Embed Size (px)
Citation preview

DIRECTORS OF STUDENT SERVICESOCEAN CITY RETREAT
JANUARY 22 AND 23, 2009PBIS IN 2009
Presented by Andrea Alexander, Milton McKenna, Jerry Bloom and Catherine Bradshaw

Advanced Organizer
• PBIS Initiative Status
• Update on 7-304: PBIS and the Law
• State Leadership Team Activity: - Recognition Subcommittee
- Training Subcommittee
• Update on Collaborative Research Activities
• What’s Next?

Academic Systems Behavioral Systems
1-5% 1-5%
5-10% 5-10%
80-90% 80-90%
Intensive, Individually Designed Interventions• Address individual needs of student• Assessment-based• High Intensity
Intensive, Individually Designed Interventions• Strategies to address needs of individual students with intensive needs• Function-based assessments• Intense, durable strategies
Targeted, Group Interventions• Small, needs-based groups for at risk students who do not respondto universal strategies• High efficiency• Rapid response
Targeted, Group Interventions• Small, needs-based groups for at- risk students who do not respond to universal strategies• High efficiency/ Rapid response• Function-based logic
Core Curriculum and Differentiated Instruction• All students• Preventive, proactive•School-wide or classroomsystems for ALL students
Core Curriculum and Universal Interventions• All settings, all students• Preventive, proactive• School-wide or classroom systems for ALL students and staff
Maryland’s Tiered Instructional and Positive Behavioral Interventions and Supports (PBIS) Framework
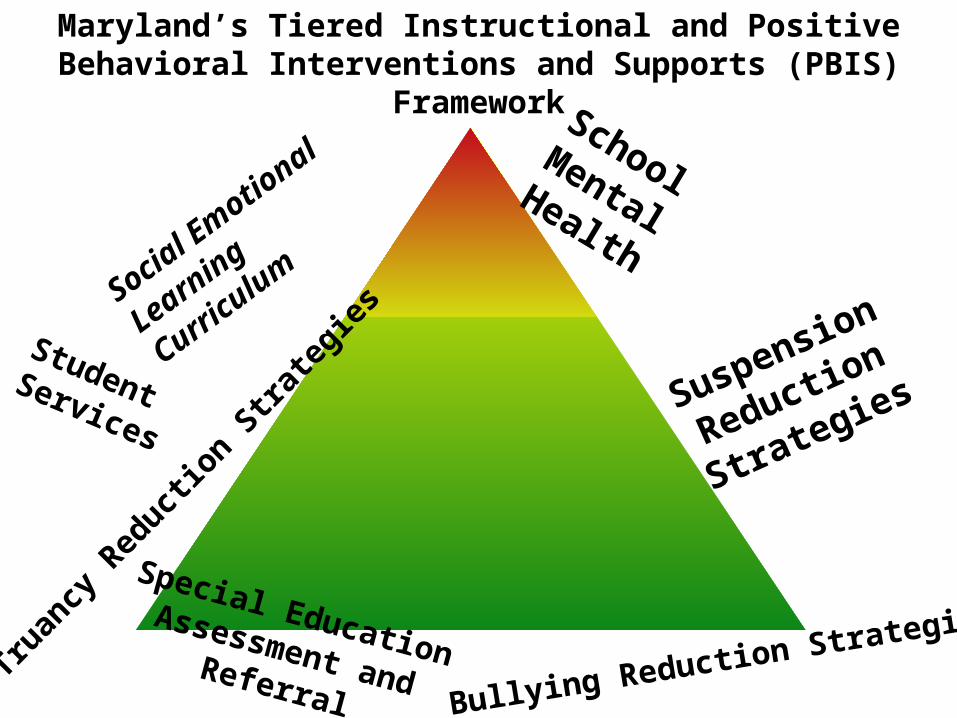
School Mental
Health
Student Services
Social E
motio
nal
Learn
ing
Curricu
lum
Trua
ncy
Reduc
tion
Strat
egie
sSuspension
Reduction
Strategies
Special Education Assessment and
Referral Bullying Reduction Strategies
Maryland’s Tiered Instructional and Positive Behavioral Interventions and Supports (PBIS)
Framework

PBIS Model: Whole-school Prevention• Application of behavioral, social learning, &
organizational behavioral principles – Clear behavioral expectations– Procedures for managing disruptions– Positive rewards
• Public health approach (universal / selective / indicated)– Requires a shift from punitive to preventive
• Focus on changing adult behavior– Team-based & data-based process– Emphasizes staff buy-in
• Can be implemented in any school level, type, or setting– Non-curricular model – flexible to fit school context
• Coaching to ensure high fidelity implementation
(Horner & Sugai, 2001; Lewis & Sugai, 1999; Sugai & Horner, 2006)

Maryland’s PBIS Infrastructure
State
District
School
Classroom
Student
School Level584 PBIS Teams (one per school)•Team leaders (one per school)•Behavior Support Coaches (380+)District Level (24)Regional Coordinators
State LevelState Leadership Team•Maryland State Department of Education •Sheppard Pratt Health System•Johns Hopkins Center for Prevention of Youth Violence•24 Local school districts•University of Maryland•Department of Juvenile Services•Mental Hygiene AdministrationManagement TeamPartnership Group National LevelNational PBIS Technical Assistance Center•University of Oregon•University of Connecticut•University of Missouri


PBIS in Maryland Schools
334 Elementary; 14 Elementary/Middle; 177 Middle; 81 High Schools; 44 Other

Where Are We In 2008?

7500 Schools across 44 states implementing school-wide positive behavior support


Leadership Team
FundingVisibility Political
Support
Training Coaching Evaluation
Active Coordination
Local School Teams/Demonstrations
PBIS Systems Implementation Logic

Cor
e Su
ppor
t Pro
gram
: Pr
ovid
ed to
all,
inte
nded
to re
ach
mos
t
Continuum of SupportsContinuum of Supports
The required resources to address the
problem increases
The need to enhance
environmental structures increases
The frequency for collecting
and acting upon
information increases

Opportunities to Increase Visibility • The Delinquency Prevention and Diversion Services Task Force• School Safety Action Planning Committee-Twice• International School Mental Health Conference• Blueprint for Mental Health’s Emotional Disturbance
Workgroup• Child Welfare Training Academy• Youth Investment Project• Advocates for Children and Youth Meeting• Pupil Personnel State meeting• Charles County Pupil Personnel Workers and Guidance/School
Counselors Meeting• APBS/PBIS Implementers Forums• Federal Legislation/2008 and anticipated in 2009• Montgomery County School visit in Montgomery County
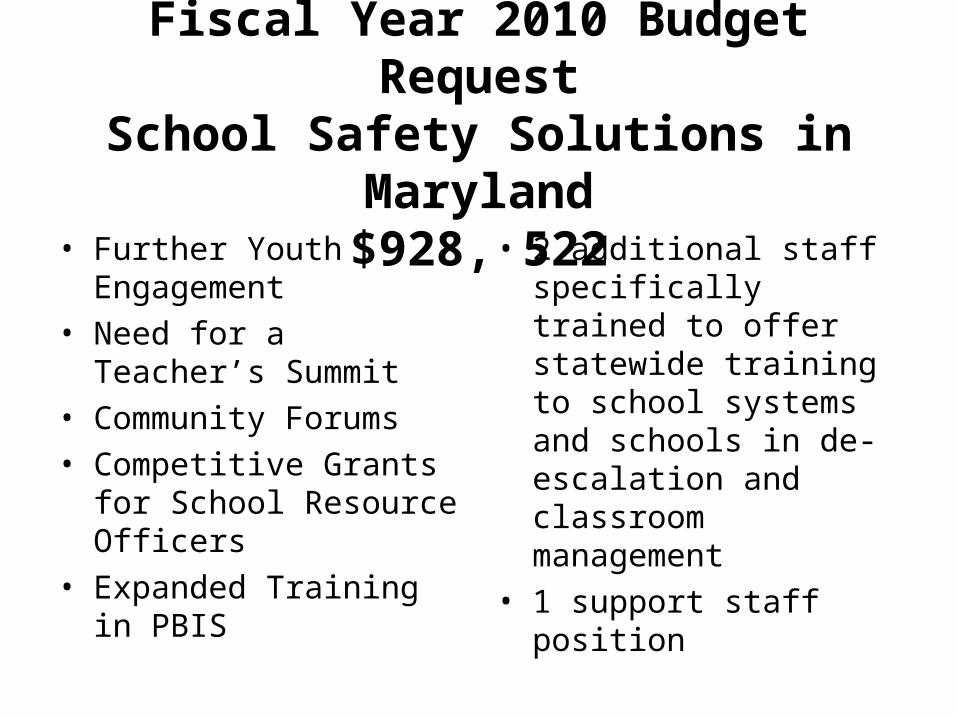
Fiscal Year 2010 Budget RequestSchool Safety Solutions in Maryland
$928, 522• Further Youth Engagement
• Need for a Teacher’s Summit
• Community Forums
• Competitive Grants for School Resource Officers
• Expanded Training in PBIS
• 2 additional staff specifically trained to offer statewide training to school systems and schools in de-escalation and classroom management
• 1 support staff position

PBIS and the LAW 7-304.1: Schools To Be Identified in School Year 2008/2009
1. Elementary schools with suspension rates exceeding 12%;
2. Elementary schools already implementing PBIS with suspension rates exceeding 12%; and,
3. Any school with a truancy rate exceeding 8%;
4. Any school already implementing PBIS with a truancy rate exceeding 8%.

Defining TruancyThe source for truancy data is the report entitled
Habitual Truants, Maryland Public Schools, 2006-2007:
A student is considered a habitual truant if he or she
meets ALL of the following criteria:
• the student was age 5 through 20 during the school year;
• the student was in membership in a school for 91 or more days; and
• the student was unlawfully absent for 20% or more of the days in membership.
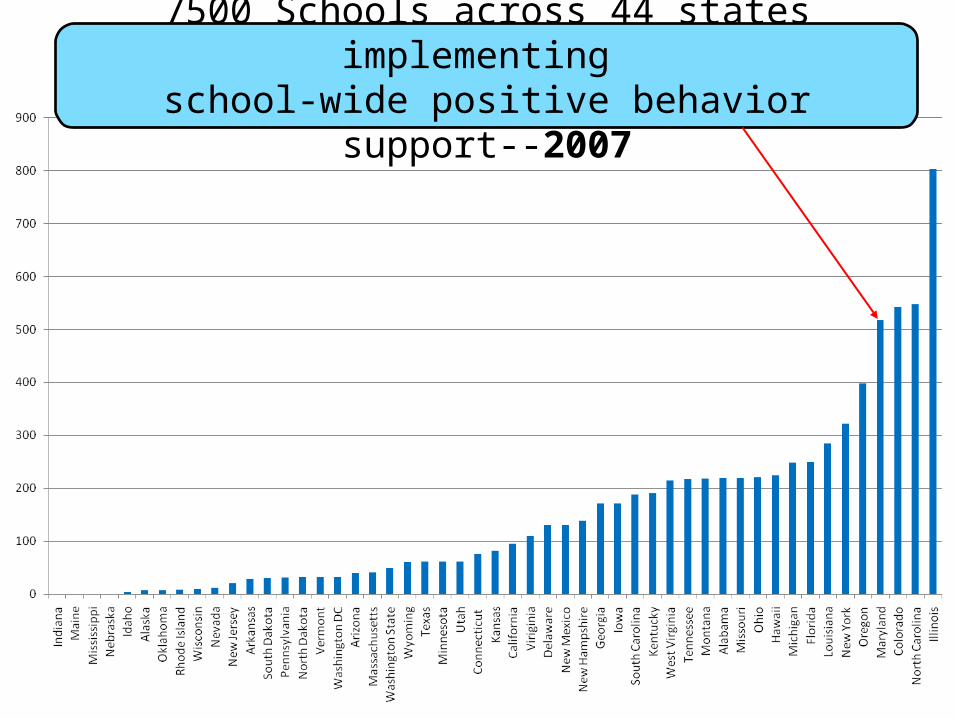
7500 Schools across 44 states implementing school-wide positive behavior support--2007

Increased Visibility of PBIS in MD and Nationally
• Number of PBIS Schools– 650 in MD (46%)– Over 7,500 in US
• 44 states have coordinated PBIS effort– Several other countries (Australia, Norway, Canada)
• Maryland Legislation– House Bill 1288 (2004)
• Required elementary schools (K-5) with high suspension rates (12%) to implement PBIS
– Truancy Bill (2008)• Requires any public school with high truancy rate to implement PBIS
• Federal Legislation– NCLB & IDEA
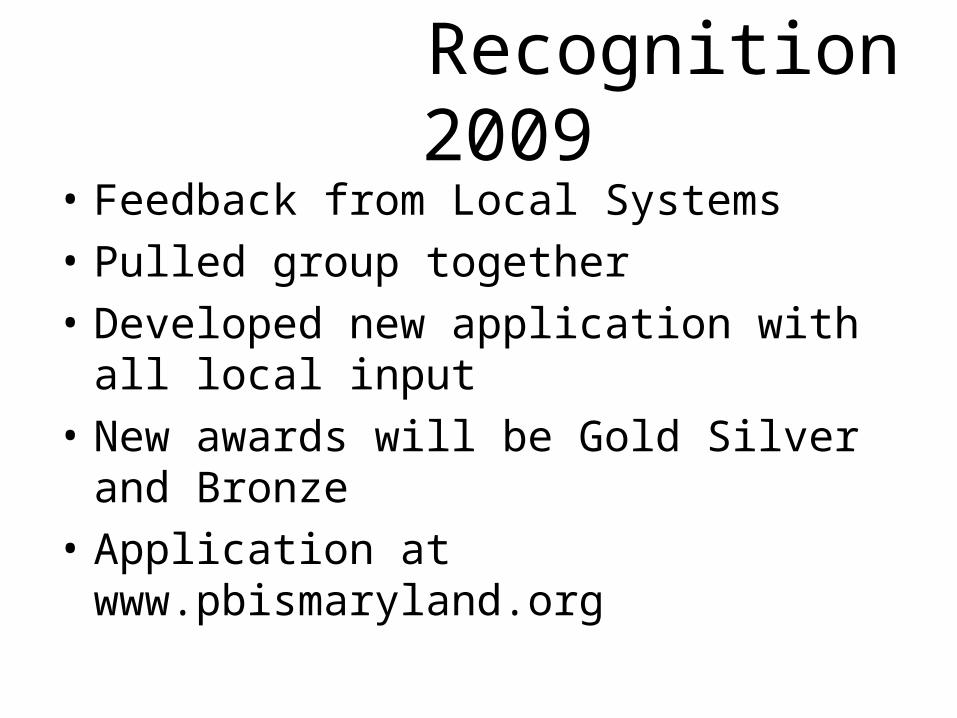
Recognition 2009
• Feedback from Local Systems
• Pulled group together
• Developed new application with all local input
• New awards will be Gold Silver and Bronze
• Application at www.pbismaryland.org

Training Subcommittee
• Hard working group
• Discussed fiscal realities for New and Returning team events
• Looking at methods for providing some formal training in Check in/Check out/BEP for one or two systems who have enough local capacity to support schools who are implementing

Dates to RememberEVENT LOCATION DATE(S)
SWIS Facilitator Training Loyola CollegeTimonium, Maryland
March 3 -5, 2009
APBS Hyatt JacksonvilleJacksonville, Florida
March 26 - 28, 2009
Leadership Summit Turf ValleyHoward County
March 30, 2009
Coaches’ Meeting Turf ValleyHoward County
April 21, 2009
Western Region Retuning Team:Allegany, Carroll, Frederick, Garrett, Washington
South Hagerstown HSWashington County
June 24, 2009
Central 2 Returning Team Training: Anne Arundel, Howard, Montgomery, Prince Georges
Old Mill ComplexAnne Arundel County
July 14, 2009July 15, 2009 for some LSS’s
Coaches Training Turf ValleyHoward County
July 20, 2009
New Team Training: Secondary Turf ValleyHoward County
July 21 -22, 2009
New Team Training: Elementary Turf ValleyHoward County
July 23 – 24, 2009
Southern Region Returning Team:Calvert, Charles, St. Mary’s
North Point HSCharles County
July 29 – 30, 2009

Catherine P. Bradshaw, PhD
Johns Hopkins Center for the Prevention of Youth ViolenceIn Collaboration with the
PBIS Maryland Management Team (MSDE, SPHS, & JHU)
PBIS Maryland Initiative funded by MSDE & SPHS;Research supported by NIMH (1R01MH67948-1A) & CDC (1U49CE 000728 and K01CE001333-01)
Update on Collaborative Research Efforts Related
to PBIS

Group Randomized Trial of SWPBIS: Project Target
Funding Centers for Disease Control & Prevention (CDC; Leaf, PI) National Institute of Mental Health (NIMH; Leaf, PI)
Sample• 37 voluntary elementary schools across 5 MD school districts
– Allegany, Anne Arundel, Baltimore Co., Charles, & Washington– Enrollment 227-983; 60% Caucasian; 48% suburban; 41% urban fringe; 49% Title I
Design• Group randomized effectiveness trial
– 21 PBIS & 16 “Focus/Comparison”
• Baseline plus 4 years (spring 2002 - spring 2007)– Data from 29,423 students & 3,563 staff
Project Target

SET: PBIS Implementation Fidelity
43%
56%61%
49% 48%
37%
84%90% 91%
95%
0%
20%
40%
60%
80%
100%
Baseline Year 1 Year 2 Year 3 Year 4
Mea
n Sc
ores
(%
)
Focus PBIS
Notes. No significant differences between groups at baseline, but differences at all other years at p<.05. Overall SET score: Wilks’ Λ = .38, F (4,32) = 13.36, p <.001, partial η2 = .63, d = 3.22.
Significant improvement among PBIS
schools

Organizational Health Inventory (OHI)
• OHI: 37 item staff-report measure of 5 aspects of a healthy functioning school (Hoy et al., 1991)– academic emphasis - students are cooperative in the classroom
– staff affiliation - warm and friendly interactions, commitment, trust
– collegial leadership - principal’s behavior is friendly, supportive, open
– resource influence - principal’s ability to lobby for resources for school
– institutional integrity - protected from unreasonable community demands
– overall OHI score (average of 5 subscales)

0 1 2 3 42.25
2.50
2.75
3.00
3.25
3.50
Study Year
Ove
rall
OH
I
ComparisonPBIS
Effect of PBIS on Overall OHI
Note. Adjusted means from 3-level model. * Intervention effect on slope of overall OHI significant at p<.05. (Bradshaw et al., 2008; SPQ)
*
Sig. difference (.05)

Office Discipline Referrals (ODRs)Percent of Students with A Major or Minor ODR
22 21.8
21.1
19.6
1818.519
19.520
20.521
21.522
22.5
Year 1 Year 2 Year 3 Year 4
(%) S
tude
nts w
ith M
ajor
or M
inor
ODRs
PBIS
Note. Wilks’ Λ = .67, F[1,14] = 6.99, p =.019, η2 = .33, d = .07, adjusting for school system, % FARMS, and school enrollment. (Bradshaw et al., in press, JPBI)
Significant reduction among
PBIS schools

Teacher-Reported Office Discipline Referrals (ODR): Comparing PBIS and Focus
Across All Study Years
• Students in PBIS schools were 35% less likely than students in Focus schools to receive an ODR– Boys were 29% less likely to receive an ODR
– Girls were 45% less likely to receive an ODR• Effects were strongest for students who first received
PBIS in Kindergarten or 1st grade
Note. Based on teacher report. Estimates varied by generation (i.e., the grade the children were in during the first year of the Project Target), p<.05. Analyses adjust for school level covariates.

Suspension Rate (school-level duplicated counts)
5.1 5.14.5
3.6 3.4
7.7 7.8 7.7
6 6
0
1
2
3
4
5
6
7
8
9
Baseline Year 1 Year 2 Year 3 Year 4
Susp
ension
rate (%
)
Focus PBIS
Note. Wilcoxon test: (PBIS) Z = -2.17, p = .03, d = .27. ; (Comparison) Z = -1.54, p = .12
Significant reduction
among PBIS schools only

Teacher-reported Need & Use of Services: Comparing PBIS and Focus across All Study Years
• Generation K students in PBIS schools were 39% less to receive counseling for inappropriate behavior– Generation K girls in PBIS schools were 45% less likely
• Generation K students (overall and boys and girls) were 33% less likely to need counseling for social skills– Generation K boys in PBIS schools were 35% less likely
• There were no significant differences in special education service referral or use– Referral: 14.9% in PBIS vs. 15.4% in Focus schools– Use: 12.8% in PBIS vs. 12.7% in Focus schools
Note. Based on teacher report. Generation indicates the grade the child was in during the first year of the Project Target, p<.05. Analyses adjust for school level covariates.

Achievement Data: Cumulative Gains in MSA Advanced and Proficient Across All Available
Years
19.120.5
8
10.7
17.9
14.6
17
22.6
0
5
10
15
20
25
% P
oint
s Gaine
d
Grade 3 ReadingGrade 5 Reading Grade 3 Math Grade 5 Math
PT Focus PT PBIS
Note. †Grade 5 math: t = -1.67, df = 35, p = .105, d = .54
†

Summary of Randomized Trial Findings
• High fidelity implementation of PBIS– Comparison schools adopted some aspects of PBIS
• PBIS training associated with increase in school’s organizational health– Especially those starting at a slightly lower level
• Impact on students– Reductions in office discipline referrals
• Boys in PBIS schools were 31-56% less likely to receive an ODR
• Girls in PBIS schools were 62-63% less likely to receive an ODR
– Reductions in school-level suspensions
– Reduced need for counseling
– Positive trend in MSA achievement
Project Target
(Bradshaw et al., Prevention Science, School Psychology Quarterly, JPBI)

Current & Future Research Directions• Grants
– “Variations Grant” to U.S. DOE (IES)• Link Project Target and MSDE data to examine student-level
achievement, attendance etc.
• Determine needs of students not responding adequately to PBIS
– Center for Prevention and Early Intervention (NIMH, N.
Ialongo) – BCPSS• PATHS & Good Behavior Game with PBIS
• Middle School PATHS & Good Behavior Game with PBIS
• Middle School Coping Power for PBIS non-responders
– PBISplus Project• Supports for non-responders through connection with SST

PBISplus ProjectDesign• Federally funded 3-year randomized controlled trial (USDOE/IES)
• 45 elementary schools that have high fidelity PBIS & “yellow-zone” needs
- Cohort 1: Anne Arundel, Baltimore, Charles, & Howard; - Cohort 2: Carroll & Prince George’s
• Random assignment to either “SWPBIS” or “Plus” condition
Aims• Address needs of PBIS “non-responders”• Increase use of evidence-based programs• Reduce behavior problems & improve achievement• Reduce disproportionality
Strategy• Provide training, support, and on-site technical assistance to SSTs and staff regarding:
– Simplified functional behavioral assessment and “function-based thinking”– Evidence-based programs– Effective teaming and collaborative problem-solving– Cultural competency training & culturally appropriate interventions
PBISplus

Summary of Support Services Provided by PBISplus Liaisons
Liaision Services Provided (total hours)
53.4
26.9
32.3
60.1
42.8
41.3
29.0
29.8
24.0
92.1
201.6
122.1
52.7
64.2
314.2
0 50 100 150 200 250 300 350
Other supportTeaming Process
RIDE processSelecting EBPs
FBA processData-based decision making
Cultural relevanceProfessional developmentData Collection strategies
Needs assessmentModel/shadow observationsModel/shadow consultation
Check In/Check OutAttend SWPBIS mtg
Attend SST mtg
Note. Data from Year 1 (Sept – May), N=14 schools

Observations from the Field: Year 1 in PBISplus• Schools need additional services and supports for the children
not responding adequately to the universal model
• In Year 1, Liaisons conducted 432 school visits – ≈ 3.4 visits per month, 3 hours each
– 1,296 total hours of consultation
• Most common services: – Attend SST meetings, conduct needs assessment, model/shadow
classroom observations, & model/shadow consultations with teachers
• Potential areas for additional technical assistance: – SWPBIS coaching, FBA, SST process, data-based decision-making,
& implementation fidelity of Check-in/Check-out
PBISplus

What’s next?? • What do we need to know from you as we
move forward?

AcknowledgementsJohns Hopkins • Phil Leaf• Katrina Debnam• Qing Zheng• Mary Mitchell• Catherine Bradshaw
Maryland State Departmentof Education• Chuck Buckler• Ann Chafin• Andrea Alexander• Milt McKenna
Research FundingP. Leaf: NIMH (R01 MH67948-1A1 )
P. Leaf: CDC (R49/CCR318627)C. Bradshaw: CDC (K01CE001333-01)
www.PBISMaryland.orgwww.PBIS.orgwww.jhsph.edu/PreventYouthViolence/Research/index.html
Additional Information on PBIS
Sheppard PrattHealth System• Burt Lohnes• Susan Barrett• Jerry Bloom

Contact Information-PBIS Management Team
• NAME/PHONE EMAIL AGENCY • Andrea Alexander [email protected] MSDE
410.767.0318• Susan Barrett [email protected] SPHS
410.274.9835• Brian Bartels [email protected] MSDE
410.767.0294• Jerry Bloom [email protected] SPHS
443.386.2158• Catherine Bradshaw [email protected] JHU
410.502.2587• Shanda Crowder [email protected] MSDE
410.767.0736• Phil Leaf [email protected] JHU
410.955.3962• Milt McKenna [email protected] MSDE
410.767.0304• Richard Scott [email protected] MSDE
410.767.0288