Embed Size (px)
Citation preview
Triweekly Series
Ideas and Nuggets of News You Can Use!
Discuss how diversified your clients’ portfolios are and how they should be allocated.
A Registered Investment Advisor
600 Village Trace, Building 23 | Marietta, GA | 30067
“Big enough to deliver,
small enough to care”
Triweekly Series
Ideas and Nuggets of News You Can Use!
by Chris Briggs, CFP® and Leo Rose, AIF®
Call to action: Discuss how diversified your clients’ portfolios are and how they should be allocated.
Working from the general thesis that the S&P 500 is becoming overvalued, how do you talk to your clients about how to best position their portfolio? You can’t predict when sectors or asset classes will outperform, so the best strategy is to maintain strategic exposures across multiple asset classes so the investor can participate when certain parts of the market outperform. Most clients are seeing the news that the S&P 500 is at all-time highs, however investing in the S&P 500 now is chasing performance.
A good valuation metric to use in determining if an index is overvalued is the Price to Sales ratio (P/S).
P/S can be seen as how much investors are paying per dollar of revenue. As of late July, the S&P 500 P/S
ratio is at 15-year highs.1 So what that means is that investors are now paying more per dollar of
revenue than they have in the past 15 years. In order for stocks with high P/S ratios to remain
attractive, there should be an indication that sales will grow into the higher valuation, which there
hasn’t been.
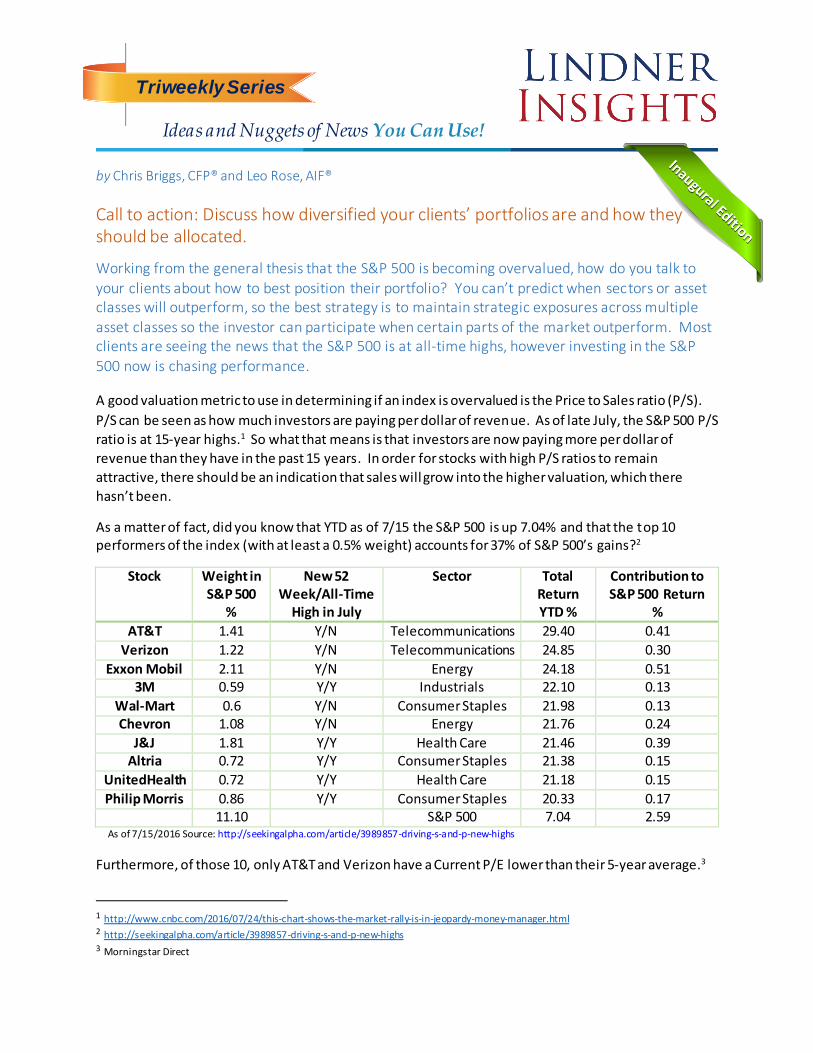
As a matter of fact, did you know that YTD as of 7/15 the S&P 500 is up 7.04% and that the top 10 performers of the index (with at least a 0.5% weight) accounts for 37% of S&P 500’s gains?2
Stock Weight in S&P 500
%
New 52 Week/All-Time
High in July
Sector Total Return YTD %
Contribution to S&P 500 Return
%
AT&T 1.41 Y/N Telecommunications 29.40 0.41
Verizon 1.22 Y/N Telecommunications 24.85 0.30
Exxon Mobil 2.11 Y/N Energy 24.18 0.51 3M 0.59 Y/Y Industrials 22.10 0.13
Wal-Mart 0.6 Y/N Consumer Staples 21.98 0.13 Chevron 1.08 Y/N Energy 21.76 0.24
J&J 1.81 Y/Y Health Care 21.46 0.39 Altria 0.72 Y/Y Consumer Staples 21.38 0.15
UnitedHealth 0.72 Y/Y Health Care 21.18 0.15
Philip Morris 0.86 Y/Y Consumer Staples 20.33 0.17 11.10 S&P 500 7.04 2.59
As of 7/15/2016 Source: http://seekingalpha.com/article/3989857-driving-s-and-p-new-highs
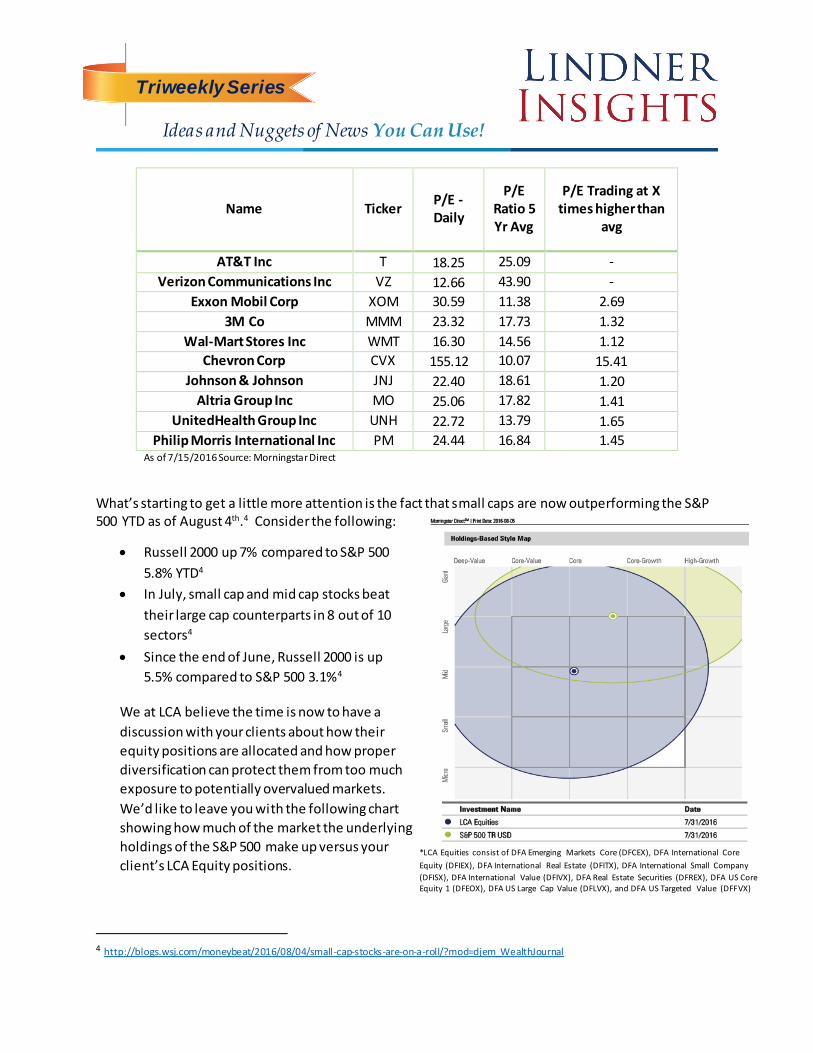
Furthermore, of those 10, only AT&T and Verizon have a Current P/E lower than their 5-year average.3
1 http://www.cnbc.com/2016/07/24/this-chart-shows-the-market-rally-is-in-jeopardy-money-manager.html 2 http://seekingalpha.com/article/3989857-driving-s-and-p-new-highs 3 Morningstar Direct
Triweekly Series
Ideas and Nuggets of News You Can Use!
Name Ticker P/E - Daily
P/E Ratio 5 Yr Avg
P/E Trading at X times higher than
avg
AT&T Inc T 18.25 25.09 -
Verizon Communications Inc VZ 12.66 43.90 -
Exxon Mobil Corp XOM 30.59 11.38 2.69
3M Co MMM 23.32 17.73 1.32
Wal-Mart Stores Inc WMT 16.30 14.56 1.12
Chevron Corp CVX 155.12 10.07 15.41
Johnson & Johnson JNJ 22.40 18.61 1.20
Altria Group Inc MO 25.06 17.82 1.41
UnitedHealth Group Inc UNH 22.72 13.79 1.65
Philip Morris International Inc PM 24.44 16.84 1.45 As of 7/15/2016 Source: Morningstar Direct
What’s starting to get a little more attention is the fact that small caps are now outperforming the S&P 500 YTD as of August 4th.4 Consider the following:
Russell 2000 up 7% compared to S&P 500
5.8% YTD4
In July, small cap and mid cap stocks beat
their large cap counterparts in 8 out of 10
sectors4
Since the end of June, Russell 2000 is up
5.5% compared to S&P 500 3.1%4
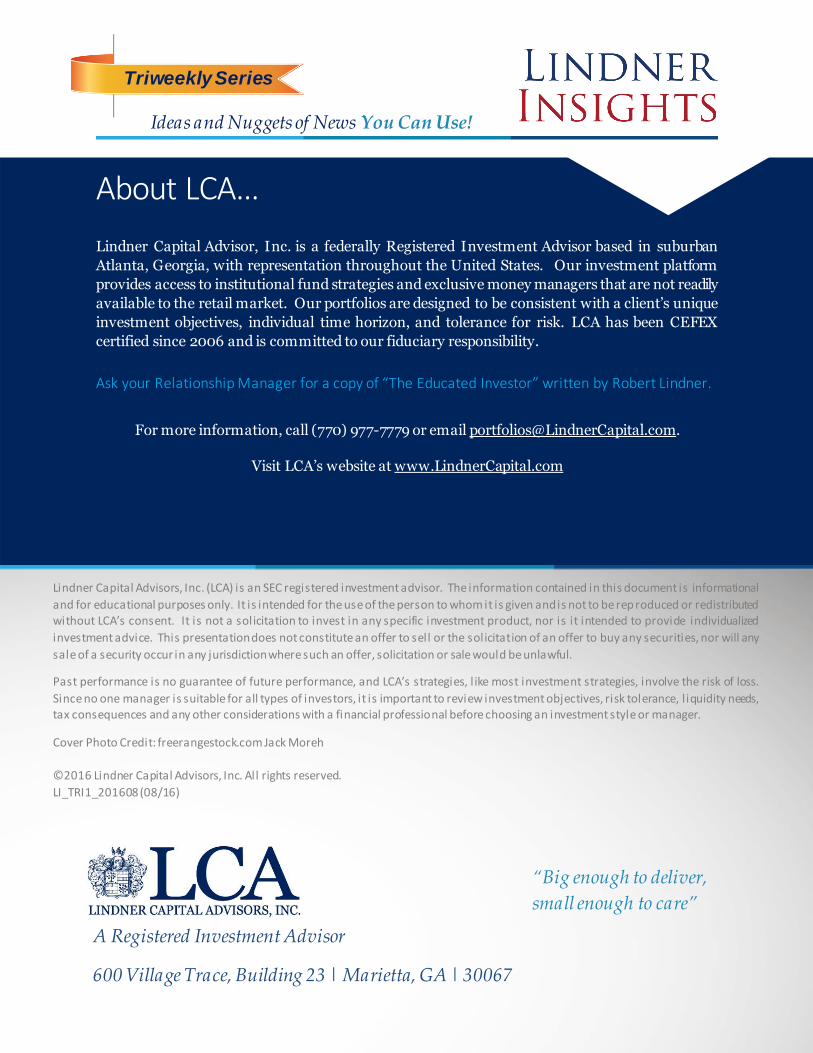
We at LCA believe the time is now to have a
discussion with your clients about how their
equity positions are allocated and how proper
diversification can protect them from too much
exposure to potentially overvalued markets.
We’d like to leave you with the following chart
showing how much of the market the underlying
holdings of the S&P 500 make up versus your
client’s LCA Equity positions.
4 http://blogs.wsj.com/moneybeat/2016/08/04/small-cap-stocks-are-on-a-roll/?mod=djem_WealthJournal
*LCA Equities consist of DFA Emerging Markets Core (DFCEX), DFA International Core
Equity (DFIEX), DFA International Real Estate (DFITX), DFA International Small Company
(DFISX), DFA International Value (DFIVX), DFA Real Estate Securities (DFREX), DFA US Core Equity 1 (DFEOX), DFA US Large Cap Value (DFLVX), and DFA US Targeted Value (DFFVX)
Lindner Capital Advisors, Inc. (LCA) is an SEC registered investment advisor. The information contained in this document is informational
and for educational purposes only. It is intended for the use of the person to whom it is given and is not to be rep roduced or redistributed without LCA’s consent. It is not a solicitation to invest in any specific investment product, nor is it intended to provide individualized
investment advice. This presentation does not constitute an offer to sell or the solicitation of an offer to buy any securities, nor will any
sale of a security occur in any jurisdiction where such an offer, solicitation or sale would be unlawful.
Past performance is no guarantee of future performance, and LCA’s strategies, l ike most investment strategies, involve the risk of loss.
Since no one manager is suitable for all types of investors, it is important to review investment objectives, risk tolerance, l iquidity needs, tax consequences and any other considerations with a financial professional before choosing an investment style or manager.
Cover Photo Credit: freerangestock.com Jack Moreh
©2016 Lindner Capital Advisors, Inc. All rights reserved.
LI_TRI1_201608 (08/16)
A Registered Investment Advisor
600 Village Trace, Building 23 | Marietta, GA | 30067
“Big enough to deliver,
small enough to care”
Triweekly Series
Ideas and Nuggets of News You Can Use!
About LCA… Lindner Capital Advisor, Inc. is a federally Registered Investment Advisor based in suburban
Atlanta, Georgia, with representation throughout the United States. Our investment platform
provides access to institutional fund strategies and exclusive money managers that are not readily
available to the retail market. Our portfolios are designed to be consistent with a client’s unique
investment objectives, individual time horizon, and tolerance for risk. LCA has been CEFEX
certified since 2006 and is committed to our fiduciary responsibility.
Ask your Relationship Manager for a copy of “The Educated Investor” written by Robert Lindner.
For more information, call (770) 977-7779 or email [email protected].
Visit LCA’s website at www.LindnerCapital.com