Embed Size (px)
Citation preview
Sub-Appendix I-H
Gas Investigation Final Monitoring Report, Disposal Gardens CIWMB, October 2007
1
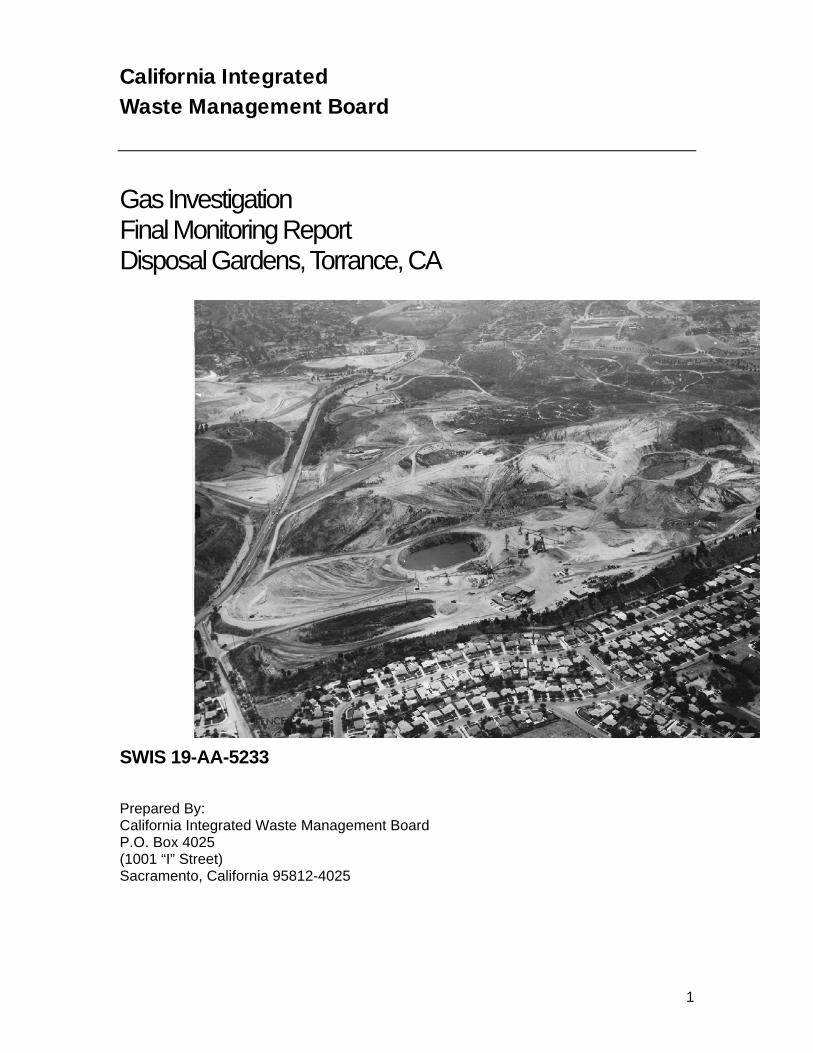
Gas Investigation Final Monitoring Report Disposal Gardens, Torrance, CA
SWIS 19-AA-5233 Prepared By: California Integrated Waste Management Board P.O. Box 4025 (1001 “I” Street) Sacramento, California 95812-4025
California Integrated Waste Management Board
2
Table of Contents Page Number History of the Site Investigation 3 Data Collection 6 Findings and Recommendations 7 Conclusion and Recommendation 7 Figures Gas monitoring well location 4 Appendix A Monthly Monitoring Results (Excel Spreadsheet) Appendix B Final Laboratory Results
3
1.0 History of the Site Investigation The Remediation, Closure & Technical Services (RCTS) Branch, was requested by Los Angeles County Local Enforcement Agency (LEA) to perform a phase I office investigation and a phase II field investigation, which would include intrusive investigation (borings), waste and soil sampling and characterization, installation and sampling of gas monitoring probes; and to install gas monitoring probes, collect soil samples during drilling, conduct analytical testing of select samples, and to evaluate appropriate remedial measures necessary to protect public health and safety and the environment. The main objective of this limited assessment has been to generally evaluate by conducting investigative work at specific areas, whether this site is producing methane gas and if this gas is migrating up to the surface. To help make a determination, the installed probes will be monitored monthly for a period of one year to account for temporal variations in the gas production (if any) from the site. The historic documentation indicates fill was placed at various times at the site in association with sand and gravel mining activities and subsequent grading of the site for residential development. However, the composition of the fill is not entirely known and it is also not known if inert solid wastes were also disposed of at the site. The second objective of this investigation was to conduct a limited characterization of this site by obtaining soil samples during drilling and submitting them for analytical testing. The samples were sent to the CIWMB’s contracted certified analytical testing laboratory, ExcelChem Laboratories, Inc. and analyzed for constituents of potential concern (COPC). The investigation began March 27 and lasted until March 31, 2006. A total of 13 multi-depth gas monitoring wells were installed. During the boring of the wells, soil samples were collected in brass sleeves and sent to the lab for analysis of constituents of concern. It was expected that there was a possibility of elevated levels of hydrocarbons would be found in the soil samples due to a mixture of petroleum and sand that was used as fill when the site was first graded in the early 1970’s. Total Petroleum Hydrocarbons were found in the soils at various levels and depths, a statistical analysis shows ranges from 0-183 mg/kg (parts per million), 0-507 mg/kg (ppm) and 0-414 mg/kg (ppm). The integrated Waste Management Board and Department of Toxic Substances Control does not regulate TPH, the results and the report has been forwarded to the Regional Water Quality Control Board for review. Well locations were chosen using previous site investigation reports and well logs that showed the subsurface soil conditions with any evidence of waste or debris. (See Final Site Investigation Report written by CIWMB)
4
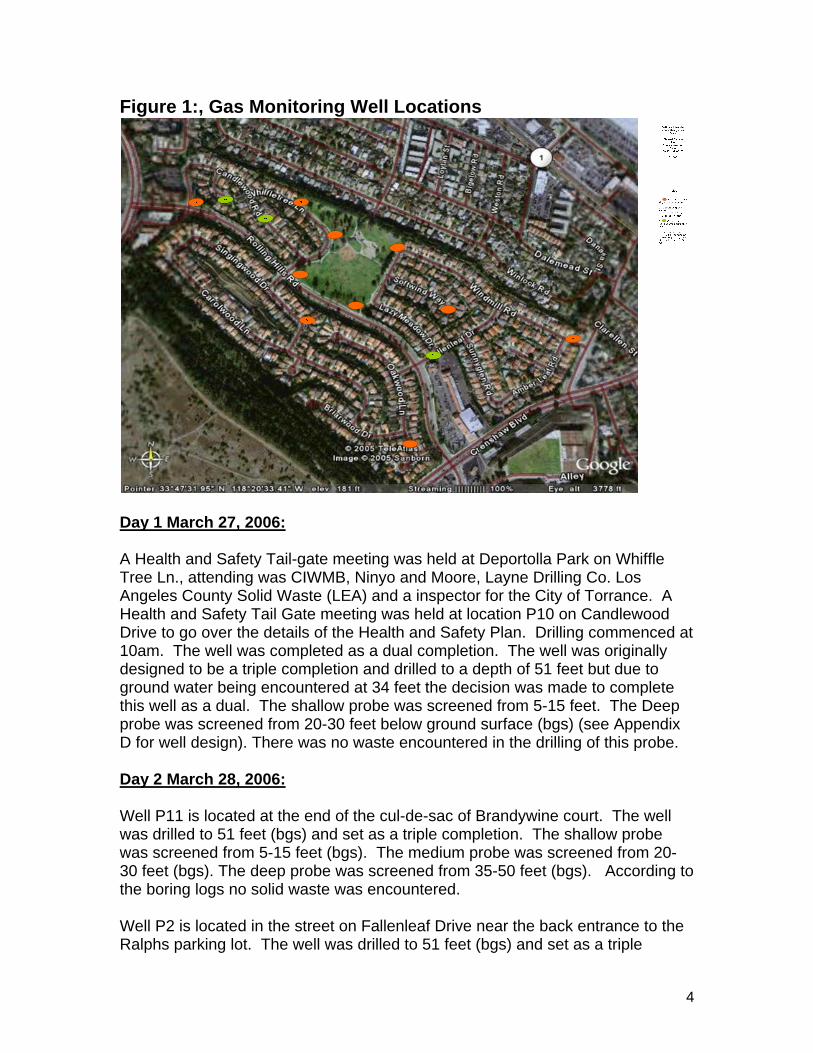
Figure 1:, Gas Monitoring Well Locations
Day 1 March 27, 2006: A Health and Safety Tail-gate meeting was held at Deportolla Park on Whiffle Tree Ln., attending was CIWMB, Ninyo and Moore, Layne Drilling Co. Los Angeles County Solid Waste (LEA) and a inspector for the City of Torrance. A Health and Safety Tail Gate meeting was held at location P10 on Candlewood Drive to go over the details of the Health and Safety Plan. Drilling commenced at 10am. The well was completed as a dual completion. The well was originally designed to be a triple completion and drilled to a depth of 51 feet but due to ground water being encountered at 34 feet the decision was made to complete this well as a dual. The shallow probe was screened from 5-15 feet. The Deep probe was screened from 20-30 feet below ground surface (bgs) (see Appendix D for well design). There was no waste encountered in the drilling of this probe. Day 2 March 28, 2006: Well P11 is located at the end of the cul-de-sac of Brandywine court. The well was drilled to 51 feet (bgs) and set as a triple completion. The shallow probe was screened from 5-15 feet (bgs). The medium probe was screened from 20-30 feet (bgs). The deep probe was screened from 35-50 feet (bgs). According to the boring logs no solid waste was encountered. Well P2 is located in the street on Fallenleaf Drive near the back entrance to the Ralphs parking lot. The well was drilled to 51 feet (bgs) and set as a triple
5
completion. The shallow probe was screened from 5-15 feet (bgs). The medium probe was screened from 20-30 feet (bgs). The deep probe was screened from 35-50 feet (bgs). According to the boring logs no solid waste was encountered. Day 3 March 29, 2006: Well P1 is located directly across from 2921 Oakwood Lane, on the southern side of the street about 2 feet from the curb. The well was drilled to 16.5 feet (bgs) and set as a single completion. Ground water was encountered at 13 feet (bgs). The probe was screened from 5-10 feet (bgs). According to the boring logs no solid waste was encountered. Well P6 is located next to 3113 Singing Wood Drive, approximately 10 feet from the curb to the west. The well was completed as a single construction and drilled to 16.5 feet. Water was encountered at approximately 13 feet (bgs). The probe was screened from 5-15 feet, according to the boring logs no solid waste was encountered. Well P13 is located next to 25602 Amber leaf drive, The corner of Amber Leaf and Windmill about 5 feet west of the curb. The well was completed as a single construction and drilled to 16.5 feet. Water was encountered at approximately 13 feet (bgs). The probe was screened from 5-15 feet; according to the boring logs no solid waste was encountered. Well P3 is located in the cul-de-sac of Softwind Way across from 3002 approximately 600 feet down Softwind Way and 600 feet from Fallenleaf Drive. The well was drilled to a depth of 16.5 feet and completed as a single completion. The probe was screened from 5-15 feet, according to the boring logs no solid waste was encountered Day 4 March 30, 2006 Well P9 is located across from 3244 Whiffle Tree lane about 50 feet north of the street on the grassy hill. The well was drilled to 18.5 feet and completed as a single completion. The probe was screened from 5-15 feet, according to the boring logs no solid waste was encountered. Well P8 is located across from 3216 Whiffle tree in the grass approximately 3-4 feet from the curb towards the park. The well was drilled to 20.5 feet (bgs). Perched groundwater was encountered during drilling at approximately 2-3 feet (bgs). The probe was screened from 9-19 feet bgs due to the water that was encountered (see appendix D well logs), according to the boring logs no solid waste was encountered. Well P7 is located In front of the Deportolla park sign, in the grass, approximately 12 feet north of the curb on the corner of Rolling Hills Drive and Whiffletree Lane.
6
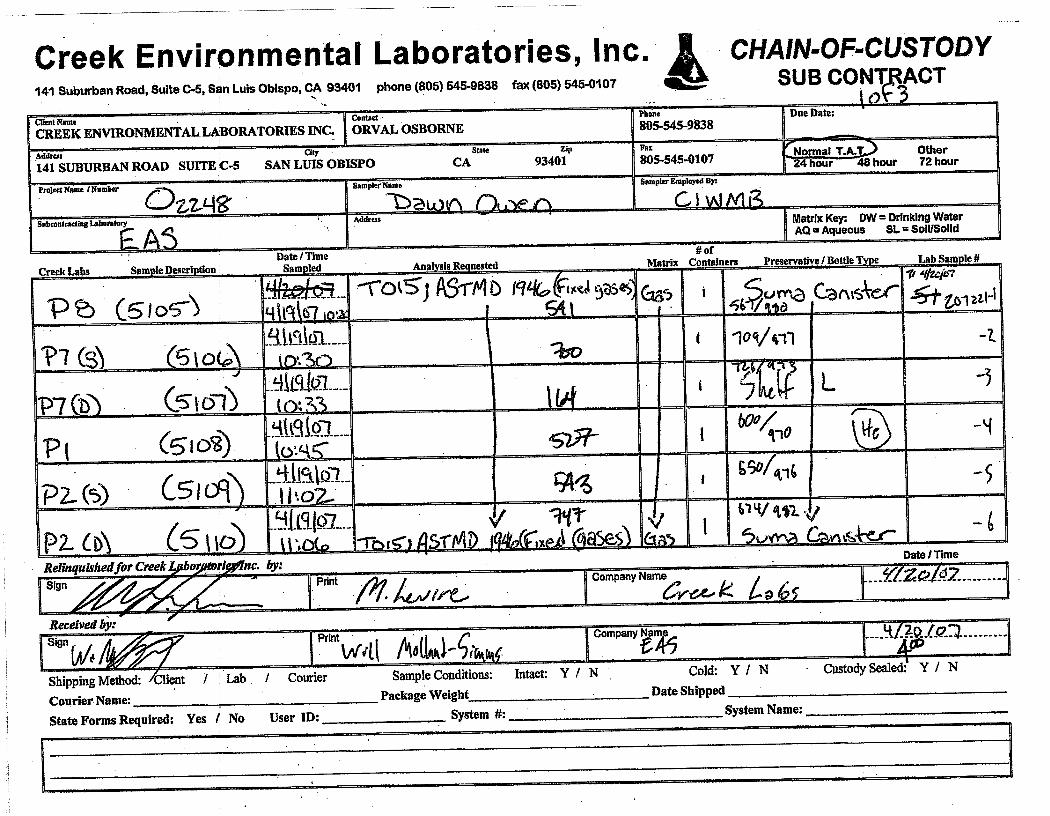
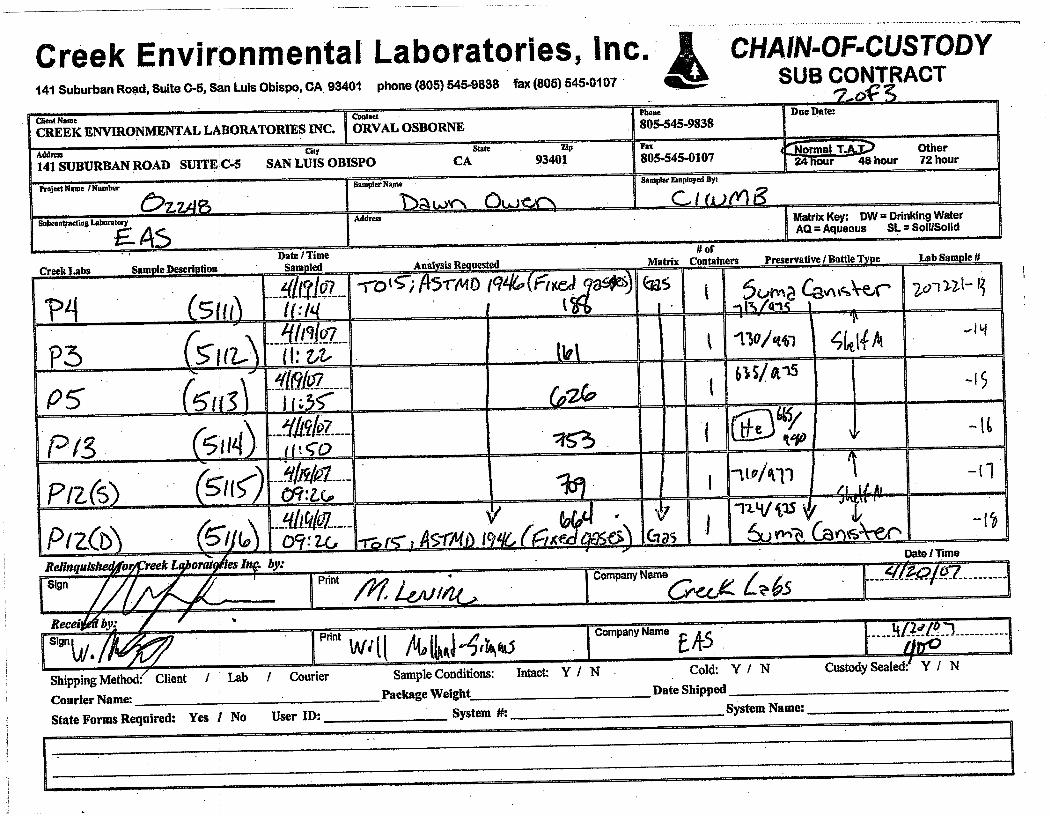
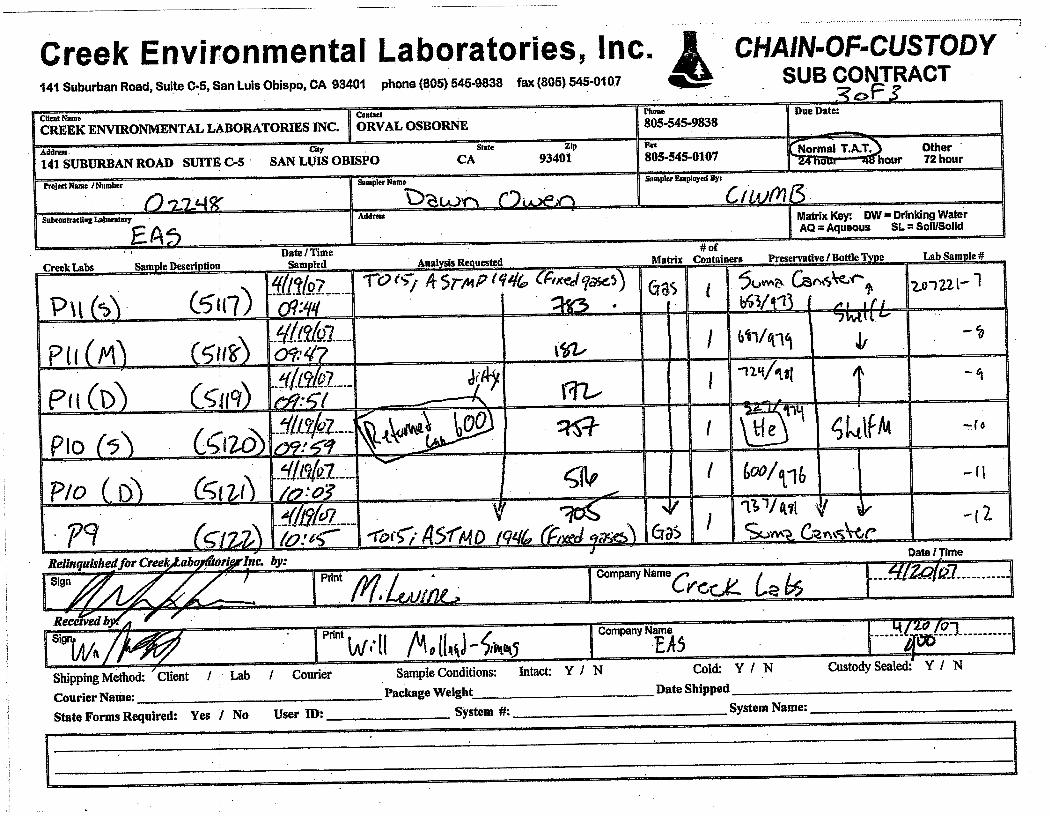
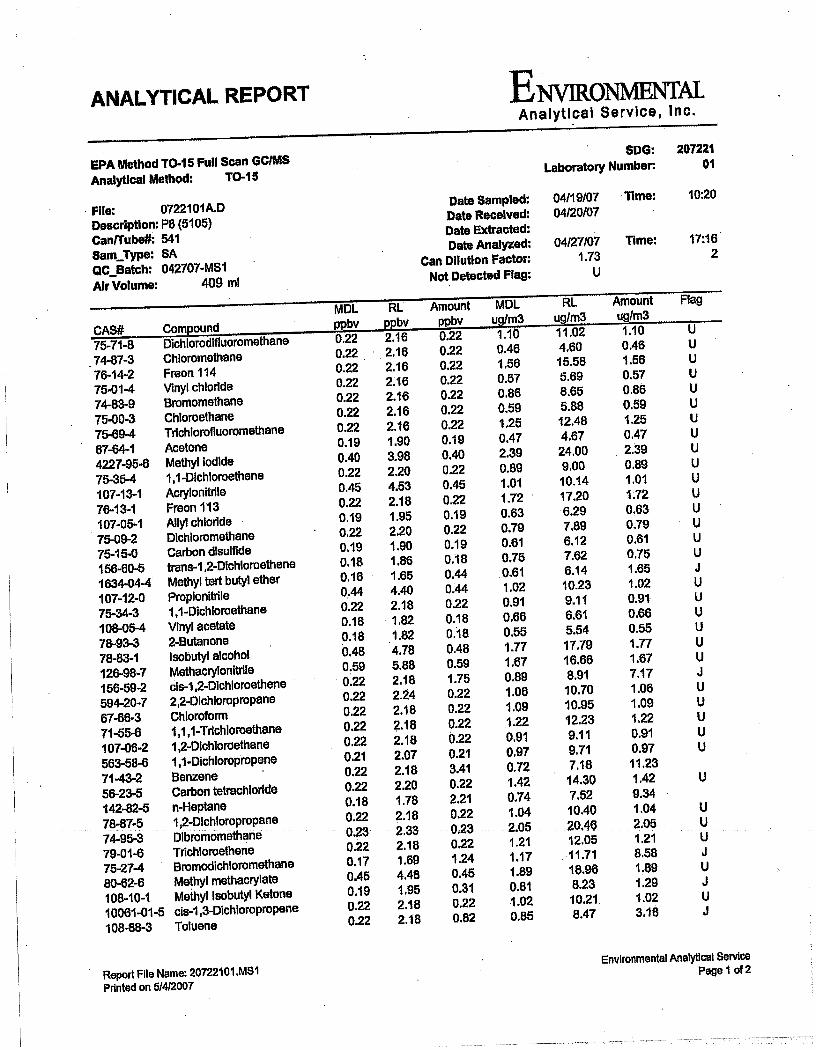
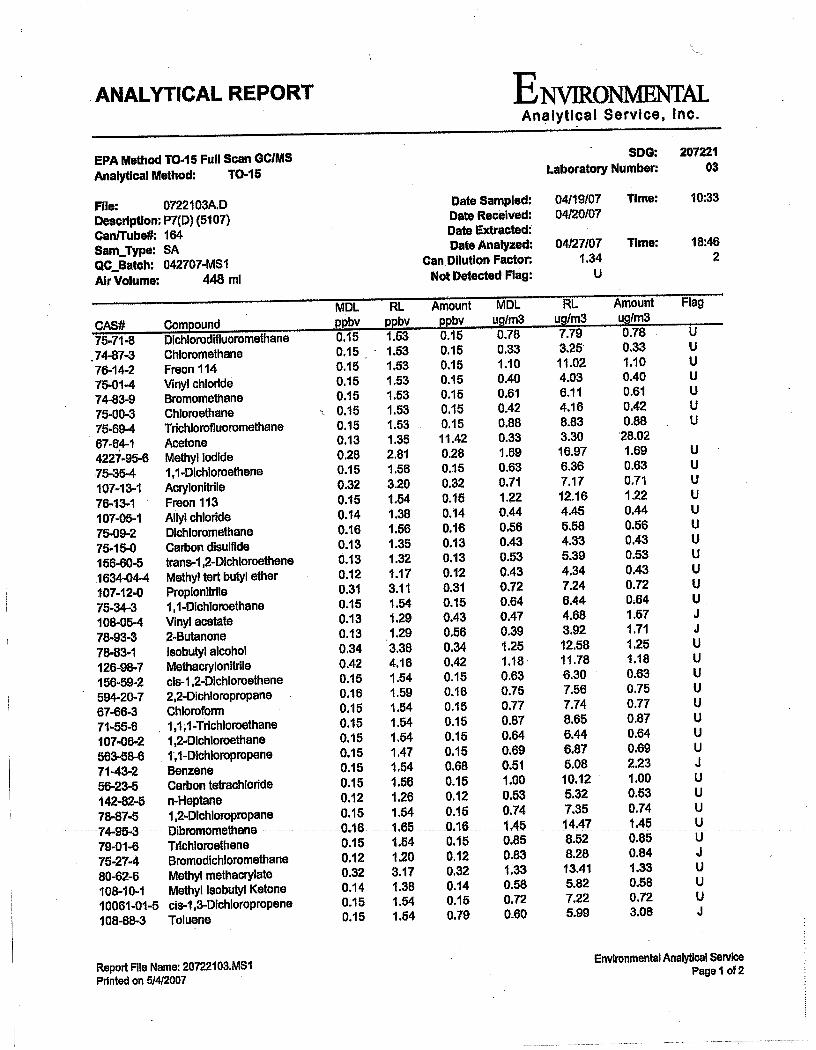
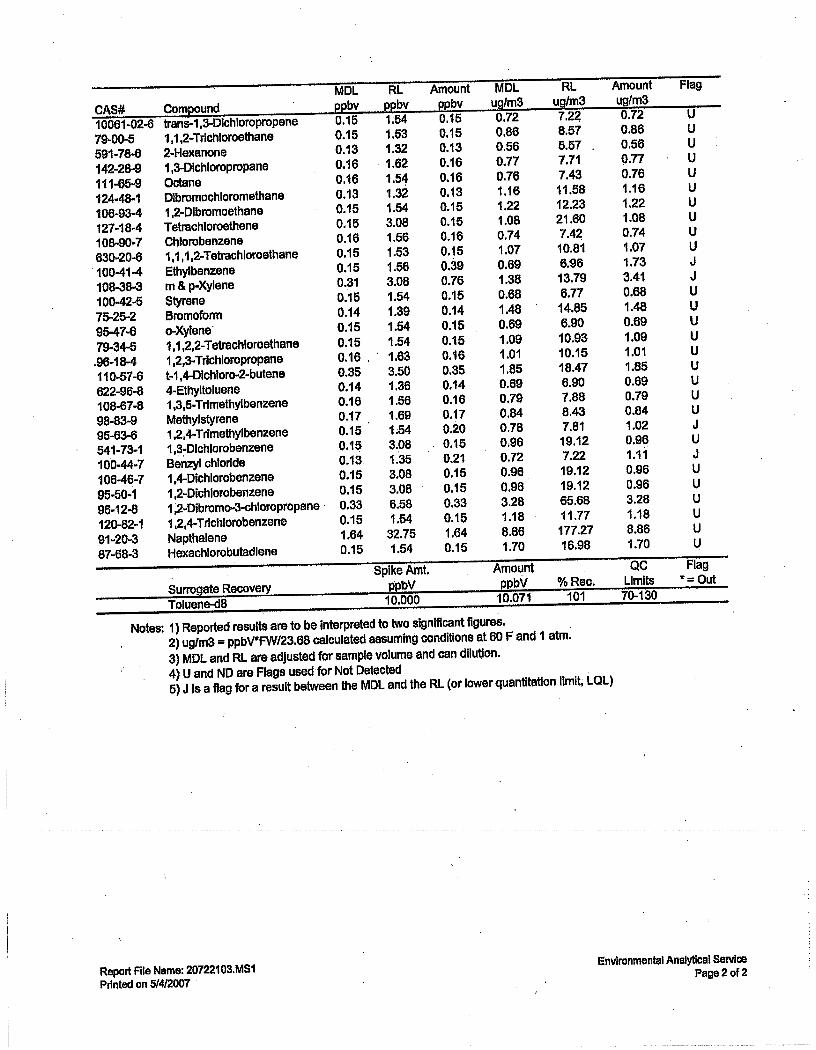
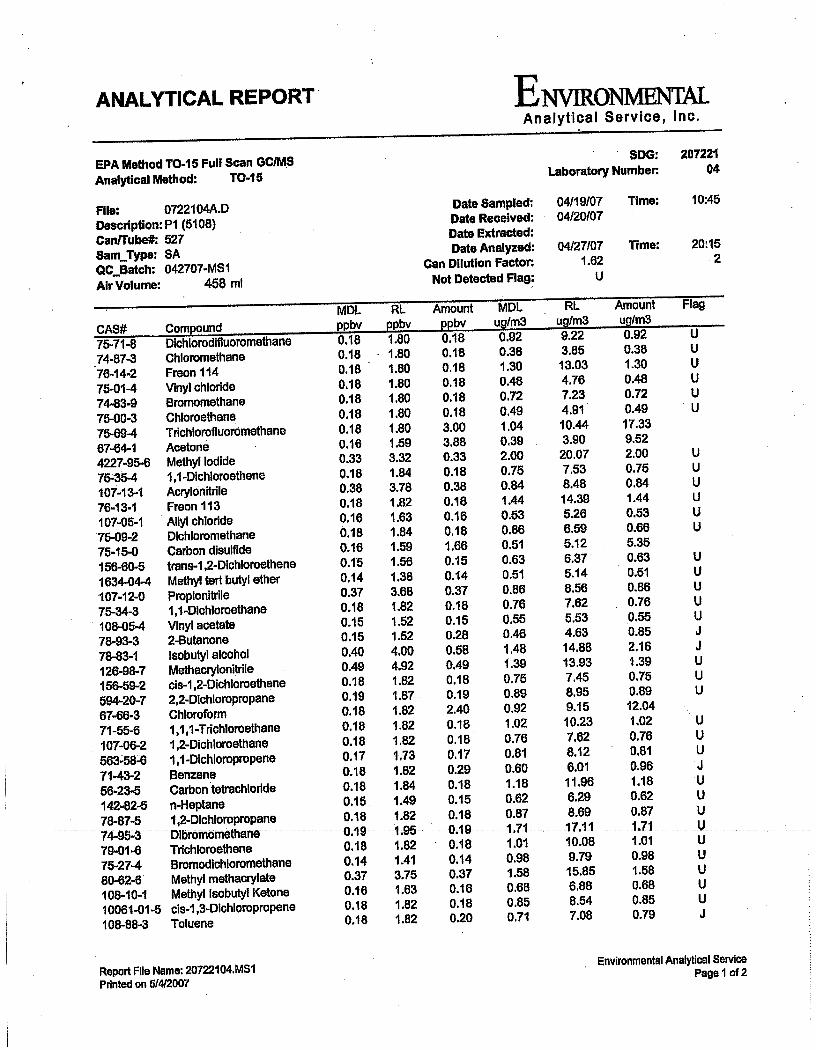
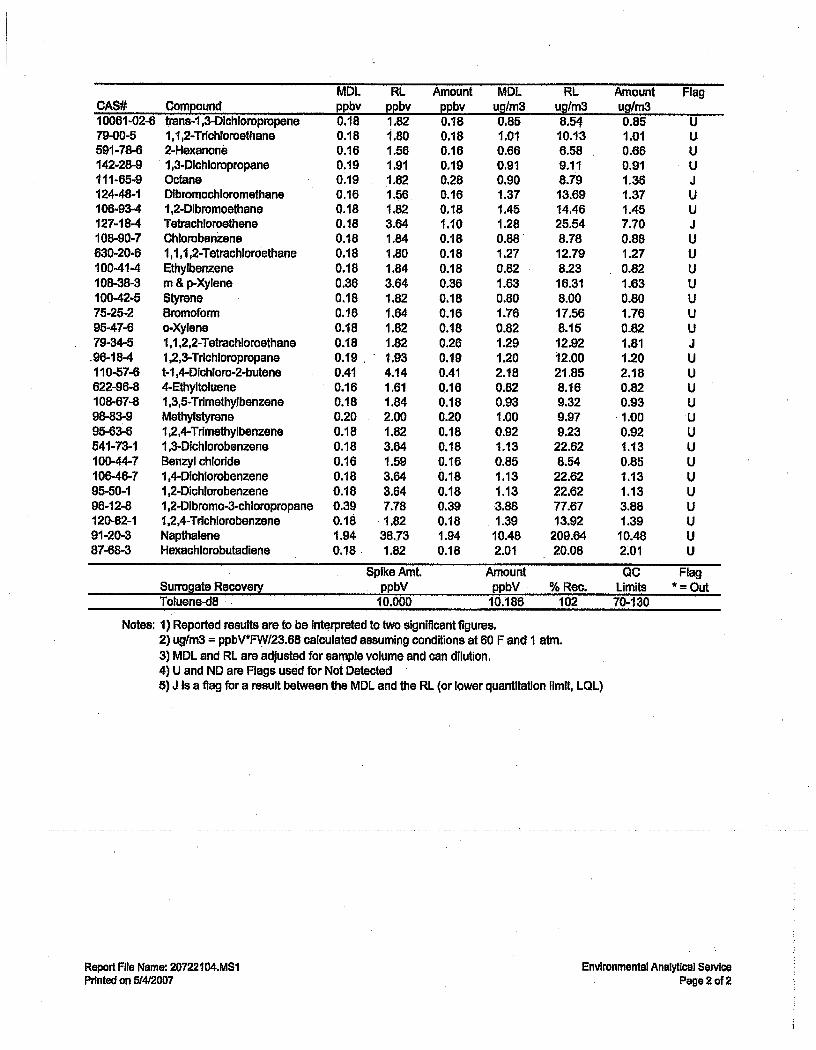
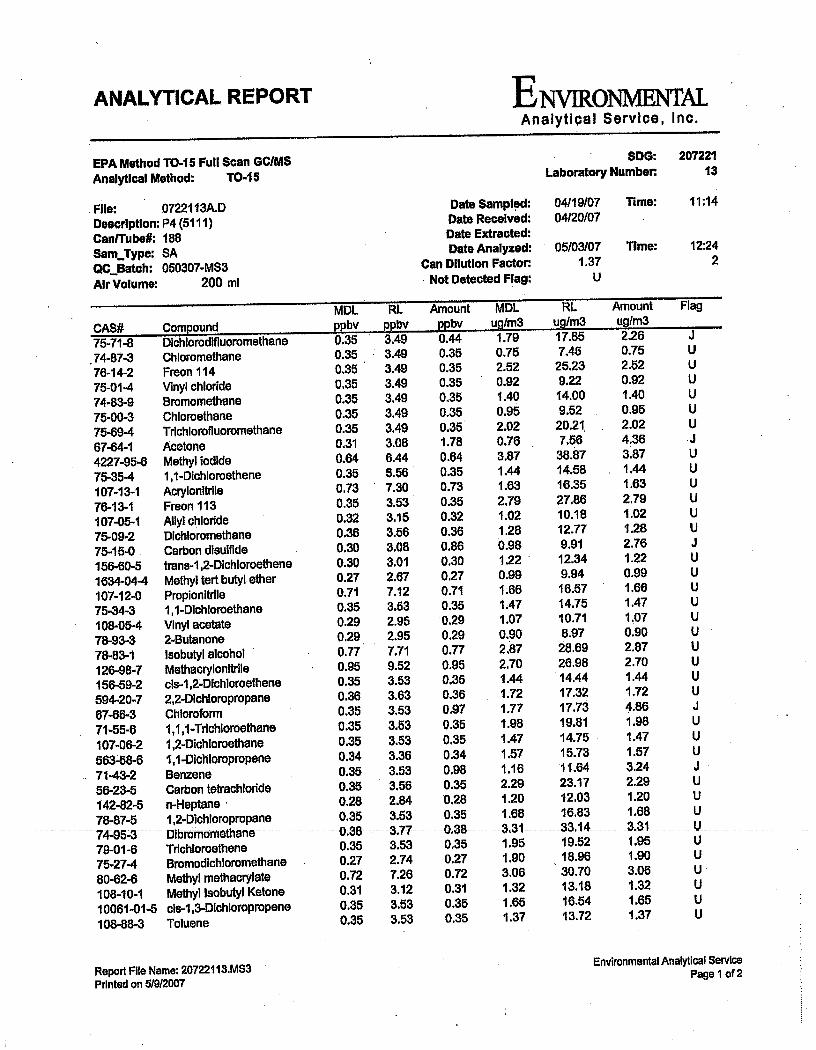
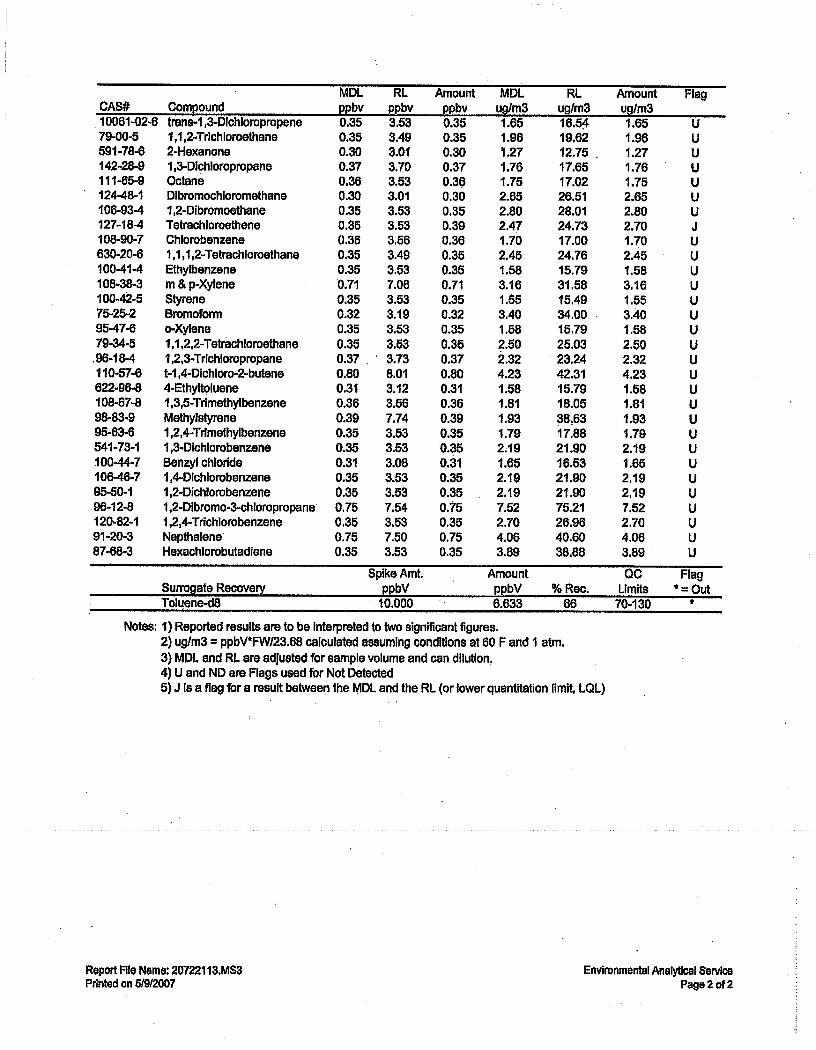
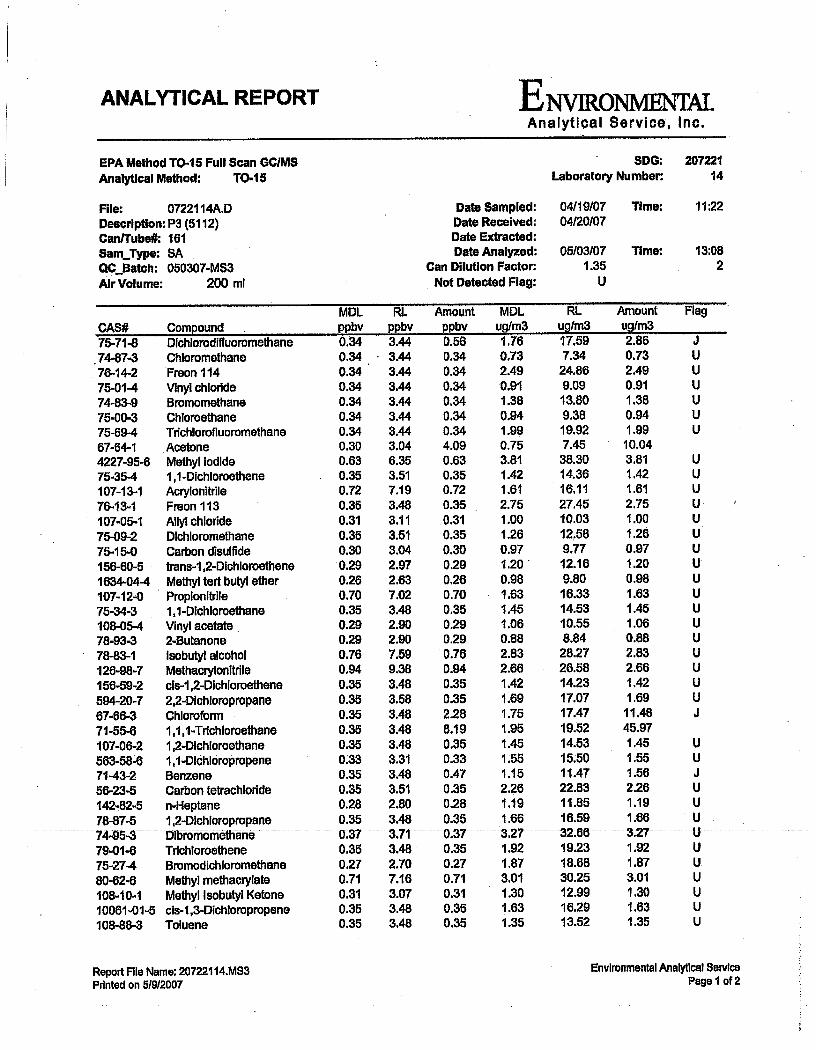
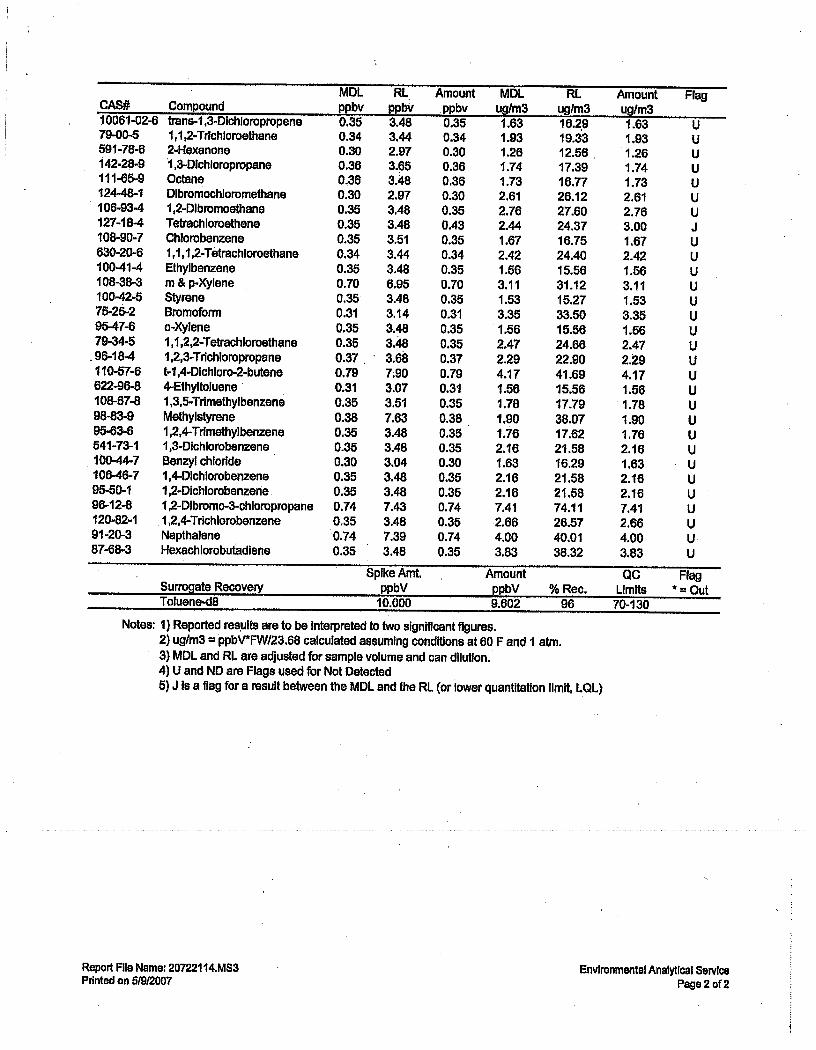
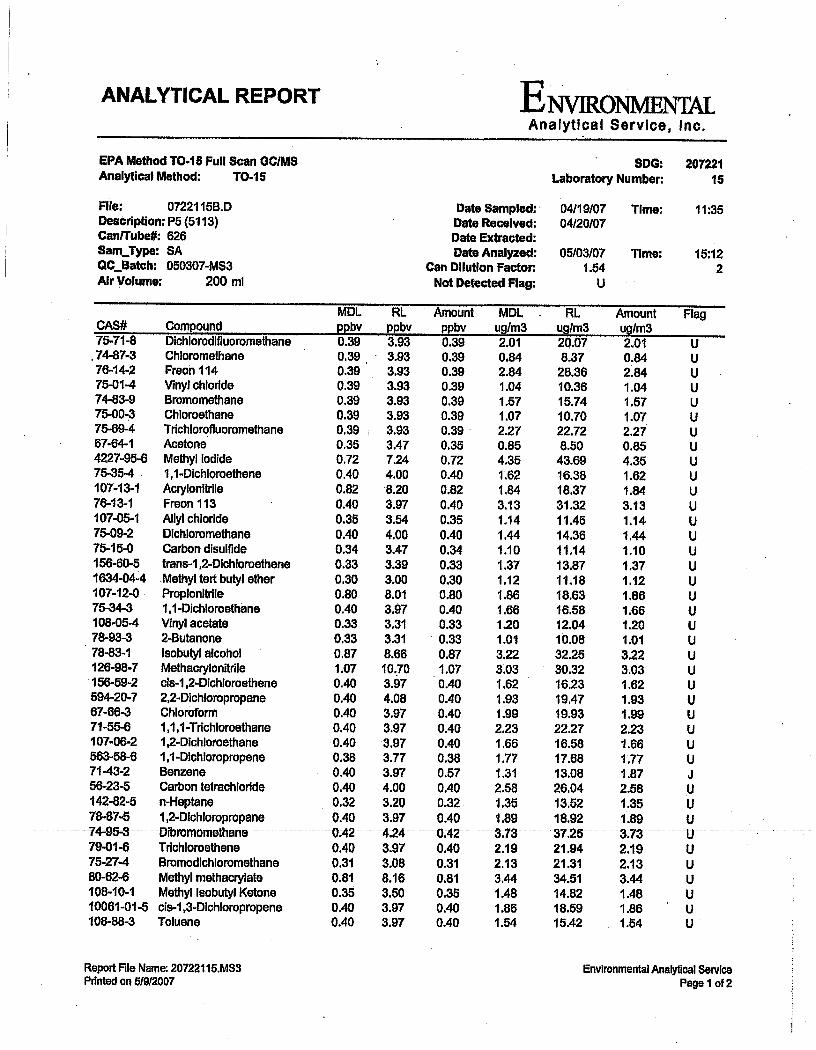
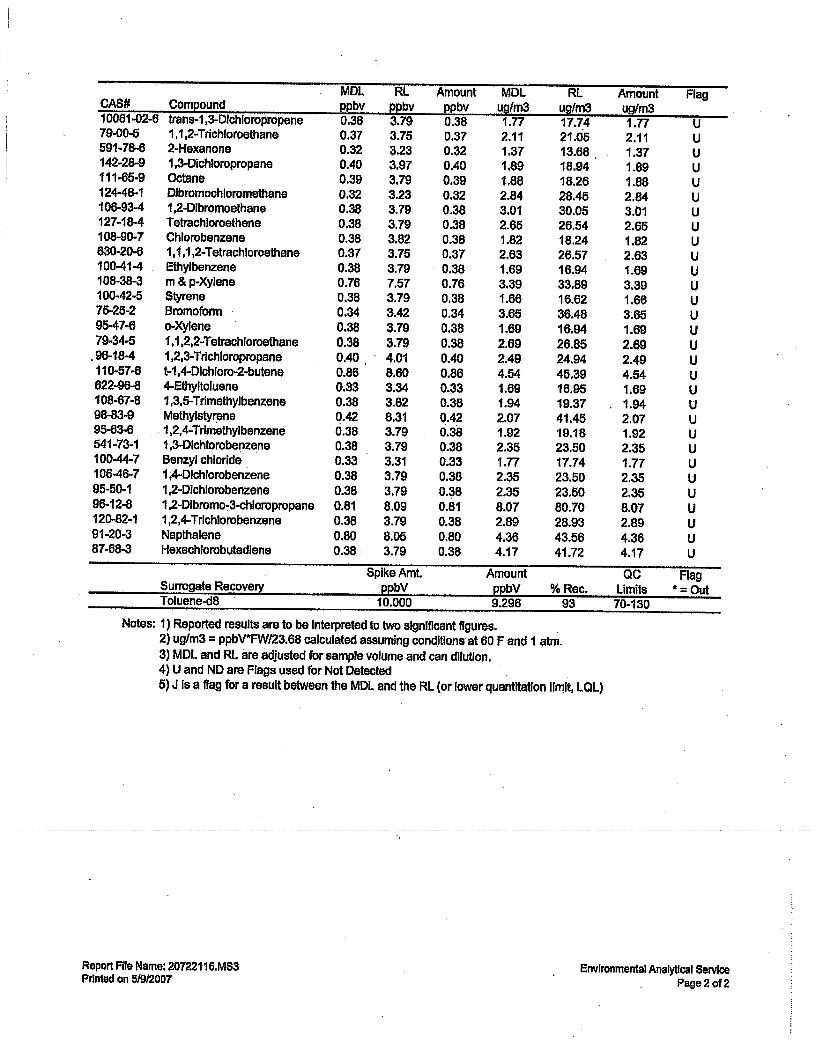
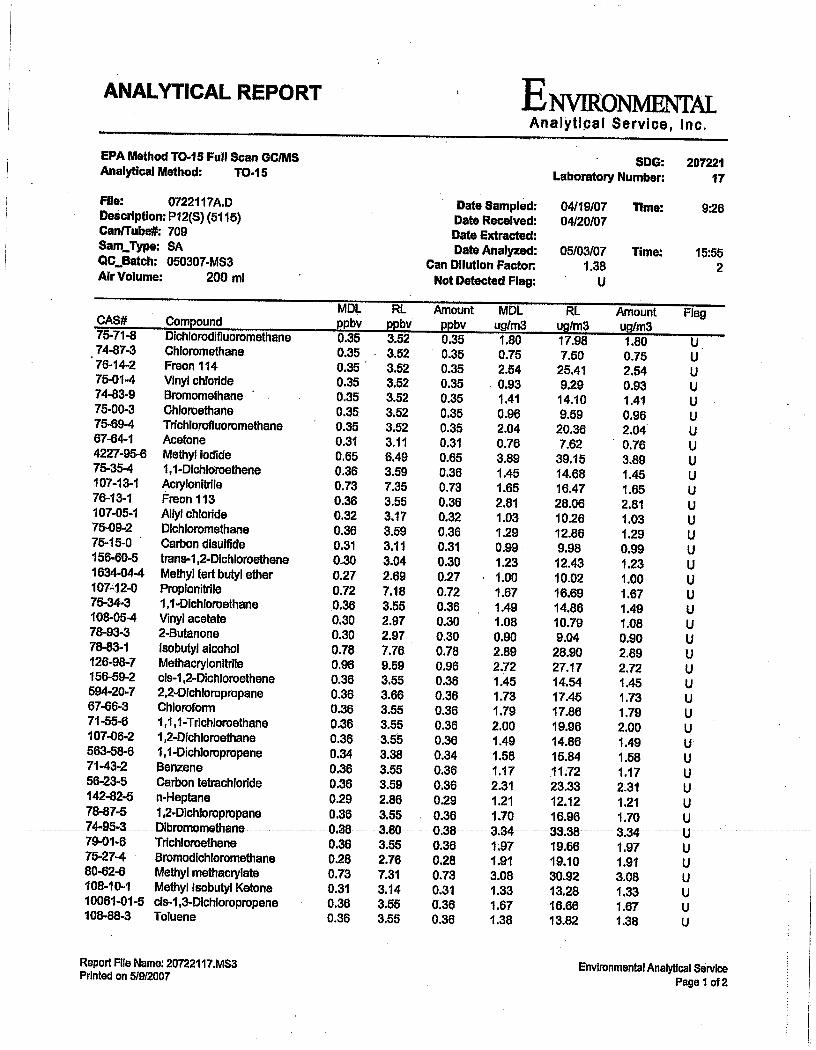
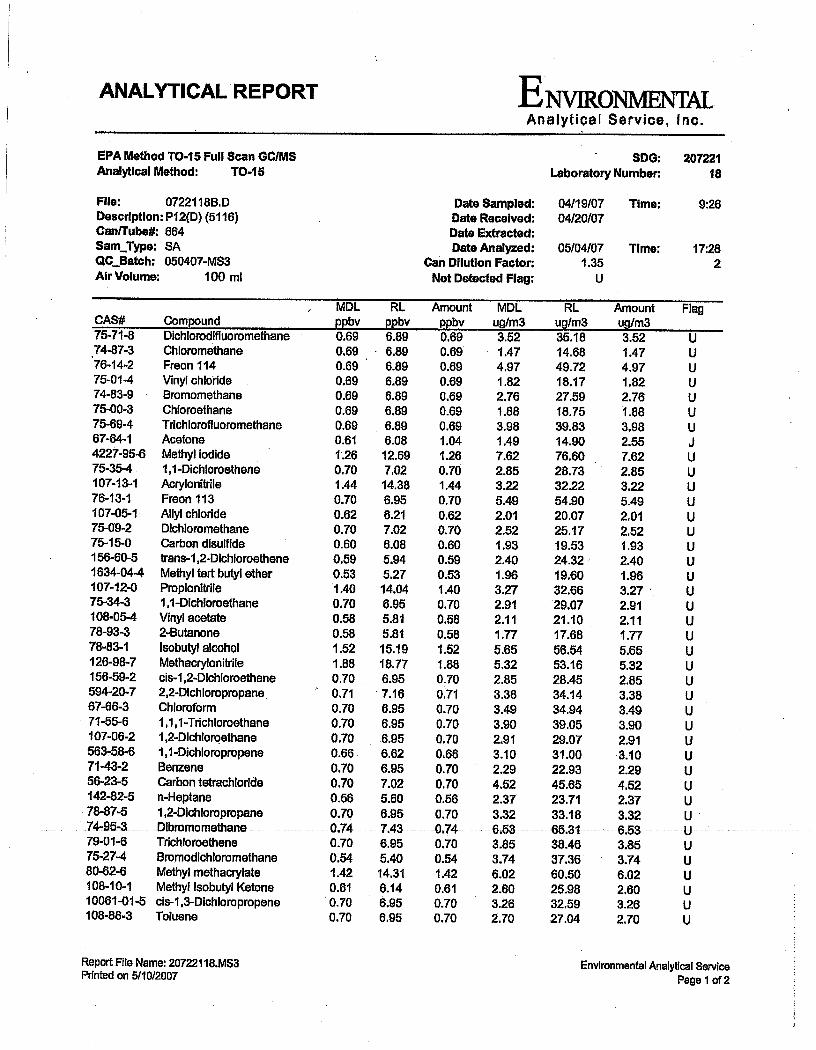
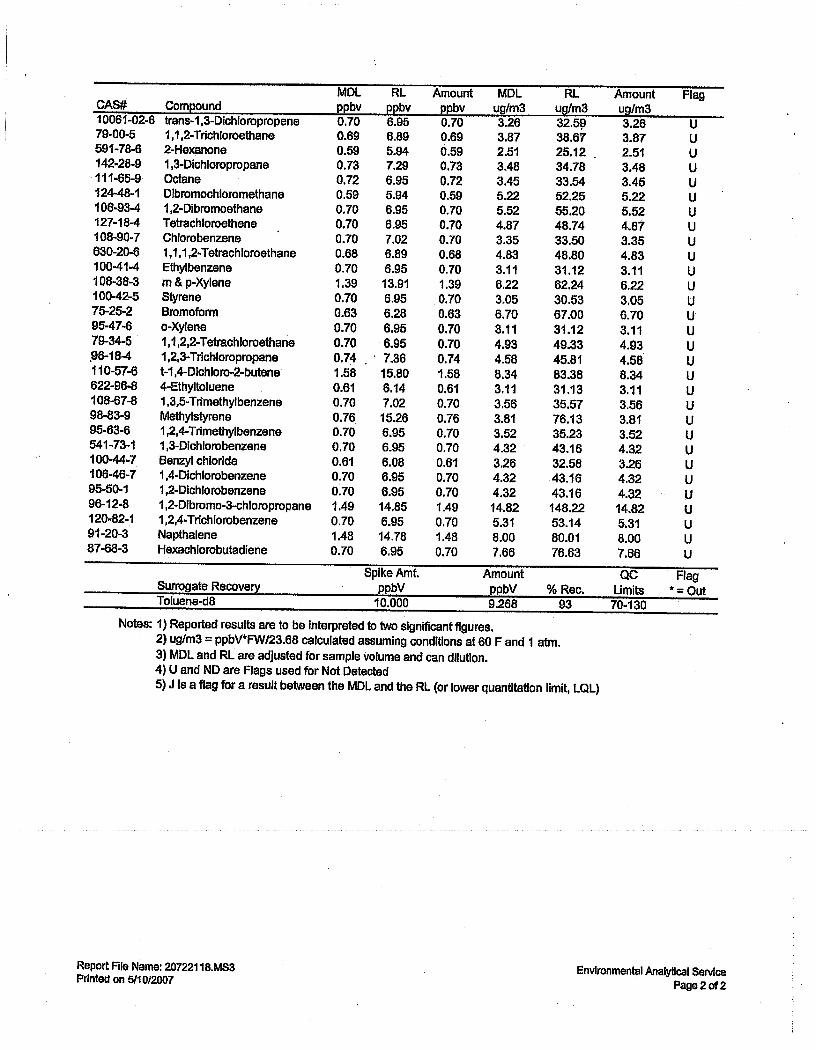
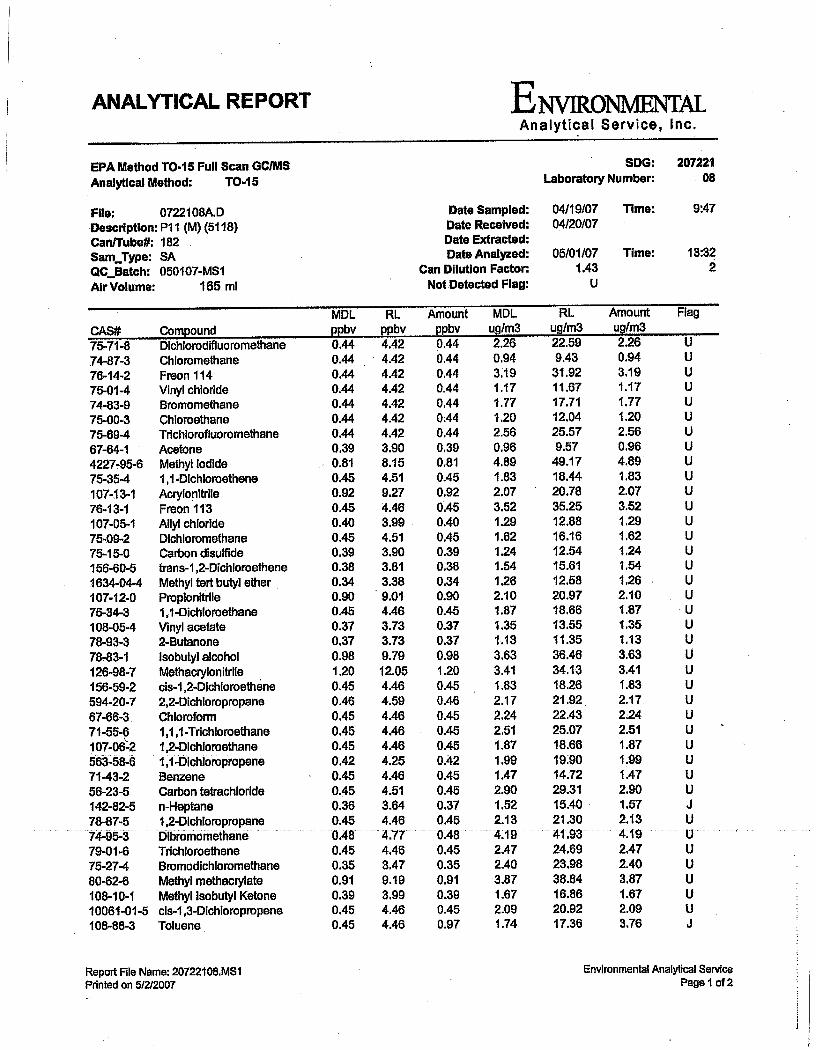
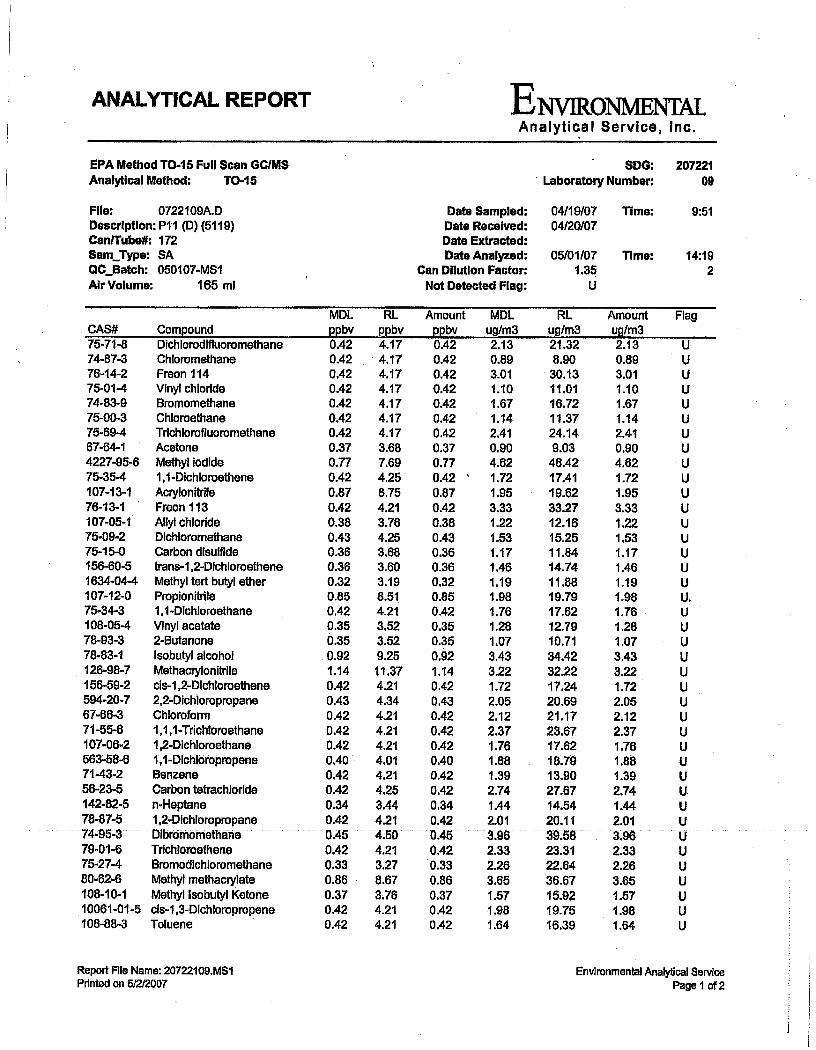
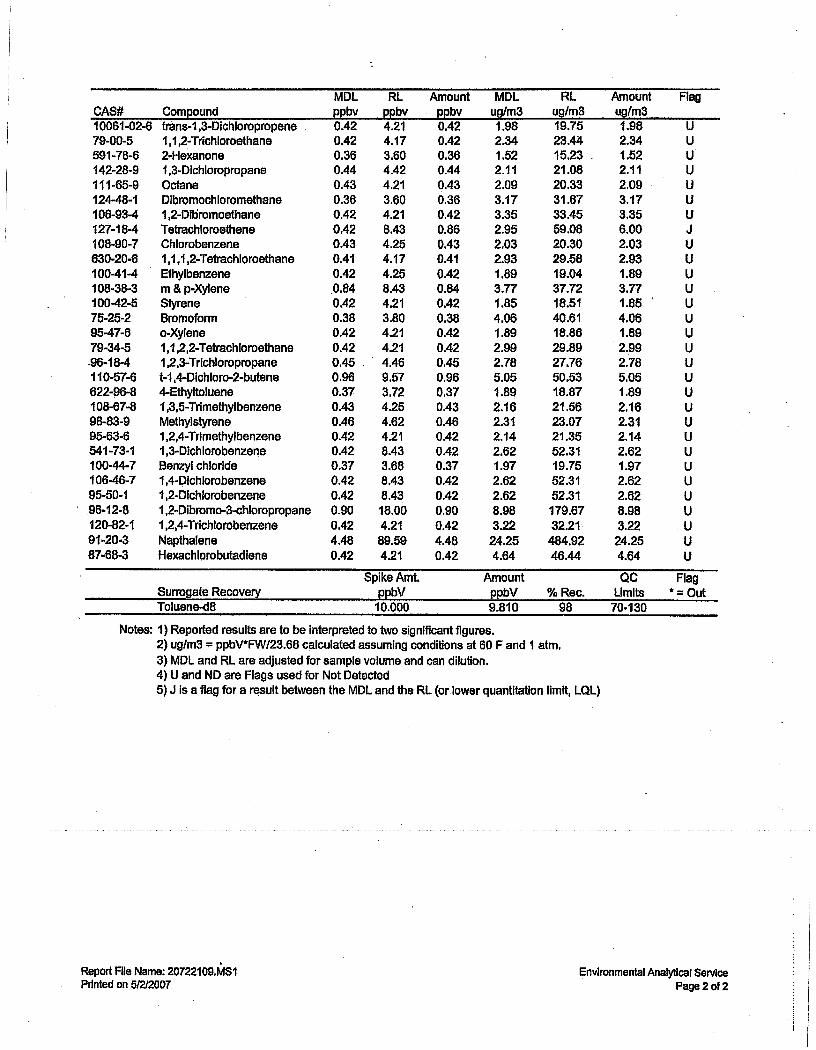
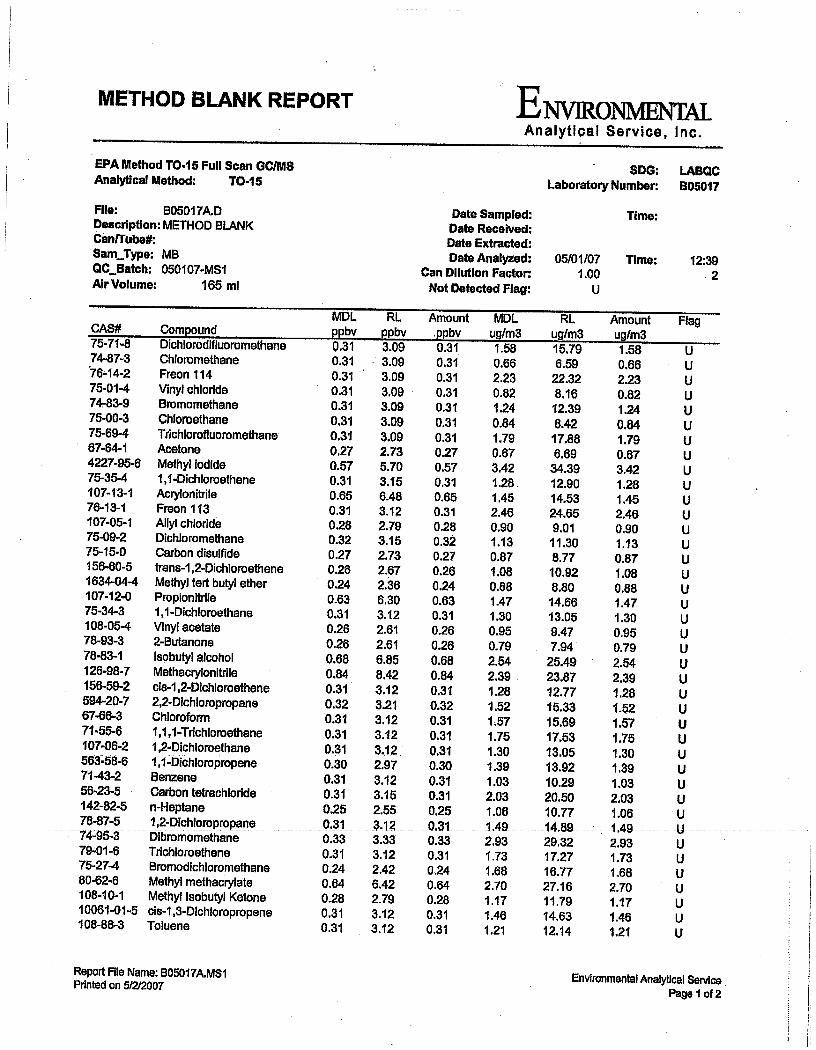
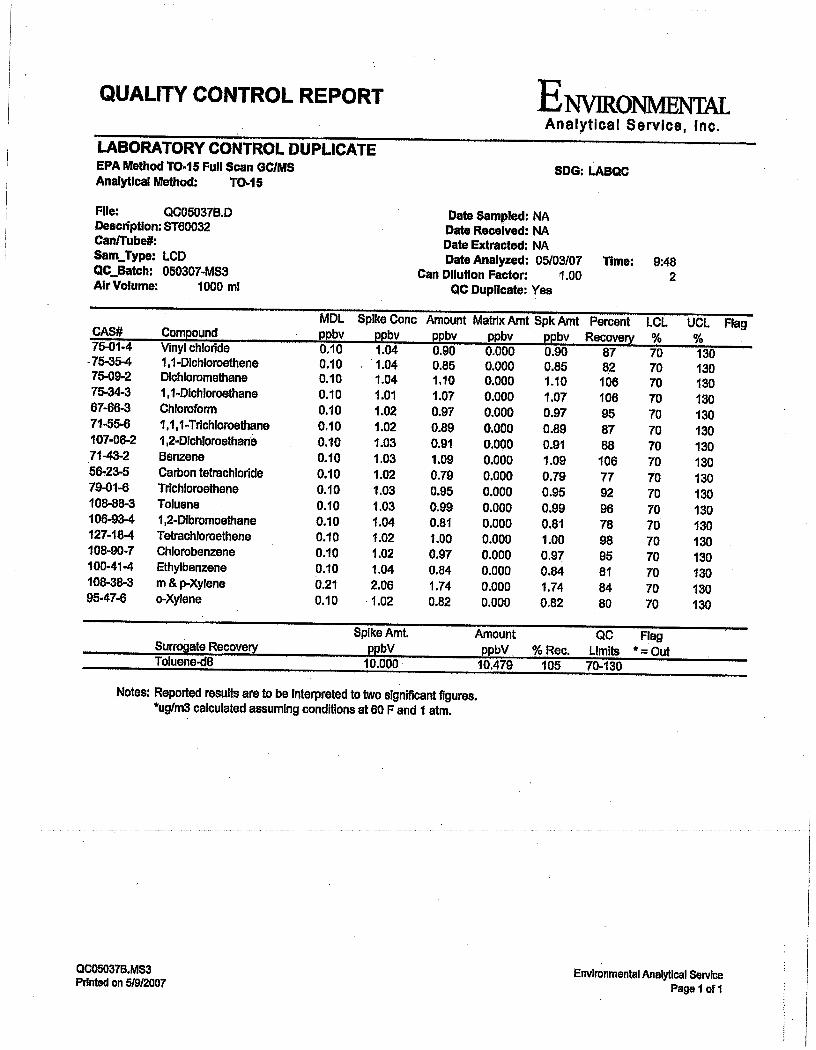
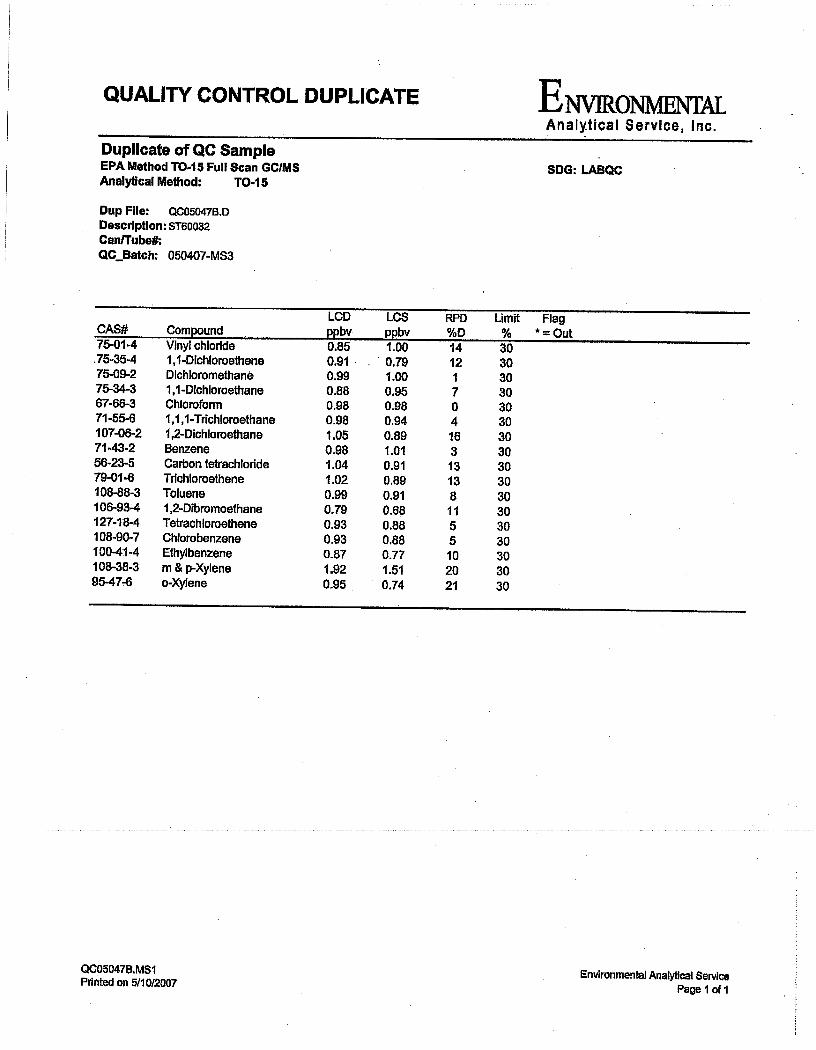
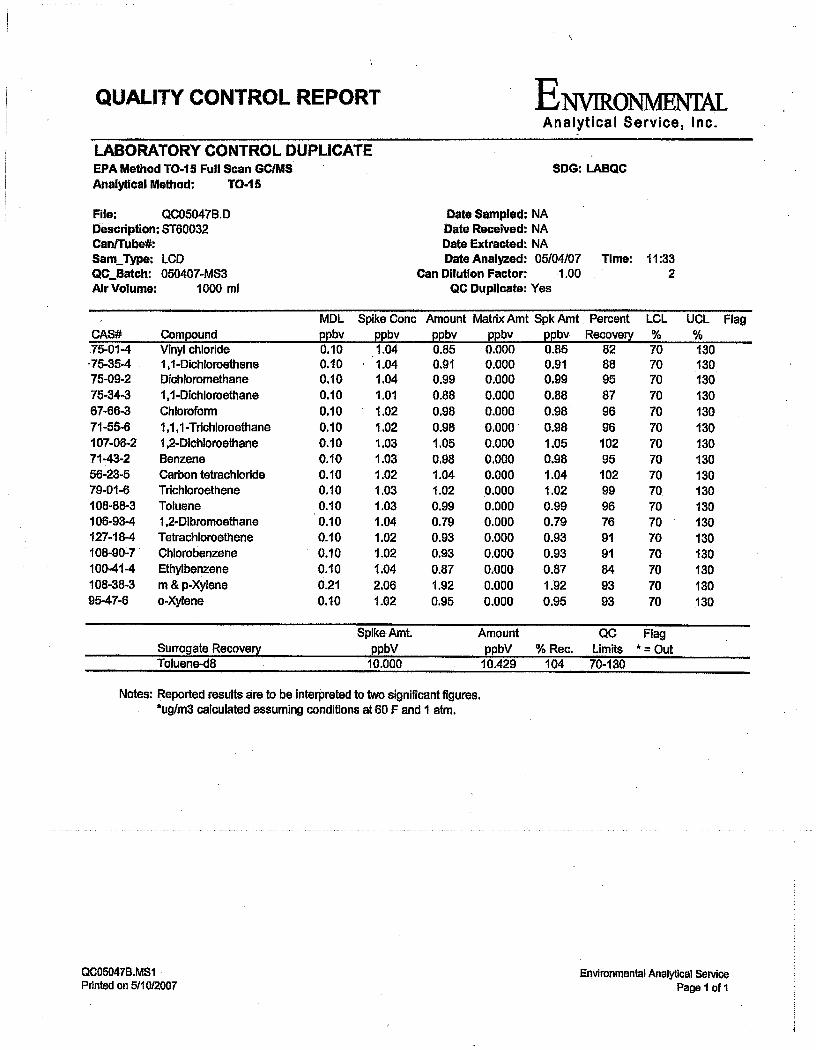
The well was drilled to 31.5 feet (bgs) and was completed as a dual completion. The shallow probe was screened from 5-15 feet (bgs) and the deep probe was screened from 20-30 feet (bgs). There was no ground water encountered and according to the well logs, no waste encountered either. Well P5 In the corner of the park, 12 feet north-west of the curb in the grass on Rolling Hills Road. The well was drilled to 16.5 feet (bgs) and completed as a single completion probe. The probe was screened from 5-15 feet (bgs). There was no ground water encountered and according to the well logs, no waste encountered either. Day 5 March 31, 2006 Well P4 is located in the north-east corner of the park. On the corner of Lazy Meadow Drive and Windmill Road approximately 16 ft, north- west of the sidewalk in the grass. The well was drilled to 16.5 feet (bgs) and completed as a single completion. The probe was screened from 5-15 feet (bgs). There was no ground water encountered and according to the well logs, no waste encountered either. Well P12 is located on the north-east Corner of Rolling Hills Road and Madison, approximately 50 feet NE of rolling hills in the grass. The well was drilled to 33 feet (bgs) and completed as a dual completion. The shallow probe was screened from 5-15 feet (bgs) and the deep probe was screened from 20-30 feet (bgs). There was no ground water encountered and according to the well logs, no waste encountered either. For more information on the construction of the gas wells (see Appendix D well construction) 2.0 Data Collection Initial gas sampling was conducted in the 13 gas monitoring wells using a gas detection instrument (GEM 2000, capable of measuring methane, carbon dioxide, oxygen and organic vapor up to 1,000 ppm) and gas sampling containers (Summa Canisters and Tedlar Bags) provided by CIWMB’s Environmental Laboratory Accreditation Program (ELAP) certified laboratory contractor. Field screening was conducted in accordance with the gas sampling and analysis plan and sample collection and analysis conducted in accordance with EPA technical order 15 (TO-15). Collected gas samples have been analyzed for typical landfill gas constituents such as methane, carbon dioxide, nitrogen and hydrogen sulfide taken at selected probes. Due to a history of oil production and the historical information indicating the site to be a sump, it was necessary to fingerprint the gas using EPA TO3 (hydro-carbon speciation), EPA 15/16 (hydrogen sulfide) and EPA TIO-15 (VOC’s). Trace gases (also referred to as Non-methane organic compounds NMOC) have been analyzed for a suite of Volatile Organic Compounds including
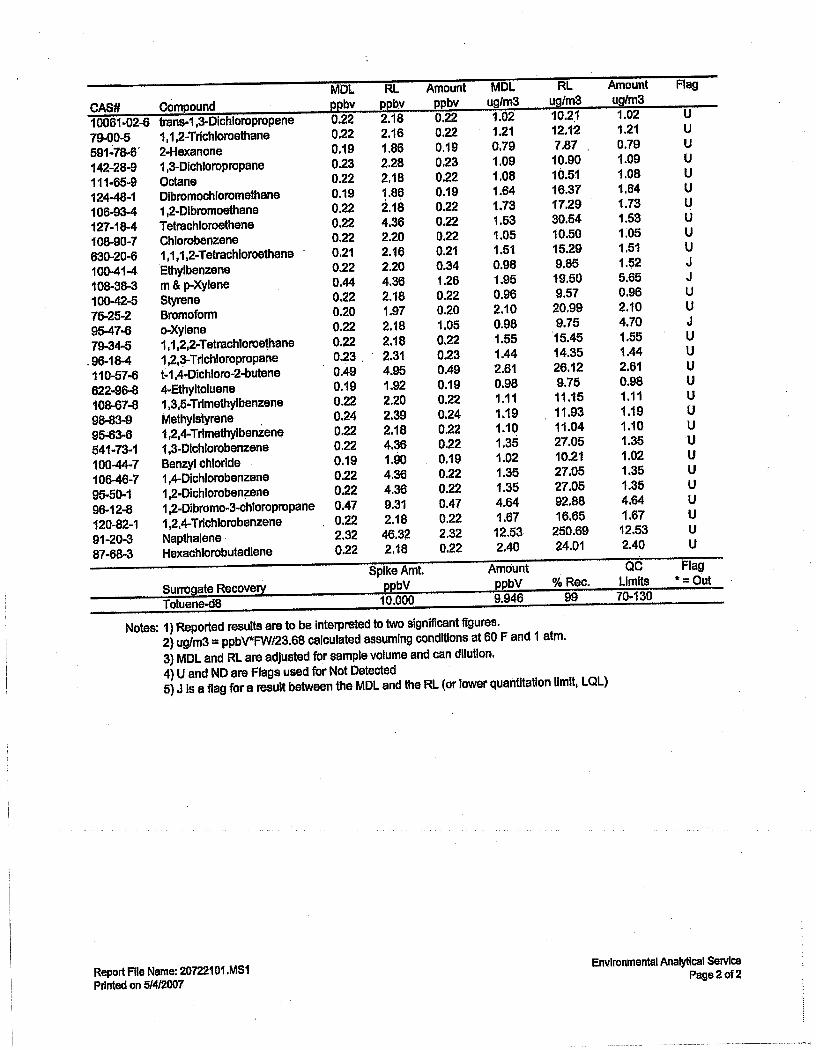
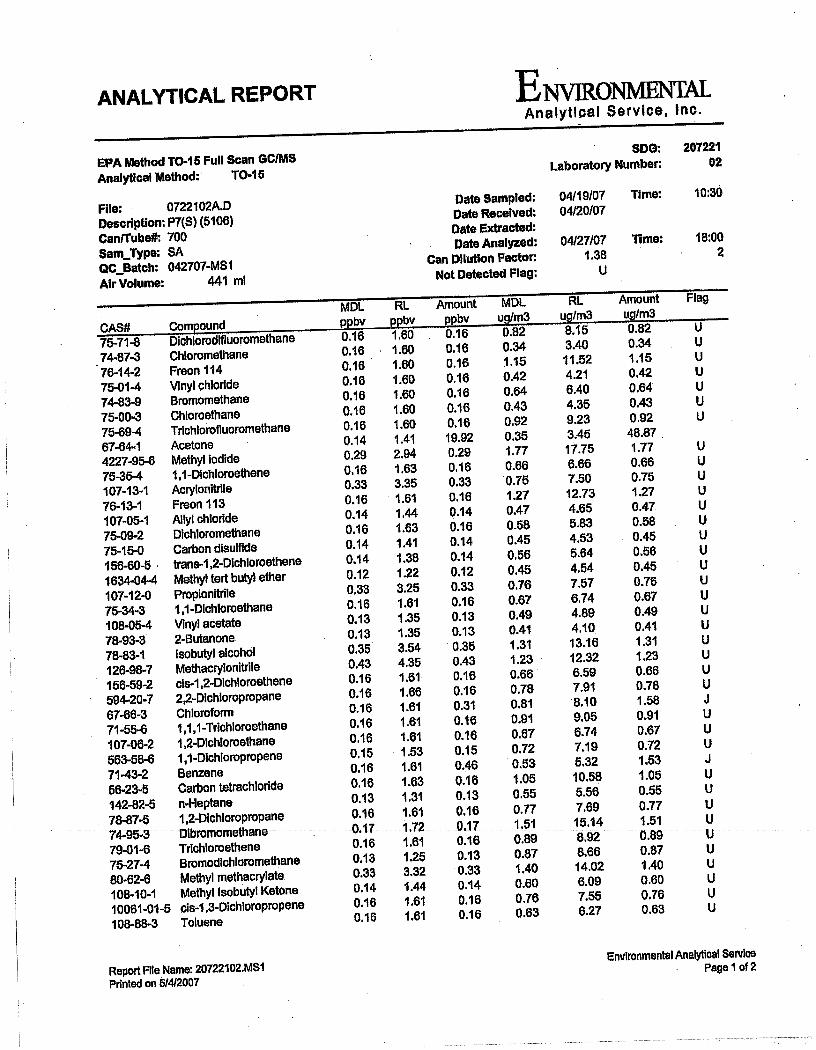
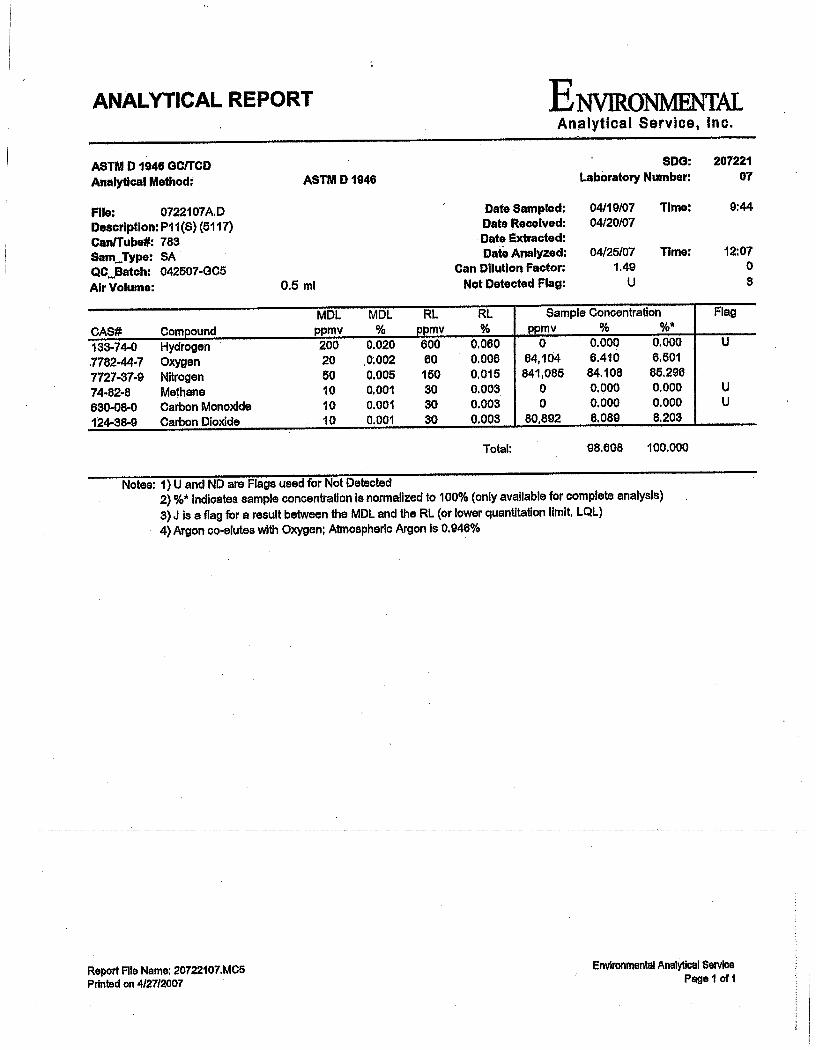
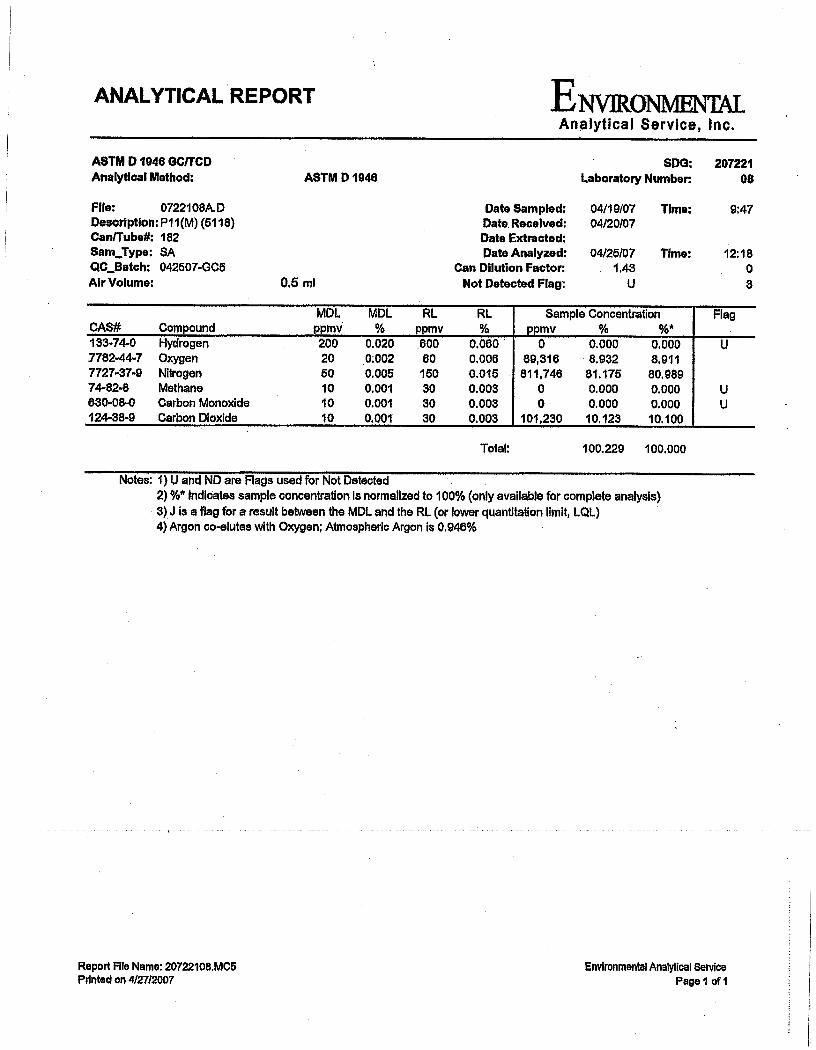
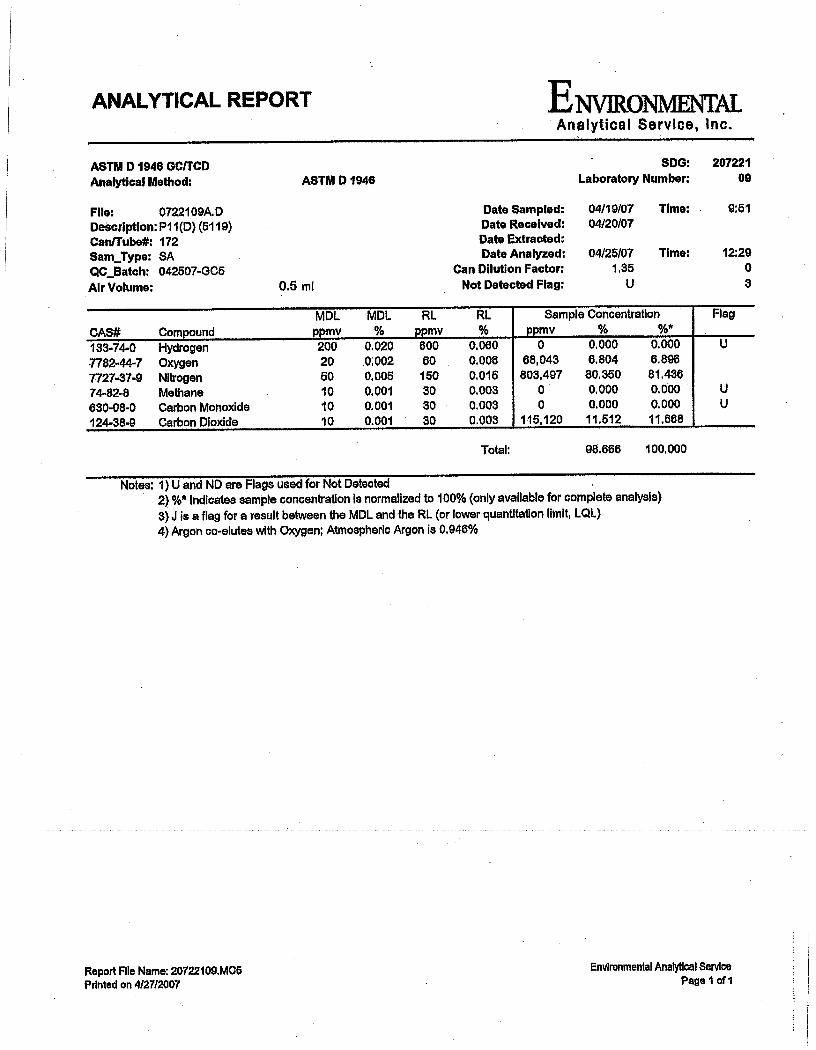
7
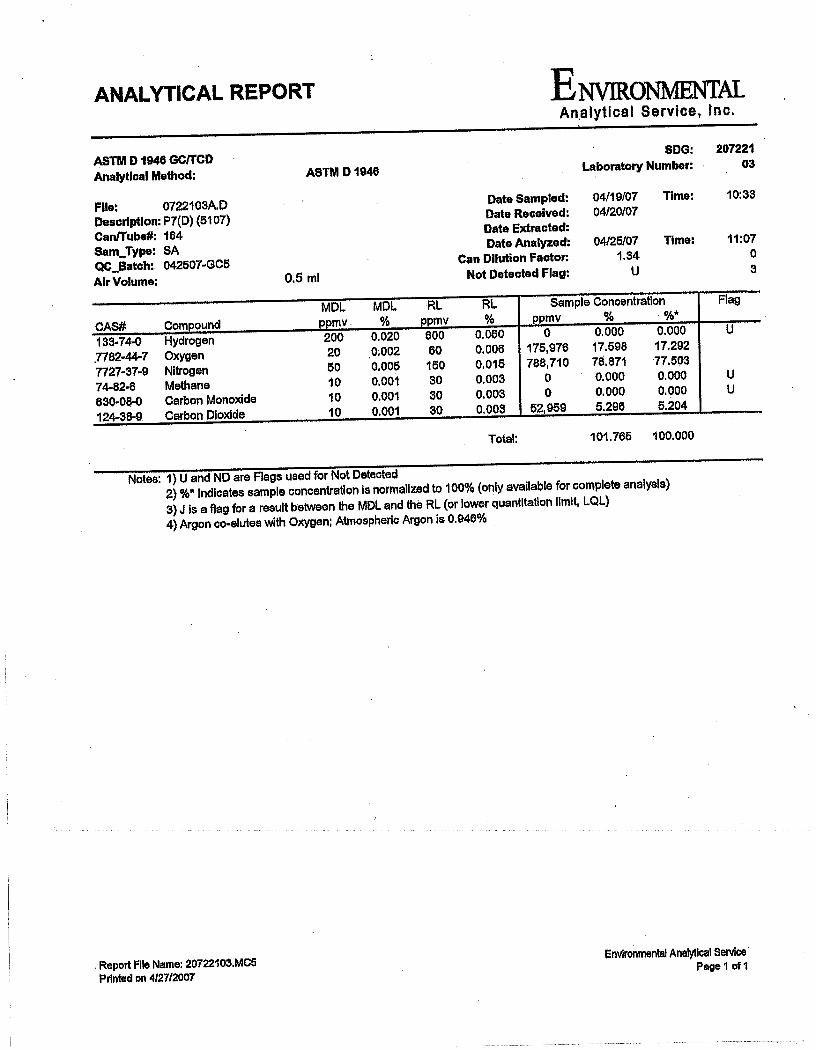
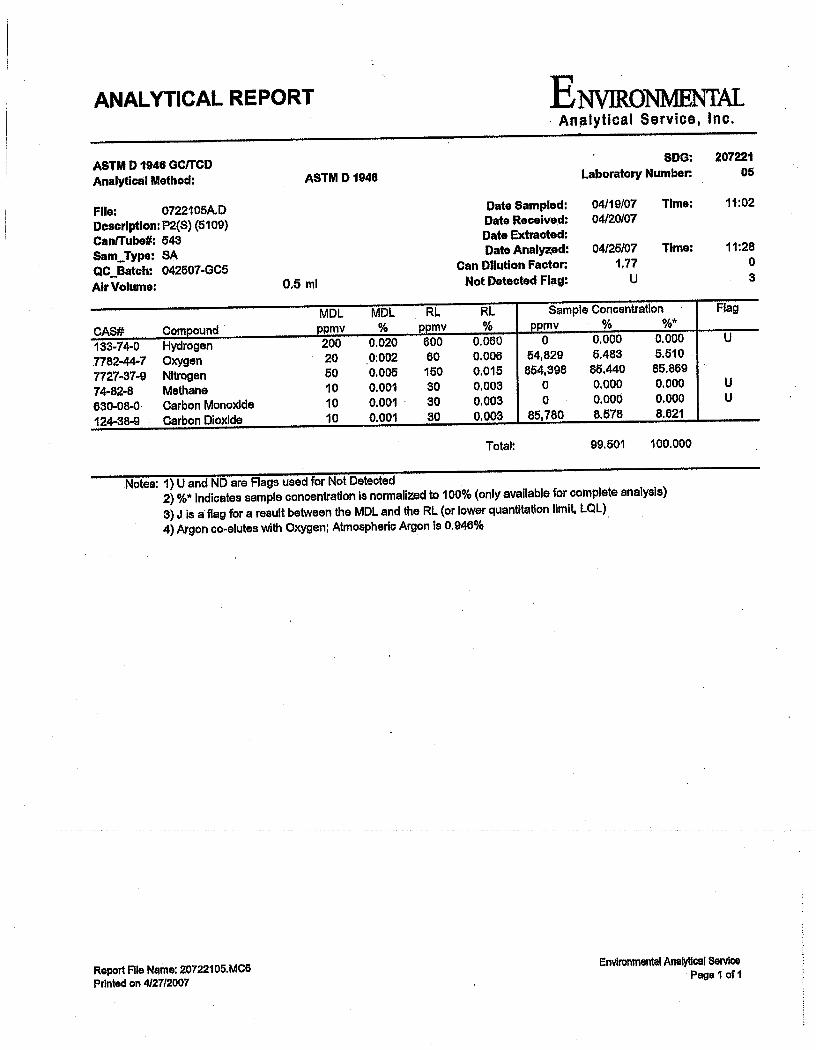
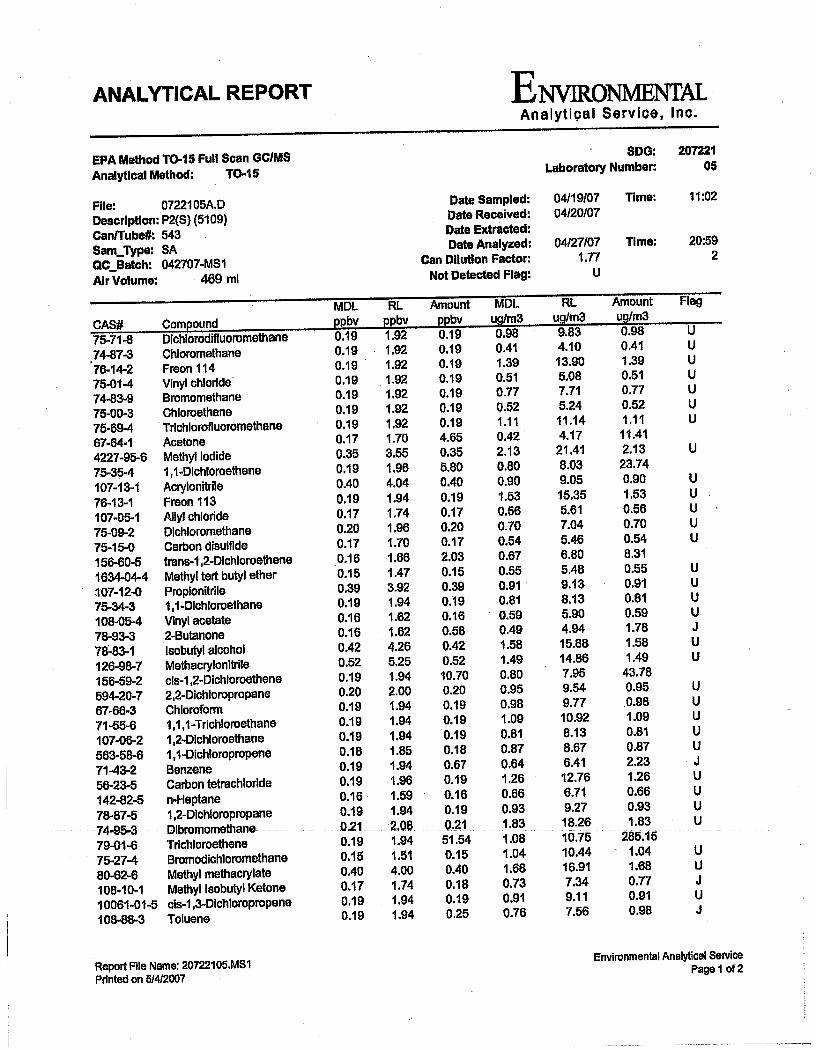
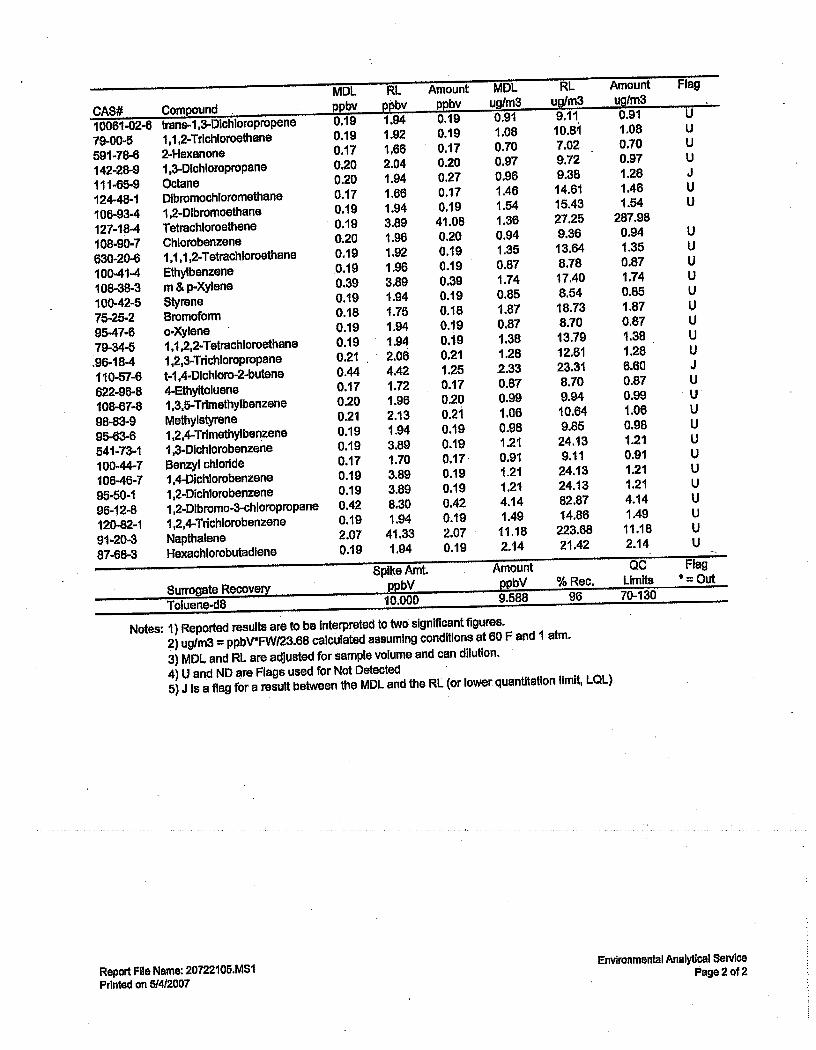
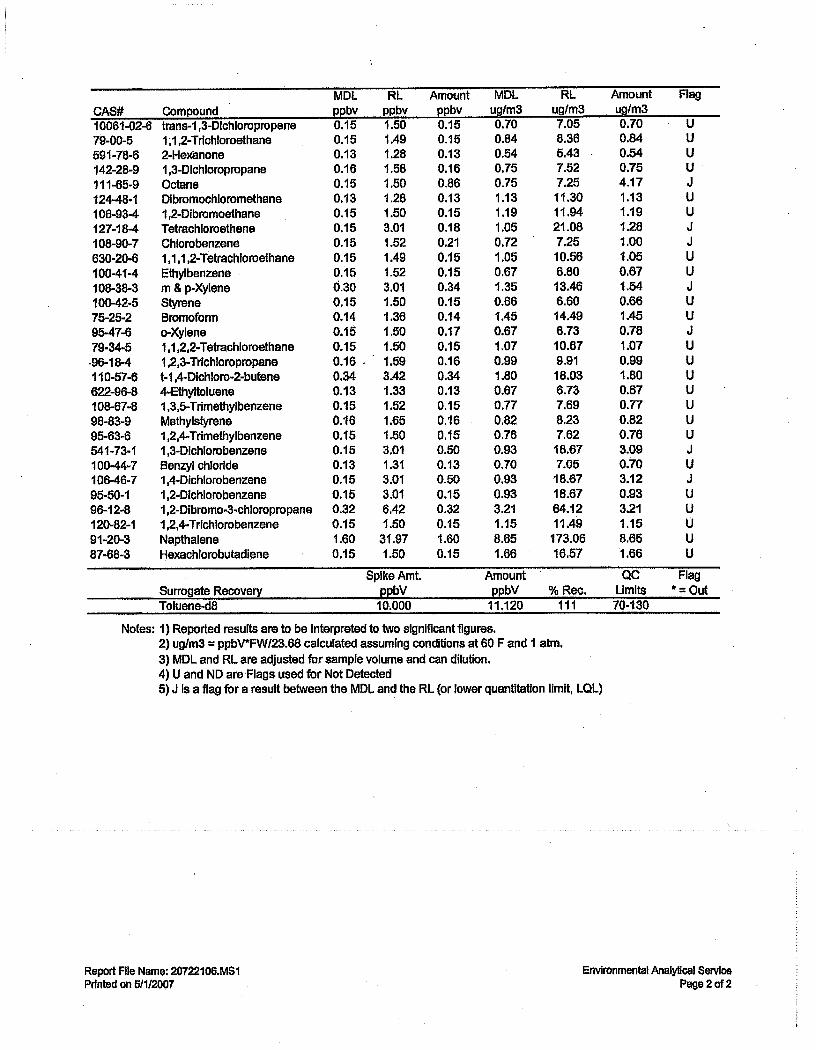
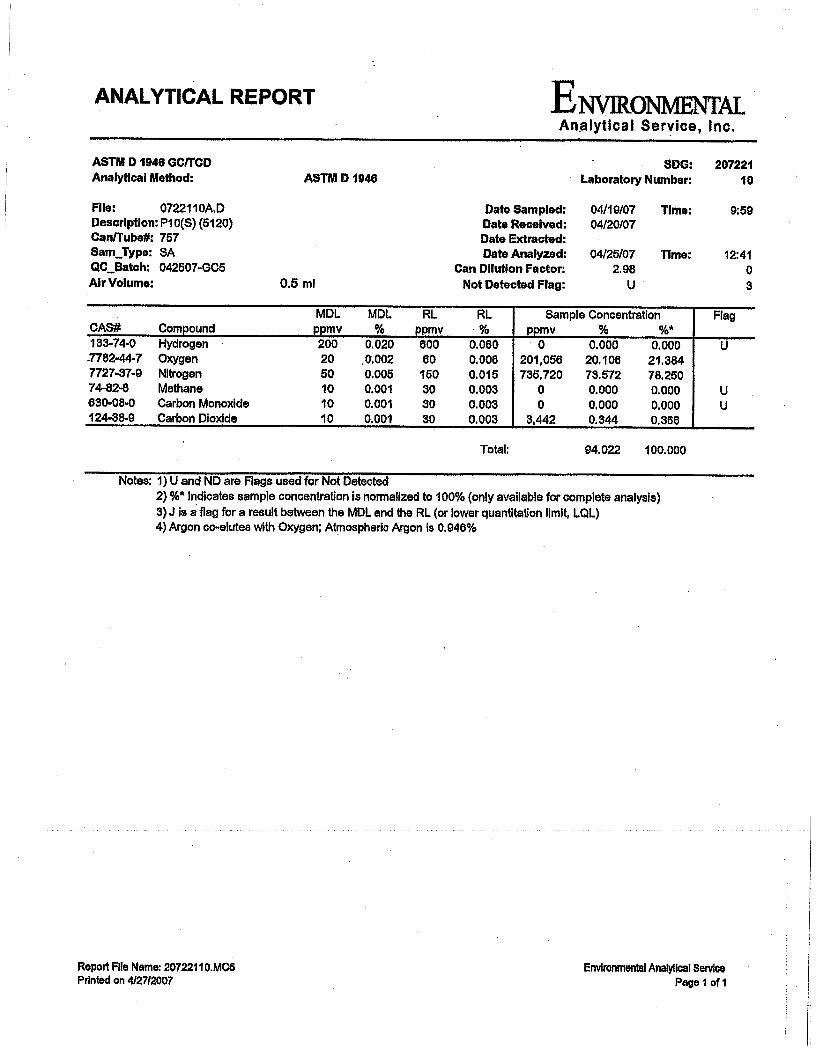
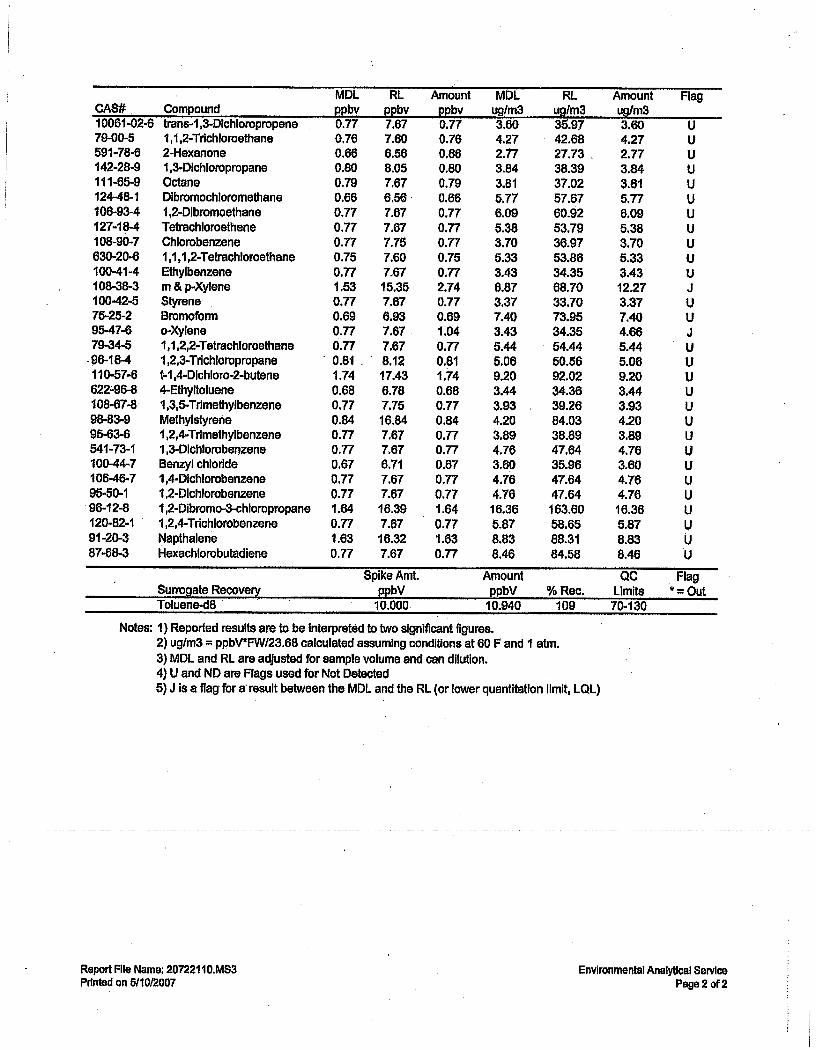
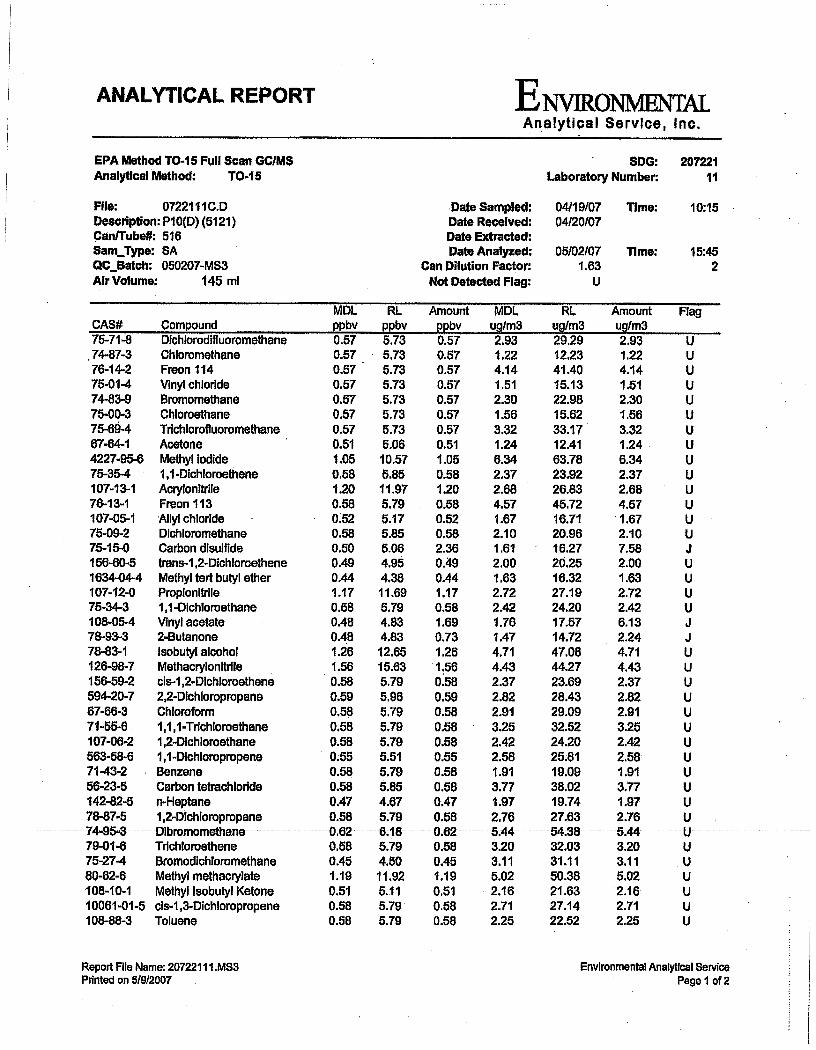
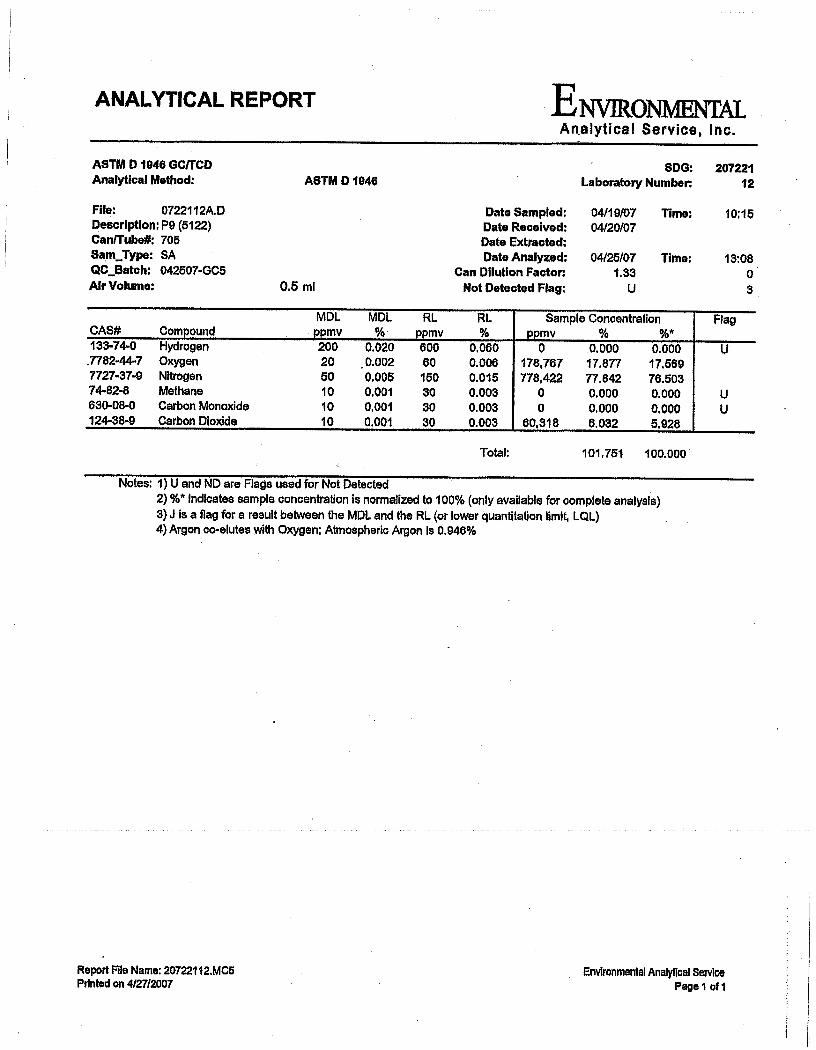
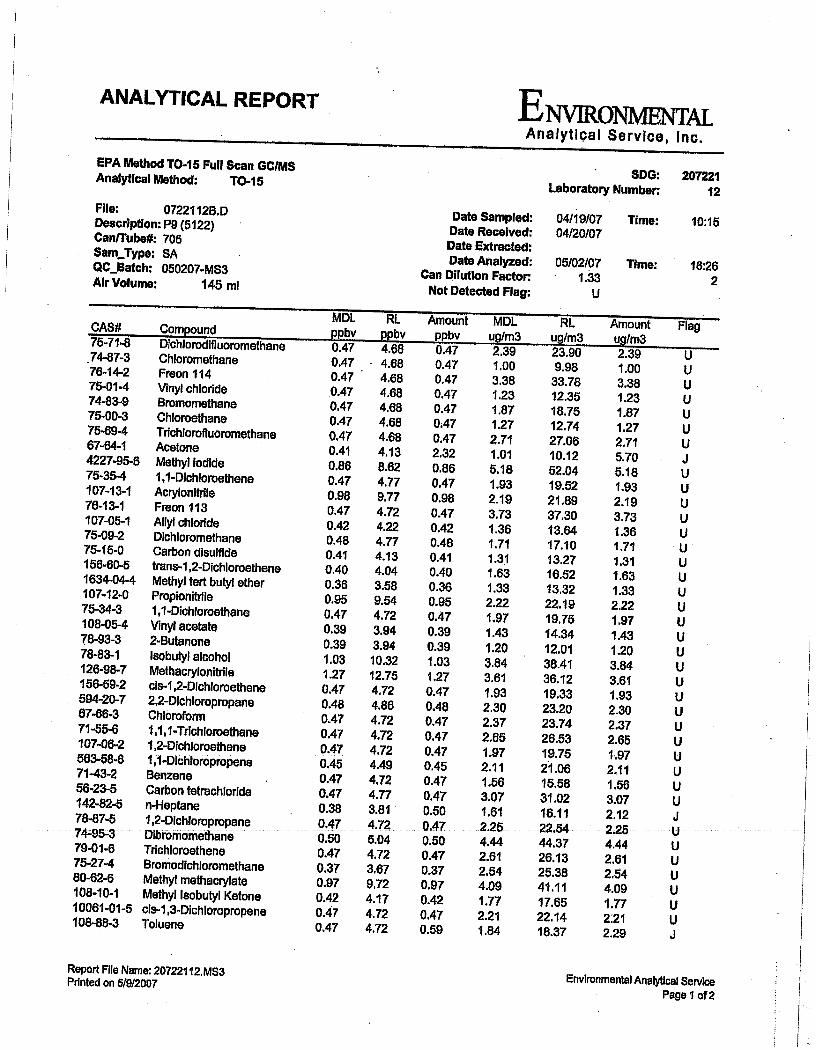
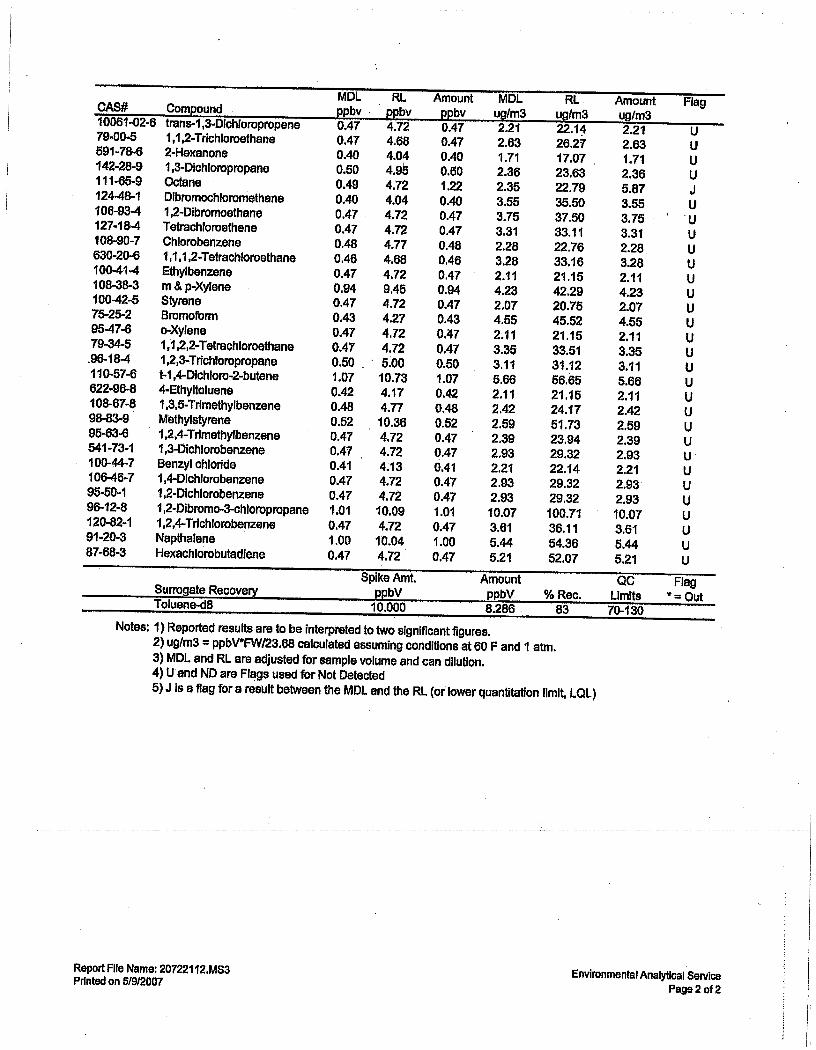
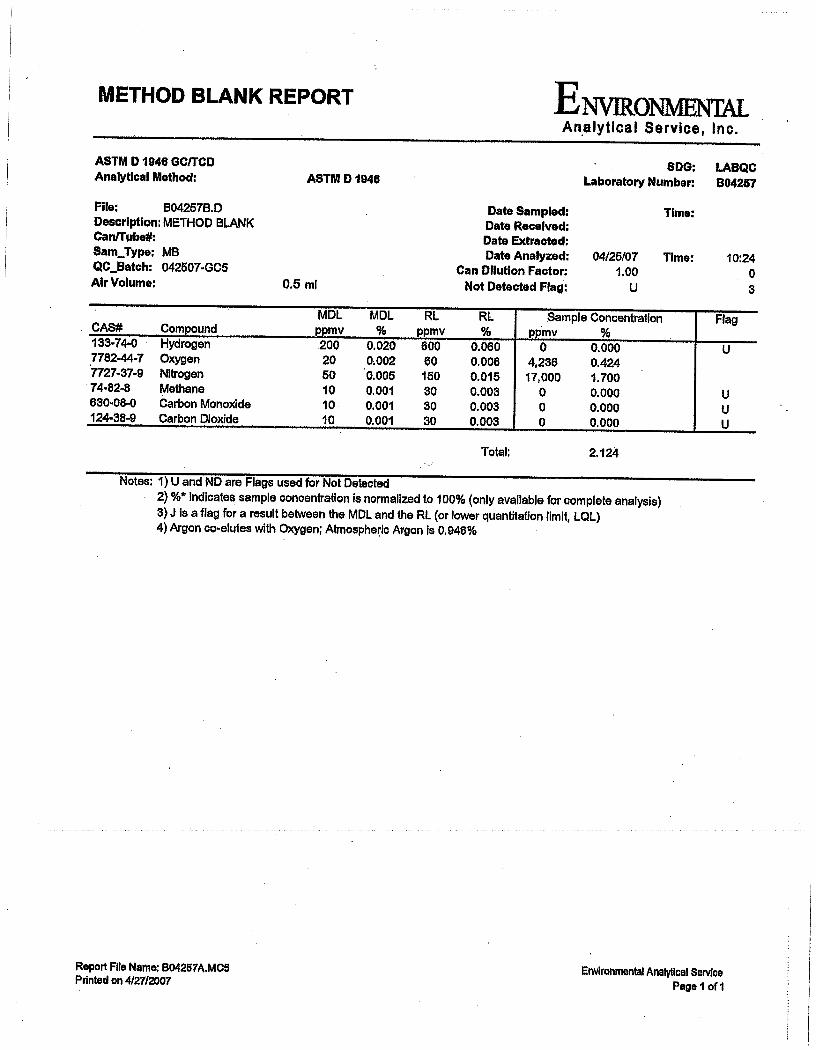
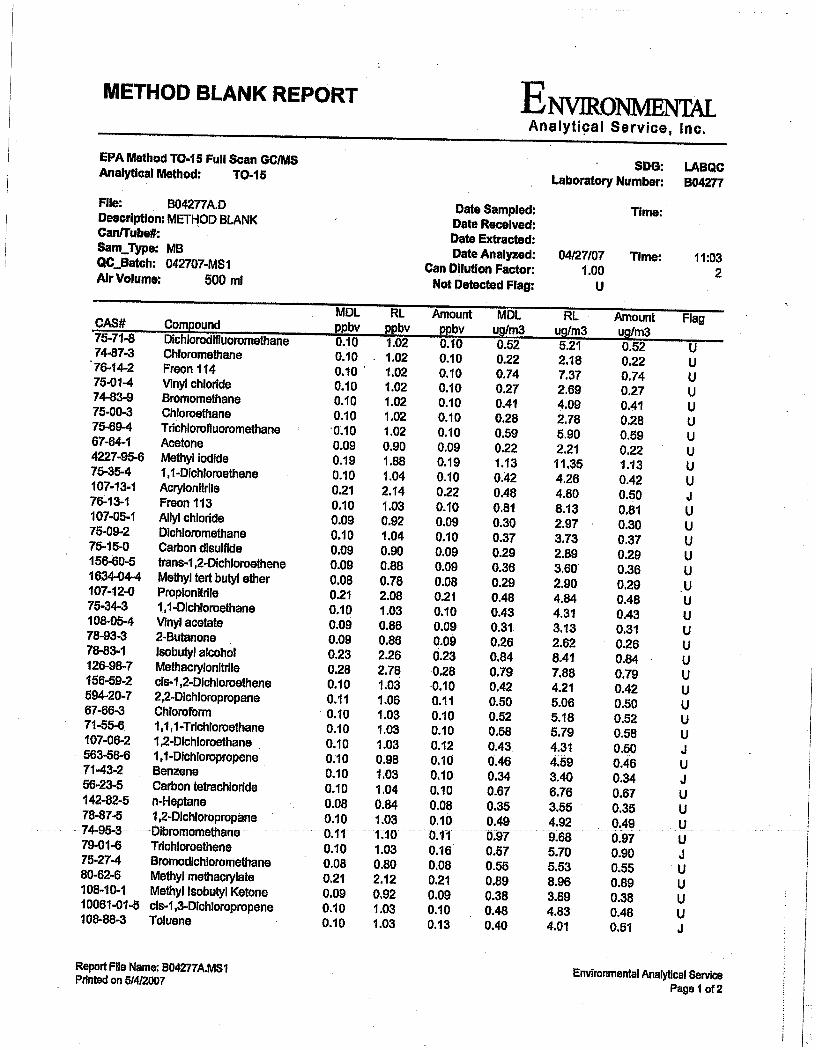
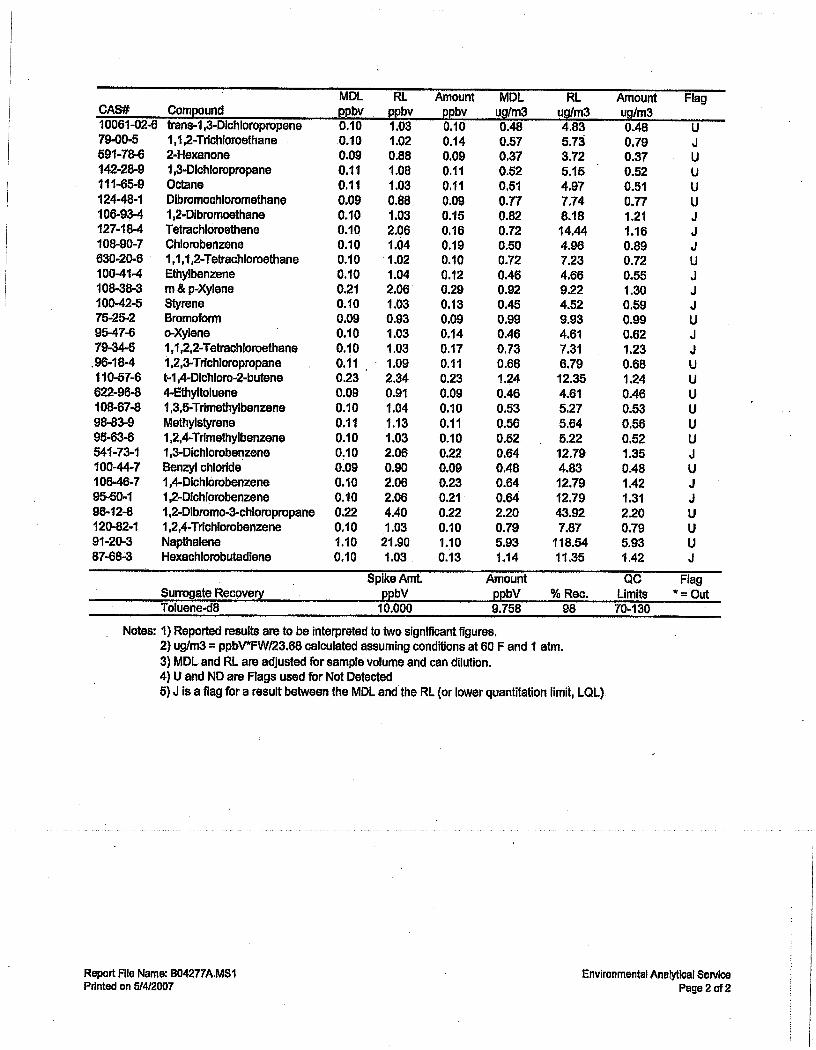
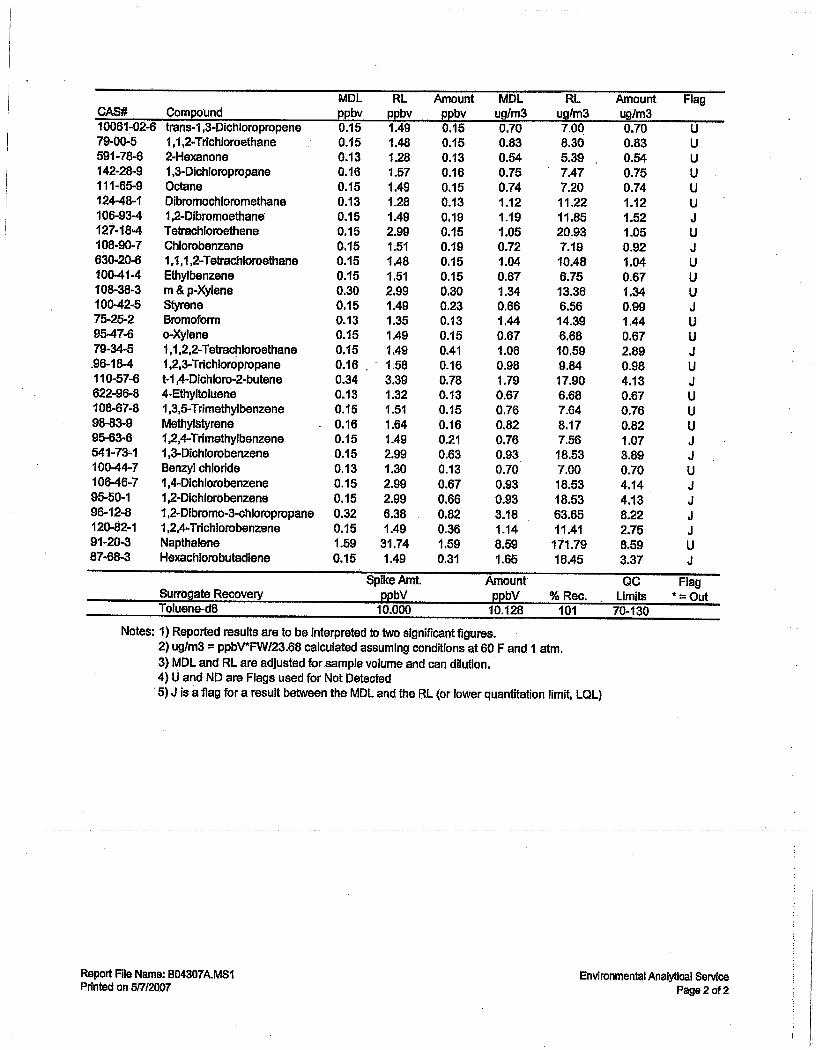
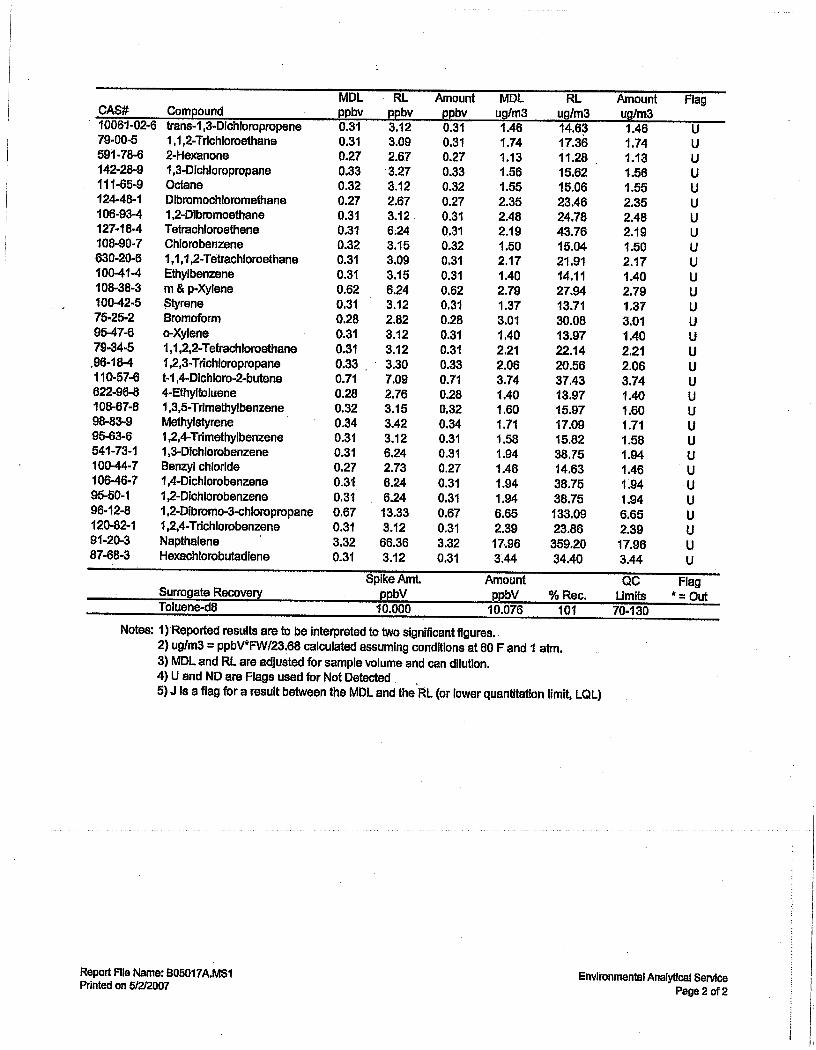
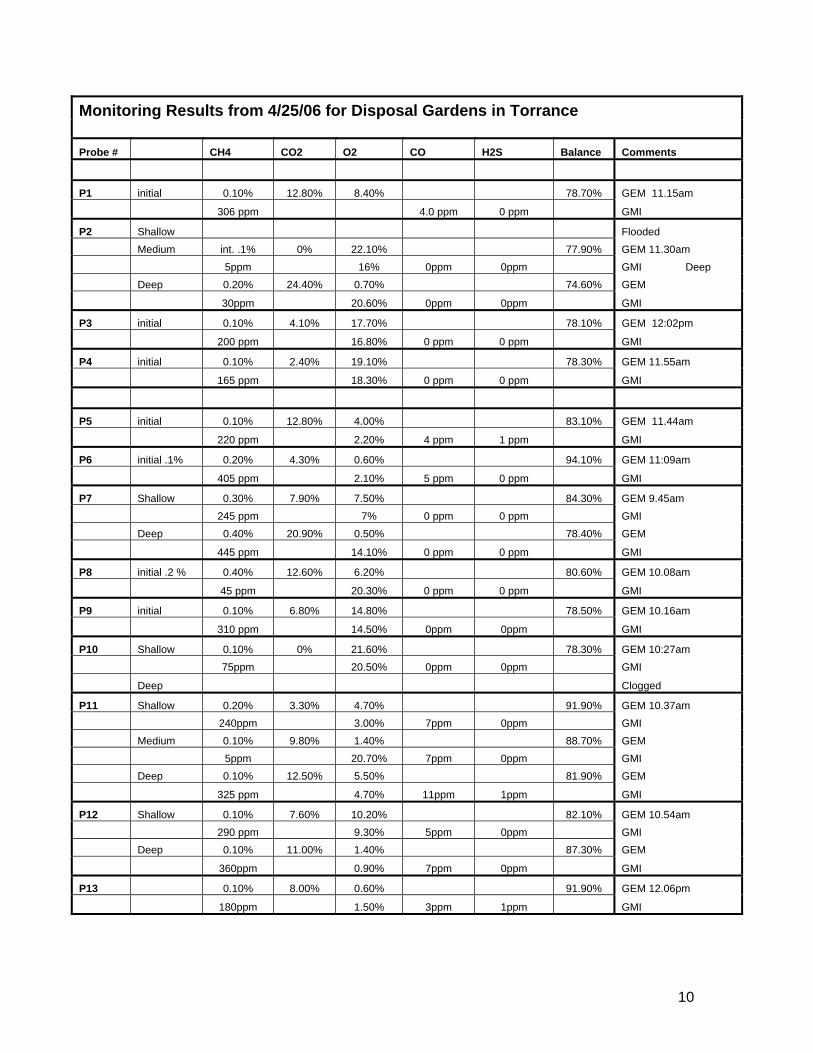
trichloroethylene, perchloroethylene, dichloromethane, tetrachloroethane, benzene, toluene, xylene and ethyl benzene (See Site Investigation Final Report for all previous analysis including soil sample analysis). 3.0 Findings and Recommendations Monthly monitoring began 4/25/06 and continued until 4/19/07 completing the annual monitoring cycle. From 4/25/06 to 9/26/06 a GEM 2000 and a GMI multi-gas analyzer was used to monitor the gas wells. From 10/24/06 until 4/19/07 the decision was made to utilize only the GEM 2000 while monitoring the site because the GMI was inaccurate in low oxygen conditions. During the last monthly sampling event, Suma Canisters were used to take verification samples of the gas. The samples were analyzed for VOC’s using EPA TO15 and ASTMD1946 for fixed gasses. The monthly monitoring results and the final laboratory results are located in Appendix A (monthly monitoring results) and Appendix B (laboratory results). The monitoring events showed no levels of methane above 5%, only 1 probe ((P-10) deep at 20-30 feet) showed some low level methane no higher than 4 % v/v 9/26/06 the following three months were: 3.3% v/v for 10/24/06, 2.9 % v/v for 11/17/06, and 2.3% v/v for 12/19/06, the remainder of the monthly monitoring events never exceeded 2% v/v. Probes 1-13 (with the exception of P10 (D), reported below regulatory thresholds and never exceeded 1 % v/v. Final laboratory results confirmed the monitoring results for Methane, probe P10 (D) showed 2.4 % v/v and all other wells showed no detectable levels of Methane, the main constituent of concern in this investigation. Trace levels of VOC’s were detected in wells P-1, P-2, P-3, P-7, P-8, P-10, P-11, and P-13. Though the Integrated Waste Management Board does not regulate Volatile Organic Compounds, laboratory analysis is generally conducted to validate chemical constituents that are common in landfill gas such as Vinyl Chloride. The information is also provided to the Regional Water Quality Control Board (RWQCB), Department of Toxic Substances Control (DTSC) and the Local Enforcement Agency to further evaluate the site and determine if their standards have been violated and a threat to public health is substantiated. 4.0 Conclusion Based on monthly monitoring and analytical laboratory results, this site does not violate State Minimum Standards for methane migration or intrusion. The CIWMB could not determine if this was actually a solid waste site from work performed when the gas wells were installed. Historical information suggests that the site was never permitted to be used as a solid waste site and the site investigation verifies the historical information. This report will be forwarded to RWQCB, DTSC and the LEA to comment or determine if

8
there will be any further actions to enforce their regulations. We recommend that quarterly monitoring be conducted by the LEA for at least a period of 1 year, further actions to be determined there after.

9
APPENDIX A Monthly Monitoring Results
10
Monitoring Results from 4/25/06 for Disposal Gardens in Torrance Probe # CH4 CO2 O2 CO H2S Balance Comments
P1 initial 0.10% 12.80% 8.40% 78.70% GEM 11.15am
306 ppm 4.0 ppm 0 ppm GMI
P2 Shallow Flooded Medium int. .1% 0% 22.10% 77.90% GEM 11.30am 5ppm 16% 0ppm 0ppm GMI Deep Deep 0.20% 24.40% 0.70% 74.60% GEM
30ppm 20.60% 0ppm 0ppm GMI
P3 initial 0.10% 4.10% 17.70% 78.10% GEM 12:02pm
200 ppm 16.80% 0 ppm 0 ppm GMI
P4 initial 0.10% 2.40% 19.10% 78.30% GEM 11.55am
165 ppm 18.30% 0 ppm 0 ppm GMI
P5 initial 0.10% 12.80% 4.00% 83.10% GEM 11.44am
220 ppm 2.20% 4 ppm 1 ppm GMI
P6 initial .1% 0.20% 4.30% 0.60% 94.10% GEM 11:09am
405 ppm 2.10% 5 ppm 0 ppm GMI
P7 Shallow 0.30% 7.90% 7.50% 84.30% GEM 9.45am 245 ppm 7% 0 ppm 0 ppm GMI Deep 0.40% 20.90% 0.50% 78.40% GEM
445 ppm 14.10% 0 ppm 0 ppm GMI
P8 initial .2 % 0.40% 12.60% 6.20% 80.60% GEM 10.08am
45 ppm 20.30% 0 ppm 0 ppm GMI
P9 initial 0.10% 6.80% 14.80% 78.50% GEM 10.16am
310 ppm 14.50% 0ppm 0ppm GMI
P10 Shallow 0.10% 0% 21.60% 78.30% GEM 10:27am 75ppm 20.50% 0ppm 0ppm GMI
Deep Clogged
P11 Shallow 0.20% 3.30% 4.70% 91.90% GEM 10.37am 240ppm 3.00% 7ppm 0ppm GMI Medium 0.10% 9.80% 1.40% 88.70% GEM 5ppm 20.70% 7ppm 0ppm GMI Deep 0.10% 12.50% 5.50% 81.90% GEM
325 ppm 4.70% 11ppm 1ppm GMI
P12 Shallow 0.10% 7.60% 10.20% 82.10% GEM 10.54am 290 ppm 9.30% 5ppm 0ppm GMI Deep 0.10% 11.00% 1.40% 87.30% GEM
360ppm 0.90% 7ppm 0ppm GMI
P13 0.10% 8.00% 0.60% 91.90% GEM 12.06pm
180ppm 1.50% 3ppm 1ppm GMI
11
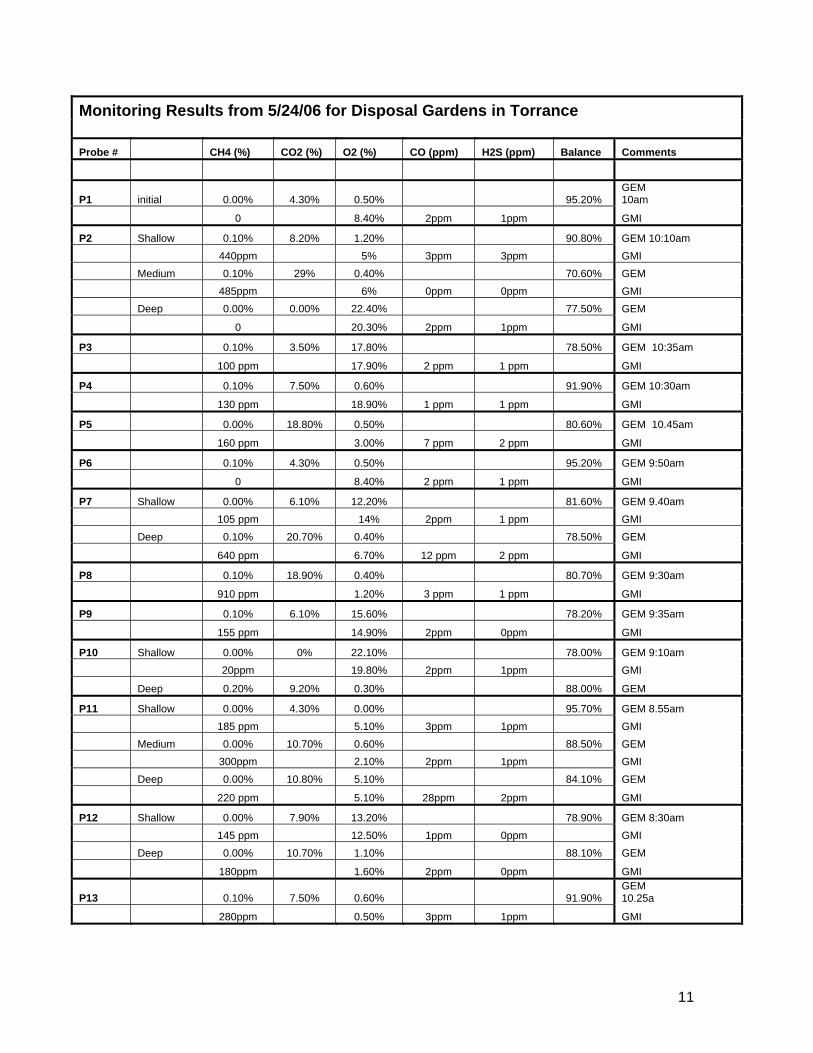
Monitoring Results from 5/24/06 for Disposal Gardens in Torrance
Probe # CH4 (%) CO2 (%) O2 (%) CO (ppm) H2S (ppm) Balance Comments
P1 initial 0.00% 4.30% 0.50% 95.20% GEM 10am
0 8.40% 2ppm 1ppm GMI
P2 Shallow 0.10% 8.20% 1.20% 90.80% GEM 10:10am 440ppm 5% 3ppm 3ppm GMI Medium 0.10% 29% 0.40% 70.60% GEM 485ppm 6% 0ppm 0ppm GMI Deep 0.00% 0.00% 22.40% 77.50% GEM
0 20.30% 2ppm 1ppm GMI
P3 0.10% 3.50% 17.80% 78.50% GEM 10:35am
100 ppm 17.90% 2 ppm 1 ppm GMI
P4 0.10% 7.50% 0.60% 91.90% GEM 10:30am
130 ppm 18.90% 1 ppm 1 ppm GMI
P5 0.00% 18.80% 0.50% 80.60% GEM 10.45am
160 ppm 3.00% 7 ppm 2 ppm GMI
P6 0.10% 4.30% 0.50% 95.20% GEM 9:50am
0 8.40% 2 ppm 1 ppm GMI
P7 Shallow 0.00% 6.10% 12.20% 81.60% GEM 9.40am 105 ppm 14% 2ppm 1 ppm GMI Deep 0.10% 20.70% 0.40% 78.50% GEM
640 ppm 6.70% 12 ppm 2 ppm GMI
P8 0.10% 18.90% 0.40% 80.70% GEM 9:30am
910 ppm 1.20% 3 ppm 1 ppm GMI
P9 0.10% 6.10% 15.60% 78.20% GEM 9:35am
155 ppm 14.90% 2ppm 0ppm GMI
P10 Shallow 0.00% 0% 22.10% 78.00% GEM 9:10am 20ppm 19.80% 2ppm 1ppm GMI
Deep 0.20% 9.20% 0.30% 88.00% GEM
P11 Shallow 0.00% 4.30% 0.00% 95.70% GEM 8.55am 185 ppm 5.10% 3ppm 1ppm GMI Medium 0.00% 10.70% 0.60% 88.50% GEM 300ppm 2.10% 2ppm 1ppm GMI Deep 0.00% 10.80% 5.10% 84.10% GEM
220 ppm 5.10% 28ppm 2ppm GMI
P12 Shallow 0.00% 7.90% 13.20% 78.90% GEM 8:30am 145 ppm 12.50% 1ppm 0ppm GMI Deep 0.00% 10.70% 1.10% 88.10% GEM
180ppm 1.60% 2ppm 0ppm GMI
P13 0.10% 7.50% 0.60% 91.90% GEM 10.25a
280ppm 0.50% 3ppm 1ppm GMI
12
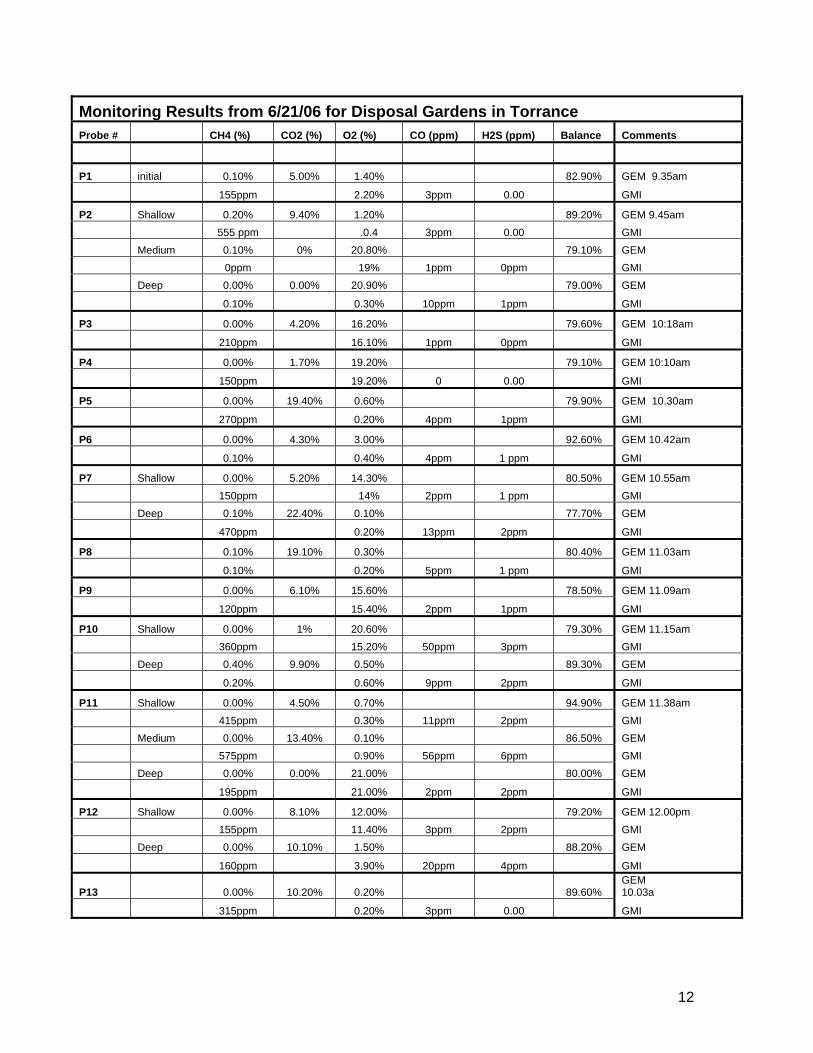
Monitoring Results from 6/21/06 for Disposal Gardens in Torrance
Probe # CH4 (%) CO2 (%) O2 (%) CO (ppm) H2S (ppm) Balance Comments
P1 initial 0.10% 5.00% 1.40% 82.90% GEM 9.35am
155ppm 2.20% 3ppm 0.00 GMI
P2 Shallow 0.20% 9.40% 1.20% 89.20% GEM 9.45am 555 ppm .0.4 3ppm 0.00 GMI Medium 0.10% 0% 20.80% 79.10% GEM 0ppm 19% 1ppm 0ppm GMI Deep 0.00% 0.00% 20.90% 79.00% GEM
0.10% 0.30% 10ppm 1ppm GMI
P3 0.00% 4.20% 16.20% 79.60% GEM 10:18am
210ppm 16.10% 1ppm 0ppm GMI
P4 0.00% 1.70% 19.20% 79.10% GEM 10:10am
150ppm 19.20% 0 0.00 GMI
P5 0.00% 19.40% 0.60% 79.90% GEM 10.30am
270ppm 0.20% 4ppm 1ppm GMI
P6 0.00% 4.30% 3.00% 92.60% GEM 10.42am
0.10% 0.40% 4ppm 1 ppm GMI
P7 Shallow 0.00% 5.20% 14.30% 80.50% GEM 10.55am 150ppm 14% 2ppm 1 ppm GMI Deep 0.10% 22.40% 0.10% 77.70% GEM
470ppm 0.20% 13ppm 2ppm GMI
P8 0.10% 19.10% 0.30% 80.40% GEM 11.03am
0.10% 0.20% 5ppm 1 ppm GMI
P9 0.00% 6.10% 15.60% 78.50% GEM 11.09am
120ppm 15.40% 2ppm 1ppm GMI
P10 Shallow 0.00% 1% 20.60% 79.30% GEM 11.15am 360ppm 15.20% 50ppm 3ppm GMI Deep 0.40% 9.90% 0.50% 89.30% GEM
0.20% 0.60% 9ppm 2ppm GMI
P11 Shallow 0.00% 4.50% 0.70% 94.90% GEM 11.38am 415ppm 0.30% 11ppm 2ppm GMI Medium 0.00% 13.40% 0.10% 86.50% GEM 575ppm 0.90% 56ppm 6ppm GMI Deep 0.00% 0.00% 21.00% 80.00% GEM
195ppm 21.00% 2ppm 2ppm GMI
P12 Shallow 0.00% 8.10% 12.00% 79.20% GEM 12.00pm 155ppm 11.40% 3ppm 2ppm GMI Deep 0.00% 10.10% 1.50% 88.20% GEM
160ppm 3.90% 20ppm 4ppm GMI
P13 0.00% 10.20% 0.20% 89.60% GEM 10.03a
315ppm 0.20% 3ppm 0.00 GMI
13
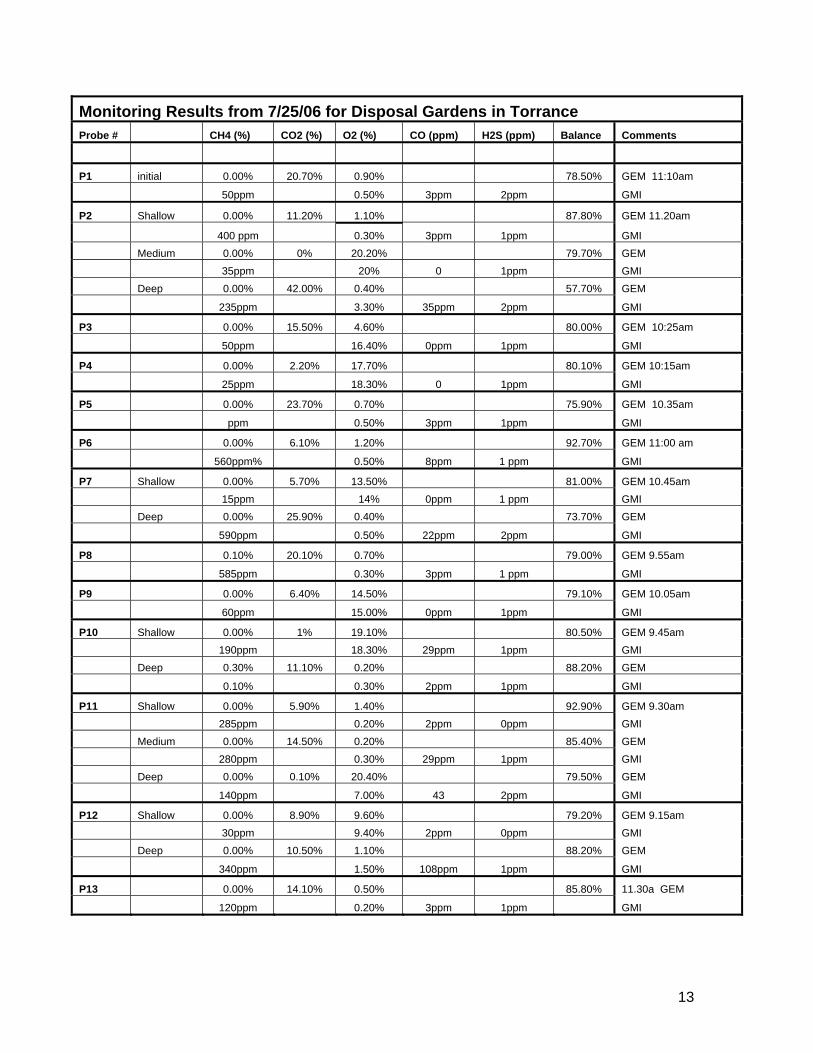
Monitoring Results from 7/25/06 for Disposal Gardens in Torrance
Probe # CH4 (%) CO2 (%) O2 (%) CO (ppm) H2S (ppm) Balance Comments
P1 initial 0.00% 20.70% 0.90% 78.50% GEM 11:10am
50ppm 0.50% 3ppm 2ppm GMI
P2 Shallow 0.00% 11.20% 1.10% 87.80% GEM 11.20am
400 ppm 0.30% 3ppm 1ppm GMI Medium 0.00% 0% 20.20% 79.70% GEM 35ppm 20% 0 1ppm GMI Deep 0.00% 42.00% 0.40% 57.70% GEM
235ppm 3.30% 35ppm 2ppm GMI
P3 0.00% 15.50% 4.60% 80.00% GEM 10:25am
50ppm 16.40% 0ppm 1ppm GMI
P4 0.00% 2.20% 17.70% 80.10% GEM 10:15am
25ppm 18.30% 0 1ppm GMI
P5 0.00% 23.70% 0.70% 75.90% GEM 10.35am
ppm 0.50% 3ppm 1ppm GMI
P6 0.00% 6.10% 1.20% 92.70% GEM 11:00 am
560ppm% 0.50% 8ppm 1 ppm GMI
P7 Shallow 0.00% 5.70% 13.50% 81.00% GEM 10.45am 15ppm 14% 0ppm 1 ppm GMI Deep 0.00% 25.90% 0.40% 73.70% GEM
590ppm 0.50% 22ppm 2ppm GMI
P8 0.10% 20.10% 0.70% 79.00% GEM 9.55am
585ppm 0.30% 3ppm 1 ppm GMI
P9 0.00% 6.40% 14.50% 79.10% GEM 10.05am
60ppm 15.00% 0ppm 1ppm GMI
P10 Shallow 0.00% 1% 19.10% 80.50% GEM 9.45am 190ppm 18.30% 29ppm 1ppm GMI Deep 0.30% 11.10% 0.20% 88.20% GEM
0.10% 0.30% 2ppm 1ppm GMI
P11 Shallow 0.00% 5.90% 1.40% 92.90% GEM 9.30am 285ppm 0.20% 2ppm 0ppm GMI Medium 0.00% 14.50% 0.20% 85.40% GEM 280ppm 0.30% 29ppm 1ppm GMI Deep 0.00% 0.10% 20.40% 79.50% GEM
140ppm 7.00% 43 2ppm GMI
P12 Shallow 0.00% 8.90% 9.60% 79.20% GEM 9.15am 30ppm 9.40% 2ppm 0ppm GMI Deep 0.00% 10.50% 1.10% 88.20% GEM
340ppm 1.50% 108ppm 1ppm GMI
P13 0.00% 14.10% 0.50% 85.80% 11.30a GEM
120ppm 0.20% 3ppm 1ppm GMI
14
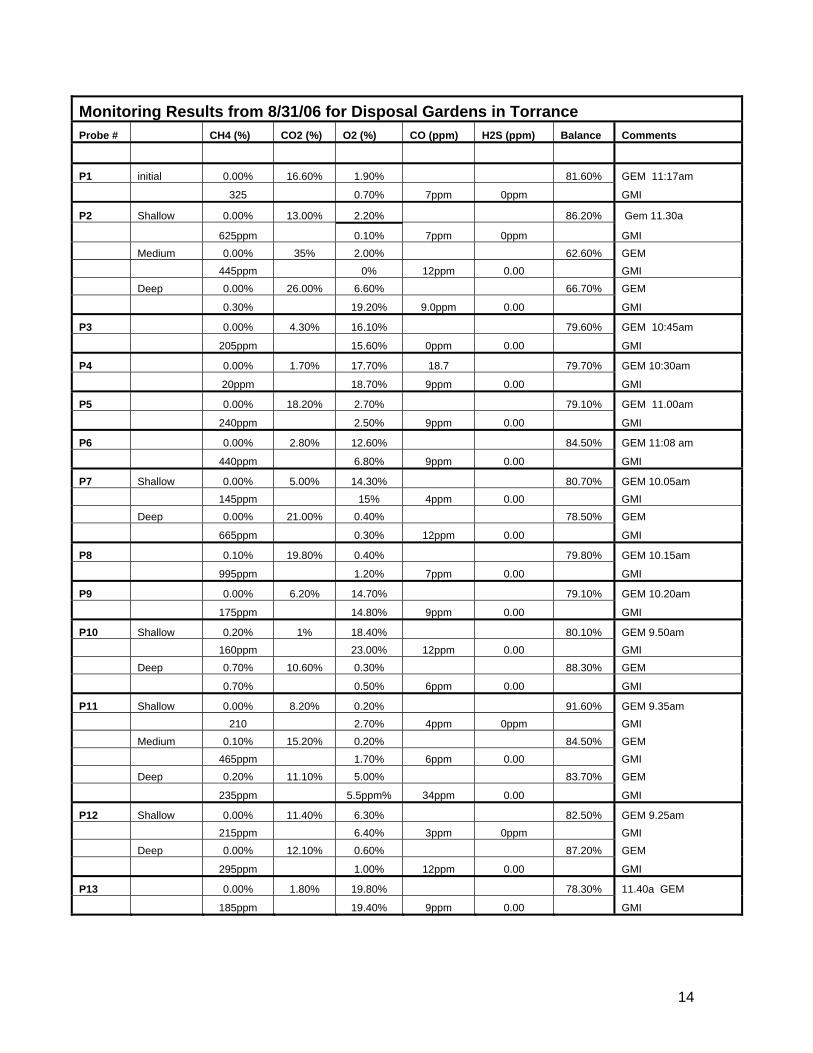
Monitoring Results from 8/31/06 for Disposal Gardens in Torrance
Probe # CH4 (%) CO2 (%) O2 (%) CO (ppm) H2S (ppm) Balance Comments
P1 initial 0.00% 16.60% 1.90% 81.60% GEM 11:17am
325 0.70% 7ppm 0ppm GMI
P2 Shallow 0.00% 13.00% 2.20% 86.20% Gem 11.30a
625ppm 0.10% 7ppm 0ppm GMI Medium 0.00% 35% 2.00% 62.60% GEM 445ppm 0% 12ppm 0.00 GMI Deep 0.00% 26.00% 6.60% 66.70% GEM
0.30% 19.20% 9.0ppm 0.00 GMI
P3 0.00% 4.30% 16.10% 79.60% GEM 10:45am
205ppm 15.60% 0ppm 0.00 GMI
P4 0.00% 1.70% 17.70% 18.7 79.70% GEM 10:30am
20ppm 18.70% 9ppm 0.00 GMI
P5 0.00% 18.20% 2.70% 79.10% GEM 11.00am
240ppm 2.50% 9ppm 0.00 GMI
P6 0.00% 2.80% 12.60% 84.50% GEM 11:08 am
440ppm 6.80% 9ppm 0.00 GMI
P7 Shallow 0.00% 5.00% 14.30% 80.70% GEM 10.05am 145ppm 15% 4ppm 0.00 GMI Deep 0.00% 21.00% 0.40% 78.50% GEM
665ppm 0.30% 12ppm 0.00 GMI
P8 0.10% 19.80% 0.40% 79.80% GEM 10.15am
995ppm 1.20% 7ppm 0.00 GMI
P9 0.00% 6.20% 14.70% 79.10% GEM 10.20am
175ppm 14.80% 9ppm 0.00 GMI
P10 Shallow 0.20% 1% 18.40% 80.10% GEM 9.50am 160ppm 23.00% 12ppm 0.00 GMI Deep 0.70% 10.60% 0.30% 88.30% GEM
0.70% 0.50% 6ppm 0.00 GMI
P11 Shallow 0.00% 8.20% 0.20% 91.60% GEM 9.35am 210 2.70% 4ppm 0ppm GMI Medium 0.10% 15.20% 0.20% 84.50% GEM 465ppm 1.70% 6ppm 0.00 GMI Deep 0.20% 11.10% 5.00% 83.70% GEM
235ppm 5.5ppm% 34ppm 0.00 GMI
P12 Shallow 0.00% 11.40% 6.30% 82.50% GEM 9.25am 215ppm 6.40% 3ppm 0ppm GMI Deep 0.00% 12.10% 0.60% 87.20% GEM
295ppm 1.00% 12ppm 0.00 GMI
P13 0.00% 1.80% 19.80% 78.30% 11.40a GEM
185ppm 19.40% 9ppm 0.00 GMI
15
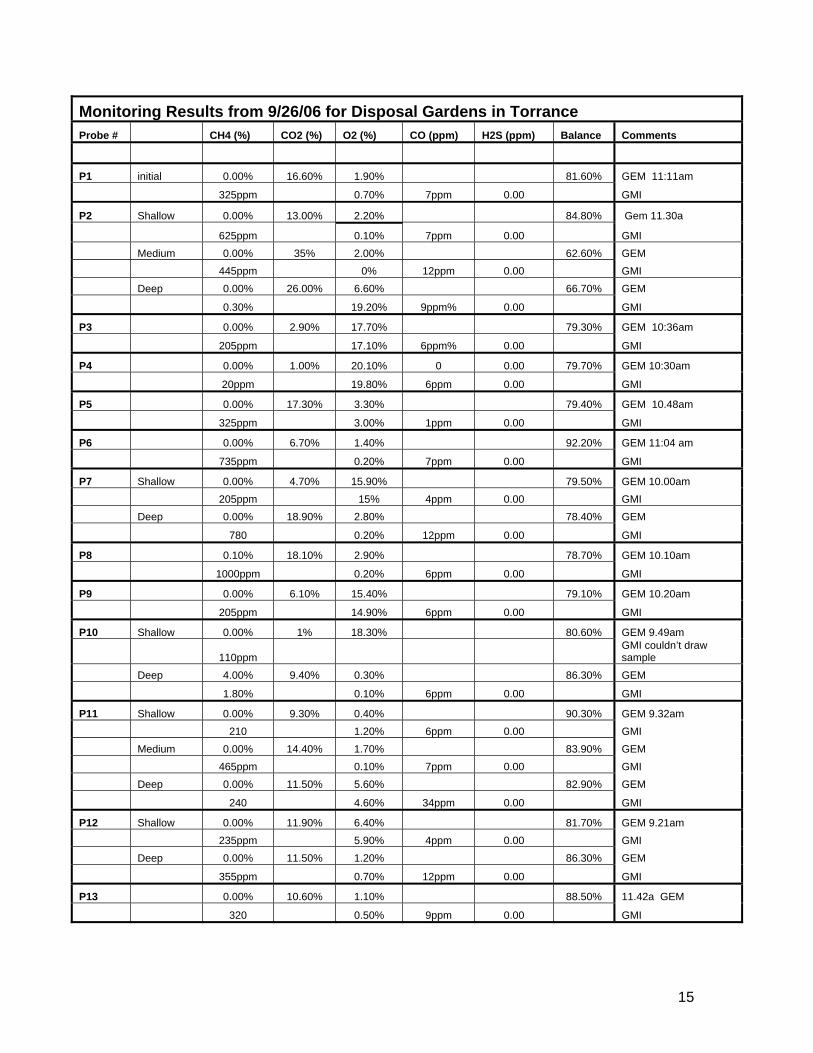
Monitoring Results from 9/26/06 for Disposal Gardens in Torrance
Probe # CH4 (%) CO2 (%) O2 (%) CO (ppm) H2S (ppm) Balance Comments
P1 initial 0.00% 16.60% 1.90% 81.60% GEM 11:11am
325ppm 0.70% 7ppm 0.00 GMI
P2 Shallow 0.00% 13.00% 2.20% 84.80% Gem 11.30a
625ppm 0.10% 7ppm 0.00 GMI Medium 0.00% 35% 2.00% 62.60% GEM 445ppm 0% 12ppm 0.00 GMI Deep 0.00% 26.00% 6.60% 66.70% GEM
0.30% 19.20% 9ppm% 0.00 GMI
P3 0.00% 2.90% 17.70% 79.30% GEM 10:36am
205ppm 17.10% 6ppm% 0.00 GMI
P4 0.00% 1.00% 20.10% 0 0.00 79.70% GEM 10:30am
20ppm 19.80% 6ppm 0.00 GMI
P5 0.00% 17.30% 3.30% 79.40% GEM 10.48am
325ppm 3.00% 1ppm 0.00 GMI
P6 0.00% 6.70% 1.40% 92.20% GEM 11:04 am
735ppm 0.20% 7ppm 0.00 GMI
P7 Shallow 0.00% 4.70% 15.90% 79.50% GEM 10.00am 205ppm 15% 4ppm 0.00 GMI Deep 0.00% 18.90% 2.80% 78.40% GEM
780 0.20% 12ppm 0.00 GMI
P8 0.10% 18.10% 2.90% 78.70% GEM 10.10am
1000ppm 0.20% 6ppm 0.00 GMI
P9 0.00% 6.10% 15.40% 79.10% GEM 10.20am
205ppm 14.90% 6ppm 0.00 GMI
P10 Shallow 0.00% 1% 18.30% 80.60% GEM 9.49am
110ppm GMI couldn’t draw sample
Deep 4.00% 9.40% 0.30% 86.30% GEM
1.80% 0.10% 6ppm 0.00 GMI
P11 Shallow 0.00% 9.30% 0.40% 90.30% GEM 9.32am 210 1.20% 6ppm 0.00 GMI Medium 0.00% 14.40% 1.70% 83.90% GEM 465ppm 0.10% 7ppm 0.00 GMI Deep 0.00% 11.50% 5.60% 82.90% GEM
240 4.60% 34ppm 0.00 GMI
P12 Shallow 0.00% 11.90% 6.40% 81.70% GEM 9.21am 235ppm 5.90% 4ppm 0.00 GMI Deep 0.00% 11.50% 1.20% 86.30% GEM
355ppm 0.70% 12ppm 0.00 GMI
P13 0.00% 10.60% 1.10% 88.50% 11.42a GEM
320 0.50% 9ppm 0.00 GMI
16
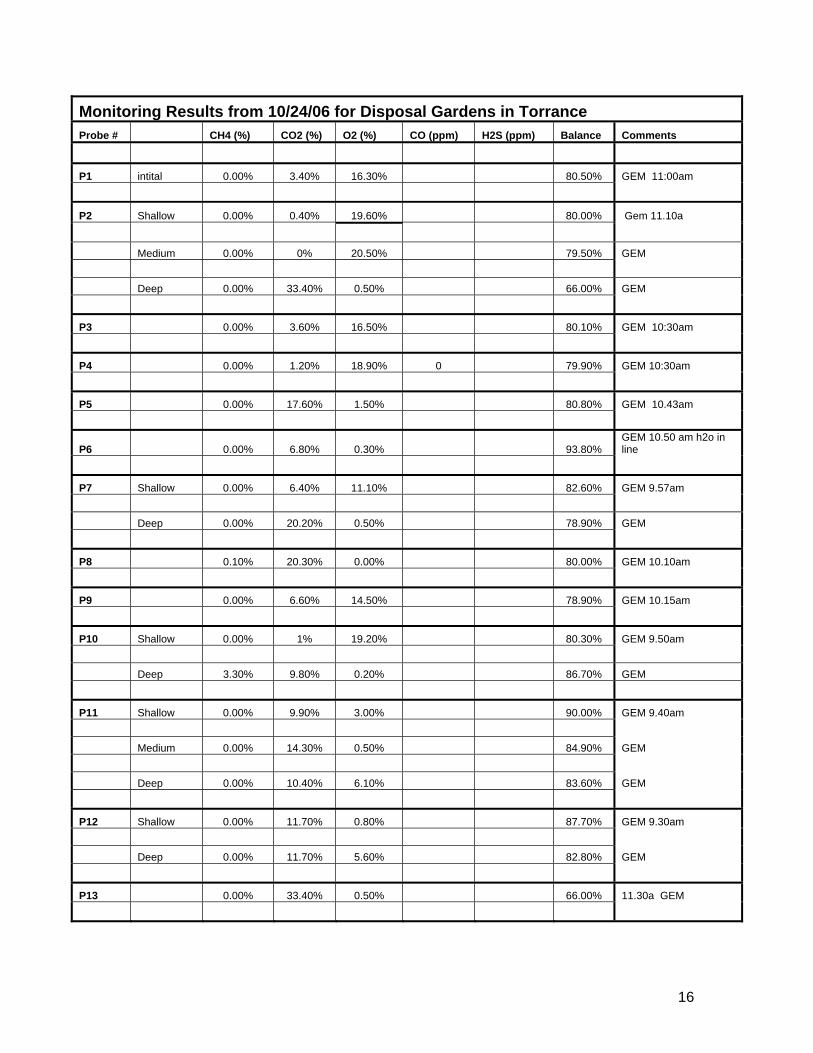
Monitoring Results from 10/24/06 for Disposal Gardens in Torrance
Probe # CH4 (%) CO2 (%) O2 (%) CO (ppm) H2S (ppm) Balance Comments
P1 intital 0.00% 3.40% 16.30% 80.50% GEM 11:00am
P2 Shallow 0.00% 0.40% 19.60% 80.00% Gem 11.10a
Medium 0.00% 0% 20.50% 79.50% GEM Deep 0.00% 33.40% 0.50% 66.00% GEM
P3 0.00% 3.60% 16.50% 80.10% GEM 10:30am
P4 0.00% 1.20% 18.90% 0 79.90% GEM 10:30am
P5 0.00% 17.60% 1.50% 80.80% GEM 10.43am
P6 0.00% 6.80% 0.30% 93.80% GEM 10.50 am h2o in line
P7 Shallow 0.00% 6.40% 11.10% 82.60% GEM 9.57am Deep 0.00% 20.20% 0.50% 78.90% GEM
P8 0.10% 20.30% 0.00% 80.00% GEM 10.10am
P9 0.00% 6.60% 14.50% 78.90% GEM 10.15am
P10 Shallow 0.00% 1% 19.20% 80.30% GEM 9.50am Deep 3.30% 9.80% 0.20% 86.70% GEM
P11 Shallow 0.00% 9.90% 3.00% 90.00% GEM 9.40am Medium 0.00% 14.30% 0.50% 84.90% GEM Deep 0.00% 10.40% 6.10% 83.60% GEM
P12 Shallow 0.00% 11.70% 0.80% 87.70% GEM 9.30am Deep 0.00% 11.70% 5.60% 82.80% GEM
P13 0.00% 33.40% 0.50% 66.00% 11.30a GEM
17
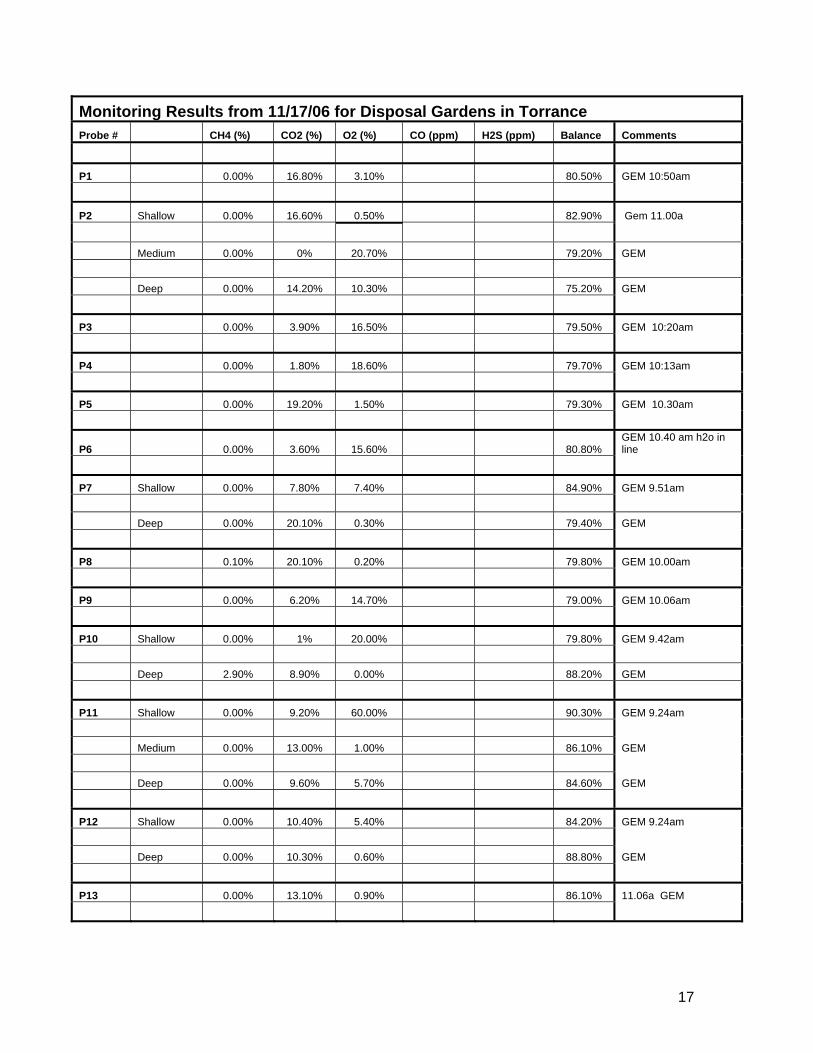
Monitoring Results from 11/17/06 for Disposal Gardens in Torrance
Probe # CH4 (%) CO2 (%) O2 (%) CO (ppm) H2S (ppm) Balance Comments
P1 0.00% 16.80% 3.10% 80.50% GEM 10:50am
P2 Shallow 0.00% 16.60% 0.50% 82.90% Gem 11.00a
Medium 0.00% 0% 20.70% 79.20% GEM Deep 0.00% 14.20% 10.30% 75.20% GEM
P3 0.00% 3.90% 16.50% 79.50% GEM 10:20am
P4 0.00% 1.80% 18.60% 79.70% GEM 10:13am
P5 0.00% 19.20% 1.50% 79.30% GEM 10.30am
P6 0.00% 3.60% 15.60% 80.80% GEM 10.40 am h2o in line
P7 Shallow 0.00% 7.80% 7.40% 84.90% GEM 9.51am Deep 0.00% 20.10% 0.30% 79.40% GEM
P8 0.10% 20.10% 0.20% 79.80% GEM 10.00am
P9 0.00% 6.20% 14.70% 79.00% GEM 10.06am
P10 Shallow 0.00% 1% 20.00% 79.80% GEM 9.42am Deep 2.90% 8.90% 0.00% 88.20% GEM
P11 Shallow 0.00% 9.20% 60.00% 90.30% GEM 9.24am Medium 0.00% 13.00% 1.00% 86.10% GEM Deep 0.00% 9.60% 5.70% 84.60% GEM
P12 Shallow 0.00% 10.40% 5.40% 84.20% GEM 9.24am Deep 0.00% 10.30% 0.60% 88.80% GEM
P13 0.00% 13.10% 0.90% 86.10% 11.06a GEM
18
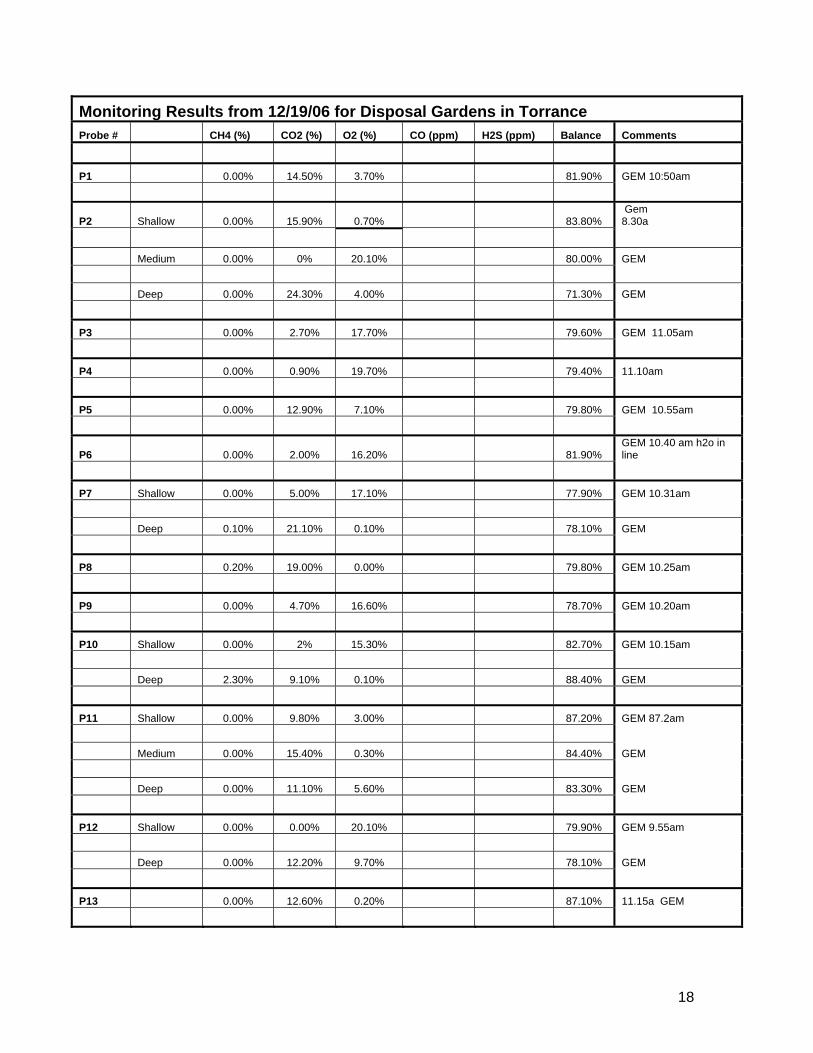
Monitoring Results from 12/19/06 for Disposal Gardens in Torrance
Probe # CH4 (%) CO2 (%) O2 (%) CO (ppm) H2S (ppm) Balance Comments
P1 0.00% 14.50% 3.70% 81.90% GEM 10:50am
P2 Shallow 0.00% 15.90% 0.70% 83.80% Gem 8.30a
Medium 0.00% 0% 20.10% 80.00% GEM Deep 0.00% 24.30% 4.00% 71.30% GEM
P3 0.00% 2.70% 17.70% 79.60% GEM 11.05am
P4 0.00% 0.90% 19.70% 79.40% 11.10am
P5 0.00% 12.90% 7.10% 79.80% GEM 10.55am
P6 0.00% 2.00% 16.20% 81.90% GEM 10.40 am h2o in line
P7 Shallow 0.00% 5.00% 17.10% 77.90% GEM 10.31am Deep 0.10% 21.10% 0.10% 78.10% GEM
P8 0.20% 19.00% 0.00% 79.80% GEM 10.25am
P9 0.00% 4.70% 16.60% 78.70% GEM 10.20am
P10 Shallow 0.00% 2% 15.30% 82.70% GEM 10.15am Deep 2.30% 9.10% 0.10% 88.40% GEM
P11 Shallow 0.00% 9.80% 3.00% 87.20% GEM 87.2am Medium 0.00% 15.40% 0.30% 84.40% GEM Deep 0.00% 11.10% 5.60% 83.30% GEM
P12 Shallow 0.00% 0.00% 20.10% 79.90% GEM 9.55am Deep 0.00% 12.20% 9.70% 78.10% GEM
P13 0.00% 12.60% 0.20% 87.10% 11.15a GEM
19
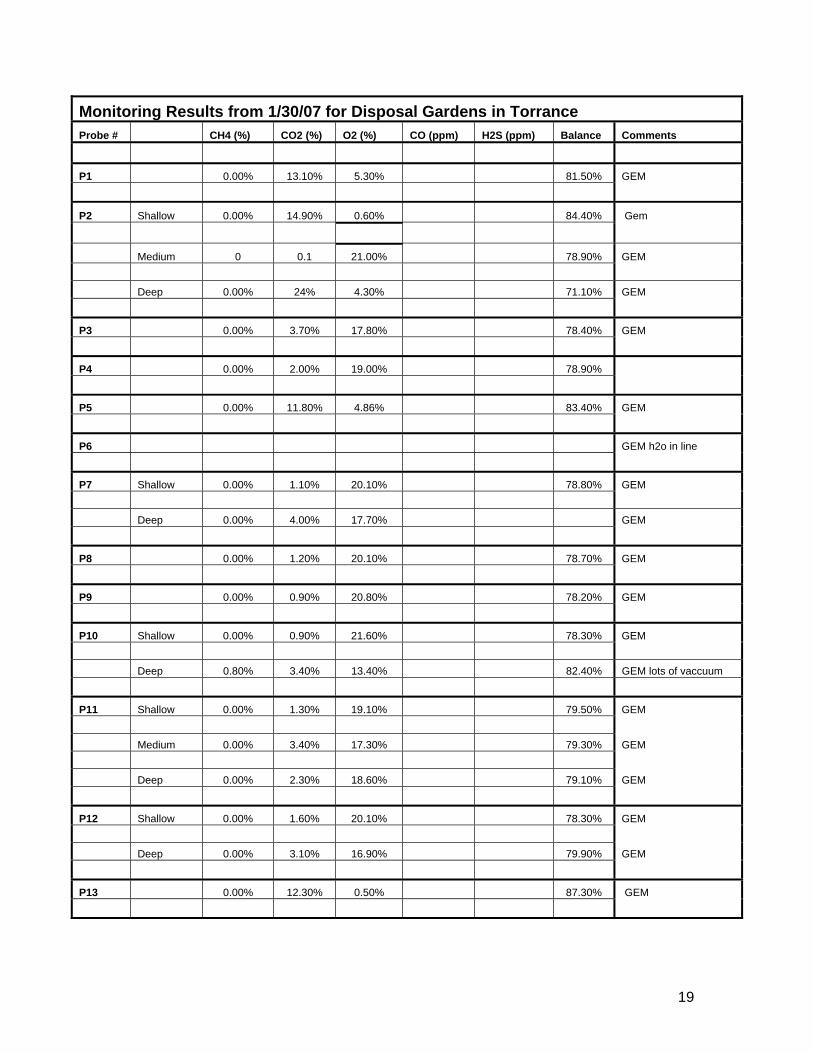
Monitoring Results from 1/30/07 for Disposal Gardens in Torrance
Probe # CH4 (%) CO2 (%) O2 (%) CO (ppm) H2S (ppm) Balance Comments
P1 0.00% 13.10% 5.30% 81.50% GEM
P2 Shallow 0.00% 14.90% 0.60% 84.40% Gem
Medium 0 0.1 21.00% 78.90% GEM Deep 0.00% 24% 4.30% 71.10% GEM
P3 0.00% 3.70% 17.80% 78.40% GEM
P4 0.00% 2.00% 19.00% 78.90%
P5 0.00% 11.80% 4.86% 83.40% GEM
P6 GEM h2o in line
P7 Shallow 0.00% 1.10% 20.10% 78.80% GEM Deep 0.00% 4.00% 17.70% GEM
P8 0.00% 1.20% 20.10% 78.70% GEM
P9 0.00% 0.90% 20.80% 78.20% GEM
P10 Shallow 0.00% 0.90% 21.60% 78.30% GEM Deep 0.80% 3.40% 13.40% 82.40% GEM lots of vaccuum
P11 Shallow 0.00% 1.30% 19.10% 79.50% GEM Medium 0.00% 3.40% 17.30% 79.30% GEM Deep 0.00% 2.30% 18.60% 79.10% GEM
P12 Shallow 0.00% 1.60% 20.10% 78.30% GEM Deep 0.00% 3.10% 16.90% 79.90% GEM
P13 0.00% 12.30% 0.50% 87.30% GEM
20
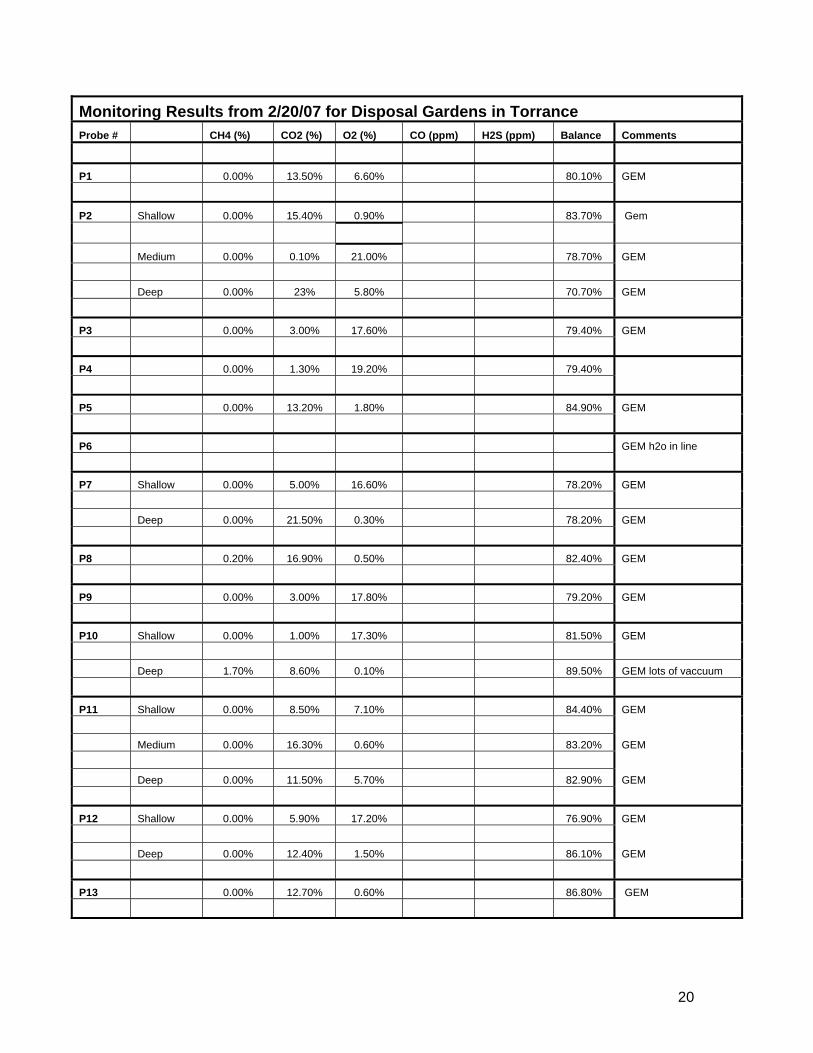
Monitoring Results from 2/20/07 for Disposal Gardens in Torrance
Probe # CH4 (%) CO2 (%) O2 (%) CO (ppm) H2S (ppm) Balance Comments
P1 0.00% 13.50% 6.60% 80.10% GEM
P2 Shallow 0.00% 15.40% 0.90% 83.70% Gem
Medium 0.00% 0.10% 21.00% 78.70% GEM Deep 0.00% 23% 5.80% 70.70% GEM
P3 0.00% 3.00% 17.60% 79.40% GEM
P4 0.00% 1.30% 19.20% 79.40%
P5 0.00% 13.20% 1.80% 84.90% GEM
P6 GEM h2o in line
P7 Shallow 0.00% 5.00% 16.60% 78.20% GEM Deep 0.00% 21.50% 0.30% 78.20% GEM
P8 0.20% 16.90% 0.50% 82.40% GEM
P9 0.00% 3.00% 17.80% 79.20% GEM
P10 Shallow 0.00% 1.00% 17.30% 81.50% GEM Deep 1.70% 8.60% 0.10% 89.50% GEM lots of vaccuum
P11 Shallow 0.00% 8.50% 7.10% 84.40% GEM Medium 0.00% 16.30% 0.60% 83.20% GEM Deep 0.00% 11.50% 5.70% 82.90% GEM
P12 Shallow 0.00% 5.90% 17.20% 76.90% GEM Deep 0.00% 12.40% 1.50% 86.10% GEM
P13 0.00% 12.70% 0.60% 86.80% GEM

21
Monitoring Results from 3/20/07 for Disposal Gardens in Torrance
Probe # CH4 (%) CO2 (%) O2 (%) CO (ppm) H2S (ppm) Balance Comments
P1 0.00% 13.90% 6.80% 79.10% GEM
P2 Shallow 0.00% 13.50% 0.20% 86.20% Gem
Medium 0.00% 0.00% 21.00% 78.70% GEM Deep 0.00% 21.80% 6.50% 71.00% GEM
P3 0.00% 2.80% 18.40% 79.10% GEM
P4 0.00% 1.50% 19.20% 79.30%
P5 0.00% 15.50% 0.30% 84.00% GEM
P6 GEM h2o in line
P7 Shallow 0.00% 6.40% 12.80% 80.00% GEM Deep 0.00% 21.20% 0.40% 78.30% GEM
P8 0.20% 16.40% 0.00% 83.40% GEM
P9 0.00% 3.20% 18.30% 78.40% GEM
P10 Shallow 0.00% 1.60% 15.40% 82.90% GEM Deep 1.90% 9.40% 0.00% 88.60% GEM lots of vaccuum
P11 Shallow 0.00% 8.90% 4.50% 86.50% GEM Medium 0.00% 16.50% 0.00% 83.40% GEM Deep 0.00% 12.00% 5.70% 82.50% GEM
P12 Shallow 0.00% 7.60% 12.40% 80.00% GEM Deep 0.00% 12.70% 0.80% 86.40% GEM
P13 0.00% 13.00% 0.10% 86.80% GEM
22
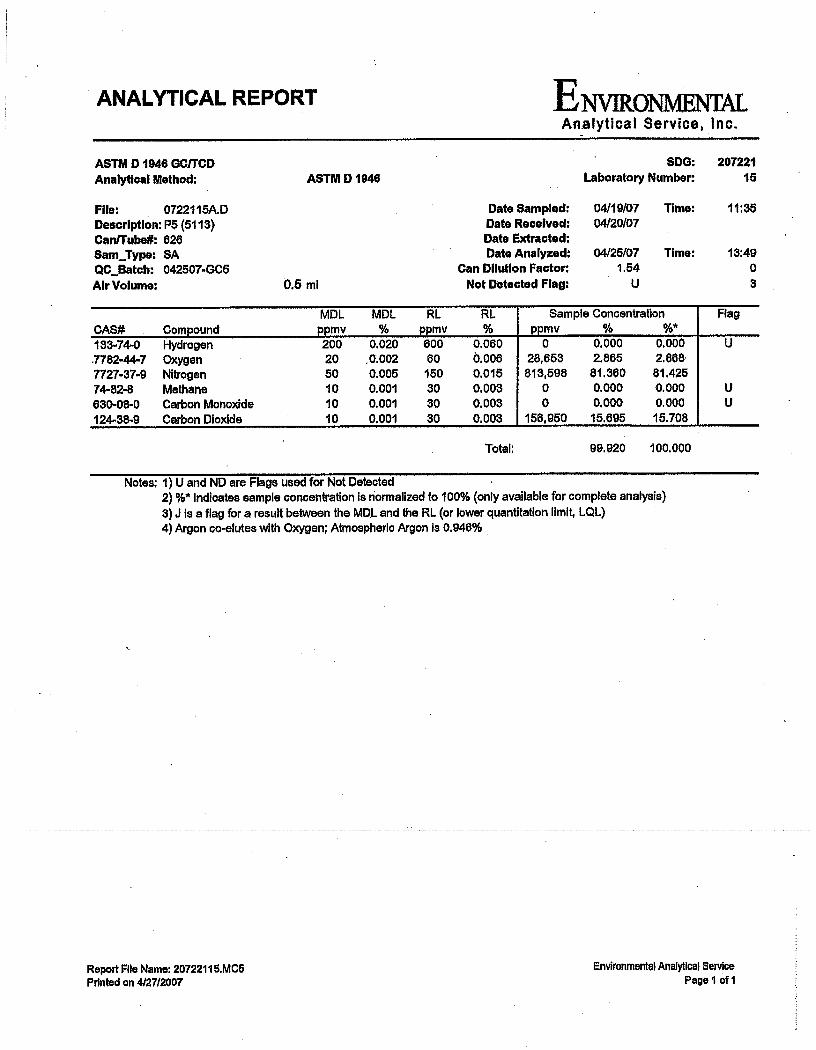
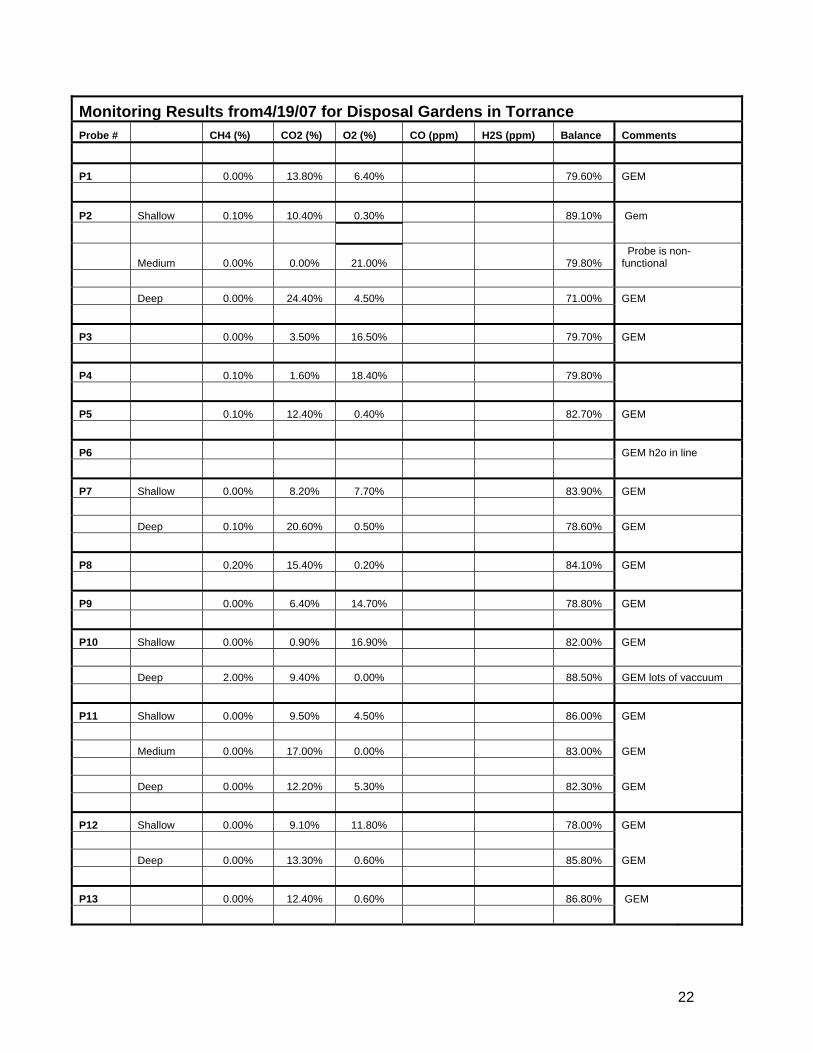
Monitoring Results from4/19/07 for Disposal Gardens in Torrance
Probe # CH4 (%) CO2 (%) O2 (%) CO (ppm) H2S (ppm) Balance Comments
P1 0.00% 13.80% 6.40% 79.60% GEM
P2 Shallow 0.10% 10.40% 0.30% 89.10% Gem
Medium 0.00% 0.00% 21.00% 79.80% Probe is non-functional
Deep 0.00% 24.40% 4.50% 71.00% GEM
P3 0.00% 3.50% 16.50% 79.70% GEM
P4 0.10% 1.60% 18.40% 79.80%
P5 0.10% 12.40% 0.40% 82.70% GEM
P6 GEM h2o in line
P7 Shallow 0.00% 8.20% 7.70% 83.90% GEM Deep 0.10% 20.60% 0.50% 78.60% GEM
P8 0.20% 15.40% 0.20% 84.10% GEM
P9 0.00% 6.40% 14.70% 78.80% GEM
P10 Shallow 0.00% 0.90% 16.90% 82.00% GEM Deep 2.00% 9.40% 0.00% 88.50% GEM lots of vaccuum
P11 Shallow 0.00% 9.50% 4.50% 86.00% GEM Medium 0.00% 17.00% 0.00% 83.00% GEM Deep 0.00% 12.20% 5.30% 82.30% GEM
P12 Shallow 0.00% 9.10% 11.80% 78.00% GEM Deep 0.00% 13.30% 0.60% 85.80% GEM
P13 0.00% 12.40% 0.60% 86.80% GEM
23
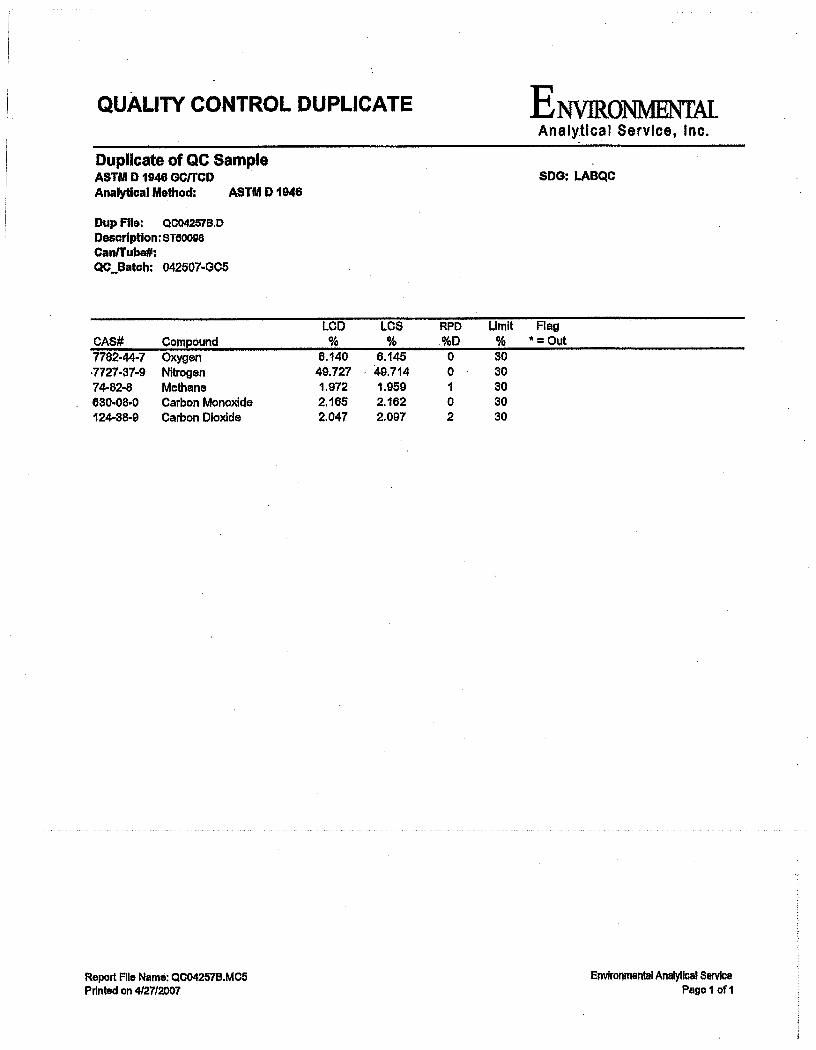
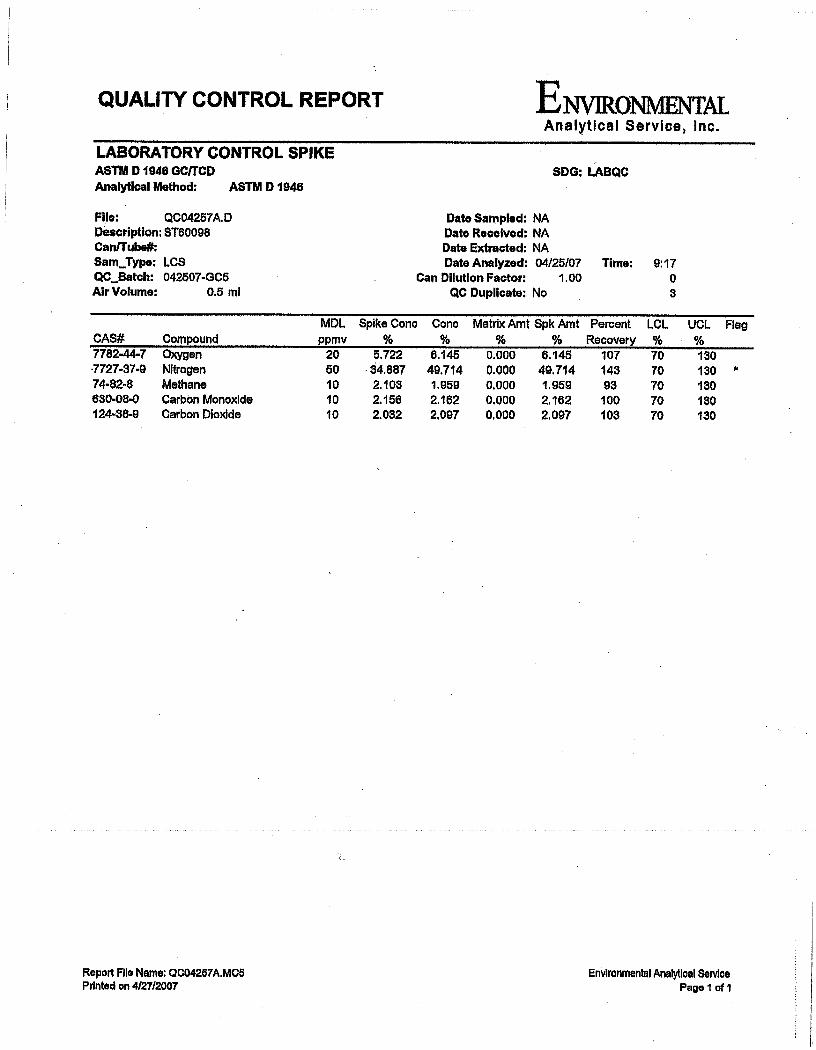
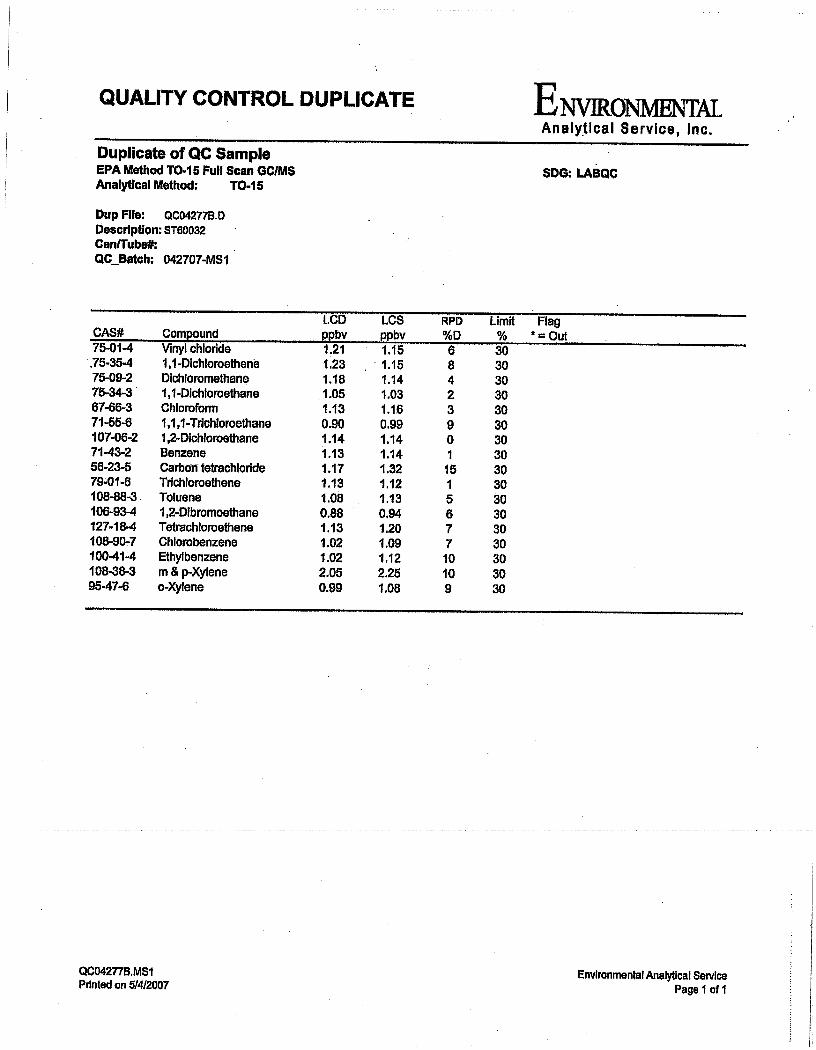
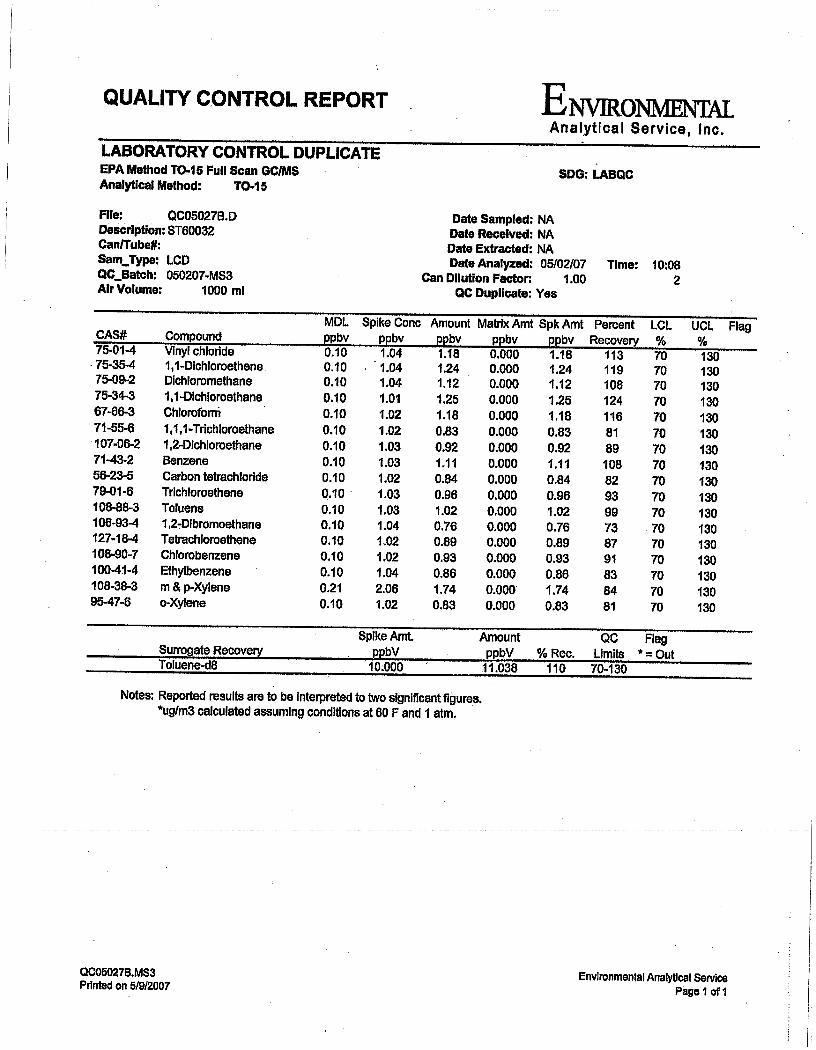
Appendix B Laboratory Results