Embed Size (px)
Citation preview
DISSECTION OF DEFENSE RESPONSES OF skl, AN ETHYLENE
INSENSITIVE MUTANT OF MEDICAGO TRUNCATULA
A Dissertation
by
PEDRO URIBE MEJIA
Submitted to the Office of Graduate Studies of Texas A&M University
in partial fulfillment of the requirements for the degree of
DOCTOR OF PHILOSOPHY
August 2004
Major Subject: Plant Pathology
DISSECTION OF DEFENSE RESPONSES OF skl, AN ETHYLENE
INSENSITIVE MUTANT OF MEDICAGO TRUNCATULA
A Dissertation
by
PEDRO URIBE MEJIA
Submitted to Texas A&M University in partial fulfillment of the requirements
for the degree of
DOCTOR OF PHILOSOPHY
Approved as to style and content by: _________________________ _________________________ Charles M. Kenerley Douglas R. Cook (Co-Chair of Committee) (Co-Chair of Committee) _________________________ _________________________ James L. Starr Thomas D. McKnight (Member) (Member) _________________________ Dennis C. Gross (Head of Department)
August 2004
Major Subject: Plant Pathology
iii
ABSTRACT
Dissection of Defense Responses of skl, an Ethylene Insensitive Mutant of Medicago
truncatula.
(August 2004)
Pedro Uribe, B.S., Universidad de los Andes
Co-Chairs of Advisory Committee: Dr. Douglas R. Cook Dr. Charles M. Kenerley
The interactions between Medicago truncatula and Phytophthora medicaginis
were examined using skl, a mutant blocked in ethylene perception, and a range of wild
accessions of this plant species. P. medicaginis infection of M. truncatula plants resulted
in compatible responses, whereas the mutant genotype was found to be hyper-susceptible
to the pathogen. Phytophthora reproduction and colonization rates of Medicago tissues
supported this conclusion. Infection of skl with different pathogens reinforced this
observation. Ethylene production in infected A17 and skl roots showed reduced ethylene
evolution in the mutant and suggested that a positive feedback loop, known as
autocatalytic ethylene production, amplified the ethylene signal.
To complement the study, expression analyses of defense response genes in this
interaction were studied by real time RTPCR of Phytophthora-infected and mock-
infected roots. The genes analyzed were PAL, CHS, IFR, ACC oxidase, GST, and PR10.
The sequences needed for the analysis were found through the scrutiny of the M.
truncatula EST database employing phylogenetics and bio-informatics tools. In A17 all

iv
the genes studied were up-regulated, although the specific gene expression patterns
differed. The comparison of gene expression between A17 and skl genotypes allowed
the differentiation between ethylene-dependent and ethylene-independent responses.
Discrete results showed that ACC oxidase homologues were downregulated in the
ethylene perception mutant, corroborating the ethylene observations. However, the
expression of genes involved in the phenylpropanoid metabolism was increased in skl
relative to A17, suggestive of an antagonism between the ethylene perception pathway
and the regulation of the phenylpropanoid pathway. This result implied that Medicago
phytoalexins accumulate in the disease interaction, but raised questions about their role
in resistance to Phytophthora infection.
This study establishes a link between mechanisms that regulate symbiotic
infection and the regulation of disease resistance to Oomycete pathogens, especially P.
medicaginis. The results served to identify a series of Phytophthora-induced genes,
which remain pathogen-responsive even in the absence of a functional ethylene
perception pathway. While it is possible that the products of these genes are involved in
resistance to P. medicaginis, the present results demonstrate that ethylene perception is
required for resistance.

v
DEDICATION
I dedicate this dissertation to my family whose patience, help and love
surrounded me constantly during all these years of research. I specially want to
acknowledge the help and support that my wife Leigh Anne gave me, and the constant
words of encouragement that I received from my family far away.

vi
ACKNOWLEDGEMENTS
I want to express my sincere gratitude to COLFUTURO, Corporación
Colombiana para el Futuro de Colombia, whose scholarship provided me with the initial
resources to start this endeavor. Without it, most likely I would not have had the
opportunity of learning about plant science in such a respected and traditional place as
Texas A&M.
I would like to thank Doug Cook for his support and teaching all these years.
Destiny moved him away from Texas A&M for him to reach new goals. The same
destiny gave me the opportunity to complement my studies and to test myself in a
different environment and to supplement my opinions with the views and feelings from a
different place. I would like also to acknowledge the past and present members of the
Cook laboratory for their friendship, support, and help.
I would like to thank the members of my committee, Dr. Charles Kenerley, Dr.
Thomas McKnight and Dr. James Starr, for their knowledge, help and advice.
vii
TABLE OF CONTENTS
Page
ABSTRACT.................................................................................................................... iii
DEDICATION..................................................................................................................v
ACKNOWLEDGEMENTS............................................................................................ vi
TABLE OF CONTENTS............................................................................................... vii
LIST OF FIGURES ........................................................................................................ xi
LIST OF TABLES........................................................................................................ xiv
CHAPTER
I INTRODUCTION..................................................................................................1
LEGUMES IN HUMAN SURVIVAL AND HOSTS FOR SEVERAL PLANT-MICROBE INTERACTIONS ...........................................................2
History and Importance...........................................................................2 Pathogens and Diseases of Legume Crops..............................................5 Model Legumes.......................................................................................7
PHYTOPHTHORA AS A PLANT PATHOGEN.............................................9 The Phylum Oomycota as Important Plant Pathogens............................9 The Genus Phytophthora and Its Importance in Agriculture ................10
MOLECULAR BASIS OF VIRULENCE AND PLANT DISEASE RESISTANCE................................................................................................11 METHODS FOR GENE EXPRESSION.......................................................22
viii
CHAPTER Page
II RESISTANCE AND SUSCEPTIBILITY OF MEDICAGO TRUNCATULA NATURAL POPULATIONS TO PHYTOPHTHORA MEDICAGINIS ..............29
SUMMARY ...................................................................................................29 INTRODUCTION..........................................................................................30
M. truncatula Pathogen Systems...........................................................32 Phytophthora crown and root rot .................................................32 Pythium damping off ....................................................................34 Anthracnose..................................................................................34
MATERIALS AND METHODS ...................................................................36 Plant Material ........................................................................................36 Plant Growth Conditions .......................................................................36
Seed germination..........................................................................36 Growing conditions ......................................................................37
Pathogen Growth Conditions ................................................................38 Alfalfa crown and root rot, caused by Phytophthora medicaginis...................................................................................38 Pythium ultimum and P. irregularum...........................................39 Stem and leaf blight, caused by C. trifolii....................................40
Resistance and Susceptibility of M. truncatula Natural Populations to Infection by P. medicaginis...............................................................41 Geographical Location of M. truncatula’s Sources of Resistance and Susceptibility to P. medicaginis ............................................................41 Resistance of P. medicaginis Resistant and Susceptible Ecotypes against Pythium sp.................................................................................42
RESULTS.......................................................................................................43 Resistance and Susceptibility of M. truncatula Natural Populations to Infection by P. medicaginis...............................................................43 Geographical Location of M. truncatula’s Sources of Resistance and Susceptibility to P. medicaginis ............................................................49 Resistance of P. medicaginis Resistant and Susceptible Ecotypes against Pythium sp.................................................................................51
DISCUSSION ................................................................................................52
III AN ETHYLENE INSENSITIVE MUTANT OF MEDICAGO TRUNCATULA IS HYPER-SUSCEPTIBLE TO PHYTOPHTHORA MEDICAGINIS ................59
ix
CHAPTER Page
SUMMARY ...................................................................................................59 INTRODUCTION..........................................................................................60 MATERIALS AND METHODS ...................................................................62
Plant and Pathogen Growth Conditions ................................................62 M. truncatula Infection by P. medicaginis, Soil Experiments ..............62 M. truncatula Infection by P. medicaginis, Aeroponic Tank Experiments...........................................................................................63
Microscopical analysis .................................................................64 Ethylene quantification ................................................................65
M. truncatula Infection by Pythium sp..................................................66 M. truncatula Infection by C. trifolii.....................................................66
RESULTS.......................................................................................................66 M. truncatula Near-Isogenic Line skl Is Hyper-Infected by P. medicaginis............................................................................................66 Ethylene Quantification of M. truncatula Plants Infected with P. medicaginis............................................................................................70 Infection of M. truncatula skl with Pythium sp.....................................72 M. truncatula skl Mutation Is Not Altered in Resistance to C. trifolii..75
DISCUSSION ................................................................................................76
IV TRANSCRIPTION PROFILING OF GENE HOMOLOGUES IN MEDICAGO TRUNCATULA ...............................................................................83
SUMMARY ...................................................................................................83 INTRODUCTION..........................................................................................84
Pathways for Defense Responses in Plants ...........................................89 Real Time PCR Analysis of Gene Expression ......................................92
MATERIALS AND METHODS ...................................................................93 P. medicaginis Infection of M. truncatula ............................................93 In silica Analysis of Candidate Gene Families .....................................94
Blast search of candidate genes....................................................94 In silica inference of gene expression ..........................................96 Homologue sequence, alignment and analysis.............................96
RNA Isolation and Reverse Transcription ............................................96 Real Time Reverse Transcription PCR .................................................97
Primer and probe design...............................................................98 Reaction conditions ......................................................................99 Methods for data analysis...........................................................103
x
CHAPTER Page RESULTS.....................................................................................................105
In silica Analysis of Candidate Gene Families ...................................105 Ethylene biosynthesis pathway homologues..............................105 Plant defense signal transduction homologues...........................106 Stress and detoxifying pathways ................................................108 Phenylpropanoid metabolism homologues ................................111
PAL homologues...............................................................111 Chalcone Synthase homologues........................................115 Isoflavone Reductase homologues ....................................116
Real Time PCR Analysis of M. truncatula Homologues....................121 Choice of internal controls for analysis......................................121 Expression profiling of skl an ethylene insensitive mutant of M. truncatula..........................................................................125
Expression profiling of ACO homologues. .......................125 Expression profiling of PR10 homologues. ......................127 Transcriptional analysis of gene members in the phenylpropanoid metabolism. ...........................................129 Transcription profiling of GST homologues. ....................132
DISCUSSION ..............................................................................................135 In silica Analysis of Gene Homologues..............................................135 Transcription Profiling of Gene Homologues.....................................139
Real time PCR............................................................................139 Gene expression profiling ..........................................................144
V SUMMARY .......................................................................................................152
LITERATURE CITED ..................................................................................................155
APPENDIX ....................................................................................................................174
VITA ..............................................................................................................................176
xi
LIST OF FIGURES
FIGURE Page
1 Ethylene signal transduction pathway................................................................ 16 2 Proposed plant defense responses to pathogens and insects .............................. 21 3 M. truncatula ecotypes infected by P. medicaginis. .......................................... 42 4 Disease susceptibility of M. truncatula ecotypes to infection by
P.medicaginis ..................................................................................................... 44 5 Disease resistance and susceptibility of selected ecotypes to infection by
P. medicaginis .................................................................................................... 47 6 Geographical location and associated resistance or susceptibility of
Medicago truncatula ecotypes exposed to infection by P. medicaginis. ........... 51 7 Disease incidence in M. truncatula ecotypes upon infection with P.
ultimum and P. irregularum. .............................................................................. 52 8 Compatible and incompatible responses of M. truncatula ecotypes to
infection by C. trifolii......................................................................................... 57 9 Disease susceptibility of M. truncatula A17 and near isogen sickle to
infection by P. medicaginis ................................................................................ 67 10 Total development of P. medicaginis in M. truncatula roots............................. 69 11 Mortality rate of Phytophthora infected and mock-infected M. truncatula
plants .................................................................................................................. 69 12 Ethylene evolution in Phytophthora-infected M. truncatula roots. ................... 70 13 Medicago truncatula roots infected with P. medicaginis. ................................. 71 14 Effect of Phytophthora infection on the development of M. truncatula
seedlings ............................................................................................................. 72 15 Disease incidence in M. truncatula upon infection with P. ultimum ................. 73 16 Disease incidence in M. truncatula upon infection with P. irregularum........... 75
xii
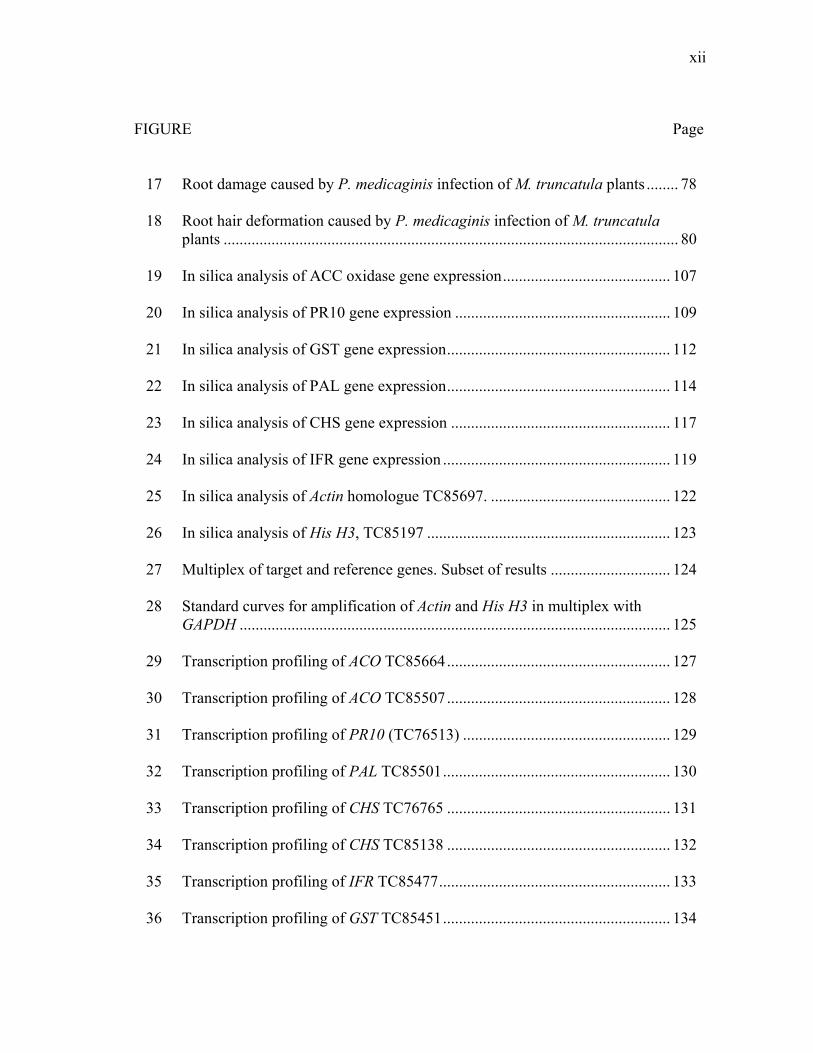
FIGURE Page 17 Root damage caused by P. medicaginis infection of M. truncatula plants ........ 78 18 Root hair deformation caused by P. medicaginis infection of M. truncatula
plants .................................................................................................................. 80 19 In silica analysis of ACC oxidase gene expression.......................................... 107 20 In silica analysis of PR10 gene expression ...................................................... 109 21 In silica analysis of GST gene expression........................................................ 112 22 In silica analysis of PAL gene expression........................................................ 114 23 In silica analysis of CHS gene expression ....................................................... 117 24 In silica analysis of IFR gene expression ......................................................... 119 25 In silica analysis of Actin homologue TC85697. ............................................. 122 26 In silica analysis of His H3, TC85197 ............................................................. 123 27 Multiplex of target and reference genes. Subset of results .............................. 124 28 Standard curves for amplification of Actin and His H3 in multiplex with
GAPDH ............................................................................................................ 125 29 Transcription profiling of ACO TC85664........................................................ 127 30 Transcription profiling of ACO TC85507........................................................ 128 31 Transcription profiling of PR10 (TC76513) .................................................... 129 32 Transcription profiling of PAL TC85501......................................................... 130 33 Transcription profiling of CHS TC76765 ........................................................ 131 34 Transcription profiling of CHS TC85138 ........................................................ 132 35 Transcription profiling of IFR TC85477.......................................................... 133 36 Transcription profiling of GST TC85451......................................................... 134

xiii
FIGURE Page 37 Transcription profiling of GST TC78052......................................................... 134
xiv
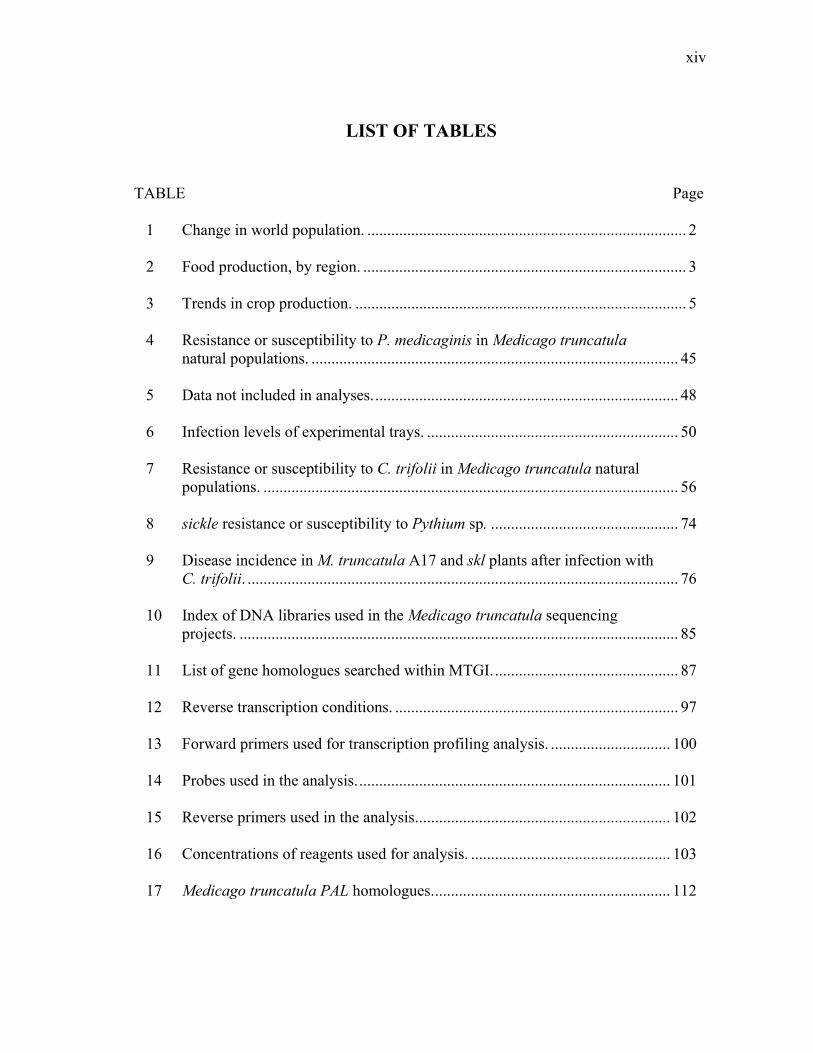
LIST OF TABLES
TABLE Page
1 Change in world population. ................................................................................ 2
2 Food production, by region. ................................................................................. 3 3 Trends in crop production. ................................................................................... 5 4 Resistance or susceptibility to P. medicaginis in Medicago truncatula
natural populations. ............................................................................................ 45 5 Data not included in analyses............................................................................. 48 6 Infection levels of experimental trays. ............................................................... 50 7 Resistance or susceptibility to C. trifolii in Medicago truncatula natural
populations. ........................................................................................................ 56 8 sickle resistance or susceptibility to Pythium sp. ............................................... 74 9 Disease incidence in M. truncatula A17 and skl plants after infection with
C. trifolii. ............................................................................................................ 76 10 Index of DNA libraries used in the Medicago truncatula sequencing
projects. .............................................................................................................. 85 11 List of gene homologues searched within MTGI............................................... 87 12 Reverse transcription conditions. ....................................................................... 97 13 Forward primers used for transcription profiling analysis. .............................. 100 14 Probes used in the analysis............................................................................... 101 15 Reverse primers used in the analysis................................................................ 102 16 Concentrations of reagents used for analysis. .................................................. 103 17 Medicago truncatula PAL homologues............................................................ 112

xv
TABLE Page 18 Medicago truncatula CHS homologues. .......................................................... 113 19 Medicago truncatula IFR homologues. ........................................................... 118
1
CHAPTER I
INTRODUCTION
The research presented in this dissertation is divided into four chapters. In this
chapter, a context for the research is provided by examining legumes as crop species and
related aspects of plant-pathogen interactions. In Chapter II, in order to find plant
populations that are resistant or susceptible to infection by P. medicaginis and C. trifolii,
the defense responses of natural populations to infection by these pathogens are
presented. In Chapter III, the characterization of the interaction between M. truncatula
and P. medicaginis based on the reactions of sickle, an ethylene insensitive mutant of M.
truncatula is further studied using greenhouse and growth chamber experiments.
Chapter IV starts with an analysis of genes involved in plant defense responses through
the search and study of the M. truncatula EST database. This search resulted in the
discovery of putative gene homologues that, upon in silica analysis, were suspected of
having differential expression subsequent to pathogen challenge. The usefulness of such
results is presented in the second part of this chapter, where the genetic responses of skl
mutant after infection with P. medicaginis, based on a subset of the gene homologues
previously found are presented, with the purpose of obtaining a framework to explain the
breadth of responses affected in skl mutation.
____________________ This dissertation follows the style and format of Phytopathology.
2
LEGUMES IN HUMAN SURVIVAL AND HOSTS FOR SEVERAL PLANT-
MICROBE INTERACTIONS
History and Importance
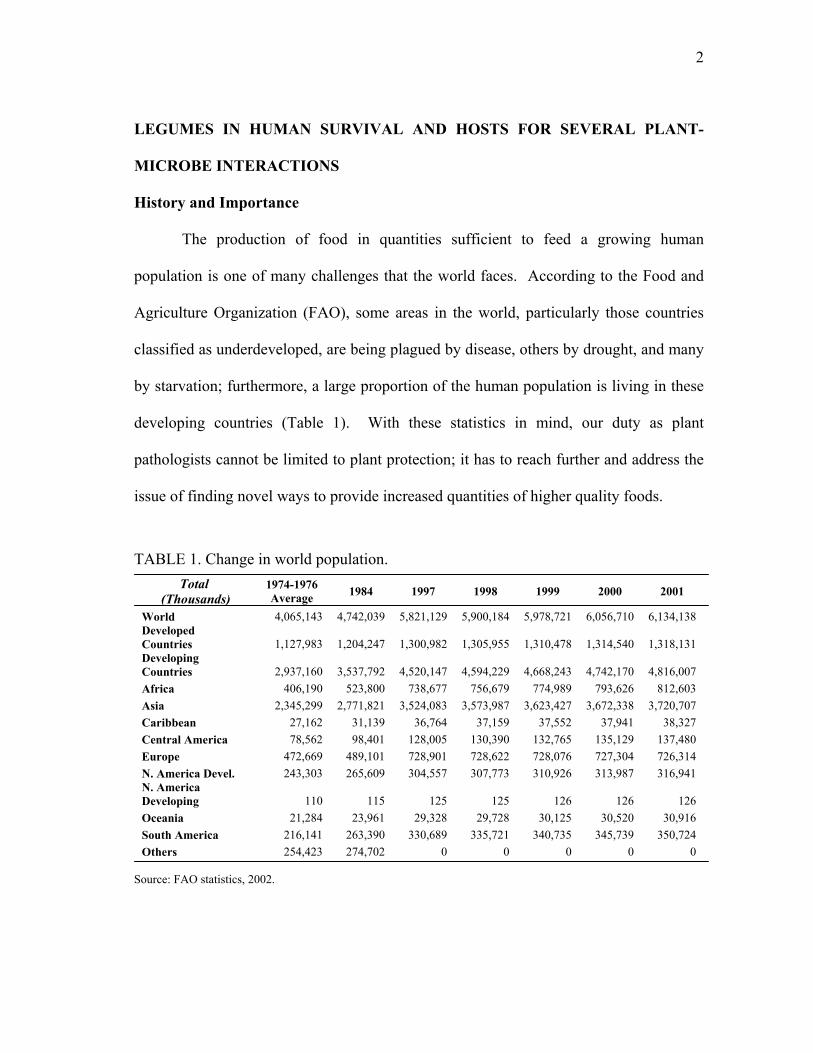
The production of food in quantities sufficient to feed a growing human
population is one of many challenges that the world faces. According to the Food and
Agriculture Organization (FAO), some areas in the world, particularly those countries
classified as underdeveloped, are being plagued by disease, others by drought, and many
by starvation; furthermore, a large proportion of the human population is living in these
developing countries (Table 1). With these statistics in mind, our duty as plant
pathologists cannot be limited to plant protection; it has to reach further and address the
issue of finding novel ways to provide increased quantities of higher quality foods.
TABLE 1. Change in world population. Total
(Thousands) 1974-1976 Average 1984 1997 1998 1999 2000 2001
World 4,065,143 4,742,039 5,821,129 5,900,184 5,978,721 6,056,710 6,134,138 Developed Countries 1,127,983 1,204,247 1,300,982 1,305,955 1,310,478 1,314,540 1,318,131 Developing Countries 2,937,160 3,537,792 4,520,147 4,594,229 4,668,243 4,742,170 4,816,007 Africa 406,190 523,800 738,677 756,679 774,989 793,626 812,603 Asia 2,345,299 2,771,821 3,524,083 3,573,987 3,623,427 3,672,338 3,720,707 Caribbean 27,162 31,139 36,764 37,159 37,552 37,941 38,327 Central America 78,562 98,401 128,005 130,390 132,765 135,129 137,480 Europe 472,669 489,101 728,901 728,622 728,076 727,304 726,314 N. America Devel. 243,303 265,609 304,557 307,773 310,926 313,987 316,941 N. America Developing 110 115 125 125 126 126 126 Oceania 21,284 23,961 29,328 29,728 30,125 30,520 30,916 South America 216,141 263,390 330,689 335,721 340,735 345,739 350,724 Others 254,423 274,702 0 0 0 0 0
Source: FAO statistics, 2002.
3
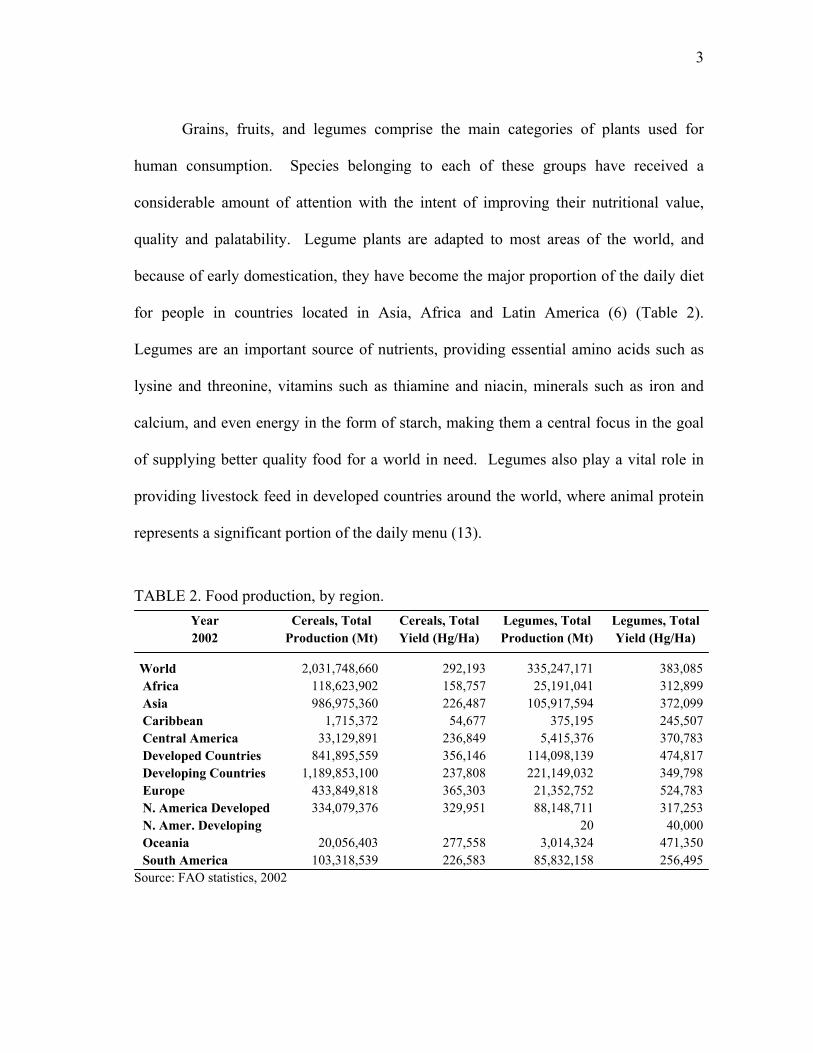
Grains, fruits, and legumes comprise the main categories of plants used for
human consumption. Species belonging to each of these groups have received a
considerable amount of attention with the intent of improving their nutritional value,
quality and palatability. Legume plants are adapted to most areas of the world, and
because of early domestication, they have become the major proportion of the daily diet
for people in countries located in Asia, Africa and Latin America (6) (Table 2).
Legumes are an important source of nutrients, providing essential amino acids such as
lysine and threonine, vitamins such as thiamine and niacin, minerals such as iron and
calcium, and even energy in the form of starch, making them a central focus in the goal
of supplying better quality food for a world in need. Legumes also play a vital role in
providing livestock feed in developed countries around the world, where animal protein
represents a significant portion of the daily menu (13).
TABLE 2. Food production, by region. Year Cereals, Total Cereals, Total Legumes, Total Legumes, Total 2002 Production (Mt) Yield (Hg/Ha) Production (Mt) Yield (Hg/Ha)
World 2,031,748,660 292,193 335,247,171 383,085 Africa 118,623,902 158,757 25,191,041 312,899 Asia 986,975,360 226,487 105,917,594 372,099 Caribbean 1,715,372 54,677 375,195 245,507 Central America 33,129,891 236,849 5,415,376 370,783 Developed Countries 841,895,559 356,146 114,098,139 474,817 Developing Countries 1,189,853,100 237,808 221,149,032 349,798 Europe 433,849,818 365,303 21,352,752 524,783 N. America Developed 334,079,376 329,951 88,148,711 317,253 N. Amer. Developing 20 40,000 Oceania 20,056,403 277,558 3,014,324 471,350 South America 103,318,539 226,583 85,832,158 256,495
Source: FAO statistics, 2002
4
Legumes are extremely important for soil improvement and agricultural
productivity due to their capacity to fix atmospheric nitrogen. During the nitrogen fixing
process, symbiotic bacteria, living in specialized root-derived organs called nodules,
convert atmospheric nitrogen into ammonia. The host legume provides the bacteria with
carbohydrates and low oxygen tension, which are critical for nitrogen fixation and
bacteria survival. The plant uses the ammonia to produce glutamine, the initial product
of nitrogen assimilation, and subsequently to supply other aspects of primary and
secondary metabolism with organic nitrogen. Nitrogen fixation is the subject of intense
research in the areas of plant pathology, plant breeding and plant physiology. Research
on this topic is also of interest to bacteriologists and efforts to improve the understanding
and the efficacy of this beneficial interaction are currently underway (188).
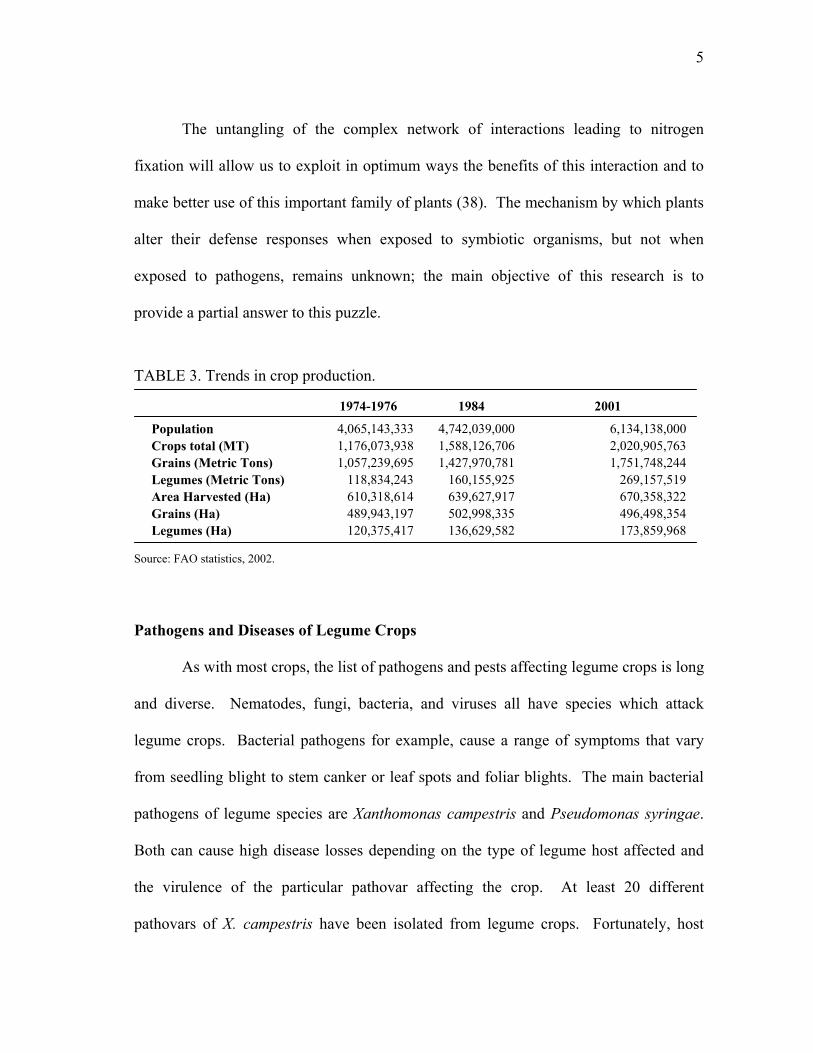
During the last 40 years, we have seen the results of a green revolution. Crop
yields have improved due to the use of new varieties that were specially selected and
bred for larger yields. This improvement has come with boosts in the use of pesticides,
irrigation and fertilizers but without affordable crop prices or the desirable increases in
cultivated area (Table 3). Because there is a lack of appropriate soils for cultivation,
(13), these factors have translated into higher demands for the soils and the plants
growing on them to yield. Legume crops can play a vital role to improve this situation.
This fact, combined with the knowledge that approximately 30% of the proteins and
50% of the essential amino acids have legume origin, reinforces their importance and
provides ample reason to continue research for legume improvement (25).
5
The untangling of the complex network of interactions leading to nitrogen
fixation will allow us to exploit in optimum ways the benefits of this interaction and to
make better use of this important family of plants (38). The mechanism by which plants
alter their defense responses when exposed to symbiotic organisms, but not when
exposed to pathogens, remains unknown; the main objective of this research is to
provide a partial answer to this puzzle.
TABLE 3. Trends in crop production. 1974-1976 1984 2001
Population 4,065,143,333 4,742,039,000 6,134,138,000 Crops total (MT) 1,176,073,938 1,588,126,706 2,020,905,763 Grains (Metric Tons) 1,057,239,695 1,427,970,781 1,751,748,244 Legumes (Metric Tons) 118,834,243 160,155,925 269,157,519 Area Harvested (Ha) 610,318,614 639,627,917 670,358,322 Grains (Ha) 489,943,197 502,998,335 496,498,354 Legumes (Ha) 120,375,417 136,629,582 173,859,968
Source: FAO statistics, 2002. Pathogens and Diseases of Legume Crops
As with most crops, the list of pathogens and pests affecting legume crops is long
and diverse. Nematodes, fungi, bacteria, and viruses all have species which attack
legume crops. Bacterial pathogens for example, cause a range of symptoms that vary
from seedling blight to stem canker or leaf spots and foliar blights. The main bacterial
pathogens of legume species are Xanthomonas campestris and Pseudomonas syringae.
Both can cause high disease losses depending on the type of legume host affected and
the virulence of the particular pathovar affecting the crop. At least 20 different
pathovars of X. campestris have been isolated from legume crops. Fortunately, host

6
plant resistance, in addition to crop rotation, improved seed production and other
management practices have reduced the incidence of the pathogens and their overall
threat (6-7).
Root pathogens like Rhizoctonia, Pythium and Phytophthora species can cause
crown rots, damping-off and root rots in seedlings, resulting in poor emergence and
therefore low crop yields. Another important pathogen, particularly for groundnut
species, is Aspergillus flavus, which besides attacking seeds and seedlings and causing
emergence problems in these species, can contaminate the established plantations with
carcinogenic aflatoxins. Because of the extreme danger of aflatoxins, the levels of this
compound in peanuts are subject to intense scrutiny and regulation at both the national
and international level (6,7). As the seedlings mature, fungi such as F. oxysporum,
Aphanomyces euteiches or Sclerotinia sclerotiorum are capable of causing wilts in some
of the established plants. Nematodes are also root pathogens, and are perhaps the most
significant disease agents affecting legumes. They are almost cosmopolitan, and when
associated with fungi, they can create disease complexes and cause extensive damage.
They remain difficult to control in the soil and few soil fumigants are certified to control
them. Species like Heterodera goettingianna, Meloidogyne incognita and M. javanica
are some of the most prevalent (6,7).
Most leaf diseases in legumes are caused by fungi such as Botrytis, Alternaria, or
Colletotrichum. Oomycetes, such as Peronospora pisi or P. viciae, can cause downy
mildews under conditions of low temperature and high humidity. Powdery mildews
caused by species such as Erysiphe polygoni or E. pisi and rusts like Uromyces pisi are
7
capable of lowering crop yield by 20% or more if control measures are not taken rapidly
(6,7).
Viruses are usually not an extensive problem unless severe vector infestations are
present. Potyviruses are the most prevalent; bean common mosaic, bean yellow mosaic
and soybean mosaic are of major importance among them. These organisms transmit
themselves by means of contaminated seed or insect vectors, usually aphids such as
Aphis gossipi or Acyrthosiphon pisum. Other viruses belonging to groups such as
geminiviruses and carlaviruses also affect legume crops and may have different means
and vectors for transmission (7).
The relative economic importance of these organisms is usually assessed on a
regional basis. Data records of disease loss are available for certain crops and diseases,
but few reports exist where an overall, judicious assessment of yield loss is
accomplished. Because no reliable data is available to estimate the importance of a
disease, this value can be extrapolated from the cost in the use of fungicides, pesticides
and soil fumigants applied to the crops. This information alone might not be enough
because the pathogens also affect the quality of the crop and thus the price of the yield
(6).
Model Legumes
The leguminosae includes many economically important species such as
soybean, pea, chickpea, bean and lentil. Some legume crops are used as forage crops,
while other species such as peanuts and soybeans are valuable sources of plant oils as

8
well as food crops (13). The need for understanding nitrogen fixing processes mediated
by rhizobacteria has led to the development of genetic models like Lotus japonicus and
M. truncatula.
Both plants have small genomes that make them ideal candidates as model
species (38-39, 82, 141). Linkage maps have been developed for both organisms and
these maps are providing gene information and markers of agronomically important
traits. Comparative genomics is allowing the alignment of genetic maps and the transfer
of genetic markers of these model species to the counterparts of agronomically important
plants like alfalfa, soybean, beans and peas (34, 198). Colinearity of these maps makes
the mapping of these agronomically important traits an achievable task (34).
In a similar way, Expressed Sequence Tags (EST) libraries, constructed from
different tissues over a wide range of conditions, are now available in the public domain.
Bacterial Artificial Chromosomes (BAC) libraries have also been constructed (126) and
have helped in the construction of physical maps for these species and in the cloning of
important genes. cDNA microarrays are providing global pictures of the responses of
these species to particular stimuli like a pathogen or an environmental condition (188).
Lastly, genetic transformation by different methods is a reality for these species,
and it is now possible to overexpress or silence a particular gene to study its effects (23,
94, 182). Eventually, this information will be applied in agronomically important
species to increase our knowledge and ultimately to improve crop quality and yield.
9
PHYTOPHTHORA AS A PLANT PATHOGEN
The Phylum Oomycota as Important Plant Pathogens
The Oomycetes are life forms that belong to the kingdom Chromista.
Heterokonta, one of three phyla in this kingdom, contains the class Pseudofungi
(Heteromycotina), which is where the subclass Oomycetes is grouped (5).
Characteristic in Oomycetes is the presence of anisokont and heterokont flagella
in the zoospores, the asexual reproductive structures of these organisms. Typical as well
is a cell wall composition with various types of glucans (β-1,3-glucans, β-1,6-glucans
and β-1,4-glucans (cellulose)) (16), similar to that of plants. The Oomycetes life cycle is
characterized by a predominantly diploid vegetative stage, interrupted only by haploid
stages that occur exclusively inside reproductive structures called gametangia.
Mycelium in Oomycetes is coenocytic with few or no septa. Asexual reproduction is
possible by the production of asexual reproduction structures called sporangia.
Sporangia contain the asexual motile spores called zoospores and they represent the
main infective structures of these organisms. Some studies suggest that chemotaxis
drives the movement of these infective structures towards suitable hosts (29).
Several important plant pathogens belong to this subclass of organisms. The
downy mildews, for example, form an economically important group of obligate
parasites of plants. Representative genera of this group of plant parasites include
Bremia, Peronospora and Sclerospora. Several species from these groups cause disease
symptoms in a wide range of plant species (5). The Phytiaceae family contains the
genera Pythium and Phytophthora, both of which are notable plant pathogens (5).

10
The Genus Phytophthora and Its Importance in Agriculture
Phytophthora species can cause multicyclic foliar and root diseases. This is
possible because of the high rate of zoospore production. Under optimum conditions,
the inocula of these species can go from barely detectable to high numbers in matter of
days to weeks. This inoculum is able to generate secondary infections on the host,
giving sense to the term multicyclic. The epidemiology of potato late blight and several
other Phytophthora-caused diseases such as black pod of cacao (P. palmivora) and black
shank of tobacco (P. parasitica) are good examples of systems that can be described as
multicyclic diseases (95).
Potato late blight caused by P. infestans is the best known illustration of the
terrible potential to cause disasters which these organisms have. The late blight
epidemic in Ireland ended with a severe famine that brought this genus of organisms to
the forefront of plant pathology research; since then numerous other Phytophthora
diseases affecting other crops have been studied and classified. In the case of legumes
particularly important are the root rot caused by P. sojae in soybean and the leaf blight
of P. drechsleri on pigeon pea. In soybean, plant losses and yield reductions range from
40% in highly tolerant cultivars to total loss in susceptible ones. Disease severity
depends on genetic resistance of the cultivar, rainfall, temperature, soil drainage, and
management practices (7). For pigeon pea, Phytophthora infection is particularly severe
in countries like India, where losses of 100% have been reported. The disease is still
considered relatively new and precise information on severity and distribution is not
11
available. Nonetheless, it has been reported in the Dominican Republic, Kenya, Panama
and Puerto Rico (156). Alfalfa and other medics are attacked by P. medicaginis, causing
root rots if poorly drained soils are present. Phytophthora root rot of alfalfa is an
important disease in the high plains of Texas and Oklahoma (137), but it is widespread
and particularly severe in Australia, where different medics are grown for forage
purposes (6-7). In the following section, the molecular basis of virulence and disease
resistance, a key concept to deal with these pathogens will be presented.
MOLECULAR BASIS OF VIRULENCE AND PLANT DISEASE RESISTANCE
Resistance and susceptibility against a pathogen is largely divided into two
classes. The first is termed horizontal resistance, or general, and it is not directed
specifically towards any pathogen. Structural features like cell wall appositions,
preformed chemical inhibitors, plant age, and plant developmental status are some
examples of this type of resistance. The second type, called vertical resistance, is of a
more specific nature and it is directed towards the pathogen. Phytoalexin production and
the occurrence of a Hypersensitive Response (HR) in the plant after exposure to the
pathogen are some examples of this type of defense response (185). Vertical resistance
is caused by the expression of resistance genes in the plant as a consequence of the
recognition of the expression of virulence genes by the pathogen. Flor, in 1946,
proposed his gene-for-gene theory, in which he stated that for any virulence gene in the
pathogen there is a corresponding resistance gene in the plant (67). Usually resistance
genes are dominantly inherited (Res), whereas virulence genes are recessively inherited
12
(vir), but this is not always true. In general, the absence of resistance genes or the
expression of the recessive allele in the resistance gene will lead to disease symptoms or
compatibility when confronted with the virulence genes of the pathogen (185). Upon
expression of the resistance gene, the plant customarily undergoes a fast and localized
HR response. Under this response, the cells that are the objects of infection enter into
programmed cell death patterns, shown to be mediated by the generation of Reactive
Oxygen Species (ROS) in and around the site of infection (129, 144). The HR signals
the plant to start producing series of specific kinds of proteins related with pathogenesis
that increase the general immune response in the plants (73, 77). For example, in the
case of P. sojae infection of resistant soybean plants, hypersensitive cell death occurs at
the site of infection and synthesis of compounds like callose and the isoflavonoid
phytoalexin glyceollin occur in adjacent tissues. Callose formation looks like a general
response to injury and not a defense response per se. However, glyceollin production
has been shown to be dependent on specific gene activation of the phenylpropanoid
metabolism, because the application of α-AminoOxy-ß-PhenylPropionic acid (AOPP) or
other compounds to inhibit Phenyl alanine Ammonia Liase (PAL) expression leads to
loss of glyceollin production and development of disease symptoms (145).
Isoflavonoid compounds are also important in symbiotic interactions between
plants and microorganisms. In the case of legume plants and Rhizobium bacteria, an
interaction initiated by flavonoid compounds released by roots of the plant is followed
by the specific production of nodulation factors in the bacteria. Nod factor, the
compound that is produced by Rhizobium, is specifically recognized by receptors in the
13
plant root. The specificity of the recognition process depends on the chemical
modifications present on the chitin backbone of the Nod factor (142). Upon positive
recognition, a series of developmental stages transpire that lead to the formation of a
new organ, the nodule, which will harbor the nitrogen-fixing bacteria (143).
In the case of M. truncatula plants infected with S. meliloti, their natural
symbiont, a negative feedback pathway involving ethylene mediates Nod factor
responsiveness (140). A key mutant used to understand this event is skl, a M. truncatula
ethylene insensitive mutant that has been shown to be a homologue of A. thaliana
Ethylene Insensitive 2 (EIN2). EIN2 in turn, has homology to the NRAMP divalent
cation transporters of eukaryotic systems, suggesting a critical role for metal metabolism
in ethylene signal transduction mechanisms (8, 21, 66, 87, 118). Even though the
specific mechanism to explain how ethylene regulates nodule number is not clear,
research involving skl mutation suggest that ethylene is involved in complex
mechanisms controlling different levels of the developmental response. In 1997, for
example, Penmetsa and Cook (146) proposed that ethylene is the molecule responsible
for controlling the extent of infection of roots exposed to Rhizobium bacteria. In 2001,
Oldroyd et al. (140) showed that A17 M. truncatula roots exposed to Nod factor
sustained reduced calcium spiking responses in the presence of ethylene, while Nod
factor treated skl roots continued to have calcium spiking responses similar to Nod factor
treated, non ethylene exposed controls. Calcium spiking is one of the earliest responses
to Nod factor presence in Rhizobium infected roots, possibly creating ion changes in the
root hairs that are required for infection thread formation and eventual nodule formation
14
(140). Previously, Heidstra et al. demonstrated that transcripts of 1-Amino-
Cyclopropane-1Carboxylic acid oxidase (ACC oxidase) were negatively correlated with
the spatial distribution of nodule development (86). ACC oxidase catalyzes the last step
in ethylene production, but the specific mechanism of ethylene’s involvement in
nodulation is not yet known.
In plant–pathogen interactions, the plant hormone ethylene is believed to be
involved in plant defense responses. After pathogen infection and subsequent
recognition of the pathogen by the host, ethylene is produced by the conversion of S-
Adenosyl-L-Methionine (SAM) into ACC. ACC is then converted into ethylene, carbon
dioxide and cyanide. Ethylene production generates a molecular and genetic cascade of
responses that lead to the induction of host defense-related genes (21, 49, 51, 91, 98,
174).
The dissection of the ethylene signal pathway leading to the expression of host
defense-related genes reveals that it starts with a receptor protein that binds ethylene in
the presence of copper. Several mutants defective in ethylene perception (i.e. etr1, ers1,
etr2, ein4 and ers2) were isolated and cloned from A. thaliana (21, 91, 174). The
binding of ethylene presumably causes an alteration in the coordination chemistry of
copper that results in a conformational change in the ethylene binding site that, in turn, is
propagated to the transmitter domain of the EThylene Receptor 1 (ETR1) family dimer
pair (21, 91).
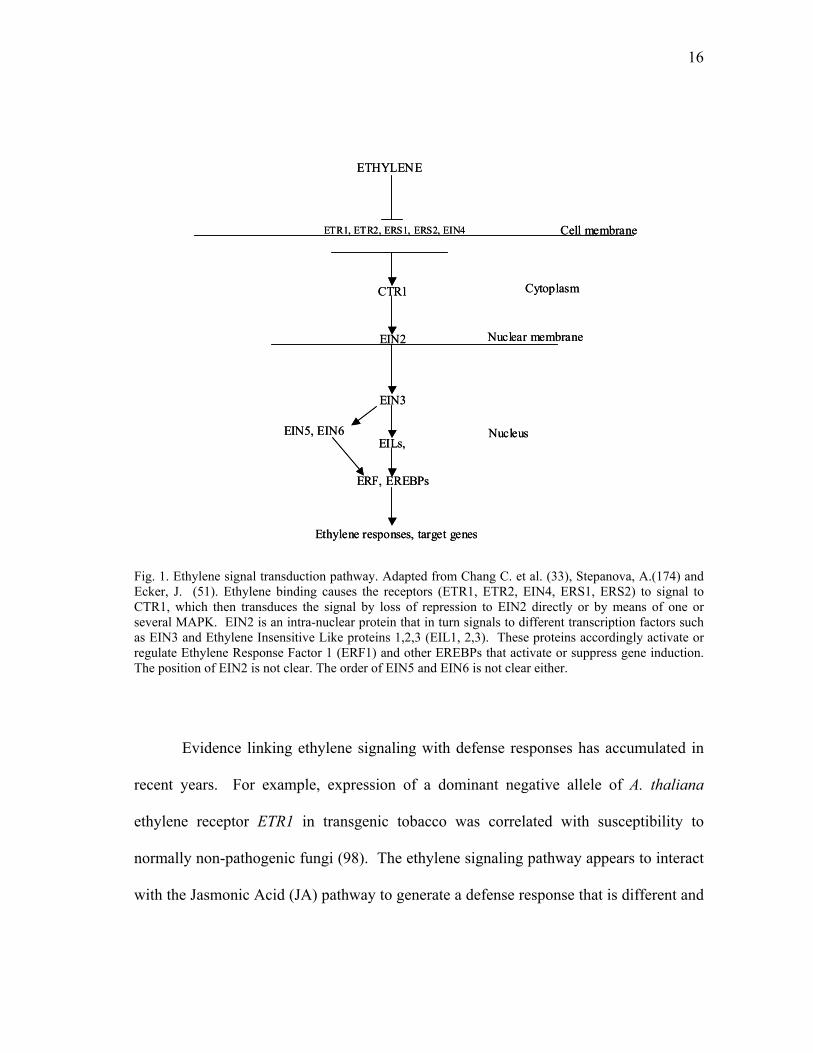
The proposed model (21, 33, 91, 174) (Fig. 1) postulates that in the absence of
ethylene, the A17 “two-component” receptors, paralogues of the ETR1 family, activate
15
the regulator Constitutive Triple Response 1 protein (CTR1), which in turn represses the
activity of the downstream genes EIN2 and Ethylene Insensitive 3 (EIN3). Ethylene
binding is believed to switch off the receptors, leading to CTR1 inactivation and
activation of downstream signaling. Loss of function mutants that affect the binding of
ethylene lead to constitutive signaling to CTR1 and confer dominant insensitivity to
ethylene. By contrast, mutations in at least three or more receptor family members lead
to a lack of activation of CTR1 and therefore a constitutive triple response phenotype.
Similarly, loss of function mutants affecting CTR1 also resulted in a constitutive
ethylene-response phenotype, indicating that CTR1 is a negative regulator of the
ethylene response pathway (33, 91, 96, 174). Sequence analysis of CTR1 shows that it is
related to the mammalian RAF kinase family of protein kinases that initiate Mitogen-
Activated Protein KINASE cascades (MAP-kinase) of signal transduction. MAP-kinase
cascades are often involved in regulation of transcription factor activity (111) (Fig. 1).
EIN2 shows 21% sequence similarity to the eukaryotic NRAMP family of
presumptive metal ion transporters and it is required for ethylene signaling between
CTR1 and EIN3 (8, 21, 174). The mechanism of EIN2 action remains unknown, but it is
possible that it functions directly by regulating a second messenger during the signaling
process. Alternatively, EIN2 could be a metal homeostatic regulator acting indirectly on
the ethylene-signaling pathway (8, 33, 98) (Fig. 1). EIN3 acts genetically downstream of
CTR1 and codes for a transcription factor that initiates a cascade of different responses
involving members of a large, plant-specific group of transcription factors called
Ethylene Responsive Elements Binding Proteins (EREBP) (171, 174).
16
Fig. 1. Ethylene signal transduction pathway. Adapted from Chang C. et al. (33), Stepanova, A.(174) and Ecker, J. (51). Ethylene binding causes the receptors (ETR1, ETR2, EIN4, ERS1, ERS2) to signal to CTR1, which then transduces the signal by loss of repression to EIN2 directly or by means of one or several MAPK. EIN2 is an intra-nuclear protein that in turn signals to different transcription factors such as EIN3 and Ethylene Insensitive Like proteins 1,2,3 (EIL1, 2,3). These proteins accordingly activate or regulate Ethylene Response Factor 1 (ERF1) and other EREBPs that activate or suppress gene induction. The position of EIN2 is not clear. The order of EIN5 and EIN6 is not clear either.
Evidence linking ethylene signaling with defense responses has accumulated in
recent years. For example, expression of a dominant negative allele of A. thaliana
ethylene receptor ETR1 in transgenic tobacco was correlated with susceptibility to
normally non-pathogenic fungi (98). The ethylene signaling pathway appears to interact
with the Jasmonic Acid (JA) pathway to generate a defense response that is different and
ETR1, ETR2, ERS1, ERS2, EIN4
ETHYLENE
CTR1
EIN5, EIN6
Cell membrane
EIN2
ERF, EREBPs
EIN3
Ethylene responses, target genes
Nucleus
Nuclear membrane
Cytoplasm
EILs,
ETR1, ETR2, ERS1, ERS2, EIN4
ETHYLENE
CTR1
EIN5, EIN6
Cell membrane
EIN2
ERF, EREBPs
EIN3
Ethylene responses, target genes
Nucleus
Nuclear membrane
Cytoplasm
EILs,
17
independent from the Salicylic Acid (SA)-dependent Systemic Acquired Resistance
(SAR) pathway (49, 178). Furthermore, a requirement for ethylene during disease
resistance was observed in A. thaliana plants carrying a defective ein2 gene. The mutant
plants showed increased susceptibility to different strains of the gray mold Botrytis
cinerea. On the other hand, when the plants were challenged with non-pathogenic
strains of Alternaria brassicola or Peronospora parasitica, no increased susceptibility
was observed. These results indicate that ethylene is required for some, but not all, of
the defense responses against pathogens (21, 49, 98, 174, 178-179) (Fig. 2).
Among the different plant defense responses, ethylene in conjunction with
jasmonic acid (JA) triggers a subset of responses that is important in providing one type
of broad-spectrum systemic resistance in plants. This pathway was identified while
analyzing the effects of JA to wounds and insect attack. For instance, in injured leaves
JA is rapidly and transiently produced in response to pest attack. One of the effects of
the rise in JA levels is an upsurge in ethylene production. Other effects include the
induction of a different set of defense response genes than those induced by SA. In A.
thaliana, JA production leads to the induction of the defensin gene PDF1.2. This gene
encodes an antifungal protein (189). In this same way, another defense protein called
thionin is also induced, and furthermore, the same set of genes is activated following
induction by ethylene or cell wall oligosaccharide fragments (49, 178). Lipoxygenase,
the enzyme responsible for the synthesis of JA and other fatty acid derivatives, is also
induced by JA, injury or pathogen attack (17). In this sense, a positive correlation
between LOX expression and the defense responses of the plants has been observed in
18
several different plant-pathogen systems. Some examples of this are: Puccinia graminis
tritici and wheat, P. coronata and oats, and Magnaphorte grisea and rice (119). The
inhibition of ethylene and/or JA production, or reduced sensitivity to both compounds,
can negatively affect the initiation of the JA pathway and the downstream responses.
Among the most studied responses of plants to pathogens are the HR and SAR.
The HR is an incompatible reaction that occurs at the point of pathogen infection and is
distinguished by a localized oxidative burst and cell death (77,104). The HR is believed
to control and isolate the pathogen at the point of infection (77,104). In turn, the HR is
correlated with SAR (discussed below), although the precise relationship between HR
and SAR remains to be determined. Experiments involving A. thaliana Defense No
Death (dnd) mutants suggested that dnd mutants fail to produce HR but still show SAR
(36, 195). Under the gene-for-gene hypothesis, the plant continually evolves new
resistance genes that will allow the establishment of an incompatible interaction between
the plant and the pathogen and lead to disease development. Correspondingly, the
pathogen evolves new virulence specificities to render susceptible the co-evolving host
(43, 67, 104) (Fig. 2). The HR can also be induced during resistance responses to non-
host-specific pathogens. It is believed that avirulent pathogens elicit SA accumulation
by means of resistance genes, through the action of genes such as Non Defense
Resistance 1 (NDR1) (31-32) and Enhanced Disease Susceptibility 1 (EDS1) (60), which
are responsive to induction by different sets of R-genes. The activation of either gene
eventually translates into HR and SA accumulation and SAR (49, 75, 89).
19
SAR is a broadly effective and systemic defense response, dependent on the
accumulation of salicylic acid (160). SAR confers protection against many types of
pathogens. Upon SA accumulation, Pathogenesis Related proteins (PR) are expressed
throughout the plant. Cellulases, chitinases, proteinases, glucanases and antiviral
proteins are among the known PR gene products. SAR limits secondary infections
and/or spread of the initial pathogen (44, 160). Interestingly, SA accumulation will
occur even if the local HR was sufficient to stop the initial infection. In addition to
specific PR protein induction, structural and metabolic mechanisms of defense are also
activated during SAR. For example, localized cell wall modifications can make the cell
wall less pervious to pathogen ingress, while production of toxic secondary metabolites
called phytoalexins can act directly to impede pathogen development. SAR can also be
triggered by successful infection events, and in this case SA accumulation is also the key
element in mounting this associated defense response (49, 160). The signal transduction
events that lead to SA accumulation and that trigger SAR are complex and not yet
completely understood. Virulent pathogens, for instance, seem to elicit SA production in
the plant by means of host regulatory genes such as PhytoAlexin Deficient 4 (PAD4) and
EDS (49, 89). The Constitutive expresser of PR genes 1 gene (CPR1) is a negative
regulator of both PAD4 and EDS, and has a mutant phenotype that constitutively
accumulates SA. SA, in turn, induces the expression of PR genes by means of SA
responsive transcription factors. Downstream of SA sits NPR1. Mutations on this gene
abolish the expression of some of the PR protein and cause enhanced susceptibility to
pathogens (28, 49). This protein was showed to contain several ankyrin motifs, which
20
are involved in protein-protein interactions (28, 75, 197). It has been proposed that
NPR1 protein is targeted to the nucleus as a response to SA accumulation. In the
nucleus, it is believed to interact with a subclass of TGA transcription factors, which in
turn may intermingle with SA responsive cis-elements of PR genes such as as-1 of PR1
(28, 75, 97, 197). Furthermore, recent literature (50, 58, 105) reports the presence of W-
boxes inside the promoter of some PR proteins. The W-box motif interacts with WRKY
transcription factors. This family of transcription factors is found only in plants and, in
this case, they act as negative regulators of SA dependent gene expression. NPR1 might
interact directly or indirectly with these transcription factors (28, 50, 58).
Recently, the Klessig lab (169) identified other mutations that seem to induce PR
protein expression responses through signals that are SA dependent but NPR-1
independent or through SA/NPR1 independent pathways. For example, the ssi1 mutant
was shown to suppress npr1 mutations. Nonetheless, degradation of SA signals
abolishes the constitutive expression of PR proteins present in the mutant confirming the
need of such signal for its normal expression (168). This last example shows that even
though multiple components of this pathway have been characterized (50, 108, 168-169)
the complete picture is still not entirely understood. However, multiple genetic analyses
have suggested a linear CPR1-SA-NPR1 pathway that ends with the expression of PR
proteins and the acquisition of SAR status (49) (Fig. 2).
In defense responses to pathogens, the signals of SAR seem to interact with those
of JA/Ethylene. But the precise relationship between both defense pathways remains
obscure. Data suggests that JA/Ethylene and SA accumulation negatively influence each
21
other (49). Some clarification of this issue came from the characterization of the
systemic inducible defense peptides, thionin and defensin, in A. thaliana. The study
demonstrated that thionin is induced by methyl jasmonate, silver nitrate and F.
oxysporum, but not by SA (55), which indicates that the JA/Ethylene defense response
pathway can be selectively activated.
WoundingWall Fragments
Avirulent Pathogen
Wound response
SARISR
CPR1ROS
Virulent pathogen
PAD4
NPR1
Ethy lene
EDS1NDR1
HR
JA
SAEIN2COI1, JAR1
CPR6
CPR5
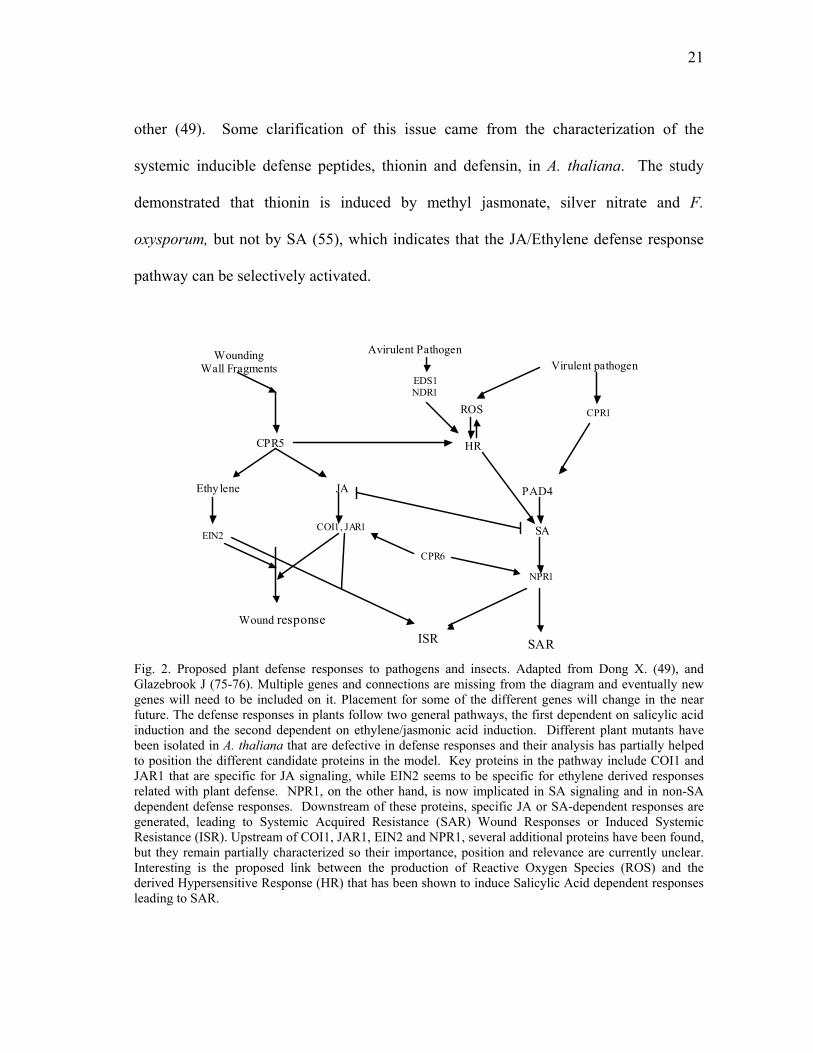
Fig. 2. Proposed plant defense responses to pathogens and insects. Adapted from Dong X. (49), and Glazebrook J (75-76). Multiple genes and connections are missing from the diagram and eventually new genes will need to be included on it. Placement for some of the different genes will change in the near future. The defense responses in plants follow two general pathways, the first dependent on salicylic acid induction and the second dependent on ethylene/jasmonic acid induction. Different plant mutants have been isolated in A. thaliana that are defective in defense responses and their analysis has partially helped to position the different candidate proteins in the model. Key proteins in the pathway include COI1 and JAR1 that are specific for JA signaling, while EIN2 seems to be specific for ethylene derived responses related with plant defense. NPR1, on the other hand, is now implicated in SA signaling and in non-SA dependent defense responses. Downstream of these proteins, specific JA or SA-dependent responses are generated, leading to Systemic Acquired Resistance (SAR) Wound Responses or Induced Systemic Resistance (ISR). Upstream of COI1, JAR1, EIN2 and NPR1, several additional proteins have been found, but they remain partially characterized so their importance, position and relevance are currently unclear. Interesting is the proposed link between the production of Reactive Oxygen Species (ROS) and the derived Hypersensitive Response (HR) that has been shown to induce Salicylic Acid dependent responses leading to SAR.
22
A separate experiment showed that the induction of the PR proteins PR-1-, PR-2
and PR-5 requires SA signaling but not methyl jasmonate or ethylene mediated signaling
(77). This results in the induction of SAR-dependent, but not JA/Ethylene dependent,
defense responses. In addition, defensin induction in A. thaliana was obtained with
applications of JA, ethylene, rose bengal, and the non-host pathogen, A. brassicola, but
not with SA applications (149). Furthermore, Thomma et al. (178) showed that the
induction of PR-3, PR-4, and defensin is dependent on the JA pathway (Fig. 2).
Recently, the characterization of a third pathway named Induced Systemic
Resistance (ISR) was started. Root colonization by fluorescent pseudomonads in
Arabidopsis results in elevated resistance levels against pathogenic bacteria and fungi.
The defense mechanism was shown to be dependent on ethylene and JA signals but at
the same time independent of SA responses (152, 187). Finally, every day there is more
information suggesting that cascades of protein kinases mediate the different defense
responses at various levels (196). MPK4, for example, is needed for proper JA/ethylene
signaling and at the same time inhibits SA signaling. The nature of such phenomenon is
not yet completely understood. Another protein kinase characterized is EDR1 that in a
similar way is needed for proper expression of SA signals (19, 70, 151, 194).
METHODS FOR GENE EXPRESSION
Several methods are available to analyze mRNA. Northern hybridizations,
nuclease protection assays, in situ hybridizations, reverse transcription PCR, microarrays
23
and real time reverse transcription PCR are some of the techniques developed to detect
and quantify RNA in tissues and samples.
In situ hybridizations, for example, are typically radioactive- or fluorescence-
based methods used to localize the expression of a particular transcript. When the probe
is incubated in the presence of the tissue where the target gene or transcript is expected
to be present, localized hybridization of target and probe molecules will occur. If this
happens, photographic or radiological techniques will be able to detect the source of the
signal and give positive confirmation of the process (164). An example of this process
was done by Ramu et al. (155) to localize and study the expression of RIP 1, a nodule-
specific peroxidase of M. truncatula (37).
Nuclease protection assays are an alternative method for RNA analysis. They are
supposed to give excellent sensitivity and are also based on the hybridization of labeled
RNA molecules with complementary templates present in an experimental sample.
When nucleases are employed to degrade RNA molecules, hybrid RNAs are protected
from degradation by their hybrid condition. Gel electrophoresis of digested samples is
then used to detect the remaining hybrid molecules. If standards of the samples are used,
quantification can be performed (157, 164).
Northern blots are perhaps the most commonly used of all the techniques
employed to detect the presence of mRNA. With this technique, it is possible to detect
any specific transcript by its hybridization with a radioactively labeled probe. The main
advantage of this system is that it is highly specific and sensitive due to the ease of
detecting radioactive sources. Problems with the technique include the need of special
24
equipment to handle radioactive material, the demand of trained personnel and the
generation of radioactive waste, which requires the presence of specific facilities and
equipment to handle it.
The major drawback of northern hybridizations is the need to repeat the process
every time that a new time point is to be analyzed or every time that a new mRNA
species is to be detected. In other words, the method causes a slow processing of
experimental samples and it is not well suited for experiments involving several time
points or different genes. Another potential problem that the sensitivity of this technique
can generate is the detection of closely related sequences that could create false signals.
Usually the design of the hybridization probe can solve this problem, but, as in the case
of very closely related sequences, sometimes this problem cannot be avoided (157).
To move away from the hazardous problems that the handling of radioactivity
creates, new detection methods based on colorimetric methods, such as biotin-labeled or
fluorescent-labeled probes are currently being implemented. Nonetheless, to detect
these novel probes additional detection equipment is needed and because the technology
is new and not widespread it is still expensive. The new systems are also facing
sensitivity problems that have slowed down their development (164).
Polymerase Chain Reaction (PCR) based methods for quantification of nucleic
acids were developed in the early 1990’s. PCR is a process that allows the perpetual
amplification of any nucleic acid product; it was created during the mid 1980’s and
multiple variations have been designed since then. A variation of PCR called Reverse
Transcription PCR (RTPCR) allows the generation of complementary copies (cDNA) of
25
mRNA. A later modification of this technique is Quantitative RTPCR (qRTPCR) that
allows the quantification of gene products.
There are two ways to perform qRTPCR. One is called competitive qRTPCR
while the second one is called noncompetitive qRTPCR. In both cases, templates
previously quantified are used to assess the copy number of the mRNA molecules in the
experimental sample. The premise behind qRTPCR is that the quantification process
will be valid if the PCR amplification efficiencies of both the standards and the target
molecules are the same (69).
Recently, new methods for quantification of nucleic acids were developed. They
are based on fluorescent probes that report the presence of nucleic acids by intercalating
or specifically hybridizing to them. Two of these techniques are real time PCR and
microarrays. Both methodologies have surpassed the developmental phase and are now
routinely applied for several purposes. Microarrays, for example, are presenting the
transcriptional profiles of organisms based on the expression change of thousands of
genes upon exposure to different conditions while real time PCR monitors in real time
the increase of a nucleic acid template during the PCR reaction (192). RTPCR has
already been shown to be extremely useful to find coordinated gene expression patterns
under multiple conditions (166) and even to validate the results of microarray
experiments (116).
Microarrays are based on the hybridization of fluorescent-labeled mRNA with
the complementary sequences in the array slide (192). The microarray slide is typically
a silica surface printed in predetermined patterns with nucleic acids. In the case of M.
26
truncatula microarrays, the slides are printed with specific EST (around 1000) that
represent a group of genes coding for most of the physiological and responsive pathways
in this species (188). The pattern of printing is repeated in the slide to have data
replication. Detection of fluorescent signals allow the generation of images where the
presence or absence of a particular RNA species is reported. Because thousands of
genes are present at the same time in the array, the displayed results contain an immense
amount of data that represents the transcriptional profile of an organism in pre-
determined experimental conditions.
Real time PCR has been consistently employed since 1997 to track the changes
in concentration of nucleic acids in several systems. It has been successfully applied in
research for medicinal purposes (see reviews by Bustin (26-27), Giulleti (74) and
McKey (114)) and it has begun to be applied in plant systems. A variation of this
technique using reverse transcription was used in this study to quantify and monitor the
expression of genes involved in defense responses upon infection of A17 and skl roots
with P. medicaginis. Real time PCR allowed the study of the fate of a relatively high
number of genes, providing the details that microarrays or northern hybridizations could
not achieve without extensive experimentation.
In the simplest form of real time PCR, nucleic acid intercalating compounds are
added to the PCR reaction to monitor the increase of PCR products. Because
intercalating compounds bind to any class of nucleic acids, nonspecific amplification of
PCR products like primer dimers, pseudogenes or homologous genes to the target
sequence can be detected (26, 74). Nonetheless, if abundant template is present and the

27
specificity of the primer is high, quantification of a particular gene is possible and
precise.
To increase the specificity of the reactions and the reliability of the technique,
systems that report the specific annealing of fluorescent primers to their complementary
templates were developed. The new methods rely on detecting the Fluorescent
Resonance Energy Transfer (FRET) that occurs between fluorescent molecules upon
excitation with an energy source. The FRET principle states that when a light source is
providing photons to the PCR mix, the fluorescent primer or probe inside the reaction
tube increases its energy from a resting basal level to the point where it cannot absorb or
accept any more energy, losing stability and releasing the excess of energy in different
ways, such as heat (friction generated by the kinetic movement of the chemicals), light
(fluorescence for example), and usually both (26). Any compound that absorbs energy
and releases it using FRET has an optimum wavelength at which it absorbs the
maximum of energy and a second one at which emits the maximum of energy. Special
light filters inside the detection system are used to provide and screen for these particular
wavelengths. When losing the excess of energy in the form of light, the fluorescent
molecule typically emits a flash of light in a different wavelength than the one it
absorbed. This energy is in turn accepted by a second compound that can act as
quencher or as a reporter for the system (190). Two types of fluorescent probes that
make use of FRET principles are currently on the market. The first type is called a
hybridization probe, while the second type is called a hydrolysis probe. In the case of
hydrolysis probes, the reporter molecule and the quencher are located in an amplification
28
probe. When nonhybridized reporter and quencher molecules are located in close
proximity to each other, they do not allow signals to be detected or escape from the
system. When hybridization occurs, the enzyme in charge of performing the PCR
disintegrates the probe, allowing FRET signals to be detected and quantified by the
detection system. This type of assay is called Taqman™ (26, 74).
The amount of fluorescence for all three systems can be correlated with the
amount of initial template during the exponential phase of PCR amplification (72, 85) by
a mathematical expression of a straight line expressed in logarithmic terms. The
mathematical expression uses the change in the fluorescence of the system to correlate
the amount of template of the experimental sample with the amplification cycle of the
PCR. If the right controls and the optimum amplification conditions have been
provided, it is possible to quantify the initial amount of template by extrapolation or
direct quantification of the initial sample (72, 85). For this dissertation research, the
Taqman™ system was used because it allowed the specific recognition of the particular
genes chosen for analysis. In the Appendix, the mathematical considerations needed to
perform this technique are presented, while the results of the analyses performed are
shown in Chapter IV.
29
CHAPTER II
RESISTANCE AND SUSCEPTIBILITY OF MEDICAGO
TRUNCATULA NATURAL POPULATIONS TO PHYTOPHTHORA
MEDICAGINIS
SUMMARY
The Medicago truncatula core collection has been screened for resistance and
susceptibility to Phytophthora medicaginis. The analysis of 96 ecotypes resulted in
certain genotypes showing high resistance and certain ones having high susceptibility to
the pathogen. Ecotypes such as DZA 222 and DZA 220 were shown to be highly
susceptible to P. medicaginis infection, whereas the ecotypes GRE 065 and FRA 20031
were found to be resistant. In addition, the resistance and susceptibility of DZA 220,
DZA 222, GRE 065 and FRA 20031 to other Oomycetes such as Pythium ultimum and
P. irregularum were also studied. The experimental results were complemented with a
preliminary survey of the same collection of 96 ecotypes for disease resistance against
Colletotrichum trifolii.
This information will provide the beginnings of breeding programs aimed at
improving the resistance of commercial varieties of M. truncatula to P. medicaginis, as
well as the map-based cloning of resistance genes. Using comparative genomics or
transgenic work, this information can eventually be used to improve other commercially
significant legume species also affected by this pathogen.
30
INTRODUCTION
The past century represented the birth of the green revolution. Many crops were
improved through breeding practices, allowing the development of new varieties and
hybrids engineered for high yield and the ability to withstand pathogens and pests (24).
Plants were selected and backcrossed to refine characteristics such as yield, size, color
and taste, in lengthy processes involving the crossings of two or more cultivars and/or
ecotypes. Due to the importance of breeding in agriculture, continuous efforts have been
made to generate new and improved varieties. In the field of plant pathology, the main
task is to find ways to protect the plants from pathogens, and, in the process, provide the
grower with excellent yield and quality seed sources. In agricultural settings, the use of
high yield varieties is often hampered by the arrival of virulent races of pathogens.
When a new strain of a pathogen renders existing cultivars susceptible, the usefulness of
the cultivar decreases while the abundance of the pathogen increases correspondingly.
The grower is faced with few alternatives, including the application of chemical or
biological control agents to reduce the incidence of the disease, the removal of diseased
plants with the intent of controlling the pathogen by elimination of infection foci, or
finally, the use of new varieties that are resistant to the pathogen (3-4).
The production of new cultivars resistant to evolving pathogens depends on
identifying sources for such resistance. A common source of new resistance phenotypes
are ecotypes, the wild relatives of cultivated species. The development of resistance
genes occurs after selective pressures caused by virulent pathogens reduce the genetic
variability of the population under stress. Genetic mutation, outcrossing of susceptible

31
and resistant individuals within the population, and the arrival of resistant individuals not
endemic to the area are the sources for the development of new resistance genes. After a
process that involves several generations, the resistant alleles are fixed into the
population, and new resistant populations or ecotypes are found (3). The task of plant
breeders is to find those genetic sources of resistance and outcross them with existent or
commercial cultivars to generate improved crops. With the advent of biotechnology, it
is now possible to use genetic transformation and breeding techniques to accelerate the
improvement of crops by transferring genes that confer resistance into susceptible
cultivars from resistant individuals.
The purpose of genetic models is to expedite the study and understanding of
biological processes. The large amount of natural populations collected over the years
on model species makes them the perfect resource to find sources of genetic variability.
In the case of the model legume M. truncatula, an extensive resource of about 400
natural populations, all of them isolated from different regions in the world, is available
for research (188). These populations are expected to present different resistance levels
to a pathogen, representing an invaluable supply of genetic material for crop
improvement. Equally important is the existence of the highly dense genetic maps in
model species that has allowed the mapping and cloning of important genes (34). The
development of comparative genomics has permitted the transfer of this genetic
information from model species into agronomically important species, opening new
ways to use the information contained in these natural populations.

32
In this work, the screening of natural populations of M. truncatula for resistance
and susceptibility to Phytophthora medicaginis was done. This study has the aim of
providing insights into the genetic variability of this plant species and offers a glimpse of
its usefulness as a source of resistance genes for crop improvement.
M. truncatula Pathogen Systems
Few plant-pathogen interactions have been studied in M. truncatula. However,
plant-pathogen interactions in the closely related species M. sativa (alfalfa) have been
widely studied and ample information is available to growers and investigators. Because
of the close evolutionary relationship between these two plants, I have hypothesized that
many of the pathogens affecting alfalfa will also be capable of producing disease
symptoms in M. truncatula. Standard assays have been developed to test pathogens in
alfalfa (The Standard Tests for Alfalfa Cultivars Handbook), so I used this information
to adapt protocols for testing pathogens in M. truncatula. The following sections explain
the pathogen systems used in this study.
Phytophthora crown and root rot
Also known as alfalfa crown and root rot, this is a root and seedling disease
caused by Phytophthora medicaginis. This oomycete, under conditions of cold
temperatures and high humidity (flooding), develops asexual swimming spores called
zoospores. Flooding conditions promote disease development (88, 120, 130-131) by
providing a medium for zoospore motility and chemotaxis (29, 57) and by inducing
anoxic conditions that interfere with host defenses. Because of the multicyclic

33
development of this pathogen, it can cause severe epidemics if chemical control or
resistant varieties are not used when planting. This pathogen is homothallic and host
specific. The pathogen’s natural host is Medicago sativa, which is a polyploid species,
obligatorily outcrossed. The existence of multiple genomes in this species has created a
high level of heterozygosity in all the genetic loci of this species and the exploitation of
this natural variability has allowed the discovery of natural resistance to most of the
problems (120). Phytophthora root rot is not an exception; however, resistance to this
pathogen is dependent on the density of the pathogen in the soil and on environmental
conditions. If flooding occurs frequently, the density of the pathogen will increase and
both resistant and susceptible populations will die. This means, as Miller and Maxwell
observed in 1984 (120), that both types of plants are capable of becoming infected but
the rate of colonization in resistant populations is considerably slower than in susceptible
plants (120).
In tetraploid alfalfa, two loci that are incompletely dominant, Pm1 and Pm2, are
required for resistance (56). In diploid M. falcata plants, resistance to P. medicaginis is
conditioned by two independently segregating loci, Pm3 and Pm4 (83). The nature of
the resistance against this pathogen in M. truncatula is not well known. Even though
breakdown of resistance by this pathogen is not a common situation, these studies of the
interaction between P. medicaginis and M. truncatula can provide new opportunities for
unique sources of resistance against this pathogen.

34
Pythium damping off
Damping off is a disease caused by oomycetes pathogens. Pythium species are
best known for inciting seedling damping off and pre-emergence rots. Like
Phytophthora, this organism is filamentous, heterotrophic and similar to true fungi, but
more closely related to plants than to true fungi. Several species, including P. ultimum
and P. irregularum, can cause severe losses to alfalfa stands. As in the case of
Phytophthora, zoospores are the most important infective structures for this pathogen.
Control of these species is currently by deployment of resistant individuals, as well as by
chemical control (5). However, biological control of these pathogens through the
development of suppressive soils has shown some success. These suppressive soils
maintain physical characteristics such as pH, iron content and soil type that negatively
influence the establishment of pathogenic populations. Under these conditions, the
development and colonization of the root interphase by native beneficial populations of
bacteria and fungi are favored. Biological control of Pythium species is currently
investigated using fluorescent pseudomonads and Streptomyces bacteria (42, 92) as well
by other antagonistic organisms such as fungi of the Trichoderma species (191).
Anthracnose
This is a leaf, stem and crown disease caused by the ascomycete C. trifolii. It is
an important disease of alfalfa that affects growth, forage yield and plant vigor (135,
150). In compatible interactions, this pathogen causes typical anthracnose symptoms
characterized by black lesions on the stems and leaves of the plant (133, 183). The
pathogen enters the host by means of appressoria and the subsequent development of
35
penetration pegs. Once inside the epidermis, the fungus colonizes the tissues (136, 150).
Upon successful colonization, asexual reproduction structures called acervuli can be
visualized on the surface of the infected tissues. In the United States, two different races
of the pathogen exist. Race 1 has been detected in all areas where alfalfa is grown,
whereas race 2 seems to be confined to the eastern states (136). Specific resistance
against these races has been found, but efforts to produce cultivars carrying resistance
genes in M. sativa have been hampered by the auto-tetraploid and outcrossing nature of
alfalfa, causing every cultivar to be genetically heterogeneous. Due to this fact,
resistance against a pathogen in alfalfa is expressed in terms of percentage of the
population carrying such resistance. Nonetheless, resistance against these races is
controlled by two single dominant independent segregating loci, An1 and An2 (136).
The nature of these genes has not been determined in alfalfa. Model legumes such as M.
truncatula can potentially facilitate such analyses, either by providing comparative
molecular markers that can help with the cloning of the homologues in alfalfa, or by
cloning and characterizing the orthologous locus in the Medicago truncatula. This
pathogen has become a model pathogen for plant-disease interactions, and host
transcriptional responses are being characterized by a combination of EST sequencing
and transcriptional profiling in M. truncatula leaves (188).
36
MATERIALS AND METHODS
Plant Material
M. truncatula ecotypes isolated from locations in Crete, Greece, Portugal, Spain,
France, Algeria and Australia were provided by Dr. Jean Prosperi, INRA, France. Seed
from cultivar Jemalong A17 and near isogenic sickle were obtained from the Cook
laboratory (Department of Plant Pathology, UC Davis).
Plant Growth Conditions
Seed germination
Seed were scarified with concentrated sulfuric acid (200 seed/ecotype/cultivar/20
ml H2SO4) for 8 minutes inside 50ml falcon tubes, rinsed 5 times with sterile distilled
water and left for at least four hours to imbibe water. The seed was then placed in 9 cm
Petri dishes containing sterilized moist filter paper, sealed with parafilm, wrapped in
aluminum foil and stored inside a 4 °C refrigerator for 2 days to synchronize
germination.
After the two days of cold treatment, the dishes containing the seed were
transferred to room temperature (usually 20°C), and maintained in the dark to allow
germination. After 36 hours at room temperature, a visible radicle of 1½ to 2 cm long
had developed in most of the seedlings. This radicle length is long enough to support the
seedling if it is transferred into aeroponics tanks. For experiments in soil, a germination
time of two days was used.
37
Growing conditions
The soil used in the experiments was Peter's Professional Potting Soil (Scotts-
Sierra Horticultural Products Co.). Individual seedlings were transplanted in pre-shaped
potting trays (60 seedlings/tray) or in small pots, 7.5 cm diameter, until well-established.
Pathogenicity experiments with Phytophthora and Colletotrichum were carried out
directly in these trays. As the potting soil contained sufficient amounts of
macronutrients and micronutrients to support the initial stages of development, slow
release fertilizers were added one month after potting. Micronutrients were added at
later stages (i.e. at 2 months). Pest control was limited to the control of fungal gnats and
whiteflies. For fungal gnats, a biological control formulation based on Bacillus
thuringiensis (Gnatrol) was added by drenching at the time of potting, with additional
applications at one-month intervals. After a two week period of establishment, the
plants were maintained with low water regimens. The low humidity in the soil usually
helped to keep the levels of fungal gnats under control and it also helped to prevent root
rot diseases. To control whiteflies, a detergent-based formulation (Safer Soap) was
sufficient to reduce the incidence of the pest. In cases of infestations, contact
insecticides such as Avid were combined with the soap as control measures. Preventive
measures such as yellow sticky traps that attract insects and help to monitor and reduce
the density of the whitefly were also used.
Growing plants inside growth rooms were exposed to 300 umol/m2/s of light
intensity with a photoperiod of 14 h of daylight and 10 h of darkness. The growth room
temperature was set to 22°C during the day and 18°C at night. The greenhouse
38
temperature was maintained below 30°C with the lowest relative humidity possible to
prevent sporadic downy mildew outbreaks. In cases of mildew infections, sulfur was
burned during the night to control the disease, and the flats and pots spaced to increase
the ventilation of the infected area. Lastly, infected tissues were removed.
Pathogen Growth Conditions
Alfalfa crown and root rot, caused by Phytophthora medicaginis
The isolate M2019, used for the experiments, was provided by Dr. Deborah
Samac (USDA ARS-Plant Science Research Unit, St. Paul, MN). Zoospores were
induced by transferring ten day old cultures growing on V8 agar at 22°C to a 28°C
incubator for two days. The cultures were then flooded with 20 ml distilled sterile water
and transferred to a 16°C incubator for 12-15 hours (120). Zoospore suspensions were
collected and quantified with a hemacytometer. Infection of 2-week-old seedlings was
achieved by flooding the experimental trays and evenly spreading the quantified
inoculum (1.5x10⁵ zoospores/ml) over the soil containing the plants. Negative control
treatments were prepared in the same way as the pathogenic treatments, using sterile
culture dishes as a mock inoculum source.
Flooding conditions were maintained for two days (120, 130). High soil
moisture levels were maintained in the soil, to allow continued disease development.
Starting 3-4 days after inoculation and for a period of two weeks, plants were counted
and disease symptoms rated daily, using the following standards:
39
No symptoms, 0; cotyledons affected (chlorosis) or stunting, 1; cotyledons
chlorotic/necrotic, monofoliate chlorotic, 2; trifoliate, monofoliate, cotyledons
(chlorotic/necrotic), 3; plant totally affected/wilting, 4; plant dead, 5.
The number of resistant plants was expressed as the average severity index (ASI)
(10, 153): ASI= [((n class 5 seeds) 5 + (n class 4) 4 + (n class 3) 3+ (n class 2) 2 + (n
class 1))*100 /(N*5)], where N is the total number of seeds expected to germinate from
a non-inoculated control (swollen seed – dead seed).
Pythium ultimum and P. irregularum
Cultures for both organisms were obtained from Dr. Charles Kenerley,
(Department of Plant Pathology and Microbiology at Texas A&M University). Acid-
treated and cold-conditioned M. truncatula seeds were planted in 3-day-old water-agar
dishes previously inoculated with the oomycete under study. The dishes were kept in the
dark at 20°C to stimulate seed germination. This temperature is critical to ensure seed
germination without induction of a virulent response in the pathogen. After 48 hours of
darkness, the dishes were transferred to a photoperiod of 14 h light and 10 h dark, with a
reduced temperature of 18 °C. The thickness and concentration of the water-agar was
crucial for this experiment. A17 seeds have normal tropisms and will grow towards
gravity and light. skl mutants are unable to efficiently penetrate typical agar
concentrations (2% or so), so a maximum 1% agar was used in all the experiments.
The rating system followed the recommendations of the Standard Tests for
Alfalfa cultivars (9-10, 15), as listed below: Resistant (1), healthy seedling; primary root
40
free of necrosis; slight discoloration may be present. Resistant (2), infected seedling;
primary root tip necrotic but firm. Moderately susceptible (3), infected seedling; primary
root tip soft and rotted. Susceptible, dead seedling (4), germinated seed with emerged
radicle rotted. Highly susceptible (5), dead seed; no germination at all, seed rotted.
The number of resistant plants was expressed as the average severity index
(ASI), calculated as Powell et al. and Altier et al. (10, 153): ASI= (((n class 5 seeds – N
dead seeds in germination control) 5 + (n class 4) 4 + (n class 3) 3+ (n class 2) 2 + (n
class 1))*100 /(N*5)), where N is the total number of seeds expected to germinate from
a non-inoculated control (swollen seed – dead seed).
Stem and leaf blight, caused by C. trifolii
The pathogen was generously provided by Dr. Nichole O’Neill, USDA-ARS,
Bellville MD. The isolate 2sp2 belongs to the race 1 of the pathogen. Suspensions of
conidia were prepared by flooding 7-day-old C. trifolii culture dishes (1/2 strength
oatmeal agar) with sterile water (132, 134-136). The conidia were quantified and
adjusted to 1x10⁶ CFU/ml and then sprayed to runoff on the leaves of 2-week-old
seedlings (±3ml/plant). Inoculated plants (60 plants/tray) were kept under humidomes to
maintain conditions of high humidity (95-100%) for 2 days to assure efficient
germination of the fungal propagules (132, 136). Disease symptoms were rated and
scored starting on the seventh day after inoculation as follows:
75-100 % survival, resistant. RR 50 - 75 % survival, moderately resistant. R 25 - 50 % survival, moderately susceptible. S 0 - 25 % susceptible. SS
41
Resistance and Susceptibility of M. truncatula Natural Populations to Infection by
P. medicaginis
The experimental design consisted of planting four different M. truncatula
ecotypes and two controls (A17 and skl) in single trays. Ten seedlings per
ecotype/genotype, totaling 60 seedlings/tray were used in each experiment. To comprise
the full collection of ecotypes surveyed a total of 24 trays were used. Each of the
genotypes tested was planted in randomized positions along the tray.
Nonetheless, a predetermined pattern for planting the seedlings of each ecotype
was used to facilitate the screening and the generation of infection patterns (Fig. 3).
Two weeks after planting, the trays were flooded and inoculated with a suspension of P.
medicaginis zoospores following the protocols previously presented. Disease symptoms
were rated as described. The consistency of the results was checked by replicated
experiments of resistant and susceptible ecotypes.
Geographical Location of M. truncatula’s Sources of Resistance and Susceptibility
to P. medicaginis
To determine if geographical origins were correlated with resistance of an
ecotype, the points of origin and their corresponding resistance to the pathogen were
plotted on a map. Each ecotype was color-coded according to its corresponding score
using the following system: resistant (0-40% disease) green, moderately resistant (41-
60% disease) yellow, moderately susceptible (61-80% disease) orange, and susceptible
(81-100% disease) red.
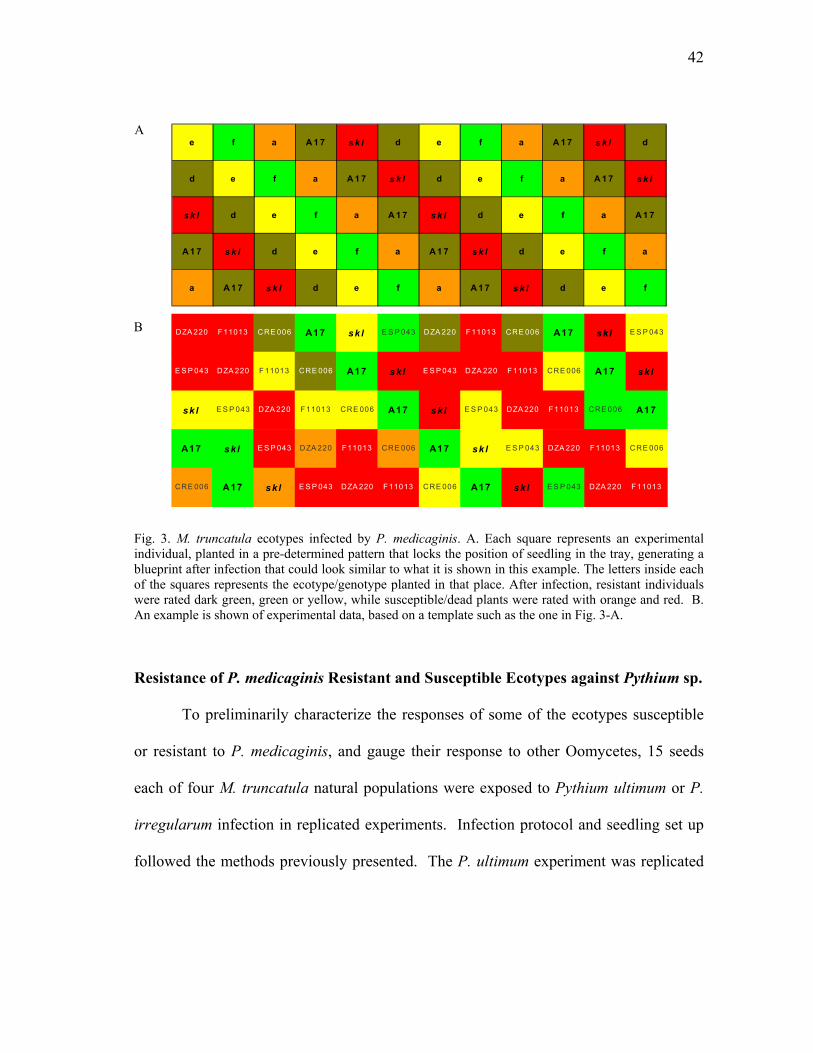
42
Fig. 3. M. truncatula ecotypes infected by P. medicaginis. A. Each square represents an experimental individual, planted in a pre-determined pattern that locks the position of seedling in the tray, generating a blueprint after infection that could look similar to what it is shown in this example. The letters inside each of the squares represents the ecotype/genotype planted in that place. After infection, resistant individuals were rated dark green, green or yellow, while susceptible/dead plants were rated with orange and red. B. An example is shown of experimental data, based on a template such as the one in Fig. 3-A. Resistance of P. medicaginis Resistant and Susceptible Ecotypes against Pythium sp.
To preliminarily characterize the responses of some of the ecotypes susceptible
or resistant to P. medicaginis, and gauge their response to other Oomycetes, 15 seeds
each of four M. truncatula natural populations were exposed to Pythium ultimum or P.
irregularum infection in replicated experiments. Infection protocol and seedling set up
followed the methods previously presented. The P. ultimum experiment was replicated
A
B
e f a A 1 7 s k l d e f a A 1 7 s k l d
d e f a A 1 7 s k l d e f a A 1 7 s k l
s k l d e f a A 1 7 s k l d e f a A 1 7
A 1 7 s k l d e f a A 1 7 s k l d e f a
a A 1 7 s k l d e f a A 1 7 s k l d e f
DZA 220 F11013 CRE 006 A17 sk l E S P 043 DZA 220 F 11013 CRE 006 A17 skl E S P 043
E S P 043 DZA 220 F 11013 CRE 006 A17 skl E S P 043 DZA 220 F11013 CRE 006 A17 sk l
sk l E S P 043 DZA 220 F 11013 CRE 006 A17 skl E S P 043 DZA 220 F11013 CRE 006 A17
A17 skl E S P 043 DZA 220 F11013 CRE 006 A17 sk l E S P 043 DZA 220 F 11013 CRE 006
CRE 006 A17 skl E S P 043 DZA 220 F11013 CRE 006 A17 sk l E S P 043 DZA 220 F 11013
43
three times while the P. irregularum experiment was replicated two times. The
populations studied were A17, skl, FRA20031, GRE065, DZA220 and DZA222.
RESULTS
Resistance and Susceptibility of M. truncatula Natural Populations to Infection by
P. medicaginis
The 96 populations were screened for resistance or susceptibility against P.
medicaginis, a range of responses varying from almost total immunity to P. medicaginis
infection to complete lack of resistance to the pathogen (Table 4, Fig. 4) was found. The
ecotypes showing the extreme responses, i.e. highly resistant like GRE065 and A17 or
highly susceptible like DZA222 and DZA220, were tested in two additional but
independently performed experiments for consistency of results; the results of both trials
were in agreement with what was previously observed (Fig. 5).
To test if the developmental status of the plant had an effect on its resistance to
the pathogen, correlation analysis between the severity indexes of the ecotypes against
their corresponding developmental status was performed. For the analysis, the size of
the plant represented the independent variable, whereas severity of infection was the
dependent variable. The statistical analysis showed that DZA220 had a correlation
coefficient of -0.149, FRA20031 had 0.328, A17, 0.091, skl, 0.003 and GRE065 had -
0.705. The observed results suggest that there is independence between parameters. The
complete results of the analyses are shown in Table 4. At the time of infection, all the
plants belonging to DZA222, had the same developmental status, showing full expansion
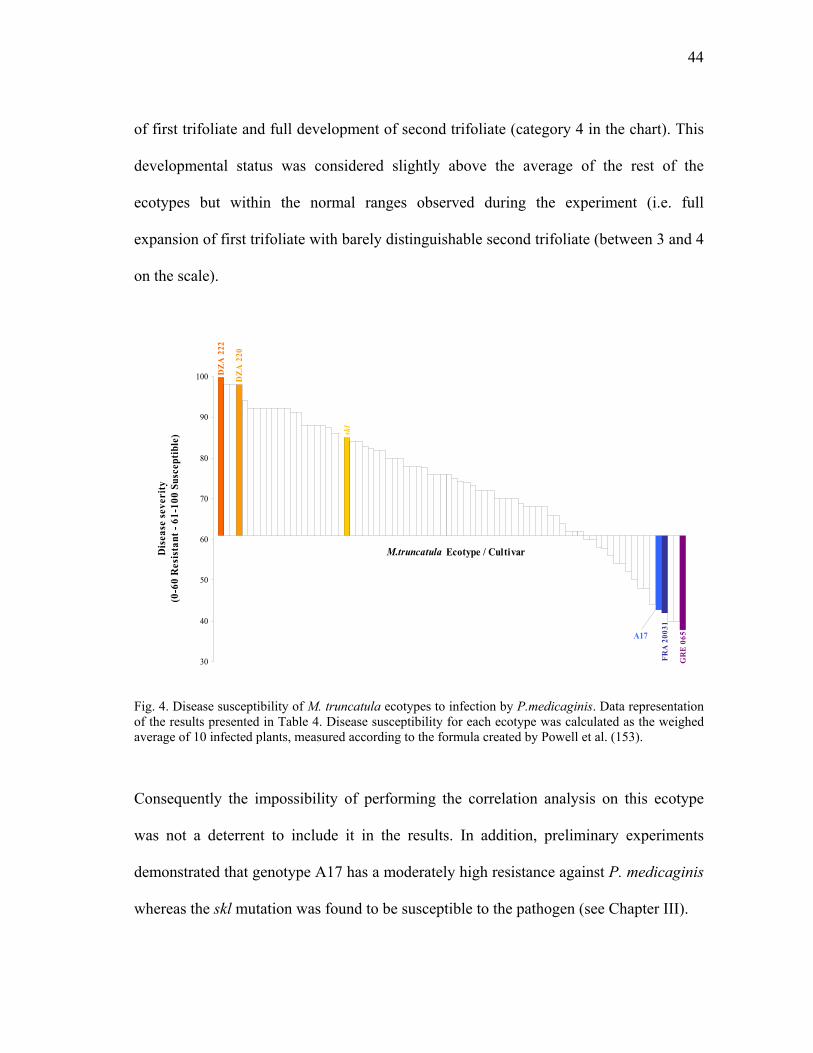
44
of first trifoliate and full development of second trifoliate (category 4 in the chart). This
developmental status was considered slightly above the average of the rest of the
ecotypes but within the normal ranges observed during the experiment (i.e. full
expansion of first trifoliate with barely distinguishable second trifoliate (between 3 and 4
on the scale).
DZA
222
DZA
220
skl
FRA
200
31
GR
E 0
65
30
40
50
60
70
80
90
100
M.truncatula Ecotype / CultivarDis
ease
seve
rity
(0-6
0 R
esis
tant
- 61
-100
Sus
cept
ible
)
A17
Fig. 4. Disease susceptibility of M. truncatula ecotypes to infection by P.medicaginis. Data representation of the results presented in Table 4. Disease susceptibility for each ecotype was calculated as the weighed average of 10 infected plants, measured according to the formula created by Powell et al. (153).
Consequently the impossibility of performing the correlation analysis on this ecotype
was not a deterrent to include it in the results. In addition, preliminary experiments
demonstrated that genotype A17 has a moderately high resistance against P. medicaginis
whereas the skl mutation was found to be susceptible to the pathogen (see Chapter III).
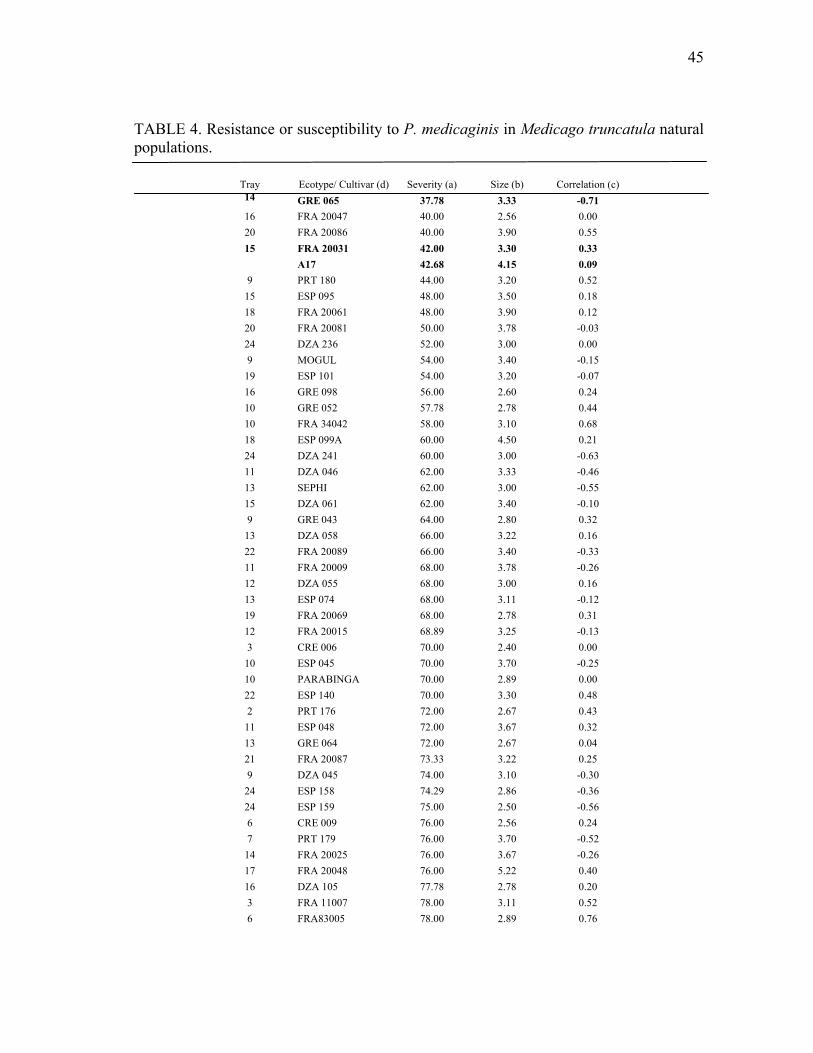
45
TABLE 4. Resistance or susceptibility to P. medicaginis in Medicago truncatula natural populations.
Tray Ecotype/ Cultivar (d) Severity (a) Size (b) Correlation (c) 14 GRE 065 37.78 3.33 -0.71 16 FRA 20047 40.00 2.56 0.00 20 FRA 20086 40.00 3.90 0.55 15 FRA 20031 42.00 3.30 0.33
A17 42.68 4.15 0.09 9 PRT 180 44.00 3.20 0.52
15 ESP 095 48.00 3.50 0.18 18 FRA 20061 48.00 3.90 0.12 20 FRA 20081 50.00 3.78 -0.03 24 DZA 236 52.00 3.00 0.00 9 MOGUL 54.00 3.40 -0.15
19 ESP 101 54.00 3.20 -0.07 16 GRE 098 56.00 2.60 0.24 10 GRE 052 57.78 2.78 0.44 10 FRA 34042 58.00 3.10 0.68 18 ESP 099A 60.00 4.50 0.21 24 DZA 241 60.00 3.00 -0.63 11 DZA 046 62.00 3.33 -0.46 13 SEPHI 62.00 3.00 -0.55 15 DZA 061 62.00 3.40 -0.10 9 GRE 043 64.00 2.80 0.32
13 DZA 058 66.00 3.22 0.16 22 FRA 20089 66.00 3.40 -0.33 11 FRA 20009 68.00 3.78 -0.26 12 DZA 055 68.00 3.00 0.16 13 ESP 074 68.00 3.11 -0.12 19 FRA 20069 68.00 2.78 0.31 12 FRA 20015 68.89 3.25 -0.13 3 CRE 006 70.00 2.40 0.00
10 ESP 045 70.00 3.70 -0.25 10 PARABINGA 70.00 2.89 0.00 22 ESP 140 70.00 3.30 0.48 2 PRT 176 72.00 2.67 0.43
11 ESP 048 72.00 3.67 0.32 13 GRE 064 72.00 2.67 0.04 21 FRA 20087 73.33 3.22 0.25 9 DZA 045 74.00 3.10 -0.30
24 ESP 158 74.29 2.86 -0.36 24 ESP 159 75.00 2.50 -0.56 6 CRE 009 76.00 2.56 0.24 7 PRT 179 76.00 3.70 -0.52
14 FRA 20025 76.00 3.67 -0.26 17 FRA 20048 76.00 5.22 0.40 16 DZA 105 77.78 2.78 0.20 3 FRA 11007 78.00 3.11 0.52 6 FRA83005 78.00 2.89 0.76
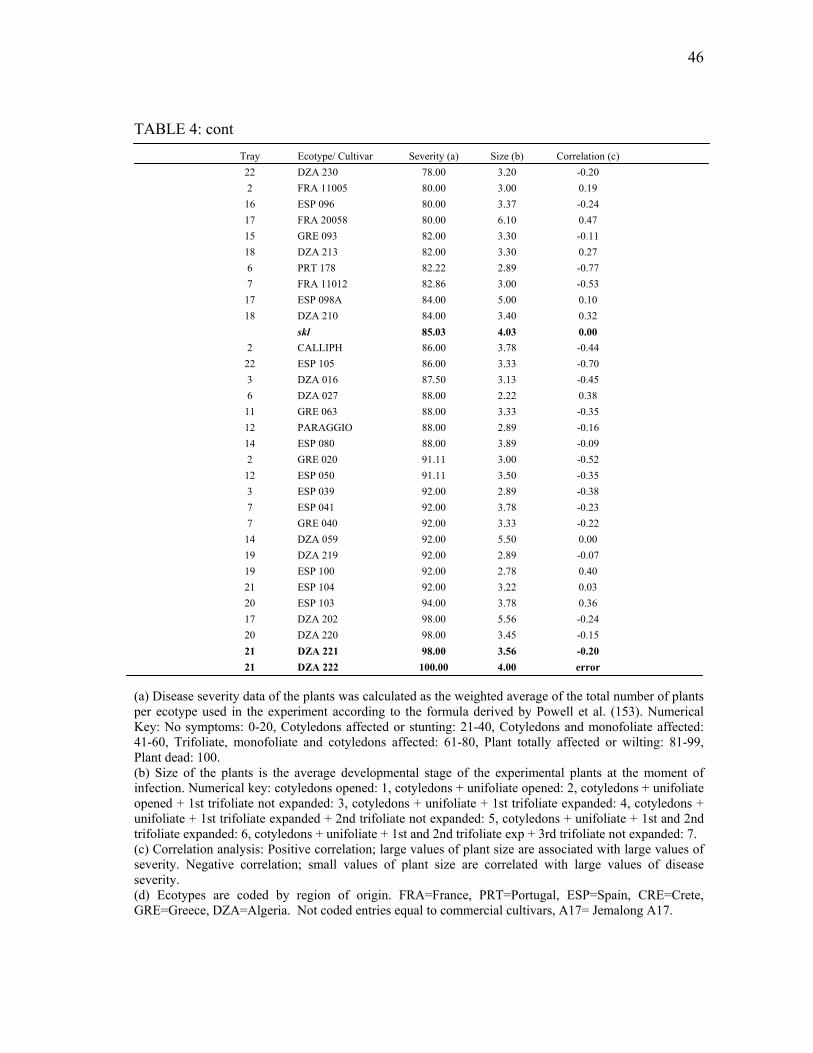
46
TABLE 4: cont
Tray Ecotype/ Cultivar Severity (a) Size (b)
Correlation (c) 22 DZA 230 78.00 3.20 -0.20 2 FRA 11005 80.00 3.00 0.19
16 ESP 096 80.00 3.37 -0.24 17 FRA 20058 80.00 6.10 0.47 15 GRE 093 82.00 3.30 -0.11 18 DZA 213 82.00 3.30 0.27 6 PRT 178 82.22 2.89 -0.77 7 FRA 11012 82.86 3.00 -0.53
17 ESP 098A 84.00 5.00 0.10 18 DZA 210 84.00 3.40 0.32
skl 85.03 4.03 0.00 2 CALLIPH 86.00 3.78 -0.44
22 ESP 105 86.00 3.33 -0.70 3 DZA 016 87.50 3.13 -0.45 6 DZA 027 88.00 2.22 0.38
11 GRE 063 88.00 3.33 -0.35 12 PARAGGIO 88.00 2.89 -0.16 14 ESP 080 88.00 3.89 -0.09 2 GRE 020 91.11 3.00 -0.52
12 ESP 050 91.11 3.50 -0.35 3 ESP 039 92.00 2.89 -0.38 7 ESP 041 92.00 3.78 -0.23 7 GRE 040 92.00 3.33 -0.22
14 DZA 059 92.00 5.50 0.00 19 DZA 219 92.00 2.89 -0.07 19 ESP 100 92.00 2.78 0.40 21 ESP 104 92.00 3.22 0.03 20 ESP 103 94.00 3.78 0.36 17 DZA 202 98.00 5.56 -0.24 20 DZA 220 98.00 3.45 -0.15 21 DZA 221 98.00 3.56 -0.20 21 DZA 222 100.00 4.00 error
(a) Disease severity data of the plants was calculated as the weighted average of the total number of plants per ecotype used in the experiment according to the formula derived by Powell et al. (153). Numerical Key: No symptoms: 0-20, Cotyledons affected or stunting: 21-40, Cotyledons and monofoliate affected: 41-60, Trifoliate, monofoliate and cotyledons affected: 61-80, Plant totally affected or wilting: 81-99, Plant dead: 100. (b) Size of the plants is the average developmental stage of the experimental plants at the moment of infection. Numerical key: cotyledons opened: 1, cotyledons + unifoliate opened: 2, cotyledons + unifoliate opened + 1st trifoliate not expanded: 3, cotyledons + unifoliate + 1st trifoliate expanded: 4, cotyledons + unifoliate + 1st trifoliate expanded + 2nd trifoliate not expanded: 5, cotyledons + unifoliate + 1st and 2nd trifoliate expanded: 6, cotyledons + unifoliate + 1st and 2nd trifoliate exp + 3rd trifoliate not expanded: 7. (c) Correlation analysis: Positive correlation; large values of plant size are associated with large values of severity. Negative correlation; small values of plant size are correlated with large values of disease severity. (d) Ecotypes are coded by region of origin. FRA=France, PRT=Portugal, ESP=Spain, CRE=Crete, GRE=Greece, DZA=Algeria. Not coded entries equal to commercial cultivars, A17= Jemalong A17.
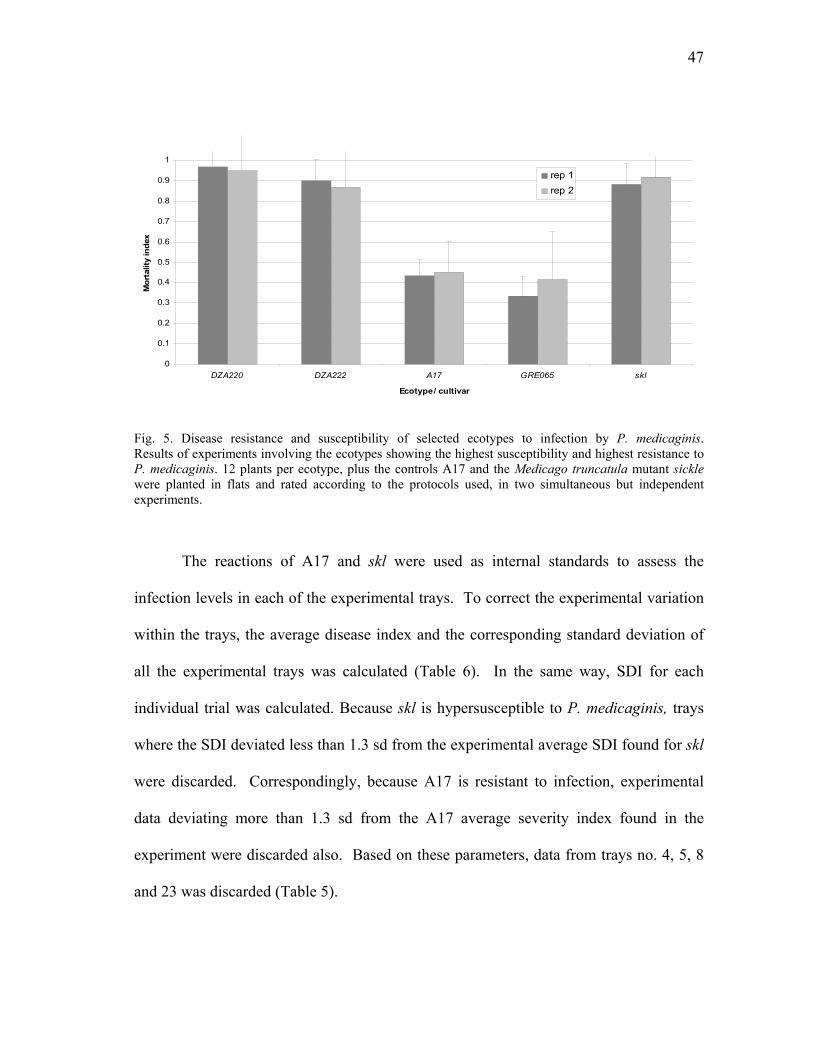
47
0
0.1
0.2
0.3
0.4
0.5
0.6
0.7
0.8
0.9
1
DZA220 DZA222 A17 GRE065 skl
Ecotype/ cultivar
Mor
talit
y in
dex
rep 1rep 2
Fig. 5. Disease resistance and susceptibility of selected ecotypes to infection by P. medicaginis. Results of experiments involving the ecotypes showing the highest susceptibility and highest resistance to P. medicaginis. 12 plants per ecotype, plus the controls A17 and the Medicago truncatula mutant sickle were planted in flats and rated according to the protocols used, in two simultaneous but independent experiments.
The reactions of A17 and skl were used as internal standards to assess the
infection levels in each of the experimental trays. To correct the experimental variation
within the trays, the average disease index and the corresponding standard deviation of
all the experimental trays was calculated (Table 6). In the same way, SDI for each
individual trial was calculated. Because skl is hypersusceptible to P. medicaginis, trays
where the SDI deviated less than 1.3 sd from the experimental average SDI found for skl
were discarded. Correspondingly, because A17 is resistant to infection, experimental
data deviating more than 1.3 sd from the A17 average severity index found in the
experiment were discarded also. Based on these parameters, data from trays no. 4, 5, 8
and 23 was discarded (Table 5).
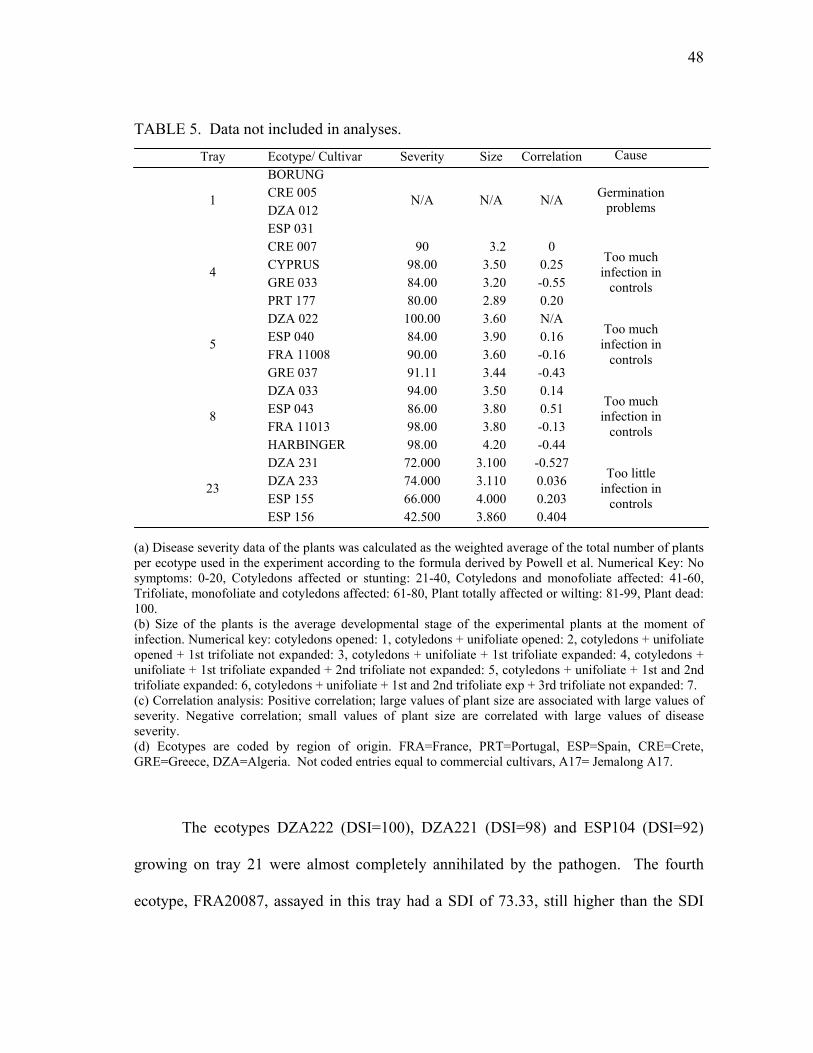
48
TABLE 5. Data not included in analyses.
(a) Disease severity data of the plants was calculated as the weighted average of the total number of plants per ecotype used in the experiment according to the formula derived by Powell et al. Numerical Key: No symptoms: 0-20, Cotyledons affected or stunting: 21-40, Cotyledons and monofoliate affected: 41-60, Trifoliate, monofoliate and cotyledons affected: 61-80, Plant totally affected or wilting: 81-99, Plant dead: 100. (b) Size of the plants is the average developmental stage of the experimental plants at the moment of infection. Numerical key: cotyledons opened: 1, cotyledons + unifoliate opened: 2, cotyledons + unifoliate opened + 1st trifoliate not expanded: 3, cotyledons + unifoliate + 1st trifoliate expanded: 4, cotyledons + unifoliate + 1st trifoliate expanded + 2nd trifoliate not expanded: 5, cotyledons + unifoliate + 1st and 2nd trifoliate expanded: 6, cotyledons + unifoliate + 1st and 2nd trifoliate exp + 3rd trifoliate not expanded: 7. (c) Correlation analysis: Positive correlation; large values of plant size are associated with large values of severity. Negative correlation; small values of plant size are correlated with large values of disease severity. (d) Ecotypes are coded by region of origin. FRA=France, PRT=Portugal, ESP=Spain, CRE=Crete, GRE=Greece, DZA=Algeria. Not coded entries equal to commercial cultivars, A17= Jemalong A17.
The ecotypes DZA222 (DSI=100), DZA221 (DSI=98) and ESP104 (DSI=92)
growing on tray 21 were almost completely annihilated by the pathogen. The fourth
ecotype, FRA20087, assayed in this tray had a SDI of 73.33, still higher than the SDI
Tray Ecotype/ Cultivar Severity Size Correlation Cause BORUNG CRE 005 DZA 012
1
ESP 031
N/A N/A N/A Germination problems
CRE 007 90 3.2 0 CYPRUS 98.00 3.50 0.25 GRE 033 84.00 3.20 -0.55
4
PRT 177 80.00 2.89 0.20
Too much infection in
controls
DZA 022 100.00 3.60 N/A ESP 040 84.00 3.90 0.16 FRA 11008 90.00 3.60 -0.16
5
GRE 037 91.11 3.44 -0.43
Too much infection in
controls
DZA 033 94.00 3.50 0.14 ESP 043 86.00 3.80 0.51 FRA 11013 98.00 3.80 -0.13
8
HARBINGER 98.00 4.20 -0.44
Too much infection in
controls
DZA 231 72.000 3.100 -0.527 DZA 233 74.000 3.110 0.036 ESP 155 66.000 4.000 0.203
23
ESP 156 42.500 3.860 0.404
Too little infection in
controls

49
observed for the internal controls growing in the tray. The SDI values observed for tray
21 suggest susceptibility to the pathogen. Replicated experiments involving DZA222
yielded the same high susceptibility to P. medicaginis (Fig. 5). Interestingly, a close
look at Table 6 suggests that data from tray 21 should have been similarly discarded. In
that tray, the SDI for A17 was 8 and for skl was 60. Both of these averages were below
the expected averages and out of the cut off ranges employed, suggesting underinfection
of the experimental plants, but clearly the observed results suggest that the ecotypes
growing on the tray were not affected by the lack of infection found for both controls
(skl and A17) and therefore they were not discarded.
Geographical Location of M. truncatula’s Sources of Resistance and Susceptibility
to P. medicaginis
The ecotypes used in the previous experiment are accompanied by extensive
documentation, including information regarding the precise geographical location of
their origin. In cases where resistance against P. medicaginis represents adaptive
variation, one might expect to find geographical pockets of resistant ecotypes. To test
this hypothesis, the geographical origin of each ecotype was plotted on a map.
As shown in Fig. 6, a cluster of resistant ecotypes was identified in the French
island of Corsica, whereas a cluster of susceptible ecotypes was identified in Algeria.
Interestingly, the African populations seem to change from moderately resistant for
those located near the Mediterranean coast, almost at the same longitude of Corsica, to
susceptible, the farther they are found from this location.
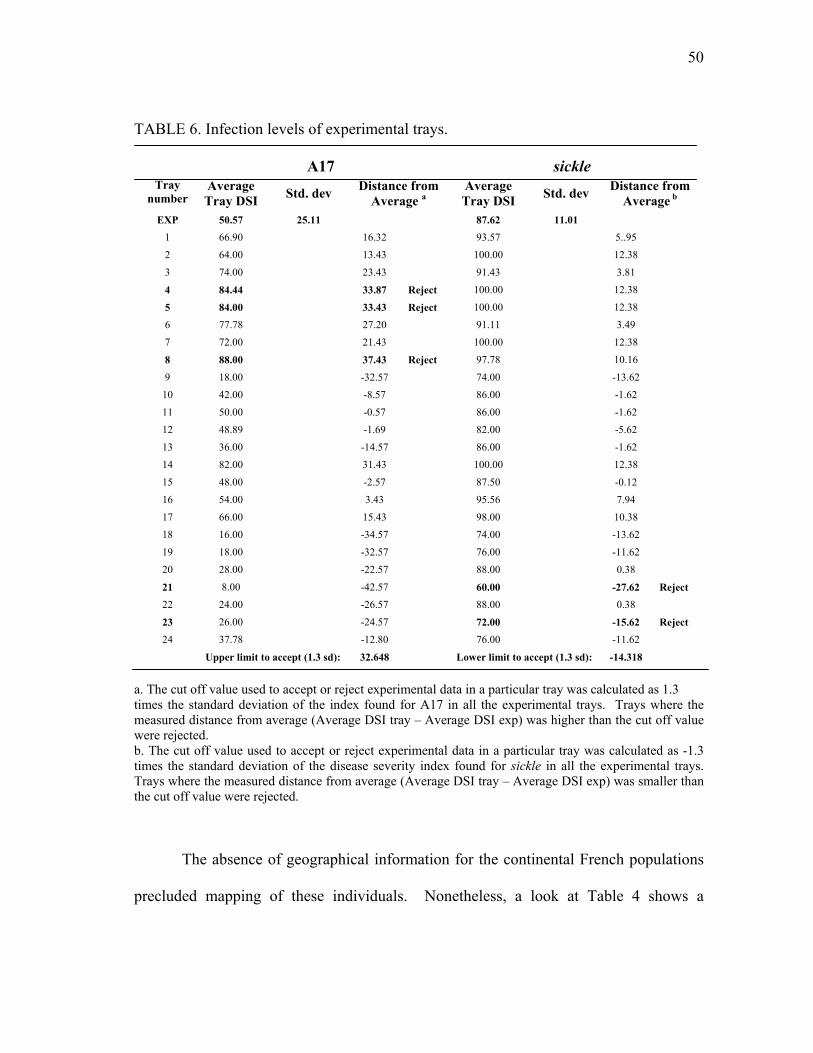
50
TABLE 6. Infection levels of experimental trays.
a. The cut off value used to accept or reject experimental data in a particular tray was calculated as 1.3 times the standard deviation of the index found for A17 in all the experimental trays. Trays where the measured distance from average (Average DSI tray – Average DSI exp) was higher than the cut off value were rejected. b. The cut off value used to accept or reject experimental data in a particular tray was calculated as -1.3 times the standard deviation of the disease severity index found for sickle in all the experimental trays. Trays where the measured distance from average (Average DSI tray – Average DSI exp) was smaller than the cut off value were rejected.
The absence of geographical information for the continental French populations
precluded mapping of these individuals. Nonetheless, a look at Table 4 shows a
A17 sickle Tray
number Average Tray DSI Std. dev Distance from
Average a Average Tray DSI Std. dev Distance from
Average b EXP 50.57 25.11 87.62 11.01
1 66.90 16.32 93.57 5..95
2 64.00 13.43 100.00 12.38
3 74.00 23.43 91.43 3.81
4 84.44 33.87 Reject 100.00 12.38
5 84.00 33.43 Reject 100.00 12.38
6 77.78 27.20 91.11 3.49
7 72.00 21.43 100.00 12.38
8 88.00 37.43 Reject 97.78 10.16
9 18.00 -32.57 74.00 -13.62
10 42.00 -8.57 86.00 -1.62
11 50.00 -0.57 86.00 -1.62
12 48.89 -1.69 82.00 -5.62
13 36.00 -14.57 86.00 -1.62
14 82.00 31.43 100.00 12.38
15 48.00 -2.57 87.50 -0.12
16 54.00 3.43 95.56 7.94
17 66.00 15.43 98.00 10.38
18 16.00 -34.57 74.00 -13.62
19 18.00 -32.57 76.00 -11.62
20 28.00 -22.57 88.00 0.38
21 8.00 -42.57 60.00 -27.62 Reject 22 24.00 -26.57 88.00 0.38
23 26.00 -24.57 72.00 -15.62 Reject 24 37.78 -12.80 76.00 -11.62
Upper limit to accept (1.3 sd): 32.648 Lower limit to accept (1.3 sd): -14.318
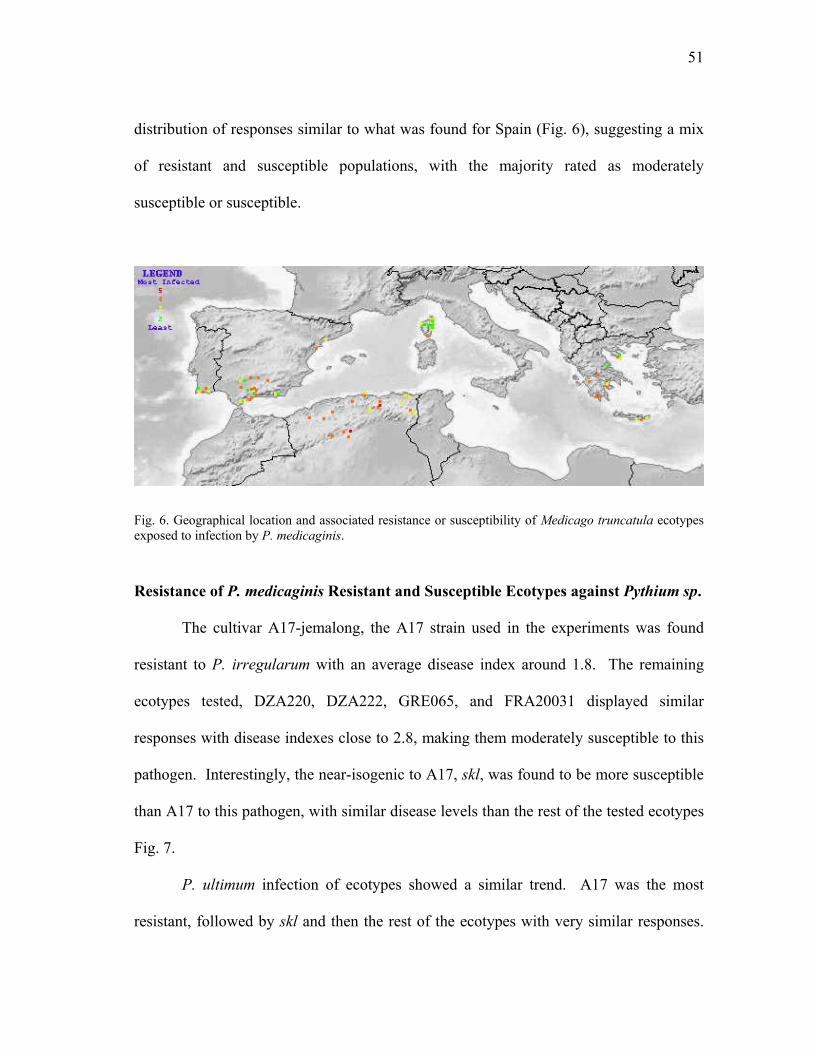
51
distribution of responses similar to what was found for Spain (Fig. 6), suggesting a mix
of resistant and susceptible populations, with the majority rated as moderately
susceptible or susceptible.
Fig. 6. Geographical location and associated resistance or susceptibility of Medicago truncatula ecotypes exposed to infection by P. medicaginis.
Resistance of P. medicaginis Resistant and Susceptible Ecotypes against Pythium sp.
The cultivar A17-jemalong, the A17 strain used in the experiments was found
resistant to P. irregularum with an average disease index around 1.8. The remaining
ecotypes tested, DZA220, DZA222, GRE065, and FRA20031 displayed similar
responses with disease indexes close to 2.8, making them moderately susceptible to this
pathogen. Interestingly, the near-isogenic to A17, skl, was found to be more susceptible
than A17 to this pathogen, with similar disease levels than the rest of the tested ecotypes
Fig. 7.
P. ultimum infection of ecotypes showed a similar trend. A17 was the most
resistant, followed by skl and then the rest of the ecotypes with very similar responses.
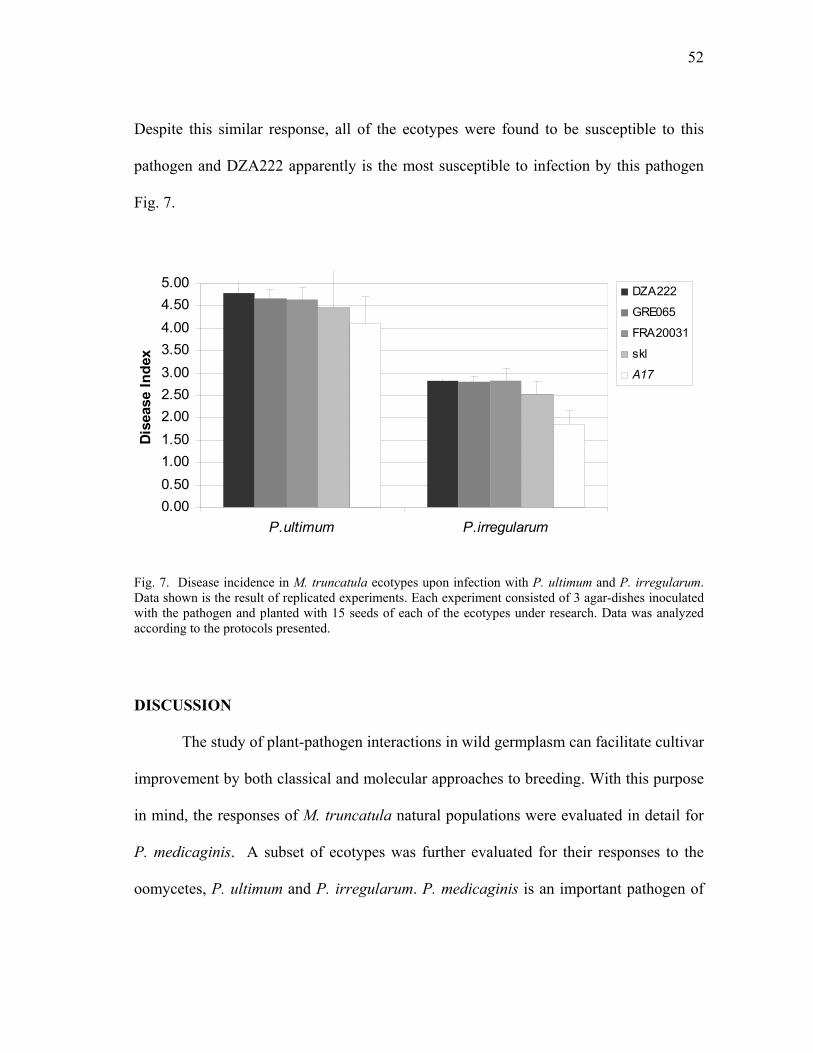
52
Despite this similar response, all of the ecotypes were found to be susceptible to this
pathogen and DZA222 apparently is the most susceptible to infection by this pathogen
Fig. 7.
0.000.501.001.502.002.503.003.504.004.505.00
P.ultimum P.irregularum
Dis
ease
Inde
x
DZA222
GRE065
FRA20031
skl
A17
Fig. 7. Disease incidence in M. truncatula ecotypes upon infection with P. ultimum and P. irregularum. Data shown is the result of replicated experiments. Each experiment consisted of 3 agar-dishes inoculated with the pathogen and planted with 15 seeds of each of the ecotypes under research. Data was analyzed according to the protocols presented.
DISCUSSION
The study of plant-pathogen interactions in wild germplasm can facilitate cultivar
improvement by both classical and molecular approaches to breeding. With this purpose
in mind, the responses of M. truncatula natural populations were evaluated in detail for
P. medicaginis. A subset of ecotypes was further evaluated for their responses to the
oomycetes, P. ultimum and P. irregularum. P. medicaginis is an important pathogen of

53
alfalfa and Pythium species are major seed pathogens of a wide range of plants. Based
on these analyses, the potential resistant ecotypes to these pathogens were defined.
The response of M. truncatula ecotypes to P. medicaginis was examined in
greatest detail. To reduce the chance of artificially labeling well developed plants as
resistant ecotypes and small or poorly developed plants as susceptible, correlation
analysis between the developmental stage of the plant at the moment of infection and its
corresponding disease index after infection were performed. This was an important
point because in aeroponics assays it was observed that A17 plants infected with P.
medicaginis developed secondary roots to replace the loss of infected roots. This
secondary defense response correlated with the extent of plant development and could
skew the experimental results. The results of the cases where the correlation between
the two parameters was high (-.95 or more), suggesting that well-developed plants
correlated with low disease levels, were discarded. Experimental results were also
removed from analysis when their correlation showed that small, poorly developed
plants could statistically be linked with high levels of disease.
To normalize disease ratings between assays, the M. truncatula mutant skl was
used as a positive control for infection. skl is impaired in its defense response to
Oomycete pathogens. Near isogenic A17 was used as the resistant cultivar control. In
some cases, the disease severity ratings observed for both control genotypes differ from
what was expected. Localized differences in the flooding levels of the experimental
trays during the inoculation stages of the experiment and changes in the viability of the
quantified inoculum prior to infection could explain these results. Particular trays

54
yielded quite low infection rates, while other trays resulted in almost total plant death
(Table 6). To minimize that experimental variation, any tray departing more than 1.3
standard deviation units from the average disease rating was removed from the analysis.
This was accomplished by comparing the disease ratings of each individual tray to the
experimental average disease rating of all the trays using the formula presented by Altier
and Thies (9).
An interesting experimental result of this analysis was obtained in tray number
21 (Table 6). In this tray the average disease index for A17 and skl was lower than the
observed average of all the trays suggesting under-infection of the experimental plants.
Nonetheless, the ecotypes growing in this tray were almost completely killed by the
pathogen clearly showing susceptibility to P. medicaginis (Table 4). The disease
symptoms observed for these ecotypes (i.e. DZA222, DZA221, ESP104 and FRA20087)
did not suggest contamination with any other pathogen. The developmental status and
correlation coefficients for these ecotypes similarly did not imply any problems affecting
the plants or skewing of the results (Table 4). Furthermore, replicated experiments
involving DZA222 and P. medicaginis showed again the high susceptibility of this
ecotype to the pathogen (Fig. 5), further reinforcing the conviction that genetic
susceptibility to the pathogen in these ecotypes was behind the results. If the results in
this tray were to be rejected, the reason for the rejection would have been the low
infection level of controls. A look at Tables 5 and 6 shows that the expected patterns for
rejection of data holds in the remaining cases (i.e. too much infection in controls
correlates with high SDI in the ecotypes growing in the trays and vice versa). In this

55
case, the pattern is totally the opposite. The ecotype data for tray 21 did not correlate
with the low infection of the controls and the rejection of this data would imply the
faulty not labeling of a negative result as negative, a parameter that these analyses were
not intended for. In statistical terms, I could have configured a hypotheses error of the ß
type.
A positive outcome of the findings of these screens is that breeding programs and
studies aiming to find the genetic basis for disease resistance against P. medicaginis can
be initiated using the resistant and susceptible ecotypes identified here. Of particular
interest was the identification of putative geographical centers of resistance and
susceptibility (Fig. 5). Ecotypes isolated from Corsica appear to be more resistant to
infection than, for example, ecotypes isolated from Algeria, which showed the highest
susceptibility to this pathogen. Further experiments involving nearest neighbor analysis
should clarify this hypothesis. Determining the genetic basis of these resistance
phenotypes and monitoring the frequency and distribution of functionally defined alleles
would allow a population level study of these Medicago-Phytophthora interactions.
Preliminary experimentation has also been done to test the responses of a subset of
ecotypes to infection by Pythium species. In the case of P. ultimum, the results suggest
that this pathogen is extremely virulent to M. truncatula. Conversely, the P. irregularum
results suggest that moderate resistance to this pathogen is present in the ecotypes. It is
possible that part of the observed results can be explained on the basis of the host
developmental status. In this research, the development of P. irregularum was slower
than P. ultimum, allowing longer development of the seedlings used in the experiment.
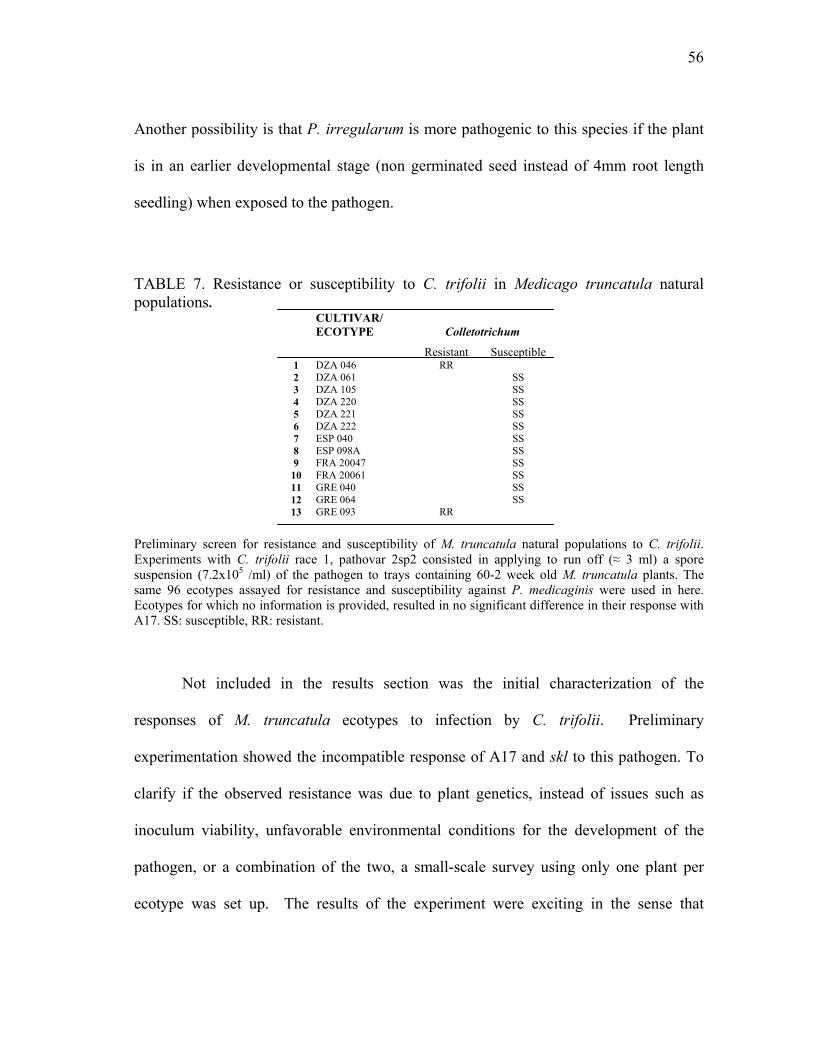
56
Another possibility is that P. irregularum is more pathogenic to this species if the plant
is in an earlier developmental stage (non germinated seed instead of 4mm root length
seedling) when exposed to the pathogen.
TABLE 7. Resistance or susceptibility to C. trifolii in Medicago truncatula natural populations.
Preliminary screen for resistance and susceptibility of M. truncatula natural populations to C. trifolii. Experiments with C. trifolii race 1, pathovar 2sp2 consisted in applying to run off (≈ 3 ml) a spore suspension (7.2x10⁵ /ml) of the pathogen to trays containing 60-2 week old M. truncatula plants. The same 96 ecotypes assayed for resistance and susceptibility against P. medicaginis were used in here. Ecotypes for which no information is provided, resulted in no significant difference in their response with A17. SS: susceptible, RR: resistant.
Not included in the results section was the initial characterization of the
responses of M. truncatula ecotypes to infection by C. trifolii. Preliminary
experimentation showed the incompatible response of A17 and skl to this pathogen. To
clarify if the observed resistance was due to plant genetics, instead of issues such as
inoculum viability, unfavorable environmental conditions for the development of the
pathogen, or a combination of the two, a small-scale survey using only one plant per
ecotype was set up. The results of the experiment were exciting in the sense that
CULTIVAR/ ECOTYPE Colletotrichum
Resistant Susceptible
1 DZA 046 RR 2 DZA 061 SS 3 DZA 105 SS 4 DZA 220 SS 5 DZA 221 SS 6 DZA 222 SS 7 ESP 040 SS 8 ESP 098A SS 9 FRA 20047 SS 10 FRA 20061 SS 11 GRE 040 SS 12 GRE 064 SS 13 GRE 093 RR
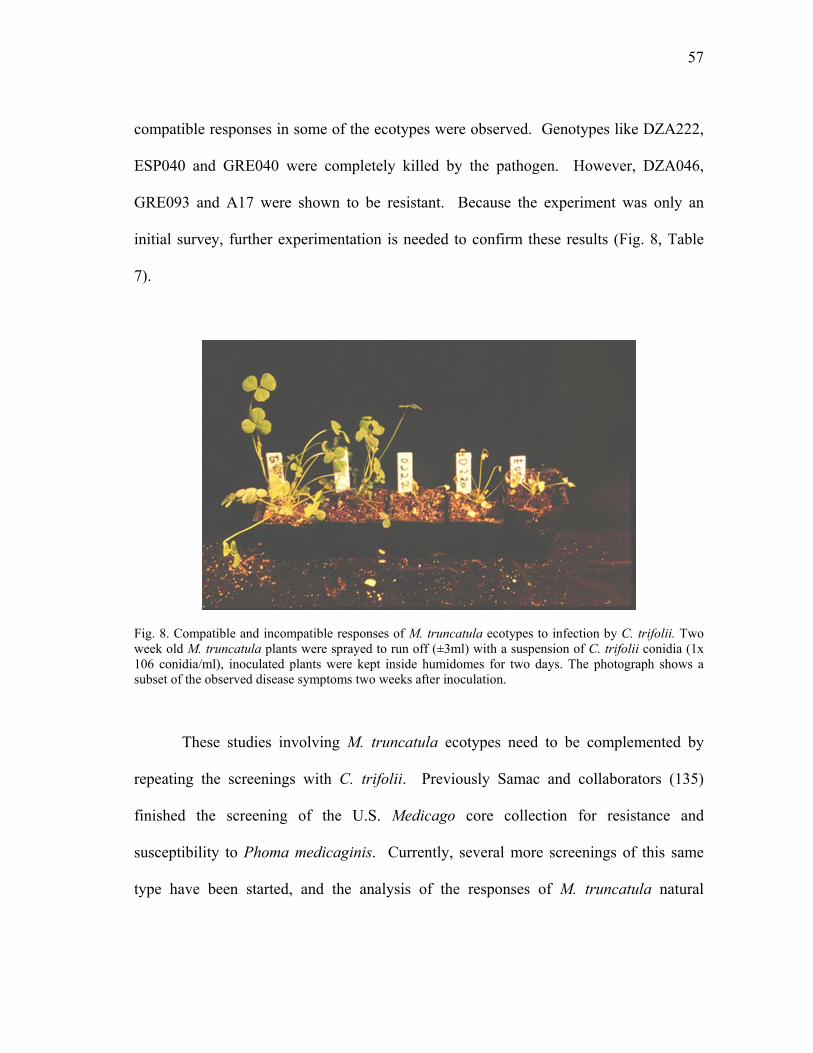
57
compatible responses in some of the ecotypes were observed. Genotypes like DZA222,
ESP040 and GRE040 were completely killed by the pathogen. However, DZA046,
GRE093 and A17 were shown to be resistant. Because the experiment was only an
initial survey, further experimentation is needed to confirm these results (Fig. 8, Table
7).
Fig. 8. Compatible and incompatible responses of M. truncatula ecotypes to infection by C. trifolii. Two week old M. truncatula plants were sprayed to run off (±3ml) with a suspension of C. trifolii conidia (1x 10⁶ conidia/ml), inoculated plants were kept inside humidomes for two days. The photograph shows a subset of the observed disease symptoms two weeks after inoculation.
These studies involving M. truncatula ecotypes need to be complemented by
repeating the screenings with C. trifolii. Previously Samac and collaborators (135)
finished the screening of the U.S. Medicago core collection for resistance and
susceptibility to Phoma medicaginis. Currently, several more screenings of this same
type have been started, and the analysis of the responses of M. truncatula natural

58
populations to important pathogens and pests, like the nematode Meloidogyne incognita,
the fastidious bacterium Xyllela fastidiosa, the parasitic plant Cuscuta trifolii (dodder)
and the economically important pest Hypera postica (alfalfa weevil) are on their way
(D.R. Cook, personal communication). Similar screenings involving aphids and other
fungal pathogens are currently being done (188).
59
CHAPTER III
AN ETHYLENE INSENSITIVE MUTANT OF MEDICAGO
TRUNCATULA IS HYPER-SUSCEPTIBLE TO PHYTOPHTHORA
MEDICAGINIS
SUMMARY
In recent years, studies of the legume-Rhizobium interaction have expanded to
include the analysis of plant mutants defective in symbiotic development. Such studies
provide the basis for understanding developmental and regulatory pathways involved in
nitrogen fixation interactions. One such mutant is the Medicago truncatula hyper-
nodulation mutant sickle (skl), which shows increased infection by Sinhorhizobium
meliloti, the natural nitrogen fixing symbiont of this plant. The skl mutation is recessive
and confers insensitivity to the plant hormone ethylene.
Here it is shown that skl also displays an increased susceptibility to infection by
pathogenic organisms, particularly oomycetes. The coincidence of these phenotypes in
skl mutation (i.e. symbiosis, disease susceptibility and ethylene insensitivity) creates an
opportunity to study the commonalities between genetic control of infection by
symbiotic and pathogenic microorganisms, in particular those dependent on the
perception of the plant hormone ethylene.
60
INTRODUCTION
Several Ethyl MethaneSulfonate (EMS) mutagenized populations of M.
truncatula cultivar A17 have been screened for their symbiotic interaction with nitrogen
fixing microorganisms, specifically the symbiotic bacteria S. meliloti (38). From these
screenings, two sets of mutant plants were initially identified and are being studied. The
first subset showed a phenotype characterized by a lack of development of nitrogen
fixing root nodules, whereas the second subset showed a higher than usual number of
nodules on inoculated roots. From the first group mutations such as Does not Make
Infections1 (dmi1), dmi2 and dmi3 have been characterized and recently cloned (11, 30,
54, 121).
From the second subset of plants, two mutants, Super Numeric Nodules (sunn)
and SicKLe (skl), were identified (146,148). Phenotypic and physiological analysis of
skl plants demonstrated that they are pleiotropic for delayed petal and leaf senescence.
In addition, skl showed decreased abscission of seedpods and leaves, and was hyper-
infected by symbiotic bacteria, allowing approximately 10 times the normal number of
persistent infections in the plant. As a consequence, skl plants showed an increased
number of symbiotic nodules. Genetic analysis of the sickle mutation demonstrated that
these phenotypes are conferred by a single, recessive gene (150).
Sickle seedlings exposed to ethylene failed to produce the typical triple response
observed in A17 plants. The triple response is an ethylene dependent response
characterized by decreased elongation of hypocotyls and roots, and an exaggerated
apical hook in response to exogenous ethylene (174). Exposure of A17 or skl plants to
61
either ACC or ethylene gas showed that nodulation of A17 was effectively blocked by
both compounds, whereas the nodulation of the mutant skl was insensitive to these
treatments. ACC is the immediate precursor of ethylene and skl insensitivity to this
compound was observed even at the high dose of 300µM ACC (10x higher than the
ED50, for A17 plants) (146). Overall, these data supported the hypothesis of skl
involvement in ethylene perception or transduction of ethylene-derived plant signals.
Cloning of skl mutation was recently achieved and it was shown to have homology to the
A. thaliana EIN2 gene (manuscript under preparation). Therefore, skl has been
hypothesized to act in the ethylene perception pathway in a similar way as the
Arabidopsis thaliana mutant ein2 (Dr. D. Cook personal communication). On the other
hand, sunn plants showed a similar increase in the number of symbiotic nodules, with
root insensitivity to the hormone ethylene. Despite the similarities between both
mutations, genetic analysis suggested that skl and sunn correspond to different unlinked
loci and furthermore, define separate genetic pathways that control nodule number and
organogenesis processes upon infection with S. meliloti in M. truncatula (148).
To study the commonalities between genetic control of infection by symbiotic
and pathogenic microorganisms, seedlings of three of these mutants (dmi1, skl and sunn)
were exposed to zoospores or mycelia of Phytophthora medicaginis. The results showed
that skl mutant was more susceptible than A17 to infection by this pathogen. On the
other hand, the responses of dmi1 and sunn were not different from the infected A17
control, the genotype A17 (results not shown). Parallel analysis indicated that skl
mutants were not altered in their gross response to arbuscular mycorrhizal fungi (Dr.
62
Maria Harrison, personal communication). skl was also unaltered in its response to the
nematode pathogen Meloidogyne incognita (Dr. H. Zhu, personal communication) and to
the fungal pathogens Fusarium oxisporum and Rhizoctonia solani (data not shown).
Taken together, the data suggest that ethylene signaling is a common feature of defense
against oomycete pathogens and regulation of infection by Sinorhizobium meliloti.
MATERIALS AND METHODS
Plant and Pathogen Growth Conditions
M. truncatula seed scarification and germination, preparation of aeroponic tanks
and soil trays and growing conditions for experimental plants followed the protocols
presented by Cook et al. (37). P. medicaginis cultures were grown as presented in
Chapter II to induce zoospore production. The inoculum was quantified using
hemacytometers and adjusted to 1.5x10⁵ zoospores/ml. P. ultimum and P. irregularum
were grown initially on corn meal agar at 23°C. 5-day-old colonized corn-meal agar
pegs were then transferred to water-agar dishes (0.8 %). 3-day-old infected water-agar
dishes were used as source of infection for experiments involving P. ultimum, and 5-day-
old dishes were used with P. irregularum. Conidia of C. trifolii were prepared as
previously presented in Chapter II.
M. truncatula Infection by P. medicaginis, Soil Experiments
Inoculation of M. truncatula plants with P. medicaginis was performed by flooding 2-
week-old plants growing in trays with water and evenly distributing the quantified
63
inoculum in the flooded tray. To achieve this, the inoculum was diluted in 1 L of water
and then evenly distributed on the soil contained in the tray. To assure zoospore
germination and pathogen localization of the host, flooding conditions were maintained
for 2 days (120,130).
Soil experiments to characterize P. medicaginis infection of the skl mutation
were conducted in 50 cm x 30 cm trays, planted with 60 seeds of either skl or A17.
Four inoculated replicates were analyzed for each genotype, and two replicates were
subject to mock inoculation. P. medicaginis zoospores were used to flood-inoculate
trays at 12 days post germination, when the plants had opened the first trifoliate.
Disease symptoms were recorded at 0, 6, 8, 10, 12, 14, 16, 18 and 24 days post-
inoculation.
M. truncatula Infection by P. medicaginis, Aeroponic Tank Experiments
To grow the plants for microscopic analysis and to collect roots for ethylene
production experiments, 72 L Rubbermaid trash cans were adapted into aeroponic tanks,
as described by Gallusci et al. (71). A Defensor mist generator (aeroponic generator)
non-sonicating model 505S Air Humidifier-Atomizer (AxAir Ltd. Pfaffikon,
Switzerland) was used to create misting conditions to nourish the roots. The aeroponic
tank was washed thoroughly with soap, and rinsed with deionized sterile water. NaOCl
(20%) was used to treat every component of the tank for at least 30 minutes, followed by
at least three additional rinses with sterile water. If pathogens were previously used in
the tank, an extended overnight treatment period was used. In those cases, the misting
64
motor would be left on overnight to sterilize itself thoroughly. A similar timeframe,
using sterile water, was used to rinse the motor and tank after bleaching it. To grow the
plants inside the tanks, the nutrient medium established by Lullien et al. (113) was used.
All the stocks solutions were prepared and autoclaved separately for 20 min at 115ºC,
with 20 in Hg.
M. truncatula seedlings growing aeroponically were carefully removed from the
tanks and organized into group of 10 seedlings. The roots of the seedlings were
subsequently submerged in a P. medicaginis inoculum solution (1.5x10⁵ zoospores/ml)
for 2 h and returned to the tank. Non-inoculated controls were prepared by soaking
control plants in a liquid solution that resulted from flooding non-inoculated V8 agar
dishes with sterile water to mimic the conditions for P. medicaginis zoospore
production. At specific times groups of plants were removed from the tank for analysis.
The time 0 was defined as the moment at which the plants were moved back to the tank
after being exposed to the pathogen.
Microscopical analysis
Seedlings of skl and A17 used for microscopy were grown aeroponically (37).
M. truncatula plants, when growing inside aeroponic tanks, develop faster than in soil
and previous experiments have shown that opening of the first trifoliate occurs four days
earlier than in soil (S. Ramu, personal communication). Therefore, P. medicaginis
zoospore inoculation of experimental plants was performed when the seedlings were 8-
days-old. The evaluation times were 0, 2, 4, 6, 12, 24, 48, 72, 96 and 120 hours after
inoculation. At the scheduled times, 10 plants/genotype were retrieved and fixed in
65
2.5% glutaraldehyde and stored in 0.1% PIPES buffer pH 7.2 at 4ºC for analysis.
Individual samples were examined with a dissecting microscope (model SZH 10
Olympus, Tokyo, Japan) and (or) with an Axioskop compound microscope (Zeiss, Jena,
Germany).
Quantification of P. medicaginis reproductive structures developing over a
region defined as the first four cm of root tissue measuring from the tip of the root was
performed by counting the number of sporangiophores, oospores or chlamydospores
developing on the infected roots.
Ethylene quantification
The plants used for ethylene quantification were grown inside aeroponic tanks.
P. medicaginis zoospore infection of M. truncatula plants was achieved as described.
Infected and control roots were cut below the hypocotyl and placed inside glass vials.
The vials were sealed with serum-stoppered caps. Ethylene quantification was
performed on samples taken at 0, 2, 6, 12, 24, 32 and 48 hours after inoculation. Each
sample consisted of three individual plant roots, replicated three times. An incubation
period of 3 h was provided for each sample. For analysis of ethylene evolution, the
protocol of Finlayson et al. was followed (64). Briefly, 1 ml of sample was collected
and analyzed using a 10SPlus gas chromatograph (Photovac, Markham, Ontario,
Canada) equipped with a photo ionization detector. Control vials, without roots, were
sampled at each time point to correct for background ethylene. After each measurement,
the weight of the samples was taken. Ethylene production was expressed in terms of nM
of ethylene per gram, per hour.
66
M. truncatula Infection by Pythium sp.
In the case of Pythium ultimum and P. irregularum experiments, seeds (acid
treated and cold conditioned) were evenly distributed in the colonized water-agar dishes
in experiments replicated three times. During two days, the dishes were kept at 18°C in
the dark to stimulate germination, and subsequently moved to a growth chamber set to
14 h light and 10 h darkness, with a constant temperature of 18°C. Disease rating was
assessed using the protocols described in Chapter II on the fifth day after inoculation.
M. truncatula Infection by C. trifolii
Experiments with C. trifolii race 1, pathovar 2sp2 consisted of applying to runoff
a spore suspension of the pathogen (7.2x10⁵/ml) to trays containing 60 2-week-old M.
truncatula plants. Three replicates per genotype (A17 and skl) plus a non-inoculated
control were used. Infected and control trays were covered during the 48 h after
inoculation to keep the relative humidity inside the trays close to 100%. Plants were
watered daily as needed and data was collected at seven and 14 days after inoculation.
Infection was assessed as previously presented in Chapter II.
RESULTS
M. truncatula Near-Isogenic Line skl Is Hyper-Infected by P. medicaginis
Infection of M. truncatula plants with P. medicaginis resulted in responses that
differed with the plant genotype. Symptoms in A17 plants started as chlorosis of the
cotyledons, followed by chlorosis of the monofoliate, then the trifoliates, general
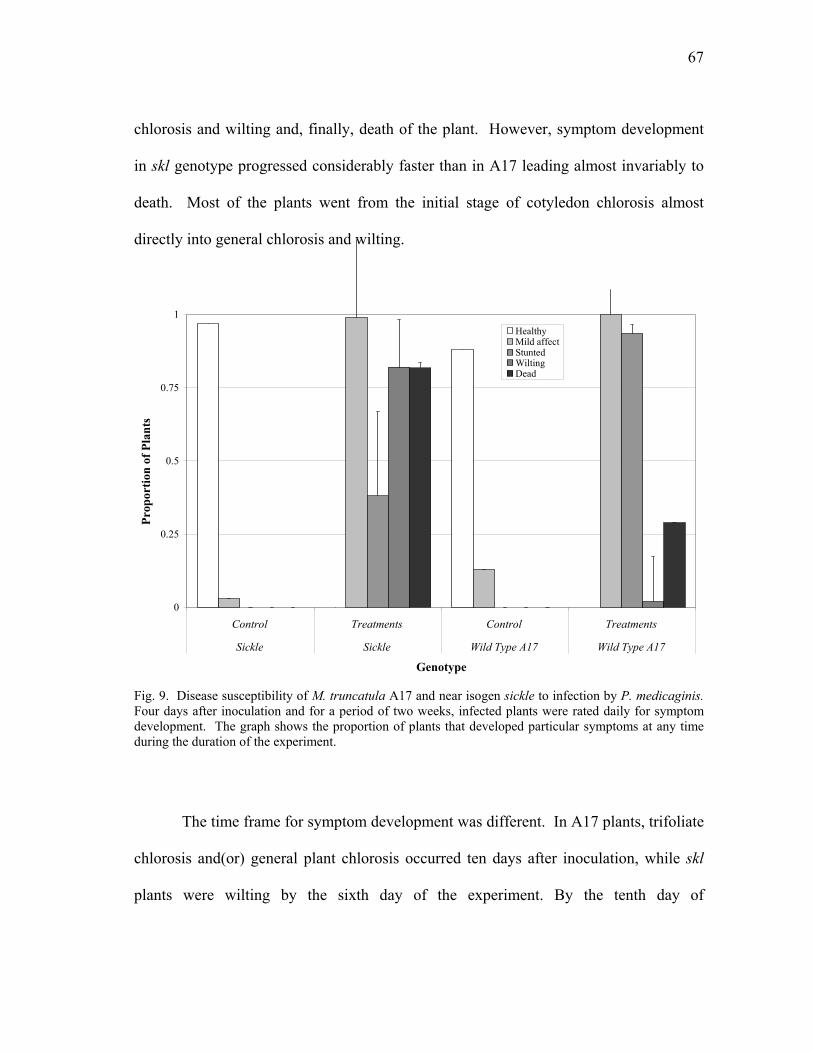
67
chlorosis and wilting and, finally, death of the plant. However, symptom development
in skl genotype progressed considerably faster than in A17 leading almost invariably to
death. Most of the plants went from the initial stage of cotyledon chlorosis almost
directly into general chlorosis and wilting.
0
0.25
0.5
0.75
1
Control Treatments Control Treatments
Sickle Sickle Wild Type A17 Wild Type A17
Genotype
Prop
ortio
n of
Pla
nts
HealthyMild affectStuntedWiltingDead
Fig. 9. Disease susceptibility of M. truncatula A17 and near isogen sickle to infection by P. medicaginis. Four days after inoculation and for a period of two weeks, infected plants were rated daily for symptom development. The graph shows the proportion of plants that developed particular symptoms at any time during the duration of the experiment.
The time frame for symptom development was different. In A17 plants, trifoliate
chlorosis and(or) general plant chlorosis occurred ten days after inoculation, while skl
plants were wilting by the sixth day of the experiment. By the tenth day of
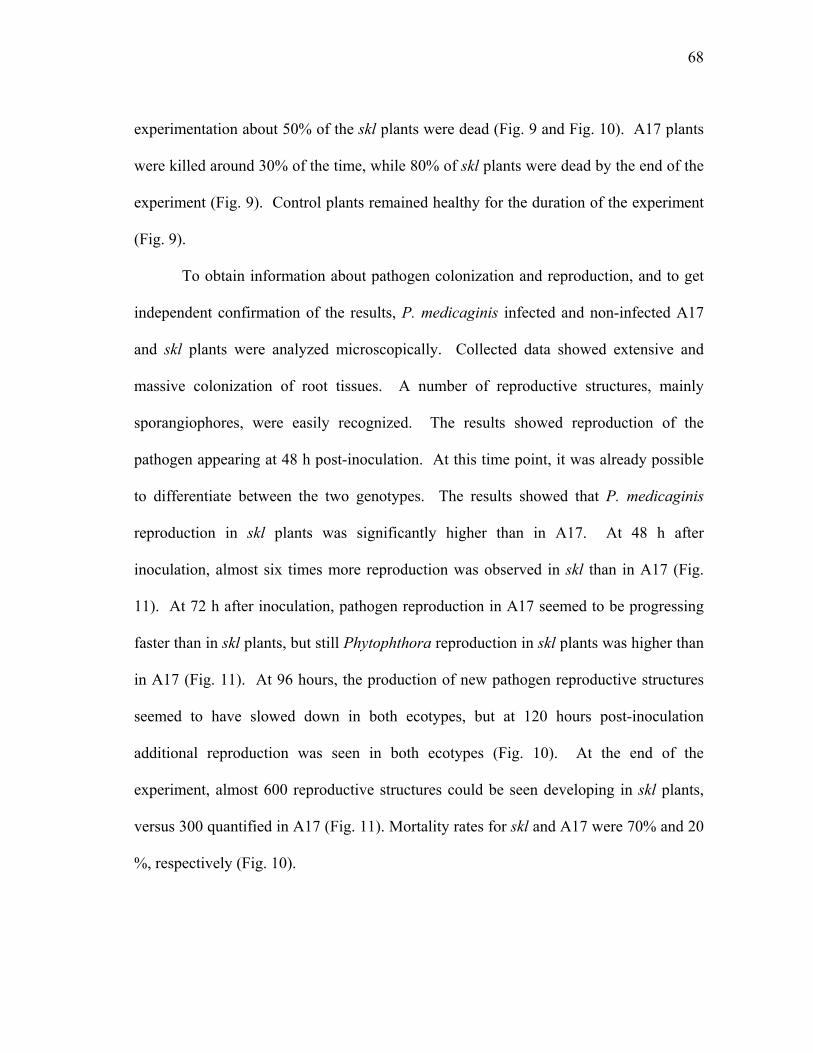
68
experimentation about 50% of the skl plants were dead (Fig. 9 and Fig. 10). A17 plants
were killed around 30% of the time, while 80% of skl plants were dead by the end of the
experiment (Fig. 9). Control plants remained healthy for the duration of the experiment
(Fig. 9).
To obtain information about pathogen colonization and reproduction, and to get
independent confirmation of the results, P. medicaginis infected and non-infected A17
and skl plants were analyzed microscopically. Collected data showed extensive and
massive colonization of root tissues. A number of reproductive structures, mainly
sporangiophores, were easily recognized. The results showed reproduction of the
pathogen appearing at 48 h post-inoculation. At this time point, it was already possible
to differentiate between the two genotypes. The results showed that P. medicaginis
reproduction in skl plants was significantly higher than in A17. At 48 h after
inoculation, almost six times more reproduction was observed in skl than in A17 (Fig.
11). At 72 h after inoculation, pathogen reproduction in A17 seemed to be progressing
faster than in skl plants, but still Phytophthora reproduction in skl plants was higher than
in A17 (Fig. 11). At 96 hours, the production of new pathogen reproductive structures
seemed to have slowed down in both ecotypes, but at 120 hours post-inoculation
additional reproduction was seen in both ecotypes (Fig. 10). At the end of the
experiment, almost 600 reproductive structures could be seen developing in skl plants,
versus 300 quantified in A17 (Fig. 11). Mortality rates for skl and A17 were 70% and 20
%, respectively (Fig. 10).
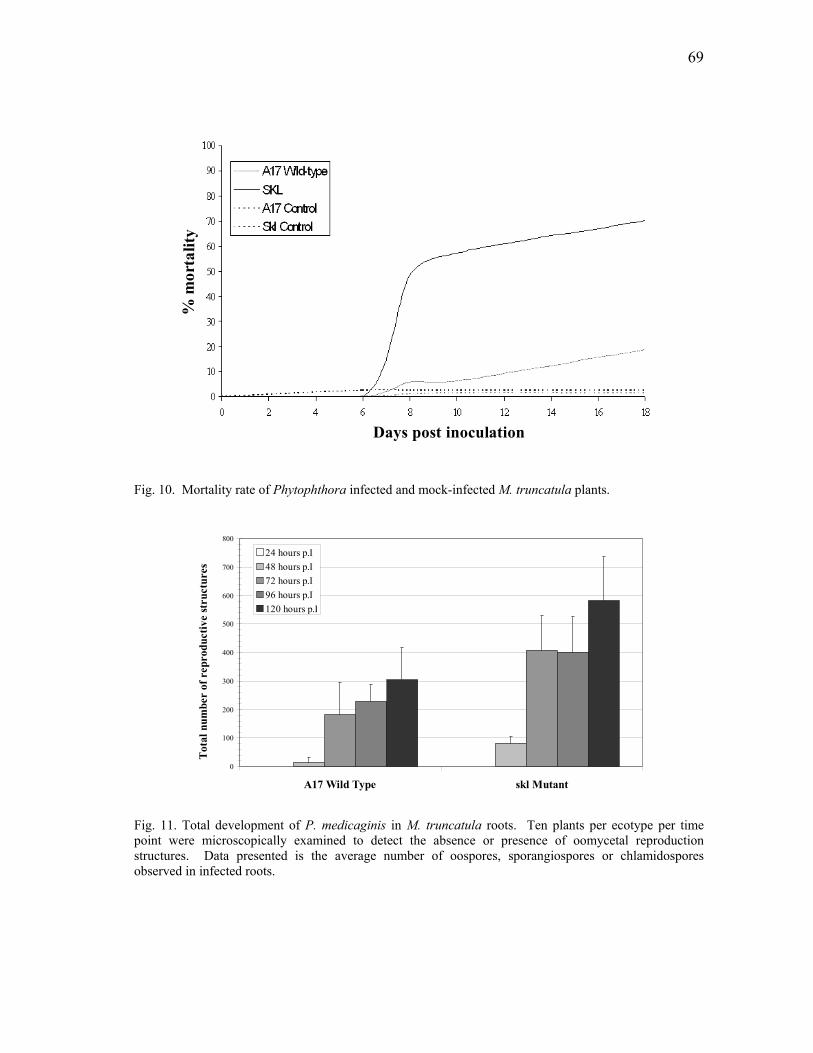
69
Days post inoculation
% m
orta
li ty
Fig. 10. Mortality rate of Phytophthora infected and mock-infected M. truncatula plants.
0
100
200
300
400
500
600
700
800
A17 Wild Type skl Mutant
Tot
al n
umbe
r of
rep
rodu
ctiv
e st
ruct
ures
24 hours p.I48 hours p.I72 hours p.I96 hours p.I120 hours p.I
Fig. 11. Total development of P. medicaginis in M. truncatula roots. Ten plants per ecotype per time point were microscopically examined to detect the absence or presence of oomycetal reproduction structures. Data presented is the average number of oospores, sporangiospores or chlamidospores observed in infected roots.
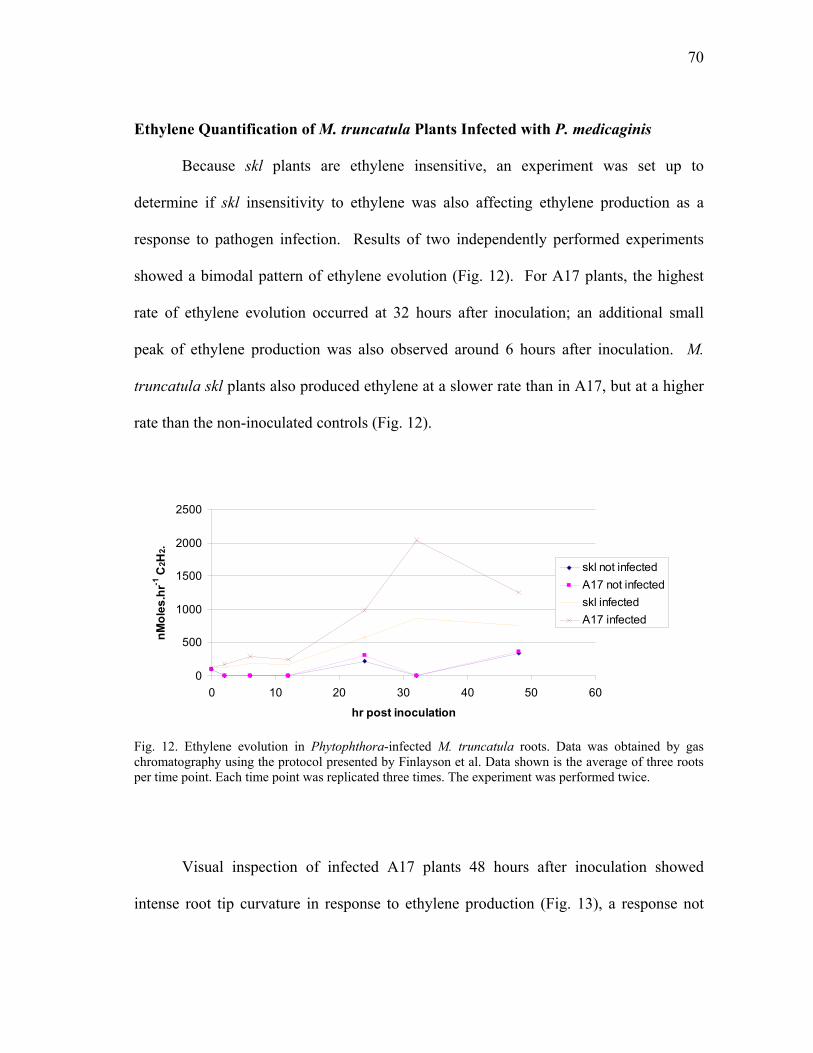
70
Ethylene Quantification of M. truncatula Plants Infected with P. medicaginis
Because skl plants are ethylene insensitive, an experiment was set up to
determine if skl insensitivity to ethylene was also affecting ethylene production as a
response to pathogen infection. Results of two independently performed experiments
showed a bimodal pattern of ethylene evolution (Fig. 12). For A17 plants, the highest
rate of ethylene evolution occurred at 32 hours after inoculation; an additional small
peak of ethylene production was also observed around 6 hours after inoculation. M.
truncatula skl plants also produced ethylene at a slower rate than in A17, but at a higher
rate than the non-inoculated controls (Fig. 12).
0
500
1000
1500
2000
2500
0 10 20 30 40 50 60
hr post inoculation
nMol
es.h
r-1 C
2H2.
skl not infectedA17 not infectedskl infectedA17 infected
Fig. 12. Ethylene evolution in Phytophthora-infected M. truncatula roots. Data was obtained by gas chromatography using the protocol presented by Finlayson et al. Data shown is the average of three roots per time point. Each time point was replicated three times. The experiment was performed twice.
Visual inspection of infected A17 plants 48 hours after inoculation showed
intense root tip curvature in response to ethylene production (Fig. 13), a response not
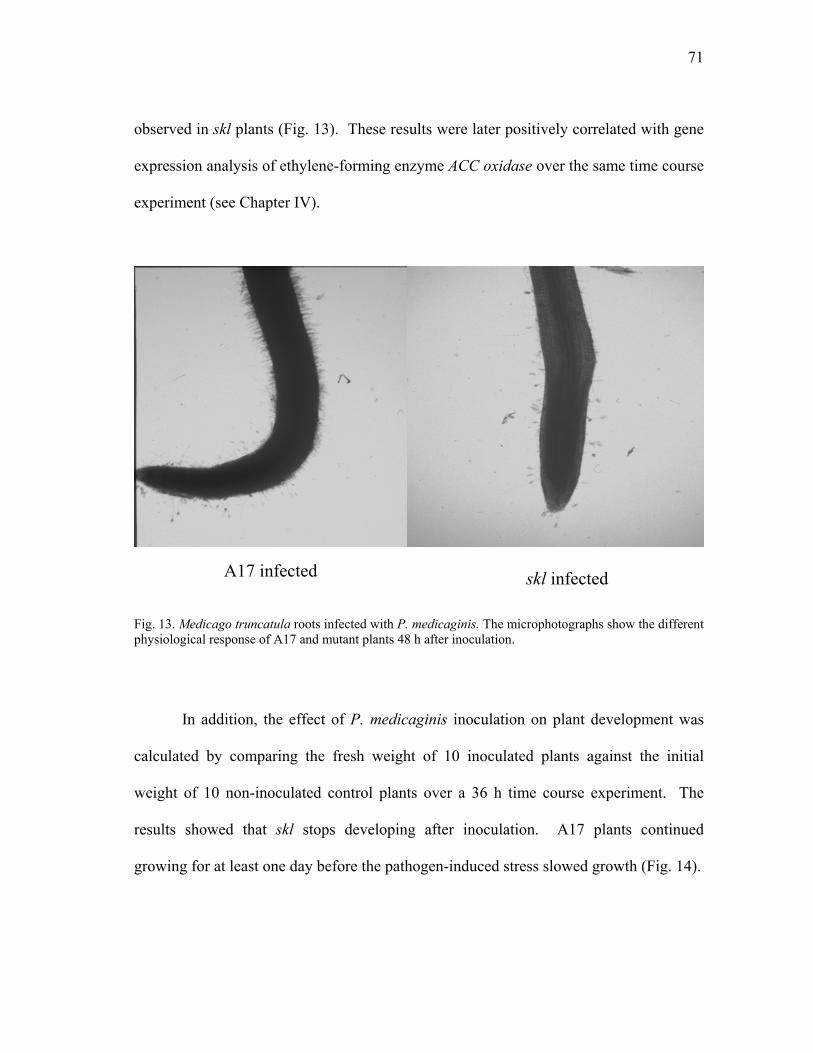
71
observed in skl plants (Fig. 13). These results were later positively correlated with gene
expression analysis of ethylene-forming enzyme ACC oxidase over the same time course
experiment (see Chapter IV).
Fig. 13. Medicago truncatula roots infected with P. medicaginis. The microphotographs show the different physiological response of A17 and mutant plants 48 h after inoculation.
In addition, the effect of P. medicaginis inoculation on plant development was
calculated by comparing the fresh weight of 10 inoculated plants against the initial
weight of 10 non-inoculated control plants over a 36 h time course experiment. The
results showed that skl stops developing after inoculation. A17 plants continued
growing for at least one day before the pathogen-induced stress slowed growth (Fig. 14).
A17 infected skl infected
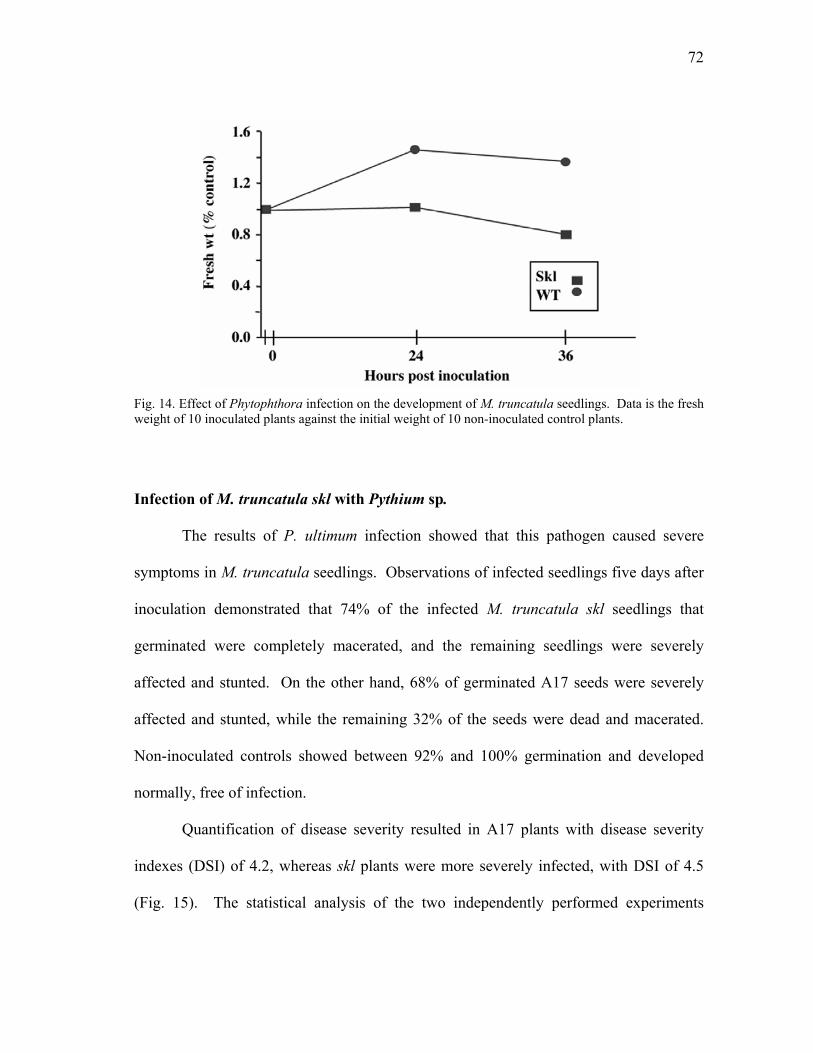
72
Fig. 14. Effect of Phytophthora infection on the development of M. truncatula seedlings. Data is the fresh weight of 10 inoculated plants against the initial weight of 10 non-inoculated control plants.
Infection of M. truncatula skl with Pythium sp.
The results of P. ultimum infection showed that this pathogen caused severe
symptoms in M. truncatula seedlings. Observations of infected seedlings five days after
inoculation demonstrated that 74% of the infected M. truncatula skl seedlings that
germinated were completely macerated, and the remaining seedlings were severely
affected and stunted. On the other hand, 68% of germinated A17 seeds were severely
affected and stunted, while the remaining 32% of the seeds were dead and macerated.
Non-inoculated controls showed between 92% and 100% germination and developed
normally, free of infection.
Quantification of disease severity resulted in A17 plants with disease severity
indexes (DSI) of 4.2, whereas skl plants were more severely infected, with DSI of 4.5
(Fig. 15). The statistical analysis of the two independently performed experiments
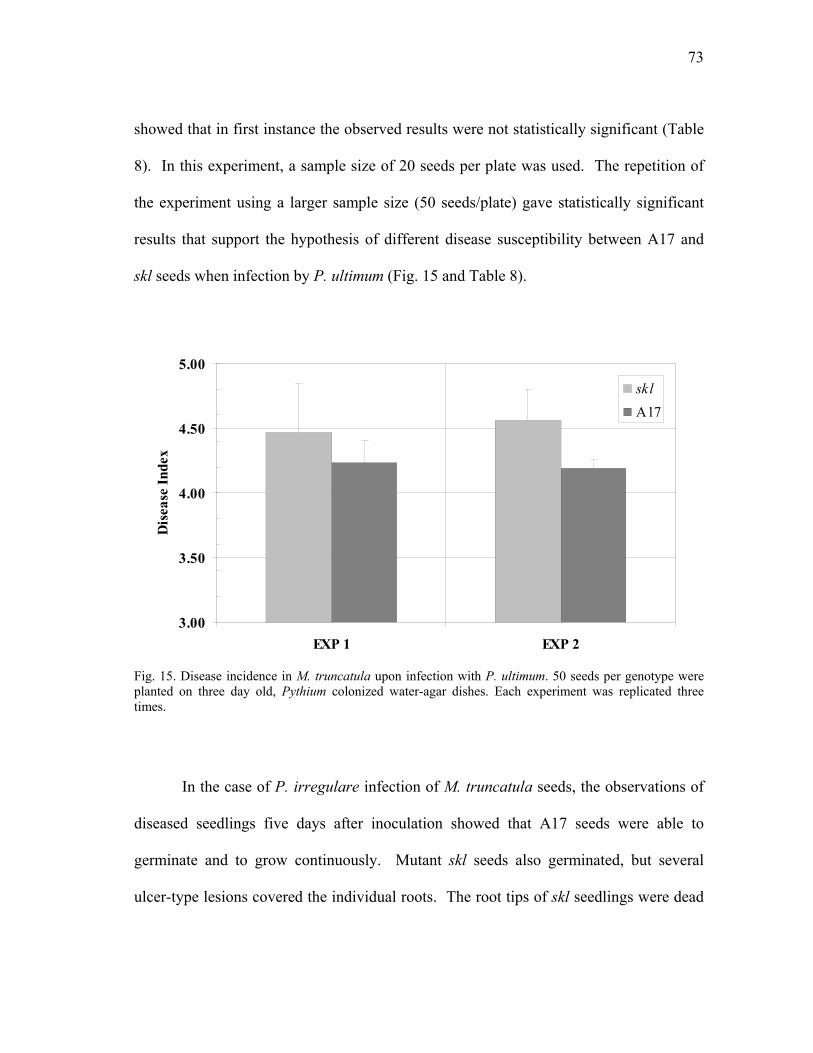
73
showed that in first instance the observed results were not statistically significant (Table
8). In this experiment, a sample size of 20 seeds per plate was used. The repetition of
the experiment using a larger sample size (50 seeds/plate) gave statistically significant
results that support the hypothesis of different disease susceptibility between A17 and
skl seeds when infection by P. ultimum (Fig. 15 and Table 8).
3.00
3.50
4.00
4.50
5.00
EXP 1 EXP 2
Dis
ease
Inde
x
sklA17
Fig. 15. Disease incidence in M. truncatula upon infection with P. ultimum. 50 seeds per genotype were planted on three day old, Pythium colonized water-agar dishes. Each experiment was replicated three times.
In the case of P. irregulare infection of M. truncatula seeds, the observations of
diseased seedlings five days after inoculation showed that A17 seeds were able to
germinate and to grow continuously. Mutant skl seeds also germinated, but several
ulcer-type lesions covered the individual roots. The root tips of skl seedlings were dead
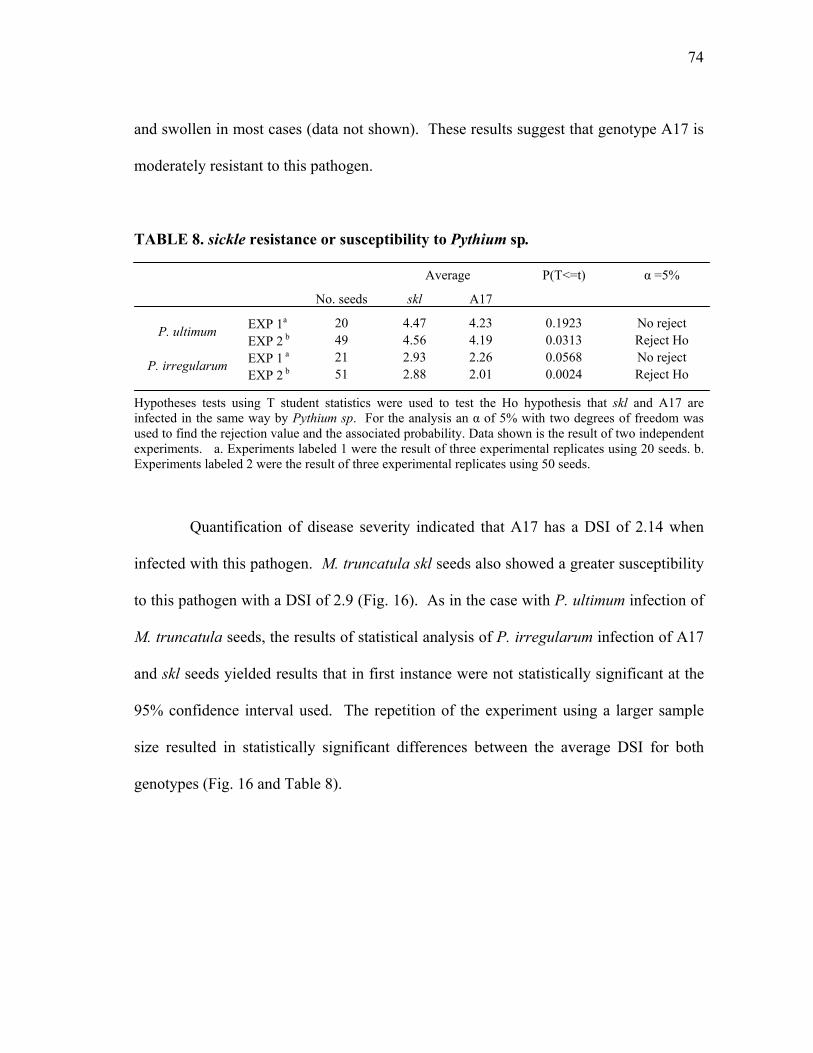
74
and swollen in most cases (data not shown). These results suggest that genotype A17 is
moderately resistant to this pathogen.
TABLE 8. sickle resistance or susceptibility to Pythium sp.
Hypotheses tests using T student statistics were used to test the Ho hypothesis that skl and A17 are infected in the same way by Pythium sp. For the analysis an α of 5% with two degrees of freedom was used to find the rejection value and the associated probability. Data shown is the result of two independent experiments. a. Experiments labeled 1 were the result of three experimental replicates using 20 seeds. b. Experiments labeled 2 were the result of three experimental replicates using 50 seeds.
Quantification of disease severity indicated that A17 has a DSI of 2.14 when
infected with this pathogen. M. truncatula skl seeds also showed a greater susceptibility
to this pathogen with a DSI of 2.9 (Fig. 16). As in the case with P. ultimum infection of
M. truncatula seeds, the results of statistical analysis of P. irregularum infection of A17
and skl seeds yielded results that in first instance were not statistically significant at the
95% confidence interval used. The repetition of the experiment using a larger sample
size resulted in statistically significant differences between the average DSI for both
genotypes (Fig. 16 and Table 8).
Average P(T<=t) α =5%
No. seeds skl A17
EXP 1a 20 4.47 4.23 0.1923 No reject P. ultimum EXP 2 b 49 4.56 4.19 0.0313 Reject Ho EXP 1 a 21 2.93 2.26 0.0568 No reject P. irregularum EXP 2 b 51 2.88 2.01 0.0024 Reject Ho
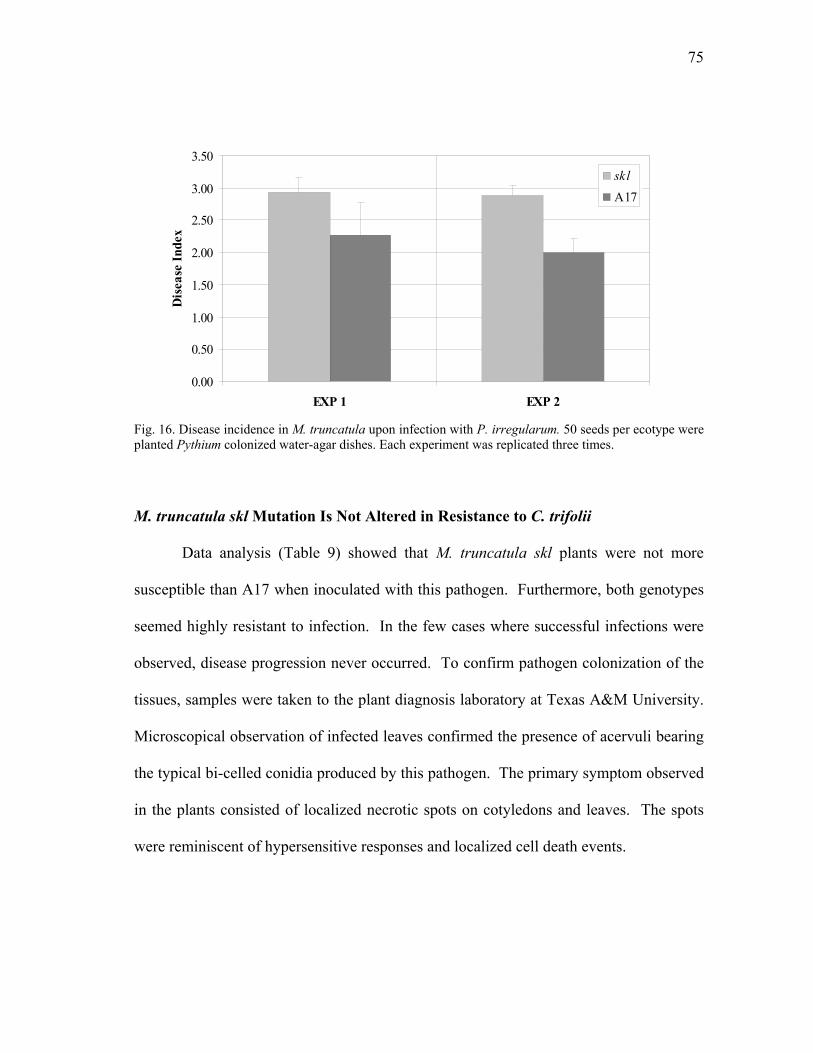
75
0.00
0.50
1.00
1.50
2.00
2.50
3.00
3.50
EXP 1 EXP 2
Dis
ease
Inde
xsklA17
Fig. 16. Disease incidence in M. truncatula upon infection with P. irregularum. 50 seeds per ecotype were planted Pythium colonized water-agar dishes. Each experiment was replicated three times.
M. truncatula skl Mutation Is Not Altered in Resistance to C. trifolii
Data analysis (Table 9) showed that M. truncatula skl plants were not more
susceptible than A17 when inoculated with this pathogen. Furthermore, both genotypes
seemed highly resistant to infection. In the few cases where successful infections were
observed, disease progression never occurred. To confirm pathogen colonization of the
tissues, samples were taken to the plant diagnosis laboratory at Texas A&M University.
Microscopical observation of infected leaves confirmed the presence of acervuli bearing
the typical bi-celled conidia produced by this pathogen. The primary symptom observed
in the plants consisted of localized necrotic spots on cotyledons and leaves. The spots
were reminiscent of hypersensitive responses and localized cell death events.
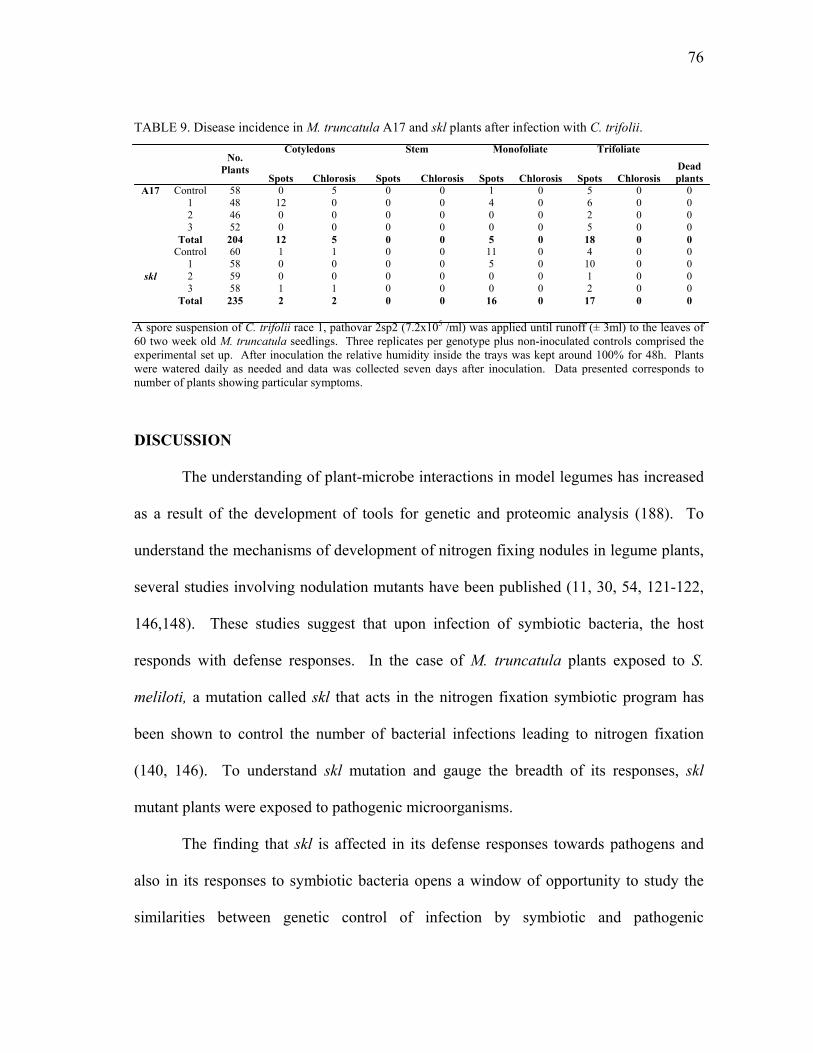
76
TABLE 9. Disease incidence in M. truncatula A17 and skl plants after infection with C. trifolii. Cotyledons Stem Monofoliate Trifoliate
No. Plants
Spots Chlorosis Spots Chlorosis Spots Chlorosis Spots Chlorosis Dead plants
Control 58 0 5 0 0 1 0 5 0 0 1 48 12 0 0 0 4 0 6 0 0 2 46 0 0 0 0 0 0 2 0 0 3 52 0 0 0 0 0 0 5 0 0
A17
Total 204 12 5 0 0 5 0 18 0 0 Control 60 1 1 0 0 11 0 4 0 0
1 58 0 0 0 0 5 0 10 0 0 2 59 0 0 0 0 0 0 1 0 0 3 58 1 1 0 0 0 0 2 0 0
skl
Total 235 2 2 0 0 16 0 17 0 0 A spore suspension of C. trifolii race 1, pathovar 2sp2 (7.2x10⁵ /ml) was applied until runoff (± 3ml) to the leaves of 60 two week old M. truncatula seedlings. Three replicates per genotype plus non-inoculated controls comprised the experimental set up. After inoculation the relative humidity inside the trays was kept around 100% for 48h. Plants were watered daily as needed and data was collected seven days after inoculation. Data presented corresponds to number of plants showing particular symptoms. DISCUSSION
The understanding of plant-microbe interactions in model legumes has increased
as a result of the development of tools for genetic and proteomic analysis (188). To
understand the mechanisms of development of nitrogen fixing nodules in legume plants,
several studies involving nodulation mutants have been published (11, 30, 54, 121-122,
146,148). These studies suggest that upon infection of symbiotic bacteria, the host
responds with defense responses. In the case of M. truncatula plants exposed to S.
meliloti, a mutation called skl that acts in the nitrogen fixation symbiotic program has
been shown to control the number of bacterial infections leading to nitrogen fixation
(140, 146). To understand skl mutation and gauge the breadth of its responses, skl
mutant plants were exposed to pathogenic microorganisms.
The finding that skl is affected in its defense responses towards pathogens and
also in its responses to symbiotic bacteria opens a window of opportunity to study the
similarities between genetic control of infection by symbiotic and pathogenic

77
microorganisms. Because skl is a mutation that affects a gene in the ethylene signal
transduction pathway, this research further supports the long known role of ethylene in
plant defense responses towards pathogens (49-50, 55, 98, 149, 179). The results of this
study suggest that skl can be used to classify defense responses of M. truncatula into
ethylene-dependent and ethylene-independent categories. Although the role of ethylene
perception in regulating infection by oomycetes and nitrogen fixing bacteria is clearly
established, it remains uncertain if the downstream responses are also related.
The initial experiments with P. medicaginis were surprising not only because of
skl hyper-infection, but also because of the speed of infection. The initial intention of
the experiments was to follow disease symptoms over a three-week period, however, 10
days after inoculation maximum disease severity was recorded. The observed results
have conclusively shown that the pathogen was able to complete its life cycle in M.
truncatula plants. Microscopic observations of skl and A17 infected roots showed an
increase in pathogen colonization in the mutant plant as expressed by the number of
reproductive structures formed by the pathogen. The results also showed a faster
progression of disease symptoms in skl-infected plants compared to A17 plants.
Microscopic examination of infected roots revealed the ease and speed at which
P. medicaginis colonized the root surface in skl plants. In addition to the observed
differences in pathogen reproduction and speed of colonization, subtle, un-quantified
responses also appeared in A17 but not in skl plants. For example, it was observed that
A17 plants that survived pathogen challenge developed secondary root growth.
Development of secondary roots after pathogen inoculation was not observed in skl (Fig.
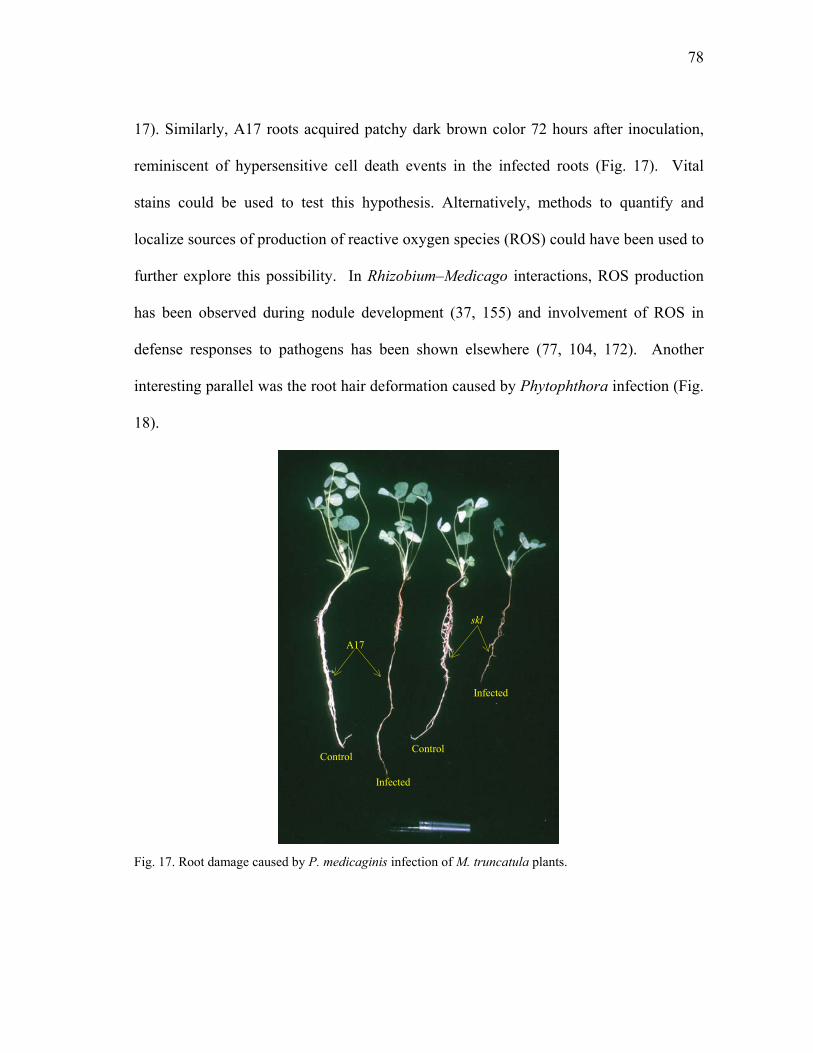
78
17). Similarly, A17 roots acquired patchy dark brown color 72 hours after inoculation,
reminiscent of hypersensitive cell death events in the infected roots (Fig. 17). Vital
stains could be used to test this hypothesis. Alternatively, methods to quantify and
localize sources of production of reactive oxygen species (ROS) could have been used to
further explore this possibility. In Rhizobium–Medicago interactions, ROS production
has been observed during nodule development (37, 155) and involvement of ROS in
defense responses to pathogens has been shown elsewhere (77, 104, 172). Another
interesting parallel was the root hair deformation caused by Phytophthora infection (Fig.
18).
skl
ControlControl
Infected
Infected
A17
skl
ControlControl
Infected
Infected
A17
Fig. 17. Root damage caused by P. medicaginis infection of M. truncatula plants.
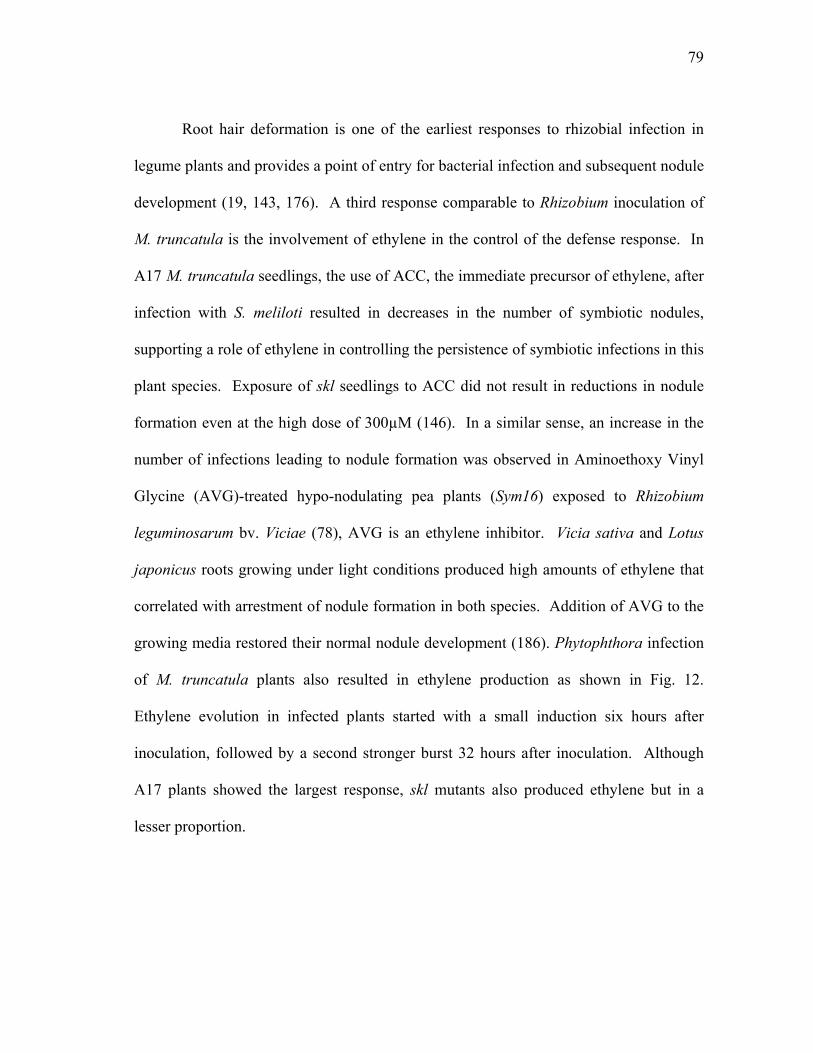
79
Root hair deformation is one of the earliest responses to rhizobial infection in
legume plants and provides a point of entry for bacterial infection and subsequent nodule
development (19, 143, 176). A third response comparable to Rhizobium inoculation of
M. truncatula is the involvement of ethylene in the control of the defense response. In
A17 M. truncatula seedlings, the use of ACC, the immediate precursor of ethylene, after
infection with S. meliloti resulted in decreases in the number of symbiotic nodules,
supporting a role of ethylene in controlling the persistence of symbiotic infections in this
plant species. Exposure of skl seedlings to ACC did not result in reductions in nodule
formation even at the high dose of 300µM (146). In a similar sense, an increase in the
number of infections leading to nodule formation was observed in Aminoethoxy Vinyl
Glycine (AVG)-treated hypo-nodulating pea plants (Sym16) exposed to Rhizobium
leguminosarum bv. Viciae (78), AVG is an ethylene inhibitor. Vicia sativa and Lotus
japonicus roots growing under light conditions produced high amounts of ethylene that
correlated with arrestment of nodule formation in both species. Addition of AVG to the
growing media restored their normal nodule development (186). Phytophthora infection
of M. truncatula plants also resulted in ethylene production as shown in Fig. 12.
Ethylene evolution in infected plants started with a small induction six hours after
inoculation, followed by a second stronger burst 32 hours after inoculation. Although
A17 plants showed the largest response, skl mutants also produced ethylene but in a
lesser proportion.
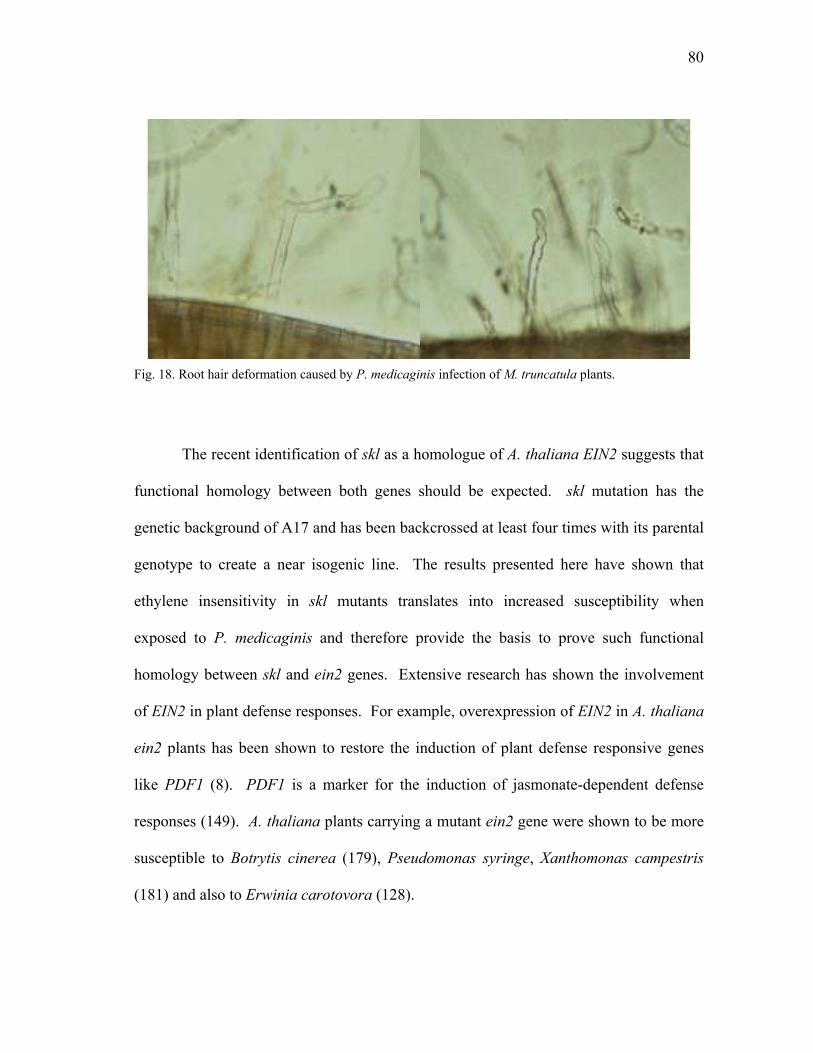
80
Fig. 18. Root hair deformation caused by P. medicaginis infection of M. truncatula plants.
The recent identification of skl as a homologue of A. thaliana EIN2 suggests that
functional homology between both genes should be expected. skl mutation has the
genetic background of A17 and has been backcrossed at least four times with its parental
genotype to create a near isogenic line. The results presented here have shown that
ethylene insensitivity in skl mutants translates into increased susceptibility when
exposed to P. medicaginis and therefore provide the basis to prove such functional
homology between skl and ein2 genes. Extensive research has shown the involvement
of EIN2 in plant defense responses. For example, overexpression of EIN2 in A. thaliana
ein2 plants has been shown to restore the induction of plant defense responsive genes
like PDF1 (8). PDF1 is a marker for the induction of jasmonate-dependent defense
responses (149). A. thaliana plants carrying a mutant ein2 gene were shown to be more
susceptible to Botrytis cinerea (179), Pseudomonas syringe, Xanthomonas campestris
(181) and also to Erwinia carotovora (128).
81
Whereas most of these data are similar, conflicting results have been reported
that suggest a minimal role for ein2 mutation in the defense responses to X. campestris
and P. syringe (20). Recently, Mauch-Mani (158) developed a pathosystem for infection
of A. thaliana with P. porri noting that ein2, etr1 and jar1 mutants were not
compromised in their resistance against this pathogen. ETR1 codes for an ethylene
receptor and its involvement in defense responses has been previously shown (21, 33,
49, 91, 171); jar1 is a mutant impaired in JA production and its role in plant defense
responses has been shown by different groups (17, 119, 189). Interestingly, according to
Mauch-Mani (158), neither the destruction of salicylic acid (SA) in salicylate degrading
mutants (nahG) nor the application of its functional analog, benzothiadiazol, in SA
accumulating mutants was effective in preventing disease symptoms in susceptible A.
thaliana plants infected with P. porri. The Mauch-Mani analysis raises questions about
the role of ethylene, JA and SA in the resistance of this plant species to this pathogen
and suggests a completely different control mechanism mediated by pad4, a phytoalexin
deficient mutant previously characterized in A. thaliana (35, 49). The exploration of
these findings in M. truncatula is a logical step to further understand skl mutation. An
analysis of pad4 homologues, based on the analysis of the M. truncatula EST database is
was performed but it is not presented here.
Exposing skl mutants to the pathogens C. trifolii, M. incognita and R. solani
revealed in no apparent increase in susceptibility. The experiment involving C. trifolii
infection of M. truncatula plants showed a hypersensitive response in infected leaves
that included localized cell death events. This result is consistent with proposed defense
82
mechanisms previously observed for resistant alfalfa (135). By contrast, results of
infection of M. truncatula with P. ultimum or P. irregularum resulted in slight increase
susceptibility of skl seedlings when compared to its parental genotype, the A17 plant.
The procedure for P. ultimum and P. irregularum infection of M. truncatula
seeds exposes the experimental subjects directly to the pathogen in a non-natural way
forcing the expression of resistance in the host if such is present. The North America
Alfalfa Improvement Conference (NAAIC) has provided guides to clearly distinguish
between Pythium sp. resistant and susceptible individuals in such a harsh environment.
The guides are tailored to analyze alfalfa cultivars and therefore are adapted for the
purpose of this study. The results of the analysis are based on statistical parameters that
can be misleading if insufficient population size is used. This was the case with the
initial DSI results of A17 and skl infection by Pythium sp. Collected data suggested that
both genotypes respond in similar ways when infected by the pathogens. This
assumption was later proved wrong when the same experiment was repeated with a
greater sample size. Nonetheless, both of the trials resulted in higher susceptibility of skl
genotype to infection by these pathogens.
83
CHAPTER IV
TRANSCRIPTION PROFILING OF GENE HOMOLOGUES IN
MEDICAGO TRUNCATULA
SUMMARY
Bona fide sequence information for proteins involved in phenyl propanoid
metabolism, Salicylic Acid (SA) dependent resistance, Jasmonic Acid (JA)/ethylene
dependent resistance and stress related metabolism were used in tblastn searches to
screen the Medicago truncatula EST database for gene homologues. The search resulted
in series of contigs sharing a high degree of homology with the query sequences. The
EST makeup of each contig was analyzed and normalized to provide an in silica based
representation of gene expression and to phylogenetically analyze the different gene
families investigated. Lastly, the expression profiles of selected gene homologues were
used to characterize the transcriptional responses of mutant and A17 M. truncatula
plants upon infection with P. medicaginis. The results of the analysis showed that the
skl mutant was affected in the generation of signals leading to ethylene production
whereas A17 gene expression corroborated a bimodal pattern of ethylene production
previously observed. Mutant plants also exhibited upregulation of genes involved in
phytoalexin production, as well as stress-related Glutathione S Transferase (GST)
proteins. These results suggest that skl impairment blocks the ethylene/jasmonate
dependent defense response pathway, in agreement with its proposed homology to
Arabidopsis thaliana ein2 protein.
84
INTRODUCTION
Medicago truncatula (barrel medic) is a model plant for genetic and
physiological analyses in legumes. Research efforts involving M. truncatula have been
facilitated by an increasing number of tools for genetic, genomic, metabolic, and
proteomic analyses (38-39, 82, 141, 188). Among these, the development of Bacterial
Artificial Chromosome libraries (BAC libraries) (28, D.R. Cook data not published) has
allowed the cloning of important genes involved in symbiotic interactions with nitrogen
fixing and mycorrhizal organisms. Random sequencing and fingerprinting of these BAC
libraries, in addition to the use of fluorescent in-situ hybridization technologies, has led
to the detection of euchromatic and heterochromatic regions of the genome (101, 188).
These advances underlie the current effort to determine the sequence of the gene-rich
chromosome arms of M. truncatula using a BAC-by-BAC strategy (188). Finally, dense
genetic maps are providing anchoring points to markers developed in other, more
complex legume species like alfalfa, pea, mung bean (Vigna radiata), and soybean (34).
Gene analysis in this species is also progressing rapidly, mainly because of the
development of EST libraries. Currently, release 7.0 of the Medicago Gene Index
(MTGI) database (http://www.tigr.org/tdb/tgi/mtgi/) contains 189,919 sequences,
derived from 38 different cDNA libraries, each one representing a particular
environmental or physiological condition (Table 10). The EST in the database have
been clustered by sequence identity to create Tentative Contigs (TC), representing an
estimated 36,976 unique genes. Of this number, 19,341 sequences are singletons, while
17,635 sequences form contigs of two or more EST.
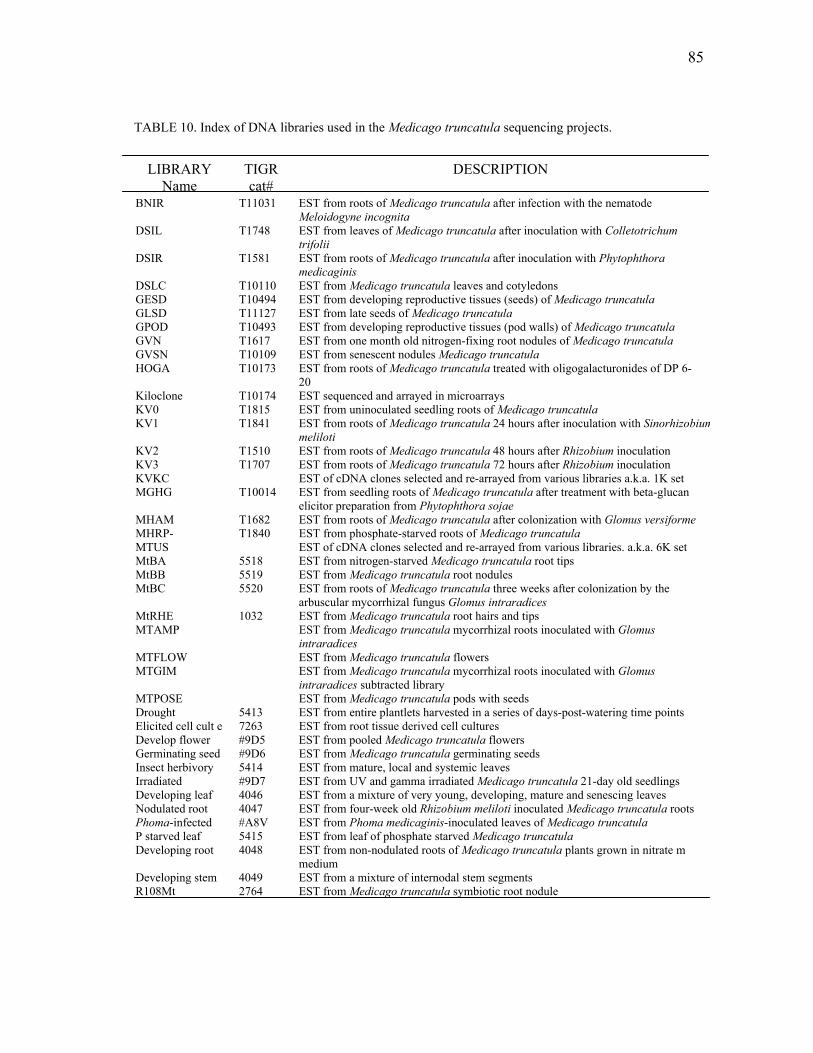
85
TABLE 10. Index of DNA libraries used in the Medicago truncatula sequencing projects.
LIBRARY Name
TIGR cat#
DESCRIPTION
BNIR T11031 EST from roots of Medicago truncatula after infection with the nematode Meloidogyne incognita
DSIL T1748 EST from leaves of Medicago truncatula after inoculation with Colletotrichum trifolii
DSIR T1581 EST from roots of Medicago truncatula after inoculation with Phytophthora medicaginis
DSLC T10110 EST from Medicago truncatula leaves and cotyledons GESD T10494 EST from developing reproductive tissues (seeds) of Medicago truncatula GLSD T11127 EST from late seeds of Medicago truncatula GPOD T10493 EST from developing reproductive tissues (pod walls) of Medicago truncatula GVN T1617 EST from one month old nitrogen-fixing root nodules of Medicago truncatula GVSN T10109 EST from senescent nodules Medicago truncatula HOGA T10173 EST from roots of Medicago truncatula treated with oligogalacturonides of DP 6-
20 Kiloclone T10174 EST sequenced and arrayed in microarrays KV0 T1815 EST from uninoculated seedling roots of Medicago truncatula KV1 T1841 EST from roots of Medicago truncatula 24 hours after inoculation with Sinorhizobium
meliloti KV2 T1510 EST from roots of Medicago truncatula 48 hours after Rhizobium inoculation KV3 T1707 EST from roots of Medicago truncatula 72 hours after Rhizobium inoculation KVKC EST of cDNA clones selected and re-arrayed from various libraries a.k.a. 1K set MGHG T10014 EST from seedling roots of Medicago truncatula after treatment with beta-glucan
elicitor preparation from Phytophthora sojae MHAM T1682 EST from roots of Medicago truncatula after colonization with Glomus versiforme MHRP- T1840 EST from phosphate-starved roots of Medicago truncatula MTUS EST of cDNA clones selected and re-arrayed from various libraries. a.k.a. 6K set MtBA 5518 EST from nitrogen-starved Medicago truncatula root tips MtBB 5519 EST from Medicago truncatula root nodules MtBC 5520 EST from roots of Medicago truncatula three weeks after colonization by the
arbuscular mycorrhizal fungus Glomus intraradices MtRHE 1032 EST from Medicago truncatula root hairs and tips MTAMP EST from Medicago truncatula mycorrhizal roots inoculated with Glomus
intraradices MTFLOW EST from Medicago truncatula flowers MTGIM EST from Medicago truncatula mycorrhizal roots inoculated with Glomus
intraradices subtracted library MTPOSE EST from Medicago truncatula pods with seeds Drought 5413 EST from entire plantlets harvested in a series of days-post-watering time points Elicited cell cult e 7263 EST from root tissue derived cell cultures Develop flower #9D5 EST from pooled Medicago truncatula flowers Germinating seed #9D6 EST from Medicago truncatula germinating seeds Insect herbivory 5414 EST from mature, local and systemic leaves Irradiated #9D7 EST from UV and gamma irradiated Medicago truncatula 21-day old seedlings Developing leaf 4046 EST from a mixture of very young, developing, mature and senescing leaves Nodulated root 4047 EST from four-week old Rhizobium meliloti inoculated Medicago truncatula roots Phoma-infected #A8V EST from Phoma medicaginis-inoculated leaves of Medicago truncatula P starved leaf 5415 EST from leaf of phosphate starved Medicago truncatula Developing root 4048 EST from non-nodulated roots of Medicago truncatula plants grown in nitrate m
medium Developing stem 4049 EST from a mixture of internodal stem segments R108Mt 2764 EST from Medicago truncatula symbiotic root nodule
86
The unigene set underlies the recent development of oligonucleotide and cDNA
microarrays for gene expression analyses. Ethyl MethaneSulfonate (EMS) mutagenesis
and fast neutron mutagenesis are being used to generate plants altered in developmental
or physiological responses (147, 188). The analysis of these mutant populations is
allowing the characterization of different signal transduction and developmental
pathways in this species. Because of the importance of symbiotic nitrogen fixation in
agriculture, much of the effort has focused on responses to Sinorhizobium meliloti and
Glomus sp., the natural nitrogen fixing and mycorrhizal symbionts of this plant species.
Nonetheless, research on defense responses, host plant and human nutrition, and plant
development is progressing steadily as well.
Nodulation screens on M. truncatula plants have allowed the isolation of
individuals affected in the control and position of nitrogen fixing nodules (148). One of
these mutants was found to be insensitive to the plant hormone ethylene. This mutation,
called sickle (skl), was linked to control of the persistence of Rhizobium infections in
roots, and, therefore, regulation of the number of symbiotic nodules allowed to develop
and mature (140, 146, 148). Further analysis of skl led to the discovery that defense
responses were also hampered in this mutant. Mutant plants were shown to be hyper-
susceptible to oomycete pathogens, but not to true fungi like Colletotrichum trifolii or
Rhizoctonia solani (see Chapters II and III). In order to further study the role of skl
mutation, EST information contained in MTGI was used to search for homologues of
genes involved in plant defense responses. The extensive search included gene members
of pathways that lead to the production of pathogenesis-related proteins (PR proteins),
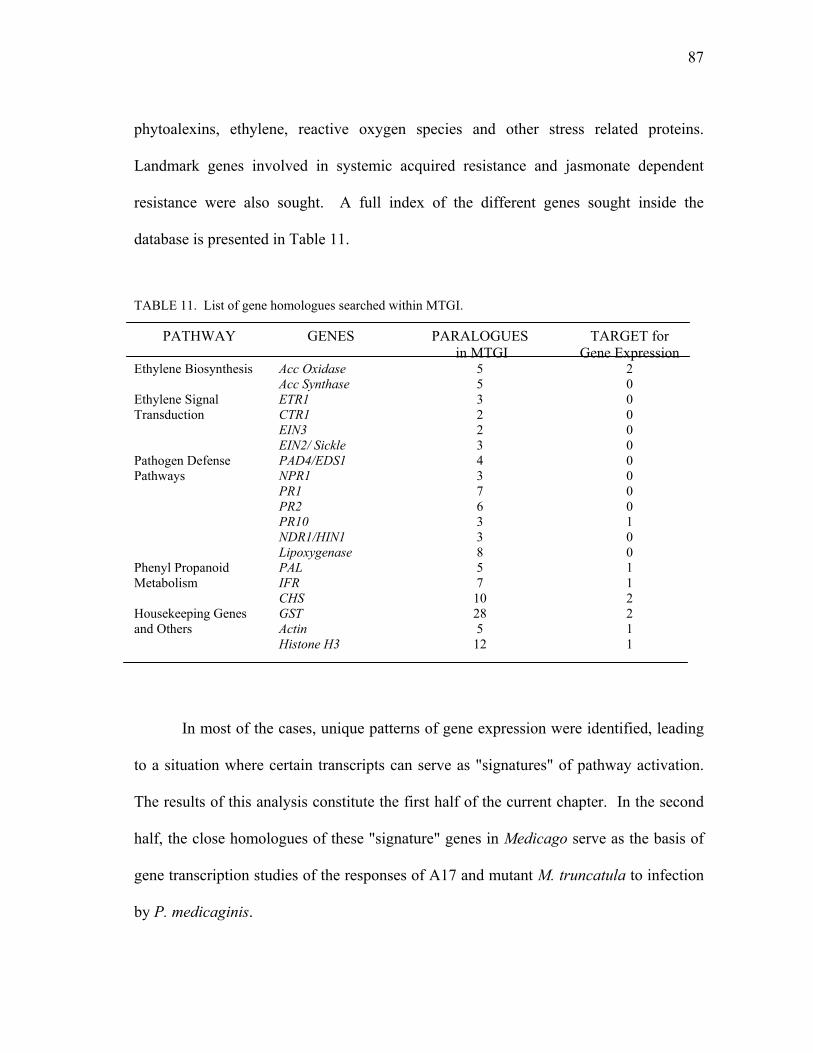
87
phytoalexins, ethylene, reactive oxygen species and other stress related proteins.
Landmark genes involved in systemic acquired resistance and jasmonate dependent
resistance were also sought. A full index of the different genes sought inside the
database is presented in Table 11.
TABLE 11. List of gene homologues searched within MTGI.
In most of the cases, unique patterns of gene expression were identified, leading
to a situation where certain transcripts can serve as "signatures" of pathway activation.
The results of this analysis constitute the first half of the current chapter. In the second
half, the close homologues of these "signature" genes in Medicago serve as the basis of
gene transcription studies of the responses of A17 and mutant M. truncatula to infection
by P. medicaginis.
PATHWAY GENES PARALOGUES in MTGI
TARGET for Gene Expression
Acc Oxidase 5 2 Ethylene Biosynthesis Acc Synthase 5 0 ETR1 3 0 CTR1 2 0 EIN3 2 0
Ethylene Signal Transduction
EIN2/ Sickle 3 0 PAD4/EDS1 4 0 NPR1 3 0 PR1 7 0 PR2 6 0 PR10 3 1 NDR1/HIN1 3 0
Pathogen Defense Pathways
Lipoxygenase 8 0 PAL 5 1 IFR 7 1
Phenyl Propanoid Metabolism
CHS 10 2 GST 28 2 Actin 5 1
Housekeeping Genes and Others
Histone H3 12 1
88
For the EST analysis of M. truncatula homologues, bona fide sequence
information available in this or other legume species was used as basis for comparison in
tblastn searches. When this information was not available for M. truncatula or other
closely related legume species, gene models developed in distant species like
Arabidopsis thaliana and Lycopersicon esculentum were used. TC with high homology
to the query sequence (Table 11) were tabulated into gene families, adjusted for
inconsistencies (i.e. sequencing errors, frame shifts, etc), aligned and phylogenetically
analyzed. Lastly, TC were further studied based on their EST makeup to obtain a
tentative representation of the degree and conditions of expression of each sequence.
With the purpose of finding the onset and duration of expression of genes related
with plant defense responses, transcription analysis of gene homologues found through
the EST analysis was performed on mRNA isolated from healthy and P. medicaginis
infected skl plants and compared against healthy and P. medicaginis infected A17 plants.
Transcription profiles of candidate genes were created by time course experiments using
real time RTPCR. The gene homologues analyzed in this way were: Gluthatione S
Transferases (GST) as a stress induced gene; ACC oxidase, an enzyme in the ethylene
biosynthesis pathway; CHalcone Synthase (CHS), IsoFlavone Reductase (IFR) and
Phenylalanine Ammonia Lyase (PAL), important enzymes in the phenyl-propanoid
metabolism; and PR10, a gene induced by JA and ethylene. The constitutive expressed
genes Histone H3 and actin were used as internal controls for the analysis.
89
Pathways for Defense Responses in Plants
The majority of characterized plant disease resistance phenotypes can be
accounted for based on three different signaling pathways: (1) Systemic Acquired
Resistance (SAR), (2) Jasmonate/ethylene dependent resistance, and (3) SA/JA/Ethylene
independent resistance (50, 102, 104, 160, 167).
In SAR, for example, genes that belong to the phenylpropanoid pathway are
often induced. Flavonoid compounds are implicated in stress responses towards a
variety of stimuli including high light/uv, wounding, low temperatures, low nitrogen,
low phosphorus, low iron, and pathogen attack (46-48, 81). PAL, the first enzyme in the
pathway, catalyzes the production of cinnamic acid from the phenylalanine. Cinnamic
acid serves as the basic skeleton for several phenylpropanoid derivates including lignin,
coumarin and SA via a series of methylation, hydroxylation and dehydration reactions.
These reactions include the condensation reaction of p-coumaroyl-COenzyme A (CoA)
with three molecules of malonyl-CoA, which yields in most species
tetrahydroxychalcone. This C15 flavonoid compound can be converted into flavones,
flavanones, flavanols and anthocyanins (46). The key enzyme is CHS, which, in
conjunction with CHalcone Reductase (CHR) produces trihydroxychalcone. This
compound is rearranged by isoflavone synthase to allow the accumulation of several
kinds of isoflavonoids. Among them, the main alfalfa phytoalexin medicarpin, is
produced after a committed step mediated by IFR. PAL, IFR and CHS were targeted for
gene expression analysis in this research. Other stress responses, and in particular
detoxification processes, are mediated by enzymes such as Gluthatione S transferases.
90
GST comprises a very large family of proteins with members in all higher organisms.
Two GST homologues were studied in transcriptional profiling experiments. SAR
induces the expression of some PR protein genes by means of W-boxes located in the
promoter regions of the genes. W-boxes are activation targets for a plant-specific class
of transcription factors called the WRKY transcription factors (49, 58, 159).
Pathogenesis related proteins comprise at least nine families. Among them, PR1
encodes an antifungal protein and perhaps is the most studied protein of this group.
Pathogenesis related protein 2 (PR2) and PR3 encode β-1,3-glucanase and chitinase,
respectively, and are implicated in the degradation of pathogen cell walls and the
production of oligosaccharide elicitors of defense responses. Pathogenesis related
protein 4 (PR4) and PR5 code for havein-like and thaumatin-like proteins, antifungal and
protein inhibitor compounds, respectively. Finally, PR10 homologues encode small
peptides that have been involved with allergic reactions. Pathogenesis related protein 10
(PR10_ is constitutively expressed in Medicago nodules, but its role in defense
responses has not been clarified yet. For SAR mediated resistance, PR1 and PR2 are
considered markers for induction of the pathway (160). For further analysis, PR10 was
chosen.
A completely separate plant defense response is mediated by JA and ethylene.
The wound response to insects is an example of this response. Upon insect injury, JA
accumulation causes the induction of genes for proteinase inhibitors, systemin, THIonin
(Thi2.1) and defensin (PDF1.2), which act together to deter insect feeding. Jasmonates
are produced through the octadecanoic pathway from cyclopentanone derivatives.
91
Several enzymes mediate JA biosynthesis, and among these, the LipOXigenases (LOX)
comprise an important gene family in which most homologues are correspondingly
activated upon insect injury. Jasmonates regulate, among others, plant growth, plant
defense responses, and development (52-53, 161, 184).
Jasmonic acid is believed to act through a mechanism involving a MAPK named
WIPK (wound induced protein kinase) (49, 167). Interestingly, transgenic tobacco
plants that lack WIPK function accumulated SA and PR1, compounds associated with
SAR, suggesting a regulatory switch where wound-induced JA suppresses SA-dependent
signaling (184). One of the marker genes for JA induction of defense responses is
COrinitine Insensitive COI1, which regulates stamen and pollen development in A.
thaliana (63, 193) and when expressed together with JAR1, a JA-inducible gene (172),
also regulates defense responses (75-76).
Ethylene insensitivity also affects defense responses. This hormone is
synthesized in two rapid steps mediated by ACC Synthase (ACS) and ACC Oxidase
(ACO) upon pathogen challenge, wounding, and other stress responses. Examples of
ethylene involvement in disease resistance include transgenic tobacco expressing a
nonfunctional etr1 (98) and the requirement for ethylene during disease resistance that
was observed in Arabidopsis plants carrying a defective ein2 gene. In the latter case,
these plants showed increased susceptibility to Botrytis cinerea (98,178). Transcription
factors known to respond to JA have similarity to ethylene responsive factors (ERF),
suggesting commonalities for the regulation of these two hormones, perhaps via EIN2
dependent or independent pathways (174, 184). Further confirmation of the interactions
92
of the two pathways comes from the analysis of mutant plants constitutively responding
to ethylene (ctr1) after treatment with JA (103, 184).
Real Time PCR Analysis of Gene Expression
Polymerase Chain Reaction (PCR) is a technology that allows the perpetual
amplification of nucleic acid sequences under controlled circumstances and has
revolutionized the scientific field for the past 20 years. Multiple variations have been
designed since the early 1980’s, when it was introduced, and among them, real time
reverse transcription PCR achieves the visualization and analysis of gene products in
real time during the progression of the PCR amplification reaction (85).
Real time PCR detection of amplification products is based on compounds that
attach or intercalate with the target molecule and in the process generate a signal that
reports the progression of the reaction. Different chemistries are available for the
detection of PCR products, including intercalating compounds such as Sybr green or
ethidium bromide, hybridization probes, molecular beacons, and hydrolysis probes (26-
27). In the studies described here Taqman™ probes were used to quantify the
expression of transcripts involved in plant defense resistance.
The Taqman™ system is based on the hydrolysis of a fluorescent probe during
the DNA replication. Probe hydrolysis, which is accomplished by the 5' exonuclease
activity of Taq DNA polymerase, results in an increase in fluorescent signal that is
directly proportional to the quantity of the complimentary amplicon (79). The fact that
the probe is complementary to the amplified product simultaneously improves the
specificity of the reaction and facilitates the quantification of the PCR product (26, 85).
93
The 5' ends of Taqman™ probes have a fluorescent moiety, while the 3' end has
a corresponding quenching moiety. Quenching is highly efficient as long as the
proximity of the fluorescent molecule and the quenching molecule are maintained.
Upon annealing to a complementary amplicon, however, the exonuclease activity of Taq
polymerase destroys the probe and releases the fluorescent molecule into solution. The
reporter system, typically a camera or a plate reader attached to the PCR machine,
detects and quantifies the fluorescent signal, which increases as the amount of replicated
nucleic acid increases (26, 72, 74, 85).
During the exponential phase of the PCR reaction, the mathematical expression
for a straight line provides an estimate of the amount of template inside the experimental
sample (72, 85). This expression correlates the amount of template with the
amplification cycle of the PCR. A user-defined threshold is used to distinguish
background from true fluorescence and standard curves can be used to calculate initial
template concentrations (72, 85).
MATERIALS AND METHODS
P. medicaginis Infection of M. truncatula
The protocols for growing M. truncatula A17 and skl seedlings used in the
experiments were described in the previous chapters and were based on the procedures
of Cook et al. (37) (Chapter II and III). The experimental plants were grown inside
aeroponic tanks Cook et al. (37). The nutrient medium used to grow the plants was that
94
of Lullien et al. (113). Stock solutions were prepared separately and autoclaved for 20
min, 115°C, and 20 in Hg.
P. medicaginis isolate M2019 provided by D. Samac (USDA ARS- Plant Science
Research Unit, St. Paul, MN) was used for the experiments. Zoospore production in this
pathogen was induced following the protocol by Maxwell et al. (120) Zoospore
suspensions were poured out of the Petri dishes, quantified using hemacytometers and
adjusted to 1.5x10⁵ zoospores/ml. Infection of M. truncatula 2-week-old seedlings was
achieved by submerging the roots of the experimental samples into the quantified
zoospore suspension, according to the protocols used in Chapter III. Non-inoculated
seedlings were mock treated in the same way as presented in Chapter III. Ten plants
(one bunch) per genotype (A17 or skl) and treatment (P. medicaginis infected or mock
infected) were sequentially removed from the tank at 0, 2, 6, 12, 24, 32, 48, 72 and 96 h
after inoculation. An absolute mock-infected experimental point was taken before
exposing the plants to P. medicaginis. The time point 0h corresponded to the time when
the plants were returned to the tanks after 2 hours of exposure to the pathogen.
Experimental samples were frozen in liquid nitrogen and stored at -80°C for later
processing and examination. The experiment was repeated two times.
In silica Analysis of Candidate Gene Families
Blast search of candidate genes
M. truncatula EST and TC sequences (154) were accessed through The Institute
of Genomic Research (TIGR). A. thaliana gene homologue sequences for the
95
phylogenetic analysis of the different proteins were obtained from the A. thaliana
sequencing project, which was accessed through The Institute of Genome Research
(TIGR). M. sativa, Pisum sativum and Glycine max sequences were retrieved from
TIGR and also from the databases that belong to the National Center for Bioinformatics
Information (NCBI).
Using bona fide gene information publicly available at NCBI, Basic Local
Alignment Search Tools (BLAST) searches were used to query the M. truncatula EST
database located at TIGR (http://www.tigr.org/tdb/tgi/mtgi) (Table 11). To do so,
protein information for each of the proposed genes was used as query template against
the TIGR non-redundant M. truncatula nucleotide database dynamically translated in all
six possible reading frames (tblastn). The search results consisted of a series of tentative
contigs with variable degrees of relatedness (% of similarity and identity) to the query
sequence. Each hit in the database has an associated "expect" value (e-value)
representing the likelihood of chance occurrence in a data set of a given size. Therefore,
the smaller the e-value the more similar the sequences are. In order to confirm the
putative identity of each blast search hit, the nucleotide sequence corresponding to the
protein-coding region of each blast search contig hit was used as query template against
the non-redundant protein database at NCBI using the tblastx tool at NCBI. Those
sequences found to represent anything different than what was expected were removed
from analysis.
96
In silica inference of gene expression
The EST makeup of each tentative contig found by the tblastn search was
tabulated according to the library from which its members were sequenced. Data was
organized in spreadsheets using Microsoft Excel and used to create plots to show for
each TC the corresponding distribution of EST, based on the library of origin. The data
was normalized by dividing the corresponding number of sequenced EST coding for a
particular contig within each library by the total number of EST present in the
corresponding libraries.
Homologue sequence, alignment and analysis
Sequences were trimmed and corrected for mistakes using DNA strider.
Multiple sequence alignments for the different protein homologues investigated were
performed using ClustalX software (180). Protein trees were created using ClustalX and
PAUP software. Distance methods (neighbor joining [162]) for phylogenetic analysis
were used at all times and bootstrap analyses based on 1000 iterations of the data, with
correction for multiple substitutions were done to evaluate the consistency of the results.
RNA Isolation and Reverse Transcription
RNA from infected and non-infected tissues was isolated using the Qiagen
RNeasy mini isolation kit, following manufacturer’s instructions. The RNA for analysis
was DNAse digested and quantified by spectrometer. Total RNA was converted into
cDNA by reverse transcription using oligo dT primers. Two µg of total
RNA/experimental sample were reverse transcribed using the reagents and protocols
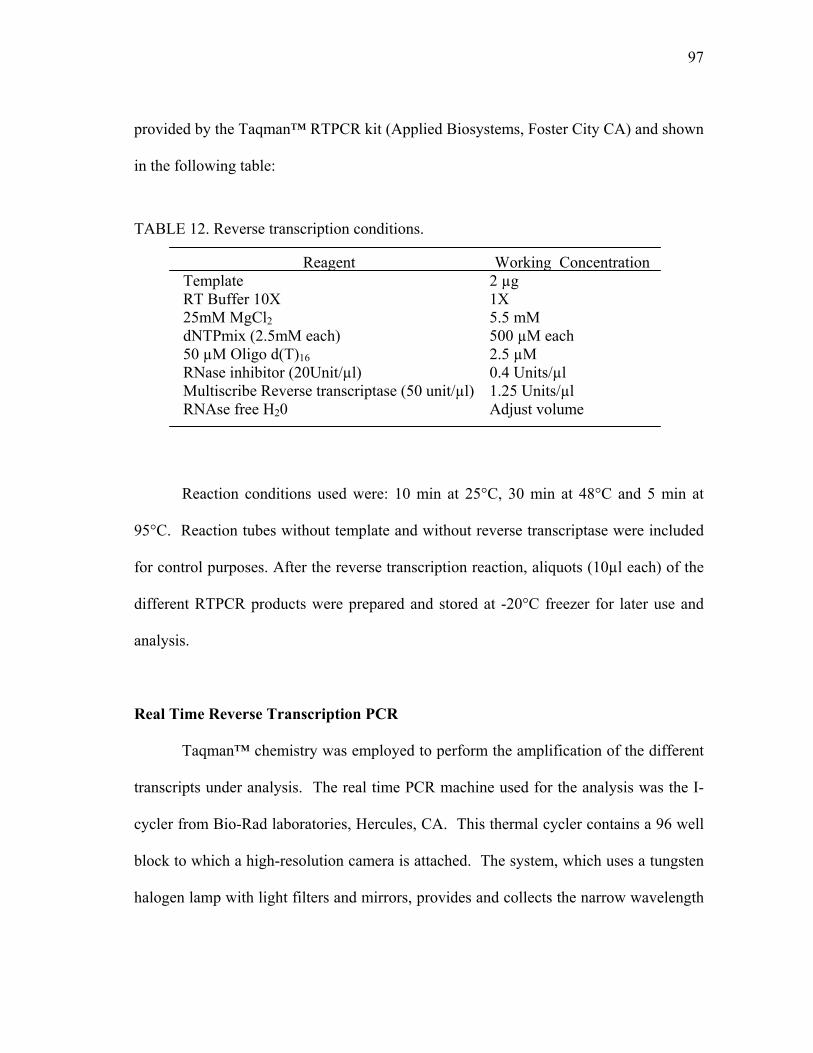
97
provided by the Taqman™ RTPCR kit (Applied Biosystems, Foster City CA) and shown
in the following table:
TABLE 12. Reverse transcription conditions.
Reaction conditions used were: 10 min at 25°C, 30 min at 48°C and 5 min at
95°C. Reaction tubes without template and without reverse transcriptase were included
for control purposes. After the reverse transcription reaction, aliquots (10µl each) of the
different RTPCR products were prepared and stored at -20°C freezer for later use and
analysis.
Real Time Reverse Transcription PCR
Taqman™ chemistry was employed to perform the amplification of the different
transcripts under analysis. The real time PCR machine used for the analysis was the I-
cycler from Bio-Rad laboratories, Hercules, CA. This thermal cycler contains a 96 well
block to which a high-resolution camera is attached. The system, which uses a tungsten
halogen lamp with light filters and mirrors, provides and collects the narrow wavelength
Reagent Working Concentration Template 2 µg RT Buffer 10X 1X 25mM MgCl2 5.5 mM dNTPmix (2.5mM each) 500 µM each 50 µM Oligo d(T)16 2.5 µM RNase inhibitor (20Unit/µl) 0.4 Units/µl Multiscribe Reverse transcriptase (50 unit/µl) 1.25 Units/µl RNAse free H20 Adjust volume
98
range desired for the optimum excitation and emission fluorescence of the reporter
molecules during the reaction. Computer software synchronizes the detection system
with the PCR machine during the PCR reaction and, at desired intervals (once every
cycle in this case), collects as many pictures as it can of the PCR samples during an
allocated user defined time frame. In this case, the time frame for data collection was set
to correspond to the first 10 s of the amplification stage of the PCR protocol. During
data collection, a graph that relates the average intensity of each sample point with the
amplification cycle of the PCR protocol is created by the software and automatically
updated until the protocol ends. Once the data is complete, subtraction of the
background fluorescence of the system from the raw data is performed to achieve the
true amplification plot of the material under quantification.
Primer and probe design
The primers and probes used in this analysis were created using the Primer
Express software (Applied Biosystems Foster City, CA). Primers had an annealing
temperature of 60°C and were typically 20-24 bp long. According to Taqman™
guidelines, the reporter probes were designed to anneal between the amplification
primers and to hybridize to the template at 70°C. The probes had modifications in each
of their ends. In the case of target genes, the 5’end was modified with the flourochrome
6-FAM, while the 3’end of target probes had any of the following quenchers attached:
DABCYL, BHQ1 or TAMRA. For the internal control genes, the 5’end of the probe
was modified with HEX or Texas Red and as quenchers on the 3’ end of the
oligonucleotides, DABCYL, BHQ1 or TAMRA were used. Tables 13-15 show the
99
details of the primer and probe sequences used, their positions in the template for
amplification and the modifications used. When possible, the primers were designed to
span intron sequences of the genes.
Reaction conditions
All the amplification primers and probes were designed to anneal almost at the
same temperature with the purpose of having a uniform set of conditions for PCR
amplification. PCR conditions for the experimental runs consisted of equal annealing
and extension temperatures, plus the required denaturing temperature.
To set up the reactions, Universal Master Mix Real Time PCR reagent kits
(Applied Biosystems, Foster City, CA) containing the amplification buffer, MgCl2,
dNTPs, UNG glycosilase (amp erase) and TAQ gold polymerase were used to minimize
pipetting errors. Reaction mixes were created by adding to aliquots of the master mix,
the necessary internal and target control primers and probe. Experimental and control
cDNAs were aliquoted in triplicate and measured aliquots of reaction mixes were added
to each of them. After careful mixing, the reagents were distributed in 96 well dishes
and the reaction volume in each well was set to 20µl.
Each PCR reaction contained five cDNA standards corresponding to 50, 10, 2,
0.4, and 0.08 ng/µl of total RNA in triplicate samples, plus 10 experimental templates
(-2, 0, 2, 6, 12, 24, 32, 48, 72 and 96 h post inoculation) also in triplicate. Reaction
tubes without template and without reverse transcriptase were included for control
purposes (one each/time point).
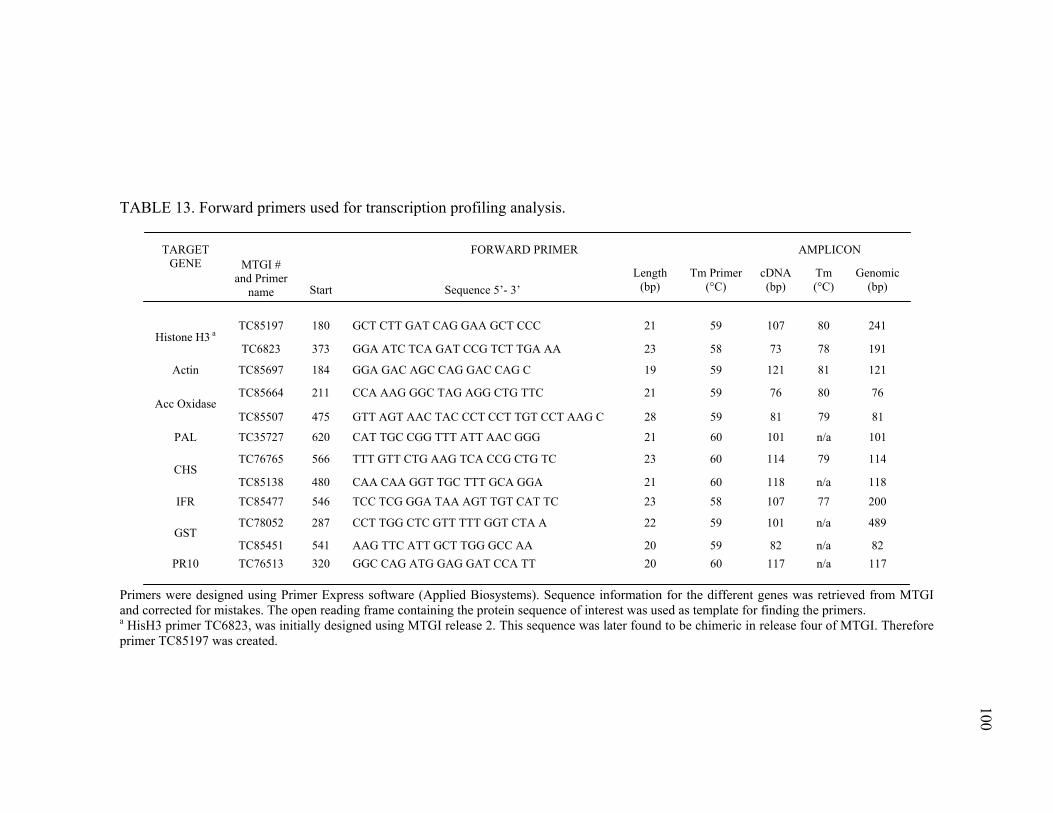
100
TABLE 13. Forward primers used for transcription profiling analysis.
FORWARD PRIMER AMPLICON TARGET
GENE MTGI # and Primer
name Start Sequence 5’- 3’ Length
(bp) Tm Primer
(°C) cDNA (bp)
Tm (°C)
Genomic (bp)
TC85197 180 GCT CTT GAT CAG GAA GCT CCC 21 59 107 80 241 Histone H3 a
TC6823 373 GGA ATC TCA GAT CCG TCT TGA AA 23 58 73 78 191
Actin TC85697 184 GGA GAC AGC CAG GAC CAG C 19 59 121 81 121
TC85664 211 CCA AAG GGC TAG AGG CTG TTC 21 59 76 80 76 Acc Oxidase
TC85507 475 GTT AGT AAC TAC CCT CCT TGT CCT AAG C 28 59 81 79 81
PAL TC35727 620 CAT TGC CGG TTT ATT AAC GGG 21 60 101 n/a 101
TC76765 566 TTT GTT CTG AAG TCA CCG CTG TC 23 60 114 79 114 CHS
TC85138 480 CAA CAA GGT TGC TTT GCA GGA 21 60 118 n/a 118 IFR TC85477 546 TCC TCG GGA TAA AGT TGT CAT TC 23 58 107 77 200
TC78052 287 CCT TGG CTC GTT TTT GGT CTA A 22 59 101 n/a 489 GST
TC85451 541 AAG TTC ATT GCT TGG GCC AA 20 59 82 n/a 82 PR10 TC76513 320 GGC CAG ATG GAG GAT CCA TT 20 60 117 n/a 117
Primers were designed using Primer Express software (Applied Biosystems). Sequence information for the different genes was retrieved from MTGI and corrected for mistakes. The open reading frame containing the protein sequence of interest was used as template for finding the primers. a HisH3 primer TC6823, was initially designed using MTGI release 2. This sequence was later found to be chimeric in release four of MTGI. Therefore primer TC85197 was created.
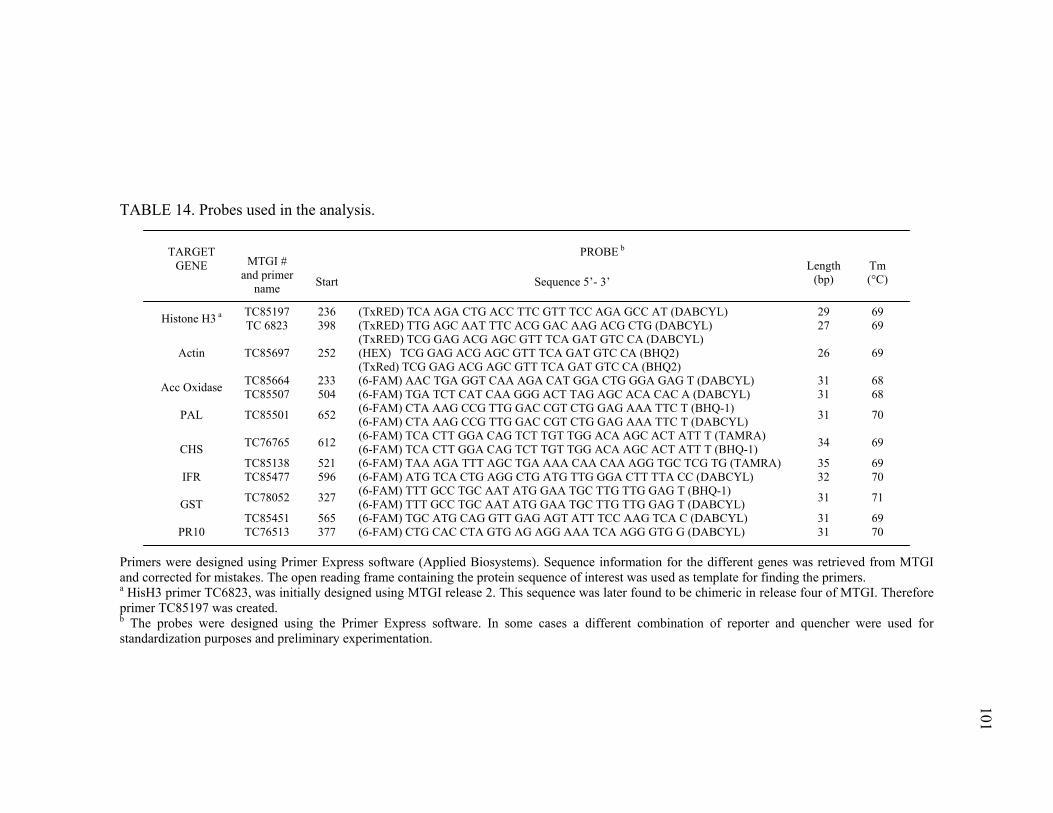
101
TABLE 14. Probes used in the analysis.
PROBE b TARGET
GENE MTGI # and primer
name Start Sequence 5’- 3’ Length
(bp) Tm (°C)
TC85197 236 (TxRED) TCA AGA CTG ACC TTC GTT TCC AGA GCC AT (DABCYL) 29 69 Histone H3 a TC 6823 398 (TxRED) TTG AGC AAT TTC ACG GAC AAG ACG CTG (DABCYL) 27 69
Actin TC85697 252 (TxRED) TCG GAG ACG AGC GTT TCA GAT GTC CA (DABCYL) (HEX) TCG GAG ACG AGC GTT TCA GAT GTC CA (BHQ2) (TxRed) TCG GAG ACG AGC GTT TCA GAT GTC CA (BHQ2)
26 69
TC85664 233 (6-FAM) AAC TGA GGT CAA AGA CAT GGA CTG GGA GAG T (DABCYL) 31 68 Acc Oxidase TC85507 504 (6-FAM) TGA TCT CAT CAA GGG ACT TAG AGC ACA CAC A (DABCYL) 31 68
PAL TC85501 652 (6-FAM) CTA AAG CCG TTG GAC CGT CTG GAG AAA TTC T (BHQ-1) (6-FAM) CTA AAG CCG TTG GAC CGT CTG GAG AAA TTC T (DABCYL) 31 70
TC76765 612 (6-FAM) TCA CTT GGA CAG TCT TGT TGG ACA AGC ACT ATT T (TAMRA) (6-FAM) TCA CTT GGA CAG TCT TGT TGG ACA AGC ACT ATT T (BHQ-1) 34 69 CHS
TC85138 521 (6-FAM) TAA AGA TTT AGC TGA AAA CAA CAA AGG TGC TCG TG (TAMRA) 35 69 IFR TC85477 596 (6-FAM) ATG TCA CTG AGG CTG ATG TTG GGA CTT TTA CC (DABCYL) 32 70
TC78052 327 (6-FAM) TTT GCC TGC AAT ATG GAA TGC TTG TTG GAG T (BHQ-1) (6-FAM) TTT GCC TGC AAT ATG GAA TGC TTG TTG GAG T (DABCYL) 31 71 GST
TC85451 565 (6-FAM) TGC ATG CAG GTT GAG AGT ATT TCC AAG TCA C (DABCYL) 31 69 PR10 TC76513 377 (6-FAM) CTG CAC CTA GTG AG AGG AAA TCA AGG GTG G (DABCYL) 31 70
Primers were designed using Primer Express software (Applied Biosystems). Sequence information for the different genes was retrieved from MTGI and corrected for mistakes. The open reading frame containing the protein sequence of interest was used as template for finding the primers. a HisH3 primer TC6823, was initially designed using MTGI release 2. This sequence was later found to be chimeric in release four of MTGI. Therefore primer TC85197 was created. b The probes were designed using the Primer Express software. In some cases a different combination of reporter and quencher were used for standardization purposes and preliminary experimentation.
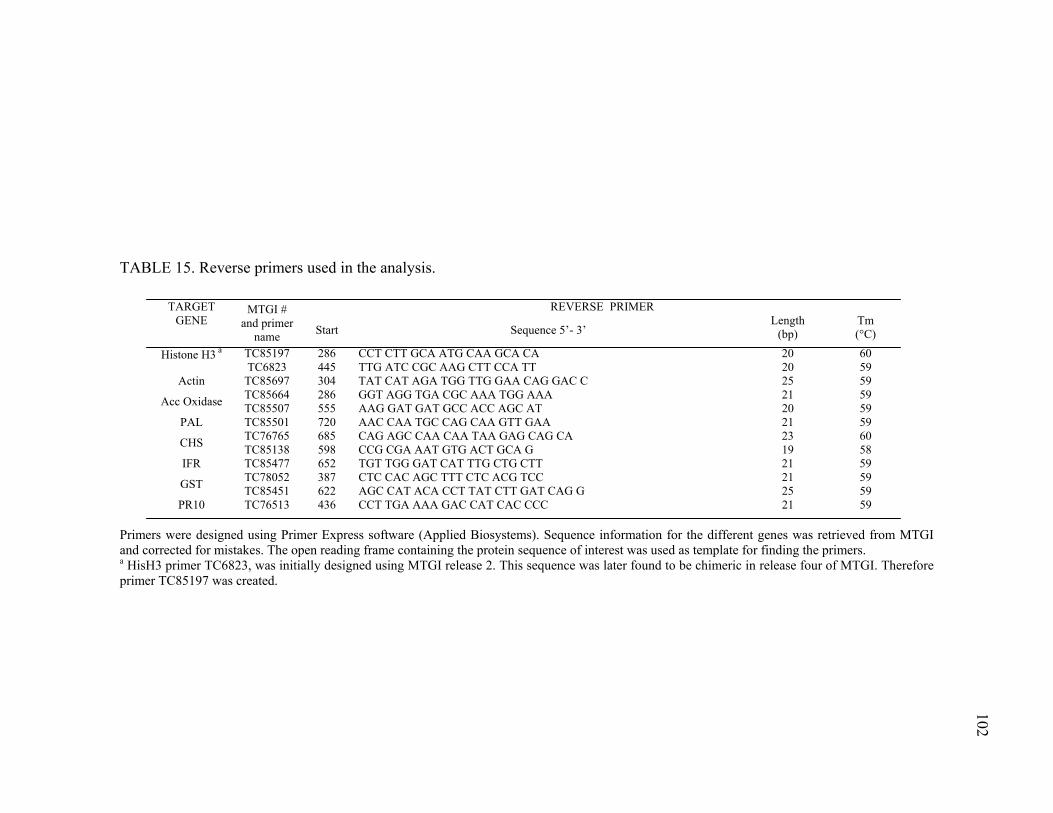
102
TABLE 15. Reverse primers used in the analysis.
REVERSE PRIMER TARGET GENE
MTGI # and primer
name Start Sequence 5’- 3’ Length
(bp) Tm (°C)
TC85197 286 CCT CTT GCA ATG CAA GCA CA 20 60 Histone H3 a TC6823 445 TTG ATC CGC AAG CTT CCA TT 20 59
Actin TC85697 304 TAT CAT AGA TGG TTG GAA CAG GAC C 25 59 TC85664 286 GGT AGG TGA CGC AAA TGG AAA 21 59 Acc Oxidase TC85507 555 AAG GAT GAT GCC ACC AGC AT 20 59
PAL TC85501 720 AAC CAA TGC CAG CAA GTT GAA 21 59 TC76765 685 CAG AGC CAA CAA TAA GAG CAG CA 23 60 CHS TC85138 598 CCG CGA AAT GTG ACT GCA G 19 58
IFR TC85477 652 TGT TGG GAT CAT TTG CTG CTT 21 59 TC78052 387 CTC CAC AGC TTT CTC ACG TCC 21 59 GST TC85451 622 AGC CAT ACA CCT TAT CTT GAT CAG G 25 59
PR10 TC76513 436 CCT TGA AAA GAC CAT CAC CCC 21 59 Primers were designed using Primer Express software (Applied Biosystems). Sequence information for the different genes was retrieved from MTGI and corrected for mistakes. The open reading frame containing the protein sequence of interest was used as template for finding the primers. a HisH3 primer TC6823, was initially designed using MTGI release 2. This sequence was later found to be chimeric in release four of MTGI. Therefore primer TC85197 was created.
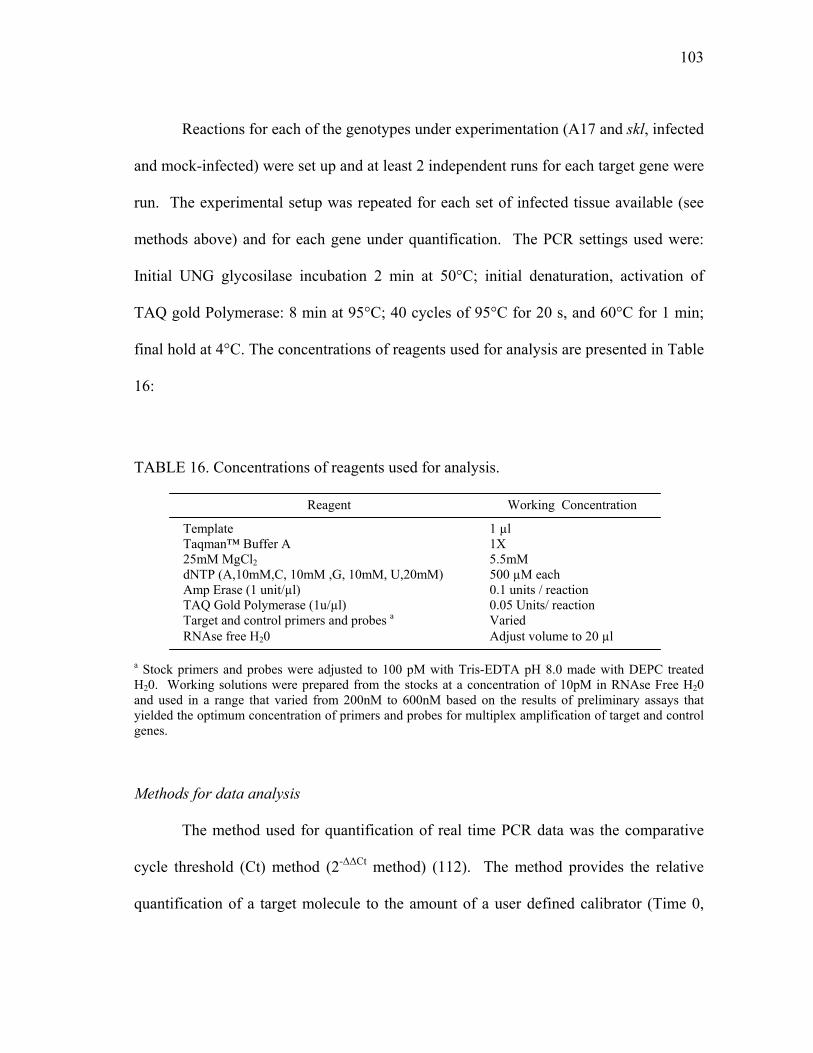
103
Reactions for each of the genotypes under experimentation (A17 and skl, infected
and mock-infected) were set up and at least 2 independent runs for each target gene were
run. The experimental setup was repeated for each set of infected tissue available (see
methods above) and for each gene under quantification. The PCR settings used were:
Initial UNG glycosilase incubation 2 min at 50°C; initial denaturation, activation of
TAQ gold Polymerase: 8 min at 95°C; 40 cycles of 95°C for 20 s, and 60°C for 1 min;
final hold at 4°C. The concentrations of reagents used for analysis are presented in Table
16:
TABLE 16. Concentrations of reagents used for analysis.
a Stock primers and probes were adjusted to 100 pM with Tris-EDTA pH 8.0 made with DEPC treated H20. Working solutions were prepared from the stocks at a concentration of 10pM in RNAse Free H20 and used in a range that varied from 200nM to 600nM based on the results of preliminary assays that yielded the optimum concentration of primers and probes for multiplex amplification of target and control genes. Methods for data analysis
The method used for quantification of real time PCR data was the comparative
cycle threshold (Ct) method (2-∆∆Ct method) (112). The method provides the relative
quantification of a target molecule to the amount of a user defined calibrator (Time 0,
Reagent Working Concentration
Template 1 µl Taqman™ Buffer A 1X 25mM MgCl2 5.5mM dNTP (A,10mM,C, 10mM ,G, 10mM, U,20mM) 500 µM each Amp Erase (1 unit/µl) 0.1 units / reaction TAQ Gold Polymerase (1u/µl) 0.05 Units/ reaction Target and control primers and probes a Varied RNAse free H20 Adjust volume to 20 µl

104
noninoculated A17 samples in this case) and normalized to the amount of a reference
molecule (histone H3 or actin). A user defined threshold cycle (Ct) is set to record the
cycle number during the PCR amplification protocol at which the signal representing
amplified target and reference molecules surpasses an arbitrary value or threshold that
differentiates between background and true fluorescence. This threshold is usually set as
10x the standard deviation of the background fluorescence of the system, but can be as
low as 3x the standard deviation of the background fluorescence (72, 85). The calibrator
is a user-defined sample which Ct value is used as norm to compare the rest of the
samples (72, 85, 112).
For each experimental sample, the Ct for target and reference molecules were
calculated. To normalize the data, the difference in the Ct of the target and the Ct of the
reference, called ∆Ct was calculated. The next step was to subtract the ∆Ct of each
sample from the ∆Ct of the calibrator to find the ∆∆Ct value. Finally, the amount of
target normalized to an internal reference and relative to a calibrator sample was
calculated by 2-∆∆Ct. Experimental data was expressed as fold change relative to the
calibrator. The derivation of the formula is presented in the Appendix.
In order for the method to be valid, the efficiency of target amplification and
reference amplification must be similar. This hypothesis was proven by looking at how
∆Ct of target and reference molecules changed with template dilution. If the
amplification efficiency of both molecules was similar, the absolute value of the slope of
log input amount of template vs. ∆Ct was expected to be less than 0.1. Therefore, for
each of the experiments involving quantification by real time PCR, this validation
105
experiment was performed (Applied Biosystems User Bulletin #2 or Livak et al. [112]).
In the cases that the validation experiment resulted in values above 0.1, absolute
quantification of target concentration based on the extrapolation of experimental data
from the standards run was used. In those cases, the extrapolated concentration was
used to calculate the fold change relative to the initial concentration of the calibrator.
RESULTS
In silica Analysis of Candidate Gene Families
Ethylene biosynthesis pathway homologues
The search for ACC oxidase homologues yielded five hits with e- values ranging
from 2.1 x 10-71 to 8.8 x 10-133. The search was done using ACC oxidase from
Arabidopsis (gi: 20141261) as the query. The top 3 hits, TC85507, TC85665, and
TC85664, all have high conservation, being 86, 89, and 87 percent similar and 74
percent identical to the query sequence. The three sequences were colinear with the full
sequence of the query protein. TC85507 has 154 EST; TC85665 has 27 EST and
TC85664 has 44 EST. cDNA library expression analyses showed that ACC oxidase was
expressed under most conditions and tissues (Fig. 19). The comparison of patterns for
TC85507 and TC85664 revealed that TC85507 was heavily induced in the yeast elicited
cell culture library (70 EST), while TC85664 only had 1 EST sequenced from this
library. A similar pattern was observed upon comparison of the number of EST found
for both contigs in roots treated with either beta-glucan or oligogalacturonide elicitors.
Symbiotic interaction libraries showed further interesting contrasts. For example,
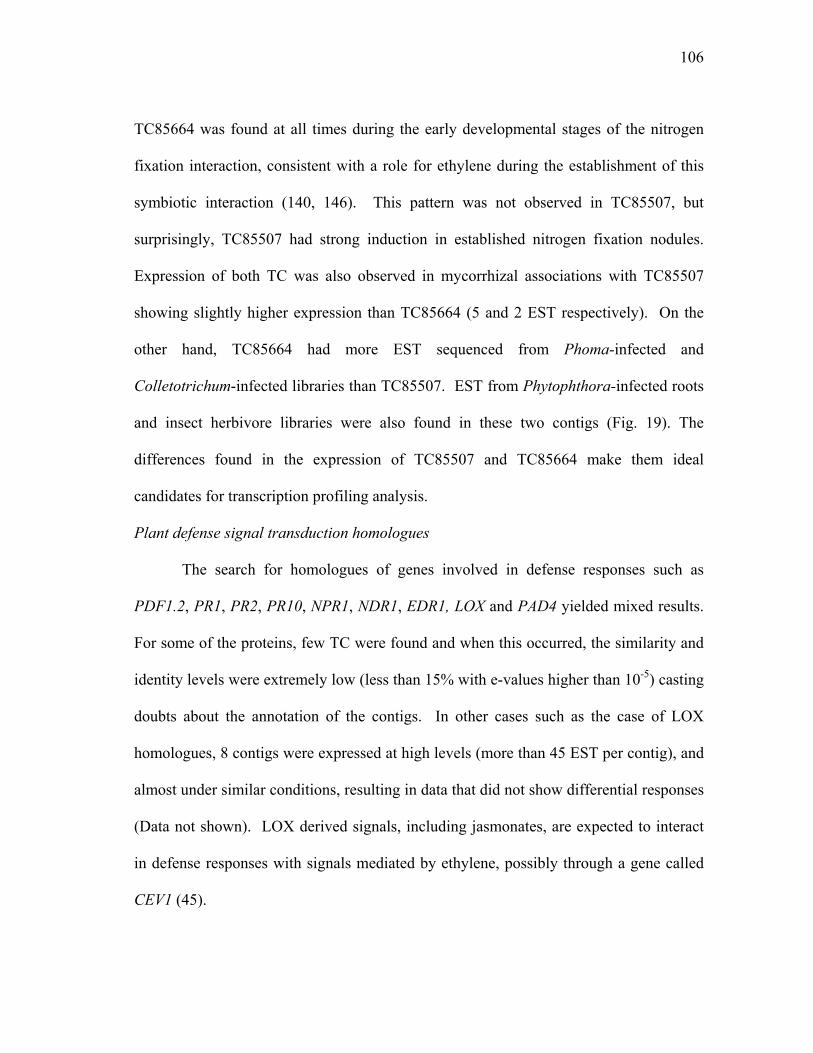
106
TC85664 was found at all times during the early developmental stages of the nitrogen
fixation interaction, consistent with a role for ethylene during the establishment of this
symbiotic interaction (140, 146). This pattern was not observed in TC85507, but
surprisingly, TC85507 had strong induction in established nitrogen fixation nodules.
Expression of both TC was also observed in mycorrhizal associations with TC85507
showing slightly higher expression than TC85664 (5 and 2 EST respectively). On the
other hand, TC85664 had more EST sequenced from Phoma-infected and
Colletotrichum-infected libraries than TC85507. EST from Phytophthora-infected roots
and insect herbivore libraries were also found in these two contigs (Fig. 19). The
differences found in the expression of TC85507 and TC85664 make them ideal
candidates for transcription profiling analysis.
Plant defense signal transduction homologues
The search for homologues of genes involved in defense responses such as
PDF1.2, PR1, PR2, PR10, NPR1, NDR1, EDR1, LOX and PAD4 yielded mixed results.
For some of the proteins, few TC were found and when this occurred, the similarity and
identity levels were extremely low (less than 15% with e-values higher than 10-5) casting
doubts about the annotation of the contigs. In other cases such as the case of LOX
homologues, 8 contigs were expressed at high levels (more than 45 EST per contig), and
almost under similar conditions, resulting in data that did not show differential responses
(Data not shown). LOX derived signals, including jasmonates, are expected to interact
in defense responses with signals mediated by ethylene, possibly through a gene called
CEV1 (45).
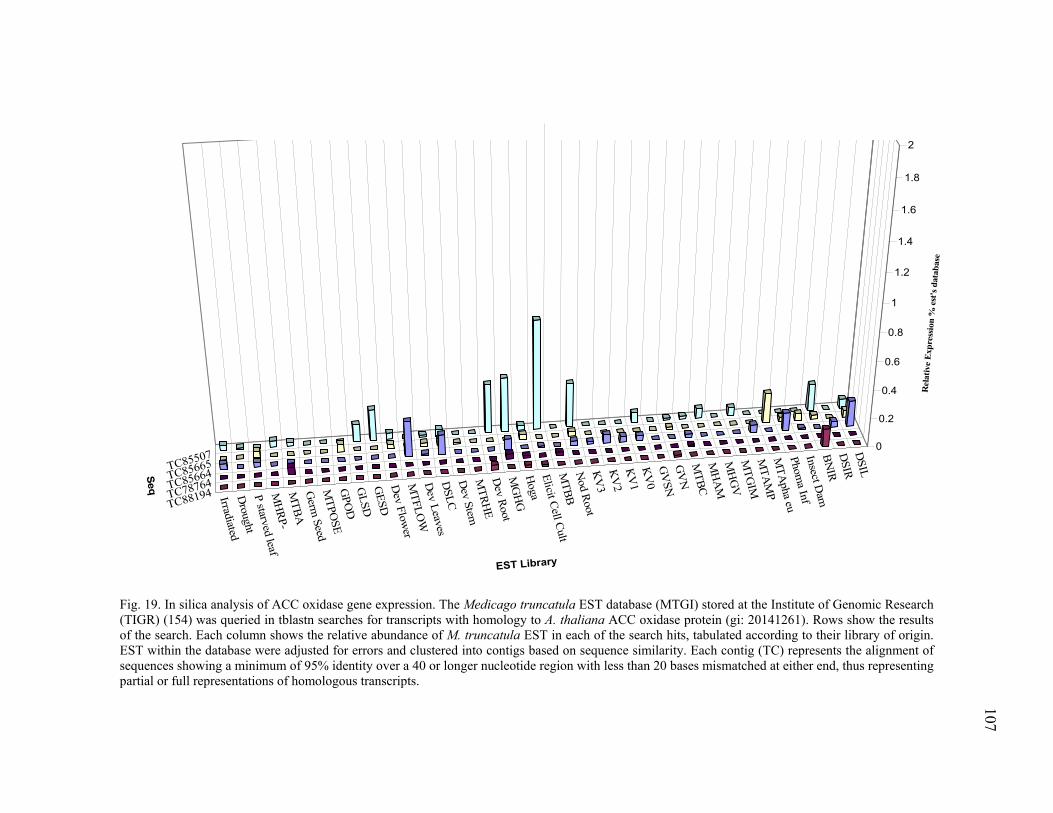
107
DSIL
DSIR
BNIR
Insect Dam
Phoma Inf
MTA
pha eu
MTA
MP
MTG
IM
MH
GV
MH
AM
MTBC
GV
N
GV
SN
KV
0
KV
1
KV
2
KV
3
Nod Root
MTBB
Elicit Cell Cult
Hoga
MG
HG
Dev Root
MTRH
E
Dev Stem
DSLC
Dev Leaves
MTFLO
W
Dev Flow
er
GESD
GLSD
GPO
D
MTPO
SE
Germ
Seed
MTBA
MH
RP-
P starved leaf
Drought
Irradiated
TC85507
TC85665
TC85664
TC78764
TC88194
0
0.2
0.4
0.6
0.8
1
1.2
1.4
1.6
1.8
2
Rel
ativ
e E
xpre
ssio
n %
est
's d
atab
ase
EST Library
Seq
Fig. 19. In silica analysis of ACC oxidase gene expression. The Medicago truncatula EST database (MTGI) stored at the Institute of Genomic Research (TIGR) (154) was queried in tblastn searches for transcripts with homology to A. thaliana ACC oxidase protein (gi: 20141261). Rows show the results of the search. Each column shows the relative abundance of M. truncatula EST in each of the search hits, tabulated according to their library of origin. EST within the database were adjusted for errors and clustered into contigs based on sequence similarity. Each contig (TC) represents the alignment of sequences showing a minimum of 95% identity over a 40 or longer nucleotide region with less than 20 bases mismatched at either end, thus representing partial or full representations of homologous transcripts.
108
PR10 tblastn searches were based on the constitutively expressed protein PR10
of M. truncatula (gi: 1616609). The search yielded several sequences with complete
homology at the protein level. Differences at the nucleotide level were found mainly in
the untranslated regions of the gene. The homology with this transcript was shared by
several more EST, making their placement into particular TC difficult.
MTGI appears to have three PR10 homologues, TC76513, TC76519 and TC76510.
TC76513 corresponded to the actual PR10 protein from M. truncatula. It was a strongly
expressed transcript, having 379 EST in the contig. EST makeup of TC76513 showed
that it was predominantly constituted by sequences derived from roots infected with
mycorrhizal organisms (MTAMP). TC76513 was also abundant in hepta ß-glucan-
treated (MGHG) cDNA libraries. Interestingly, irradiated tissues and nematode-infected
roots also expressed this transcript abundantly. The expression profile for TC76519
almost mirrors that of TC76513 but at a smaller scale (Fig. 20). Because of the high
induction of PR10 and its expected responsiveness to ethylene/jasmonate signals,
TC76513 was chosen for transcription profiling analysis.
Stress and detoxifying pathways
A large number of stress and detoxification responses are handled by proteins
such as GST. Homologues of this protein were identified in MTGI using an auxin-
inducible GST from soybean (gi: 2920666) as the query. Soybean GST protein family
and, in general, plant GSTs are members of large gene families; therefore, it was no
surprise to find several tentative contigs sharing high homology to the soybean sequence.
109
DSIL
DSIR
BN
IR
Insect Dam
Phoma Inf
MTA
pha eu
MTA
MP
MTG
IM
MH
GV
MH
AM
MTB
C
GV
N
GV
SN
KV
0
KV
1
KV
2
KV
3
Nod R
oot
MTB
B
Elicit Cell Cult
Hoga
MG
HG
Dev R
oot
MTRH
E
Dev Stem
DSLC
Dev Leaves
MTFLO
W
Dev Flow
er
GESD
GLSD
GPO
D
MTPO
SE
Germ
Seed
MTBA
MH
RP-
P starved leaf
Drought
Irradiated
TC76513
TC76519
TC76510
0
0.2
0.4
0.6
0.8
1
1.2
1.4
1.6
1.8
2
Rel
ativ
e Ex
pres
sion
% e
st's
data
base
EST Library
Seq
Fig. 20. In silica analysis of PR10 gene expression. The Medicago truncatula EST database (MTGI) stored at the Institute of Genomic Research (TIGR) (154) was queried in tblastn searches for transcripts with homology to PR10 protein of M. truncatula (gi: 1616609). Rows show the results of the search. Each column shows the relative abundance of M. truncatula EST in each of the search hits, tabulated according to their library of origin. EST within the database were adjusted for errors and clustered into contigs based on sequence similarity. Each contig (TC) represents the alignment of sequences showing a minimum of 95% identity over a 40 or longer nucleotide region with less than 20 bases mismatched at either end, thus representing partial or full representations of homologous transcripts.
110
In total, 28 contigs were identified, the great majority of which appear to contain
full-length protein coding regions. The e-values for the different hits ranged from
1.3x10-102 for the closest homologue, to 5.0x10⁻³⁰ for the most diverged sequence
analyzed. At the amino acid level, identity and similarity values ranged from 81%
identity and 94% similarity for the closest hit to 40% identity and 55% similarity for the
most distant homologue.
In silica expression analysis revealed that most contigs were expressed in many
different cDNA libraries. TC85451, the closest homologue to the query sequence, was
the most highly expressed, with 188 EST making up the contig. The EST forming this
contig were sequenced from a variety of tissues and conditions including leaves infected
with C. trifolii and roots treated with hepta ß-glucan elicitors. TC85451 also had several
EST sequenced from plant tissues taken at different stages of plant development,
including healthy leaves and stems, developing flowers, developing leaves, seeds and
pods. TC85451 was also well represented in abiotic stress libraries, including drought
and N or P starvation. EST for TC85451 were also encountered in roots infected with P.
medicaginis or M. incognita, as well as in leaves infected by Phoma medicaginis or fed
on by insects. Although the remaining GST contigs were expressed at low levels and in
different libraries, common patterns in regulation seemed to be biotic and abiotic stress.
Whereas scattered, the induction of GST homologues in response to fungal, oomycete,
nematode, insect feeding, and mycorrhizal fungi can be seen in Fig. 21.
Abiotic factors, including UV irradiation, yeast elicitor, and fungal and plant cell
wall oligosaccharides also were correlated with gene expression. The highest induction
111
of any GST homologue was found to be that of TC85868 after Glomus intraradices
(MGIM) expression. TC85868 seemed to be expressed at the very high value of 2.2% of
the EST in MGIM, well above the scale of the graph (0.5%).
By contrast to TC85451, TC78052 was not expressed in hepta ß glucan treated
tissue. A very low level of expression was seen for TC78052 in Phytophthora infected
roots (DSIR) and Colletotrichum infected leaves (DSIL) (only 1 EST was sequenced in
each case). Interestingly, elicited cell cultures KV1, MHAM, MTBC, and MTBA
contained both TC85451 and TC78052. TC78052 and TC85451 were chosen for
transcription profiling analysis.
Phenylpropanoid metabolism homologues
Three proteins from the phenylpropanoid pathway were mined from the EST data
set: PAL, the first enzyme in the process, CHS, an intermediate enzyme, and IFR, one of
the last enzymes involved in the production of the phytoalexin medicarpin.
PAL homologues. The search for PAL homologues was based on M. sativa PAL (gi:
129590). The results showed extremely high conservation between the query sequence
and three MTGI tentative contigs (Table 17). Two additional sequences, TC85503 and
TC85504, were also detected but were only partial hits, with 27% and 22% coverage,
respectively. Nonetheless, in all the cases, the close phylogenetic relationship among the
two organisms was reflected in the degree of homology among the sequences (Table 17).
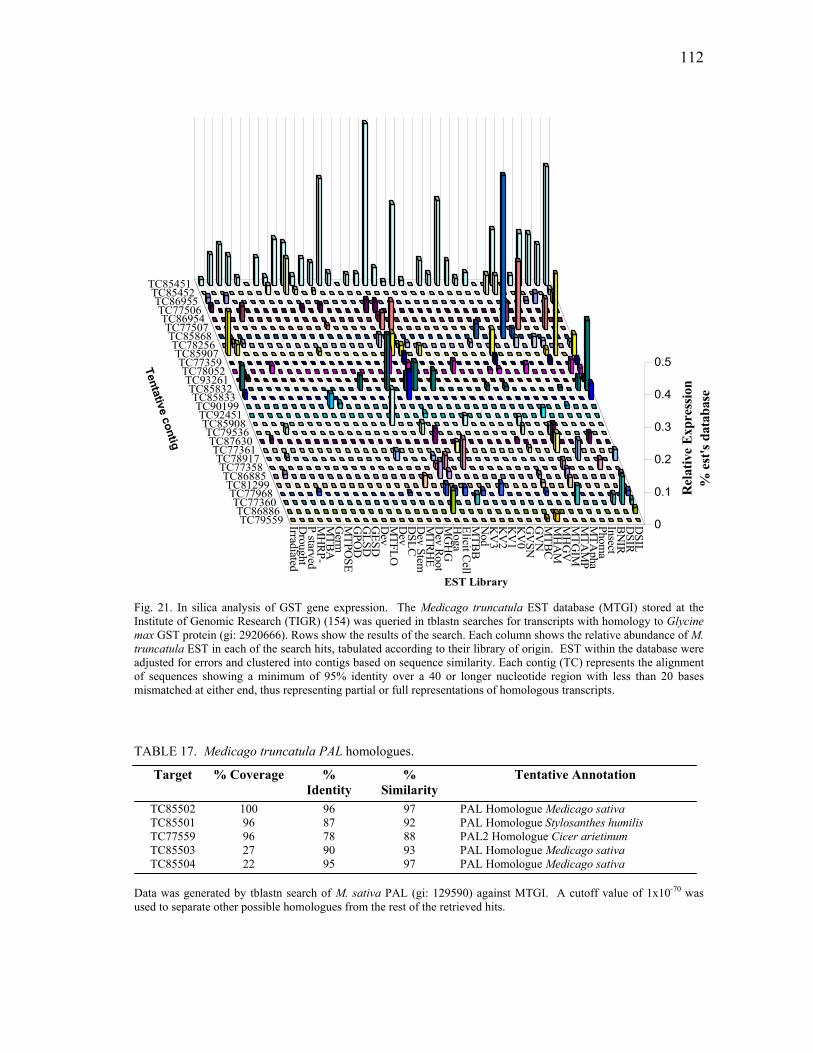
112
0
0.1
0.2
0.3
0.4
0.5
Rel
ativ
e E
xpre
ssio
n%
est
's d
atab
ase
DSIL
DSIR
BN
IRInsectPhom
aM
TApha
MTA
MP
MTG
IMM
HG
VM
HA
MM
TBC
GV
NG
VSN
KV
0K
V1
KV
2K
V3
Nod
MTB
BElicit C
ellH
ogaM
GH
GD
ev Root
MTR
HE
Dev Stem
DSLC
Dev
MTFLO
Dev
GESD
GLSD
GPO
DM
TPOSE
Germ
MTB
AM
HR
P-P starvedD
roughtIrradiated
TC85451TC85452TC86955TC77506TC86954TC77507TC85868TC78256TC85907TC77359TC78052TC93261TC85832TC85833TC90199TC92451TC85908TC79536TC87630TC77361TC78917TC77358TC86885TC81299TC77968TC77360TC86886TC79559
Tentative contig
EST Library Fig. 21. In silica analysis of GST gene expression. The Medicago truncatula EST database (MTGI) stored at the Institute of Genomic Research (TIGR) (154) was queried in tblastn searches for transcripts with homology to Glycine max GST protein (gi: 2920666). Rows show the results of the search. Each column shows the relative abundance of M. truncatula EST in each of the search hits, tabulated according to their library of origin. EST within the database were adjusted for errors and clustered into contigs based on sequence similarity. Each contig (TC) represents the alignment of sequences showing a minimum of 95% identity over a 40 or longer nucleotide region with less than 20 bases mismatched at either end, thus representing partial or full representations of homologous transcripts.
TABLE 17. Medicago truncatula PAL homologues.
Target % Coverage % Identity
% Similarity
Tentative Annotation
TC85502 100 96 97 PAL Homologue Medicago sativa TC85501 96 87 92 PAL Homologue Stylosanthes humilis TC77559 96 78 88 PAL2 Homologue Cicer arietinum TC85503 27 90 93 PAL Homologue Medicago sativa TC85504 22 95 97 PAL Homologue Medicago sativa
Data was generated by tblastn search of M. sativa PAL (gi: 129590) against MTGI. A cutoff value of 1x10-70 was used to separate other possible homologues from the rest of the retrieved hits.
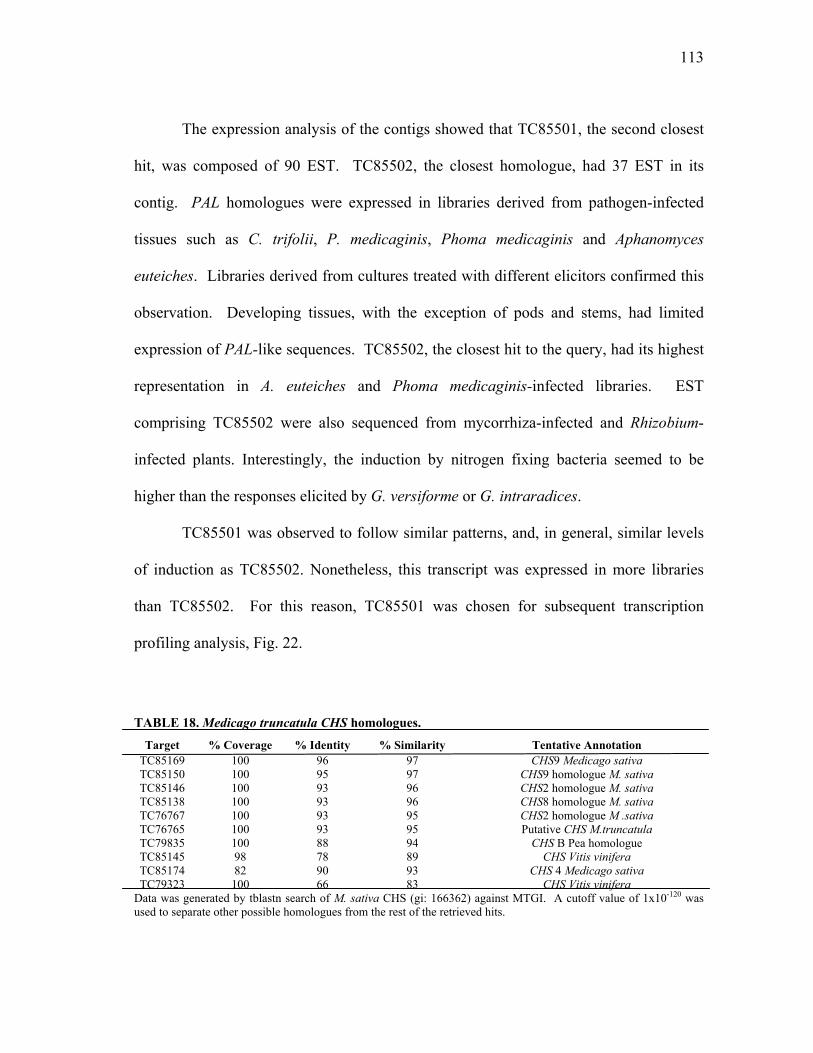
113
The expression analysis of the contigs showed that TC85501, the second closest
hit, was composed of 90 EST. TC85502, the closest homologue, had 37 EST in its
contig. PAL homologues were expressed in libraries derived from pathogen-infected
tissues such as C. trifolii, P. medicaginis, Phoma medicaginis and Aphanomyces
euteiches. Libraries derived from cultures treated with different elicitors confirmed this
observation. Developing tissues, with the exception of pods and stems, had limited
expression of PAL-like sequences. TC85502, the closest hit to the query, had its highest
representation in A. euteiches and Phoma medicaginis-infected libraries. EST
comprising TC85502 were also sequenced from mycorrhiza-infected and Rhizobium-
infected plants. Interestingly, the induction by nitrogen fixing bacteria seemed to be
higher than the responses elicited by G. versiforme or G. intraradices.
TC85501 was observed to follow similar patterns, and, in general, similar levels
of induction as TC85502. Nonetheless, this transcript was expressed in more libraries
than TC85502. For this reason, TC85501 was chosen for subsequent transcription
profiling analysis, Fig. 22.
TABLE 18. Medicago truncatula CHS homologues.
Target % Coverage % Identity % Similarity Tentative Annotation TC85169 100 96 97 CHS9 Medicago sativa TC85150 100 95 97 CHS9 homologue M. sativa TC85146 100 93 96 CHS2 homologue M. sativa TC85138 100 93 96 CHS8 homologue M. sativa TC76767 100 93 95 CHS2 homologue M .sativa TC76765 100 93 95 Putative CHS M.truncatula TC79835 100 88 94 CHS B Pea homologue TC85145 98 78 89 CHS Vitis vinifera TC85174 82 90 93 CHS 4 Medicago sativa TC79323 100 66 83 CHS Vitis vinifera
Data was generated by tblastn search of M. sativa CHS (gi: 166362) against MTGI. A cutoff value of 1x10-120 was used to separate other possible homologues from the rest of the retrieved hits.

114
DSIL
DSIR
BNIR
Insect Dam
Phoma Inf
MTA
pha euM
TAM
PM
TGIM
MH
GV
MH
AM
MTBC
GV
NG
VSN
KV
0K
V1
KV
2K
V3
Nod Root
MTBB
Elicit Cell CultH
ogaM
GH
GD
ev RootM
TRHE
Dev Stem
DSLC
Dev Leaves
MTFLO
WD
ev Flower
GESD
Germ
SeedG
LSDG
POD
MTPO
SEM
TBAM
HRP-
P starved leafD
roughtIrradiated
MtR108N
oK
VK
CTC85138
TC85145
TC85169
TC76765
TC85146
TC76767
TC85150
TC79323
TC85174
TC79835
0
0.1
0.2
0.3
0.4
0.5
Rel
ativ
e Exp
ress
ion
% es
t's...
EST Library
Seq
Fig. 22. In silica analysis of PAL gene expression. The Medicago truncatula EST database (MTGI) stored at the Institute of Genomic Research (TIGR) (154) was queried in tblastn searches for transcripts with homology to M. sativa PAL (gi: 129590). Rows show the results of the search. Each column shows the relative abundance of M. truncatula EST in each of the search hits, tabulated according to their library of origin. EST within the database were adjusted for errors and clustered into contigs based on sequence similarity. Each contig (TC) represents the alignment of sequences showing a minimum of 95% identity over a 40 or longer nucleotide region with less than 20 bases mismatched at either end, thus representing partial or full representations of homologous transcripts.
115
Chalcone Synthase homologues. This search was based on M. sativa CHS1 (gi:
166362), and 10 hits were found to contain high homology to CHS1. Most of the hits
covered the entire length of the query protein (Table 18). Expression analyses of the
contigs showed that most of them were expressed under pathogen attack or following
elicitor treatment. Interestingly, the abundance of EST induced by symbiotic organisms
(Rhizobium and Glomus) was lower than that observed after pathogen challenge.
Minimal induction of CHS transcripts (less than 4 EST) was seen in most of the flower-
and seed-derived libraries, libraries from developing leaves and stems, or tissue under
abiotic stress including nitrogen or phosphate starvation or drought.
The strongest induction observed was for TC85138 upon exposure to yeast
elicitors. Roots and leaves inoculated with P. medicaginis and Phoma medicaginis also
strongly induced this same transcript. TC85138 was not found in most of the libraries
derived from Rhizobium infection, but its transcripts were found highly expressed in
established symbiotic interactions with Rhizobium (Nod roots, 10 EST). Conversely,
other transcripts were expressed in the different Rhizobium-infected libraries (KV0,
KV1, KV2, KV3, GVN, GVSN, etc). The high levels of expression seen under these
three conditions suggest that TC85138 is a good candidate for transcription profiling
analysis. A different homologue, TC76765, was also expressed at high levels and in
libraries such as DSIL (C. trifolii infected), DSIR (P. medicaginis infected), NBIR (M.
incognita infected) and Phoma medicaginis infected. Expression of TC76765 in elicited
cell cultures was high, but curiously its expression was almost nonexistent in HOGA or
116
MGHG. These last two libraries represent treatments where elicitors of defense
responses were also used. TC85138, for example, was present in all these three libraries.
TC76765 was also almost silent in symbiotic responses to S. meliloti (low expression in
KV0, KV2 and GVN), and in this sense, TC76765 shows different regulation and
induction conditions than TC85138 and somewhat similar conditions to TC85145 and
other homologues. Expression of TC76765 in roots infected with P. medicaginis (2
EST) was also lower than TC85138 (8 EST), but both transcripts were similarly induced
by Phoma medicaginis infection. The observed different regulation and expression
conditions of TC76765 make it another good candidate for transcription profiling
analysis, Fig. 23.
Isoflavone Reductase homologues. The query sequence used for the tblastn search was
M. sativa IFR (gi: 19620). This protein is 318 aa long and its comparison against MTGI
yielded seven sequences sharing homology. Of the seven hits, only one had an almost
perfect match with the query sequence. TC85477 had 98% identity and 99% similarity,
for an e-value of 6.6x10-167 (Table 19). Besides these seven sequences, an additional hit
was found to partially cover the C-terminal end of the query protein. The homology of
this contig was high, being 98% identical and 99% similar to the query sequence. Two
singletons were also found to have homology to the query. Table 19 shows the different
findings.
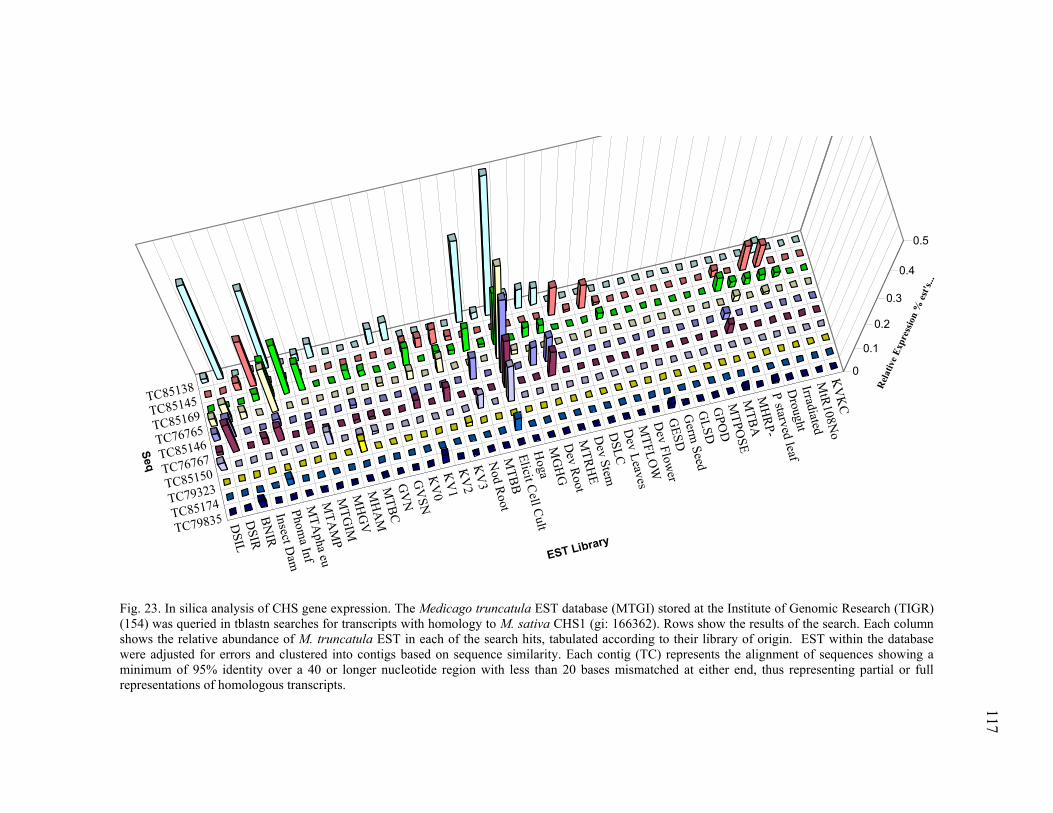
117
DSIL
DSIR
BNIR
Insect Dam
Phoma Inf
MTA
pha euM
TAM
PM
TGIM
MH
GV
MH
AM
MTBC
GV
NG
VSN
KV
0K
V1
KV
2K
V3
Nod Root
MTBB
Elicit Cell CultH
ogaM
GH
GD
ev RootM
TRHE
Dev Stem
DSLC
Dev Leaves
MTFLO
WD
ev Flower
GESD
Germ
SeedG
LSDG
POD
MTPO
SEM
TBAM
HRP-
P starved leafD
roughtIrradiated
MtR108N
oK
VK
CTC85138
TC85145
TC85169
TC76765
TC85146
TC76767
TC85150
TC79323
TC85174
TC79835
0
0.1
0.2
0.3
0.4
0.5
Rel
ativ
e Exp
ress
ion
% es
t's...
EST Library
Seq
Fig. 23. In silica analysis of CHS gene expression. The Medicago truncatula EST database (MTGI) stored at the Institute of Genomic Research (TIGR) (154) was queried in tblastn searches for transcripts with homology to M. sativa CHS1 (gi: 166362). Rows show the results of the search. Each column shows the relative abundance of M. truncatula EST in each of the search hits, tabulated according to their library of origin. EST within the database were adjusted for errors and clustered into contigs based on sequence similarity. Each contig (TC) represents the alignment of sequences showing a minimum of 95% identity over a 40 or longer nucleotide region with less than 20 bases mismatched at either end, thus representing partial or full representations of homologous transcripts.
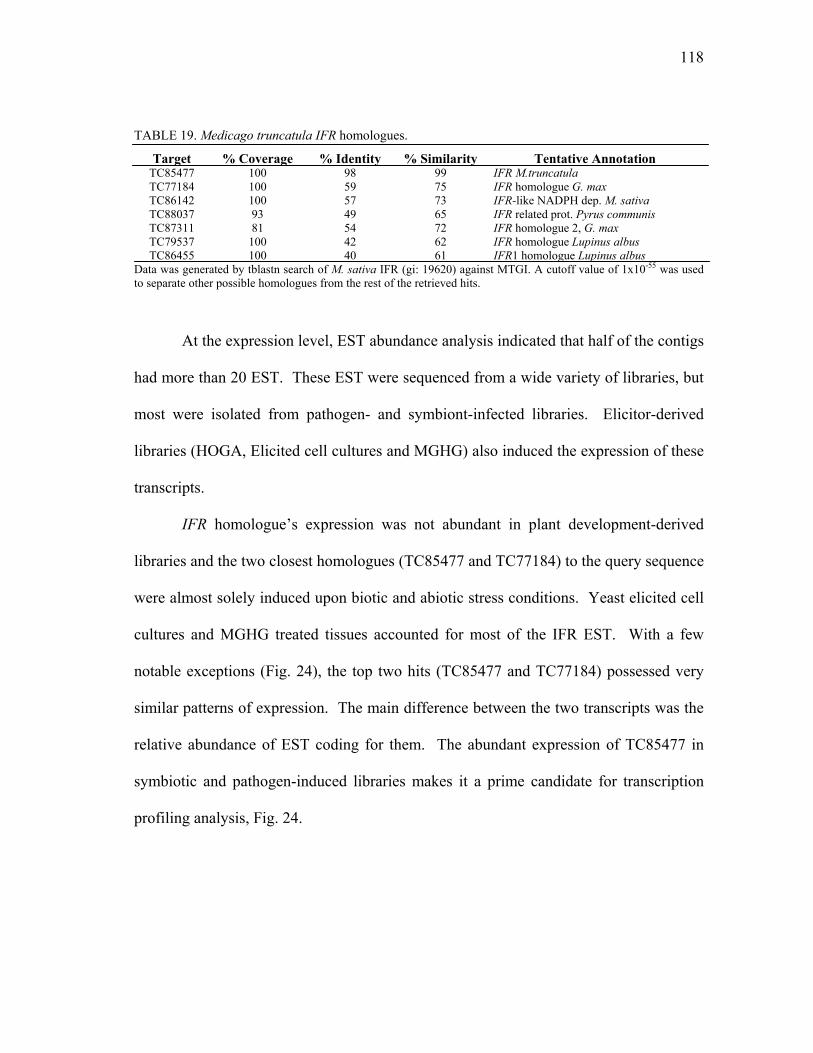
118
TABLE 19. Medicago truncatula IFR homologues.
Target % Coverage % Identity % Similarity Tentative Annotation TC85477 100 98 99 IFR M.truncatula TC77184 100 59 75 IFR homologue G. max TC86142 100 57 73 IFR-like NADPH dep. M. sativa TC88037 93 49 65 IFR related prot. Pyrus communis TC87311 81 54 72 IFR homologue 2, G. max TC79537 100 42 62 IFR homologue Lupinus albus TC86455 100 40 61 IFR1 homologue Lupinus albus
Data was generated by tblastn search of M. sativa IFR (gi: 19620) against MTGI. A cutoff value of 1x10-55 was used to separate other possible homologues from the rest of the retrieved hits.
At the expression level, EST abundance analysis indicated that half of the contigs
had more than 20 EST. These EST were sequenced from a wide variety of libraries, but
most were isolated from pathogen- and symbiont-infected libraries. Elicitor-derived
libraries (HOGA, Elicited cell cultures and MGHG) also induced the expression of these
transcripts.
IFR homologue’s expression was not abundant in plant development-derived
libraries and the two closest homologues (TC85477 and TC77184) to the query sequence
were almost solely induced upon biotic and abiotic stress conditions. Yeast elicited cell
cultures and MGHG treated tissues accounted for most of the IFR EST. With a few
notable exceptions (Fig. 24), the top two hits (TC85477 and TC77184) possessed very
similar patterns of expression. The main difference between the two transcripts was the
relative abundance of EST coding for them. The abundant expression of TC85477 in
symbiotic and pathogen-induced libraries makes it a prime candidate for transcription
profiling analysis, Fig. 24.
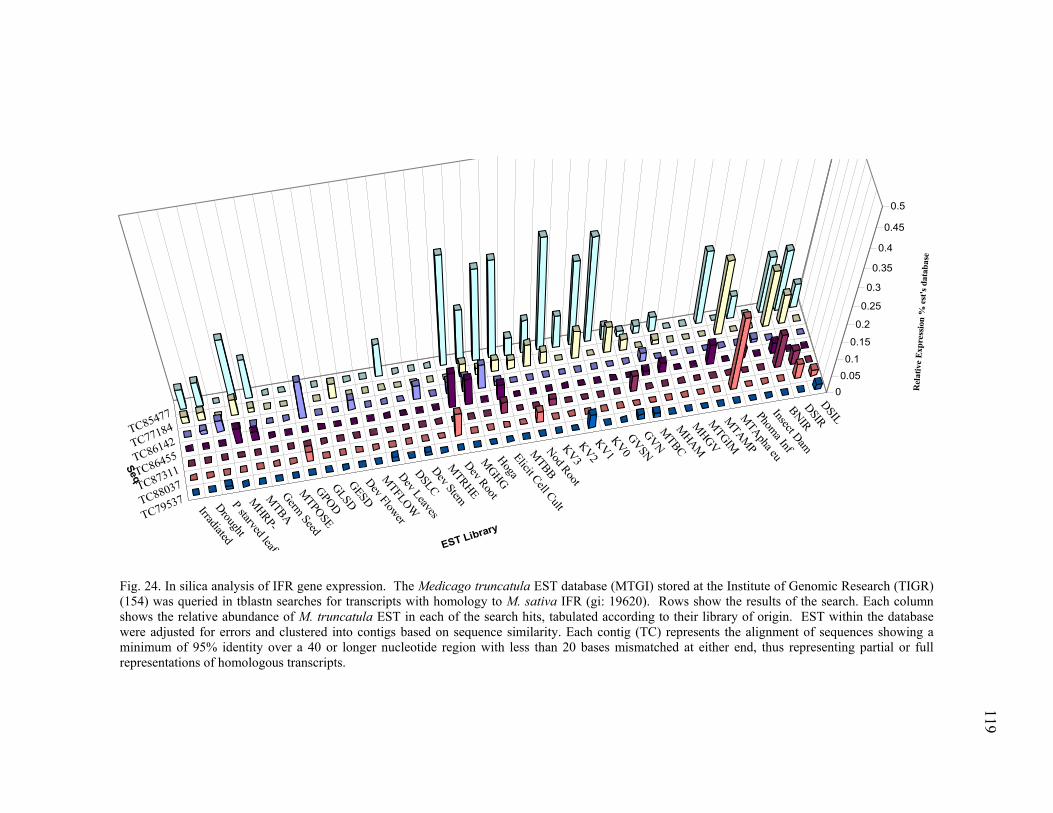
119
DSIL
DSIR
BNIR
Insect Dam
Phoma Inf
MTApha eu
MTAM
P
MTGIM
MHGV
MHAM
MTBC
GVN
GVSN
KV0
KV1
KV2
KV3
Nod Root
MTBB
Elicit Cell Cult
Hoga
MGHG
Dev Root
MTRHE
Dev Stem
DSLC
Dev Leaves
MTFLOW
Dev Flower
GESD
GLSD
GPOD
MTPOSE
Germ Seed
MTBA
MHRP-
P starved leaf
Drought
Irradiated
TC85477
TC77184
TC86142
TC86455
TC87311
TC88037
TC79537
00.050.1
0.15
0.2
0.25
0.3
0.35
0.4
0.45
0.5
Rel
ativ
e Ex
pres
sion
% e
st's
dat
abas
e
EST Library
Seq
Fig. 24. In silica analysis of IFR gene expression. The Medicago truncatula EST database (MTGI) stored at the Institute of Genomic Research (TIGR) (154) was queried in tblastn searches for transcripts with homology to M. sativa IFR (gi: 19620). Rows show the results of the search. Each column shows the relative abundance of M. truncatula EST in each of the search hits, tabulated according to their library of origin. EST within the database were adjusted for errors and clustered into contigs based on sequence similarity. Each contig (TC) represents the alignment of sequences showing a minimum of 95% identity over a 40 or longer nucleotide region with less than 20 bases mismatched at either end, thus representing partial or full representations of homologous transcripts.
120
The comparison of expression profiles between CHS homologues and IFR
homologues showed interesting parallels. For example, both proteins were highly
expressed in elicited cell cultures, nodulated roots, and Phytophthora-infected roots. On
the other hand, these proteins were not to be highly expressed in leaves, pods or flowers.
A low level of induction was similarly observed after infection with
mycorrhizal fungi. Intriguingly, the abundance of EST coding for IFR homologues was
higher than the number of EST coding for CHS homologues in S. meliloti-induced
libraries. In this same sense, nematode infection of roots (BNIR) induced the expression
of CHS and IFR homologues, but again the induction levels for CHS was lower than the
observed IFR levels. This might indicate that the activity of IFR enzyme is required at
higher levels in those particular interactions suggesting medicarpin production.
CHS levels were higher than IFR levels when the plants were exposed to Phoma
medicaginis, an observation that suggests a different response program in the plant
towards this pathogen. PAL expression seems to be lower than CHS, but it is seen to
occur in the same tissues and conditions as IFR and CHS. CHS, which in itself seems to
be the highest expressed of all three enzymes, was also the one with the most number of
homologues found, suggesting a very complex and tightly regulated exchange of signals
within the phenylpropanoid pathway.
121
Real Time PCR Analysis of M. truncatula Homologues
Choice of internal controls for analysis
The control transcripts chosen to normalize the expression profiling experiments
were two constitutively expressed genes, Actin and Histone H3. Analysis of expression
based on the abundance of EST coding for these two sequences is shown in Figures 25
and 26.
To demonstrate the utility of these genes for real time PCR experimentation, they
were initially amplified using M. truncatula genomic DNA. The results of four reactions
per gene with 50 cycles of PCR demonstrated that each target yielded a single product
with the expected size (data not shown). Standard curves for these transcripts using
serial dilutions of template indicated that it was possible to detect a template
concentration ranging from 0.04 ng – 400 ng of DNA (Fig. 27).
To test the amplification of actin and histone controls in a two-target multiplex,
where template concentration of one gene varied relative to the second, a known amount
(1 ng) of Homo sapiens DNA was added to the samples of M. truncatula genomic DNA.
Control reactions amplified extremely well when the amount of M. truncatula template
was below 40ng/µl. The flat line response observed (Fig. 28) means that the
amplification of GAPDH during the PCR reaction was not affected by any template
concentration below that point and that it was possible to generate standard curves for
amplification using both Actin and His H3. These results also demonstrated a high
degree of technical precision, as noted by the similarity in the amplification curves for
GAPDH in experiments using actin as compared to histone.
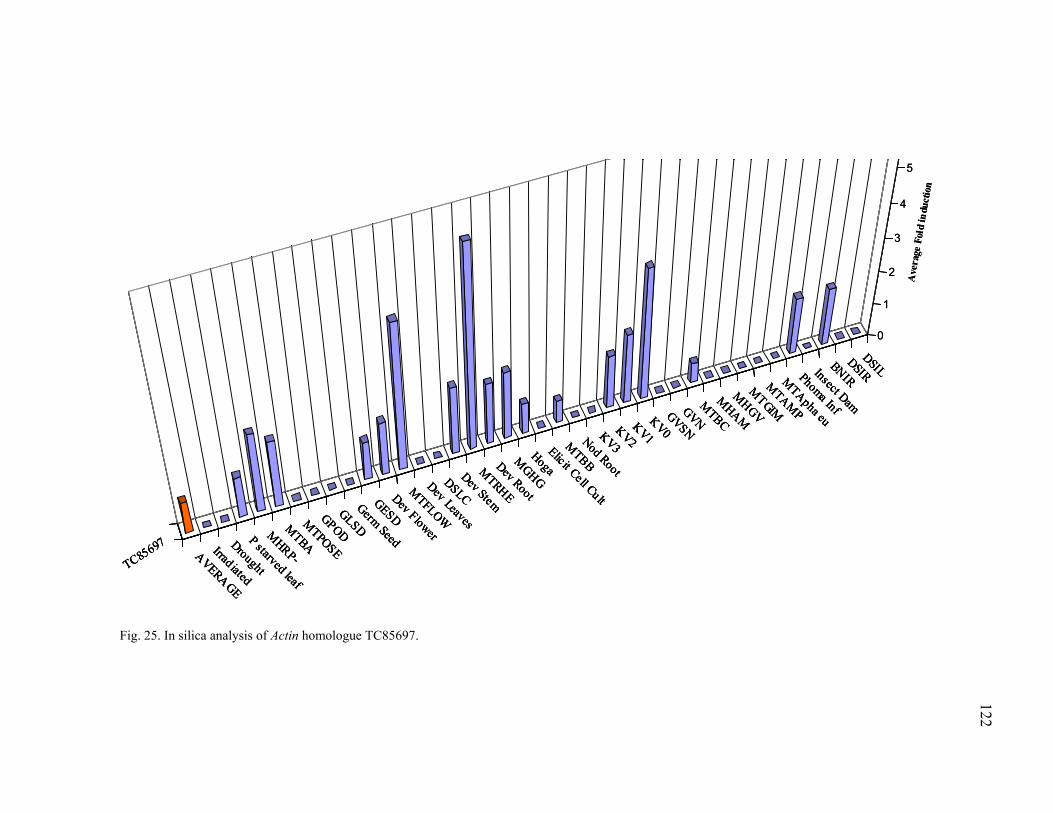
122
Fig. 25. In silica analysis of Actin homologue TC85697.
DSIL
DSIR
BNIR
Insect Dam
Phoma Inf
MTApha eu
MTAMP
MTGIM
MHGV
MHAM
MTBC
GVNGVSN
KV0KV1
KV2KV3Nod Root
MTBB
Elicit Cell Cult
Hoga
MGHG
Dev Root
MTRHE
Dev Stem
DSLC
Dev Leaves
MTFLOW
Dev Flower
GESD
Germ Seed
GLSD
GPOD
MTPOSE
MTBA
MHRP-
P starved leaf
Drought
Irrad iated
AVERAGE
TC85697
0
1
2
3
4
5
Ave
rage
Fol
d in
duct
ion
DSIL
DSIR
BNIR
Insect Dam
Phoma Inf
MTApha eu
MTAMP
MTGIM
MHGV
MHAM
MTBC
GVNGVSN
KV0KV1
KV2KV3Nod Root
MTBB
Elicit Cell Cult
Hoga
MGHG
Dev Root
MTRHE
Dev Stem
DSLC
Dev Leaves
MTFLOW
Dev Flower
GESD
Germ Seed
GLSD
GPOD
MTPOSE
MTBA
MHRP-
P starved leaf
Drought
Irrad iated
AVERAGE
TC85697
DSIL
DSIR
BNIR
Insect Dam
Phoma Inf
MTApha eu
MTAMP
MTGIM
MHGV
MHAM
MTBC
GVNGVSN
KV0KV1
KV2KV3Nod Root
MTBB
Elicit Cell Cult
Hoga
MGHG
Dev Root
MTRHE
Dev Stem
DSLC
Dev Leaves
MTFLOW
Dev Flower
GESD
Germ Seed
GLSD
GPOD
MTPOSE
MTBA
MHRP-
P starved leaf
Drought
Irrad iated
AVERAGE
TC85697
0
1
2
3
4
5
Ave
rage
Fol
d in
duct
ion
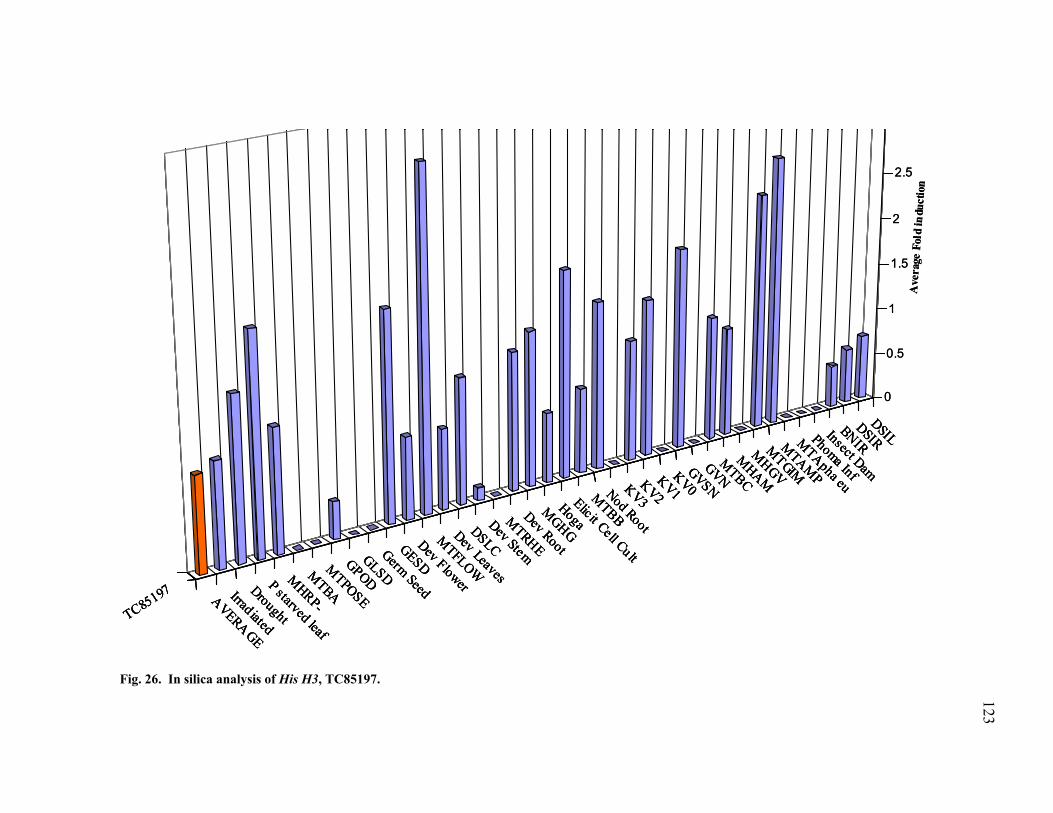
123
Fig. 26. In silica analysis of His H3, TC85197.
DSIL
DSIR
BNIR
Insect Dam
Phoma Inf
MTApha eu
MTAMP
MTGIM
MHGV
MHAM
MTBC
GVN
GVSN
KV0
KV1
KV2
KV3Nod Root
MTBB
Elicit Cell Cu lt
Hoga
MGHG
Dev Root
MTRHE
Dev Stem
DSLC
Dev Leaves
MTFLOW
Dev Flower
GESD
Germ Seed
GLSD
GPOD
MTPOSE
MTBA
MHRP-
P starved leaf
Drought
Irrad iated
AVERAGE
TC85197
0
0.5
1
1.5
2
2.5
Ave
rage
Fol
d in
duct
ion
DSIL
DSIR
BNIR
Insect Dam
Phoma Inf
MTApha eu
MTAMP
MTGIM
MHGV
MHAM
MTBC
GVN
GVSN
KV0
KV1
KV2
KV3Nod Root
MTBB
Elicit Cell Cu lt
Hoga
MGHG
Dev Root
MTRHE
Dev Stem
DSLC
Dev Leaves
MTFLOW
Dev Flower
GESD
Germ Seed
GLSD
GPOD
MTPOSE
MTBA
MHRP-
P starved leaf
Drought
Irrad iated
AVERAGE
TC85197
DSIL
DSIR
BNIR
Insect Dam
Phoma Inf
MTApha eu
MTAMP
MTGIM
MHGV
MHAM
MTBC
GVN
GVSN
KV0
KV1
KV2
KV3Nod Root
MTBB
Elicit Cell Cu lt
Hoga
MGHG
Dev Root
MTRHE
Dev Stem
DSLC
Dev Leaves
MTFLOW
Dev Flower
GESD
Germ Seed
GLSD
GPOD
MTPOSE
MTBA
MHRP-
P starved leaf
Drought
Irrad iated
AVERAGE
TC85197
0
0.5
1
1.5
2
2.5
Ave
rage
Fol
d in
duct
ion
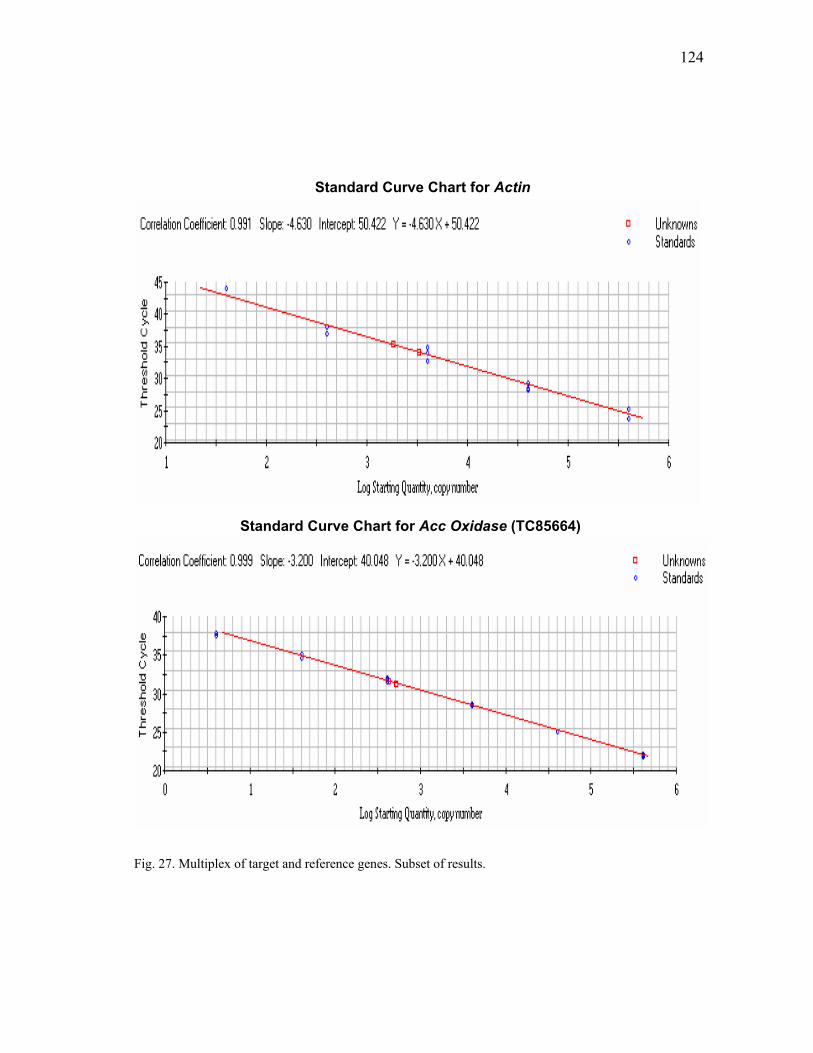
124
Fig. 27. Multiplex of target and reference genes. Subset of results.
Standard Curve Chart for Actin
Standard Curve Chart for Acc Oxidase (TC85664)
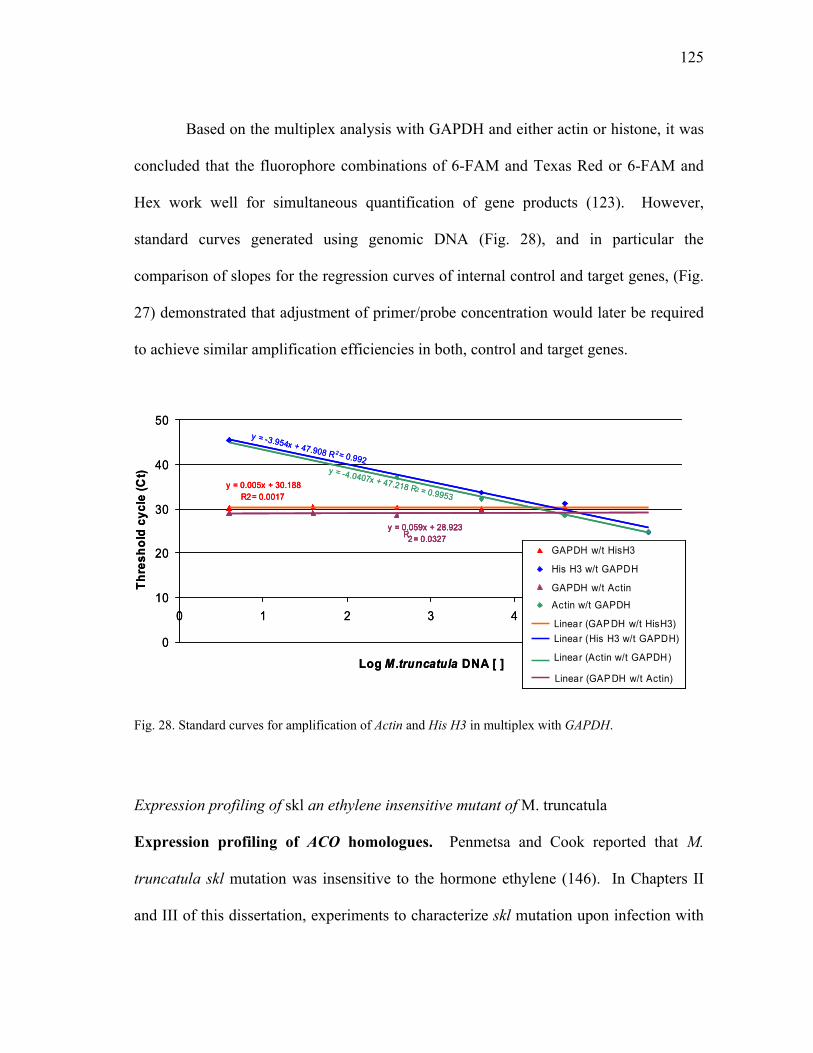
125
Based on the multiplex analysis with GAPDH and either actin or histone, it was
concluded that the fluorophore combinations of 6-FAM and Texas Red or 6-FAM and
Hex work well for simultaneous quantification of gene products (123). However,
standard curves generated using genomic DNA (Fig. 28), and in particular the
comparison of slopes for the regression curves of internal control and target genes, (Fig.
27) demonstrated that adjustment of primer/probe concentration would later be required
to achieve similar amplification efficiencies in both, control and target genes.
y = 0.005x + 30.188R2= 0.0017
y = -3.954x + 47.908 R 2= 0.992y = -4.0407x + 47.218 R2 = 0.9953
Ry = 0.059x + 28.923
2= 0.0327
0
10
20
30
40
50
0 1 2 3 4 5 6
Log M.truncatula DNA [ ]
Thre
shol
d cy
cle
(Ct)
GAPDH w/t HisH3
His H3 w/t GAPDH
GAPDH w/t Actin
Actin w/t GAPDH
Linear (GAP DH w/t HisH3)
Linear (Actin w/t GAPDH)
Linear (GAP DH w/t Actin)
Linear (His H3 w/t GAPDH)
y = 0.005x + 30.188R2= 0.0017
y = 0.005x + 30.188R2= 0.0017
y = -3.954x + 47.908 R 2= 0.992y = -4.0407x + 47.218 R2 = 0.9953
Ry = 0.059x + 28.923
2= 0.0327Ry = 0.059x + 28.923
2= 0.0327y = 0.059x + 28.923
2= 0.0327
0
10
20
30
40
50
0 1 2 3 4 5 6
Log M.truncatula DNA [ ]
Thre
shol
d cy
cle
(Ct)
GAPDH w/t HisH3
His H3 w/t GAPDH
GAPDH w/t Actin
Actin w/t GAPDH
Linear (GAP DH w/t HisH3)
Linear (Actin w/t GAPDH)
Linear (GAP DH w/t Actin)
Linear (His H3 w/t GAPDH)
GAPDH w/t HisH3
His H3 w/t GAPDH
GAPDH w/t Actin
Actin w/t GAPDH
Linear (GAP DH w/t HisH3)
Linear (Actin w/t GAPDH)
Linear (GAP DH w/t Actin)
Linear (His H3 w/t GAPDH)
Fig. 28. Standard curves for amplification of Actin and His H3 in multiplex with GAPDH.
Expression profiling of skl an ethylene insensitive mutant of M. truncatula
Expression profiling of ACO homologues. Penmetsa and Cook reported that M.
truncatula skl mutation was insensitive to the hormone ethylene (146). In Chapters II
and III of this dissertation, experiments to characterize skl mutation upon infection with
126
different pathogens demonstrated that skl plants were hyper-susceptible to infection by
oomycete pathogens. Results of gas chromatography of P. medicaginis-infected roots
showed that skl roots produced ethylene upon infection, but the intensity of the detected
ethylene burst was smaller than the levels observed for infected A17 plants (Chapter III).
To characterize the expression profile of ethylene forming enzymes during
infection by P. medicaginis, amplification of homologues of the ethylene-forming
enzyme ACC oxidase using real time polymerase chain reaction was performed. Based
on in silica analysis of the M. truncatula database (this chapter, previous results), two
contigs with homology to ACC oxidases were chosen for analysis. According to the in
silica analyses, both contigs were highly expressed but showed different expression
profiles according to the treatments and conditions from which each of the EST
comprising the contigs were sequenced. Therefore, these contigs represented good
candidates to analyze differential responses to pathogen infection.
Real time PCR of TC85507 and TC85664 in A17 and skl infected roots revealed
different profiles. Upon P. medicaginis infection, A17 plants expressed both
homologues. In the case of the TC85664 transcript, A17 plants showed a strong initial
induction that was followed by a decrease to almost basal levels during the first 12 hours
after inoculation. At 24 hours, it was possible to see again an increase in transcript
accumulation that peaked at 32 hours, Fig. 29. Later experiments showed that another
increase in expression was observed beginning at 72 hours and continuing through 96
hours (data not shown). TC85507 exhibited a different pattern of expression, with a low
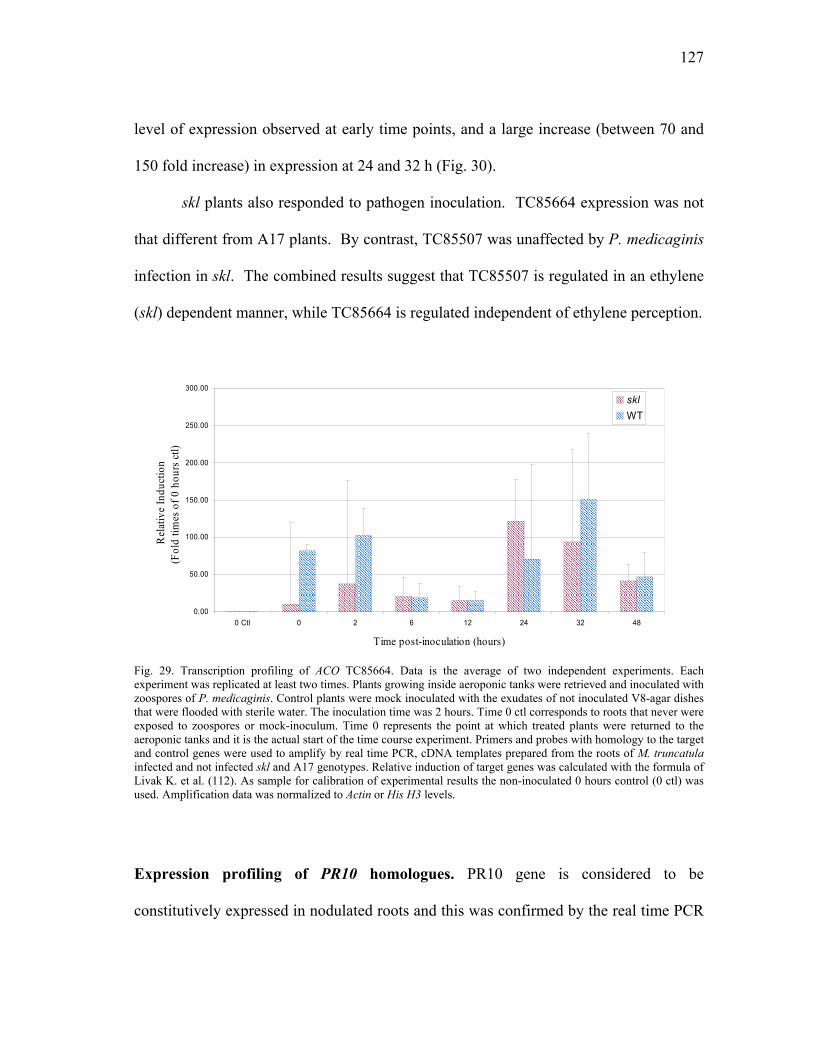
127
level of expression observed at early time points, and a large increase (between 70 and
150 fold increase) in expression at 24 and 32 h (Fig. 30).
skl plants also responded to pathogen inoculation. TC85664 expression was not
that different from A17 plants. By contrast, TC85507 was unaffected by P. medicaginis
infection in skl. The combined results suggest that TC85507 is regulated in an ethylene
(skl) dependent manner, while TC85664 is regulated independent of ethylene perception.
Fig. 29. Transcription profiling of ACO TC85664. Data is the average of two independent experiments. Each experiment was replicated at least two times. Plants growing inside aeroponic tanks were retrieved and inoculated with zoospores of P. medicaginis. Control plants were mock inoculated with the exudates of not inoculated V8-agar dishes that were flooded with sterile water. The inoculation time was 2 hours. Time 0 ctl corresponds to roots that never were exposed to zoospores or mock-inoculum. Time 0 represents the point at which treated plants were returned to the aeroponic tanks and it is the actual start of the time course experiment. Primers and probes with homology to the target and control genes were used to amplify by real time PCR, cDNA templates prepared from the roots of M. truncatula infected and not infected skl and A17 genotypes. Relative induction of target genes was calculated with the formula of Livak K. et al. (112). As sample for calibration of experimental results the non-inoculated 0 hours control (0 ctl) was used. Amplification data was normalized to Actin or His H3 levels.
Expression profiling of PR10 homologues. PR10 gene is considered to be
constitutively expressed in nodulated roots and this was confirmed by the real time PCR
0.00
50.00
100.00
150.00
200.00
250.00
300.00
0 Ctl 0 2 6 12 24 32 48
Time post-inoculation (hours)
Rel
ativ
e In
duct
ion
(Fol
d tim
es o
f 0 h
ours
ctl)
sklWT
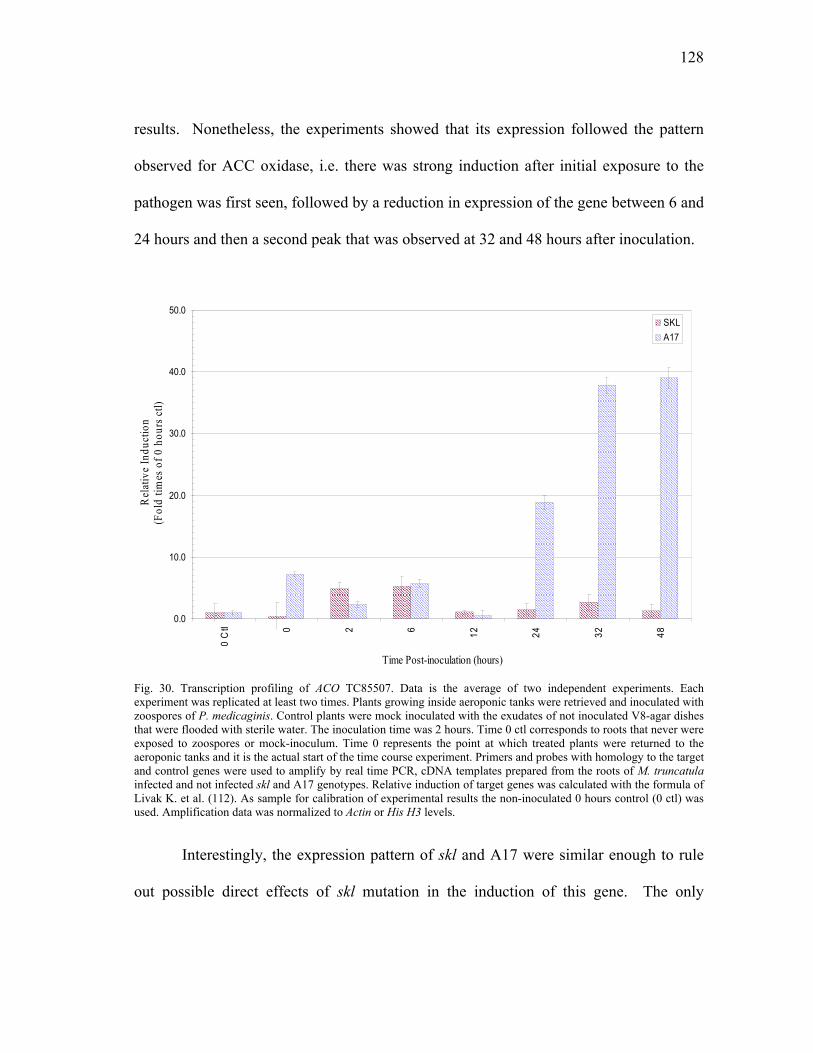
128
results. Nonetheless, the experiments showed that its expression followed the pattern
observed for ACC oxidase, i.e. there was strong induction after initial exposure to the
pathogen was first seen, followed by a reduction in expression of the gene between 6 and
24 hours and then a second peak that was observed at 32 and 48 hours after inoculation.
0.0
10.0
20.0
30.0
40.0
50.0
0 C
tl 0 2 6 12 24 32 48Time Post-inoculation (hours)
Rel
ativ
e In
duct
ion
(Fol
d tim
es o
f 0 h
ours
ctl)
SKLA17
Fig. 30. Transcription profiling of ACO TC85507. Data is the average of two independent experiments. Each experiment was replicated at least two times. Plants growing inside aeroponic tanks were retrieved and inoculated with zoospores of P. medicaginis. Control plants were mock inoculated with the exudates of not inoculated V8-agar dishes that were flooded with sterile water. The inoculation time was 2 hours. Time 0 ctl corresponds to roots that never were exposed to zoospores or mock-inoculum. Time 0 represents the point at which treated plants were returned to the aeroponic tanks and it is the actual start of the time course experiment. Primers and probes with homology to the target and control genes were used to amplify by real time PCR, cDNA templates prepared from the roots of M. truncatula infected and not infected skl and A17 genotypes. Relative induction of target genes was calculated with the formula of Livak K. et al. (112). As sample for calibration of experimental results the non-inoculated 0 hours control (0 ctl) was used. Amplification data was normalized to Actin or His H3 levels.
Interestingly, the expression pattern of skl and A17 were similar enough to rule
out possible direct effects of skl mutation in the induction of this gene. The only
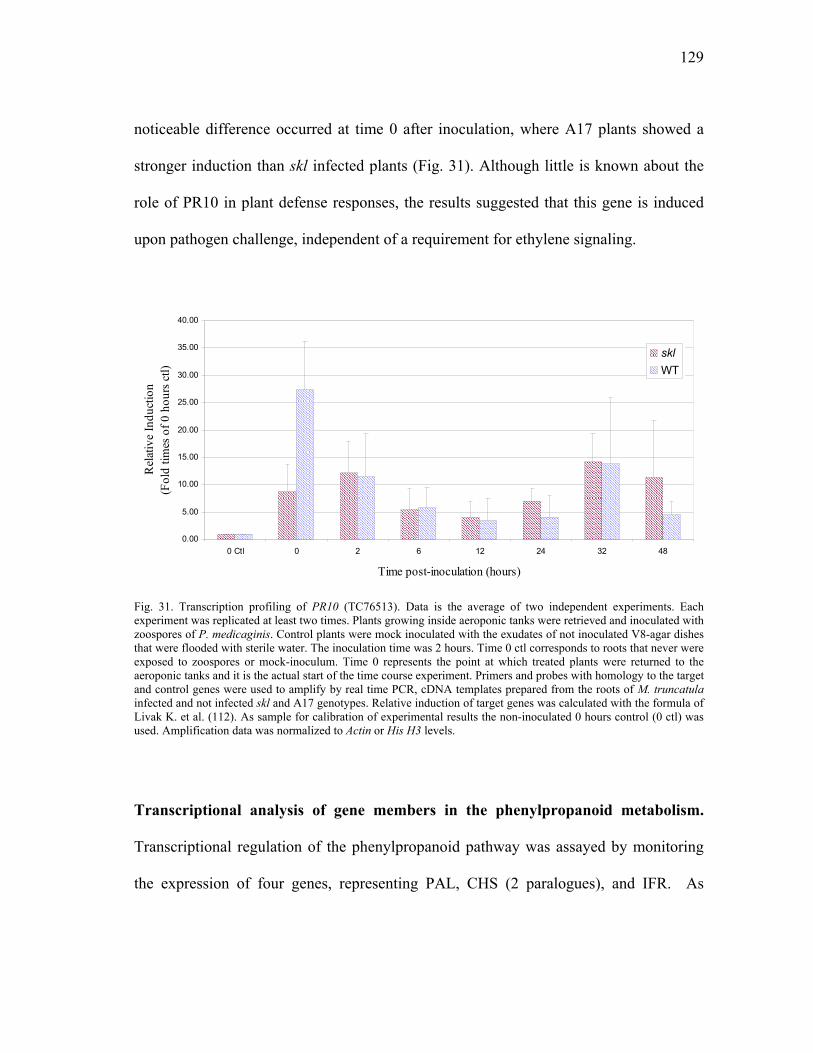
129
noticeable difference occurred at time 0 after inoculation, where A17 plants showed a
stronger induction than skl infected plants (Fig. 31). Although little is known about the
role of PR10 in plant defense responses, the results suggested that this gene is induced
upon pathogen challenge, independent of a requirement for ethylene signaling.
0.00
5.00
10.00
15.00
20.00
25.00
30.00
35.00
40.00
0 Ctl 0 2 6 12 24 32 48
Time post-inoculation (hours)
Rel
ativ
e In
duct
ion
(Fol
d tim
es o
f 0 h
ours
ctl )
sklWT
Fig. 31. Transcription profiling of PR10 (TC76513). Data is the average of two independent experiments. Each experiment was replicated at least two times. Plants growing inside aeroponic tanks were retrieved and inoculated with zoospores of P. medicaginis. Control plants were mock inoculated with the exudates of not inoculated V8-agar dishes that were flooded with sterile water. The inoculation time was 2 hours. Time 0 ctl corresponds to roots that never were exposed to zoospores or mock-inoculum. Time 0 represents the point at which treated plants were returned to the aeroponic tanks and it is the actual start of the time course experiment. Primers and probes with homology to the target and control genes were used to amplify by real time PCR, cDNA templates prepared from the roots of M. truncatula infected and not infected skl and A17 genotypes. Relative induction of target genes was calculated with the formula of Livak K. et al. (112). As sample for calibration of experimental results the non-inoculated 0 hours control (0 ctl) was used. Amplification data was normalized to Actin or His H3 levels.
Transcriptional analysis of gene members in the phenylpropanoid metabolism.
Transcriptional regulation of the phenylpropanoid pathway was assayed by monitoring
the expression of four genes, representing PAL, CHS (2 paralogues), and IFR. As
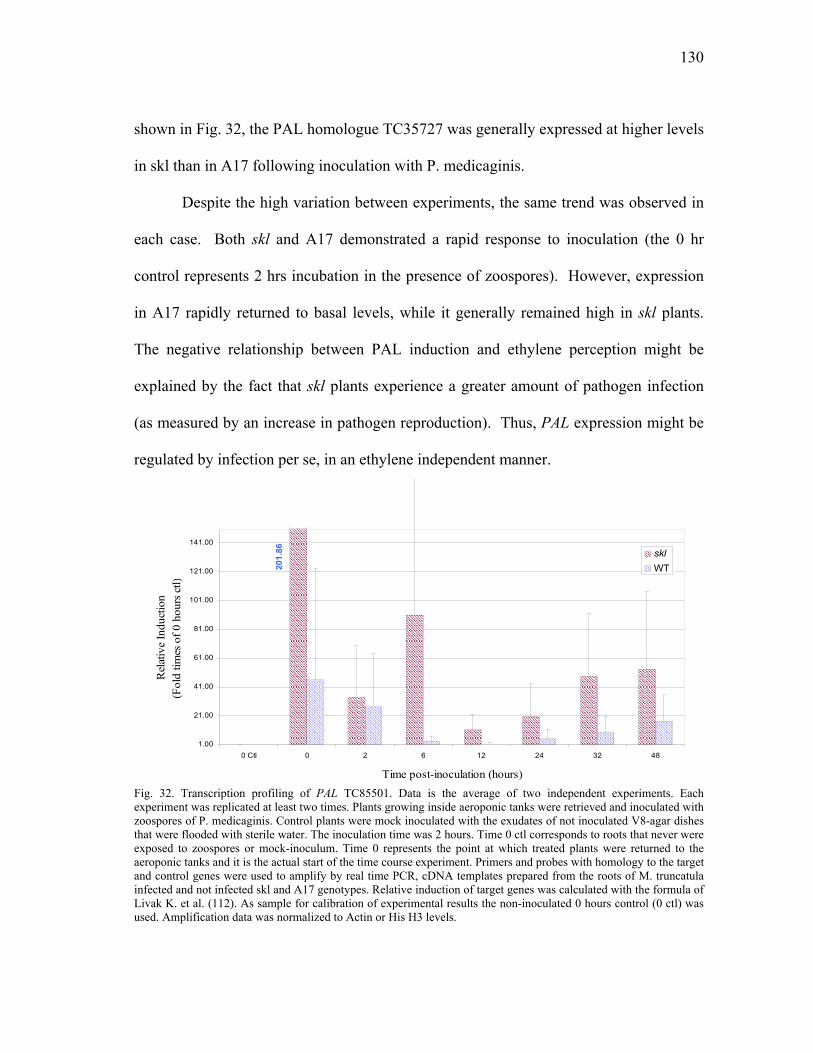
130
shown in Fig. 32, the PAL homologue TC35727 was generally expressed at higher levels
in skl than in A17 following inoculation with P. medicaginis.
Despite the high variation between experiments, the same trend was observed in
each case. Both skl and A17 demonstrated a rapid response to inoculation (the 0 hr
control represents 2 hrs incubation in the presence of zoospores). However, expression
in A17 rapidly returned to basal levels, while it generally remained high in skl plants.
The negative relationship between PAL induction and ethylene perception might be
explained by the fact that skl plants experience a greater amount of pathogen infection
(as measured by an increase in pathogen reproduction). Thus, PAL expression might be
regulated by infection per se, in an ethylene independent manner.
201.
86
1.00
21.00
41.00
61.00
81.00
101.00
121.00
141.00
0 Ctl 0 2 6 12 24 32 48
Time post-inoculation (hours)
Rel
ativ
e In
duct
ion
(Fol
d tim
es o
f 0 h
ours
ctl )
sklWT
Fig. 32. Transcription profiling of PAL TC85501. Data is the average of two independent experiments. Each experiment was replicated at least two times. Plants growing inside aeroponic tanks were retrieved and inoculated with zoospores of P. medicaginis. Control plants were mock inoculated with the exudates of not inoculated V8-agar dishes that were flooded with sterile water. The inoculation time was 2 hours. Time 0 ctl corresponds to roots that never were exposed to zoospores or mock-inoculum. Time 0 represents the point at which treated plants were returned to the aeroponic tanks and it is the actual start of the time course experiment. Primers and probes with homology to the target and control genes were used to amplify by real time PCR, cDNA templates prepared from the roots of M. truncatula infected and not infected skl and A17 genotypes. Relative induction of target genes was calculated with the formula of Livak K. et al. (112). As sample for calibration of experimental results the non-inoculated 0 hours control (0 ctl) was used. Amplification data was normalized to Actin or His H3 levels.
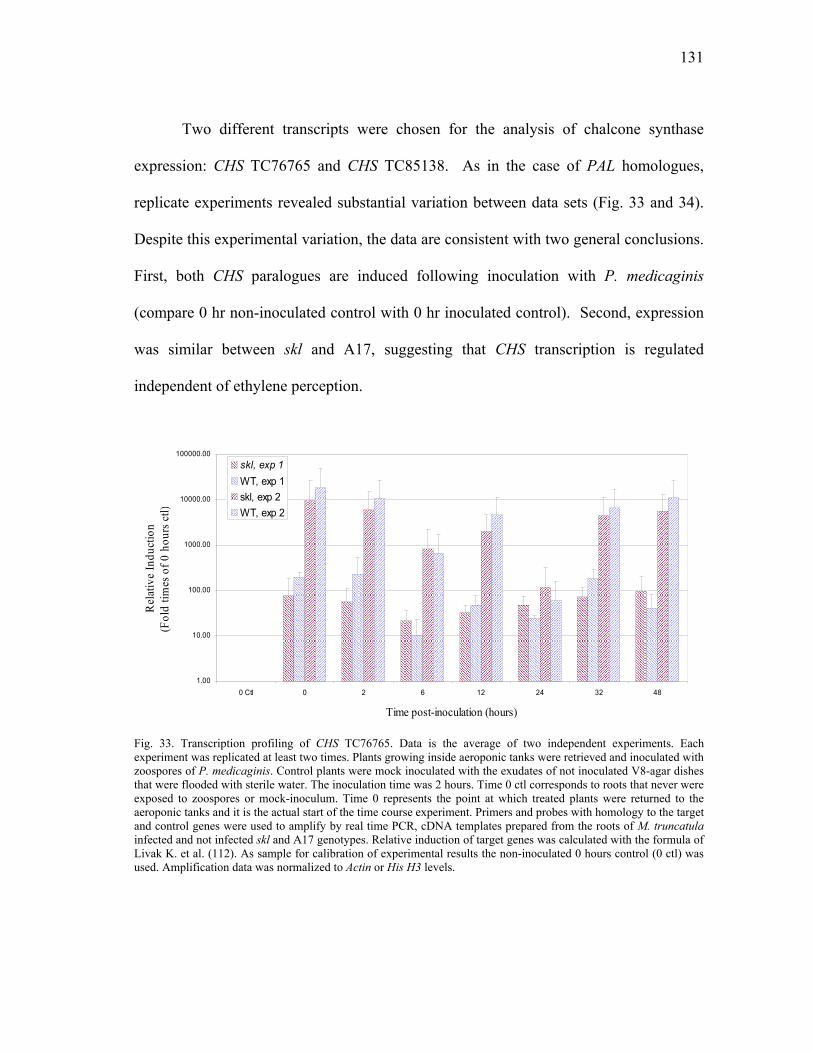
131
Two different transcripts were chosen for the analysis of chalcone synthase
expression: CHS TC76765 and CHS TC85138. As in the case of PAL homologues,
replicate experiments revealed substantial variation between data sets (Fig. 33 and 34).
Despite this experimental variation, the data are consistent with two general conclusions.
First, both CHS paralogues are induced following inoculation with P. medicaginis
(compare 0 hr non-inoculated control with 0 hr inoculated control). Second, expression
was similar between skl and A17, suggesting that CHS transcription is regulated
independent of ethylene perception.
1.00
10.00
100.00
1000.00
10000.00
100000.00
0 Ctl 0 2 6 12 24 32 48
Time post-inoculation (hours)
Rel
ativ
e In
duct
ion
(Fol
d tim
es o
f 0 h
ours
ctl)
skl, exp 1WT, exp 1skl, exp 2WT, exp 2
Fig. 33. Transcription profiling of CHS TC76765. Data is the average of two independent experiments. Each experiment was replicated at least two times. Plants growing inside aeroponic tanks were retrieved and inoculated with zoospores of P. medicaginis. Control plants were mock inoculated with the exudates of not inoculated V8-agar dishes that were flooded with sterile water. The inoculation time was 2 hours. Time 0 ctl corresponds to roots that never were exposed to zoospores or mock-inoculum. Time 0 represents the point at which treated plants were returned to the aeroponic tanks and it is the actual start of the time course experiment. Primers and probes with homology to the target and control genes were used to amplify by real time PCR, cDNA templates prepared from the roots of M. truncatula infected and not infected skl and A17 genotypes. Relative induction of target genes was calculated with the formula of Livak K. et al. (112). As sample for calibration of experimental results the non-inoculated 0 hours control (0 ctl) was used. Amplification data was normalized to Actin or His H3 levels.
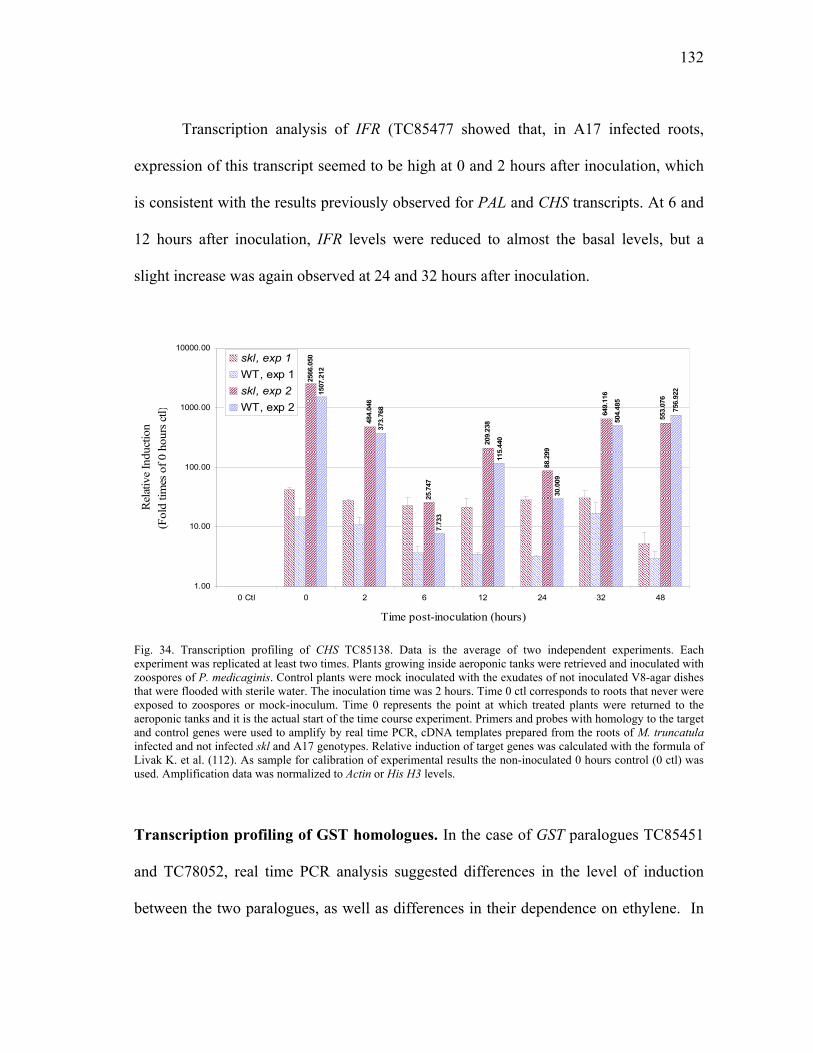
132
Transcription analysis of IFR (TC85477 showed that, in A17 infected roots,
expression of this transcript seemed to be high at 0 and 2 hours after inoculation, which
is consistent with the results previously observed for PAL and CHS transcripts. At 6 and
12 hours after inoculation, IFR levels were reduced to almost the basal levels, but a
slight increase was again observed at 24 and 32 hours after inoculation.
25.7
47
88.2
99
7.73
3
30.0
09
2566
.050
484.
046
649.
116
553.
076
209.
238
1507
.212
373.
768
115.
440
504.
485
756.
922
1.00
10.00
100.00
1000.00
10000.00
0 Ctl 0 2 6 12 24 32 48
Time post-inoculation (hours)
Rel
ativ
e In
duct
ion
(Fol
d tim
es o
f 0 h
ours
ctl)
skl, exp 1WT, exp 1skl, exp 2WT, exp 2
Fig. 34. Transcription profiling of CHS TC85138. Data is the average of two independent experiments. Each experiment was replicated at least two times. Plants growing inside aeroponic tanks were retrieved and inoculated with zoospores of P. medicaginis. Control plants were mock inoculated with the exudates of not inoculated V8-agar dishes that were flooded with sterile water. The inoculation time was 2 hours. Time 0 ctl corresponds to roots that never were exposed to zoospores or mock-inoculum. Time 0 represents the point at which treated plants were returned to the aeroponic tanks and it is the actual start of the time course experiment. Primers and probes with homology to the target and control genes were used to amplify by real time PCR, cDNA templates prepared from the roots of M. truncatula infected and not infected skl and A17 genotypes. Relative induction of target genes was calculated with the formula of Livak K. et al. (112). As sample for calibration of experimental results the non-inoculated 0 hours control (0 ctl) was used. Amplification data was normalized to Actin or His H3 levels.
Transcription profiling of GST homologues. In the case of GST paralogues TC85451
and TC78052, real time PCR analysis suggested differences in the level of induction
between the two paralogues, as well as differences in their dependence on ethylene. In
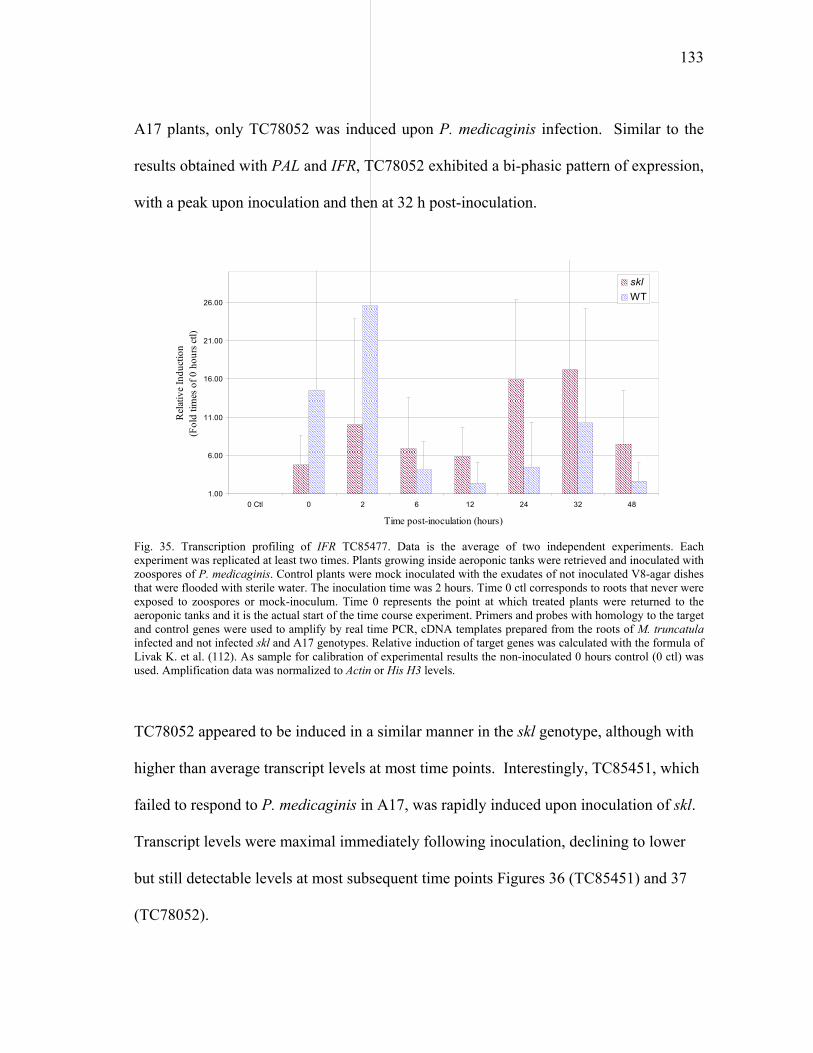
133
A17 plants, only TC78052 was induced upon P. medicaginis infection. Similar to the
results obtained with PAL and IFR, TC78052 exhibited a bi-phasic pattern of expression,
with a peak upon inoculation and then at 32 h post-inoculation.
1.00
6.00
11.00
16.00
21.00
26.00
0 Ctl 0 2 6 12 24 32 48
Time post-inoculation (hours)
Rel
ativ
e In
duct
ion
(Fol
d tim
es o
f 0 h
ours
ctl)
sklWT
Fig. 35. Transcription profiling of IFR TC85477. Data is the average of two independent experiments. Each experiment was replicated at least two times. Plants growing inside aeroponic tanks were retrieved and inoculated with zoospores of P. medicaginis. Control plants were mock inoculated with the exudates of not inoculated V8-agar dishes that were flooded with sterile water. The inoculation time was 2 hours. Time 0 ctl corresponds to roots that never were exposed to zoospores or mock-inoculum. Time 0 represents the point at which treated plants were returned to the aeroponic tanks and it is the actual start of the time course experiment. Primers and probes with homology to the target and control genes were used to amplify by real time PCR, cDNA templates prepared from the roots of M. truncatula infected and not infected skl and A17 genotypes. Relative induction of target genes was calculated with the formula of Livak K. et al. (112). As sample for calibration of experimental results the non-inoculated 0 hours control (0 ctl) was used. Amplification data was normalized to Actin or His H3 levels.
TC78052 appeared to be induced in a similar manner in the skl genotype, although with
higher than average transcript levels at most time points. Interestingly, TC85451, which
failed to respond to P. medicaginis in A17, was rapidly induced upon inoculation of skl.
Transcript levels were maximal immediately following inoculation, declining to lower
but still detectable levels at most subsequent time points Figures 36 (TC85451) and 37
(TC78052).
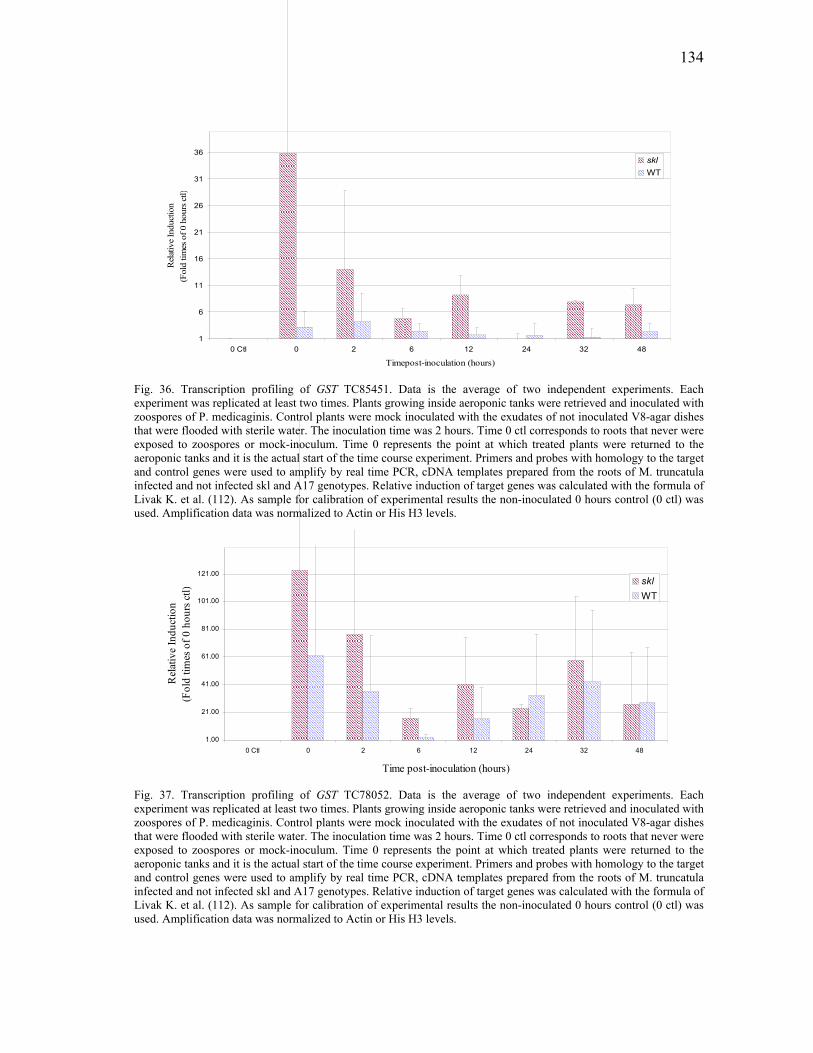
134
1
6
11
16
21
26
31
36
0 Ctl 0 2 6 12 24 32 48
Timepost-inoculation (hours)
Rel
ativ
e In
duct
ion
(Fol
d tim
es o
f 0 h
ours
ctl)
sklWT
Fig. 36. Transcription profiling of GST TC85451. Data is the average of two independent experiments. Each experiment was replicated at least two times. Plants growing inside aeroponic tanks were retrieved and inoculated with zoospores of P. medicaginis. Control plants were mock inoculated with the exudates of not inoculated V8-agar dishes that were flooded with sterile water. The inoculation time was 2 hours. Time 0 ctl corresponds to roots that never were exposed to zoospores or mock-inoculum. Time 0 represents the point at which treated plants were returned to the aeroponic tanks and it is the actual start of the time course experiment. Primers and probes with homology to the target and control genes were used to amplify by real time PCR, cDNA templates prepared from the roots of M. truncatula infected and not infected skl and A17 genotypes. Relative induction of target genes was calculated with the formula of Livak K. et al. (112). As sample for calibration of experimental results the non-inoculated 0 hours control (0 ctl) was used. Amplification data was normalized to Actin or His H3 levels.
1.00
21.00
41.00
61.00
81.00
101.00
121.00
0 Ctl 0 2 6 12 24 32 48
Time post-inoculation (hours)
Rel
ativ
e In
duct
ion
(Fol
d tim
es o
f 0 h
ours
ctl)
sklWT
Fig. 37. Transcription profiling of GST TC78052. Data is the average of two independent experiments. Each experiment was replicated at least two times. Plants growing inside aeroponic tanks were retrieved and inoculated with zoospores of P. medicaginis. Control plants were mock inoculated with the exudates of not inoculated V8-agar dishes that were flooded with sterile water. The inoculation time was 2 hours. Time 0 ctl corresponds to roots that never were exposed to zoospores or mock-inoculum. Time 0 represents the point at which treated plants were returned to the aeroponic tanks and it is the actual start of the time course experiment. Primers and probes with homology to the target and control genes were used to amplify by real time PCR, cDNA templates prepared from the roots of M. truncatula infected and not infected skl and A17 genotypes. Relative induction of target genes was calculated with the formula of Livak K. et al. (112). As sample for calibration of experimental results the non-inoculated 0 hours control (0 ctl) was used. Amplification data was normalized to Actin or His H3 levels.
135
DISCUSSION
In silica Analysis of Gene Homologues
The M. truncatula EST database was analyzed to identify candidate genes
involved in plant defense responses. Literature searches and computational resources
(blast searches and phylogenetic analysis programs) were used to find homologous
sequences for a large set of proteins and pathways involved in plant defense responses.
The various sequences were analyzed for their homology and phylogenetic relationship
with other closely related sequences. The analyses also provided an estimate of gene
expression based on the EST frequency of Medicago truncatula Gene Index (MTGI),
stored at TIGR. Although extensive, the performed analysis needs to be corroborated
through extensive experimentation.
The characterization and use of M. truncatula EST libraries has been previously
demonstrated (41, 61, 80, 93). These studies emphasized nodule-derived transcripts to
complement studies describing the symbiotic relationships between M. truncatula and its
nitrogen-fixing symbiont, the bacteria S. meliloti. The analysis presented here represents
the first step towards the characterization and potential cloning of defense-related genes
and compares defense responses in M. truncatula with other plant models such as A.
thaliana and Nicotiana tabacum. This data will also enhance and complement the
information available from the shotgun sequencing and fingerprinting of BAC libraries
of M. truncatula (188).
Data mining of EST information has allowed the establishment of the first
comparisons of gene expression profiles (2, 68, 106, 138,139) that ultimately were used
136
to provide experimental model analyses for medical and biochemical purposes.
Currently, the availability of several plant EST databases has permitted this type of
analysis to be done with agronomically important species (1, 22, 40, 59, 61,62, 100, 115,
165).
Most “in silica” analyses rely on the accumulation of a large number of EST to
deduce the expression patterns from the EST frequency within the library. Other
approaches such as Fedorova et al. (61) used logical queries to characterize MTGI and
find sequences that fulfilled certain requirements including expression in symbiont-
derived libraries, but not in developmental- or stress-conditioned libraries. Venn
diagrams, each one representing each of the different EST libraries and secondary
diagrams, (the product of the queries) were used to find a subset of 340 out of over
140.000 transcripts within 30 libraries, which were induced only as a response to
nitrogen fixation symbiotic development. These results were validated by microarray
and northern analyses of this subset of transcripts. To validate in silica analyses,
statistical methods have also been employed (59, 173). As a partial validation of the in
silica approach used in this study, real time PCR amplification of a subset of the gene
homologues found in this analysis was accomplished.
Because EST libraries are sequenced from different tissues and conditions, the
relative abundance of a particular transcript in a specific library is an index of its
expression (106). This quality was exploited in this work to find the candidate transcripts
for PCR analyses. The approach used gave emphasis to those contigs seemingly
137
expressed in mainly pathogen-infected derived libraries, due to the interest in the
responses elicited by M. truncatula upon pathogen infection.
Correct analysis of transcript abundance requires that the contribution of each
transcript in the overall database be the same. In MTGI, each EST library has a different
number of sequences, that if not normalized will skew the results of the analysis.
Therefore, all the data were normalized to a basal level that was independent of the
depth at which each EST library was sequenced. The normalization procedure allowed
the visualization of the treatment or tissue that generated the highest proportion of EST
in a given contig; providing a relative representation of gene expression. Phylogenetic
analysis and multiple sequence alignment of the different gene families were used to
establish the closeness of the homologues identified. This approach provided
information regarding the evolutionary history of the transcripts, which was useful in the
selection process of the contigs used in real time PCR amplification. Multiple sequence
alignment data were used to design amplification primers and probes around regions
with low homology to assure amplification of the desired contigs and to distinguish
among very closely related paralogues.
The usefulness of in silica analyses has been limited by factors such as the
extension, coverage and quality of the available EST databases (138,139). The
extension and coverage of the database is directly related to the manner in which the
EST information is processed prior to study. For example, with larger EST datasets,
more contigs can be made, and the completeness of the representation of the expressed
mRNA is enhanced (109, 154). In addition, the likelihood of finding a particular mRNA
138
species depends on the copy number of the gene in question, its expression level and
turnover rate. Thus, the mRNA population inside a cell can be classified as highly
abundant, moderately abundant or rare. According to Lee et al. (106), if the EST
database contains more than 3.000 sequences, the probability of finding a highly
abundant mRNA species is higher than 99%. For moderately abundant transcripts, the
probability is higher than 85%, and for rare transcripts it is less than 5%. As most of the
libraries comprising MTGI were sequenced in sufficient depth, there is a high degree of
confidence that most of the transcripts will be found in the database.
During the construction of EST, mistakes can be introduced. A study to analyze
EST sequencing errors was previously performed by Liang and Quakenbusch (109) with
the purpose of optimizing the process of EST clustering and creation of TC.
Nonetheless, TC can still harbor chimerical sequences that have high homology among
them. This type of error was observed for some of the PAL and GST homologues (data
not shown), and it is particularly evident when new releases of the EST database,
containing greater datasets showed that a sequence could be split into two or three
different contigs, based on the new clustering of the EST.
Although the dataset was extensive, candidate genes for most of the pathways
analyzed were not found. For example, the EST search of gene homologues for PR1,
PR2, PAD4, NPR1, NDR1 and CPR1 yielded mixed results or lowly expressed
transcripts or transcripts that were similarly regulated. Under these conditions, it was not
expected that these transcripts would be affected in skl mutation. These gene
homologues were not further studied. Something similar was observed for gene
139
homologues such as PDF1.2 and thionin. However, the search for LOX homologues
produced eight different contig sequences, all sharing high homology with the query
sequence and coordinately induced in the different libraries. Furthermore, the number of
EST in each of the contigs was high, suggestive of high expression levels. The lack of a
differential response in pathogen-derived or elicitor-derived libraries for these contigs
suggested that the usefulness of Lox homologues in subsequent analysis of skl mutation
was not clear (data not shown).
EST analysis for genes involved in the transduction of ethylene signals, such as
ETR1, CTR1, EIN2 and EIN3, yielded a low number of contigs with homology to the
query sequences. In some of the cases, the homology was restricted to known protein
motifs that are present in other proteins, severely limiting the confidence in these results.
However, the EST search of ACC oxidase and ACC synthase homologues yielded
sequences that were highly expressed according to the number of EST comprising each
of the contigs. These results were particularly clear in the case of ACC oxidase and
therefore subsequent analysis focused on this protein.
Transcription Profiling of Gene Homologues
Real time PCR
The success of real time PCR, irrespective of the chemistry or quantification
method used, depends upon the normalization process. A reliable quantification of RT-
PCR requires correction for experimental variation at both the reverse transcription and
the PCR efficiencies (74). Constitutive expressed genes have been used as controls to
140
normalize data in a wide array of experimental assays because they are expressed at a
constant level among the different tissues of an organism, and their expression is neither
affected by the treatment nor the stage of development of the organism (26, 74). Of the
different housekeeping genes available, the most commonly used are Actin, ribosomal
RNA and Histone H3, but other genes, such as Hypoxanthine-guanine
phosphoribosyltransferase, ciclophilin, mitochondrial ATP synthase, have been used as
well as controls in gene quantification experiments (74). Histone H3 (HisH3) encodes a
protein involved in cromatin organization. The HisH3 transcript amplified in this work
was TC85197, the homologue of HisH3 gene from Lycopersicon sculentum. TC85197 is
a contig assembled with 126 EST and is expressed across 26 different libraries. In silica
analysis of expression levels in TC85197 showed that the levels were quite similar
among the different libraries (Fig. 26). The same analysis also showed that HisH3 was
mildly induced by pathogens, although artificial elicitation with yeast cells or Hepta-
glucans seemed to induce this gene in higher proportions. Nonetheless, this HisH3
apparent induction was lower than the level seen for this same transcript in the
developing leaves EST library, which presented the highest induction of all (≈3.5X the
average induction level or 0.25% of the number of EST in the database. Interestingly,
this transcript was present at above average levels in mycorrhizal and S. meliloti induced
libraries, suggesting that it might not be a good control for analysis in experiments
involving such treatments.
Actin encodes a cytoskeleton protein and was expressed in almost all cell types
examined. The actin transcript analyzed was TC85697, the homologue of Actin 11 of A.
141
thaliana. TC85697 is formed by 27 EST sequenced from 18 different libraries (Fig. 25).
This transcript is also present in the Kiloclone set, an EST library prepared with the
clones present in the microarray slides that the M. truncatula consortium is printing. As
in the case of His H3, this transcript was mildly induced in tissues infected by pathogens.
TC85697 was shown to be strongly induced in libraries derived from elicited tissues
exposed to yeast cells or Hepta-glucans. The in silica study also showed that nitrogen
fixing bacteria seemed to induce this transcript. TC85697 had its highest expression in
root hairs and developing leaves, which is consistent with developing tissues and cells
engaged in active reproduction. Thus, it was not surprising to find induction of this
transcript in root cells infected with S. meliloti from libraries such as KV0, KV1 and
KV2 that represent the initial stages of plant-microbe interactions leading to nitrogen
fixation. In this context the expression of TC85697 corresponds to the expected
modification of sub-cellular structures in cells undergoing changes that will lead to the
development of nitrogen fixing nodules. The expression of this transcript in roots and its
very low or almost non existent induction by pathogens makes this transcript a very
good control for the purposes of these transcription profiling experiments.
The goal of the initial control experiments was to identify the possibility of
amplifying target and control molecules in single reactions. The main advantage of
multiplexing target and control genes is that the number of samples that can be
processed in a determined time frame is greatly increased (72). Multiplexing also
reduces the amount of PCR template needed to achieve the experiments, a very
important factor if the amount of the experimental sample is limited. On the other hand,
142
multiplexing requires a comparatively longer preparation time than the time required to
prepare the amplification of a single PCR product. Similarly, multiplexing requires
experiments geared to adjust the conditions for the PCR amplification, which can
increase the final cost of the experiment in terms of reagents (PCR Polymerase, dNTPs,
MgCl2, PCR buffer) (107). Nonetheless, simultaneous amplification of target and control
genes in different tubes may be the preference if a suitable primer and probe
combinations for target and control genes cannot be determined (190). This choice is
also useful if the number of target genes for analysis and the number of reactions to be
performed is small. But more importantly, data analysis of real time PCR reactions can
be accurate under multiplex or separate tube amplification (112). Because the goal of
the experiment was to amplify nine different genes plus an internal control in time
course experiments involving as many as eight different time points in replicated
experiments, the most reasonable approach seemed to adjust amplification conditions for
multiplexing of target and internal control genes. The major concern with the
multiplexing strategy was to not restrict the amplification of any of the gene species and
to ensure that the reporter system would be adequate to clearly distinguish the signals
from target and control molecules.
Independent amplification of PCR targets is important because in real time PCR,
data are analyzed when the fluorescence of the target gene is above an arbitrary point
called the Threshold Cycle (Ct) (72, 85). The threshold cycle is defined as the PCR cycle
at which the fluorescence of a sample is above the background fluorescence of the
experimental system. It is usually calibrated at 10x the standard deviation of the average
143
background fluorescence of the system (85). Thus, when adjusting the primer and probe
concentrations for both internal and target genes, the primer and probe concentration
subsequently used in the real time experiments was the one that minimized the time
required for the PCR to reach the threshold cycle for both genes.
Color multiplexing is one of the ways by which different PCR products can be
identified in a reaction mixture. Other ways to achieve this is by using physical
properties that will discriminate among the simultaneously amplified templates such as
denaturing temperature or size of the PCR amplicon (190). Color multiplexing relies on
the use of external artificial tags present at the extremes of a third oligonucleotide called
a probe. Upon probe and template hybridization, the tags are detected during the PCR
reaction by typical fluorescence resonance energy transfer mechanisms (26, 190).
Efficient energy transfer between the 5’ and 3’ modifications largely depends on how far
apart the locations of both modifications are within the probe. The distance these
molecules can be placed apart depends on the Föster radius of the fluorogenic molecules
employed (177). The farther apart the two molecules are, the less likely will be the
transferring of electrons or photons among them. A higher likelihood of achieving an
efficient electromagnetic interaction between the molecules occurs when the two
fluorogenic molecules are close to each other (177).
As shown in the experimental results section, real time amplification data was
inconsistent. Factors that could have influenced this outcome would include
photobleaching of reporter probes, activity of DNA polymerase, stability of RNA and
cDNA molecules, and choice of reporters. The mechanism by which Taqman™ probes

144
work can also be improved. A new generation of these probes is currently available and
is designed to bind to the minor grove of the cDNA template. This type of binding is
expected to be more robust and reliable, allowing a better disintegration of the probe
during the amplification. Also, new probes are shorter than the ones used in this study.
Shorter probes should be more effective in quenching fluorescence when not hybridized
and hydrolyzed. In addition, new methods for synthesis of reporter compounds are
yielding probes that are more stable and less prone to degradation (123).
Gene expression profiling
Few expression profiling studies in M. truncatula that aim to characterize the
defense responses upon pathogen infection have been published. The expression profiles
of chitinase homologues in M. truncatula under conditions of mycorrhiza and pathogen
infection have been demonstrated (163). However, the expression patterns of only eight
different chitinase homologues were examined. The objective of the current study was to
provide a possible framework to study defense-responses against pathogens on a much
broader scale.
Equally scarce are data that correlate gene expression information with
microarray data in M. truncatula. Recently, Mitra et al. (121) used microarray
technology to screen for changes in the expression profile of mutated genes in M.
truncatula. With this novel approach Mitra et al. were able to clone M. truncatula dmi3,
a gene involved in the signal transduction program of symbiotic interactions between M.
truncatula and organisms such as S. meliloti and G. versiforme. A publication has been
145
provided by Harrison et al. (110) that has insights about transcription profiling in
mycorrhizally infected roots. Also, real time PCR has been used to create expression
profiles of genes involved in root development upon auxin exposure in this plant species
(127). Currently experiments are being performed to analyze transcription profiling of
Medicago truncatula pathogenic interactions using microarray technology (188).
To adapt to changing environments, higher organisms differentially regulate gene
families (65). Lipoxygenases, for example, comprise a fairly large gene family with at
least 8 members in M. truncatula. This enzyme is involved in the production of multiple
compounds implicated with plant growth and development, resistance to insects and
pathogens, senescence, cold tolerance, and drought. The specific regulation of some of
these homologues has been correlated with their specific function and tissue location
(99). The evolution of triterpene synthases in M. truncatula is another example of
differential regulation of gene families. Some of the triterpene synthase homologues are
involved in gravitropism, whereas others are needed for cellulose synthesis or to produce
saponins involved in antimicrobial activity (90). Therefore, it is expected that gene
homologues involved with defense responses have also adapted to respond to different
biotical stresses, thus being differentially regulated. Under this framework, it is expected
that genes that are differentially regulated in skl mutation be found, therefore facilitating
the characterization and study of this plant mutation.
In Chapter III of this dissertation, it was shown that P. medicaginis infection of
M. truncatula seedlings induced ethylene production. Gas chromatographic assays of skl
and A17 infected seedlings showed that the pattern of ethylene evolution had bimodal
146
characteristics. Using real time PCR those results were able to be corroborated with gene
expression data from genes coding for ACC oxidase. Using the same conditions of
pathogen infection, it was possible to trace the gene expression pattern of two ACO
homologues. One was not responsive in skl infected plants, possibly contributing to the
lack of ethylene production in these mutant plants.
Expression profiling of the ACO homologue TC85507 matched the results of the
gas chromatography assay. The expression levels were clearly induced in A17 plants but
almost absent in skl. On the other hand, the second ACO homologue, TC85664, was
similarly induced in both genotypes. The fact that TC85507 exhibited a different
expression pattern in A17 and skl plants suggests independent pathways for the control
of the expression of these genes. Perhaps TC85507 represents an ACO homologue
induced upon pathogen challenge, while TC85664 may be an ACC oxidase homologue
induced by autocatalytic ethylene. In agreement with this hypothesis, an ortholog of
TC85664 from lima bean was induced by herbivore-induced volatiles and ethylene in a
timeframe similar to the one observed here (12). Visual and microscopical observations
of P. medicaginis-infected plants, in skl and A17 plants at 96 hours post inoculation
(data not shown) demonstrated that skl infected plants had considerably more necrosis at
the root level than the necrosis observed in infected A17 plants. The aerial parts were
almost completely wilted in skl plants. These factors together could trigger the
production of autocatalytic ethylene and explain the similar induction seen for TC85664
both skl and A17 infected plants.
147
PR10 expression after infection with P. medicaginis in both A17 and skl infected
tissues followed the patterns obtained for ACC oxidase. PR10 is a gene constitutively
expressed in nodules of M. truncatula, but its function is not clear. PR10 family of
pathogenesis related proteins are seen as providers of small peptides with antifungal
properties. Because PR10 proteins are expressed in reaction to ethylene and jasmonic
acid defense responses, the intent of this experiment was to follow the expression pattern
of this gene and determine the extent of impairment of skl defense responses.
Unfortunately, the constitutively expression of this transcript precluded it being a useful
gene to characterize skl mutation.
The comparison of gene expression data for PAL, IFR and CHS homologues
suggested that their expression was coordinated after pathogen infection. In this study,
the specific amplification of particular transcripts was attempted to find those cases of
coordinated gene induction.
However, the expression profiling analysis of PAL, CHS and IFR homologues
was difficult to assess. In the case of CHS homologues, the experimental results from
two experiments were different, but the patterns obtained remained constant. In one of
the experiments, at time 0 before inoculation, the basal levels for the transcripts were
found to be low. The use of the time 0 not inoculated samples as the calibrator to deduce
the induction or repression pattern of the time course experiment generated high values
of relative induction in all the infected time points. The values found were in some cases
a hundred-to a thousand-fold higher than in the replicated experiment, which used a
different set of equally treated plants. Furthermore, in both sets of plants, the TC values
148
for the internal control gene were always in the same range as in infected tissues,
suggesting different initial calibrator concentration in the template instead of different
concentration of cDNA template for that particular control sample during real time PCR.
To resolve the inconsistency between experiments, each experiment was analyzed
independently rather than as a single dataset. The fact that this problem was only
observed for CHS transcripts suggested a localized induction of this transcript created by
a unique, undetected stress response generated during the development of the
experiment, instead of a general contamination of the experiment.
Phytoalexin production in M. truncatula begins with the production of flavonoid
compounds in a series of reactions involving the enzymes PAL and CHS. IFR and O-
methyltransferase (IOMT) are required in the later stages of the process to transform the
deoxyflavonoid daidzein into medicarpin, the major phytoalexin of alfalfa and M.
truncatula. The pathway leading to medicarpin production is highly regulated and
involves many more than these four enzymes (46-48). Several analyses have
characterized the different steps involved in medicarpin production and its importance in
disease resistance (46-48, 84, 199). Medicarpin and other phytoalexin detoxifying
metabolic pathways have been described in plant pathogenic fungi, suggesting the
importance of this plant antibiotic in disease resistance (170). Recently, the studies of
Mundodi et al. (124,125) suggested that upon pathogen infection, the biosynthesis of
antifungal phytoalexins in alfalfa and other legumes was correlated with higher
resistance to fungal pathogens. Other research suggests that medicarpin accumulation
occurred faster and its effect lasted longer in incompatible interactions involving fungal
149
pathogens (46-48). Studies such as Stevenson et al. (175), and Samac et al. (14),
previously suggested the importance of the phytoalexins medicarpin and maackiain in
the control of F. oxisporum f.sp. ciceri in chickpea and Pratylenchus penetrans in
alfalfa.
In this study, it was shown that the pathways leading to medicarpin accumulation
was activated in both skl and A17 infected plants. The results of the transcription
profiling experiments suggested that skl plants should produce medicarpin, but the time
and intensity of the response might be different than in A17. Testing of this hypothesis
requires the characterization of root exudates by liquid chromatography in a similarly
designed time course experiment. skl plants infected with P. medicaginis were severely
affected by the pathogen, suggesting that additional defense mechanisms other than
medicarpin production are present in A17 plants but impaired in skl mutants.
Quantification of reactive oxygen species and real time PCR of genes induced by
salicylic acid production or jasmonic acid production may provide further insights into
the skl mutation. Another experiment that may assist in clarifying skl’s role in defense
responses is the transcription profiling of skl and A17 plants upon infection with natural
symbionts such as S. meliloti and Glomus sp.
Data analysis of the GST homologues showed that both transcripts were
expressed in A17 and skl infected tissues. The gene expression analysis of the GST
homologues demonstrated that these transcripts were expressed at higher levels in skl
mutants than in A17, suggesting a similar regulation pattern as PAL, CHS and IFR
genes. Because GST had an extremely high number of homologues, the biological
150
significance of the real time PCR results is difficult to understand. Nonetheless, a
possible mechanistic process can be proposed. GSTs are thought to be involved in the
protection of cells against oxidative damage. GSTs work by reducing the energy of
reactive molecules with the addition of tripeptide glutathione (GSH), but the
mechanisms involved in such protection are not clear (117). Ethylene production in P.
medicaginis infected plants trigger secondary defense responses such as localized cell
death mechanisms, as well as the induction of genes involved in defense responses,
therefore the activation of protection mechanisms mediated by GST molecules is
expected. The role of GSTs in the degradation of xenobiotic compounds as well as GST
induction after exposure to plant hormones such as abscisic acid, gibberelic acid,
ethylene and auxin has been reported (117). Plant exposure to pathogens, bright light,
dehydration, and wounding also induced transcripts of this gene family (117).
Experiments to measure the production of reactive species as a result of pathogen
exposure could clarify the role of this gene family not only in skl background, but also in
the general defense responses of this model species.
Recently, skl was shown to be the EIN2 homologue of A. thaliana. The in silica
analysis performed in this study was unable to establish the number of EIN2 homologues
in this model legume. Efforts to find them using EST databases were hampered by the
extensive homology of this gene to protein kinases. The results observed for the genes
involved in the phenylpropanoid metabolism, ethylene production, as well as the
expression profile of GST homologues, can be explained on the basis of decreased signal
transduction of ethylene derived responses. The salicylic acid derived defense responses
151
that are normally counteracted by the ethylene-JA signal transduction become partially
unblocked. It is accepted that ethylene-jasmonic acid defense responses cross talk to
repress the salicylic acid derived defense responses (49), and skl impairment in the
ethylene signaling pathway could remove the repression of the responses induced by
salicylic acid accumulation. Under the regulation of SA, the increase in PAL (TC85501),
CHS (TC85138) and IFR (TC 85477) would be explained, while the expression of CHS
(TC76765) could be dependent on ethylene accumulation after pathogen infection. The
almost totally opposite expression pattern found for both CHS homologues suggested
different regulation of these proteins at the transcriptional level. An examination of the
in silica expression pattern found for both CHS homologues corroborates this
assessment. TC85138 was highly expressed in Phytophthora infected roots, while
TC76765 was also expressed under this condition, but at a considerably lower level. It is
possible that TC85138 is globally regulated, while TC76765 is pathogen dependent.
Experiments designed to test skl deficiencies under an npr1 or nahG background could
further clarify the role of skl in defense responses.
152
CHAPTER V
SUMMARY
In this dissertation, the analysis of M. truncatula lines with a mutation in skl, a
gene homologous to A. thaliana ein2 was accomplished. The analysis of skl was
performed at two levels. Initially, the response of individuals with the skl mutation to
pathogens such as P. medicaginis, C. trifolii, R. solani, P. ultimum and P. irregulare was
assessed. Plants with the skl mutation were hyperinfected by the oomycete pathogens,
but not by the true fungi C. trifolii or R. solani. A time course experiment to
characterize the response of skl to P. medicaginis indicated that the mutant plants were
almost invariably killed by the pathogen whereas the control genotype (A17) had only
30% mortality. Quantification of oomycete reproductive structures showed the
extraordinary ease with which the pathogen colonized the mutant plants. Quantification
of ethylene production following infection by P. medicaginis of A17 and skl genotypes
showed a bi-modal pattern of ethylene evolution. The ethylene burst in A17 was
determined to be higher than in skl, but the ethylene production in the mutant was higher
than in the non-inoculated controls.
To determine the relative response of M. truncatula plants to infection by P.
medicaginis, 96 ecotypes and commercial cultivars representing populations from
Algeria, France, Spain, Portugal and Greece were inoculated with oospores of the
pathogen. The results indicated that the genotype A17 is a resistant ecotype. Four other
populations, including GRE065 and FRA20031 from Greece and France respectively,
153
demonstrated higher resistance than A17. On the other hand, skl mutation, as well as
DZA220 and DZA222 from Algeria, plus 19 other ecotypes and cultivars mainly from
Spain and Algeria were within a group of populations susceptible to P. medicaginis
infection.
Characterization of the skl mutation at the transcriptional level was attempted by
real time RTPCR. Literature searches for genes and pathways involved in plant defense
responses towards pathogens and pests provided a list of candidate genes for analysis,
that were suspected of being regulated by the skl mutation. Sequence information for
such genes were mined from the M. truncatula EST database (MTGI), using Basic Local
Alignment Search Tools (Blast). Data were corrected for inconsistencies and analyzed in
silica. Putative gene homologues that seemed to satisfy expression conditions, such as a
high expression in EST libraries derived from plant tissues exposed to pathogens or
expression in EST libraries derived from elicitors of pathogen interactions and that had
the greatest potential to detreat skl’s impairments were chosen for further study.
Real time RTPCR of replicated time course experiments, involving skl and A17
plants infected with P. medicaginis, indicated that skl was hampered in its ability to
induce transcription of downstream genes involved in Phytophthora resistance, such as
ACC oxidase homologues. skl’s inability to correctly induce transcriptional responses
seemed to cause an increase in the transcriptional response of genes, such as GST, IFR,
CHS and PAL that act through the SAR pathway. These results are in agreement with a
mechanism where the block of SAR signals that is expected to occur upon activation of
defense responses mediated by JA/ethylene is not present, and likely due to the lack of

154
ethylene derived defense signals mediated by skl. The observed results also provided
evidence of functional homology between skl and its orthologous sequence, the
Arabidopsis thaliana EIN2 gene.
155
LITERATURE CITED
1. Ablett, E., Seaton, G., Scott, K., Shelton, D., Graham, M. W., Baverstock, P.,
Slade, L., and Henry, R. 2000. Analysis of grape EST: global gene expression patterns in leaf and berry. Plant Science 159: 87–95.
2. Adams, M. D., Kerlavage, A. R., Fleischmann, R. D., Fuldner, R. A., Bult C. J.,
Lee, N. H., Kirkness, E. F., Weinstock, K. G., Gocayne, J. D., and White, O. 1995. Initial assessment of human gene diversity and expression patterns based upon 83 million nucleotides of cDNA sequence. Nature 377 (6547 suppl.): 3-174.
3. Agrios, G. N. 1997. Control of plant diseases. Pages 173-221 in: Plant pathology.
G. N., Agrios, ed. Academic Press. San Diego. CA. 4. Agrios, G. N. 1997. Genetics of plant disease. Pages 115-142 in: Plant pathology.
G. N., Agrios, ed. Academic Press. San Diego. CA. 5. Alexopoulos, C. J., Mims, C. W., and Blackwell, M. 1996. Phylum Oomycota.
Pages 683-737 in: Introductory mycology. C. J. Alexopoulos, C. W. Mims, and M. Blackwell, eds. Jonh Wiley & Sons, Inc, New York, NY.
6. Allen, D. J. 1983. Introduction. Pages 1-17 in: The pathology of tropical food
legumes : disease resistance in crop improvement, D. J. Allen, ed. John Wiley & sons. New York, NY.
7. Allen, D. J., and Lenné, J. M. 1998. Disease as a constraint to production of
legumes in agriculture. Pages 1-61 in: The pathology of food and pasture legumes, D. J. Allen, and J. M. Lenné, eds. ICRISAT & CAB International, New York, NY.
8. Alonso, J. M., Hirayama, T., Roman, G., Nourizadeh, S., and Ecker, J. R. 1999.
EIN2, a bifunctional transducer of ethylene and stress responses in Arabidopsis, Science 284: 2148-2152.
9. Altier, N. A., Barnes, D. K., Thies, J. A., and Samac, D. A. 1995. Pythium seed
rot and damping-off resistance in: Standard tests to characterize alfalfa cultivars. North America Alfalfa Improvement Conference (NAAIC). Oklahoma State University, Stillwater, OK. http://www.naaic.org/stdtests/pythium.htm.
10. Altier, N. A., and Thies J. A. 1995. Identification of resistance to Pythium
seedling diseases in alfalfa using a culture plate method. Plant Dis. 79: 341-346.
156
11. Ané, J. M., Kiss, G. B., Riely, B. K., Penmetsa, R. V., Oldroyd G. E. D., Ayax, C., Lévy, J., Debellé, F., Baek, J. M., Kalo, P., Rosenberg, C., Roe, B. A., Long, S. R., Dénarié, J., and Cook D. R. 2004. Medicago truncatula DMI1 required for bacterial and fungal symbioses in legumes. Science 303: 1364-1367.
12. Arimura, G., Ozawa, R., Nishioka, T., Boland, W., Koch, T., Kühnemann, F.,
and Takabayashi, J. 2002. Herbivore-induced volatiles induce the emission of ethylene in neighboring lima bean plants. Plant Journal 29: 87-98.
13. Bajaj, Y. P. S. 1990. Wide hybridization, transformation, cryopreservation. Pages
1-20 in: Biotechnology in agriculture and forestry: legumes and oilseed crops. Y. P. S. Bajaj, ed. Springer-Verlag. Berlin, Germany.
14. Baldridge, G. D., and O'Neill, N. R., Samac, D. A. 1998. Alfalfa (Medicago
sativa L.) resistance to the root-lesion nematode, Pratylenchus penetrans: defense-response gene mRNA and isoflavonoid phytoalexin levels in roots. Plant Mol. Biol. 38: 999-1010.
15. Barbetti, M. J. 1989. Response of Medicago cultivars to fungal root pathogens
associated with Trifolium subterraneum. Plant Protection Quarterly 4: 75-77. 16. Bartnicki-Garcia, S., and Wong, M. C. 1983. Biochemical aspects of
morphogenesis in Phytophthora. Pages 121-137 in: Phytophthora: its biology, taxonomy, ecology and pathology. D. C. Erwin, S. Bartnicki-Garcia, and P. M. Tsao, eds. The American Phytopathological Society Press, St. Paul, MN.
17. Bell, E., and Mullet, J. 1993. Characterization of an Arabidopsis lipoxigenases
gene responsive to methyl jasmonate and wounding. Plant Physiol. 103: 1133-1137.
18. Ben Amor, B., Shaw, S. L., Oldroyd, G. E. D., Maillet, F., Penmetsa, R. V.,
Cook, D. R., Long, S. R., Dénarié, J., and Gough, C. 2003. The NFP locus of Medicago truncatula controls an early step of Nod factor signal transduction upstream of a rapid calcium flux and root hair formation. Plant Journal 34: 495-506.
19. Bent, A. 2001. Plant mitogen-activated protein kinase cascades: negative
regulatory roles turn out positive. Proc. Natl. Acad. Sci. USA 98: 784-786. 20. Bent, A. F., Innes, R. W., Ecker, J. R., and Staskawicz, B. J. 1992. Disease
development in ethylene-insensitive Arabidopsis thaliana infected with virulent and avirulent Pseudomonas and Xanthomonas pathogens. Mol. Plant-Microbe Interact. 5: 372-378.
157
21. Bleecker, A. B. 1999. Ethylene perception and signaling: an evolutionary perspective. Trends in Plant Science 4: 269-274.
22. Bohnert, H. J., Ayoubi, P., Borchert, C., Bressan, R. A., Burnap, R. L., Cushman,
J. C., Cushman, M. A., Deyholos, M., Fischer, R., and Galbraith, D. W. 2001. A genomics approach towards salt stress tolerance. Plant Physiol. Biochem. 39: 295–311.
23. Boisson-Dernier, A., Chabaud, M., Garcia, F., Bécard, G., Rosenberg, C., and
Barker, D. G. 2001. Agrobacterium rhizogenes-transformed roots of Medicago truncatula for the study of nitrogen-fixing and endomycorrhizal symbiotic associations. Mol. Plant-Microbe Interact. 14: 693-700.
24. Borlaug, N. E. 2000. Ending world hunger. The promise of biotechnology and
the threat of antiscience zealotry. Plant Physiol. 124: 487–490. 25. Brady, N. C. 1998. Food legume research sponsored by the United States Agency
for International Development (AID). Pages 3-6 in: World crops: cool season food legumes. R. J. Summerfield, ed. Kluwer Academic Publishers. Boston, MA.
26. Bustin, S. A. 2000. Absolute quantification of mRNA using real-time reverse
transcription polymerase chain reaction assays. J. Molec. Endocr. 25: 169-193. 27. Bustin, S. A. 2002. Quantification of mRNA using real-time reverse transcription
PCR (RT-PCR): trends and problems. J. Molec. Endocr. 29: 23-39. 28. Cao, H., Li, X., and Dong, X. 1998. Generation of broad-spectrum disease
resistance by overexpression of an essential regulatory gene in systemic acquired resistance. Proc. Natl. Acad. Sci. USA 95: 6531-6536.
29. Carlile, M. 1983. Motility, taxis, and tropism in Phytophthora. Pages 95-105 in:
Phytophthora: its biology, taxonomy, ecology and pathology. D.C. Erwin, S. Bartnicki-Garcia, and P. M. Tsao, eds. The American Phytopathological Society Press, St. Paul, MN.
30. Catoira, R., Galera, C., de Billy, F., Journet, E. P., Maillet, F., Penmetsa, V.,
Rosenberg, C., Gough, C., Cook, D. and Dénarié, J. 2000. Four genes of Medicago truncatula controlling components of a Nod factor transduction pathway. Plant Cell 12: 1647–1665.
31. Century, K. S., Holub, E. B., and Staskawicz, B. J. 1995. NDR1, a locus of
Arabidopsis thaliana that is required for disease resistance to both a bacterial and a fungal pathogen. Proc. Natl. Acad. Sci. USA 92: 6597-6601.
158
32. Century, K. S., Shapiro, A. D., Repetti, P. P., Dahlbeck, D., Holub, E., and Staskawicz, B. J. 1997. NDR1, a pathogen-induced component required for Arabidopsis disease resistance. Science 278: 1963-1965.
33. Chang, C., and Shokey, J. A. 1999. The ethylene–response pathway: signal
perception to gene regulation. Curr. Op. Plant Biol. 2: 352-358. 34. Choi, H. K., Kim, D., Uhm, T., Limpens, E., Lim, H., Mun, J. H., Kalo, P.,
Penmetsa, R. V., Seres, A., Kulikova, O., Roe, B. A., Bisseling, T., Kiss, G. B., and Cook, D. R. 2004. A sequence-based genetic map of Medicago truncatula and comparison of marker colinearity with M. sativa. Genetics 166: 1463-1502.
35. Clarke, J. D., Liu, Y., Klessig, D. F., and Dong, X. 1998. Uncoupling PR gene
expression from NPR1 and bacterial resistance: characterization of the dominant Arabidopsis cpr6-1 mutant. Plant Cell 10: 557-569.
36. Clough, S., Fengler, K. A., Yu, I. C., Lippok, B., Smith, R. K., and Bent, A. F.
2000. The Arabidopsis dnd1 “defense, no death” gene encodes a mutated cyclic nucleotide-gated ion channel. Proc. Natl. Acad. Sci. USA 97: 9323-9328.
37. Cook, D., Dreyer, D., Bonnet, D., Howell, M., Nony, E., and VandenBosch, K.
1995. Transient induction of a peroxidase gene in Medicago truncatula precedes infection by Rhizobium meliloti. Plant Cell 7: 43-55.
38. Cook, D. R. 1999. Medicago truncatula – a model in the making. Curr. Op. Plant
Biol. 2: 301-304. 39. Cook, D. R., VandenBosch, K., De Bruijn, F., and Huguet, T. 1997. Model
legumes get the nod. Plant Cell 9: 275-281. 40. Cooke, R., Raynal, M., Laudié, M., Grellet, F., Delseny, M., Morris, P. C.,
Guerrier, D., Giraudat, J., Quigley, F., and Clabault, G. 1996. Further progress towards a catalogue of all Arabidopsis genes: analysis of a set of 5000 non-redundant ESTs. Plant Journal 9: 101–124.
41. Covitz, P. A., Smith, L.S. and Long, S.R. 1998. Expressed sequence tags from a
root-hair-enriched Medicago truncatula cDNA library. Plant Physiol. 117: 1325-1332.
42. De la Fuente, L., Quagliotto, L., Bajsa, N., Fabiano, E., Altier, N., and Arias, A.
2002. Inoculation with Pseudomonas flourescens does not affect the symbiosis between rhizobia and forage legumes. Soil Biol. Biochem. 34: 545-548.
159
43. De Wit, P. J. G. M. 1992. Molecular characterization of gene-for-gene systems in plant-fungus interactions and the application of avirulence genes in control of plant pathogens. Annu. Rev. Phytopathol. 30: 391-418.
44. Delaney, T. P., Uknes, S. J., Vernooij, B., Friedrich, L., Weymann, K., Negrotto,
D., Gaffney, T., Gut-Rella, M., Kessmann, H., Ward, E., and Ryals, J. 1994. A central role of salicylic acid in plant disease resistance. Science 266: 1247-1249.
45. Devoto, A., and Turner, J. G. 2003. Regulation of jasmonate-mediated plant
responses in Arabidopsis. Annals of Botany 92: 329-337. 46. Dixon, R. 2001. Natural products and plant disease resistance. Nature 411: 843-
847. 47. Dixon, R. A., and Paiva, N. 1995. Stress induced phenylpropanoid metabolism.
Plant Cell 7: 1085-1097. 48. Dixon, R. A., and Steele, C.L. 1999. Flavonoids and isoflavonoids a gold mine
for metabolic engineering. Trends in Plant Science 4: 394-400. 49. Dong, X. 1998. SA, JA, ethylene and disease resistance in plants. Curr. Op. Plant
Biol. 1: 316-323. 50. Dong, X. 2001. Genetic dissection of systemic acquired resistance. Curr. Op.
Plant Biol. 4: 309-314. 51. Ecker J. R. 1995. The ethylene signal transduction pathway in plants. Science
268: 667-675. 52. Ellis, C., Karafyllidis, L., Wasternack, C., and Turner, J. G. 2002. The
Arabidopsis mutant cev1 links cell wall signaling to jasmonate and ethylene responses. Plant Cell 14: 1557-1566.
53. Ellis, C., and Turner, J. G. 2001. The Arabidopsis mutant cev1 has constitutively
active jasmonate and ethylene signal pathways and enhanced resistance to pathogens. Plant Cell 13: 1025-1033.
54. Endre, G., Kereszt, A., Kevei, Z., Mihacea, S., Kaló, P., and Kiss, G. B. 2002. A
receptor kinase gene regulating symbiotic nodule development. Nature 417: 962–966.
55. Epple, P., Apel, K., and Bohlmann, H. 1995. An Arabidopsis thaliana thionin
gene is inducible via a signal transduction pathway different from that for pathogenesis-related proteins. Plant Physiol. 109: 813-820.
160
56. Erwin, D. C., and Ribeiro, O. K. 1996. Control by host resistance. Pages 186-210 in: Phytophthora, diseases worldwide. D. C. Erwin, and O. K. Ribeiro, eds. The American Phytopathological Society Press, St. Paul, MN.
57. Erwin, D. C., and Ribeiro, O. K. 1996. Culture, physiology and genetics. Pages
43-95 in: Phytophthora, diseases worldwide. D. C. Erwin, and O. K. Ribeiro, eds. The American Phytopathological Society Press, St. Paul, MN.
58. Eulgem T., Rushton, P. J., Robatzek, S., and Somssichet I. E. 2000. The WRKY
superfamily of plant transcription factors. Trends in Plant Science 5: 199-206. 59. Ewing, R. M., Kahla, A. B., Poirot, O., Lopez, F., Audic, S., and Claverie, J. M.
1999. Large scale statistical analyses of rice EST reveal correlated patterns of gene expression. Genome Res. 9: 950–959.
60. Falk, A., Feys, B. J., Frost, L. N., Jones, J. D. G., Daniels, M. J., and Parker, J. E.
1999. EDS1, an essential component of R gene-mediated disease resistance in Arabidopsis has homology to eukaryotic lipases. Proc. Natl. Acad. Sci. USA 96: 3292-3297.
61. Fedorova, M., Van De Mortel, J., Matsumoto, P. A., Cho, J., Town, C. D.,
VandenBosch, K. A., Gantt, J. S., and Vance, C. P. 2002. Genome-wide identification of nodule-specific transcripts in the model legume Medicago truncatula. Plant Physiol. 130: 519–537.
62. Fernandes, J., Brendel, V., Gai, X., Lal, S., Chandler, V. L., Elumalai, R. P.,
Galbraith, D. W., Pierson, E. A., and Walbot, V. 2002. Comparison of RNA expression profiles based on maize expression sequence tag frequency analysis and micro-array hybridization. Plant Physiol. 128: 896–910.
63. Feys, B. J. F., Benedetti, C. E., Penfold, C. N., and Turner, J. G. 1994.
Arabidopsis mutants selected for resistance to the phytotoxin coronatine are male-sterile, insensitive to methyl jasmonate, and resistant to a bacterial pathogen. Plant Cell 6: 751–759.
64. Finlayson, S. A., Lee, I. J., and Morgan, P. W. 1998. Phytochrome B and the
regulation of circadian ethylene production in sorghum. Plant Physiol. 116: 17-25.
65. Fisher, A. J. Grimes, H. D., and Fall, R. 2003. The biochemical origin of
pentenol emissions from wounded leaves. Phytochemistry. 62: 159-163.
161
66. Flemming, M. D., and Andrews, N. C. 1998. Mammalian iron transport: an unexpected link between metal homeostasis and host defense. J. Lab. Clin. Med. 132: 464-468.
67. Flor, H. H. 1946. Genetics of pathogenicity of Melampsora lini. J. Agricultural
Research 74: 241-262. 68. Franco, G. R., Rabelo, E. M., Azevedo, V., Pena, H. B., Ortega, J. M., Santos, T.
M., Meira, W. S., Rodrigues, N. A., Dias, C. M., Harrop, R., Wilson, A., Saber, M., Abdel-Hamid, H., Faria, M. S., Margutti, M. E., Parra, J. C., and Pena, S. D. 1997. Evaluation of cDNA libraries from different developmental stages of Schistosoma mansoni for production of expressed sequence tags (EST). DNA Research 4: 231-240.
69. Freeman, W. M., Walker, S. J., and Vrana, K. E. 1999. Quantitative RT-PCR:
pitfalls and potential. Biotechniques 26: 112-125. 70. Frye, C., Tang, D., and Innes, R. W. 2001. Negative regulation of defense
responses in plants by a conserved MAPKK kinase. Proc. Natl. Acad. Sci. USA 98: 373-378.
71. Gallusci, P., Dedieu, A., Journet, E. P., Huguet, T., and Barker, D. G. 1991.
Synchronous expression of leghaemoglobin genes in Medicago truncatula during nitrogen-fixing root nodule development and response to exogenously supplied nitrate. Plant Mol. Biol. 17: 335-349.
72. Gibson U. E. M., Heid, C. A., and Williams P. M. 1996. A novel method for real
time quantitative RT-PCR. Genome Res. 6: 995-1001. 73. Gilchrist, D. G. 1998. Programmed cell death in plant disease: the purpose and
promise of cellular suicide. Annu. Rev. Phytopathol. 36: 393–414. 74. Giuletti, A., Overbergh, L., Valckx, D., Decallonne, B., Bouillon, R., and
Mathieu, C. 2001. An overview of real time PCR. Methods 25: 386-401. 75. Glazebrook, J. 1999. Genes controlling expression of defense responses in
Arabidopsis. Curr. Op. Plant Biol. 2: 280-286. 76. Glazebrook, J. 2001. Genes controlling expression of defense responses in
Arabidopsis - 2001 status. Curr. Op. Plant Biol. 4: 301-308. 77. Goodman, R. N., and Novacky, A. J. 1994. The hypersensitive reaction in plants
to pathogens: a resistance phenomenon. Pages 45-56. The American Phytopathological Society Press. St. Paul, MN.
162
78. Guinel, F. C., and Sloetjes, L. L. 2000. Ethylene is involved in the nodulation phenotype of Pisum sativum R50 (sym 16), a pleiotropic mutant that nodulates poorly and has pale green leaves. J. Exp. Bot. 51: 885-894.
79. Gut, M., Leutenegger, C. M., Huder, J. B., Pedersen, N. C., and Lutz, H. 1999.
One-tube fluorogenic reverse transcription-polymerase chain reaction for the quantitation of feline coronaviruses. J. Virol. Methods 77: 37–46.
80. Györgyey, J., Vaubert, D., Jiménez-Zurdo, J. I., Charon, C., Troussard, L.,
Kondorosi, A., and Kondorosi, E. 2000. Analysis of Medicago truncatula nodule expressed sequence tags. Mol. Plant-Microbe Interact. 13: 62–71.
81. Hammerschmidt, R. 1999. Phytoalexins: What have we learned after 60 years?
Annu. Rev. Phytopathology. 37: 285-306. 82. Harrison, M. J. 2000. Molecular genetics of model legumes. Trends in Plant
Science 5: 414-415. 83. Havey, M. J., and Maxwell, D. P. 1987. Inheritance of Phytophthora root rot
resistance in two diploid alfalfa species. Crop Science 27: 225-228. 84. He, X. Z., and Dixon, R. A. 2000. Genetic manipulation of isoflavone 7-O-
methyltransferase enhances biosynthesis of 4'-O-methylated isoflavonoid phytoalexins and disease resistance in alfalfa. Plant Cell 12: 1689-1702.
85. Heid, C., Stevens, J., Livak, K. J., and Williams, P. M. 1996. Real time
quantitative PCR. Genome Res. 6: 986-994. 86. Heidstra, R., Yang, W. C., Yalcin, Y., Peck, S., Emons, A. M., van Kammen, A.,
and Bisseling, T. 1997. Ethylene provides positional information on cortical cell division but is not involved in Nod factor-induced root hair tip growth in Rhizobium-legume interaction. Development 124: 1781-1787.
87. Hirayama, T. and Alonso, J. M. 2000. Ethylene captures a metal! Metal ions are
involved in ethylene perception and signal transduction. Plant Cell Physiol. 41: 548-555.
88. Hohrein, B. A., and Bean, G. A. 1983. Greenhouse technique to evaluate alfalfa
resistance to Phytophthora megasperma f. sp. medicaginis. Plant Dis. 67: 1332-1333.
89. Innes, R. W. 1998. Genetic dissection of R gene signal transduction pathways.
Curr. Op. Plant Biol. 1: 229-304.
163
90. Iturbe-Ormaetxe, I., Haralampidis, K., Papadopoulou, K., and Osbourn, A. E. 2003. Molecular cloning and characterization of triterpene synthases from Medicago truncatula and Lotus japonicus. Plant Mol. Biol. 51: 731-743.
91. Jhonson, P. R., and Ecker, J. R. 1998. The ethylene signal transduction pathway:
a molecular perspective. Annu. Rev. Genet. 32: 227-254. 92. Jones, C. R., and Samac, D. A. 1996. Biological control of fungi causing alfalfa
seedling damping-off with a disease-suppressive strain of Streptomyces. Biological Control 7: 196-204.
93. Journet, E. P., van Tuinen, D., Gouzy, J., Crespeau, H., Carreau, V., Farmer, M.
J., Niebel, A., Schiex, T., Jaillon, O., Chatagnier, O., Godiard, L., Micheli, F., Kahn, D., Gianinazzi-Pearson, V., and Gamas, P. 2002. Exploring root symbiotic programs in the model legume Medicago truncatula using EST analysis. Nucleic Acids Res. 30: 5579-5592.
94. Kamaté, K., Rodriguez-Llorente, I. D., Scholte, M., Durand, P., Ratet, P.,
Kondorosi, E., Kondorosi, A., and Trinh, T. H. 2000. Transformation of floral organs with GFP in Medicago truncatula. Plant Cell Reports 19: 647–653.
95. Keen, N. T., and Yoshikawa, M. 1983. Physiology of disease and the nature of
resistance to Phytophthora. Pages 279-287 in: Phytophthora: its biology, taxonomy, ecology and pathology. D. C. Erwin, S. Bartnicki-Garcia, and P. M. Tsao, eds. The American Phytopathological Society Press, St. Paul, MN.
96. Kieber, J. J., Rothenberg, M., Roman, G., Feldmann, K. A., and Ecker, J. R.
1993. CTR1, a negative regulator of the ethylene response pathway in Arabidopsis, encodes a member of the RAF family of protein kinases. Cell. 72: 427-441.
97. Kinkema, M., Fan, W., and Dong, X. 2000. Nuclear localization of NPR1 Is
required for activation of PR gene expression. Plant Cell 12: 2339-2350. 98. Knoester, M., van Loon, L. C., and van den Heuvel, J. 1998. Ethylene-insensitive
tobacco lacks non-host resistance against soil-borne fungi. Proc. Natl. Acad. Sci. USA 95: 1933-1937.
99. Kolomiets, M. V., Chen, H., Gladon, R. J., and Hannapel, D. J. 2000. A leaf
lipoxygenase of potato induced specifically by pathogen infection. Plant Physiol. 124: 1121-1130.
164
100. Kruger, W. M., Pritsch, C., Chao, S., and Muehlbauer, G. J. 2002. Functional and comparative bioinformatic analysis of expressed genes from wheat spikes infected with Fusarium graminearum. Mol. Plant-Microbe Interact. 15: 445–455.
101. Kulikova, O., Gualtieri, G., Geurts, R., Kim, D. J., Cook, D., Huguet, T., de
Jong, J. H., Fransz, P. F., and Bisseling, T. 2001. Integration of the FISH pachytene and genetic maps of Medicago truncatula. Plant Journal 27: 49-58.
102. Kumar, D., and Klessig, D. F. 2000. Differential induction of tobacco MAP
kinases by the defense signals nitric oxide, salicylic acid, ethylene, and jasmonic acid. Mol. Plant-Microbe Interact. 13: 347-351.
103. Kunkel, B. N., and Brooks, D. M. 2002. Cross talk between signaling pathways
in pathogen defense. Curr. Op. Plant Biol. 5: 325–331. 104. Lamb, C., and Dixon, R. A. 1996. The oxidative burst in plant disease resistance.
Annu. Rev. Plant Physiol. Plant Mol. Biol. 48: 251-275. 105. Lebel, E., Heifetz, P., Thorne, L., Uknes, S., Ryals, J., and Wardet, E. 1998.
Functional analysis of regulatory sequences controlling PR-1 gene expression in Arabidopsis. Plant Journal 16: 223-233.
106. Lee, N. H., Weinstock, K. G., Kirkness, E. F., Earle-Hugues, J. A., Fuldner, R.
A., Marmaros, S., Glodek, A., Gocayne, J. D., Adams, M. D., and Kerlavage, A. R. 1995. Comparative expressed-tag analysis of differential gene expression profiles in PC-12 cells before and after nerve growth factor treatment. Proc. Natl. Acad. Sci. USA 92: 8303-8307.
107. Leutenegger, C. M., Mislin, C. N., Sigrist, B., Ehrengruber, M. U., Hofmann-
Lehmann, R., and Lutz, H. 1999. Quantitative real-time PCR for the measurement of feline cytokine mRNA. Vet. Immunol. Immunopathol. 71: 291-305.
108. Li, X., Clarke, J. D., Zhang, Y., and Dong, X. 2001. Activation of an EDS1-
mediated R-gene pathway in the snc1 mutant leads to constitutive, NPR1-independent pathogen resistance. Mol. Plant-Microbe Interact. 14: 1131-1139.
109. Liang, F., Holt, I., Pertea, G., Karamycheva, S., Salzberg, S. L., and
Quackenbush, J. 2000. An optimized protocol for analysis of EST sequences. Nucleic Acids Res. 28: 3657-3665.
165
110. Liu, J., Blaylock, L. A., Endre, G., Cho, J., Town, C. D., VandenBosch, K. A., and Harrison, M. J. 2003. Transcript profiling coupled with spatial expression analyses reveals genes involved in distinct developmental stages of an arbuscular mycorrhizal symbiosis. Plant Cell 15: 2106-2123.
111. Liu, Y., Zhang, S., and Klessig, D. F. 2000. Molecular cloning and
characterization of a tobacco MAP kinase kinase that interacts with SIPK. Mol. Plant-Microbe Interact. 13: 229-124.
112. Livak, K. J., and Schmittgen, T. D. 2001. Analysis of relative gene expression
data using real time quantitative PCR and the 2-∆∆Ct method. Methods 25: 402-408.
113. Lullien, V., Barker, D. G., de Lajudie, P., and Huguet, T. 1987. Plant gene
expression in effective and ineffective root nodules of alfalfa (Medicago sativa). Plant Mol. Biol. 9: 469-478.
114. Mackay, I. M., Arden, K. E., and Nitsche, A. 2002. Real-time PCR in virology.
Nucleic Acids Res. 30: 1292-1305. 115. Maleck, K., Levine, A., Eulgem, T., Morgan, A., Schmid, J., Lawton, K. A.,
Dangl, J. L., and Dietrich, R. A. 2000. The transcriptome of Arabidopsis thaliana during systemic acquired resistance. Nature Genet. 26: 403–410.
116. Mangalathu, R., Ranamukhaarachchi, D. G., Vernon, S. D., and Unger, E. R.
2001. Use of Real-Time Quantitative PCR to validate the results of cDNA array and differential display PCR technologies. Methods 25: 443-451.
117. McGonigle, B., Keeler, S. J., Lau S. C. L., Koeppe, M. K., and O'Keefe, D. P.
2000. A genomics approach to the comprehensive analysis of the Glutathione S-Transferase gene family in soybean and maize. Plant Physiol. 124: 1105-1120.
118. McGrath, R., and Ecker, J. R. 1998. Ethylene signaling in Arabidopsis: events
from the membrane to the nucleus. Plant Physiol. Biochem. 36: 103-113. 119. Melan, M., Dong, X., Endara, M. E., Davis, K. R., Ausubel, F. M., and Peterman,
T. K. 1993. An Arabidopsis thaliana lipoxygenase gene can be induced by pathogens, abscisic acid, and methyl jasmonate. Plant Physiol. 101: 441-450.
120. Miller, S., and Maxwell, D. P. 1984. Light microscope observations of
susceptible, host resistant, and nonhost resistant interactions of alfalfa with Phytophthora megasperma. Can. J. Bot. 62: 109-116.
166
121. Mitra, R. M., Gleason, C. A., Edwards, A., Hadfield, J., Downie, J. A., Oldroyd, G. E. D., and Long S. R. 2004. A Ca2+/calmodulin-dependent protein kinase required for symbiotic nodule development: gene identification by transcript-based cloning. Proc. Nat. Acad. Sci. USA 101: 4701-4705.
122. Mitra, R. M., and Long, S. R. 2004. Plant and bacterial symbiotic mutants define
three transcriptionally distinct stages in the development of the Medicago truncatula/Sinorhizobium meliloti symbiosis. Plant Physiol. 134: 595–604.
123. Molecular Probes, Inc. 2004. Handbook of fluorescent probes and
research products. Section 1.1: Introduction to amine modification. http://www.probes.com/handbook/sections/0101.html.
124. Mundodi, S. R., and Paiva, N. L. 2000. Expression of a medicarpin detoxification
gene in alfalfa. (Abstr.) Plant Biology Meeting (ASPB): 281. 125. Mundodi, S. R., Watson, B. S., Lopez-Meyer, M., and Paiva, N. L. 2001.
Functional expression and subcellular localization of the Nectria haematococca Mak1 phytoalexin detoxification enzyme in transgenic tobacco. Plant Mol. Biol. 46: 421-432.
126. Nam, Y-W., Penmetsa, R. V., Endre, G., Uribe, P., Kim, D., and Cook, D. R.
1999. Construction of a bacterial artificial chromosome library of Medicago truncatula and identification of clones containing ethylene-response genes. Theor. Applied Genetics. 98: 638-646.
127. Nolan, K. E., Irwanto, R., and Rose, R. J. 2003. Auxin up-regulates MtSERK1
expression in both Medicago truncatula root-forming and embryogenic cultures. Plant Physiol. 133: 218-230.
128. Norman-Setterblad, C., Vidal, S., and Palva, E. T. 2000. Interacting signal
pathways control defense gene expression in Arabidopsis in response to cell wall-degrading enzymes from Erwinia carotovora. Mol. Plant-Microbe Interact. 13: 430-438.
129. Nürnberger, T., and Scheel, D. 2001. Signal transmission in the plant immune
response. Trends in Plant Science 6: 372-379. 130. Nygaard, S., Tofte, J., and Barnes, D. K. 1995. Phytophthora root rot-seedling in:
Standard tests to characterize alfalfa cultivars. North America Alfalfa Improvement Conference (NAAIC). Oklahoma State University, Stillwater, OK. http://www.naaic.org/stdtests/phytophtseeds.htm.
167
131. Nygaard, S. L., and Grau, C. R. 1989. Phytophthora megasperma virulence to alfalfa measured using single-isolate zoospore suspensions. Can. J. Plant Pathol. 11: 101-108.
132. O’Neill, N. R. 1991. Anthracnose in: Standard tests to characterize alfalfa
cultivars. North America Alfalfa Improvement Conference (NAAIC). Third edition (1991). Oklahoma State University, Stillwater, OK. http://www.naaic.org/stdtests/anthracn.html.
133. O’Neill, N. R. 1996. Defense expression in protected tissues of Medicago sativa
is enhanced during compatible interactions with Colletotrichum trifolii. Phytopathology 86: 1045-1050.
134. O’Neill, N. R. 1996. Pathogenic variability and host resistance in the
Colletotrichum trifolii / Medicago sativa pathosystem. Plant Dis. 80: 450-457. 135. O’Neill, N. R., Bauchan, G. R., and Samac, D. A. 2003. Reactions in the annual
Medicago spp. core germplasm collection to Phoma medicaginis. Plant Dis. 87: 557-562.
136. O’Neill, N. R., and Saunders, J. A. 1994. Compatible and incompatible responses
in alfalfa cotyledons to races 1 and 2 of Colletotrichum trifolii. Phytopathology 84: 283-287.
137. Oklahoma Cooperative Extension Service. 2003. Root and crown diseases. Pages
30-33 in: E-826, Alfalfa production guide for the southern great plains. Oklahoma State University. Stillwater, OK.
138. Okubo, K., Hori, N., Matoba, R., Niiyama, T., Fukushima, A., Kojima, Y., and
Matsubara, K. 1992. Large scale cDNA sequencing for analysis of quantitative and qualitative aspects of gene expression. Nature Genet. 2: 173-179.
139. Okubo, K., Itoh, K., Fukushima, A., Yoshii, J., and Matsubara, K. 1995.
Monitoring cell physiology by expression profiles and discovering cell type-specific genes by compiled expression profiles. Genomics 30: 178-186.
140. Oldroyd, G., Engstrom, E., and Long, S. R. 2001. Ethylene inhibits the Nod
factor signal transduction pathway of Medicago truncatula. Plant Cell 13: 1835-1849.
141. Oldroyd, G., and Geurts, R. 2001. Medicago truncatula, going where no plant
has gone before. Trends in Plant Science. 6: 552-554.
168
142. Oldroyd, G., Mitra, R. M., Wais, R. J., and Long, S. R. 2001. Evidence for structurally specific negative feedback in the Nod factor signal transduction pathway. Plant Journal 28: 191-199.
143. Oldroyd, G.E.D. 2001. Dissecting symbiosis: developments in Nod factor signal
transduction. Annals of Bot. 87: 709-718. 144. Orozco-Cárdenas, M. L., Narváez-Vásquez, J., and Ryan, C. A. 2001. Hydrogen
peroxide acts as a second messenger for the induction of defense genes in tomato plants in response to wounding, systemin, and methyl jasmonate. Plant Cell 13: 179-191.
145. Parker, J. E., Knoegge, W., and Scheel, D. 1989. Molecular aspects of host-
pathogen interactions in Phytophthora. Pages 91-103 in: Phytophthora. J.A. Lucas, R. C. Shas, D. C. Shaw, and L. R. Cooke, eds. Cambridge University Press. Cambridge, United Kingdom.
146. Penmetsa, R. V., and Cook, D. R. 1997. A legume ethylene-insensitive mutant
hyperinfected by its rhizobial symbiont. Science 275: 527-530. 147. Penmetsa, R. V., and Cook, D. R. 2000. Production and characterization of
diverse developmental mutants of Medicago truncatula. Plant Physiol. 123: 1387-1397.
148. Penmetsa, V., Frugoli, J., Smith, L. S., Long, S. R., and Cook, D. R. 2003. Dual
genetic pathways controlling nodule number in Medicago truncatula. Plant Physiol. 131: 998-1008.
149. Penninckx, I., Eggermont, K., Terras, F., and Thomma, B. 1996. Pathogen-
induced systemic activation of a plant defensin gene in Arabidopsis follows a salicylic acid-independent pathway. Plant Cell 8: 2309-2323.
150. Perfect, S. E., Hughes, H. B., O'Connell, R. J., and Green, J. R. 1999.
Colletotrichum: A model genus for studies on pathology and fungal-plant interactions. Fungal Genetics & Biology 27: 186-198.
151. Petersen, M., Brodersen, P., Naested, H., Andreasson, E., Lindhart, U., Johansen,
B., Nielsen, H. B., Lacy, M., Austin, M. J., Parker, J. E. Sharma, S. B., Klessig, D. F., Martienssen, R., Mattsson, O., Jensen, A. B., and Mundy, J. 2000. Arabidopsis MAP kinase 4 negatively regulates systemic acquired resistance. Cell 103: 1111-1120.
169
152. Pieterse, C., van Wees, S., and van Pelt, J. 1998. A novel signaling pathway controlling induced systemic resistance in Arabidopsis. Plant Cell. 10: 1571-1580.
153. Powell, N. T., Meléndez, P. L., and Batten, C. K. 1971. Disease complexes in
tobacco involving Meloidogyne incognita and certain soil-borne fungi. Phytopathology 61: 1332-1337.
154. Quackenbush, J., Cho, J., Lee, D., Liang, F., Holt, I., Karamycheva, S., Parvizi,
B., Pertea, G., Sultana, R., and White, J. 2001. The TIGR Gene Indices: analysis of gene transcript sequences in highly sampled eukaryotic species. Nucleic Acids Res. 29: 159-164.
155. Ramu, S. K., Peng, H. M., and Cook, D. R. 2002. Nod factor induction of
reactive oxygen species production is correlated with expression of the early nodulin gene rip1 in Medicago truncatula. Mol. Plant-Microbe Interact. 15: 522-528.
156. Reddy, M. V., Raju, T. N., and Lenné, J. M. 1998. Diseases of pigeonpea. Pages
517-558 in: The pathology of food and pasture legumes, D. J. Allen, and J. M. Lenné, eds. ICRISAT & CAB International, New York, NY.
157. Reue, K. 1998. mRNA quantitation techniques: considerations for experimental
design and application. Journal of Nutrition 128: 2038-2044. 158. Roetschi, A., Si-Ammour, A., Belbahri, L., Mauch, F., and Mauch-Mani, B.
2001. Characterization of an Arabidopsis-Phytophthora pathosystem: Resistance requires a functional PAD2 gene and is independent of salicylic acid, ethylene and jasmonic acid signaling. Plant Journal 28: 293-305.
159. Rushton, P. J., Torres, J. T., Parniske, M., Wernert, P., Hahlbrock, K., and
Somssich, I. E. 1996. Interaction of elicitor-induced DNA-binding proteins with elicitor response elements in the promoters of parsley PR1 genes. EMBO J. 15: 5690-5700.
160. Ryals, J. A., Neuenschwander, U. H., Willits, M. G., Molina, A., Steiner, H. Y.,
and Hunt, M. D. 1996. Systemic acquired resistance. Plant Cell 8: 1809-1819. 161. Ryan, C. A., Pearce, G., Johnson, S., McGurl, B., Orozco-Cardenas, M., and
Farmer, E. 1993. Systemin, a polypeptide signal for proteinase inhibitor gene expression in plants. Pages 196-201 in: Developments in plant pathology; mechanisms of plant defense responses. B. Fritig, and M. Legrand, eds. Vol. 2. Kluwer Academic Publishers, Boston, MA.
170
162. Saitou, N., and Nei, M. 1987. The neighbor-joining method: a new method for reconstructing phylogenetic trees. Mol. Biol. Evol. 4: 406-425.
163. Salzer, P., Bonanomi, A., Beyer, K., Vögeli-Lange, R., Aeschbacher, R. A.,
Lange, J., Wiemken, A., Kim, D., Cook, D. R., and Boller, T. 2000. Differential expression of eight chitinase genes in Medicago truncatula roots during mycorrhiza formation, nodulation, and pathogen infection. Mol. Plant-Microbe Interact. 13: 763–777.
164. Sambrook, J., and Russell, D, W. 2001. Molecular cloning: A laboratory manual.
Cold Spring Harbor Laboratory Press. Cold Spring Harbor, NY. 165. Sasaki, T., Song, J., Koga-Ban, Y., Matsui, E., Fang, F., Higo, H., Nagasaki, H.,
Hori, M., Miya, M., and Murayama-Kayano, E. 1994. Toward cataloguing all rice genes: large-scale sequencing of randomly chosen rice cDNAs from a callus cDNA library. Plant Journal 6: 615–624.
166. Schenk, P. M., Kazan, K., Wilson, L., Anderson, J. P., Richmond, T., Somerville,
S. C., and Manners, J. M. 2000. Coordinated plant defense responses in Arabidopsis revealed by microarray analysis. Proc. Natl. Acad. Sci. USA. 97: 11655-11660.
167. Seo, S., Sano, H., and Ohashi, Y. 1999. Jasmonate-based wound signal
transduction requires activation of WIPK, a tobacco mitogen-activated protein kinase. Plant Cell 11: 289-298.
168. Shah, J., Kachroo, P., and Klessig, D. F. 1999. The Arabidopsis ssi1 mutation
restores pathogenesis-related gene expression in npr1 plants and renders defensin gene expression salicylic acid dependent. Plant Cell 11: 191-206.
169. Shah, J., Kachroo, P., Nandi, A., and Klessig, D. F. 2001. A recessive mutation
in the Arabidopsis SSI2 gene confers SA- and NPR1-independent expression of PR genes and resistance against bacterial and oomycete pathogens. Plant Journal 25: 563-574.
170. Soby, S., Caldera, S., Bates, R., and Vanetten, H. 1996. Detoxification of the
phytoalexins maackiain and medicarpin by fungal pathogens of alfalfa. Phytochemistry 41: 759-765.
171. Solano, R., Stepanova, A., Chao, Q., and Ecker, J. R. 1998. Nuclear events in
ethylene signaling: A transcriptional cascade mediated by ethylene-insensitive3 and ethylene-response-factor1. Genes & Development 12: 3703-3714.
171
172. Staskawicz, B. J., Asubel, F. M., Baker, B. J., Ellis, J. E., and Jones, J. D. G. 1995. Molecular genetics of plant disease resistance. Science 268: 661-667.
173. Stekel, D. J., Git, Y., and Falciani, F. 2000. The comparison of gene expression
from multiple cDNA libraries. Genome Res. 10: 2055–2061. 174. Stepanova, A. N., and Ecker, J. R. 2000. Ethylene signaling: from mutants to
molecules. Curr. Op. Plant Biol. 3: 353-360. 175. Stevenson, P. C., Padgham, D. E., and Haware, M. P. 1994. The chemical basis
of resistance in chickpeas, Cicer arietinum L., to fusarium wilt, Fusarium oxisporum f.sp. ciceri. Acta Hort. (ISHS) 381: 631-637.
176. Stougaard, J. 2000. Regulators and regulation of legume root nodule
development. Plant Physiol. 124: 531-540. 177. Stryer, L., and Haugland, R. P. 1967. Energy transfer: a spectroscopic ruler. Proc.
Natl. Acad. Sci. USA 58: 719-726. 178. Thomma, B., Eggermont, K., and Penninckx, I. 1998. Separate jasmonate-
dependent and salicylate-dependent defense-response pathways in Arabidopsis are essential for resistance to distinct microbial pathogens. Proc. Natl. Acad. Sci. USA 95: 15107-15111.
179. Thomma, B., Eggermont, K., Tierens, K., and Broekaert, W. 1999. Requirement
of functional Ethylene-Insensitive 2 Gene for efficient resistance of Arabidopsis to infection by Botrytis cinerea. Plant Physiol. 121: 1093-1101.
180. Thompson, J. D., Gibson, T. J., Plewniak, F., Jeanmougin, F., and Higgins, D. G.
1997. The ClustalX windows interface: flexible strategies for multiple sequence alignment aided by quality analysis tools. Nucleic Acids Res. 24: 4876-4882.
181. Ton, J., van Pelt, J. A., van Loon, L. C., and Pieterse, C. M. J. 2002. Differential
effectiveness of salicylate-dependent and jasmonate/ethylene-dependent induced resistance in Arabidopsis. Mol. Plant-Microbe Interact. 15: 27-34.
182. Trinh, T. H., Ratet, P., Kondorosi. E., Durand, P., Kamaté, K., Bauer, P., and
Kondorosi, A. 1998. Rapid and efficient transformation of diploid Medicago truncatula and Medicago sativa ssp. falcata lines improved in somatic embryogenesis. Plant Cell Reports 17: 345-355.
183. Truesdell, G. M., and Dickman, M. B. 1997. Isolation of pathogen/stress-
inducible cDNAs from alfalfa by mRNA differential display. Plant Mol. Biology 33: 737-743.
172
184. Turner, J. G., Ellis, C., and Devoto, A. 2002. The Jasmonate Signal Pathway. (Abstr.) Plant Cell (suppl.): S153–S164.
185. Tuzun, S., and Bent, E. 1999. The role of hydrolytic enzymes in multigenic and
microbially-induced resistance in plants. Pages 95-115 in: Induced plant defenses against pathogens and herbivores. A. Agrawal, S. Tuzun, and E. Bent, eds. The American Phytopathological Society Press. St. Paul, MN.
186. van Spronsen, P. C., Gronlund, M., Bras, C. P., Spaink, H. P., and Kijne J. W.
2001. Cell biological changes of outer cortical root cells in early determinate nodulation. Mol. Plant-Microbe Interact. 14: 839–847.
187. van Wees, S. C. M., De Swart, E. A. M., van Pelt, J. A., van Loon L. C., and
Pieterse, C. M. J. 2000. Enhancement of induced disease resistance by simultaneous activation of salicylate and jasmonate-dependent defense pathways in Arabidopsis thaliana. Proc. Natl. Acad. Sci. USA 97: 8711-8716.
188. VandenBosch, K., and Stacey, G. (Monitoring editors). 2003. Summaries of
legume genomics projects from around the globe. Community resources for crops and models. Plant Physiol. 131: 840-865.
189. Vijayan, P., Shockey, J., Levesque, C. A., Cook, R. J., and Browse, J. 1998. A
role for jasmonate in pathogen defense of Arabidopsis. Proc. Natl. Acad. Sci. USA 95: 7209-7214.
190. Wittwer, C. T., Herrmann, M. G., Gundry, C. N., and Elenitoba-Johnson, K. S. J.
2001. Real time multiplex PCR assays. Methods 25: 430-442. 191. Wright, B., Rowse, H. R., and Whipps, J. M. 2003. Application of beneficial
microorganisms to seeds during drum priming. Biocontrol Science and Technology 13: 599-614.
192. Wu, S. H., Ramonell, K., Gollub, J., and Somerville, S. 2001. Plant gene
expression profiling with DNA microarrays. Plant Physiol. Biochem. 39: 917-926.
193. Xie, D. X., Feys, B. F., James, S., Nieto-Rostro, M., and Turner, J. G. 1998.
COI1: An Arabidopsis gene required for jasmonate-regulated defense and fertility. Science 280: 1091–1094.
194. Yang, K., Liu, Y., and Zhang, S. 2001. Activation of mitogen-activated protein
kinase is involved in disease resistance in tobacco. Proc. Natl. Acad. Sci. USA 98: 741-746.
173
195. Yu, I., Parker, J., and Bent, A. 1998. Gene-for-gene disease resistance without the hypersensitive response in Arabidopsis dnd1 mutant. Proc. Natl. Acad. Sci. USA 95: 7819-7824.
196. Zhang, S., and Klessig, D. F. 2001. MAPK cascades in plant defense responses.
Trends in Plant Science 11: 520-527. 197. Zhang Y., Fan, W., Kinkema, M., Li, X., and Dong X. 1999. Interaction of NPR1
with basic leucine zipper protein transcription factors that bind sequences required for salicylic acid induction of the PR-1 gene. Proc. Natl. Acad. Sci. USA 96: 6523-6528.
198. Zhu, H., Cannon, S. B., Young, N. D., and Cook, D. R. 2002. Phylogeny and
genomic organization of the TIR and non-TIR NBS-LRR resistance gene family in Medicago truncatula. Mol. Plant-Microbe Interact. 15: 529-539.
199. Zubieta, C., Dixon, R. A., and Noel, J. P. 2001. Crystal structures of chalcone O-
methyltransferase and isoflavone O-methyltransferase reveal the structural basis for substrate specificity in plant O-methyltransferases. Nature Struct. Biol. 8: 271-279.

174
APPENDIX
Formula Derivation for the comparative 2–∆∆CT method for real time PCR amplification
data analysis (112).
The equation that describes the exponential amplification of PCR is:
Xn = Xo x (1-Ex)n Where Xn = number of target molecules at cycle n
Xo = number of initial target molecules
Ex = Efficiency of target amplification
Therefore;
XT = Xo x (1 + Ex )CT,X = KX XT = Threshold number of target molecules
CT,X = Threshold number of target amplification
KX = Constant
A similar equation describes the amplification of the endogenous reference:
RT = Ro x (1 + Ex )CT,R = KR
Ro = number of initial reference molecules
RT = Threshold number of reference molecules
ER = Efficiency of target amplification
CT,R = Threshold number of reference amplification
KR = Constant
XT Xo x (1 + Ex )CT,X KX ── = ─────── = ── = K RT Ro x (1 + Ex )CT,R KR

175
XT and RT depend on several factors like the reporter dye used in the probe, its purity,
the sequence context effects on the fluorescence of the probe, the efficiency of probe
cleavage and the setting of the threshold cycle of fluorescence. So K does not have to be
equal to 1.
If the efficiency of amplification of target and reference molecules is the same, the equation can be simplified to: Xo ── x (1+ E ) CT,X - CT,R = K Ro Solving for some of the terms results in: XN x (1+E) ∆CT = K Where XN is the normalized amount of target according to the reference value and ∆CT
is the difference in threshold cycles for target and reference.
Rearranging the expression, becomes: XN = K x (1+E) -∆CT The last step is to divide XN for any sample q by the XN for the calibrator (cb). XN, q K x (1+E) –∆CT,q ── = ─────── = (1+E) –∆∆CT XN, cb K x (1+E) –∆CT, cb Where ∆∆CT is the subtraction of ∆CT,q –∆CT, cb For amplicons smaller than 150 bp and under optimized amplification conditions, E is
close to 1.
Therefore the equation can be simplified to: 2–∆∆CT.
176
VITA
NAME: Pedro Uribe Mejía
PERMANENT ADDRESS: Transversal 5. No. 87-87 Bogotá, Colombia, S. A. EDUCATIONAL BACKGROUND:
DEGREE: Specialist. MAJOR SUBJECT: Integrated Management of
Environment. UNIVERSITY: Universidad de los Andes, Bogotá,
Colombia. DATE: September, 1997. DEGREE: Bachelor of Science. MAJOR SUBJECT: Biology. UNIVERSITY: Universidad de los Andes, Bogotá,
Colombia. DATE: September, 1992.