Embed Size (px)
Citation preview
Behavioral/Cognitive
Distinct � Band Oscillatory Networks Subserving Motor andCognitive Control during Gait Adaptation
Johanna Wagner,1,2 X Scott Makeig,2 Mateusz Gola,2,3 Christa Neuper,1,4 and Gernot Muller-Putz1
1Laboratory of Brain-Computer Interfaces, Institute for Knowledge Discovery, Graz University of Technology, 8010 Graz, Austria, 2Swartz Center forComputational Neuroscience, Institute for Neural Computation, University of California–San Diego, La Jolla, California 92093-0559, 3Institute ofPsychology, Polish Academy of Science, Warsaw 00-378, Poland, and 4Department of Psychology, University of Graz, 8010 Graz, Austria
Everyday locomotion and obstacle avoidance requires effective gait adaptation in response to sensory cues. Many studies have shown thatefficient motor actions are associated with � rhythm (8 –13 Hz) and � band (13–35 Hz) local field desynchronizations in sensorimotorand parietal cortex, whereas a number of cognitive task studies have reported higher behavioral accuracy to be associated with increasesin � band power in prefrontal and sensory cortex. How these two distinct patterns of � band oscillations interplay during gait adaptation,however, has not been established. Here we recorded 108 channel EEG activity from 18 participants (10 males, 22–35 years old) attempt-ing to walk on a treadmill in synchrony with a series of pacing cue tones, and quickly adapting their step rate and length to sudden shiftsin pacing cue tempo. Independent component analysis parsed each participant’s EEG data into maximally independent component (IC)source processes, which were then grouped across participants into distinct spatial/spectral clusters. Following cue tempo shifts, mean �band power was suppressed for IC sources in central midline and parietal regions, whereas mean � band power increased in IC sourcesin or near medial prefrontal and dorsolateral prefrontal cortex. In the right dorsolateral prefrontal cortex IC cluster, the � band powerincrease was stronger during (more effortful) step shortening than during step lengthening. These results thus show that two distinctpatterns of � band activity modulation accompany gait adaptations: one likely serving movement initiation and execution; and the other,motor control and inhibition.
Key words: � band oscillations; EEG; gait adaptation; independent component analysis; motor inhibition; rhythmic auditory cueing
IntroductionImpaired gait adaptability (i.e., a reduced ability to change walkingspeed or direction as required) (Den Otter et al., 2005; Hofstad et al.,2006) produces a reduced ability to avoid obstacles and an increased
risk of falling in affected individuals, including many stroke andParkinson’s patients (Weerdesteyn et al., 2006). Rhythmic auditorycues have been widely used in gait rehabilitation (Thaut and Abiru,2010). Use of an auditory pacing stimulus stream, including infre-quent tempo shifts, has been recommended to identify deficits andtrain improvements in gait adaptation in stroke patients (Roerdinket al., 2009, 2007). Unfortunately, because of the ill effects of bodymovements on brain imaging data, the precise temporal brain dy-
Received Sept. 23, 2015; revised Dec. 26, 2015; accepted Jan. 11, 2016.Author contributions: J.W. designed research; J.W., M.G., C.N, and G.M.-P. performed research; J.W. and S.M.,
analyzed data; J.W., S.M, and M.G. wrote the paper.This work was supported by Future Labs Reloaded 2013 of the Faculty of Computer Science at the Graz University
of Technology, Austria, OeAD (Austrian Agency for International Mobility) Marietta Blau Grant to J.W., the BMWF(Austrian Federal Ministry of Science and Research), Polish Ministry of Science Mobility Plus Grant 1057/MOB/2013/0 to M.G., and a gift to University of California–San Diego by the Swartz Foundation (Old Field, NY). We thankDr. Teodoro Solis-Escalante for programming the auditory paradigm; and Daniel Hackhofer and Laura Schulz forassistance during the experiments.
The authors declare no competing financial interests.
Correspondence should be addressed to Dr. Johanna Wagner, Laboratory of Brain-Computer Interfaces, Institutefor Knowledge Discovery, Graz University of Technology, Stremayrgasse 16, 8010 Graz, Austria. E-mail:[email protected].
DOI:10.1523/JNEUROSCI.3543-15.2016Copyright © 2016 the authors 0270-6474/16/362212-15$15.00/0
Significance Statement
Understanding brain dynamics supporting gait adaptation is crucial for understanding motor deficits in walking, such as thoseassociated with aging, stroke, and Parkinson’s. Only a few electromagnetic brain imaging studies have examined neural correlatesof human upright walking. Here, application of independent component analysis to EEG data recorded during treadmill walkingallowed us to uncover two distinct � band oscillatory cortical networks that are active during gait adaptation to shifts in the tempoof an auditory pacing cue: (8 –13 Hz) � rhythm and (13–35 Hz) � band power decreases in central and parietal cortex and (14 –20Hz) � band power increases in frontal brain areas. These results provide a fuller framework for electrophysiological studies ofcortical gait control and its disorders.
2212 • The Journal of Neuroscience, February 17, 2016 • 36(7):2212–2226
namics of step adaptation remain largely unexplored by neuroimag-ing studies. Recent signal processing advances, however, allow studyof source-resolved EEG dynamics during walking (Gwin et al., 2010,2011; Gramann et al., 2011; Seeber et al., 2015) and other actions, anapproach termed Mobile Brain/Body Imaging by Makeig et al.(2009). Adopting this approach, in several previous studies, weshowed that specific gait phases are represented in power amplitudemodulations in the lower (24–40 Hz) (Wagner et al., 2012, 2014;Seeber et al., 2014) and upper (70–90 Hz) (Seeber et al., 2015) �band in central midline areas. Other studies have shown lateralizedmodulations at scalp electrode channels C3 and C4 (Cheron et al.,2012) and in source-resolved (Gwin et al., 2011) power relative to thegait cycle.
We have also reported � rhythm and �-band power decreases(desynchronizations) over central sensorimotor and parietal ar-eas during active walking relative to standing or passive walking(i.e., when participants’ legs are moved by a robot) (Wagner et al.,2012; Seeber et al., 2014) and during step adaptation to interac-tive visual feedback in a virtual environment (Wagner et al.,2014). � and � band power in the motor system decrease duringthe preparation and voluntary execution of movements (Jasperand Penfield, 1949; Pfurtscheller and Berghold, 1989; Pfurt-scheller and Lopes da Silva, 1999), whereas � band power in-creases in scalp EEG data have been related to movementsuppression (Gilbertson et al., 2005; Androulidakis et al., 2007;Zhang et al., 2008; Pogosyan et al., 2009; Joundi et al., 2012;Solis-Escalante et al., 2012).
Electrophysiological studies suggest that � band oscilla-tions may also index top-down signaling. For example, visualtop-down attention and behavioral rule switching are relatedto oscillatory synchronization of �-band local field potentialsin monkeys’ prefrontal cortex (PFC) and parietal cortex(Buschman et al., 2007, 2012). PFC affects top-down controlby sending information about goals and appropriate actions toother brain areas (Miller and Cohen, 2001). Swann et al.(2009) reported that an electrocortical � band power increasein PFC during motor inhibition preceded � and � band powerdecreases in motor cortex, whereas in older subjects � bandactivity increases may have a compensatory effect (Geerligs etal., 2012; Gola et al., 2012, 2013).
Recent studies of gait adaptation using EEG showed in-creased event-related potential (ERP) (Haefeli et al., 2011)and hemodynamic responses (Suzuki et al., 2004) duringpreparation for, and performance of, stepping over obstacles,as well as during adaptive walking and precision stepping(Koenraadt et al., 2014). A recent study demonstrated that,during gait adaptation, stroke patients prefer step lengtheningover step shortening (Roerdink et al., 2009), suggesting thatbrain mechanisms controlling voluntary gait deceleration andacceleration differ (Varraine et al., 2000). Recent studies havereported that performing a secondary task during walking in-duces participants to take longer strides (Lovden et al., 2008;Li et al., 2012; De Sanctis et al., 2014), suggesting that steplengthening requires fewer attentional resources.
To examine whether difficulty in gait adaptation is relatedto PFC � band activity, we designed a high-density EEG studyin which participants walking on a treadmill moving at asteady rate had to adapt their step length and rate to shifts inthe tempo of a pacing tone (e.g., shifts requiring both longerand shorter step adaptation). We expected three different pro-cesses to accompany step rate and length adaptations to audi-tory tempo shifts: (1) � and � band desynchronization insensorimotor and parietal cortex, reflecting increased motor
flexibility and adaptation; (2) increased � band power withinthe PFC, reflecting additional cognitive control; and (3) scal-ing of PCF � band power changes with task difficulty, produc-ing a stronger increase in � band power during step shorteningthan during step lengthening.
Materials and MethodsParticipants. Twenty healthy volunteers with no neurological or motordeficits participated in this study. The data of two subjects were excludedbecause of heavy EEG artifact. The remaining data of 18 subjects (10males and 8 females, 22–35 years of age; mean 29.1 years, SD 2.7 years)were used in the analysis. All participants were right handed. Prior stud-ies show that footedness follows handedness in right handers, althoughnot consistently so in left handers (Peters and Durding, 1979). The ex-perimental procedures were approved by the human use committee ofthe Medical University Graz. Each subject gave informed consent beforethe experiment.
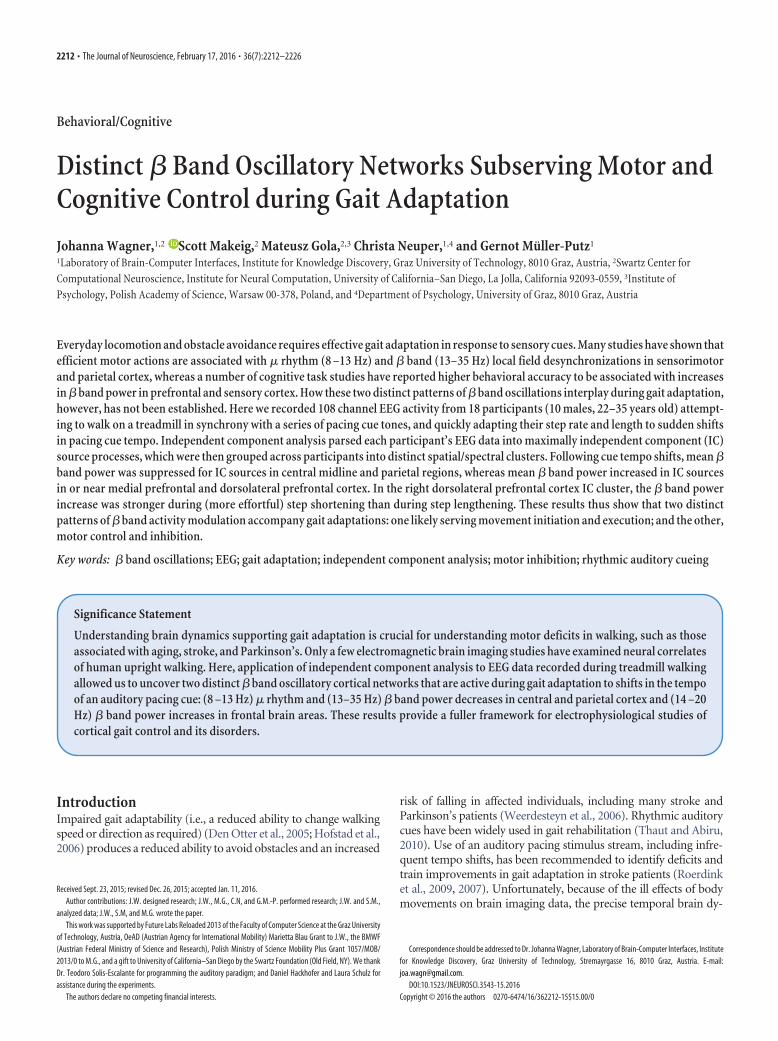
Experimental design and procedure. Figures 1 and 2 show the experi-mental setup and a schematic of the task paradigm, which was adaptedfrom Bank et al. (2011).
Training. Before the experimental procedure, participants practicedwalking on the treadmill for 2–3 min. While walking on the treadmill,participants adapted the belt speed to their most comfortable walkingspeed; this ranged from 3.0 to 3.7 km/h across participants. Belt speedwas then fixed at the participant’s comfortable walking speed and there-after remained constant throughout the experiment. Next, participantspracticed the gait adaptation task with auditory pacing so as to becomefamiliar with the task until they reached acceptable performance, mean-ing that they correctly responded to step-advance and step-delay pacingsignal tempo shifts by shortening or lengthening their steps so as tosynchronize their gait to the new pacing tempo.
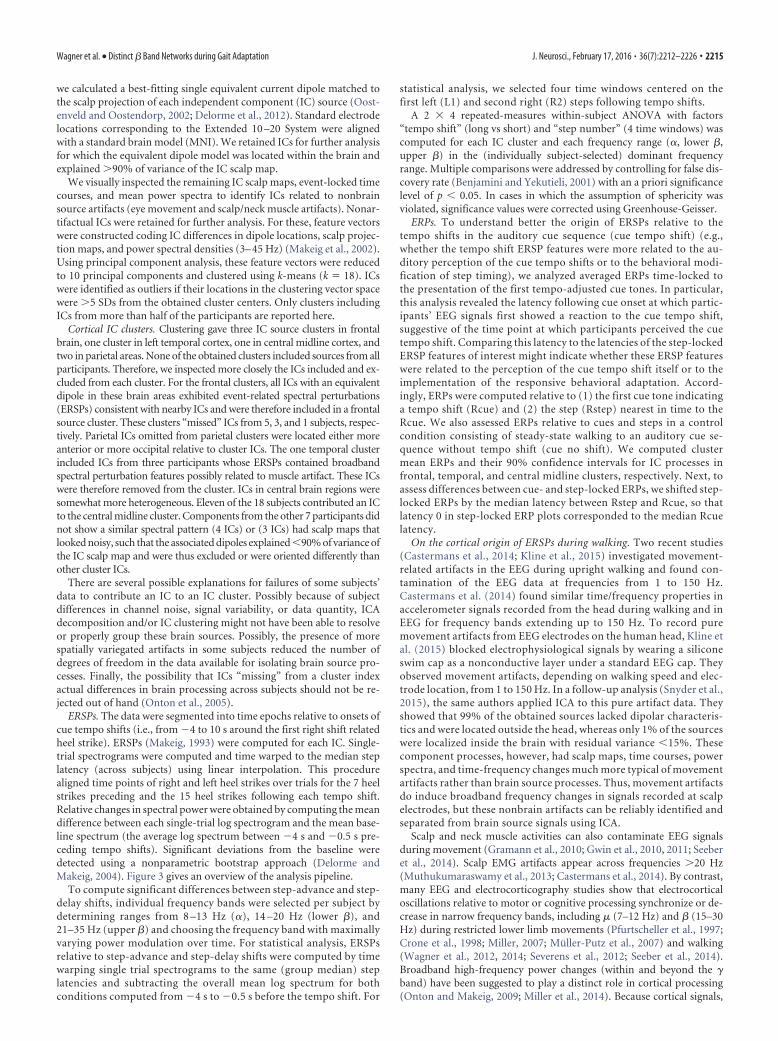
Figure 1. Experimental setup. Participant walking on the treadmill with auditory pacingcues delivered through in-ear headphones. During the initial training period, treadmill speed(3–3.5 km/h) was adjusted to the most comfortable pace for each participant and thereafterremained constant.
Wagner et al. • Distinct � Band Networks during Gait Adaptation J. Neurosci., February 17, 2016 • 36(7):2212–2226 • 2213
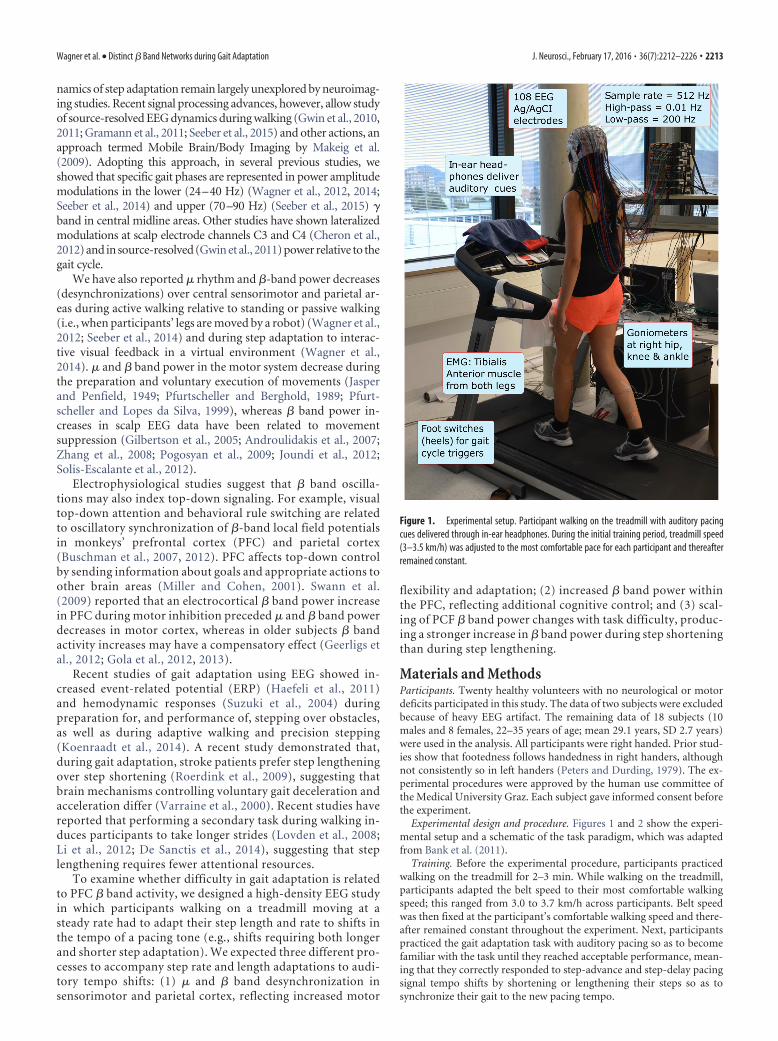
Trial structure. During each approximatelyminute-long trial period, participants firstwalked without pacing cues for �10 s. Duringthe next 8 –12 s, they heard a stream of auditorycue tones delivered via in-ear headphones at atempo matching to their current step tempo(the mean of the step intervals between their sixmost recent uncued steps). The cue sequencewas an alternating series of high and low tonespresented so as to match the participant’s rightand left (or left and right) heel strikes, respec-tively; this high/low assignment was random-ized over subjects. Participants were asked toattempt to synchronize their heel strikes to thecue tones.
Next, relative to a randomly selected rightheel strike (after 8 –12 s of cued steady-statewalking), the tempo of the cue sequence wassuddenly increased or decreased by one-sixthof a cycle (60 deg) (as in Roerdink et al., 2009),and this new cue tempo was maintained for30 –70 steps. Participants were instructed to adjust their heel strikes so asto synchronize with the new cue sequence as quickly as possible. The gaitadjustments required to restore synchronization with the metronomewere as follows: a one-sixth longer step interval and step length in (60°phase shift) step-delay trials, and a one-sixth shorter step interval andstep length in (�60° phase shift) step-advance trials. After 30 –70 steps atthe new step rate, the next trial began immediately with, again, uncuedwalking, during which participants were instructed to return to theirmost comfortable step rate.
A total of 60 step-advance and 60 step-delay trials were conducted in10 blocks of 12 trials, each comprised of 6 step-advance and 6 step-delaytrials presented in random order. Between blocks, when asked for byparticipants, short breaks of 5 min were given during which participantswere standing on the treadmill.
Data acquisition. Seven 16-channel amplifiers (g.tec) were combinedso as to record EEG data from 108 electrode channels in the 5% Interna-tional 10/20 System (EasyCap) (Oostenveld and Praamstra, 2002). Elec-trode locations that extended below the conventional 10 –20 sphericallayout included PO9, POO9, OI1, OI2, POO10, PO10, I1, Iz, and I2.Reference and ground electrodes were placed on the left and right mas-toids, respectively. All electrode impedances were reduced to �5 k�before the recording. Electromyographic (EMG) signals were recordedfrom the skin over the tibialis anterior muscles of both legs using stan-dard adhesive-fixed disposable Ag/AgCl surface electrodes. These EMGchannels were also recorded using left and right mastoids as referenceand ground, respectively. The EEG and EMG data were sampled at 512Hz, high pass filtered �0.1 Hz, and low pass filtered �256 Hz. Footcontacts were measured by mechanical foot switches placed over thecalcaneus bone in the heel of each foot. These switches produced eventmarkers for gait cycle heel strike and heel off events. To record the exacttiming of the auditory cues, we recorded the auditory stimulation viadigital inputs to one of the amplifiers.
Behavioral analysis. Two participant timing error correction processeshave been distinguished: (1) period correction to bring the motor acts(here, heel strikes) into the same tempo as the stimulus sequence(Michon, 1967); and (2) phase correction to make the motor acts coin-cident with pacing stimulus onsets by compensating for any phase dif-ference (Repp, 2001a,b). To assess sensorimotor synchronization, wethus analyzed phase correction and period correction separately. Phasecorrection was assessed by computing asynchronies between heel strikesand pacing tone onsets (for an overview, see Repp, 2005; Repp and Su,2013), whereas period correction was assessed by computing temporaldifferences between cue intervals (time intervals between consecutive cueonsets) and step intervals (or step onset asynchronies, intervals betweenconsecutive heel strikes).
Phase correction. For each trial, the relative phase angle difference be-tween each heel onset and the corresponding auditory cue was calculated.Phase was defined as phase � 360° � (tcue � tHS)/Tcue, with tcue (in
milliseconds) denoting the time of cue onset, tHS denoting the time ofthe nearest heel strike, and Tcue denoting the time interval betweenconsecutive ipsilateral step cues (Roerdink et al., 2007). For each trial,preshift coordination between steps and cues was quantified by comput-ing the mean and SD phase angle difference in the five steps immediatelypreceding the tempo shift. The time course of gait adjustments made bythe participant to restore coordination following cue tempo shifts wasquantified by calculating the phase difference from baseline for the 14steps following the shift and dividing by 60 so that step phase at S0 (thefirst time-perturbed stimulus) was 60° (Roerdink et al., 2009; Pelton etal., 2010). Trials were excluded from analysis if any of the steps exceedednormalized phase of 180°, which corresponds to a 180° difference frompremanipulation performance. Based on these criteria, on average 5 (SD6) shift trials were excluded (6% of all trials).
A 2 � 14 repeated-measures ANOVA with factors “tempo shift” (longvs short) and “step number” (step numbers 1–14 following the shift) wasused to assess significant differences in fidelity of adaptation betweenstep-advance and step-delay shifts. Post hoc tests were corrected for mul-tiple comparisons a priori to a significance level of p � 0.05 using falsediscovery rate (Benjamini and Yekutieli, 2001).
EEG analysis. EEG data analysis was performed using custom scriptswritten in MATLAB2014a (The MathWorks) incorporating EEGLAB14.0b functions (Delorme and Makeig, 2004). In Wagner et al. (2012,2014), we showed that artifact contamination of the EEG during uprightwalking can be separated from the brain source data using Infomax In-dependent Component Analysis (ICA) (compare Onton et al., 2006;Gwin et al., 2010).
The EEG data were high-pass filtered at 1 Hz (zero phase FIR filter,order 7500) to minimize slow drifts, and low pass filtered �200 Hz (zerophase FIR filter, order 36). EEG channels with prominent artifacts wereidentified by visual inspection and removed. On average, 106 channelsper participant (SD 2.2; range 102–108) remained for analysis. TheEEG data were then rereferenced to a common average reference. Aftervisually rejecting artifacts in the continuous EEG, the data were parti-tioned into epochs of 0.5 s and those epochs containing values exceedingthe average of the probability distribution of values across the data seg-ments by 5 SD were rejected. On average, 45 postshift steps per condi-tion (80% of each participant’s EEG data) remained in the analysis (SD11%; range 71%– 89%).
Next, the preprocessed EEG data were decomposed using adaptivemixture ICA (AMICA) (Palmer et al., 2006, 2008). AMICA is a general-ization of the Infomax ICA (Bell and Sejnowski, 1995; Makeig et al.,1996) and multiple-mixture (Lee et al., 1999; Lewicki and Sejnowski,2000) ICA approaches. AMICA performed blind source separation of allconcatenated preprocessed data trials for each subject individually, basedon the assumed temporal near-independence of the effective EEGsources (Makeig et al., 2002, 2004a).
Using a standardized three-shell boundary element head model imple-mented in the DIPFIT toolbox within EEGLAB (sccn.ucsd.edu/eeglab),
Figure 2. Experimental paradigm. Throughout the session, treadmill speed remained fixed at a rate comfortable to the partic-ipant. During each approximately minute-long trial, participants first walked for �10 s without auditory cues, then walked for10 –18 s synchronous with cue tones delivered at their then-prevailing step rate and phase. Thereafter, beginning at a right heelstrike, a sudden (accelerated or decelerated) tempo shift occurred in the pacing cue sequence. In response, participants wereinstructed to adapt their step length, rate, and phase as quickly as possible so as to again synchronize their steps with the cue tonesat the new tempo. After 30 –70 steps, the next trial began immediately, returning again to 10 s of uncued walking during whichparticipants were instructed to return to their most comfortable step rate.
2214 • J. Neurosci., February 17, 2016 • 36(7):2212–2226 Wagner et al. • Distinct � Band Networks during Gait Adaptation
we calculated a best-fitting single equivalent current dipole matched tothe scalp projection of each independent component (IC) source (Oost-enveld and Oostendorp, 2002; Delorme et al., 2012). Standard electrodelocations corresponding to the Extended 10 –20 System were alignedwith a standard brain model (MNI). We retained ICs for further analysisfor which the equivalent dipole model was located within the brain andexplained �90% of variance of the IC scalp map.
We visually inspected the remaining IC scalp maps, event-locked timecourses, and mean power spectra to identify ICs related to nonbrainsource artifacts (eye movement and scalp/neck muscle artifacts). Nonar-tifactual ICs were retained for further analysis. For these, feature vectorswere constructed coding IC differences in dipole locations, scalp projec-tion maps, and power spectral densities (3– 45 Hz) (Makeig et al., 2002).Using principal component analysis, these feature vectors were reducedto 10 principal components and clustered using k-means (k � 18). ICswere identified as outliers if their locations in the clustering vector spacewere �5 SDs from the obtained cluster centers. Only clusters includingICs from more than half of the participants are reported here.
Cortical IC clusters. Clustering gave three IC source clusters in frontalbrain, one cluster in left temporal cortex, one in central midline cortex, andtwo in parietal areas. None of the obtained clusters included sources from allparticipants. Therefore, we inspected more closely the ICs included and ex-cluded from each cluster. For the frontal clusters, all ICs with an equivalentdipole in these brain areas exhibited event-related spectral perturbations(ERSPs) consistent with nearby ICs and were therefore included in a frontalsource cluster. These clusters “missed” ICs from 5, 3, and 1 subjects, respec-tively. Parietal ICs omitted from parietal clusters were located either moreanterior or more occipital relative to cluster ICs. The one temporal clusterincluded ICs from three participants whose ERSPs contained broadbandspectral perturbation features possibly related to muscle artifact. These ICswere therefore removed from the cluster. ICs in central brain regions weresomewhat more heterogeneous. Eleven of the 18 subjects contributed an ICto the central midline cluster. Components from the other 7 participants didnot show a similar spectral pattern (4 ICs) or (3 ICs) had scalp maps thatlooked noisy, such that the associated dipoles explained �90% of variance ofthe IC scalp map and were thus excluded or were oriented differently thanother cluster ICs.
There are several possible explanations for failures of some subjects’data to contribute an IC to an IC cluster. Possibly because of subjectdifferences in channel noise, signal variability, or data quantity, ICAdecomposition and/or IC clustering might not have been able to resolveor properly group these brain sources. Possibly, the presence of morespatially variegated artifacts in some subjects reduced the number ofdegrees of freedom in the data available for isolating brain source pro-cesses. Finally, the possibility that ICs “missing” from a cluster indexactual differences in brain processing across subjects should not be re-jected out of hand (Onton et al., 2005).
ERSPs. The data were segmented into time epochs relative to onsets ofcue tempo shifts (i.e., from �4 to 10 s around the first right shift relatedheel strike). ERSPs (Makeig, 1993) were computed for each IC. Single-trial spectrograms were computed and time warped to the median steplatency (across subjects) using linear interpolation. This procedurealigned time points of right and left heel strikes over trials for the 7 heelstrikes preceding and the 15 heel strikes following each tempo shift.Relative changes in spectral power were obtained by computing the meandifference between each single-trial log spectrogram and the mean base-line spectrum (the average log spectrum between �4 s and �0.5 s pre-ceding tempo shifts). Significant deviations from the baseline weredetected using a nonparametric bootstrap approach (Delorme andMakeig, 2004). Figure 3 gives an overview of the analysis pipeline.
To compute significant differences between step-advance and step-delay shifts, individual frequency bands were selected per subject bydetermining ranges from 8 –13 Hz (�), 14 –20 Hz (lower �), and21–35 Hz (upper �) and choosing the frequency band with maximallyvarying power modulation over time. For statistical analysis, ERSPsrelative to step-advance and step-delay shifts were computed by timewarping single trial spectrograms to the same (group median) steplatencies and subtracting the overall mean log spectrum for bothconditions computed from �4 s to �0.5 s before the tempo shift. For
statistical analysis, we selected four time windows centered on thefirst left (L1) and second right (R2) steps following tempo shifts.
A 2 � 4 repeated-measures within-subject ANOVA with factors“tempo shift” (long vs short) and “step number” (4 time windows) wascomputed for each IC cluster and each frequency range (�, lower �,upper �) in the (individually subject-selected) dominant frequencyrange. Multiple comparisons were addressed by controlling for false dis-covery rate (Benjamini and Yekutieli, 2001) with an a priori significancelevel of p � 0.05. In cases in which the assumption of sphericity wasviolated, significance values were corrected using Greenhouse-Geisser.
ERPs. To understand better the origin of ERSPs relative to thetempo shifts in the auditory cue sequence (cue tempo shift) (e.g.,whether the tempo shift ERSP features were more related to the au-ditory perception of the cue tempo shifts or to the behavioral modi-fication of step timing), we analyzed averaged ERPs time-locked tothe presentation of the first tempo-adjusted cue tones. In particular,this analysis revealed the latency following cue onset at which partic-ipants’ EEG signals first showed a reaction to the cue tempo shift,suggestive of the time point at which participants perceived the cuetempo shift. Comparing this latency to the latencies of the step-lockedERSP features of interest might indicate whether these ERSP featureswere related to the perception of the cue tempo shift itself or to theimplementation of the responsive behavioral adaptation. Accord-ingly, ERPs were computed relative to (1) the first cue tone indicatinga tempo shift (Rcue) and (2) the step (Rstep) nearest in time to theRcue. We also assessed ERPs relative to cues and steps in a controlcondition consisting of steady-state walking to an auditory cue se-quence without tempo shift (cue no shift). We computed clustermean ERPs and their 90% confidence intervals for IC processes infrontal, temporal, and central midline clusters, respectively. Next, toassess differences between cue- and step-locked ERPs, we shifted step-locked ERPs by the median latency between Rstep and Rcue, so thatlatency 0 in step-locked ERP plots corresponded to the median Rcuelatency.
On the cortical origin of ERSPs during walking. Two recent studies(Castermans et al., 2014; Kline et al., 2015) investigated movement-related artifacts in the EEG during upright walking and found con-tamination of the EEG data at frequencies from 1 to 150 Hz.Castermans et al. (2014) found similar time/frequency properties inaccelerometer signals recorded from the head during walking and inEEG for frequency bands extending up to 150 Hz. To record puremovement artifacts from EEG electrodes on the human head, Kline etal. (2015) blocked electrophysiological signals by wearing a siliconeswim cap as a nonconductive layer under a standard EEG cap. Theyobserved movement artifacts, depending on walking speed and elec-trode location, from 1 to 150 Hz. In a follow-up analysis (Snyder et al.,2015), the same authors applied ICA to this pure artifact data. Theyshowed that 99% of the obtained sources lacked dipolar characteris-tics and were located outside the head, whereas only 1% of the sourceswere localized inside the brain with residual variance �15%. Thesecomponent processes, however, had scalp maps, time courses, powerspectra, and time-frequency changes much more typical of movementartifacts rather than brain source processes. Thus, movement artifactsdo induce broadband frequency changes in signals recorded at scalpelectrodes, but these nonbrain artifacts can be reliably identified andseparated from brain source signals using ICA.
Scalp and neck muscle activities can also contaminate EEG signalsduring movement (Gramann et al., 2010; Gwin et al., 2010, 2011; Seeberet al., 2014). Scalp EMG artifacts appear across frequencies �20 Hz(Muthukumaraswamy et al., 2013; Castermans et al., 2014). By contrast,many EEG and electrocorticography studies show that electrocorticaloscillations relative to motor or cognitive processing synchronize or de-crease in narrow frequency bands, including � (7–12 Hz) and � (15–30Hz) during restricted lower limb movements (Pfurtscheller et al., 1997;Crone et al., 1998; Miller, 2007; Muller-Putz et al., 2007) and walking(Wagner et al., 2012, 2014; Severens et al., 2012; Seeber et al., 2014).Broadband high-frequency power changes (within and beyond the �band) have been suggested to play a distinct role in cortical processing(Onton and Makeig, 2009; Miller et al., 2014). Because cortical signals,
Wagner et al. • Distinct � Band Networks during Gait Adaptation J. Neurosci., February 17, 2016 • 36(7):2212–2226 • 2215
biological noise, and mechanical artifacts possess distinct properties inwaveform, frequency range, and spatial distribution, proper applicationof signal processing methods allows separation of these sources (Makeiget al., 1996; Gwin et al., 2010; Wagner et al., 2012; Seeber et al., 2014,2015; Snyder et al., 2015).
In two previous studies (Wagner et al., 2012, 2014), we showed thatconsidering carefully the location, time course, and the frequencyspectra of the single independent components separated by ICA de-composition allows identification of sources related to brain activity.For a more detailed report on the artifacts during walking, see Wagner
et al. (2012). Our previous results (Wagner et al., 2012, 2014; Seeber etal., 2014, 2015) on � band suppression and high � increases related towalking are in line with findings in the literature on the functionalrole of these rhythms in motor execution (Pfurtscheller et al., 1997;Crone et al., 1998; Miller, 2007; Muller-Putz et al., 2007). Addition-ally, the relatively slow walking speeds used in our studies have beenfound in previous studies not be heavily affected by artifacts (Gwin etal., 2010). This accumulated evidence indicates that the observedfrequency-specific power modulations in the EEG presented in ourcurrent and previous studies are of cortical origin.
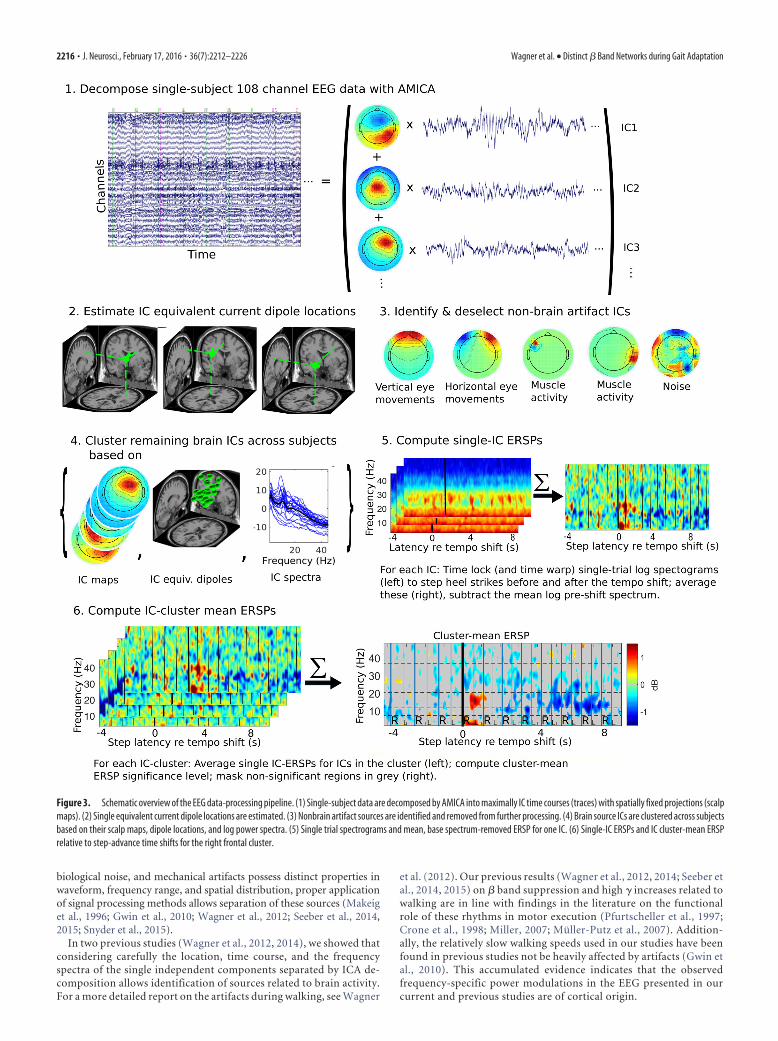
Figure 3. Schematic overview of the EEG data-processing pipeline. (1) Single-subject data are decomposed by AMICA into maximally IC time courses (traces) with spatially fixed projections (scalpmaps). (2) Single equivalent current dipole locations are estimated. (3) Nonbrain artifact sources are identified and removed from further processing. (4) Brain source ICs are clustered across subjectsbased on their scalp maps, dipole locations, and log power spectra. (5) Single trial spectrograms and mean, base spectrum-removed ERSP for one IC. (6) Single-IC ERSPs and IC cluster-mean ERSPrelative to step-advance time shifts for the right frontal cluster.
2216 • J. Neurosci., February 17, 2016 • 36(7):2212–2226 Wagner et al. • Distinct � Band Networks during Gait Adaptation
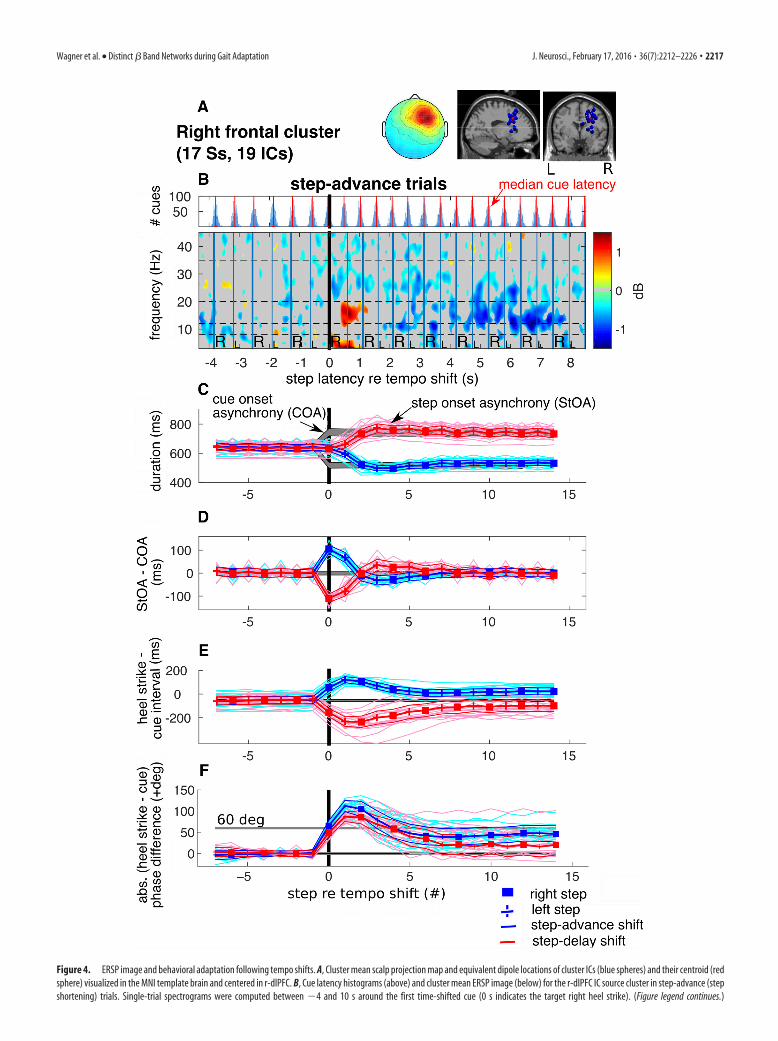
Figure 4. ERSP image and behavioral adaptation following tempo shifts. A, Cluster mean scalp projection map and equivalent dipole locations of cluster ICs (blue spheres) and their centroid (redsphere) visualized in the MNI template brain and centered in r-dlPFC. B, Cue latency histograms (above) and cluster mean ERSP image (below) for the r-dlPFC IC source cluster in step-advance (stepshortening) trials. Single-trial spectrograms were computed between �4 and 10 s around the first time-shifted cue (0 s indicates the target right heel strike). (Figure legend continues.)
Wagner et al. • Distinct � Band Networks during Gait Adaptation J. Neurosci., February 17, 2016 • 36(7):2212–2226 • 2217
ResultsBehavioral analysisThe step onset asynchrony (StOA) before tempo shifts was onaverage 641 ms (SD 5.3 ms). Following tempo shifts, a newstable StOA was generally achieved within 3 1 steps, as shownin Figure 4C. Step-delay shifts (60°) produced increases in bothStOA (754 ms, calculated for the first 15 steps following shifts;SD 14 ms) and step length, whereas step-advance shift (�60°)produced decreases in StOA (mean time between steps, 523 ms;SD 13 ms) and step length. These changes were fairly large, onaverage 18% relative to baseline, slightly larger than the expectedone-sixth (16.7%), although not significantly so.
Period correctionThe evolution of adjustments in step rate to the two new pacingtempi for all participants are depicted in Figure 4D, which alsoshows the mean difference between StOA and cue onset asyn-chrony (COA). On average, step period adaptation was achievedwithin the first two steps (between L1 and R2). During the fourfollowing steps, an overcorrection (R2) occurred, after whichparticipants stepped in near-exact synchrony to the new pacingsequence.
Phase correctionNegative StOA � COA differences indicate that, during steadystate, cue-synchronous walking step onsets slightly precededstimulus onsets. During walking at the preferred cadence (e.g.,steps �7 to �1 before the shift), we observed that heel strikeswere consistently ahead of the cues (mean difference, � 59 ms;SD 43 ms) as shown by comparing the cue latency histogramswith the median step latencies in the ERSP plot in Figure 4B andas evidenced by the negative pre-shift heel strike minus cue dif-ference in Figure 4E. This difference matches a well-known phe-nomenon called “phase lead” in finger tap synchronization
studies. It has been suggested that this difference approximatesthe difference between the times of delivery of the sensory infor-mation from the tip of the finger and the auditory informationfrom cue onset to the cortical areas in which their timing iscompared. Thus, to establish synchrony at the level of centralrepresentations, finger taps should precede the auditory signals(Aschersleben and Prinz, 1995, 1997). Adjustment of steps relativeto cues was achieved within 6 steps following tempo shifts. As shownin Figure 4E, the phase lead between steps and cues (measured fromsteps 7–15 following the shift) became larger in step-delay (steplengthening) trials (mean, �122 ms; SD 61 ms) and became pos-itive in step-advance (step shortening) trials (mean, 19 ms; SD 36ms).
Calculation of the normalized relative phase revealed differ-ences in adaptation relative to positive and negative step ratechanges, respectively. The direction of the tempo shift signifi-cantly affected synchronization accuracy (significant interaction,F(13,221) � 5.2, p � 0.00025). Post hoc tests revealed a significantlylarger initial phase deviation at steps L1 and R2 in step-advancecompared with step-delay trials. Also, as shown in Figure 4F,when participants reached stable postshift cue synchronization,asynchronies between steps and cues were significantly larger instep-advance than in step-delay trials. This suggests that partici-pants had fewer difficulties in adapting to step-delay comparedwith step-advance shifts.
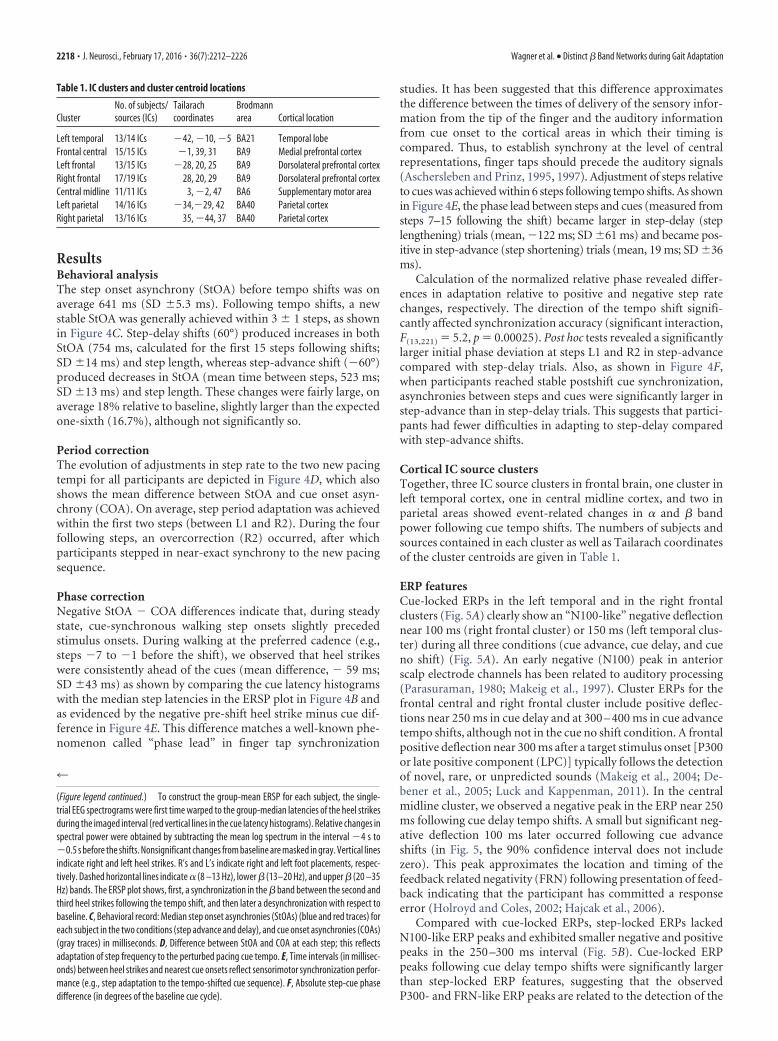
Cortical IC source clustersTogether, three IC source clusters in frontal brain, one cluster inleft temporal cortex, one in central midline cortex, and two inparietal areas showed event-related changes in � and � bandpower following cue tempo shifts. The numbers of subjects andsources contained in each cluster as well as Tailarach coordinatesof the cluster centroids are given in Table 1.
ERP featuresCue-locked ERPs in the left temporal and in the right frontalclusters (Fig. 5A) clearly show an “N100-like” negative deflectionnear 100 ms (right frontal cluster) or 150 ms (left temporal clus-ter) during all three conditions (cue advance, cue delay, and cueno shift) (Fig. 5A). An early negative (N100) peak in anteriorscalp electrode channels has been related to auditory processing(Parasuraman, 1980; Makeig et al., 1997). Cluster ERPs for thefrontal central and right frontal cluster include positive deflec-tions near 250 ms in cue delay and at 300 – 400 ms in cue advancetempo shifts, although not in the cue no shift condition. A frontalpositive deflection near 300 ms after a target stimulus onset [P300or late positive component (LPC)] typically follows the detectionof novel, rare, or unpredicted sounds (Makeig et al., 2004; De-bener et al., 2005; Luck and Kappenman, 2011). In the centralmidline cluster, we observed a negative peak in the ERP near 250ms following cue delay tempo shifts. A small but significant neg-ative deflection 100 ms later occurred following cue advanceshifts (in Fig. 5, the 90% confidence interval does not includezero). This peak approximates the location and timing of thefeedback related negativity (FRN) following presentation of feed-back indicating that the participant has committed a responseerror (Holroyd and Coles, 2002; Hajcak et al., 2006).
Compared with cue-locked ERPs, step-locked ERPs lackedN100-like ERP peaks and exhibited smaller negative and positivepeaks in the 250 –300 ms interval (Fig. 5B). Cue-locked ERPpeaks following cue delay tempo shifts were significantly largerthan step-locked ERP features, suggesting that the observedP300- and FRN-like ERP peaks are related to the detection of the
4
(Figure legend continued.) To construct the group-mean ERSP for each subject, the single-trial EEG spectrograms were first time warped to the group-median latencies of the heel strikesduring the imaged interval (red vertical lines in the cue latency histograms). Relative changes inspectral power were obtained by subtracting the mean log spectrum in the interval �4 s to�0.5 s before the shifts. Nonsignificant changes from baseline are masked in gray. Vertical linesindicate right and left heel strikes. R’s and L’s indicate right and left foot placements, respec-tively. Dashed horizontal lines indicate � (8 –13 Hz), lower � (13–20 Hz), and upper � (20 –35Hz) bands. The ERSP plot shows, first, a synchronization in the � band between the second andthird heel strikes following the tempo shift, and then later a desynchronization with respect tobaseline. C, Behavioral record: Median step onset asynchronies (StOAs) (blue and red traces) foreach subject in the two conditions (step advance and delay), and cue onset asynchronies (COAs)(gray traces) in milliseconds. D, Difference between StOA and COA at each step; this reflectsadaptation of step frequency to the perturbed pacing cue tempo. E, Time intervals (in millisec-onds) between heel strikes and nearest cue onsets reflect sensorimotor synchronization perfor-mance (e.g., step adaptation to the tempo-shifted cue sequence). F, Absolute step-cue phasedifference (in degrees of the baseline cue cycle).
Table 1. IC clusters and cluster centroid locations
ClusterNo. of subjects/sources (ICs)
Tailarachcoordinates
Brodmannarea Cortical location
Left temporal 13/14 ICs �42, �10, �5 BA21 Temporal lobeFrontal central 15/15 ICs �1, 39, 31 BA9 Medial prefrontal cortexLeft frontal 13/15 ICs �28, 20, 25 BA9 Dorsolateral prefrontal cortexRight frontal 17/19 ICs 28, 20, 29 BA9 Dorsolateral prefrontal cortexCentral midline 11/11 ICs 3, �2, 47 BA6 Supplementary motor areaLeft parietal 14/16 ICs �34,�29, 42 BA40 Parietal cortexRight parietal 13/16 ICs 35, �44, 37 BA40 Parietal cortex
2218 • J. Neurosci., February 17, 2016 • 36(7):2212–2226 Wagner et al. • Distinct � Band Networks during Gait Adaptation
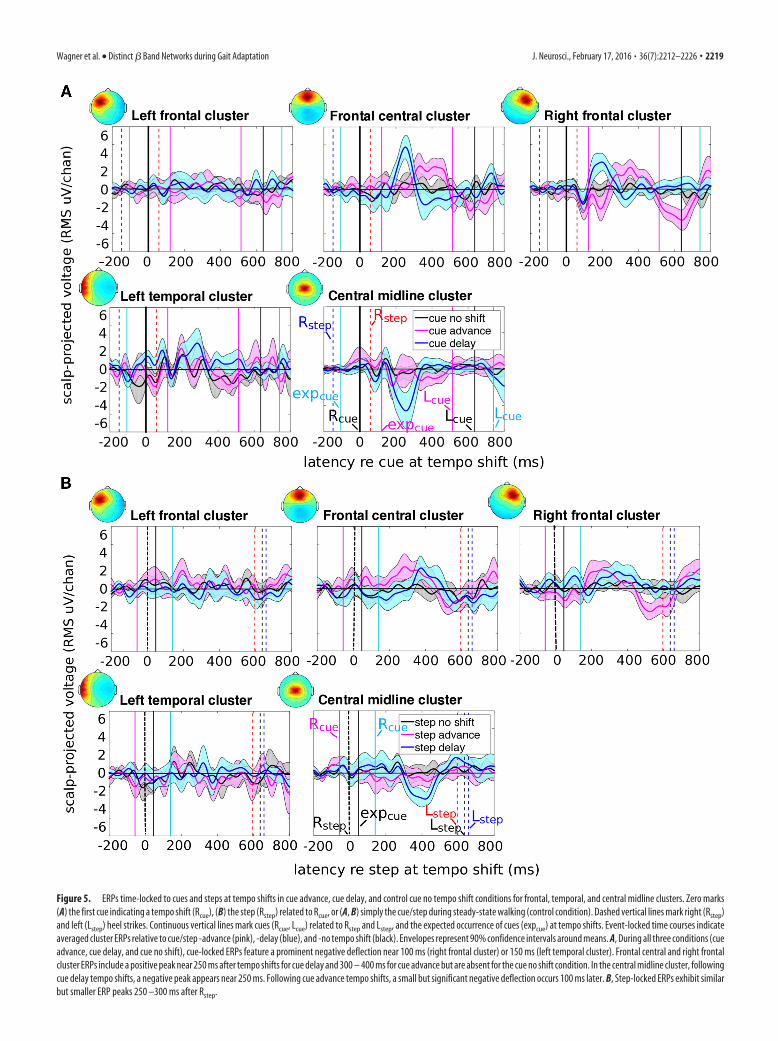
Figure 5. ERPs time-locked to cues and steps at tempo shifts in cue advance, cue delay, and control cue no tempo shift conditions for frontal, temporal, and central midline clusters. Zero marks(A) the first cue indicating a tempo shift (Rcue), (B) the step (Rstep) related to Rcue, or (A, B) simply the cue/step during steady-state walking (control condition). Dashed vertical lines mark right (Rstep)and left (Lstep) heel strikes. Continuous vertical lines mark cues (Rcue, Lcue) related to Rstep and Lstep, and the expected occurrence of cues (expcue) at tempo shifts. Event-locked time courses indicateaveraged cluster ERPs relative to cue/step -advance (pink), -delay (blue), and -no tempo shift (black). Envelopes represent 90% confidence intervals around means. A, During all three conditions (cueadvance, cue delay, and cue no shift), cue-locked ERPs feature a prominent negative deflection near 100 ms (right frontal cluster) or 150 ms (left temporal cluster). Frontal central and right frontalcluster ERPs include a positive peak near 250 ms after tempo shifts for cue delay and 300 – 400 ms for cue advance but are absent for the cue no shift condition. In the central midline cluster, followingcue delay tempo shifts, a negative peak appears near 250 ms. Following cue advance tempo shifts, a small but significant negative deflection occurs 100 ms later. B, Step-locked ERPs exhibit similarbut smaller ERP peaks 250 –300 ms after Rstep.
Wagner et al. • Distinct � Band Networks during Gait Adaptation J. Neurosci., February 17, 2016 • 36(7):2212–2226 • 2219
cue tempo shift. Following cue advance tempo shifts, significantdifferences between cue-locked and step-locked ERPs appearedonly for N100-like ERP components but not for P300- and FRN-like ERP components. One possible explanation would be that,
during cue advance tempo shifts, the premature cue tone as wellas the step about to be taken are perceived as deviant. Thus,processing of cue advance tempo shifts is possibly related to boththe steps and the cues.
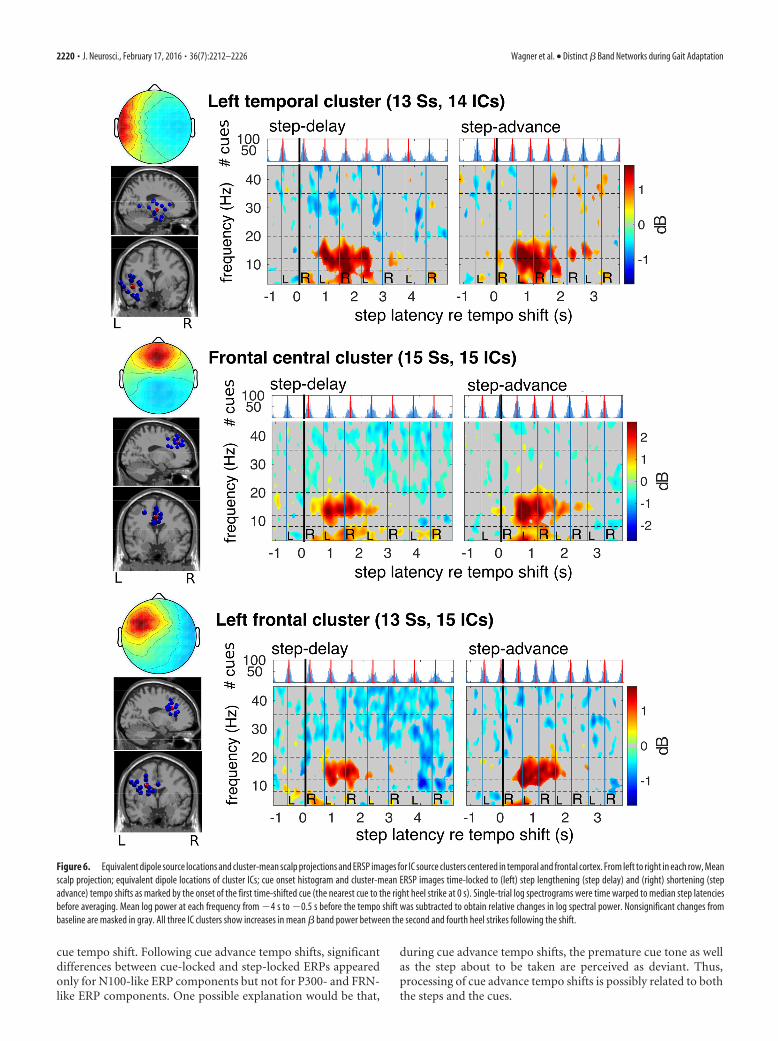
Figure 6. Equivalent dipole source locations and cluster-mean scalp projections and ERSP images for IC source clusters centered in temporal and frontal cortex. From left to right in each row, Meanscalp projection; equivalent dipole locations of cluster ICs; cue onset histogram and cluster-mean ERSP images time-locked to (left) step lengthening (step delay) and (right) shortening (stepadvance) tempo shifts as marked by the onset of the first time-shifted cue (the nearest cue to the right heel strike at 0 s). Single-trial log spectrograms were time warped to median step latenciesbefore averaging. Mean log power at each frequency from �4 s to �0.5 s before the tempo shift was subtracted to obtain relative changes in log spectral power. Nonsignificant changes frombaseline are masked in gray. All three IC clusters show increases in mean � band power between the second and fourth heel strikes following the shift.
2220 • J. Neurosci., February 17, 2016 • 36(7):2212–2226 Wagner et al. • Distinct � Band Networks during Gait Adaptation
The N100-like negative deflections in cue-locked ERPs in theleft temporal and right frontal cluster for all conditions (cue ad-vance, cue delay, and cue no shift) indicate that processing of theauditory cue events was ongoing at 100 ms after Rcue. The P300-and FRN-like ERP peaks following cue advance and cue delaytempo shifts, not present in the no shift cue condition, indicatethat participants perceived the cue tempo shifts by 250 –300 msafter Rcue onsets.
ERSPsFigure 4A, B shows cluster location and mean cluster spectralshifts time-locked to step-advance shifts for the right frontal cor-tex cluster. Comparing spectral shifts (Fig. 4B) and behavioraldata (Fig. 4C–F), a right frontal � band increase coincides withthe main adaptation period during steps 2– 4 following the shift.
While, as shown in Figures 4B, 6, and 7, during the first four stepsafter the shift frontal and temporal clusters exhibited significanttransient increases in � and/or � power (13–20 Hz in frontalclusters, 7–20 Hz in the left temporal cluster), � and � bandpower in central midline and parietal clusters decreased duringthis time period (Figs. 8, 9). Interestingly, for the left and rightparietal clusters (Fig. 9), this desynchronization lasted at least 15steps following tempo shifts and was most pronounced just be-fore contralateral heel strikes. The parietal cluster desynchroni-zation was prominent and long lasting in two frequency bands: �(7–12 Hz) and high � (18 –30 Hz).
In central medial sources (Fig. 8), however, the desynchroni-zation was not as strong but included higher frequencies (up to 35Hz) and began immediately following tempo shifts. Only theright frontal cluster showed a significant ERSP difference be-
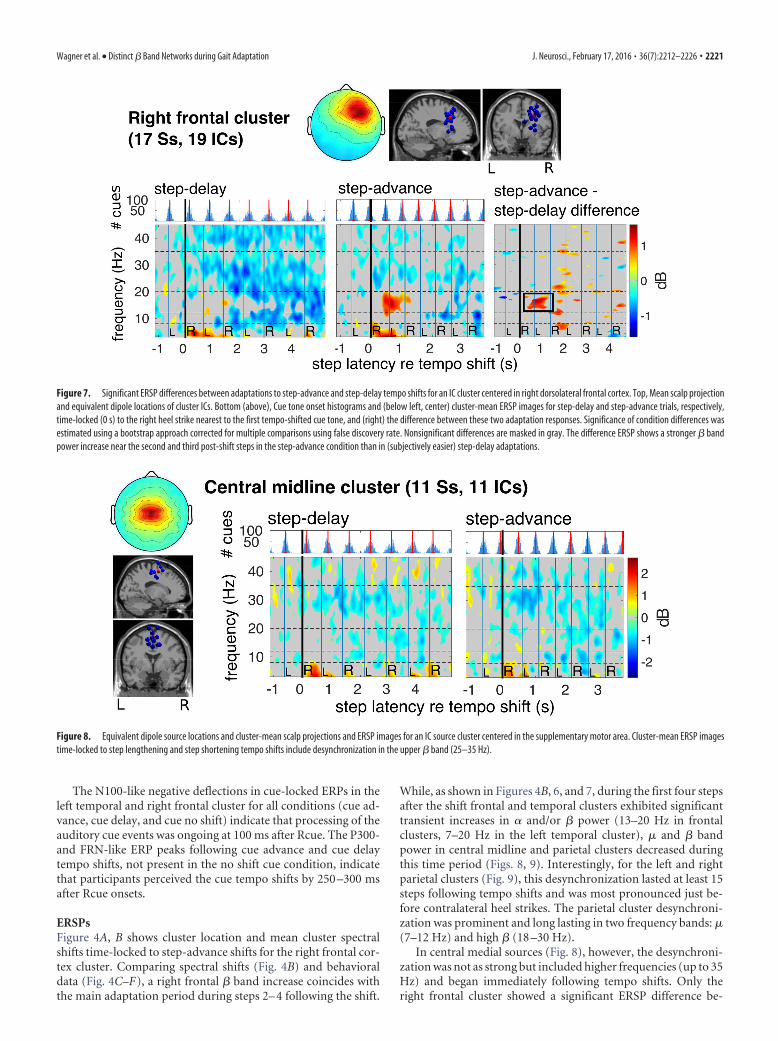
Figure 7. Significant ERSP differences between adaptations to step-advance and step-delay tempo shifts for an IC cluster centered in right dorsolateral frontal cortex. Top, Mean scalp projectionand equivalent dipole locations of cluster ICs. Bottom (above), Cue tone onset histograms and (below left, center) cluster-mean ERSP images for step-delay and step-advance trials, respectively,time-locked (0 s) to the right heel strike nearest to the first tempo-shifted cue tone, and (right) the difference between these two adaptation responses. Significance of condition differences wasestimated using a bootstrap approach corrected for multiple comparisons using false discovery rate. Nonsignificant differences are masked in gray. The difference ERSP shows a stronger � bandpower increase near the second and third post-shift steps in the step-advance condition than in (subjectively easier) step-delay adaptations.
Figure 8. Equivalent dipole source locations and cluster-mean scalp projections and ERSP images for an IC source cluster centered in the supplementary motor area. Cluster-mean ERSP imagestime-locked to step lengthening and step shortening tempo shifts include desynchronization in the upper � band (25–35 Hz).
Wagner et al. • Distinct � Band Networks during Gait Adaptation J. Neurosci., February 17, 2016 • 36(7):2212–2226 • 2221
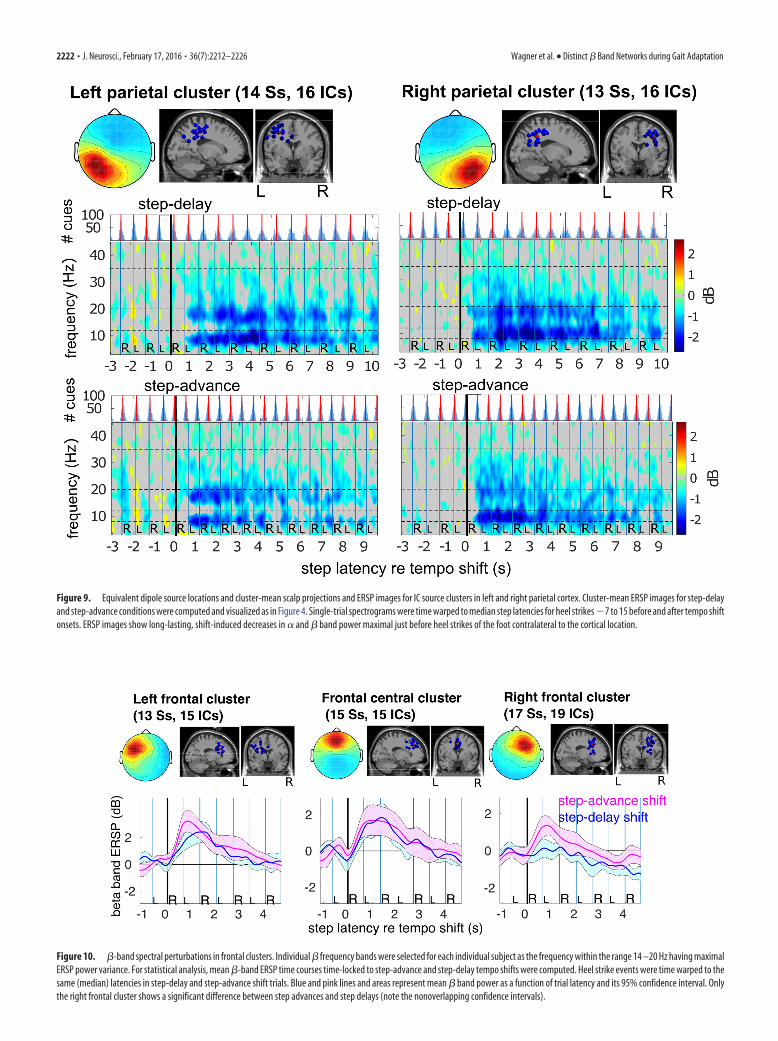
Figure 9. Equivalent dipole source locations and cluster-mean scalp projections and ERSP images for IC source clusters in left and right parietal cortex. Cluster-mean ERSP images for step-delayand step-advance conditions were computed and visualized as in Figure 4. Single-trial spectrograms were time warped to median step latencies for heel strikes �7 to 15 before and after tempo shiftonsets. ERSP images show long-lasting, shift-induced decreases in � and � band power maximal just before heel strikes of the foot contralateral to the cortical location.
Figure 10. �-band spectral perturbations in frontal clusters. Individual � frequency bands were selected for each individual subject as the frequency within the range 14 –20 Hz having maximalERSP power variance. For statistical analysis, mean �-band ERSP time courses time-locked to step-advance and step-delay tempo shifts were computed. Heel strike events were time warped to thesame (median) latencies in step-delay and step-advance shift trials. Blue and pink lines and areas represent mean � band power as a function of trial latency and its 95% confidence interval. Onlythe right frontal cluster shows a significant difference between step advances and step delays (note the nonoverlapping confidence intervals).
2222 • J. Neurosci., February 17, 2016 • 36(7):2212–2226 Wagner et al. • Distinct � Band Networks during Gait Adaptation
tween step-delay and step-advance trials; this was in the lower �band (14 –20 Hz) (F(1,18) � 9.67, p � 0.006). This significantdifference is highlighted in Figure 10, showing median � bandERSP time course and its confidence intervals in step-advanceand step-delay shift conditions for each frontal cluster. Thedifference-ERSP map for the right dorsolateral prefrontal cortex(r-dlPFC) cluster (Fig. 7) also showed a significantly larger in-crease in � band power in step-advance compared with step-delay trials during the first left and second right foot stepsfollowing tempo shifts.
DiscussionUse of a novel sensorimotor gait synchronization task, coupledwith advanced EEG source signal processing methods, revealedtwo different � band oscillatory networks involved in orchestrat-ing motor adjustments during gait adaptation. Our results com-bined � and � band power desynchronization (blocking) inmotor and parietal cortex (PPC) with a concurrent � band powerincrease in PFC. This indicates two distinct patterns of � bandactivity during gait control: (1) a motor cortical � and � banddecrease expressing motor execution and motor readiness relatedto gait movements (as in Pfurtscheller and Lopes da Silva, 1999;Neuper et al., 2006; Wagner et al., 2012, 2014; Seeber et al., 2014);and (2) a frontal � band increase related to cognitive top-downcontrol (Swann et al., 2009; as in Buschman et al., 2012).
Observed � (7–13 Hz) and � band desynchronization (13–30Hz) (Figs. 8, 9) in the motor system after a shift in tempo of thepacing cue sequence may reflect an increased disposition for mo-tor adjustments, as suggested by Engel and Fries (2010), possiblyguided by the PFC as proposed by Miller and Cohen (2001; Siegelet al., 2012). The fact that we observed temporary increase in afrontal � band oscillatory network (13–20 Hz; Figs. 6, 7, 10)during step tempo adaptation may reflect action monitoring andtop-down signaling from PFC to sensorimotor cortex. Our re-sults also show that � band power in r-dlPFC was modulated bytask difficulty. This lateralized frontal � band power increaseduring step shortening may represent neurocognitive responseinhibition processes that actively involve or are accompanied bylocally synchronous cortical � band oscillations.
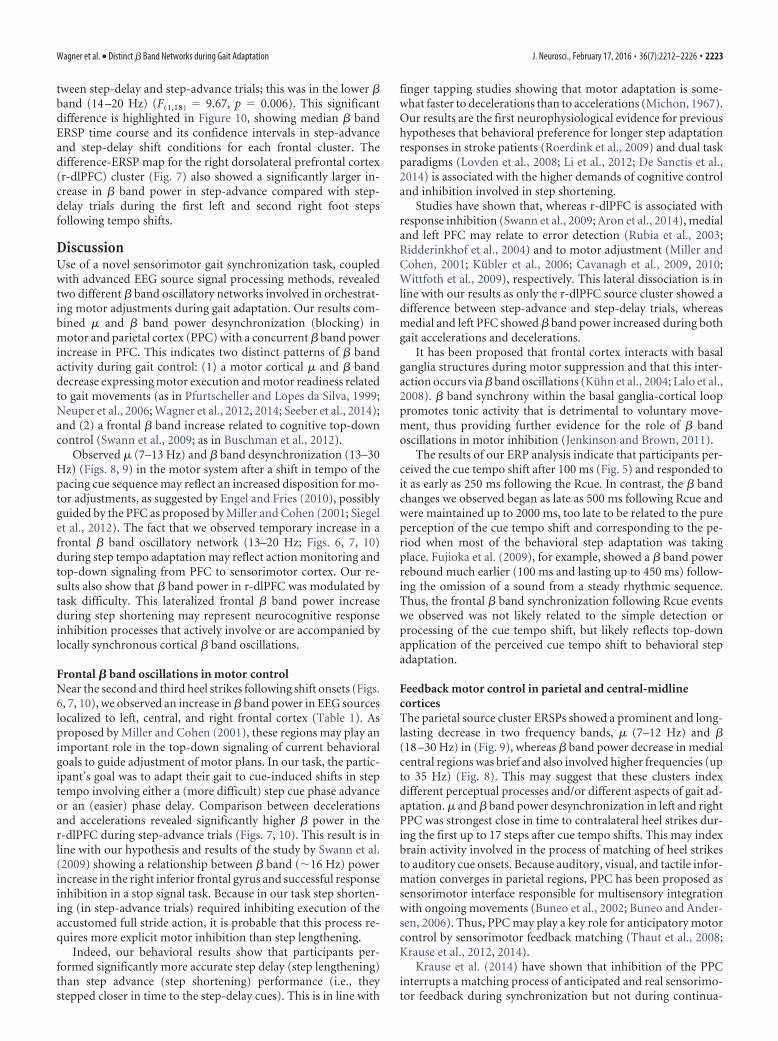
Frontal � band oscillations in motor controlNear the second and third heel strikes following shift onsets (Figs.6, 7, 10), we observed an increase in � band power in EEG sourceslocalized to left, central, and right frontal cortex (Table 1). Asproposed by Miller and Cohen (2001), these regions may play animportant role in the top-down signaling of current behavioralgoals to guide adjustment of motor plans. In our task, the partic-ipant’s goal was to adapt their gait to cue-induced shifts in steptempo involving either a (more difficult) step cue phase advanceor an (easier) phase delay. Comparison between decelerationsand accelerations revealed significantly higher � power in ther-dlPFC during step-advance trials (Figs. 7, 10). This result is inline with our hypothesis and results of the study by Swann et al.(2009) showing a relationship between � band (�16 Hz) powerincrease in the right inferior frontal gyrus and successful responseinhibition in a stop signal task. Because in our task step shorten-ing (in step-advance trials) required inhibiting execution of theaccustomed full stride action, it is probable that this process re-quires more explicit motor inhibition than step lengthening.
Indeed, our behavioral results show that participants per-formed significantly more accurate step delay (step lengthening)than step advance (step shortening) performance (i.e., theystepped closer in time to the step-delay cues). This is in line with
finger tapping studies showing that motor adaptation is some-what faster to decelerations than to accelerations (Michon, 1967).Our results are the first neurophysiological evidence for previoushypotheses that behavioral preference for longer step adaptationresponses in stroke patients (Roerdink et al., 2009) and dual taskparadigms (Lovden et al., 2008; Li et al., 2012; De Sanctis et al.,2014) is associated with the higher demands of cognitive controland inhibition involved in step shortening.
Studies have shown that, whereas r-dlPFC is associated withresponse inhibition (Swann et al., 2009; Aron et al., 2014), medialand left PFC may relate to error detection (Rubia et al., 2003;Ridderinkhof et al., 2004) and to motor adjustment (Miller andCohen, 2001; Kubler et al., 2006; Cavanagh et al., 2009, 2010;Wittfoth et al., 2009), respectively. This lateral dissociation is inline with our results as only the r-dlPFC source cluster showed adifference between step-advance and step-delay trials, whereasmedial and left PFC showed � band power increased during bothgait accelerations and decelerations.
It has been proposed that frontal cortex interacts with basalganglia structures during motor suppression and that this inter-action occurs via � band oscillations (Kuhn et al., 2004; Lalo et al.,2008). � band synchrony within the basal ganglia-cortical looppromotes tonic activity that is detrimental to voluntary move-ment, thus providing further evidence for the role of � bandoscillations in motor inhibition (Jenkinson and Brown, 2011).
The results of our ERP analysis indicate that participants per-ceived the cue tempo shift after 100 ms (Fig. 5) and responded toit as early as 250 ms following the Rcue. In contrast, the � bandchanges we observed began as late as 500 ms following Rcue andwere maintained up to 2000 ms, too late to be related to the pureperception of the cue tempo shift and corresponding to the pe-riod when most of the behavioral step adaptation was takingplace. Fujioka et al. (2009), for example, showed a � band powerrebound much earlier (100 ms and lasting up to 450 ms) follow-ing the omission of a sound from a steady rhythmic sequence.Thus, the frontal � band synchronization following Rcue eventswe observed was not likely related to the simple detection orprocessing of the cue tempo shift, but likely reflects top-downapplication of the perceived cue tempo shift to behavioral stepadaptation.
Feedback motor control in parietal and central-midlinecorticesThe parietal source cluster ERSPs showed a prominent and long-lasting decrease in two frequency bands, � (7–12 Hz) and �(18 –30 Hz) in (Fig. 9), whereas � band power decrease in medialcentral regions was brief and also involved higher frequencies (upto 35 Hz) (Fig. 8). This may suggest that these clusters indexdifferent perceptual processes and/or different aspects of gait ad-aptation. � and � band power desynchronization in left and rightPPC was strongest close in time to contralateral heel strikes dur-ing the first up to 17 steps after cue tempo shifts. This may indexbrain activity involved in the process of matching of heel strikesto auditory cue onsets. Because auditory, visual, and tactile infor-mation converges in parietal regions, PPC has been proposed assensorimotor interface responsible for multisensory integrationwith ongoing movements (Buneo et al., 2002; Buneo and Ander-sen, 2006). Thus, PPC may play a key role for anticipatory motorcontrol by sensorimotor feedback matching (Thaut et al., 2008;Krause et al., 2012, 2014).
Krause et al. (2014) have shown that inhibition of the PPCinterrupts a matching process of anticipated and real sensorimo-tor feedback during synchronization but not during continua-
Wagner et al. • Distinct � Band Networks during Gait Adaptation J. Neurosci., February 17, 2016 • 36(7):2212–2226 • 2223
tion tapping. In a previous study, we showed a decrease in � and� band power in PPC during visually guided gait adaptation in avirtual environment, suggesting that the PPC is involved inmatching steps to visual input (Wagner et al., 2014). Taking intoaccount our current results, the known role of the PPC in map-ping visual representations with motor output in space (Buneoand Andersen, 2006) may extend to matching times of occur-rence of (expected) auditory and motor events.
Participants performed most adaptation within the first threesteps following cue tempo shifts, including a rapid adaptation ofstep period and beginning a gradual reduction in the phase dif-ference between steps and cues. Finger tapping studies have alsoshown that a small sudden tempo change in the pacing sequencetends to be followed by rapid adaptation of the tapping periodaccompanied by slow adaptation of tapping phase (Thaut et al.,1998). Thus, the transient frontal � band power increase we ob-serve may index step period adaptation, whereas the longer-lasting parietal � and � band decreases may relate to step phasecorrection.
� band oscillations in temporal predictionInterestingly, � band activity in both sensory and motor systemsseems to reflect anticipatory processes. In the motor system, anupcoming action is reflected in decreased motor cortical � bandactivity that may begin several seconds before execution (Donneret al., 2009), and � band corticospinal coherence increases withdecreasing likelihood of an upcoming action (Schoffelen et al.,2005). In auditory cortex, violation of top-down expectation(e.g., the omission of a sound from a regular beat sequence)induces a � band power increase (Fujioka et al., 2009) that mayrepresent an expectation mismatch response.
Similar to these findings, our results also revealed an � andlower � band power (7–20 Hz) increase in a temporal cortexsource cluster following tempo shifts (Fig. 6). Synchronization-continuation tapping studies indicate that � band power is linkedto the development of subjective time and to the guidance ofinternally driven motor sequences (Bartolo et al., 2014; Bartoloand Merchant, 2015). Precise sensorimotor timing and anticipa-tion of subsequent events are essential to quick adjustment ofmovements with respect to external changes. Thus, the � bandactivity we observed could point to wider roles of � band oscilla-tions in the updating of internal representations for upcomingactions and events (Engel and Fries, 2010; Arnal and Giraud,2012) to prepare corrective motor adjustments.
Summary and future directionsIn conclusion, our results show two distinct patterns of � bandoscillatory activity changes following step pacing cue tempo per-turbations and suggest that these accompany or subserve motorand cognitive control processes, respectively. To our knowledge,this is the first study to show neural correlates of these two dis-tinct mechanisms acting concurrently in the service of gait adap-tation. The size of the � band power increase in or near r-dlPFCwas modulated according to adaptation difficulty, possibly re-flecting engagement of additional movement control resourcesand providing the first evidence that gait adaptation strategiesinvolving step shortening require more cortical inhibition/con-trol compared with step lengthening. Taking into account ourresults, deficits in gait adaptation are most probably due to animpairment of prefrontal control guiding motor inhibition. Thisidea has been previously tested in two TMS studies (del Olmo etal., 2007; Lee et al., 2014). Authors stimulated r-dlPFC usingrepetitive TMS at 10 Hz (no other frequencies were tested). Both
studies showed improvement in the temporal regularity and paceof gait and tapping, but not of Parkinson symptoms. Our results(along with those of Swann et al., 2009) suggest that stimulationat a higher frequency (16 –17 Hz) might prove more effective.Such interventions might be used for voluntary motor suppres-sion training with real-time feedback of motor cortical � oscilla-tions and motor-evoked potentials (as proposed by Majid et al.,2015).
ReferencesAndroulidakis AG, Doyle LM, Yarrow K, Litvak V, Gilbertson TP, Brown P
(2007) Anticipatory changes in beta synchrony in the human corticospi-nal system and associated improvements in task performance. Eur J Neu-rosci 25:3758 –3765. CrossRef Medline
Arnal LH, Giraud AL (2012) Cortical oscillations and sensory predictions.Trends Cogn Sci 16:390 –398. CrossRef Medline
Aron AR, Robbins TW, Poldrack RA (2014) Inhibition and the right infe-rior frontal cortex: one decade on. Trends Cogn Sci 18:177–185. CrossRefMedline
Aschersleben G, Prinz W (1995) Synchronizing actions with events: the roleof sensory information. Percept Psychophys 57:305–317. CrossRefMedline
Aschersleben G, Prinz W (1997) Delayed auditory feedback in synchroniza-tion. J Mot Behav 29:35– 46. CrossRef Medline
Bank PJ, Roerdink M, Peper CE (2011) Comparing the efficacy of metro-nome beeps and stepping stones to adjust gait: steps to follow! Exp BrainRes 209:159 –169. CrossRef Medline
Bartolo R, Prado L, Merchant H (2014) Information processing in the pri-mate basal ganglia during sensory-guided and internally driven rhythmictapping. J Neurosci 34:3910 –3923. CrossRef Medline
Bartolo R, Merchant H (2015) � oscillations are linked to the initiation ofsensory-cued movement sequences and the internal guidance of regulartapping in the monkey. J Neurosci 35:4635– 4640. CrossRef Medline
Bell AJ, Sejnowski TJ (1995) An information-maximization approach toblind separation and blind deconvolution. Neural Comput 7:1129 –1159.CrossRef Medline
Benjamini Y, Yekutieli D (2001) The control of the false discovery rate inmultiple testing under dependency. Ann Stat 29:1165–1188. CrossRef
Buneo CA, Jarvis MR, Batista AP, Andersen RA (2002) Direct visuomotortransformations for reaching. Nature 416:632– 636. CrossRef Medline
Buneo CA, Andersen RA (2006) The posterior parietal cortex: sensorimotorinterface for the planning and online control of visually guided move-ments. Neuropsychologia 44:2594 –2606. CrossRef Medline
Buschman TJ, Miller EK (2007) Top-down versus bottom-up control ofattention in the prefrontal and posterior parietal cortices. Science 315:1860 –1862. CrossRef Medline
Buschman TJ, Denovellis EL, Diogo C, Bullock D, Miller EK (2012) Syn-chronous oscillatory neural ensembles for rules in the prefrontal cortex.Neuron 76:838 – 846. CrossRef Medline
Castermans T, Duvinage M, Cheron G, Dutoit T (2014) About the corticalorigin of the low-delta and high-gamma rhythms observed in EEG signalsduring treadmill walking. Neurosci Lett 561:166 –170. CrossRef Medline
Cavanagh JF, Cohen MX, Allen JJ (2009) Prelude to and resolution of anerror: EEG phase synchrony reveals cognitive control dynamics duringaction monitoring. J Neurosci 29:98 –105. CrossRef Medline
Cavanagh JF, Frank MJ, Klein TJ, Allen JJ (2010) Frontal theta links predic-tion errors to behavioral adaptation in reinforcement learning. Neuroim-age 49:3198 –3209. CrossRef Medline
Cheron G, Duvinage M, De Saedeleer C, Castermans T, Bengoetxea A,Petieau M, Seetharaman K, Hoellinger T, Dan B, Dutoit T, Sylos Labini F,Lacquaniti F, Ivanenko Y (2012) From spinal central pattern generatorsto cortical network: integrated BCI for walking rehabilitation. NeuralPlast 2012:375148. CrossRef Medline
Crone NE, Miglioretti DL, Gordon B, Sieracki JM, Wilson MT, Uematsu S,Lesser RP (1998) Functional mapping of human sensorimotor cortexwith electro-corticographic spectral analysis. Brain 121:2271–2299.CrossRef Medline
Debener S, Makeig S, Delorme A, Engel AK (2005) What is novel in thenovelty oddball paradigm? Functional significance of the novelty P3event-related potential as revealed by independent component analysis.Cogn Brain Res 22:309 –321. CrossRef Medline
2224 • J. Neurosci., February 17, 2016 • 36(7):2212–2226 Wagner et al. • Distinct � Band Networks during Gait Adaptation
del Olmo MF, Bello O, Cudeiro J (2007) Transcranial magnetic stimulationover dorsolateral prefrontal cortex in Parkinson’s disease. Clin Neuro-physiol 118:131–139. CrossRef Medline
Delorme A, Makeig S (2004) EEGLAB: an open source toolbox for analysisof single-trial EEG dynamics including independent component analysis.J Neurosci Methods 134:9 –21. CrossRef Medline
Delorme A, Palmer J, Onton J, Oostenveld R, Makeig S (2012) IndependentEEG sources are dipolar. PLoS One 7:e30135. CrossRef Medline
Den Otter AR, Geurts AC, de Haart M, Mulder T, Duysens J (2005) Stepcharacteristics during obstacle avoidance in hemiplegic stroke. Exp BrainRes 161:180 –192. CrossRef Medline
De Sanctis P, Butler JS, Malcolm BR, Foxe JJ (2014) Recalibration of inhib-itory control systems during walking-related dual-task interference: amobile brain-body imaging (MOBI) study. Neuroimage 94:55– 64.CrossRef Medline
Donner TH, Siegel M, Fries P, Engel AK (2009) Build-up of choice predic-tive activity in human motor cortex during perceptual decision making.Curr Biol 19:1581–1585. CrossRef Medline
Engel AK, Fries P (2010) Beta-band oscillations: signaling the status quo?Curr Opin Neurobiol 20:156 –165. CrossRef Medline
Fujioka T, Trainor LJ, Large EW, Ross B (2009) Beta and gamma rhythms inhuman auditory cortex during musical beat processing. Ann N Y Acad Sci1169:89 –92. CrossRef Medline
Geerligs L, Saliasi E, Maurits NM, Lorist MM (2012) Compensationthrough increased functional connectivity: neural correlates of inhibitionin old and young. J Cogn Neurosci 24:2057–2069. CrossRef Medline
Gilbertson T, Lalo E, Doyle L, Di Lazzaro V, Cioni B, Brown P (2005) Ex-isting motor state is favored at the expense of new movement during13–35 Hz oscillatory synchrony in the human corticospinal system.J Neurosci 25:7771–7779. CrossRef Medline
Gola M, Kaminski J, Brzezicka A, Wrobel A (2012) Beta band oscillations asa correlate of alertness: changes in aging. Int J Psychophysiol 85:62– 67.CrossRef Medline
Gola M, Magnuski M, Szumska I, Wrobel A (2013) EEG beta band activity isrelated to attention and attentional deficits in the visual performance ofelderly subjects. Int J Psychophysiol 89:334 –341. CrossRef Medline
Gramann K, Gwin JT, Bigdely-Shamlo N, Ferris DP, Makeig S (2010) Visualevoked responses during standing and walking. Front Hum Neurosci4:202. CrossRef Medline
Gwin JT, Gramann K, Makeig S, Ferris DP (2010) Removal of movementartifact from high-density EEG recorded during walking and running.J Neurophysiol 103:3526 –3534. CrossRef Medline
Gwin JT, Gramann K, Makeig S, Ferris DP (2011) Electrocortical activity iscoupled to gait cycle phase during treadmill walking. Neuroimage 54:1289 –1296. CrossRef Medline
Haefeli J, Vogeli S, Michel J, Dietz V (2011) Preparation and performance ofobstacle steps: interaction between brain and spinal neuronal activity. EurJ Neurosci 33:338 –348. CrossRef Medline
Hajcak G, Moser JS, Holroyd CB, Simons RF (2006) The feedback-relatednegativity reflects the binary evaluation of good versus bad outcomes. BiolPsychol 71:148 –154. CrossRef Medline
Hofstad CJ, van der Linde H, Nienhuis B, Weerdesteyn V, Duysens J, GeurtsAC (2006) High failure rates when avoiding obstacles during treadmillwalking in patients with a transtibial amputation. Arch Phys Med Rehabil87:1115–1122. CrossRef Medline
Holroyd CB, Coles MG (2002) The neural basis of human error processing:reinforcement learning, dopamine, and the error-related negativity. Psy-chol Rev 109:679 –709. CrossRef Medline
Jasper H, Penfield W (1949) Electrocorticograms in man: effect of voluntarymovement upon the electrical activity of the precentral gyrus. Arch Psy-chiatr Nervenkrankheiten 183:163–174. CrossRef
Jenkinson N, Brown P (2011) New insights into the relationship betweendopamine, beta oscillations and motor function. Trends Neurosci 34:611– 618. CrossRef Medline
Joundi RA, Jenkinson N, Brittain JS, Aziz TZ, Brown P (2012) Driving os-cillatory activity in the human cortex enhances motor performance. CurrBiol 22:403– 407. CrossRef Medline
Kline JE, Huang HJ, Snyder KL, Ferris DP (2015) Isolating gait-relatedmovement artifacts in electroencephalography during human walking.J Neural Eng 12:46022. CrossRef Medline
Koenraadt KL, Roelofsen EG, Duysens J, Keijsers NL (2014) Cortical con-
trol of normal gait and precision stepping: an fNIRS study. Neuroimage85:415– 422. CrossRef Medline
Krause V, Bashir S, Pollok B, Caipa A, Schnitzler A, Pascual-Leone A (2012)1 Hz rTMS of the left posterior parietal cortex (PPC) modifies sensori-motor timing. Neuropsychologia 50:3729 –3735. CrossRef Medline
Krause V, Weber J, Pollok B (2014) The posterior parietal cortex (PPC)mediates anticipatory motor control. Brain Stimul 7:800 – 806. CrossRefMedline
Kubler A, Dixon V, Garavan H (2006) Automaticity and reestablishment ofexecutive control: an fMRI study. J Cogn Neurosci 18:1331–1342.CrossRef Medline
Kuhn AA, Williams D, Kupsch A, Limousin P, Hariz M, Schneider GH,Yarrow K, Brown P (2004) Event-related beta desynchronization in hu-man subthalamic nucleus correlates with motor performance. Brain 127:735–746. CrossRef Medline
Lalo E, Thobois S, Sharott A, Polo G, Mertens P, Pogosyan A, Brown P (2008)Patterns of bidirectional communication between cortex and basal gan-glia during movement in patients with Parkinson disease. J Neurosci 28:3008 –3016. CrossRef Medline
Lee TW, Lewicki MS, Girolami M, Sejnowski TJ (1999) Blindsource separa-tion of more sources than mixtures using overcomplete representations.IEEE Signal Processing Lett 6:87–90. CrossRef
Lee SY, Kim MS, Chang WH, Cho JW, Youn JY, Kim YH (2014) Effects ofrepetitive transcranial magnetic stimulation on freezing of gait in patientswith Parkinsonism. Restor Neurol Neurosci 32:743–753. CrossRefMedline
Lewicki MS, Sejnowski TJ (2000) Learning overcomplete representations.Neural Comput 12:337–365. CrossRef Medline
Li KZ, Abbud GA, Fraser SA, DeMont RG (2012) Successful adaptation ofgait in healthy older adults during dual-task treadmill walking. AgingNeuropsychol Cogn 19:150 –167. CrossRef Medline
Lovden M, Schaefer S, Pohlmeyer AE, Lindenberger U (2008) Walking vari-ability and working-memory load in aging: a dual-process account relat-ing cognitive control to motor control performance. J Gerontol B PsycholSci Soc Sci 63:P121–P128. CrossRef Medline
Luck SJ, Kappenman ES (eds) (2011) The Oxford handbook of event-related potential components. Oxford: Oxford UP.
Majid DS, Lewis C, Aron AR (2015) Training voluntary motor suppressionwith real-time feedback of motor evoked potentials. J Neurophysiol 113:3446 –3452. CrossRef Medline
Makeig S (1993) Auditory event-related dynamics of the EEG spectrum andeffects of exposure to tones. Electroencephalogr Clin Neurophysiol 86:283–293. CrossRef Medline
Makeig S, Bell AJ, Jung TP, Sejnowski TJ (1996) Independent componentanalysis of electroencephalographic data. In: Advances in neural informa-tion processing systems (Touretzky D, Mozer M, Hasselmo M, eds), pp145–151. Cambridge, MA: Massachusetts Institute of Technology.
Makeig S, Jung TP, Bell AJ, Ghahremani D, Sejnowski TJ (1997) Blind sep-aration of auditory event-related brain responses into independent com-ponents. Proc Natl Acad Sci U S A 94:10979 –10984. CrossRef Medline
Makeig S, Westerfield M, Jung TP, Enghoff S, Townsend J, Courchesne E,Sejnowski TJ (2002) Dynamic brain sources of visual evoked responses.Science 295:690 – 694. CrossRef Medline
Makeig S, Debener S, Onton J, Delorme A (2004) Mining event-relatedbrain dynamics. Trends Cogn Sci 8:204 –210. CrossRef Medline
Makeig S, Gramann K, Jung TP, Sejnowski TJ, Poizner H (2009) Linkingbrain, mind and behavior. Int J Psychophysiol 73:95–100. CrossRefMedline
Michon JA (1967) Timing in temporal tracking. Soesterberg, The Nether-lands: Institute for Perception RVO-TNO.
Miller KJ, Honey CJ, Hermes D, Rao RP, denNijs M,Ojemann JG (2014)Broadband changes in the cortical surface potential track activation offunctionally diverse neuronal populations. Neuroimage 85:711–720.CrossRef Medline
Miller R (2007) Theory of the normal waking EEG: from single neurons towaveforms in the alpha, beta and gamma frequency ranges. Int J Psycho-physiol 64:18 –23. CrossRef Medline
Miller EK, Cohen JD (2001) An integrative theory of prefrontal cortex func-tion. Annu Rev Neurosci 24:167–202. CrossRef Medline
Muller-Putz GR, Zimmermann D, Graimann B, Nestinger K, Korisek G,Pfurtscheller G (2007) Event-related beta EEG-changes during passive
Wagner et al. • Distinct � Band Networks during Gait Adaptation J. Neurosci., February 17, 2016 • 36(7):2212–2226 • 2225
and attempted foot movements in paraplegic patients. Brain Res 1137:84 –91. CrossRef Medline
Muthukumaraswamy SD (2013) High-frequency brain activity and muscleartifacts in MEG/EEG: a review and recommendations. Front Hum Neu-rosci 7:138. CrossRef Medline
Neuper C, Wortz M, Pfurtscheller G (2006) ERD/ERS patterns reflectingsensorimotor activation and deactivation. Prog Brain Res 159:211–222.CrossRef Medline
Onton J, Delorme A, Makeig S (2005) Early visual event-related potentialactivity in extra-striate cortex. Society for Psychophysiological Research,Lisbon, Sept. 22–25, 2005.
Onton J, Westerfield M, Townsend J, Makeig S (2006) Imaging human EEGdynamics using independent component analysis. Neurosci BiobehavRev 30:808 – 822. CrossRef Medline
Onton J, Makeig S (2009) High-frequency broadband modulations of elec-troencephalographic spectra. Front Hum Neurosci 3:61. CrossRefMedline
Oostenveld R, Oostendorp TF (2002) Validating the boundary elementmethod for forward and inverse EEG computations in the presence of ahole in the skull. Hum Brain Mapp 17:179 –192. CrossRef Medline
Palmer JA, Kreutz-Delgado K, Makeig S (2006) Super-Gaussian mixturesource model for ICA. In: Lecture notes in computer science (Rosca J,Erdogmus D, Príncipe JC, Haykin S, eds), pp 854 – 861. Berlin: Springer.
Palmer JA, Makeig S, Kreutz-Delgado K, Rao BD (2008) Newton methodfor the ICA mixture model. In: IEEE International Conference on Acous-tics and Signal Processing, Las Vegas, pp 1805–1808.
Parasuraman R (1980) Effects of information processing demands on slownegative shift latencies and N100 amplitude in selective and divided at-tention. Biol Psychol 11:217–233. CrossRef Medline
Pelton TA, Johannsen L, Huiya C, Wing AM (2010) Hemiparetic steppingto the beat: asymmetric response to metronome phase shift during tread-mill gait. Neurorehabil Neural Repair 24:428 – 434. CrossRef Medline
Peters M, Durding BM (1979) Footedness of left-and right-handers. Am JPsychol 133–142.
Pfurtscheller G, Berghold A (1989) Patterns of cortical activation duringplanning of voluntary movement. Electroencephalogr Clin Neurophysiol72:250 –258. CrossRef Medline
Pfurtscheller G, Lopes da Silva FL (1999) Event-related EEG/MEG synchro-nization and desynchronization: basic principles. Clin Neurophysiol 110:1842–1857. CrossRef Medline
Pfurtscheller G, Neuper C, Andrew C, Edlinger G (1997) Foot and hand areamu rhythms. Int J Psychophysiol 26:121–135. CrossRef Medline
Pogosyan A, Gaynor LD, Eusebio A, Brown P (2009) Boosting cortical ac-tivity at beta-band frequencies slows movement in humans. Curr Biol19:1637–1641. CrossRef Medline
Repp BH (2001a) Phase correction, phase resetting, and phase shifts aftersubliminal timing perturbations in sensorimotor synchronization. J ExpPsychol 27:600. CrossRef Medline
Repp BH (2001b) Processes underlying adaptation to tempo changes in sen-sorimotor synchronization. Hum Mov Sci 20:277–312. CrossRef Medline
Repp BH (2005) Sensorimotor synchronization: a review of the tapping lit-erature. Psychonom Bull Rev 12:969 –992. CrossRef Medline
Repp BH, Su YH (2013) Sensorimotor synchronization: a review of recentresearch (2006 –2012). Psychonom Bull Rev 20:403– 452. CrossRefMedline
Ridderinkhof KR, Ullsperger M, Crone EA, Nieuwenhuis S (2004) The roleof the medial frontal cortex in cognitive control. Science 306:443– 447.CrossRef Medline
Roerdink M, Lamoth CJ, Kwakkel G, van Wieringen PC, Beek PJ (2007)Gait coordination after stroke: benefits of acoustically paced treadmillwalking. Phys Ther 87:1009 –1022. CrossRef Medline
Roerdink M, Lamoth CJ, van Kordelaar J, Elich P, Konijnenbelt M, KwakkelG, Beek PJ (2009) Rhythm perturbations in acoustically paced treadmill
walking after stroke. Neurorehabil Neural Repair 23:668 – 678. CrossRefMedline
Rubia K, Smith AB, Brammer MJ, Taylor E (2003) Right inferior prefrontalcortex mediates response inhibition while mesial prefrontal cortex is re-sponsible for error detection. Neuroimage 20:351–358. CrossRef Medline
Schoffelen JM, Oostenveld R, Fries P (2005) Neuronal coherence as a mech-anism of effective corticospinal interaction. Science 308:111–113.CrossRef Medline
Seeber M, Scherer R, Wagner J, Solis-Escalante T, Muller-Putz GR (2014)EEG beta suppression and low gamma modulation are different elementsof human upright walking. Front Hum Neurosci 8:485. CrossRef Medline
Seeber M, Scherer R, Wagner J, Solis-Escalante T, Muller-Putz GR (2015)High and low gamma EEG oscillations in central sensorimotor areas areconversely modulated during the human gait cycle. Neuroimage 112:318 –326. CrossRef Medline
Severens M, Nienhuis B, Desain P, Duysens J (2012) Feasibility of measur-ing event related desynchronization with electroencephalography duringwalking. In: IEEE International Conference of Engineering in Medicineand Biology Society, pp 2764 –2767. San Diego, CA.
Siegel M, Donner TH, Engel AK (2012) Spectral fingerprints of large-scaleneuronal interactions. Nat Rev Neurosci 13:121–134. CrossRef Medline
Snyder KL, Kline JE, Huang HJ, Ferris DP (2015) Independent componentanalysis of gait-related movement artifact recorded using EEG electrodesduring treadmill walking. Front Hum Neurosci 9:639. CrossRef Medline
Solis-Escalante T, Muller-Putz GR, Pfurtscheller G, Neuper C (2012) Cue-induced beta rebound during withholding of overt and covert foot move-ment. Clin Neurophysiol 123:1182–1190. CrossRef Medline
Suzuki M, Miyai I, Ono T, Oda I, Konishi I, Kochiyama T, Kubota K (2004)Prefrontal and premotor cortices are involved in adapting walking andrunning speed on the treadmill: an optical imaging study. Neuroimage23:1020 –1026. CrossRef Medline
Swann N, Tandon N, Canolty R, Ellmore TM, McEvoy LK, Dreyer S, DiSanoM, Aron AR (2009) Intracranial EEG reveals a time-and frequency-specific role for the right inferior frontal gyrus and primary motor cortexin stopping initiated responses. J Neurosci 29:12675–12685. CrossRefMedline
Thaut MH, Miller RA, Schauer LM (1998) Multiple synchronization strat-egies in rhythmic sensorimotor tasks: phase vs period correction. BiolCybern 79:241–250. CrossRef Medline
Thaut MH, Demartin M, Sanes JN (2008) Brain networks for integrativerhythm formation. PLoS One 3:e2312. CrossRef Medline
Thaut MH, Abiru M (2010) Rhythmic auditory stimulation in rehabilita-tion of movement disorders: a review of current research. Music Percept27:263–269. CrossRef
Varraine E, Bonnard M, Pailhous J (2000) Intentional on-line adaptation ofstride length in human walking. Exp Brain Res 130:248 –257. CrossRefMedline
Wagner J, Solis-Escalante T, Grieshofer P, Neuper C, Muller-Putz G, SchererR (2012) Level of participation in robotic-assisted treadmill walkingmodulates midline sensorimotor EEG rhythms in able-bodied subjects.Neuroimage 63:1203–1211. CrossRef Medline
Wagner J, Solis-Escalante T, Scherer R, Neuper C, Muller-Putz G (2014) It’show you get there: walking down a virtual alley activates premotor andparietal areas. Front Hum Neurosci 8:93. CrossRef Medline
Weerdesteyn V, Rijken H, Geurts AC, Smits-Engelsman BC, Mulder T,Duysens J (2006) A five-week exercise program can reduce falls and im-prove obstacle avoidance in the elderly. Gerontology 52:131–141.CrossRef Medline
Wittfoth M, Schardt DM, Fahle M, Herrmann M (2009) How the brainresolves high conflict situations: double conflict involvement of dorsolat-eral prefrontal cortex. Neuroimage 44:1201–1209. CrossRef Medline
Zhang Y, Chen Y, Bressler SL, Ding M (2008) Response preparation andinhibition: the role of the cortical sensorimotor beta rhythm. Neurosci-ence 156:238 –246. CrossRef Medline
2226 • J. Neurosci., February 17, 2016 • 36(7):2212–2226 Wagner et al. • Distinct � Band Networks during Gait Adaptation
![RUKOVODI RADI NA - vps.ns.ac.rs · AVG([DISTINCT|ALL]n) COUNT({*|[DISTINCT|ALL] izraz }) MAX( izraz ) MIN(izraz ) SUM([DISTINCT|ALL] izraz ) (| - oznacava da se moze koristiti samo](https://img.pdfslide.net/doc/110x75/5f98e6a6165fd96be31984b9/rukovodi-radi-na-vpsnsacrs-avgdistinctalln-countdistinctall-izraz.jpg)