Embed Size (px)
Citation preview
Distribution and Habitat Associations of Radio-Tagged AdultLost River Suckers and Shortnose Suckers in
Upper Klamath Lake, Oregon
NOLAN P. BANISH,*1 BARBARA J. ADAMS,2 AND RIP S. SHIVELY3
U.S. Geological Survey, 2795 Anderson Avenue, Suite 106, Klamath Falls, Oregon 97603, USA
MICHAEL M. MAZUR4
School of Aquatic and Fishery Sciences, University of Washington, Box 355020,Seattle, Washington 98195, USA
DAVID A. BEAUCHAMP
U.S. Geological Survey, Washington Cooperative Fish and Wildlife Research Unit,5 School of Aquatic andFishery Sciences, University of Washington, Box 355020, Seattle, Washington 98195, USA
TAMARA M. WOOD
U.S. Geological Survey, Oregon Water Science Center, 2130 SW 5th Avenue, Portland, Oregon 97201, USA
Abstract.—Radiotelemetry was used to investigate the summer distribution and diel habitat associations ofendangered adult Lost River suckers Deltistes luxatus and shortnose suckers Chasmistes brevirostris innorthern Upper Klamath Lake, Oregon. From 2002 to 2004, Lost River and shortnose suckers were tracked byboat, and water depth and water quality were measured at each fish location. A series of water qualitymonitors were deployed in northern Upper Klamath Lake to provide temporal information on ambienttemperature, pH, and dissolved oxygen, and water samples were collected to assess chlorophyll aconcentration. Suckers moved into northern Upper Klamath Lake during June and began to leave in lateSeptember each year. Kernel density estimates revealed differences in the distribution in the northern portionof Upper Klamath Lake in 2002 and 2004. In 2003, however, both Lost River and shortnose suckers werecommonly located within and offshore from Pelican Bay, a shallow (1.0–2.0 m), groundwater-influenced areaof Upper Klamath Lake. This was especially obvious beginning in late July of 2003, concurrent with reduceddissolved oxygen levels (,4.0 mg/L) in the northern portion of Upper Klamath Lake that resulted from a die-off of the cyanobacterium Aphanizomenon flos-aquae. Both Lost River and shortnose suckers were generallyassociated with water depths greater than the mean depth (2.8 m) of northern Upper Klamath Lake. Evidenceratios did not suggest diel differences in depth, temperature, dissolved oxygen, or pH at sucker locations. BothLost River and shortnose suckers generally occupied depths greater than 2.0 m, except when suckers soughtrefuge in Pelican Bay during periods of poor water quality. Despite the potential for increased avian predation,suckers appeared to benefit from moving into Pelican Bay rather than staying in areas where dissolved oxygenwas low. Pelican Bay appears to be an important refugium and thus may be important for sucker conservation.
Lost River suckers Deltistes luxatus and shortnose
suckers Chasmistes brevirostris are presumably de-
clining throughout their range. Both species are
endemic to the upper Klamath River basin of California
and Oregon (Moyle 2002). Previous records indicate
that suckers were once widespread in the upper
Klamath River basin and were important to subsis-
tence, commercial, and recreational fishers (USFWS
1993; Moyle 2002). Lost River and shortnose suckers
have been extirpated from portions of their historic
range (Moyle 2002), and previous efforts to monitor
angler catch rates have indicated extreme population
declines relative to former levels (NRC 2004). Putative
factors for declines include introduction of exotic
species and habitat alteration, primarily via construc-
tion of dams, water diversions, and draining of
wetlands (Scoppettone and Vinyard 1991; USFWS
1993). As a result of the declines in sucker distribution
* Corresponding author: [email protected] Present address: U.S. Fish and Wildlife Service, 1936
California Avenue, Klamath Falls, Oregon 97601, USA.2 Present address: U.S. Forest Service, Yakutat Ranger
District, Post Office Box 327, Yakutat, Alaska 99689, USA.3 Present address: U.S. Geological Survey, 4200 New
Haven Road, Columbia, Missouri 65201, USA.4 Present address: The Watershed Company, 750 Sixth
Street South, Kirkland, Washington 98033, USA.5 The Washington Cooperative Fish and Wildlife Research
Unit is jointly sponsored by the University of Washington, theU.S. Geological Survey, the Washington State Departments ofEcology, Fish and Wildlife, and Natural Resources, and theWildlife Management Institute.
Received November 26, 2007; accepted August 24, 2008Published online January 29, 2009
153
Transactions of the American Fisheries Society 138:153–168, 2009� Copyright by the American Fisheries Society 2009DOI: 10.1577/T07-252.1
[Article]
and abundance, both species were placed on the
endangered species list by the U.S. Fish and Wildlife
Service (USFWS) in 1988.
Lost River and shortnose suckers are long-lived
(from 30 to 40 years), obligate lake dwellers that use
tributary rivers for spawning during late winter and
spring (Scoppettone and Vinyard 1991; Moyle 2002).
Upper Klamath Lake, Oregon, appears to be the most
critical remaining habitat for both species (NRC 2004).
Lost River suckers typically mature at 8 or 9 years;
shortnose suckers mature earlier, usually at 5–7 years
(NRC 2004). Data on the feeding habits of Lost River
and shortnose suckers are limited. These limited data
suggest both Lost River and shortnose suckers
consume zooplankton, benthic macroinvertebrates,
and detritus, implying they may feed in close
association with the lake bottom (Scoppettone and
Vinyard 1991; Moyle 2002; NRC 2004). Knowledge
of adult sucker distribution and habitat use in Upper
Klamath Lake is incomplete; however, the few data
that exist suggest suckers tend to occupy water depths
from 0.9 to 4.5 m (Reiser et al. 2001).
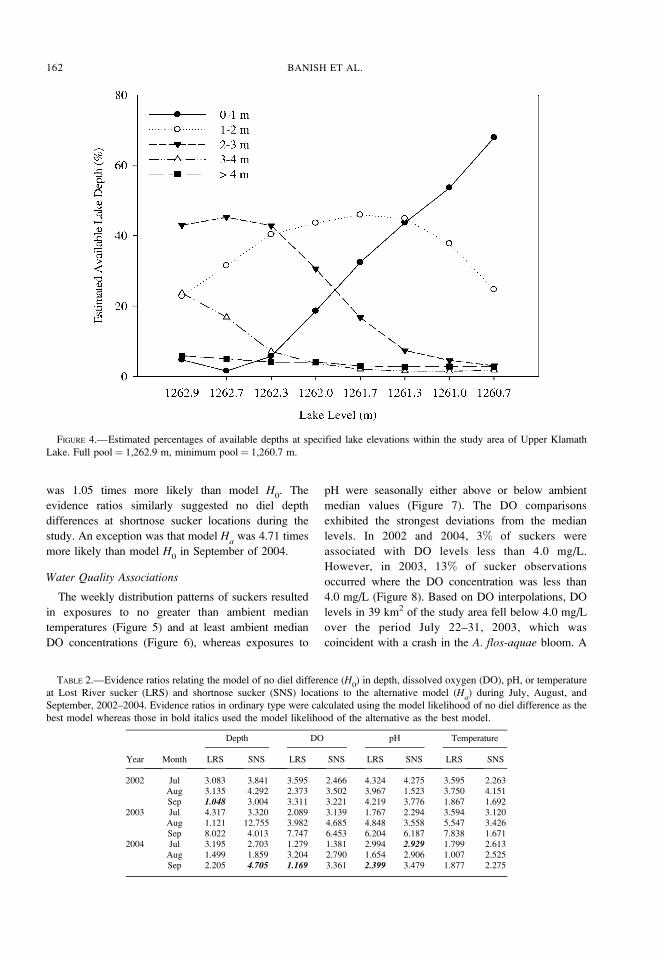
Poor water quality conditions have been identified as
one of the most significant threats to sucker recovery,
particularly in Upper Klamath Lake (NRC 2004). A
variety of water quality problems exist in Upper
Klamath Lake that are predominantly associated with
a near monoculture of the cyanobacterium, Aphanizo-menon flos-aquae. High pH (9.0–10.5), high un-
ionized ammonia levels (.0.5 mg/L), and a wide
range of dissolved oxygen concentrations (anoxic to
supersaturated) are related to the growth and decom-
position of A. flos-aquae (Kann and Smith 1999; Wood
et al. 2006). These extreme water quality conditions are
a source of stress to Lost River and shortnose suckers
and may contribute to periodic mass mortality events
(Perkins et al. 2000).
Historical records indicate that fish die-offs in Upper
Klamath Lake have occurred sporadically, but the
frequency of fish kills has increased in the last 20 years
(Perkins et al. 2000). Increasing fish die-offs as a result
of poor water quality have been recognized as a
recovery threat to both Lost River and shortnose sucker
populations (USFWS 1993; NRC 2004). Refugia from
poor water quality exist in Upper Klamath Lake near
tributaries and in areas of groundwater input (NRC
2004), though their use by suckers during periods of
poor water quality remains unclear.
Conservation of imperiled suckers requires an
understanding of their habitat use during different life
stages (Cooke et al. 2005). Despite the importance of
identifying distribution and habitat associations of
adult Lost River and shortnose suckers, little is known
about habitat use during this life history stage. The only
known study describing the summer habitat use and
distribution of adult Lost River and shortnose suckers
in Upper Klamath Lake was conducted by the U.S.
Bureau of Reclamation from 1993 to 1999 (Reiser et al.
2001). This study provided preliminary information on
adult sucker distribution and associations with water
depth and several water quality variables. Results
indicated that suckers congregated in the northern
portion of Upper Klamath Lake during summer
months. Suckers used tributaries and areas of ground-
water influence during periods of poor water quality
and dispersed from the northern portion of Upper
Klamath Lake in the fall.
However, several gaps in knowledge remain. The
U.S. Bureau of Reclamation study was conducted only
during daylight when dissolved oxygen and pH tended
to be at the high end of the diel range. Furthermore,
few suckers were tagged throughout the study (N¼76).
Small sample sizes in telemetry studies, coupled with
tag failure and mortality, can allow the behavior of a
small number of individuals to disproportionately
influence the patterns in the data. The small sample
sizes in the U.S. Bureau of Reclamation study resulted
in lumping annual data, precluding species-specific
intra-annual analyses. Moreover, a lack of data from
areas of Upper Klamath Lake where suckers were not
located hampered an evaluation of how radio-tagged
suckers used habitat in relation to availability.
Conservation of endangered Lost River and short-
nose suckers will require elucidating their distribution
patterns, identifying species-specific habitat associa-
tions, and understanding how poor water quality
influences behavior. Further, identification of key
water quality refuge areas might aid resource managers
in protection and restoration efforts. Therefore, the
objectives of this study were to (1) determine the
spatiotemporal distribution of radio-tagged adult Lost
River and shortnose suckers in the northern portion of
Upper Klamath Lake; (2) compare the depths associ-
ated with radio-tagged adult Lost River and shortnose
sucker locations with the available depths in the
northern portion of Upper Klamath Lake; and (3)
determine the diel depth and water quality conditions
associated with the locations of radio-tagged adult Lost
River and shortnose suckers in the northern portion of
Upper Klamath Lake.
Study Area
Upper Klamath Lake is a large, polymictic lake in
south-central Oregon (Wood et al. 2006). At full
capacity, Upper Klamath Lake has a surface area of
232 km2 and a mean depth of 2.8 m. A narrow trench
up to 15 m deep (Eagle Ridge trench) occurs along the
western shore adjacent to Eagle Ridge and along the
154 BANISH ET AL.
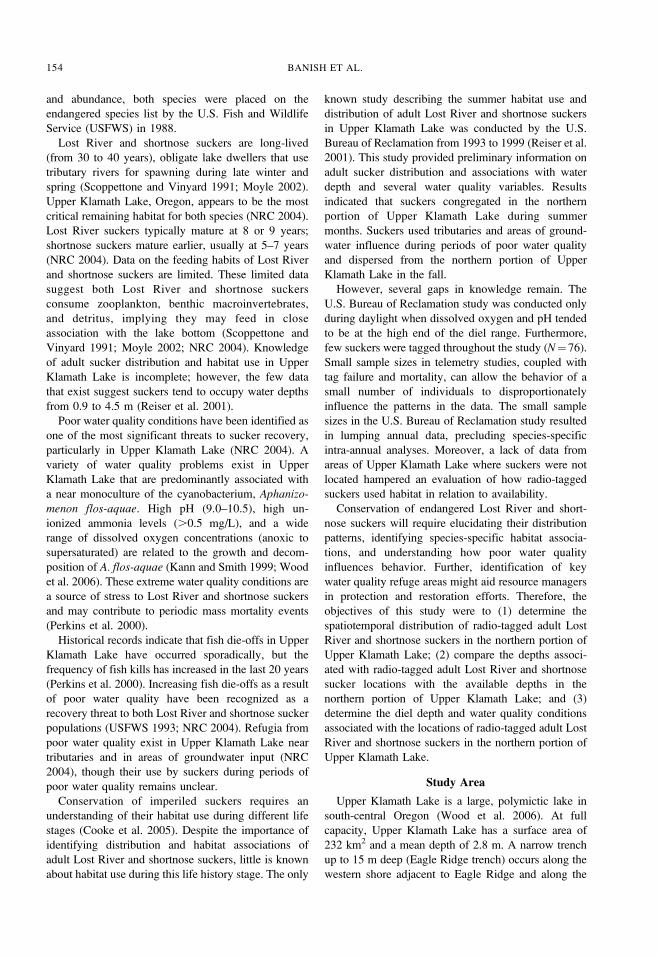
northern side of Ball Point (Figure 1). Historically, a
natural reef outlet to the Link River in Upper Klamath
Lake occurred at 1,261.9 m above sea level. In 1921,
the outlet was lowered by 1.2 m when Link River Dam
was constructed to allow lake level manipulations for
irrigation (Perkins et al. 2000). Water level regulation
also has changed the temporal signature of lake
elevation such that both the highest elevation in early
spring and the lowest elevation in late summer now
occur earlier than they did before the dam was built.
Consequently, the period of low water levels now starts
earlier in the summer and extends longer into the fall
(Kann and Welch 2005).
The watershed of Upper Klamath Lake is about
9,842 km2 in area (Snyder and Morace 1997) and the
land cover of its principal tributary drainages, the
Williamson and Sprague rivers (Figure 1), is primarily
forest (70%) with some (6%) agriculture (NRC 2004).
Upper Klamath Lake also receives groundwater input
from springs around the lake. Pelican Bay is a large
groundwater-influenced area along the northwestern
portion of Upper Klamath Lake that provides good
water quality relative to the remainder of the lake
(NRC 2004). From early July to early October of 2004,
the average dissolved oxygen concentration in Pelican
Bay was 11.6 mg/L, temperature was 14.78C, and pH
was 8.1 (U.S. Geological Survey, unpublished data).
By contrast, during this same period, the average
dissolved oxygen level at Mid North (Figure 1) was 8.3
mg/L, temperature was 19.58C, and pH was 9.2.
Phosphorus within the lake comes from internal
loading (i.e., lake sediments) and external sources
(100 lg/L inflow), about 40% of which is anthropo-
genic (NRC 2004). Total phosphorus concentrations
during the summer can be as high as 300 lg/L (Wood
et al. 2006). At peak concentrations, chlorophyll a can
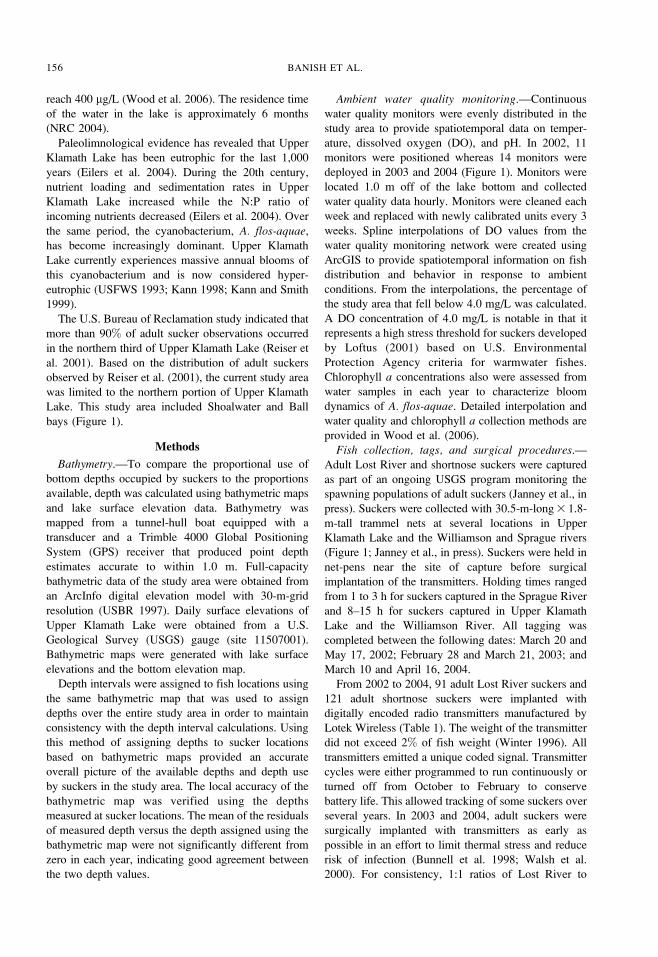
FIGURE 1.—Bathymetric map at full pool (1,262.9 m) of the study area in Upper Klamath Lake, where tracking of radio-tagged
adult Lost River and shortnose suckers occurred from 2002 to 2004. The numbers within the study area represent the depths (m)
of the isobaths. Triangles indicate water quality monitoring station locations in 2002 and circles locations in 2003 and 2004. The
water quality monitoring station in Shoalwater Bay was at the same location during each year of the study. Insets represent the
state of Oregon and Upper Klamath Lake; the highlighted portion of the inset of Upper Klamath Lake shows the study area,
including the quadrants that guided the tracking of radio-tagged suckers.
LOST RIVER AND SHORTNOSE SUCKERS IN UPPER KLAMATH LAKE 155
reach 400 lg/L (Wood et al. 2006). The residence time
of the water in the lake is approximately 6 months
(NRC 2004).
Paleolimnological evidence has revealed that Upper
Klamath Lake has been eutrophic for the last 1,000
years (Eilers et al. 2004). During the 20th century,
nutrient loading and sedimentation rates in Upper
Klamath Lake increased while the N:P ratio of
incoming nutrients decreased (Eilers et al. 2004). Over
the same period, the cyanobacterium, A. flos-aquae,
has become increasingly dominant. Upper Klamath
Lake currently experiences massive annual blooms of
this cyanobacterium and is now considered hyper-
eutrophic (USFWS 1993; Kann 1998; Kann and Smith
1999).
The U.S. Bureau of Reclamation study indicated that
more than 90% of adult sucker observations occurred
in the northern third of Upper Klamath Lake (Reiser et
al. 2001). Based on the distribution of adult suckers
observed by Reiser et al. (2001), the current study area
was limited to the northern portion of Upper Klamath
Lake. This study area included Shoalwater and Ball
bays (Figure 1).
Methods
Bathymetry.—To compare the proportional use of
bottom depths occupied by suckers to the proportions
available, depth was calculated using bathymetric maps
and lake surface elevation data. Bathymetry was
mapped from a tunnel-hull boat equipped with a
transducer and a Trimble 4000 Global Positioning
System (GPS) receiver that produced point depth
estimates accurate to within 1.0 m. Full-capacity
bathymetric data of the study area were obtained from
an ArcInfo digital elevation model with 30-m-grid
resolution (USBR 1997). Daily surface elevations of
Upper Klamath Lake were obtained from a U.S.
Geological Survey (USGS) gauge (site 11507001).
Bathymetric maps were generated with lake surface
elevations and the bottom elevation map.
Depth intervals were assigned to fish locations using
the same bathymetric map that was used to assign
depths over the entire study area in order to maintain
consistency with the depth interval calculations. Using
this method of assigning depths to sucker locations
based on bathymetric maps provided an accurate
overall picture of the available depths and depth use
by suckers in the study area. The local accuracy of the
bathymetric map was verified using the depths
measured at sucker locations. The mean of the residuals
of measured depth versus the depth assigned using the
bathymetric map were not significantly different from
zero in each year, indicating good agreement between
the two depth values.
Ambient water quality monitoring.—Continuous
water quality monitors were evenly distributed in the
study area to provide spatiotemporal data on temper-
ature, dissolved oxygen (DO), and pH. In 2002, 11
monitors were positioned whereas 14 monitors were
deployed in 2003 and 2004 (Figure 1). Monitors were
located 1.0 m off of the lake bottom and collected
water quality data hourly. Monitors were cleaned each
week and replaced with newly calibrated units every 3
weeks. Spline interpolations of DO values from the
water quality monitoring network were created using
ArcGIS to provide spatiotemporal information on fish
distribution and behavior in response to ambient
conditions. From the interpolations, the percentage of
the study area that fell below 4.0 mg/L was calculated.
A DO concentration of 4.0 mg/L is notable in that it
represents a high stress threshold for suckers developed
by Loftus (2001) based on U.S. Environmental
Protection Agency criteria for warmwater fishes.
Chlorophyll a concentrations also were assessed from
water samples in each year to characterize bloom
dynamics of A. flos-aquae. Detailed interpolation and
water quality and chlorophyll a collection methods are
provided in Wood et al. (2006).
Fish collection, tags, and surgical procedures.—
Adult Lost River and shortnose suckers were captured
as part of an ongoing USGS program monitoring the
spawning populations of adult suckers (Janney et al., in
press). Suckers were collected with 30.5-m-long 3 1.8-
m-tall trammel nets at several locations in Upper
Klamath Lake and the Williamson and Sprague rivers
(Figure 1; Janney et al., in press). Suckers were held in
net-pens near the site of capture before surgical
implantation of the transmitters. Holding times ranged
from 1 to 3 h for suckers captured in the Sprague River
and 8–15 h for suckers captured in Upper Klamath
Lake and the Williamson River. All tagging was
completed between the following dates: March 20 and
May 17, 2002; February 28 and March 21, 2003; and
March 10 and April 16, 2004.
From 2002 to 2004, 91 adult Lost River suckers and
121 adult shortnose suckers were implanted with
digitally encoded radio transmitters manufactured by
Lotek Wireless (Table 1). The weight of the transmitter
did not exceed 2% of fish weight (Winter 1996). All
transmitters emitted a unique coded signal. Transmitter
cycles were either programmed to run continuously or
turned off from October to February to conserve
battery life. This allowed tracking of some suckers over
several years. In 2003 and 2004, adult suckers were
surgically implanted with transmitters as early as
possible in an effort to limit thermal stress and reduce
risk of infection (Bunnell et al. 1998; Walsh et al.
2000). For consistency, 1:1 ratios of Lost River to
156 BANISH ET AL.
shortnose suckers and males to females were attempted
during tagging.
Suckers were anesthetized in a 100–133 mg/L
solution of tricaine methanesulfonate (MS-222) before
transmitters were surgically implanted. Fish gills were
continually irrigated with the MS-222 solution during
the surgical procedure. Transmitters and surgical
instruments were disinfected with a 10% solution of
Nolvasan and rinsed with a 1% solution of sodium
chloride. Surgical implantation of transmitters was
performed following a variation used by Isaak and
Bjornn (1996) based on the shielded needle procedure
(Ross and Kleiner 1982). Transmitters were inserted
into the peritoneal cavity along with a dose of
Promycin or oxytetracycline (50 mg/kg body weight)
to prevent infection (Summerfelt and Smith 1990).
Incisions were closed with 3–6 individual sutures and
covered with a cyanoacrylate tissue adhesive. One
suture was used to hold the trailing antenna to the side
of the sucker to aid in exit-wound healing. The entire
operation time ranged from 4 to 10 min. Radio-tagged
suckers were returned to a freshwater holding tank until
they swam upright, transferred to a floating net-pen and
held for up to 3 h, and released near their site of
capture. All suckers actively swam away following
their release.
Boat tracking.—Boat tracking in the study area was
conducted 4 d per week during two consecutive 9-h
shifts each day. Starting times were staggered weekly
to ensure sampling over the entire diel period. Tracking
was completed between July 1 and September 28,
2002, June 23 and September 27, 2003, and June 21
and October 1, 2004. The study area was partitioned
into four quadrants of equal area and each quadrant
was searched at least 1 d per week in random order
without replacement. The quadrants partitioned the
study area into northern, southeastern, south-central,
and southwestern areas that were used to guide
tracking. If the selected quadrant was searched
completely in a day, the remaining time was spent
tracking in another quadrant that was randomly
selected with replacement. Selection for additional
tracking did not preclude a quadrant from being
sampled as part of the normal design later in the week.
Some quadrants were not searched completely on all
tracking days due to the concentration of radio-tagged
suckers in a particular quadrant. As the summer
progressed, sections of some quadrants became
shallow (,1.0 m) and tracking was performed as close
as possible to the selected transect. In addition, aerial
surveys periodically covered these shallow locations.
Individual transects within each quadrant were
selected at random and sampled without replacement
for each day of effort. Based on transmitter distance
testing, from five to nine parallel transects were
established in each quadrant at 1-km intervals.
Depending on transect length, from 1 to 13 points (N¼ 133) were established at 1-km intervals along each
transect and offset from adjacent transects so that the
distance between points along adjacent transects was a
maximum of 560 m. To increase the probability of
detecting suckers occupying deep water, crews contin-
uously scanned all frequencies while slowly cruising in
waters over Eagle Ridge trench and near Ball Point,
where water depths exceeded 4.6 m (Figure 1).
At each transect point, crews monitored for the
presence of radio-tagged suckers from a 5.8-m
aluminum hull boat equipped with a 3608 rotating
six-element Yagi antenna mounted on a 3-m mast.
Receivers were programmed to scan all frequencies in
use. When a signal was detected, the objective was to
move as close as possible to the tagged sucker without
influencing its behavior. Crews followed the direction
of the signal and determined sucker location with
increasing precision by reducing receiver gain (i.e.,
sensitivity; range 0–99). An underwater antenna was
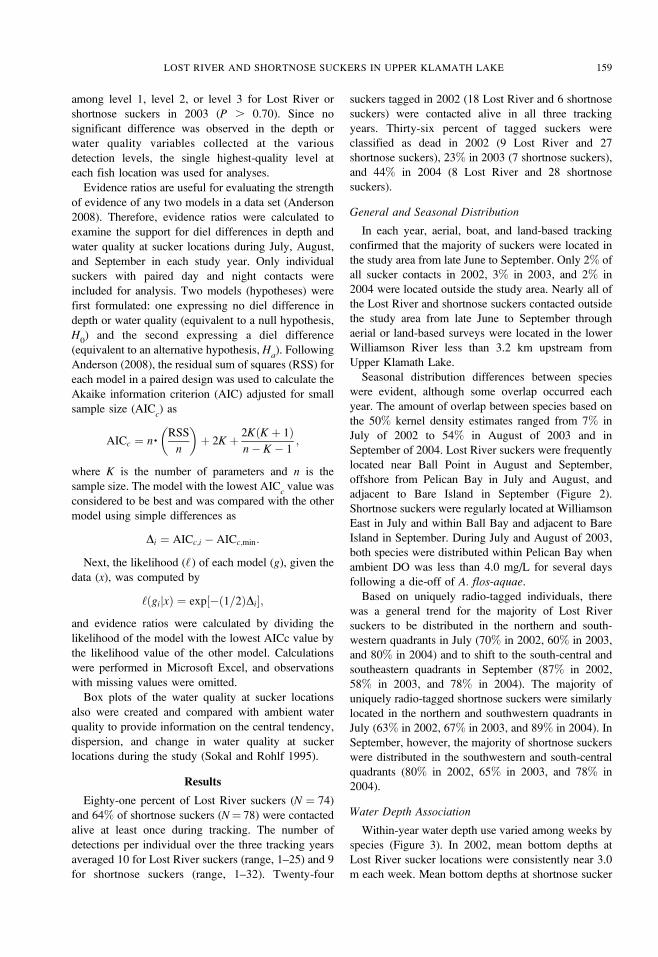
TABLE 1.—Total number (N), fork length (mm), and weight (g) of Lost River (LRS) and shortnose suckers (SNS) surgically
implanted with radio transmitters in Upper Klamath Lake, from 2002 to 2004. Transmitter cycles were either programmed to run
continuously or turned off from October to February to conserve battery life (given in months).
Year Species N Mean length (range) Mean weight (range) Tag type Tag cycle Battery life
2002 LRS 45 567 (466–686) 2,166 (1,300–4,500) MCFT-3A On–off 36.0LRS 5 587 (510–680) 2,240 (1,550–3,000) MCFT-3EM Continuous 12.0SNS 45 424 (372–520) 1,228 (750–2,300) MCFT-3A On–off 36.0SNS 5 431 (406–454) 1,285 (1,075–1,550) MCFT-3EM Continuous 12.0
2003 LRS 7 561 (499–638) 2,129 (1,350–2,850) MCFT-3FM On–off 20.0SNS 23 444 (401–496) 1,347 (800–2,000) MCFT-3FM On–off 20.0
2004 LRS 27 575 (491–650) 2,087 (1,250–2,950) MCFT-3A-IM On–off 36.0LRS 5 549 (467–629) 2,100 (1,500–2,600) SR11-25PT Continuous 6.8LRS 2 558 (556–600) 1,900 (1,700–2,100) SR18-25PT Continuous 4.7SNS 41 439 (393–552) 1,240 (900–2,200) MCFT-3A-IM On–off 36.0SNS 4 407 (386–433) 988 (900–1,200) SR11-25PT Continuous 6.8SNS 3 432 (405–467) 1,117 (1,050–1,200) SR18-25PT Continuous 4.7
LOST RIVER AND SHORTNOSE SUCKERS IN UPPER KLAMATH LAKE 157
used in the immediate vicinity of the sucker. Based on
preliminary transmitter tests that measured signal
strengths at known distances, the estimated proximity
of each sucker located was qualified by assigning it to
one of three levels. Locations were classified as level 1
(actual location estimated within 10 m) when the
receiver decoded the tag with the underwater antenna at
a gain of no more than 55; level 2 (actual location
estimated within 25 m) when a unidirectional power
signal of at least 180 was obtained with a Yagi antenna
at a gain of 50; and level 3 (actual location estimated
within 50 m) when a unidirectional signal strength of at
least 180 was obtained with a Yagi antenna at a gain of
85–90.
Once a sucker’s position was determined, its
location was recorded in Universal Transverse Merca-
tor coordinates determined by means of a GPS. Water
depth and water quality were recorded each time at the
estimated sucker location. Water depth was defined as
the bottom depth, not the depth where the sucker was
located. However, Lost River and shortnose suckers are
benthic-oriented, especially for feeding (Scoppettone
and Vinyard 1991; Moyle 2002); thus, bottom depth
measurements should reflect sucker depth. Tempera-
ture, DO, and pH were collected from 0.7 to 1.3 m
above the substrate with multiparameter datasondes at
the location of best detection level for the fish. This
range was selected to limit comparisons to similar
portions of the water column and avoid possible
confounding effects of bottom sediments. Instruments
were calibrated daily and water quality data were
collected according to USGS protocols and procedures
(USGS 1997).
Sunrise and sunset data were downloaded from the
U.S. Naval Observatory Web site (http://aa.usno.navy.
mil/) with the place name for Klamath Falls, Oregon,
and used to distinguish day and night observations.
Suckers located between sunrise and sunset were
considered day contacts and those located between
sunset and sunrise were considered night contacts.
To determine the fate of the suckers, contact
locations of individual fish were plotted in ArcGIS.
A sucker was classified as dead when three or more
contacts were within a 110-m-diameter area or if the
signal was continually detected in a shallow area (i.e.,
,0.5 m). This threshold was chosen for classifying a
sucker as dead since suckers did not exhibit sedentary
behavior during the summer. Once a sucker was
classified as dead, data collected after the last known
live contact were eliminated from subsequent analyses.
Aerial and land-based tracking.—Aerial and land-
based tracking were completed once per week during
the study to assist in locating tagged suckers that might
have moved outside the study area or into areas of
shallow water inaccessible by boat. In addition, aerial
tracking was completed periodically 3 weeks before the
study and 2 weeks after the study was completed to
verify sucker movement into and out of the study area.
Aerial surveys searched Upper Klamath Lake, Agency
Lake, and the lower Williamson and Sprague rivers. In
2002 and 2003, the aircraft was equipped with a four-
element Yagi antenna attached to a wing strut and
mounted in a vertical orientation with a 458 downward
angle. In 2004, two whip antennas attached to the
wings or the struts were used. Land-based tracking
consisted of driving to elevated areas around Upper
Klamath Lake and locating tagged suckers with a
handheld four-element Yagi antenna. Land-based
tracking was used only in 2002 to compensate for the
limited availability of aircraft due to forest fires in
southern Oregon and northern California. Aerial and
land-based locations were not used in the analysis of
species distribution, but helped in classifying suckers
as dead and for finding suckers that had moved out of
boat-tracking areas.
Data analyses.—To describe sucker distributions
and distribution overlap in the study area, 50% kernel
estimates (Worton 1989) of sucker density were
calculated and displayed using ArcGIS. Kernel density
estimation is a nonparametric technique wherein a
kernel (a probability density) is averaged across the
observed data points to create a smooth approximation
of intensity of use within an area (Seaman and Powell
1996). There were fewer than 30 observations per
individual, which is a recommended minimum for
accurate kernel estimates (Kernohan et al. 2001).
However, there were more than 30 observations per
species. Therefore, the species was treated as the
individual and composite kernel estimates of species
distributions were calculated by month for each year of
the study. Too few contacts existed to calculate weekly
kernel estimates of sucker distribution. Since there
were fewer than 30 locations of each species in June in
2003 and 2004 and October of 2004, these months
were not included for analysis. The 50% estimates were
chosen because they are accurate for defining heavily
used areas relative to 95% or 99% estimates (Vokoun
2003).
In 2003, water quality and depth measurements from
a random subset (N ¼ 50) of sucker contacts were
recorded at levels 1, 2, and 3 to examine whether
differences in habitat use could be detected. Depth and
water quality variables collected at the three detection
levels were compared with one-way analysis of
variance (ANOVA) (Sokal and Rohlf 1995) for each
species and were considered statistically significant at
P � 0.05. No statistical differences were evident
between mean water depth, DO, pH, or temperature
158 BANISH ET AL.
among level 1, level 2, or level 3 for Lost River or
shortnose suckers in 2003 (P . 0.70). Since no
significant difference was observed in the depth or
water quality variables collected at the various
detection levels, the single highest-quality level at
each fish location was used for analyses.
Evidence ratios are useful for evaluating the strength
of evidence of any two models in a data set (Anderson
2008). Therefore, evidence ratios were calculated to
examine the support for diel differences in depth and
water quality at sucker locations during July, August,
and September in each study year. Only individual
suckers with paired day and night contacts were
included for analysis. Two models (hypotheses) were
first formulated: one expressing no diel difference in
depth or water quality (equivalent to a null hypothesis,
H0) and the second expressing a diel difference
(equivalent to an alternative hypothesis, Ha). Following
Anderson (2008), the residual sum of squares (RSS) for
each model in a paired design was used to calculate the
Akaike information criterion (AIC) adjusted for small
sample size (AICc) as
AICc ¼ n �RSS
n
� �þ 2K þ 2KðK þ 1Þ
n� K � 1;
where K is the number of parameters and n is the
sample size. The model with the lowest AICc
value was
considered to be best and was compared with the other
model using simple differences as
Di ¼ AICc;i � AICc;min:
Next, the likelihood (‘ ) of each model (g), given the
data (x), was computed by
‘ðgijxÞ ¼ exp½�ð1=2ÞDi�;
and evidence ratios were calculated by dividing the
likelihood of the model with the lowest AICc value by
the likelihood value of the other model. Calculations
were performed in Microsoft Excel, and observations
with missing values were omitted.
Box plots of the water quality at sucker locations
also were created and compared with ambient water
quality to provide information on the central tendency,
dispersion, and change in water quality at sucker
locations during the study (Sokal and Rohlf 1995).
Results
Eighty-one percent of Lost River suckers (N ¼ 74)
and 64% of shortnose suckers (N¼ 78) were contacted
alive at least once during tracking. The number of
detections per individual over the three tracking years
averaged 10 for Lost River suckers (range, 1–25) and 9
for shortnose suckers (range, 1–32). Twenty-four
suckers tagged in 2002 (18 Lost River and 6 shortnose
suckers) were contacted alive in all three tracking
years. Thirty-six percent of tagged suckers were
classified as dead in 2002 (9 Lost River and 27
shortnose suckers), 23% in 2003 (7 shortnose suckers),
and 44% in 2004 (8 Lost River and 28 shortnose
suckers).
General and Seasonal Distribution
In each year, aerial, boat, and land-based tracking
confirmed that the majority of suckers were located in
the study area from late June to September. Only 2% of
all sucker contacts in 2002, 3% in 2003, and 2% in
2004 were located outside the study area. Nearly all of
the Lost River and shortnose suckers contacted outside
the study area from late June to September through
aerial or land-based surveys were located in the lower
Williamson River less than 3.2 km upstream from
Upper Klamath Lake.
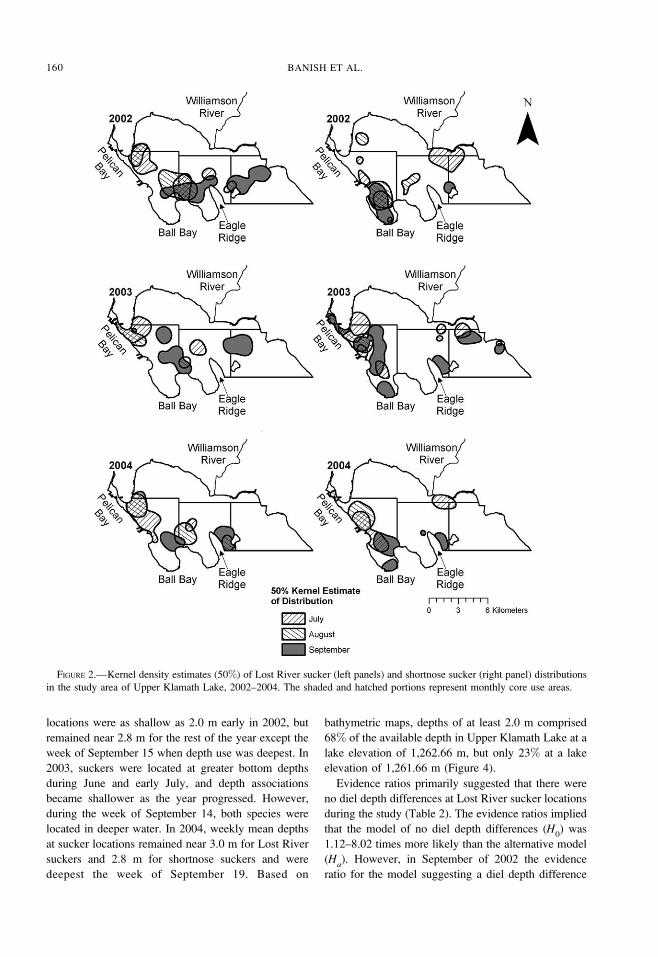
Seasonal distribution differences between species
were evident, although some overlap occurred each
year. The amount of overlap between species based on
the 50% kernel density estimates ranged from 7% in
July of 2002 to 54% in August of 2003 and in
September of 2004. Lost River suckers were frequently
located near Ball Point in August and September,
offshore from Pelican Bay in July and August, and
adjacent to Bare Island in September (Figure 2).
Shortnose suckers were regularly located at Williamson
East in July and within Ball Bay and adjacent to Bare
Island in September. During July and August of 2003,
both species were distributed within Pelican Bay when
ambient DO was less than 4.0 mg/L for several days
following a die-off of A. flos-aquae.
Based on uniquely radio-tagged individuals, there
was a general trend for the majority of Lost River
suckers to be distributed in the northern and south-
western quadrants in July (70% in 2002, 60% in 2003,
and 80% in 2004) and to shift to the south-central and
southeastern quadrants in September (87% in 2002,
58% in 2003, and 78% in 2004). The majority of
uniquely radio-tagged shortnose suckers were similarly
located in the northern and southwestern quadrants in
July (63% in 2002, 67% in 2003, and 89% in 2004). In
September, however, the majority of shortnose suckers
were distributed in the southwestern and south-central
quadrants (80% in 2002, 65% in 2003, and 78% in
2004).
Water Depth Association
Within-year water depth use varied among weeks by
species (Figure 3). In 2002, mean bottom depths at
Lost River sucker locations were consistently near 3.0
m each week. Mean bottom depths at shortnose sucker
LOST RIVER AND SHORTNOSE SUCKERS IN UPPER KLAMATH LAKE 159
locations were as shallow as 2.0 m early in 2002, but
remained near 2.8 m for the rest of the year except the
week of September 15 when depth use was deepest. In
2003, suckers were located at greater bottom depths
during June and early July, and depth associations
became shallower as the year progressed. However,
during the week of September 14, both species were
located in deeper water. In 2004, weekly mean depths
at sucker locations remained near 3.0 m for Lost River
suckers and 2.8 m for shortnose suckers and were
deepest the week of September 19. Based on
bathymetric maps, depths of at least 2.0 m comprised
68% of the available depth in Upper Klamath Lake at a
lake elevation of 1,262.66 m, but only 23% at a lake
elevation of 1,261.66 m (Figure 4).
Evidence ratios primarily suggested that there were
no diel depth differences at Lost River sucker locations
during the study (Table 2). The evidence ratios implied
that the model of no diel depth differences (H0) was
1.12–8.02 times more likely than the alternative model
(Ha). However, in September of 2002 the evidence
ratio for the model suggesting a diel depth difference
FIGURE 2.—Kernel density estimates (50%) of Lost River sucker (left panels) and shortnose sucker (right panel) distributions
in the study area of Upper Klamath Lake, 2002–2004. The shaded and hatched portions represent monthly core use areas.
160 BANISH ET AL.
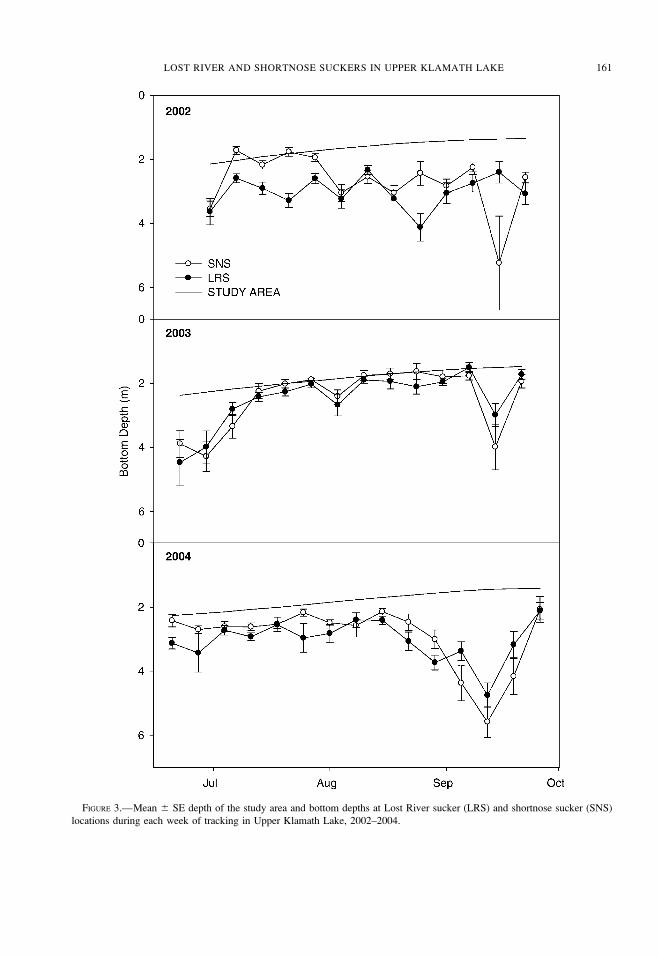
FIGURE 3.—Mean 6 SE depth of the study area and bottom depths at Lost River sucker (LRS) and shortnose sucker (SNS)
locations during each week of tracking in Upper Klamath Lake, 2002–2004.
LOST RIVER AND SHORTNOSE SUCKERS IN UPPER KLAMATH LAKE 161
was 1.05 times more likely than model H0. The
evidence ratios similarly suggested no diel depth
differences at shortnose sucker locations during the
study. An exception was that model Ha
was 4.71 times
more likely than model H0
in September of 2004.
Water Quality Associations
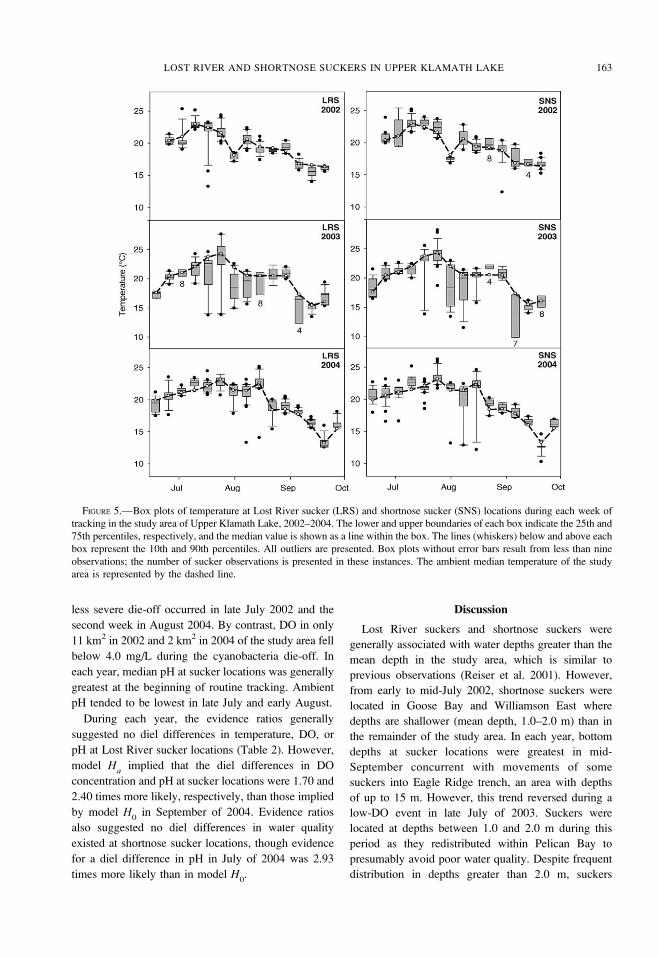
The weekly distribution patterns of suckers resulted
in exposures to no greater than ambient median
temperatures (Figure 5) and at least ambient median
DO concentrations (Figure 6), whereas exposures to
pH were seasonally either above or below ambient
median values (Figure 7). The DO comparisons
exhibited the strongest deviations from the median
levels. In 2002 and 2004, 3% of suckers were
associated with DO levels less than 4.0 mg/L.
However, in 2003, 13% of sucker observations
occurred where the DO concentration was less than
4.0 mg/L (Figure 8). Based on DO interpolations, DO
levels in 39 km2 of the study area fell below 4.0 mg/L
over the period July 22–31, 2003, which was
coincident with a crash in the A. flos-aquae bloom. A
FIGURE 4.—Estimated percentages of available depths at specified lake elevations within the study area of Upper Klamath
Lake. Full pool¼ 1,262.9 m, minimum pool¼ 1,260.7 m.
TABLE 2.—Evidence ratios relating the model of no diel difference (H0) in depth, dissolved oxygen (DO), pH, or temperature
at Lost River sucker (LRS) and shortnose sucker (SNS) locations to the alternative model (Ha) during July, August, and
September, 2002–2004. Evidence ratios in ordinary type were calculated using the model likelihood of no diel difference as the
best model whereas those in bold italics used the model likelihood of the alternative as the best model.
Year Month
Depth DO pH Temperature
LRS SNS LRS SNS LRS SNS LRS SNS
2002 Jul 3.083 3.841 3.595 2.466 4.324 4.275 3.595 2.263Aug 3.135 4.292 2.373 3.502 3.967 1.523 3.750 4.151Sep 1.048 3.004 3.311 3.221 4.219 3.776 1.867 1.692
2003 Jul 4.317 3.320 2.089 3.139 1.767 2.294 3.594 3.120Aug 1.121 12.755 3.982 4.685 4.848 3.558 5.547 3.426Sep 8.022 4.013 7.747 6.453 6.204 6.187 7.838 1.671
2004 Jul 3.195 2.703 1.279 1.381 2.994 2.929 1.799 2.613Aug 1.499 1.859 3.204 2.790 1.654 2.906 1.007 2.525Sep 2.205 4.705 1.169 3.361 2.399 3.479 1.877 2.275
162 BANISH ET AL.
less severe die-off occurred in late July 2002 and the
second week in August 2004. By contrast, DO in only
11 km2 in 2002 and 2 km2 in 2004 of the study area fell
below 4.0 mg/L during the cyanobacteria die-off. In
each year, median pH at sucker locations was generally
greatest at the beginning of routine tracking. Ambient
pH tended to be lowest in late July and early August.
During each year, the evidence ratios generally
suggested no diel differences in temperature, DO, or
pH at Lost River sucker locations (Table 2). However,
model Ha
implied that the diel differences in DO
concentration and pH at sucker locations were 1.70 and
2.40 times more likely, respectively, than those implied
by model H0
in September of 2004. Evidence ratios
also suggested no diel differences in water quality
existed at shortnose sucker locations, though evidence
for a diel difference in pH in July of 2004 was 2.93
times more likely than in model H0.
Discussion
Lost River suckers and shortnose suckers were
generally associated with water depths greater than the
mean depth in the study area, which is similar to
previous observations (Reiser et al. 2001). However,
from early to mid-July 2002, shortnose suckers were
located in Goose Bay and Williamson East where
depths are shallower (mean depth, 1.0–2.0 m) than in
the remainder of the study area. In each year, bottom
depths at sucker locations were greatest in mid-
September concurrent with movements of some
suckers into Eagle Ridge trench, an area with depths
of up to 15 m. However, this trend reversed during a
low-DO event in late July of 2003. Suckers were
located at depths between 1.0 and 2.0 m during this
period as they redistributed within Pelican Bay to
presumably avoid poor water quality. Despite frequent
distribution in depths greater than 2.0 m, suckers
FIGURE 5.—Box plots of temperature at Lost River sucker (LRS) and shortnose sucker (SNS) locations during each week of
tracking in the study area of Upper Klamath Lake, 2002–2004. The lower and upper boundaries of each box indicate the 25th and
75th percentiles, respectively, and the median value is shown as a line within the box. The lines (whiskers) below and above each
box represent the 10th and 90th percentiles. All outliers are presented. Box plots without error bars result from less than nine
observations; the number of sucker observations is presented in these instances. The ambient median temperature of the study
area is represented by the dashed line.
LOST RIVER AND SHORTNOSE SUCKERS IN UPPER KLAMATH LAKE 163
seeking refuge in the relatively good water quality of
Pelican Bay appeared to supersede staying in deep
areas when water quality was poor. This movement
may represent a trade-off between the risk of predation
in shallow water versus occupying areas with low
levels of DO.
The occupation of depths greater than 2.0 m may be
explained by several factors. For example, Lost River
and shortnose suckers are bottom-oriented species; as
their diet consists of invertebrates, plankton, and
detritus (Reiser et al. 2001; Moyle 2002), they could
minimize exposure to avian predators and still forage
for food in the deeper waters. In addition, cover (e.g.,
large woody debris) is sparse in the study area and
depths greater than 2.0 m may provide concealment
from avian predators (e.g., American white pelican
Pelecanus erythrorhynchos; Findholt and Anderson
1995; Derby and Lovvorn 1997).
Water withdrawals from Upper Klamath Lake
lowered lake elevation as the summer progressed
(NRC 2004), reducing the amount of habitat available
to suckers. Artificial lowering of Upper Klamath Lake
may pose several problems for suckers. First, an
increase in the amount of shallow areas in Upper
Klamath Lake may place suckers at an increased risk of
predation from American white pelicans, a known
sucker predator (Scoppettone et al. 2006). For instance,
from 2001 to 2005, Scoppettone et al. (2006) collected
5,193 anchor tags at known American white pelican
nesting areas on Anaho Island in Pyramid Lake,
Nevada. These tags were originally implanted in cui-
ui Chasmistes cujus from 234 to 650 mm fork length,
indicating pelicans are capable of consuming large
quantities of adult suckers. Second, depending on
proximity to a water quality refuge, suckers may be at
risk if they become concentrated in deeper areas at
night (i.e., trenches) and low DO events occur. These
low DO events have been observed during reversals of
prevailing wind patterns, which cause water circulation
to stall and prolong oxygen-demanding processes
(Wood et al. 2006).
Evidence ratios suggested that there were no diel
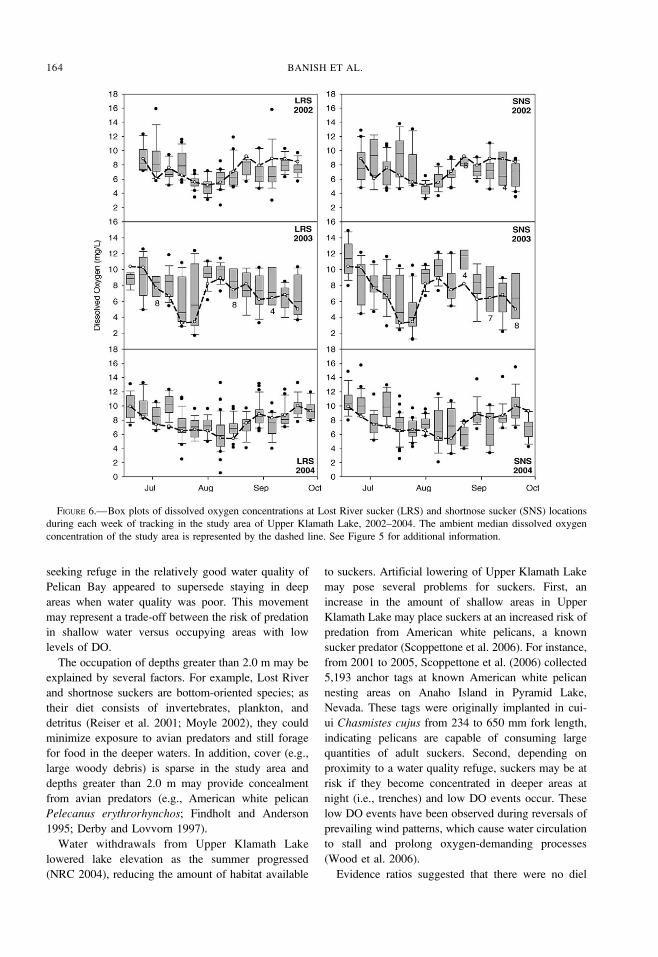
FIGURE 6.—Box plots of dissolved oxygen concentrations at Lost River sucker (LRS) and shortnose sucker (SNS) locations
during each week of tracking in the study area of Upper Klamath Lake, 2002–2004. The ambient median dissolved oxygen
concentration of the study area is represented by the dashed line. See Figure 5 for additional information.
164 BANISH ET AL.
differences in depth or water quality at sucker
locations. When evidence ratios implied that diel
differences in depth or water quality did exist,
differences were determined to be weak. For instance,
there were only four instances when evidence ratios
suggested that there were diel differences in depth or
water quality at sucker locations, and the greatest was
only 4.71 times more likely than no diel difference.
These results suggest that individual suckers stay in
areas of similar depth and are able to stay in areas with
consistent water quality, despite diel variations in
temperature, DO, and pH (Wood et al. 2006).
Poor water quality events, characterized by high pH
and low DO, typically occur each year in Upper
Klamath Lake as a result of the bloom dynamics of A.flos-aquae (Kann and Smith 1999). Suckers were
distributed in Pelican Bay and offshore from Pelican
Bay when the DO concentration in the study area was
less than 4.0 mg/L during this study. Suckers appeared
to respond quickly to deteriorating water quality. For
instance, between July 15 and July 25, 2003, an
individual shortnose sucker traveled 12.3 km from
Bare Island to Pelican Bay as DO levels fell in the
study area. Suckers used the well-oxygenated, cooler
waters of Pelican Bay as a refuge from poor water
quality through mid-August until water quality im-
proved.
Although poor water quality events occurred each
summer, shortnose suckers were primarily within
Pelican Bay during 2003. In contrast, Lost River
suckers were located off the mouth of or within Pelican
Bay each year of the study. Terwilliger et al. (2003)
revealed that nighttime DO levels less than 4.0 mg/L
for juvenile Lost River suckers and less than 1.0 mg/L
for juvenile shortnose suckers caused enough stress to
reduce growth at temperatures greater than 228C and
suggested shortnose suckers may be more tolerant of
low DO conditions. The median lethal DO concentra-
tions were consistently lower for juvenile shortnose
suckers (range, 1.14–1.34 mg/L over 24–96 h) than for
juvenile Lost River suckers (range, 1.58–1.62 mg/L
over 24–96 h) in laboratory studies (Saiki et al. 1999).
Assuming adult suckers exhibit similar tolerance to DO
conditions, results of this study concur with Terwilliger
FIGURE 7.—Box plots of pH at Lost River sucker (LRS) and shortnose sucker (SNS) locations during each week of tracking in
the study area of Upper Klamath Lake, 2002–2004. The ambient median pH of the study area is represented by the dashed line.
See Figure 5 for additional information.
LOST RIVER AND SHORTNOSE SUCKERS IN UPPER KLAMATH LAKE 165
et al. (2003) and Saiki et al. (1999) that shortnose
suckers may be more tolerant of low DO conditions
than are Lost River suckers.
Pelican Bay appears to be a key refugium for suckers
during poor water quality events. Although Pelican
Bay provides suitable water quality, other refugia are
accessible to suckers in the study area. For instance, the
Williamson River provides about 50% of the freshwa-
ter inflow to Upper Klamath Lake (NRC 2004). The
Williamson River is readily accessible to suckers
throughout the summer, but they do not often use the
river environment as a refugium. This prompts the
question why suckers use Pelican Bay and not the
Williamson River as a refuge during poor water quality
events. This pattern may be explained by several
factors. First, suckers may expend more energy in lotic
than in lentic habitats, which potentially reduces
condition. Second, circulation in Upper Klamath Lake
is driven predominately by wind currents (Wood et al.
2006). Prevailing wind currents drive circulation in a
clockwise direction in the study area. Assuming
suckers follow these currents, Pelican Bay would
provide the nearest refuge area.
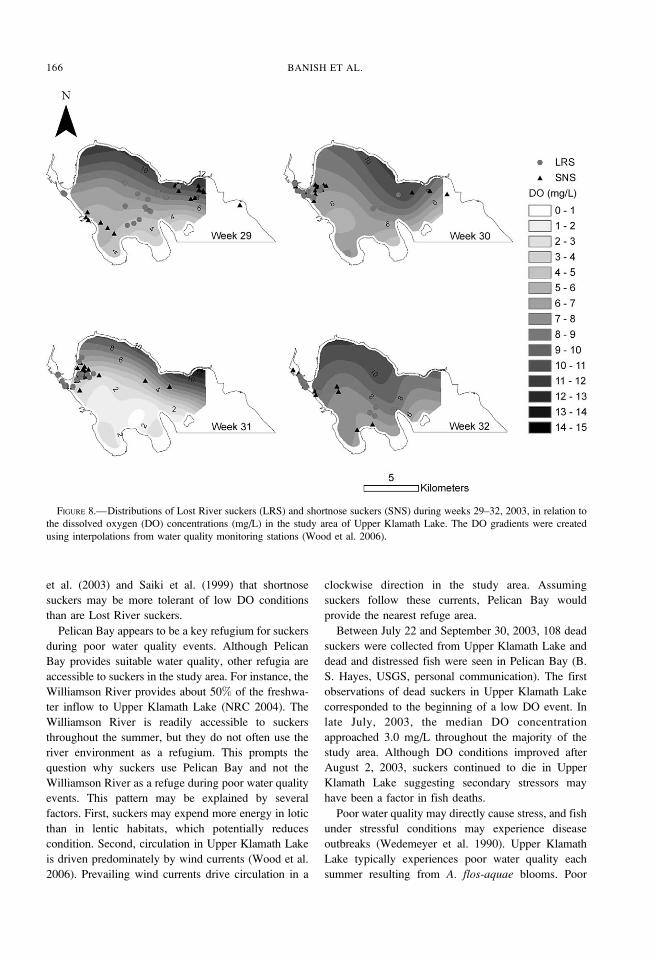
Between July 22 and September 30, 2003, 108 dead
suckers were collected from Upper Klamath Lake and
dead and distressed fish were seen in Pelican Bay (B.
S. Hayes, USGS, personal communication). The first
observations of dead suckers in Upper Klamath Lake
corresponded to the beginning of a low DO event. In
late July, 2003, the median DO concentration
approached 3.0 mg/L throughout the majority of the
study area. Although DO conditions improved after
August 2, 2003, suckers continued to die in Upper
Klamath Lake suggesting secondary stressors may
have been a factor in fish deaths.
Poor water quality may directly cause stress, and fish
under stressful conditions may experience disease
outbreaks (Wedemeyer et al. 1990). Upper Klamath
Lake typically experiences poor water quality each
summer resulting from A. flos-aquae blooms. Poor
FIGURE 8.—Distributions of Lost River suckers (LRS) and shortnose suckers (SNS) during weeks 29–32, 2003, in relation to
the dissolved oxygen (DO) concentrations (mg/L) in the study area of Upper Klamath Lake. The DO gradients were created
using interpolations from water quality monitoring stations (Wood et al. 2006).
166 BANISH ET AL.
water quality poses a source of stress to suckers,
placing them in a compromised state of health. In 2003,
a year with extremely poor water quality, moribund
and dead suckers were collected in Pelican Bay.
Examination of these suckers revealed a prevalence
of columnaris (J. S. Foott, U.S. Fish and Wildlife
Service, personal communication), a bacterial disease
that was associated with fish die-off events during
1995–1997 (Perkins et al. 2000). Wedemeyer et al.
(1990) similarly noted that high densities of salmonids
may lead to myxobacterial gill disease outbreaks.
Despite the good water quality in Pelican Bay,
crowding of suckers may have increased already
stressful conditions for both Lost River and shortnose
suckers. Crowded conditions may have compromised
fish health by reducing immune function (Maule et al.
1989), thus causing mortality.
Management efforts may be enhanced by future
studies that elucidate the life history differences
between Lost River and shortnose suckers at all life
stages to extend the results of this study. Findings of
this study also expanded upon previous investigations
to provide important information on adult sucker
distribution and habitat associations in response to
poor water quality events. Pelican Bay appears to act as
a key refugium during periods of poor water quality
within the study area and efforts to maintain the quality
of its habitat may be beneficial for suckers. Further-
more, conservation of suckers may benefit from
restoring connectivity to other water quality refugia
in Upper Klamath Lake. The National Research
Council (NRC 2004) noted refuge and spawning areas,
such as Barkley Springs in southeastern Upper
Klamath Lake, were once used by suckers, but
connectivity has since been cut off. In 2003, a
particularly severe crash of A. flos-aquae led to poor
water quality and subsequent partial fish kill. Poor
water quality in 2002 and 2004 was evident though no
dead fish were observed. Future Klamath River basin
sucker conservation would benefit from research aimed
at identifying the underlying mechanistic drivers that
may be interacting to promote fish die-off events and
potentially threatening the future persistence of these
endemic sucker species.
Acknowledgments
R. Anderson, G. Balmert, P. Barry, D. Bennetts, G.
Blackwood, T. Blankenburg, B. Bozarth, K. Buelow,
D. Gambetta, B. Hayes, H. Hendrixson, B. Herring, E.
Janney, M. Johnson, S. Kincaid, A. Scott, B. Swigle,
D. Taylor, S. Thompson, J. Whisler, and S. Vander-
Kooi assisted with field work. B. Greer, S. Kincaid,
and B. Swigle provided ArcGIS assistance. M.
Lindenberg provided assistance with the preparation
of water quality data. G. Blackwood oversaw database
management. The U.S. Fish and Wildlife Service
assisted with aerial surveys. This manuscript was
improved by comments from S. Burdick, N. Hendrix,
C. Jennings, S. VanderKooi, and three anonymous
reviewers. This project was funded by the U.S. Bureau
of Reclamation Interagency Agreement 06AA204053
and the U.S. Geological Survey. Any use of trade
names is for descriptive purposes only and does not
imply endorsement by the U.S. Government.
References
Anderson, D. R. 2008. Model-based inference in the life
sciences: a primer on evidence. Springer, New York.
Bunnell, D. B., J. J. Isely, K. H. Burrell, and D. H. VanLear.
1998. Diel movement of brown trout in a southern
Appalachian river. Transactions of the American Fisher-
ies Society 127:630–636.
Cooke, S. J., C. M. Bunt, S. J. Hamilton, C. A. Jennings, M. P.
Pearson, M. S. Cooperman, and D. F. Markle. 2005.
Threats, conservation strategies, and prognosis for
suckers (Catostomidae) in North America: insights from
regional case studies of a diverse family of non–game
fishes. Biological Conservation 121:317–331.
Derby, C. E., and J. R. Lovvorn. 1997. Predation on fish by
cormorants and pelicans in a cold-water river: a field and
modeling study. Canadian Journal of Fisheries and
Aquatic Sciences 54:1480–1493.
Eilers, J. M., J. Kann, J. Cornett, K. Moser, and A. St. Amand.
2004. Paleolimnological evidence of change in a shallow,
hypereutrophic lake: Upper Klamath Lake, Oregon,
USA. Hydrobiologia 520:7–18.
Findholt, S. L., and S. H. Anderson. 1995. Diet and prey use
patterns of the American white pelican (Pelecanuserythrorhynchos) nesting at Pathfinder Reservoir,
Wyoming. Colonial Waterbirds 18:58–68.
Isaak, D. J., and T. C. Bjornn. 1996. Movement of northern
squawfish in the tailrace of a lower Snake River dam
relative to the migration of juvenile anadromous
salmonids. Transactions of the American Fisheries
Society 125:780–793.
Kann, J. 1998. Ecology and water quality dynamics of a
shallow hypereutrophic lake dominated by cyanobacteria
(Aphanizomenon flos-aquae). Doctoral dissertation. Uni-
versity of North Carolina, Chapel Hill.
Kann, J., and V. H. Smith. 1999. Estimating the probability of
exceeding elevated pH values critical to fish populations
in a hypereutrophic lake. Canadian Journal of Fisheries
and Aquatic Sciences 56:2262–2270.
Kann, J., and E. B. Welch. 2005. Wind control on water
quality in shallow, hypereutrophic Upper Klamath Lake,
Oregon. Lake and Reservoir Management 21:149–158.
Kernohan, B. J., R. A. Gitzen, and J. J. Millspaugh. 2001.
Analysis of animal space use and movements. Pages
125–166 in J. J. Millspaugh and J. M. Marzluff, editors.
Radio tracking and animal populations. Academic Press,
San Diego, California.
Loftus, M. E. 2001. Assessment of potential water quality
stress to fish. Report by R2 Resource Consultants to U.S.
Bureau of Indian Affairs, Portland, Oregon.
LOST RIVER AND SHORTNOSE SUCKERS IN UPPER KLAMATH LAKE 167
Maule, A. G., R. A. Tripp, S. L. Kaattari, and C. B. Schreck.
1989. Stress alters immune function and disease
resistance in Chinook salmon (Oncorhynchus tshawyt-scha). Journal of Endocrinology 120:135–142.
Moyle, P. B. 2002. Inland fishes of California, revised and
expanded. University of California Press, Berkeley.
NRC (National Research Council). 2004. Endangered and
threatened fishes in the Klamath River basin: causes of
decline and strategies for recovery. National Academy
Press, Washington, D.C.
Perkins, D. L., J. Kann, and G. G. Scoppettone. 2000. The role
of poor water quality and fish kills in the decline of
endangered Lost River and shortnose suckers in Upper
Klamath Lake. U.S. Geological Survey, Biological
Resources Division, Report submitted to the U.S. Bureau
of Reclamation, Contract 4-AA-29-12160, Klamath
Falls, Oregon.
Reiser, D. W., M. Loftus, D. Chapin, E. Jeanes, and K. Oliver.
2001. Effects of water quality and lake level on the
biology and habitat of selected fish species in Upper
Klamath Lake. Report the Bureau of Indian Affairs,
Portland, Oregon.
Ross, M. J., and C. F. Kleiner. 1982. Shielded-needle
technique for surgically implanting radio-frequency
transmitters in fish. Progressive Fish-Culturist 44:41–43.
Saiki, M. K., D. P. Monda, and B. L. Bellerud. 1999. Lethal
levels of selected water quality variables to larval and
juvenile Lost River and shortnose suckers. Environmen-
tal Pollution 105:37–44.
Scoppettone, G. G., and G. Vinyard. 1991. Life history and
management of four endangered lacustrine suckers.
Pages 359–377 in W. L. Minckley and J. E. Deacon,
editors. Battle against extinction: native fish management
in the American West. University of Arizona Press,
Tucson.
Scoppettone, G. G., P. H. Rissler, D. Withers, and M. C.
Fabes. 2006. Fish tag recovery from the American white
pelican nesting colony on Anaho Island, Pyramid Lake,
Nevada. Great Basin Birds 8:6–10.
Seaman, D. E., and R. A. Powell. 1996. An evaluation of the
accuracy of kernel density estimators for home range
analysis. Ecology 77:2075–2085.
Snyder, D. T., and J. L. Morace. 1997. Nitrogen and
phosphorus loading from drained wetlands adjacent to
Upper Klamath and Agency lakes, Oregon. U.S.
Geological Survey Water-Resources Investigations Re-
port 97-4059.
Sokal, R. R., and F. J. Rohlf. 1995. Biometry, 3rd edition.
Freeman, New York.
Summerfelt, R. C., and L. S. Smith. 1990. Anesthesia,
surgery, and related techniques. Pages 213–272 in C. B.
Schreck and P. B. Moyle, editors. Methods for fish
biology. American Fisheries Society, Bethesda, Mary-
land.
Terwilliger, M. R., D. F. Markle, and J. Kann. 2003.
Associations between water quality and daily growth of
juvenile shortnose and Lost River suckers in Upper
Klamath Lake, Oregon. Transactions of the American
Fisheries Society 132:691–708.
USBR (U.S. Bureau of Reclamation). 1997. Upper Klamath
Lake agency lake data collection and processing protocol
for May–June 1996 bathymetric mapping project. USBR,
Flagstaff, Arizona.
USFWS (U.S. Fish and Wildlife Service). 1993. Lost River
(Deltistes luxatus) and shortnose (Chasmistes brevirost-ris) sucker recovery plan. USFWS, Portland, Oregon.
USGS (U.S. Geological Survey). 1997. National field manual
for the collection of water quality data. U.S. Geological
Survey, Techniques of Water-Resources Investigations,
book 9, chapters A1–A9, Washington, D.C. Available:
http://pubs.water.usgs.gov/. (August 2007)
Vokoun, J. C. 2003. Kernel density estimates of linear home
ranges for stream fishes: advantages and data require-
ments. North American Journal of Fisheries Management
23:1020–1029.
Walsh, M. G., K. A. Bjorgo, and J. J. Isely. 2000. Effects of
implantation method and temperature on mortality and
loss of simulated transmitters in hybrid striped bass.
Transactions of the American Fisheries Society 129:539–
544.
Wedemeyer, G. A., B. A. Barton, and D. J. McLeay. 1990.
Stress and acclimation. Pages 451–489 in C. B. Schreck
and P. B. Moyle, editors. Methods for fish biology.
American Fisheries Society, Bethesda, Maryland.
Winter, J. D. 1996. Advances in underwater biotelemetry.
Pages 555–590 in B. R. Murphy and D. W. Willis,
editors. Fisheries techniques, 2nd edition. American
Fisheries Society, Bethesda, Maryland.
Wood, T. M., G. R. Hoilman, and M. K. Lindenberg. 2006.
Water quality conditions in Upper Klamath Lake,
Oregon, 2002–04. U.S. Geological Survey Scientific
Investigations Report 2006-5209.
Worton, B. J. 1989. Kernel methods for estimating the
utilization distribution in home range studies. Ecology
70:164–168.
168 BANISH ET AL.