Embed Size (px)
Citation preview

District Heating and
Electricity Tariff and
Affordability Analysis
FINAL
World Bank
October 2015

Foreword
This study was financed by Energy Sector Management Assistance Program (ESMAP) and conducted by a team lead by the World Bank Energy and Extractives Global Practice, with team members drawn from Poverty Global Practice and Social Protection and Labor Global Practice.
The objective of the study is to:1. Assess the adequacy of the existing heat and electricity tariff levels for achieving
financial viability of the energy sector operators
2. Analyze the distributional implications of energy tariff increases
3. Assess the effectiveness of the existing social assistance programs and how to adjust them to mitigate the impact of energy tariff increase on the poor
This report presents the key findings and recommendations for the government of Moldova as well as other energy sector stakeholders. The report starts with a synopsis that summarizes the key findings and recommendations. The main report section starts with an introduction to country context, presents the design of tariff setting methodologies and assesses the adequacy of tariffs based on constructed scenarios. Thereafter analysis of the distributional impact of projected range of tariff increases and the need to adjust the social assistance programs to mitigate the impact on the poor are presented. The report concludes with recommendations for the government on actions to be implemented on tariff setting methodologies and social assistance as well as areas for further research. Appendices include further background information of the analysis.
2
Synopsis
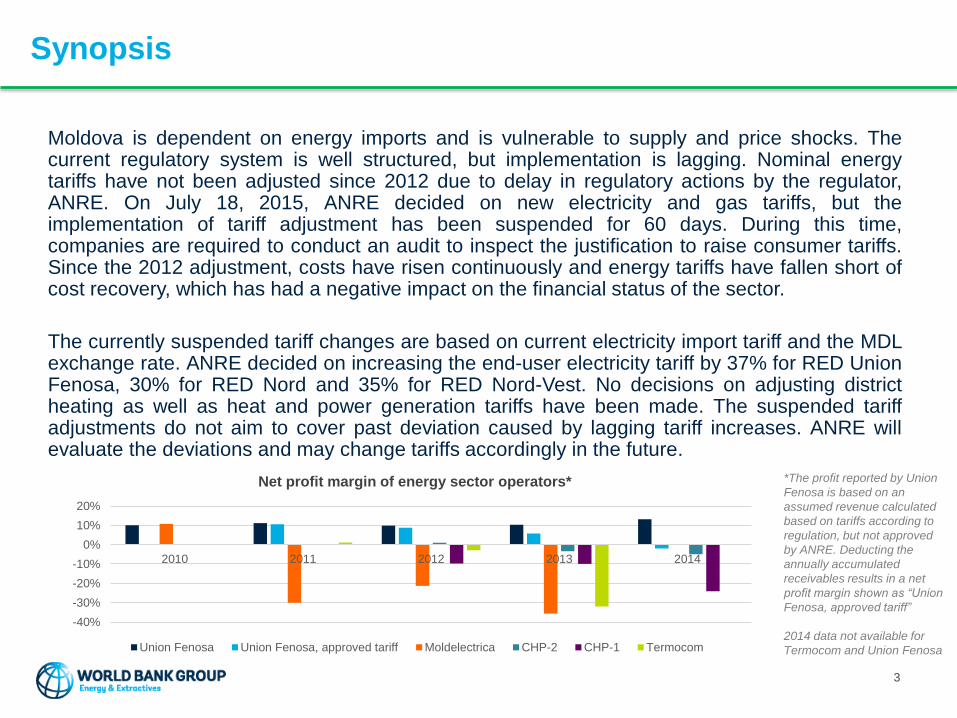
Moldova is dependent on energy imports and is vulnerable to supply and price shocks. Thecurrent regulatory system is well structured, but implementation is lagging. Nominal energytariffs have not been adjusted since 2012 due to delay in regulatory actions by the regulator,ANRE. On July 18, 2015, ANRE decided on new electricity and gas tariffs, but theimplementation of tariff adjustment has been suspended for 60 days. During this time,companies are required to conduct an audit to inspect the justification to raise consumer tariffs.Since the 2012 adjustment, costs have risen continuously and energy tariffs have fallen short ofcost recovery, which has had a negative impact on the financial status of the sector.
The currently suspended tariff changes are based on current electricity import tariff and the MDLexchange rate. ANRE decided on increasing the end-user electricity tariff by 37% for RED UnionFenosa, 30% for RED Nord and 35% for RED Nord-Vest. No decisions on adjusting districtheating as well as heat and power generation tariffs have been made. The suspended tariffadjustments do not aim to cover past deviation caused by lagging tariff increases. ANRE willevaluate the deviations and may change tariffs accordingly in the future.
3
-40%
-30%
-20%
-10%
0%
10%
20%
2010 2011 2012 2013 2014
Net profit margin of energy sector operators*
Union Fenosa Union Fenosa, approved tariff Moldelectrica CHP-2 CHP-1 Termocom
*The profit reported by Union
Fenosa is based on an
assumed revenue calculated
based on tariffs according to
regulation, but not approved
by ANRE. Deducting the
annually accumulated
receivables results in a net
profit margin shown as “Union
Fenosa, approved tariff”
2014 data not available for
Termocom and Union Fenosa
Synopsis
4
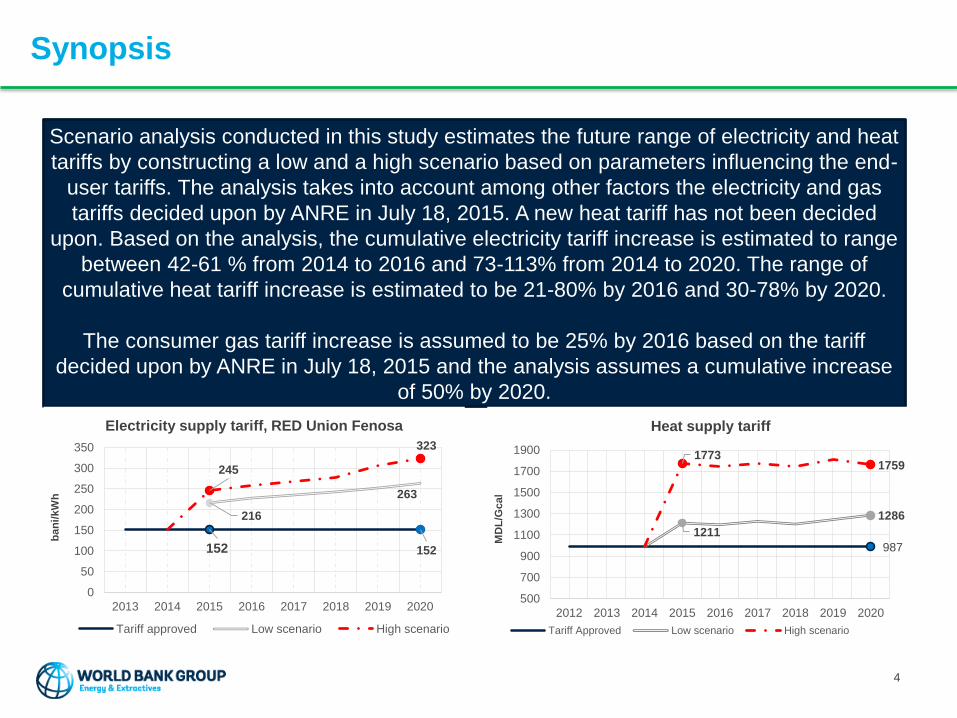
Scenario analysis conducted in this study estimates the future range of electricity and heat
tariffs by constructing a low and a high scenario based on parameters influencing the end-
user tariffs. The analysis takes into account among other factors the electricity and gas
tariffs decided upon by ANRE in July 18, 2015. A new heat tariff has not been decided
upon. Based on the analysis, the cumulative electricity tariff increase is estimated to range
between 42-61 % from 2014 to 2016 and 73-113% from 2014 to 2020. The range of
cumulative heat tariff increase is estimated to be 21-80% by 2016 and 30-78% by 2020.
The consumer gas tariff increase is assumed to be 25% by 2016 based on the tariff
decided upon by ANRE in July 18, 2015 and the analysis assumes a cumulative increase
of 50% by 2020.
152 152
216
263
245
323
0
50
100
150
200
250
300
350
2013 2014 2015 2016 2017 2018 2019 2020
Electricity supply tariff, RED Union Fenosa
Tariff approved Low scenario High scenario
ba
ni/
kW
h
987
1211
1286
17731759
500
700
900
1100
1300
1500
1700
1900
2012 2013 2014 2015 2016 2017 2018 2019 2020
Heat supply tariff
Tariff Approved Low scenario High scenario
MD
L/G
cal
Synopsis
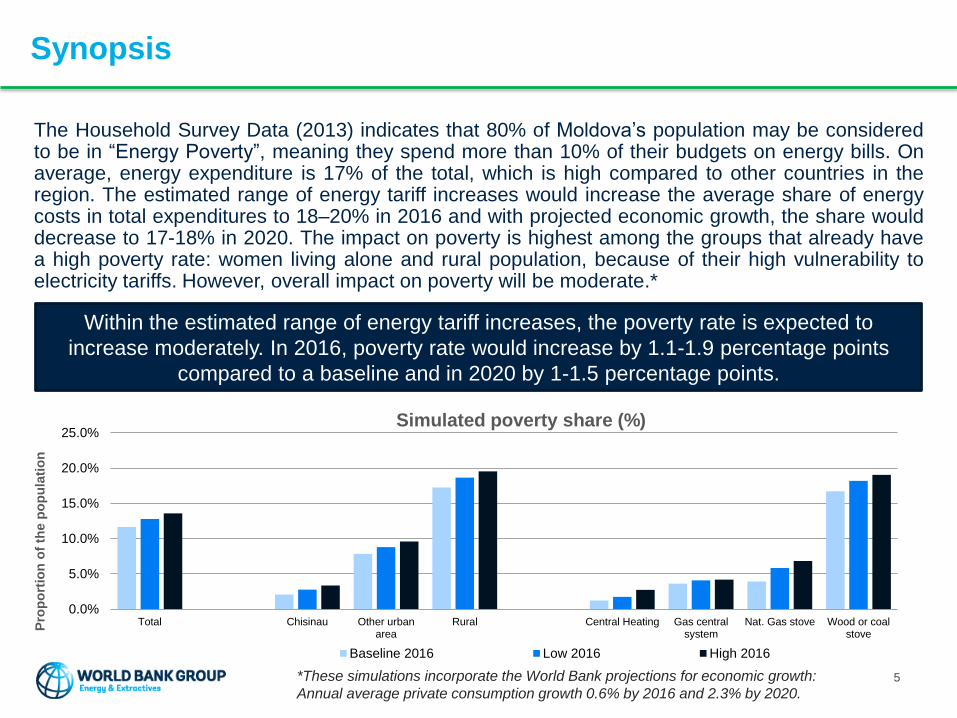
The Household Survey Data (2013) indicates that 80% of Moldova’s population may be consideredto be in “Energy Poverty”, meaning they spend more than 10% of their budgets on energy bills. Onaverage, energy expenditure is 17% of the total, which is high compared to other countries in theregion. The estimated range of energy tariff increases would increase the average share of energycosts in total expenditures to 18–20% in 2016 and with projected economic growth, the share woulddecrease to 17-18% in 2020. The impact on poverty is highest among the groups that already havea high poverty rate: women living alone and rural population, because of their high vulnerability toelectricity tariffs. However, overall impact on poverty will be moderate.*
Within the estimated range of energy tariff increases, the poverty rate is expected to
increase moderately. In 2016, poverty rate would increase by 1.1-1.9 percentage points
compared to a baseline and in 2020 by 1-1.5 percentage points.
5*These simulations incorporate the World Bank projections for economic growth:
Annual average private consumption growth 0.6% by 2016 and 2.3% by 2020.
0.0%
5.0%
10.0%
15.0%
20.0%
25.0%
Total Chisinau Other urbanarea
Rural Central Heating Gas centralsystem
Nat. Gas stove Wood or coalstove
Pro
po
rtio
n o
f th
e p
op
ula
tio
n
Simulated poverty share (%)
Baseline 2016 Low 2016 High 2016

Synopsis
The projected poverty impacts of higher tariffs would increase the need for social assistance. The
national level social assistance programs, Ajutor Social and Heating Allowance, are generally well
targeted, but the programs could be improved to increase uptake and provide more support to
poorest population. To ensure adequacy of social assistance, the threshold and benefit size of the
programs should be adjusted in line with the increasing energy costs, which will have fiscal
implications.
6
0.0%
0.5%
1.0%
1.5%
2.0%
2.5%
2016 2020
% o
f G
DP
Fiscal impact of social assistance
AS+HA budget, current take-up, low scenario AS+HA budget, perfect take-up, low scenario
AS+HA budget, current take-up, high scenario AS+HA budget, perfect take-up, high scenario
Adjusting social assistance in line with the estimated energy cost increases, would increase
social program share of government budget from 0.5% of GDP to 1.9-2.2% in 2016 and
1.3-1.7% in 2020 assuming that all eligible people apply for assistance.
In case the take-up remains at the same level, social program share of GDP would increase
to 0.7-0.8% in 2016 and decrease to 0.5-0.6% in 2020.
Synopsis
Conclusions:
Under the current situation, the security of energy supply and the sustainable development of the sector arejeopardized due to the risk of service disruptions and the lack of capital for needed investments in theinfrastructure. The delay in regulatory actions has led to loss of confidence and credibility in the institutionand process of the tariff setting regime. Restoring confidence in the system is urgently needed to provide foran investment climate that would attract the badly needed capital to Moldova. The Government needs tourgently take action to ensure the financial viability of the energy sector, such as pass through mechanismfor fuel costs and forex volatility. The impact of the needed tariff increase on poverty rate is expected to bemoderate. However, the Government should plan and budget to mitigate the impact of tariff increase on themost vulnerable population by adjusting the targeted social assistance programs, Ajutor Social and HeatingAllowance, and by increasing the take-up among poorest population. To accommodate increased fiscal costof targeted social assistance, the Government is recommended to consolidate other categorical benefits.
Recommendations:
• Consider introduction of automatic pass through mechanism for fuel and electricity costs and other measures to ensure timely tariff adjustment.
• For the recovery of past deviation, consider an approach to adjust tariffs over multiple year period in agreement with regulated companies to limit impact of tariff increase on the vulnerable.
• Improve targeted coverage of the social assistance for the poor, adjust threshold and benefit size to be in line with increasing energy costs, and improve targeting to control the fiscal impact of increased need.
• Design a plan to communicate about the planned tariff adjustments, their reasons and available social assistance.
• Develop detailed approach to how the above may be implemented.
7

Outline
• Introduction
• Design of heat and electricity tariff setting methodologies
• Tariff adequacy and forecast of tariffs
• Distributional impacts of tariff adjustments
• Social protection
• Conclusions
• Recommendations for government
• Appendices• Appendix 1 – Detailed analysis of tariff setting methodologies
• Appendix 2 – Detailed scenario analysis and sensitivity analysis of heat and electricity tariffs
• Appendix 3 – Recommendations on tariff methodology and implementation
• Appendix 4 – Detailed analysis of relations of heating type and poverty
• Appendix 5 – Detailed analysis and conclusions on social protection
• Appendix 6 – Summary of scenario analysis
8
INTRODUCTION
9

Moldova is highly dependent on imported electricity and
fuel
0
500
1000
1500
2000
2500
3000
3500
4000
4500
5000
1997 1998 1999 2000 2001 2002 2003 2004 2005 2006 2007 2008 2009 2010 2011 2012 2013
MW
h
Electricity generation and import in Moldova
Domestic electricity generation Electricity generation in Transnistria Electricity import
In 2013:
• 82 % of electricity was imported
• 93 % of domestic electricity generation was based on imported fuel
• 100 % of centralized heat production was based on imported fuel
10

The exchange rate is the main driver of recent electricity
tariff increase and drives the need for heat tariff adjustment
0
100
200
300
400
500
600
2000 2001 2002 2003 2004 2005 2006 2007 2008 2009 2010 2011 2012 2013 2014 2015 2016 2017 2018 2019 2020 2021 2022 2023 2024 2025
US
D/
1000 m
3
Natural gas price, Europe
0
5
10
15
20
25
1/1/2010 1/1/2011 1/1/2012 1/1/2013 1/1/2014 1/1/2015
MDL/USD exchange rate
Heat supply tariff set
Electricity supply tariff set for Union Fenosa
Heat supply tariff set
Electricity supply tariff set for Union Fenosa
- 26 %
+33 %
Fuel and imported
power are
purchased in USD
Need to raise electricity and heat
supply tariffs
Request for natural
gas tariff update
from MoldovaGaz
11
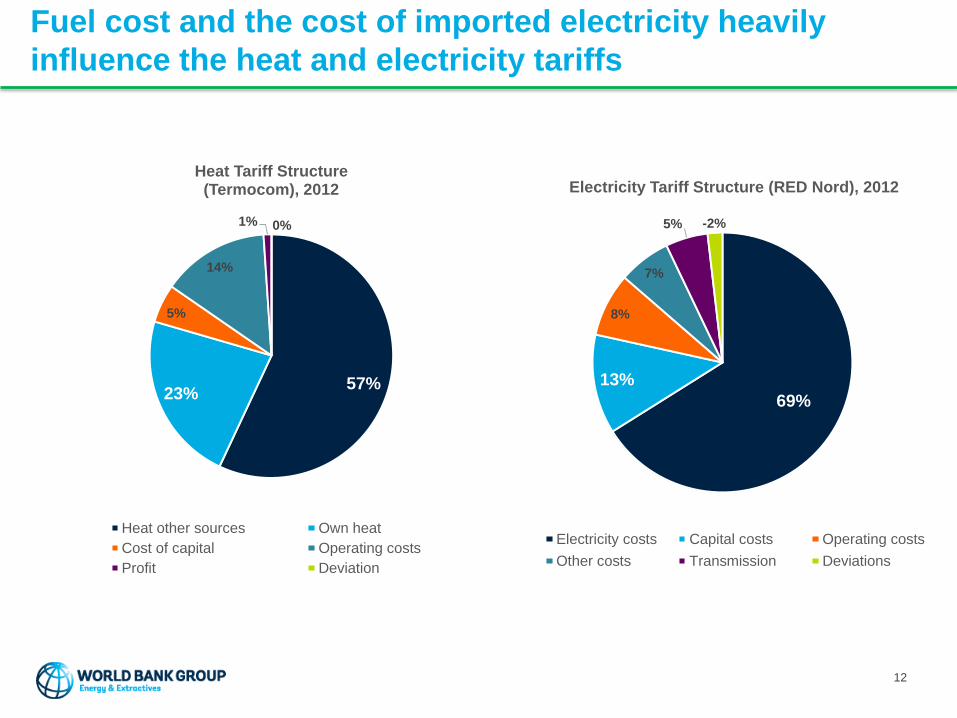
Fuel cost and the cost of imported electricity heavily
influence the heat and electricity tariffs
57%23%
5%
14%
1% 0%
Heat Tariff Structure (Termocom), 2012
Heat other sources Own heat
Cost of capital Operating costs
Profit Deviation
12
69%
13%
8%
7%
5% -2%
Electricity Tariff Structure (RED Nord), 2012
Electricity costs Capital costs Operating costs
Other costs Transmission Deviations
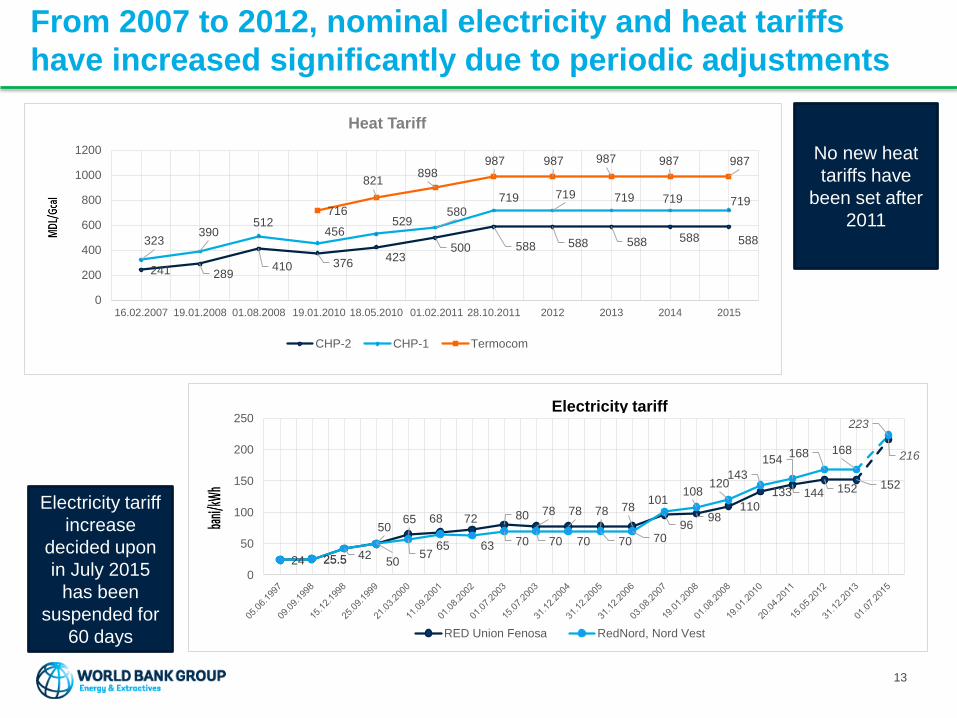
From 2007 to 2012, nominal electricity and heat tariffs
have increased significantly due to periodic adjustments
No new electricity tariffs
have been set after 2012*
241 289410 376
423500 588 588 588 588 588323
390512
456529
580
719 719 719 719 719716
821898
987 987 987 987 987
0
200
400
600
800
1000
1200
16.02.2007 19.01.2008 01.08.2008 19.01.2010 18.05.2010 01.02.2011 28.10.2011 2012 2013 2014 2015
Heat Tariff
CHP-2 CHP-1 Termocom
Electricity tariff
increase
decided upon
in July 2015
has been
suspended for
60 days
No new heat
tariffs have
been set after
2011
13
24 25.5
5065 68 72 80 78 78 78 78
9698
110
133 144 152 152
216
25.5 4250
5765 63 70 70 70 70 70
101108
120143
154168 168
223
0
50
100
150
200
250
RED Union Fenosa RedNord, Nord Vest
Electricity tariff
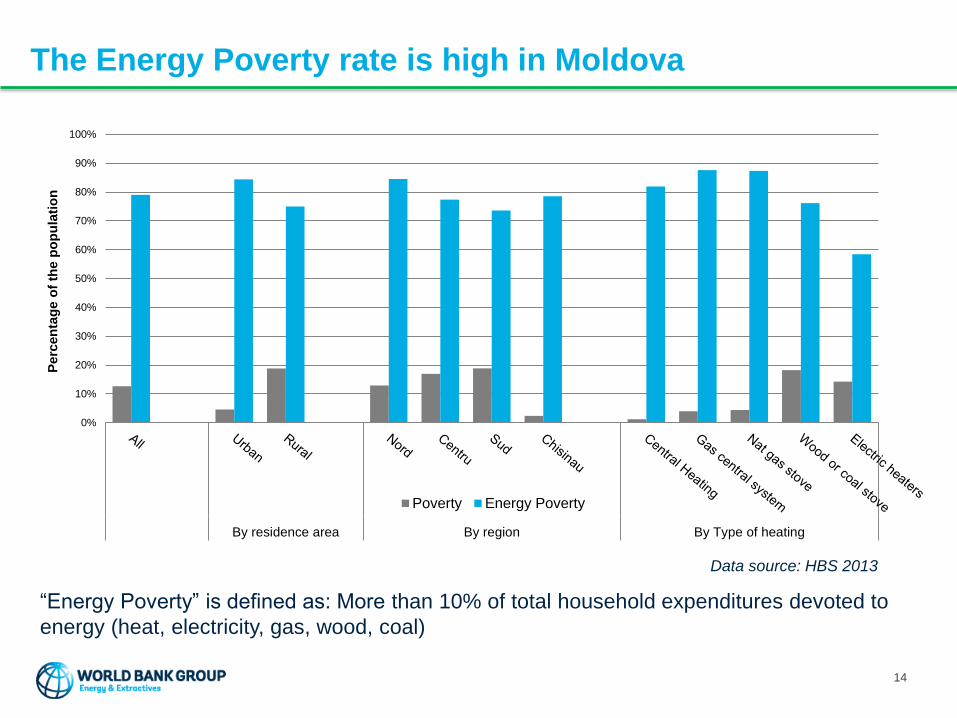
The Energy Poverty rate is high in Moldova
“Energy Poverty” is defined as: More than 10% of total household expenditures devoted to
energy (heat, electricity, gas, wood, coal)
0%
10%
20%
30%
40%
50%
60%
70%
80%
90%
100%
By residence area By region By Type of heating
Perc
en
tag
e o
f th
e p
op
ula
tio
n
Poverty Energy Poverty
14
Data source: HBS 2013
Well-targeted social protection measures can play an
important role also in improving energy affordability
• Targeting of social protection improved in Moldova in 2009• However, most social assistance benefits are provided to certain
groups of beneficiaries regardless of their welfare.
• Since 2009, the country has launched two cash transfers targeting the poor and has eliminated a few inefficient categorical benefits.
• This resulted in declined spending from 2.6% of GDP to 1.6% and more pro-poor benefits distribution.
• However, after 2012, some policies were reversed• Targeted benefits were reduced and categorical transfers were boosted
• There is need to improve the existing social protection schemes
• The targeted transfers need to be expanded to offer a safety net to the poorest households and cushion income shocks, including those stemming form higher energy costs.
15

DESIGN OF HEAT AND ELECTRICITY TARIFF SETTING
METHODOLOGIES
16
Moldova has established regulatory structures and aims
to implement the core EU energy legislation
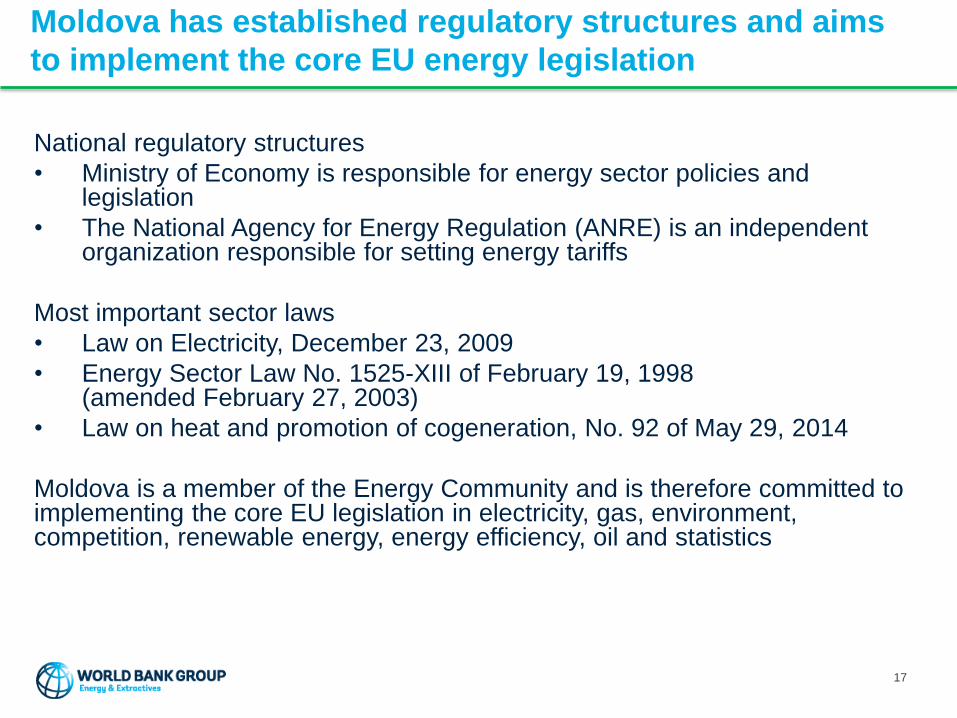
National regulatory structures
• Ministry of Economy is responsible for energy sector policies and legislation
• The National Agency for Energy Regulation (ANRE) is an independent organization responsible for setting energy tariffs
Most important sector laws
• Law on Electricity, December 23, 2009
• Energy Sector Law No. 1525-XIII of February 19, 1998 (amended February 27, 2003)
• Law on heat and promotion of cogeneration, No. 92 of May 29, 2014
Moldova is a member of the Energy Community and is therefore committed to implementing the core EU legislation in electricity, gas, environment, competition, renewable energy, energy efficiency, oil and statistics
17
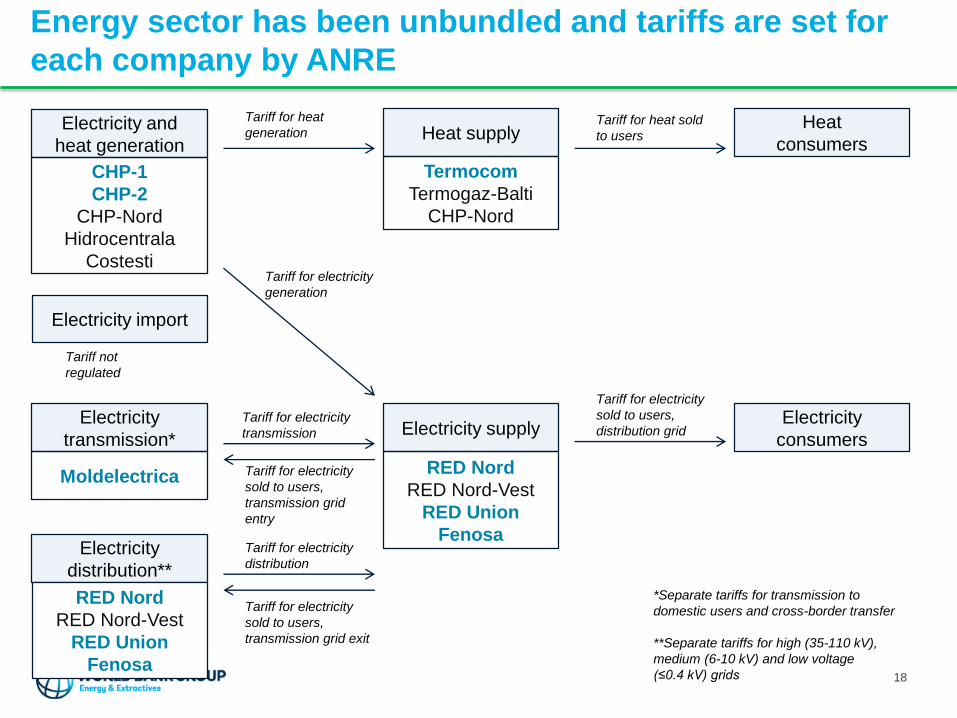
Energy sector has been unbundled and tariffs are set for
each company by ANRE
Electricity and
heat generation
Electricity
transmission*
Electricity
distribution**
Electricity supply
Heat supply
Moldelectrica
CHP-1
CHP-2
CHP-Nord
Hidrocentrala
Costesti
RED Nord
RED Nord-Vest
RED Union
Fenosa
Termocom
Termogaz-Balti
CHP-Nord
RED Nord
RED Nord-Vest
RED Union
Fenosa
Electricity import
Electricity
consumers
Heat
consumers
Tariff for electricity
sold to users,
distribution grid
Tariff for electricity
sold to users,
transmission grid
entry
Tariff for electricity
distribution
Tariff for electricity
transmission
Tariff for electricity
generation
Tariff for heat
generationTariff for heat sold
to users
Tariff for electricity
sold to users,
transmission grid exit
Tariff not
regulated
*Separate tariffs for transmission to
domestic users and cross-border transfer
**Separate tariffs for high (35-110 kV),
medium (6-10 kV) and low voltage
(≤0.4 kV) grids 18
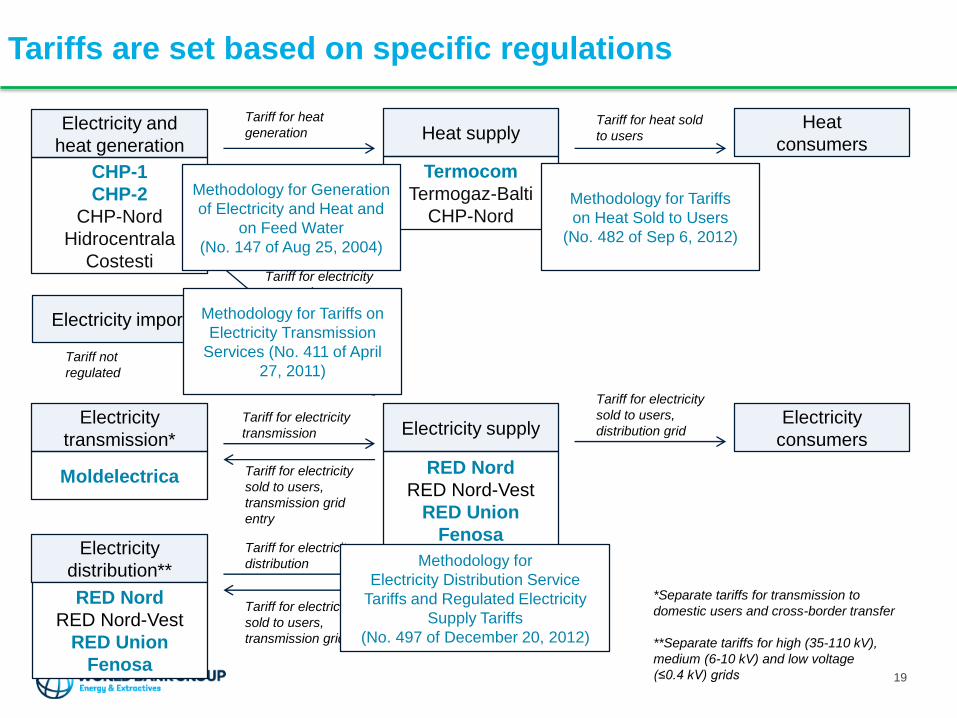
Tariffs are set based on specific regulations
Electricity and
heat generation
Electricity
transmission*
Electricity
distribution**
Electricity supply
Heat supply
Moldelectrica
RED Nord
RED Nord-Vest
RED Union
Fenosa
RED Nord
RED Nord-Vest
RED Union
Fenosa
Electricity import
Electricity
consumers
Heat
consumers
Tariff for electricity
sold to users,
distribution grid
Tariff for electricity
sold to users,
transmission grid
entry
Tariff for electricity
distribution
Tariff for electricity
transmission
Tariff for electricity
generation
Tariff for heat
generationTariff for heat sold
to users
Tariff for electricity
sold to users,
transmission grid exit
Tariff not
regulated
Methodology for
Electricity Distribution Service
Tariffs and Regulated Electricity
Supply Tariffs
(No. 497 of December 20, 2012)
Methodology for Tariffs on
Electricity Transmission
Services (No. 411 of April
27, 2011)
19
*Separate tariffs for transmission to
domestic users and cross-border transfer
**Separate tariffs for high (35-110 kV),
medium (6-10 kV) and low voltage
(≤0.4 kV) grids
CHP-1
CHP-2
CHP-Nord
Hidrocentrala
Costesti
Termocom
Termogaz-Balti
CHP-Nord
Methodology for Generation
of Electricity and Heat and
on Feed Water
(No. 147 of Aug 25, 2004)
Methodology for Tariffs
on Heat Sold to Users
(No. 482 of Sep 6, 2012)
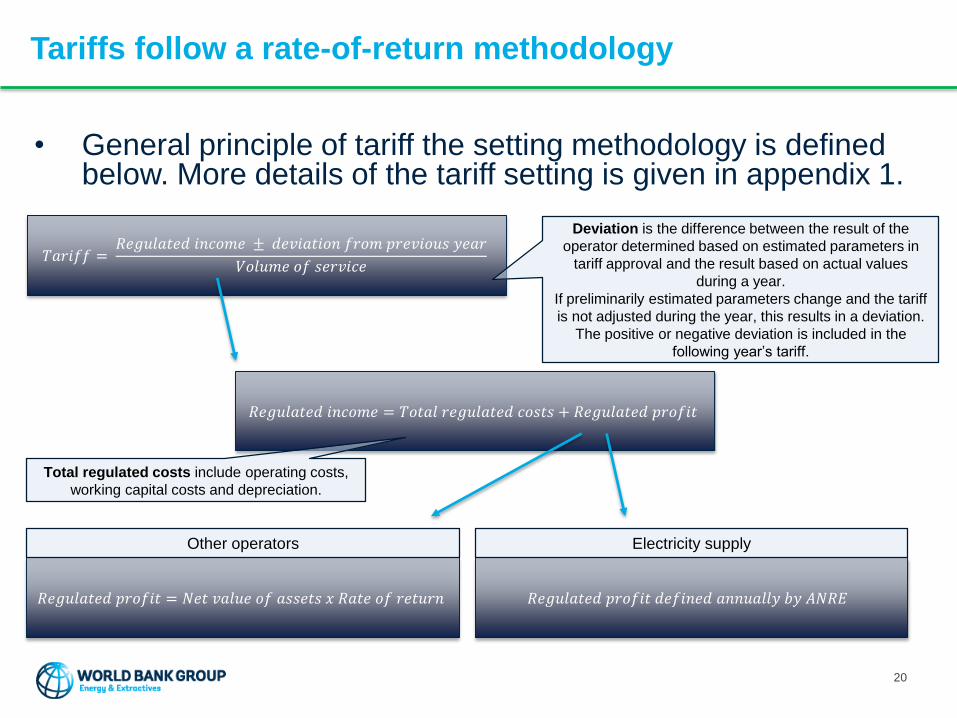
Tariffs follow a rate-of-return methodology
𝑇𝑎𝑟𝑖𝑓𝑓 =𝑅𝑒𝑔𝑢𝑙𝑎𝑡𝑒𝑑 𝑖𝑛𝑐𝑜𝑚𝑒 ± 𝑑𝑒𝑣𝑖𝑎𝑡𝑖𝑜𝑛 𝑓𝑟𝑜𝑚 𝑝𝑟𝑒𝑣𝑖𝑜𝑢𝑠 𝑦𝑒𝑎𝑟
𝑉𝑜𝑙𝑢𝑚𝑒 𝑜𝑓 𝑠𝑒𝑟𝑣𝑖𝑐𝑒
𝑅𝑒𝑔𝑢𝑙𝑎𝑡𝑒𝑑 𝑖𝑛𝑐𝑜𝑚𝑒 = 𝑇𝑜𝑡𝑎𝑙 𝑟𝑒𝑔𝑢𝑙𝑎𝑡𝑒𝑑 𝑐𝑜𝑠𝑡𝑠 + 𝑅𝑒𝑔𝑢𝑙𝑎𝑡𝑒𝑑 𝑝𝑟𝑜𝑓𝑖𝑡
𝑅𝑒𝑔𝑢𝑙𝑎𝑡𝑒𝑑 𝑝𝑟𝑜𝑓𝑖𝑡 = 𝑁𝑒𝑡 𝑣𝑎𝑙𝑢𝑒 𝑜𝑓 𝑎𝑠𝑠𝑒𝑡𝑠 𝑥 𝑅𝑎𝑡𝑒 𝑜𝑓 𝑟𝑒𝑡𝑢𝑟𝑛
Deviation is the difference between the result of the
operator determined based on estimated parameters in
tariff approval and the result based on actual values
during a year.
If preliminarily estimated parameters change and the tariff
is not adjusted during the year, this results in a deviation.
The positive or negative deviation is included in the
following year’s tariff.
Total regulated costs include operating costs,
working capital costs and depreciation.
𝑅𝑒𝑔𝑢𝑙𝑎𝑡𝑒𝑑 𝑝𝑟𝑜𝑓𝑖𝑡 𝑑𝑒𝑓𝑖𝑛𝑒𝑑 𝑎𝑛𝑛𝑢𝑎𝑙𝑙𝑦 𝑏𝑦 𝐴𝑁𝑅𝐸
Electricity supplyOther operators
20
• General principle of tariff the setting methodology is defined below. More details of the tariff setting is given in appendix 1.

Main finding: Tariff regulation is based on global good
practices, but further capital attraction is needed
• Heat and power tariff setting has been mainly well defined and they are based on a global good practice, rate of return methodology
• Electricity and heat generation tariff setting methodology is not as well defined and lacks a definition for a rate of return
• Both heat and power sector have high investment needs in the future and therefore attraction of capital with a fair return is necessary
• District heating and natural gas tariff revision should go in parallel, otherwise increasing the heat tariff may lead to disconnections from district heating system
21
TARIFF ADEQUACY AND FORECAST OF TARIFFS
22
0
50
100
150
200
2012appr.
2012 act. 2013 act. 2014 act.
RED Nord
Electricity costs Capital costs Operating costs
Other costs Transmission Deviations
ba
ni/
kW
h
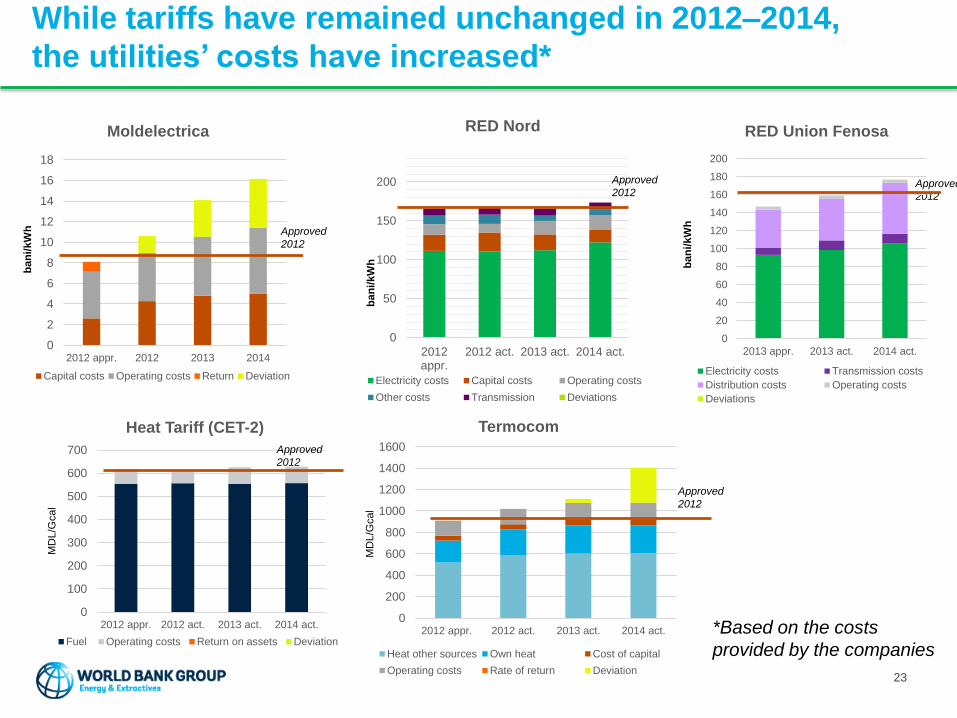
While tariffs have remained unchanged in 2012–2014,
the utilities’ costs have increased*
0
2
4
6
8
10
12
14
16
18
2012 appr. 2012 2013 2014
Moldelectrica
Capital costs Operating costs Return Deviation
ba
ni/
kW
h
0
200
400
600
800
1000
1200
1400
1600
2012 appr. 2012 act. 2013 act. 2014 act.
MD
L/G
cal
Termocom
Heat other sources Own heat Cost of capital
Operating costs Rate of return Deviation
Approved
2012
Approved
2012
*Based on the costs
provided by the companies
Approved
2012
Approved
2012
23
0
20
40
60
80
100
120
140
160
180
200
2013 appr. 2013 act. 2014 act.
RED Union Fenosa
Electricity costs Transmission costs
Distribution costs Operating costs
Deviations
ba
ni/
kW
h
0
100
200
300
400
500
600
700
2012 appr. 2012 act. 2013 act. 2014 act.
MD
L/G
cal
Heat Tariff (CET-2)
Fuel Operating costs Return on assets Deviation
Approved
2012
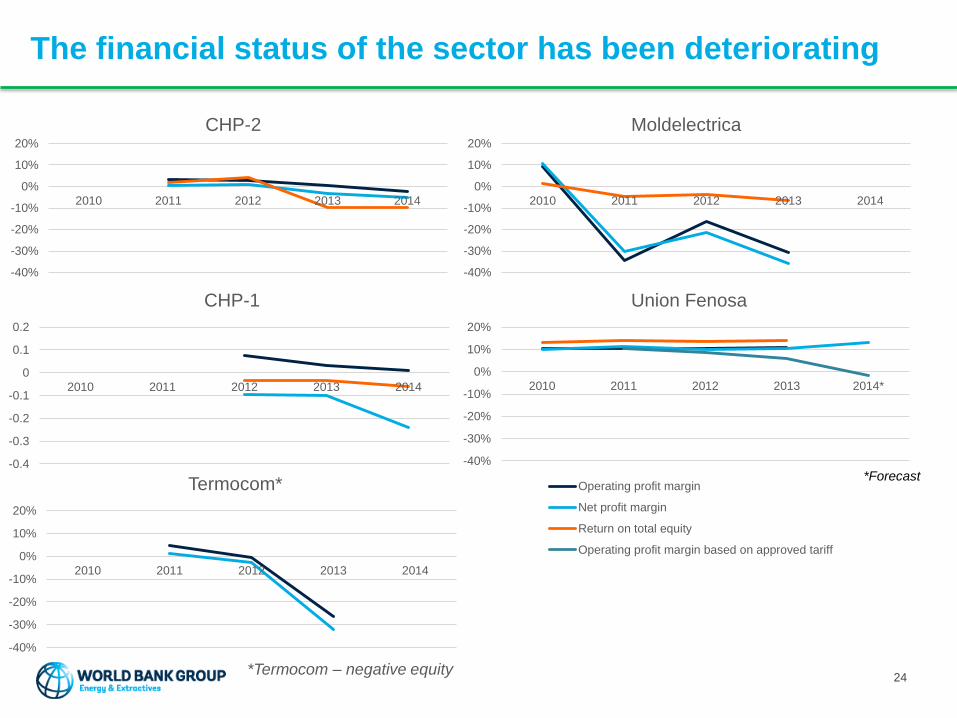
The financial status of the sector has been deteriorating
-40%
-30%
-20%
-10%
0%
10%
20%
2010 2011 2012 2013 2014
Moldelectrica
-40%
-30%
-20%
-10%
0%
10%
20%
2010 2011 2012 2013 2014
CHP-2
-40%
-30%
-20%
-10%
0%
10%
20%
2010 2011 2012 2013 2014
Termocom*
*Termocom – negative equity
-0.4
-0.3
-0.2
-0.1
0
0.1
0.2
2010 2011 2012 2013 2014
CHP-1
*Forecast
24
-40%
-30%
-20%
-10%
0%
10%
20%
2010 2011 2012 2013 2014*
Union Fenosa
Operating profit margin
Net profit margin
Return on total equity
Operating profit margin based on approved tariff
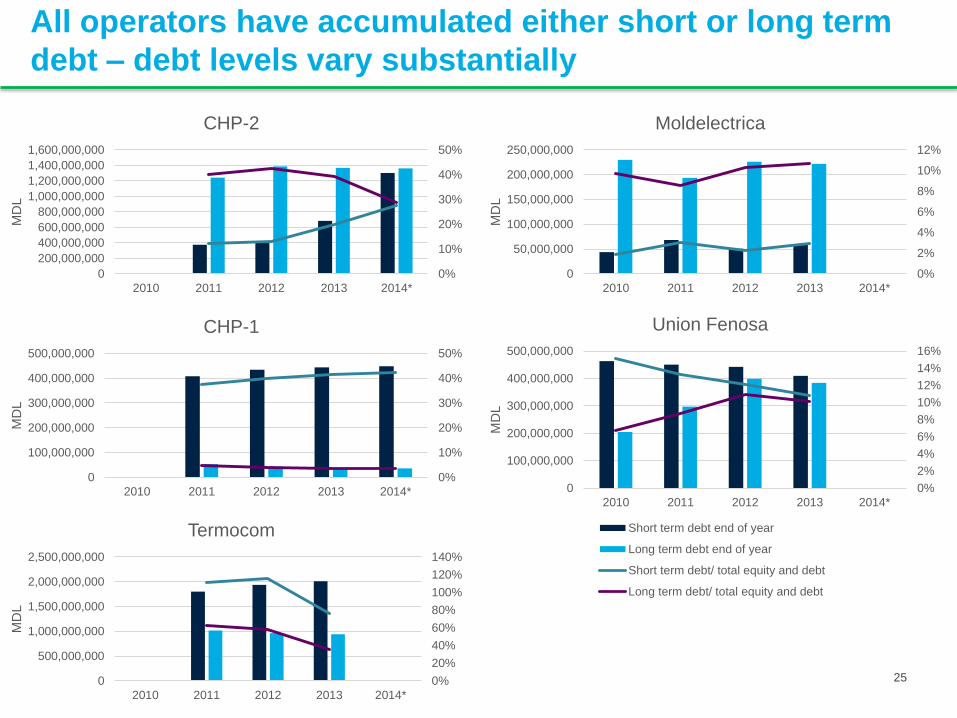
All operators have accumulated either short or long term
debt – debt levels vary substantially
0%
2%
4%
6%
8%
10%
12%
14%
16%
0
100,000,000
200,000,000
300,000,000
400,000,000
500,000,000
2010 2011 2012 2013 2014*M
DL
Union Fenosa
Short term debt end of year
Long term debt end of year
Short term debt/ total equity and debt
Long term debt/ total equity and debt
0%
2%
4%
6%
8%
10%
12%
0
50,000,000
100,000,000
150,000,000
200,000,000
250,000,000
2010 2011 2012 2013 2014*
MD
L
Moldelectrica
0%
10%
20%
30%
40%
50%
0
200,000,000
400,000,000
600,000,000
800,000,000
1,000,000,000
1,200,000,000
1,400,000,000
1,600,000,000
2010 2011 2012 2013 2014*
MD
L
CHP-2
0%
10%
20%
30%
40%
50%
0
100,000,000
200,000,000
300,000,000
400,000,000
500,000,000
2010 2011 2012 2013 2014*
MD
L
CHP-1
0%
20%
40%
60%
80%
100%
120%
140%
0
500,000,000
1,000,000,000
1,500,000,000
2,000,000,000
2,500,000,000
2010 2011 2012 2013 2014*
MD
L
Termocom
25
The estimation of future tariffs is based on scenario
analysis
• Scenario analysis aims to present potential future development of the tariffs
• The scenarios are not presented to indicate what the tariff level should be in the future, but projections based on the implementation of current tariff setting methodologies used in Moldova.
• The baseline assumption used for the analysis is that current tariff methodology is fully complied with (see information on next slide)
• Scenarios constructed and the projected consumer tariffs are presented in the following slides
• Macroeconomic and sector specific common assumptions of the scenario analysis and detailed projections of tariffs are presented in Appendix 2
26
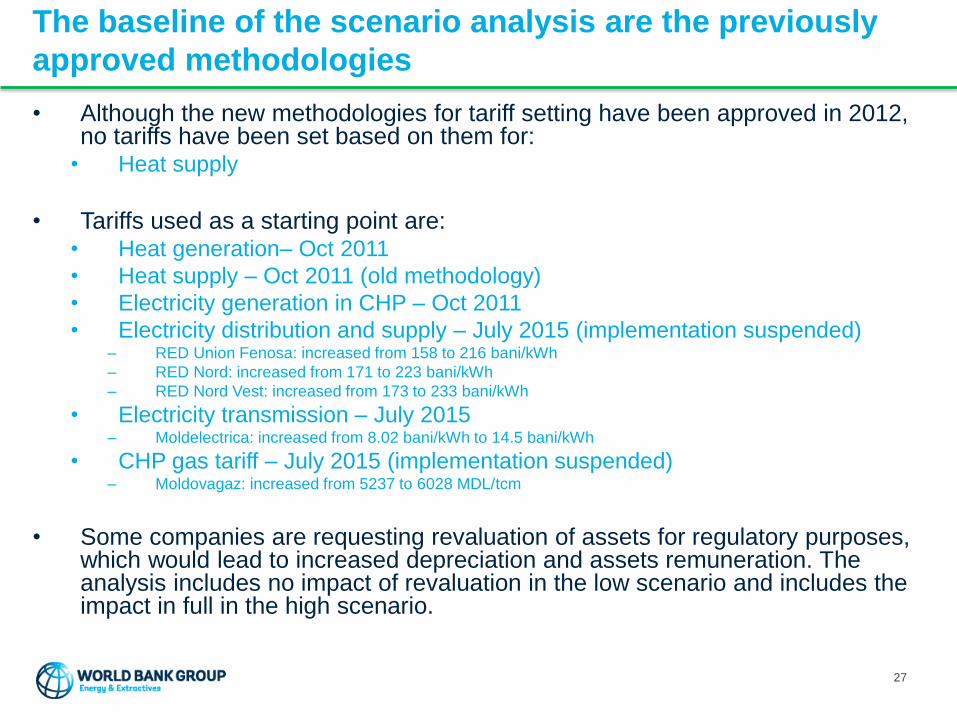
The baseline of the scenario analysis are the previously
approved methodologies
• Although the new methodologies for tariff setting have been approved in 2012, no tariffs have been set based on them for:
• Heat supply
• Tariffs used as a starting point are:• Heat generation– Oct 2011
• Heat supply – Oct 2011 (old methodology)
• Electricity generation in CHP – Oct 2011
• Electricity distribution and supply – July 2015 (implementation suspended)– RED Union Fenosa: increased from 158 to 216 bani/kWh
– RED Nord: increased from 171 to 223 bani/kWh
– RED Nord Vest: increased from 173 to 233 bani/kWh
• Electricity transmission – July 2015– Moldelectrica: increased from 8.02 bani/kWh to 14.5 bani/kWh
• CHP gas tariff – July 2015 (implementation suspended)– Moldovagaz: increased from 5237 to 6028 MDL/tcm
• Some companies are requesting revaluation of assets for regulatory purposes, which would lead to increased depreciation and assets remuneration. The analysis includes no impact of revaluation in the low scenario and includes the impact in full in the high scenario.
27

The constructed scenarios project a range of potential
tariff levels
ScenarioCommodity prices,
exchange rate
Other operating
costs
Deviation from past
yearsInvestments
Revaluation of
assets
Low scenario
Electricity: Tariff as of July 18, 2015
Heat: Gas tariff as
of July 18, 2015
Heat: As approved
in 2011 Heat: 0
Heat: BAU
(annual average)Heat: 0%
High scenario Passed throughActuals of 2014
+indices
Split to 2015-2019,
revaluation part
included
Transmission line:
2019-2020,
DH rehabilitation:
2017-2022
100%
28
• Low scenario• Based on July tariff adjustment
• Tariffs as decided by ANRE on July 18, 2015 and assumed inflation thereafter
• Heat tariff based on gas tariff as decided on July 18, 2015
• High scenario • Based on estimated maximum tariff
• Estimated high value of commodity prices, exchange rate, other operating costs and investments
• Past deviation divided to 2015-2019 tariffs
• Revaluation impact included in full
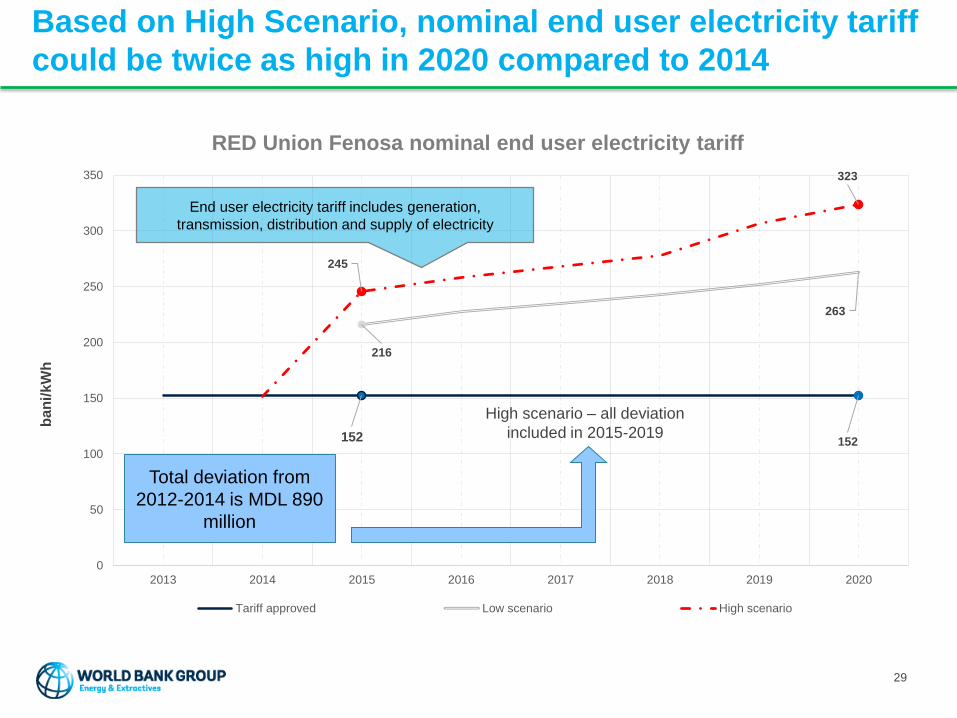
152 152
216
263
245
323
0
50
100
150
200
250
300
350
2013 2014 2015 2016 2017 2018 2019 2020
RED Union Fenosa nominal end user electricity tariff
Tariff approved Low scenario High scenario
ban
i/k
Wh
Based on High Scenario, nominal end user electricity tariff
could be twice as high in 2020 compared to 2014
End user electricity tariff includes generation,
transmission, distribution and supply of electricity
Total deviation from
2012-2014 is MDL 890
million
High scenario – all deviation
included in 2015-2019
29
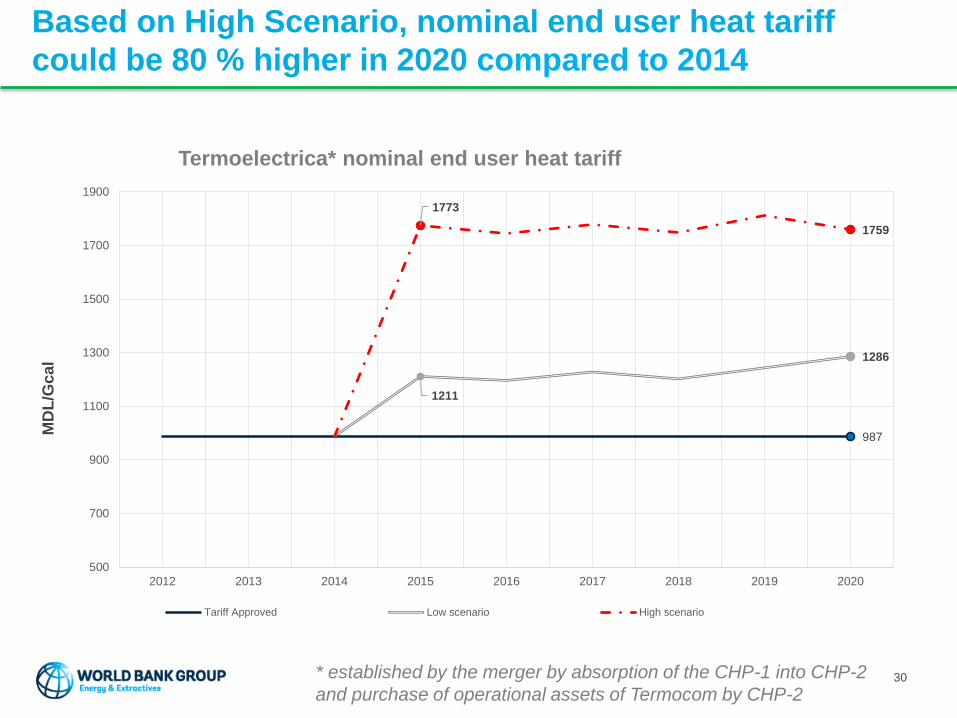
Based on High Scenario, nominal end user heat tariff
could be 80 % higher in 2020 compared to 2014
End user heat tariff includes generation
and distribution of heat.
30
987
1211
1286
1773
1759
500
700
900
1100
1300
1500
1700
1900
2012 2013 2014 2015 2016 2017 2018 2019 2020
Termoelectrica* nominal end user heat tariff
Tariff Approved Low scenario High scenario
MD
L/G
ca
l
* established by the merger by absorption of the CHP-1 into CHP-2
and purchase of operational assets of Termocom by CHP-2
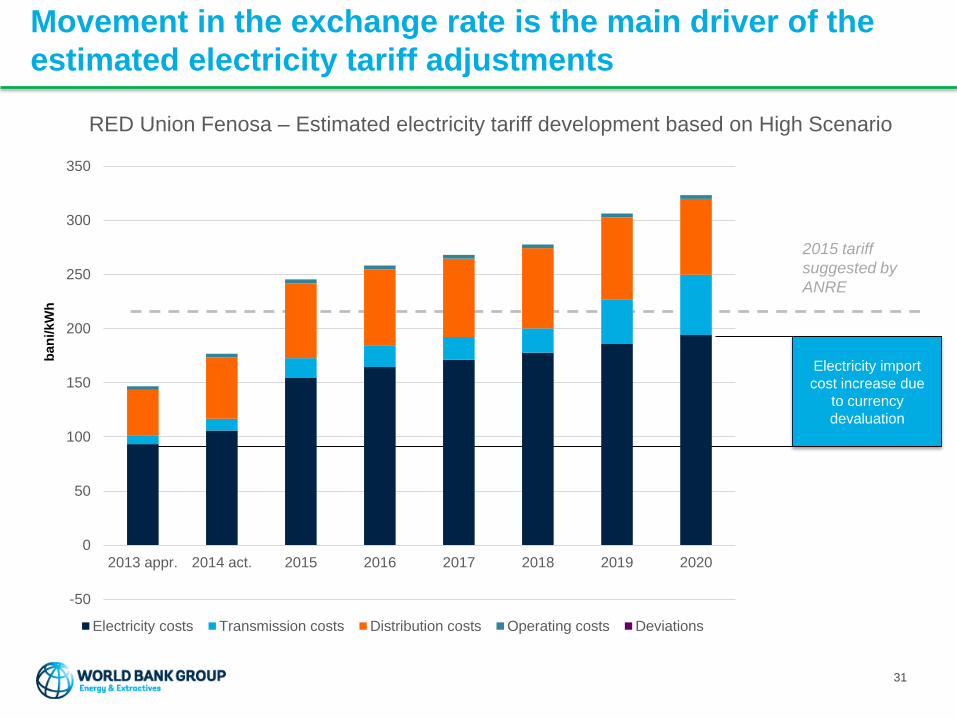
Movement in the exchange rate is the main driver of the
estimated electricity tariff adjustments
Electricity import
cost increase due
to currency
devaluation
RED Union Fenosa – Estimated electricity tariff development based on High Scenario
2015 tariff
suggested by
ANRE
31
-50
0
50
100
150
200
250
300
350
2013 appr. 2014 act. 2015 2016 2017 2018 2019 2020
ban
i/kW
h
Electricity costs Transmission costs Distribution costs Operating costs Deviations

Gas price and movements in the exchange rate are the
main drivers of the estimated heat tariff adjustments
Termoelectrica – Estimated heat tariff development based on High Scenario
Fuel cost increase
due to currency
devaluation and
requested natural
gas tariff increase
from MoldovaGaz
32
0
200
400
600
800
1000
1200
1400
1600
1800
2000
2012 appr. 2014 act. 2015 2016 2017 2018 2019 2020
Termocom heat, fuel costs Heat other sources, fuel costs Termocom heat, other costs
Heat other sources, other costs Cost of capital Operating costs
Profit Deviation
MD
L/G
cal
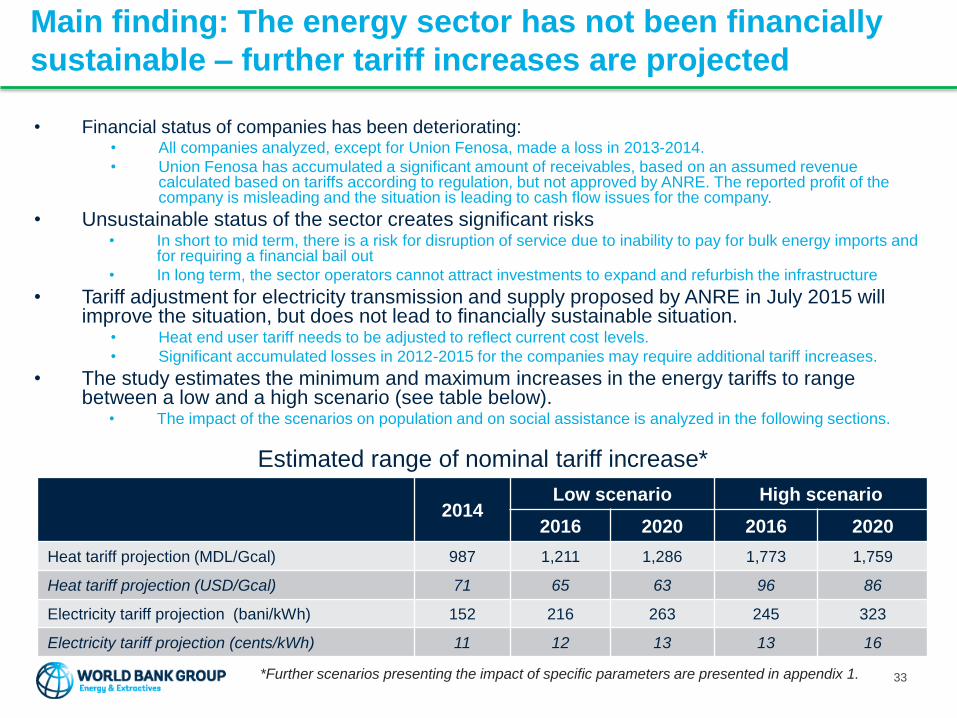
Main finding: The energy sector has not been financially
sustainable – further tariff increases are projected
• Financial status of companies has been deteriorating:• All companies analyzed, except for Union Fenosa, made a loss in 2013-2014.
• Union Fenosa has accumulated a significant amount of receivables, based on an assumed revenue calculated based on tariffs according to regulation, but not approved by ANRE. The reported profit of the company is misleading and the situation is leading to cash flow issues for the company.
• Unsustainable status of the sector creates significant risks• In short to mid term, there is a risk for disruption of service due to inability to pay for bulk energy imports and
for requiring a financial bail out
• In long term, the sector operators cannot attract investments to expand and refurbish the infrastructure
• Tariff adjustment for electricity transmission and supply proposed by ANRE in July 2015 will improve the situation, but does not lead to financially sustainable situation.
• Heat end user tariff needs to be adjusted to reflect current cost levels.
• Significant accumulated losses in 2012-2015 for the companies may require additional tariff increases.
• The study estimates the minimum and maximum increases in the energy tariffs to range between a low and a high scenario (see table below).
• The impact of the scenarios on population and on social assistance is analyzed in the following sections.
33
Estimated range of nominal tariff increase*
*Further scenarios presenting the impact of specific parameters are presented in appendix 1.
2014Low scenario High scenario
2016 2020 2016 2020
Heat tariff projection (MDL/Gcal) 987 1,211 1,286 1,773 1,759
Heat tariff projection (USD/Gcal) 71 65 63 96 86
Electricity tariff projection (bani/kWh) 152 216 263 245 323
Electricity tariff projection (cents/kWh) 11 12 13 13 16
Recommendations to be considered on improving the
tariff adjustment process
• Delay in ANRE’s actions has led to significant financial impact and accumulation of regulatory deviation/losses. The following revisions to the tariff setting methodology may be considered:
• An automatic pass through of costs for fuel and imported electricity to avoid repetition of a similar situation. Good examples of implementation include Kenya (electricity), India (fuels), and Indonesia (fuels).
• To avoid a big one time increase, it is recommended to negotiate with the sector operators on dividing the inclusion of past deviation to the tariffs over a longer time period. Sector operators could be compensated for the delay.
• Prior to beginning of the next regulatory periods in 2016-17, the tariffs including the base costs will be set again. A firm deadline for completing the review and setting the tariffs prior to the beginning of the new regulatory period should be set. To allow time for the regulatory review, the operators may be required to send their tariff applications e.g. one year in advance.
• Credibility of the regulatory framework and the regulator need to be restored rapidly. The current perception of lack of credibility and transparency that is voiced in the market increases the risk of service disruptions in the short and medium term, while discouraging capital investment in the energy infrastructure.
• Regulatory methodology for determining the regulated assets base value, depreciation and rate of return for investments need to be reviewed for clarity and consistency. Clear and credible rules can not only attract investments, but lower WACC, which leads to increased efficiency and cost reduction which can lower energy costs for the end consumers.
• Transfer to valuation of asset base and rate of return in real terms may contribute to moderate the sudden increase in tariffs caused by investments.
• Promote increase in operational efficiency of the operators without compromising service quality by providing incentives for operating cost reduction. Having a communication strategy on efficiency gains and service quality improvement by operators may help increase the willingness to pay.
34
DISTRIBUTIONAL IMPACTS OF TARIFF ADJUSTMENTS
35

On average, energy already represents 17% of total
expenditures for Moldovan households
• The poorest households in Moldova spend on average 21% of total expenditures on energy
• The spending pattern for energy or “energy mix” is very heterogeneous, with urban
households spending 15% on utilities (central heating, gas and electricity) while rural
households spend more on solid fuel (wood and coal)
• Energy consumption is highly seasonal with central heating and gas expenditures twice the
annual average during the first quarter.
• The share of household resources spent on electricity remains rather constant across the
year as few households rely on electricity for heating.
• Wood is often purchased ahead of the heating season, during the 3rd quarter.
0%
5%
10%
15%
20%
25%
Quarter 1 Quarter 2 Quarter 3 Quarter 4Sh
are
of
tota
l exp
en
dit
ure
Current Energy Expenditures by Quarter, Moldova 2013
Central share Electricity share Gas shareLPG share Wood share Coal share
0%
5%
10%
15%
20%
25%
All Chisinau Otherurbanareas
rural Quintile1
Quintile2
Quintile3
Quintile4
Quintile5
Residence area Quintile of total HH expenditures
Sh
are
of
tota
l exp
en
dit
ure
Average Energy Expenditures by Residence and by Quintile of Total Expenditures, Moldova 2013
Central share Electricity share Gas share LPG share Wood share Coal share
36
The regionally comparable share of energy expenditure in Moldova was 15% in 2013.
This is high compared to some other countries in the region: Armenia 12%, Kyrgyz
Republic 10%, Kazakhstan 8%, Kosovo 7%.
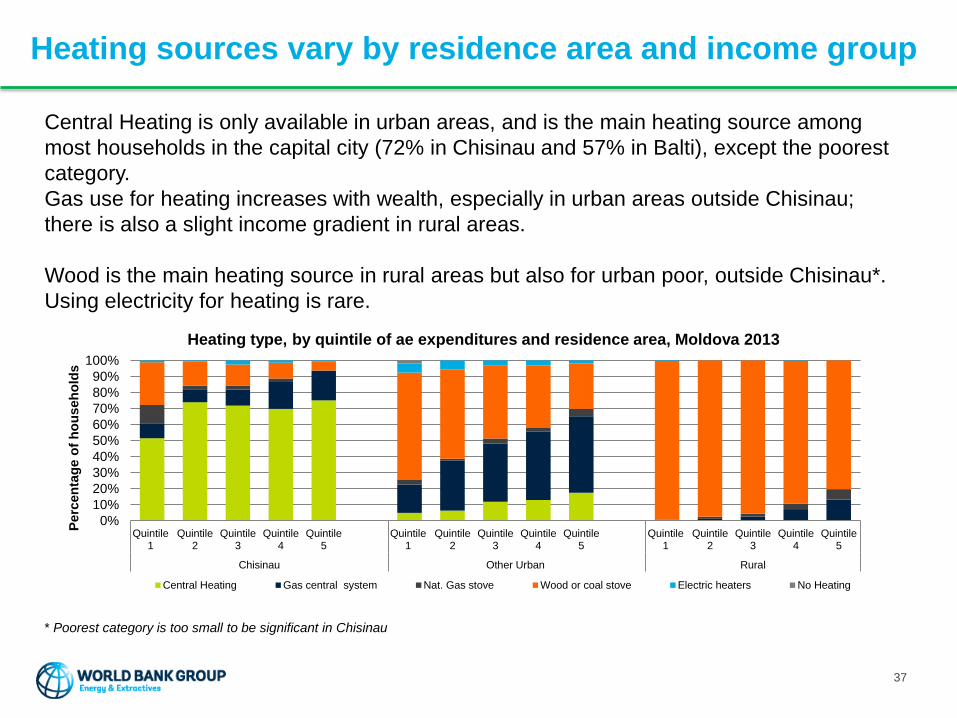
Heating sources vary by residence area and income group
Central Heating is only available in urban areas, and is the main heating source among
most households in the capital city (72% in Chisinau and 57% in Balti), except the poorest
category.
Gas use for heating increases with wealth, especially in urban areas outside Chisinau;
there is also a slight income gradient in rural areas.
Wood is the main heating source in rural areas but also for urban poor, outside Chisinau*.
Using electricity for heating is rare.
* Poorest category is too small to be significant in Chisinau
0%
10%
20%
30%
40%
50%
60%
70%
80%
90%
100%
Quintile1
Quintile2
Quintile3
Quintile4
Quintile5
Quintile1
Quintile2
Quintile3
Quintile4
Quintile5
Quintile1
Quintile2
Quintile3
Quintile4
Quintile5
Chisinau Other Urban Rural
Perc
en
tag
e o
f h
ou
seh
old
s
Heating type, by quintile of ae expenditures and residence area, Moldova 2013
Central Heating Gas central system Nat. Gas stove Wood or coal stove Electric heaters No Heating
37
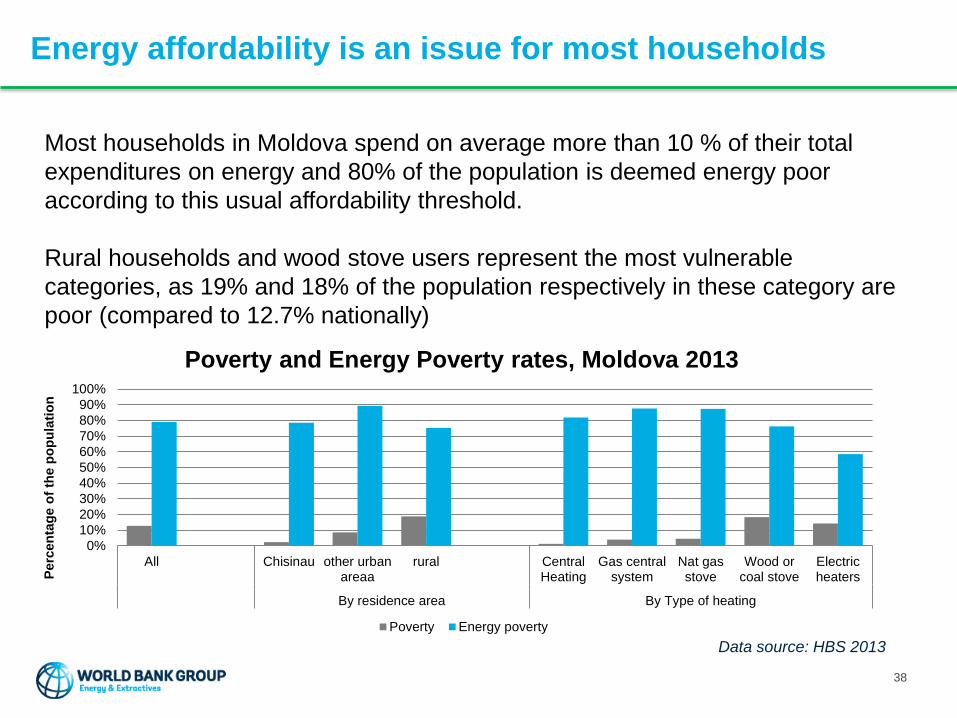
Energy affordability is an issue for most households
Most households in Moldova spend on average more than 10 % of their total
expenditures on energy and 80% of the population is deemed energy poor
according to this usual affordability threshold.
Rural households and wood stove users represent the most vulnerable
categories, as 19% and 18% of the population respectively in these category are
poor (compared to 12.7% nationally)
0%
10%
20%
30%
40%
50%
60%
70%
80%
90%
100%
All Chisinau other urbanareaa
rural CentralHeating
Gas centralsystem
Nat gasstove
Wood orcoal stove
Electricheaters
By residence area By Type of heating
Perc
en
tag
e o
f th
e p
op
ula
tio
n
Poverty and Energy Poverty rates, Moldova 2013
Poverty Energy poverty
38
Data source: HBS 2013
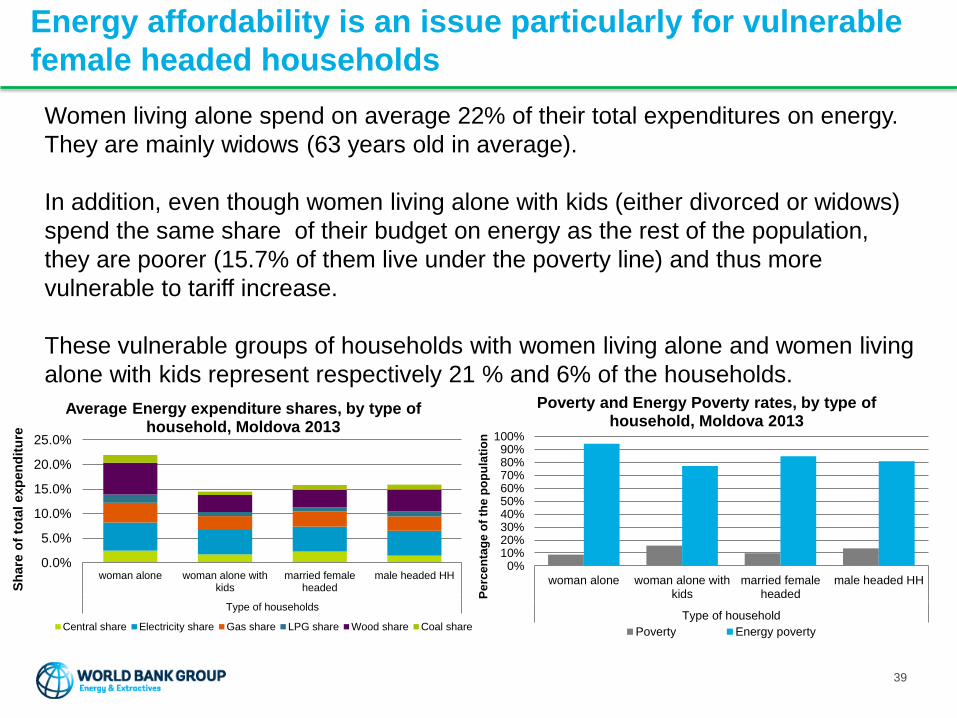
Energy affordability is an issue particularly for vulnerable
female headed households
Women living alone spend on average 22% of their total expenditures on energy.
They are mainly widows (63 years old in average).
In addition, even though women living alone with kids (either divorced or widows)
spend the same share of their budget on energy as the rest of the population,
they are poorer (15.7% of them live under the poverty line) and thus more
vulnerable to tariff increase.
These vulnerable groups of households with women living alone and women living
alone with kids represent respectively 21 % and 6% of the households.
0.0%
5.0%
10.0%
15.0%
20.0%
25.0%
woman alone woman alone withkids
married femaleheaded
male headed HH
Type of households
Sh
are
of
tota
l exp
en
dit
ure
Average Energy expenditure shares, by type of household, Moldova 2013
Central share Electricity share Gas share LPG share Wood share Coal share
0%10%20%30%40%50%60%70%80%90%
100%
woman alone woman alone withkids
married femaleheaded
male headed HH
Type of household
Pe
rce
nta
ge
of
the
po
pu
lati
on
Poverty and Energy Poverty rates, by type of household, Moldova 2013
Poverty Energy poverty
39
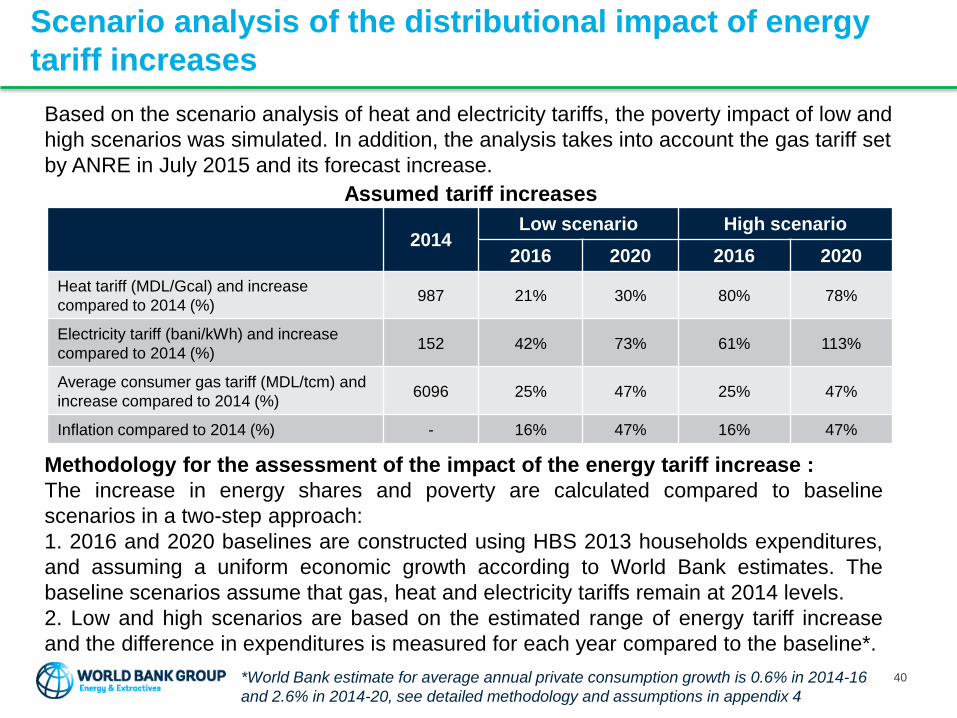
Scenario analysis of the distributional impact of energy
tariff increases
Based on the scenario analysis of heat and electricity tariffs, the poverty impact of low and
high scenarios was simulated. In addition, the analysis takes into account the gas tariff set
by ANRE in July 2015 and its forecast increase.
2014Low scenario High scenario
2016 2020 2016 2020
Heat tariff (MDL/Gcal) and increase
compared to 2014 (%)987 21% 30% 80% 78%
Electricity tariff (bani/kWh) and increase
compared to 2014 (%)152 42% 73% 61% 113%
Average consumer gas tariff (MDL/tcm) and
increase compared to 2014 (%)6096 25% 47% 25% 47%
Inflation compared to 2014 (%) - 16% 47% 16% 47%
Assumed tariff increases
40
Methodology for the assessment of the impact of the energy tariff increase :
The increase in energy shares and poverty are calculated compared to baseline
scenarios in a two-step approach:
1. 2016 and 2020 baselines are constructed using HBS 2013 households expenditures,
and assuming a uniform economic growth according to World Bank estimates. The
baseline scenarios assume that gas, heat and electricity tariffs remain at 2014 levels.
2. Low and high scenarios are based on the estimated range of energy tariff increase
and the difference in expenditures is measured for each year compared to the baseline*.
*World Bank estimate for average annual private consumption growth is 0.6% in 2014-16
and 2.6% in 2014-20, see detailed methodology and assumptions in appendix 4
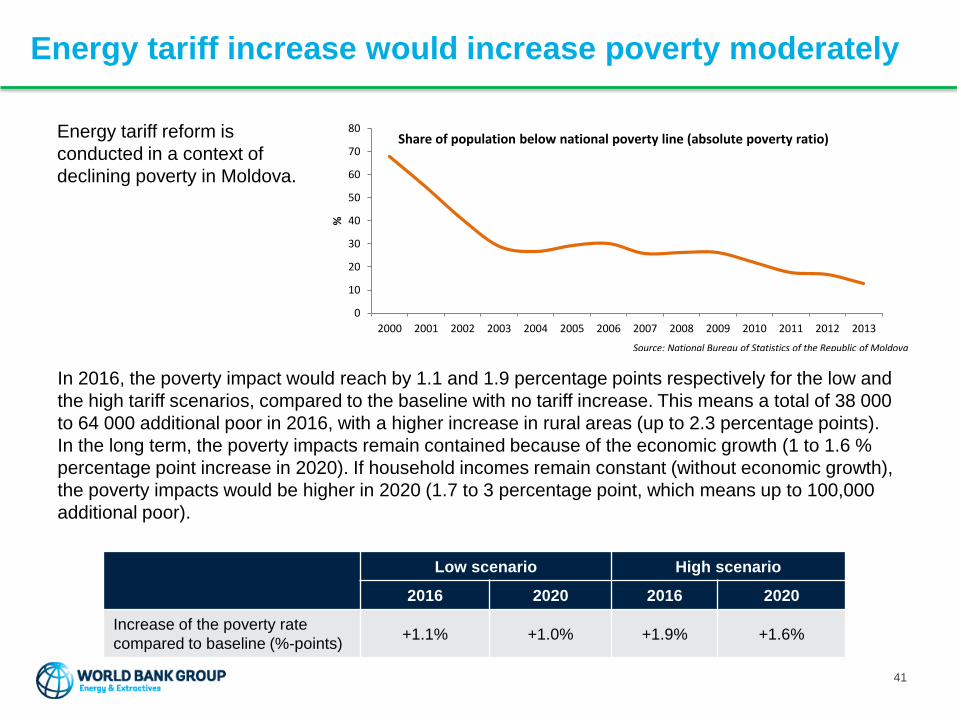
Energy tariff increase would increase poverty moderately
Energy tariff reform is
conducted in a context of
declining poverty in Moldova.
0
10
20
30
40
50
60
70
80
2000 2001 2002 2003 2004 2005 2006 2007 2008 2009 2010 2011 2012 2013%
Share of population below national poverty line (absolute poverty ratio)
Source: National Bureau of Statistics of the Republic of Moldova
Low scenario High scenario
2016 2020 2016 2020
Increase of the poverty rate
compared to baseline (%-points)+1.1% +1.0% +1.9% +1.6%
In 2016, the poverty impact would reach by 1.1 and 1.9 percentage points respectively for the low and
the high tariff scenarios, compared to the baseline with no tariff increase. This means a total of 38 000
to 64 000 additional poor in 2016, with a higher increase in rural areas (up to 2.3 percentage points).
In the long term, the poverty impacts remain contained because of the economic growth (1 to 1.6 %
percentage point increase in 2020). If household incomes remain constant (without economic growth),
the poverty impacts would be higher in 2020 (1.7 to 3 percentage point, which means up to 100,000
additional poor).
41

Energy tariff increase would increase poverty especially
among rural population, whose main fuel is wood
Wood users are vulnerable to the electricity tariff increase, as a significant proportion of this category lives close to the poverty line. Poverty increase reaches 1.5 and 2.3 percentage points in 2016 for the low and high scenario respectively.
As a consequence, the increase in poverty is higher in rural areas even if wood is the main heating source.
Users of natural gas stoves are the most vulnerable to the gas tariff increase. For this group the increase in poverty reaches 2 and 3 percentage points for low and high scenario respectively (but note that this is a very limited category)*.
42
0%
5%
10%
15%
20%
25%
Total Chisinau Other urbanarea
Rural Central Heating Gas centralsystem
Nat. Gas stove Wood or coalstove
Pro
po
rtio
n o
f th
e p
op
ula
tio
n
Simulated poverty share (%)
Baseline 2016 Low 2016 High 2016 Baseline 2020 Low 2020 High 2020
Note that the poverty rates for 2016 and 2020 are simulations intended to capture only the impacts of tariff increases, by
comparing the yearly baselines with the high and low scenarios. They do not represent World Bank poverty forecasts
which would depend on a plurality of other factors not taken into consideration here.
* Natural gas stove category too small for statistically significant
results, as they represent only 2% of the households nationally
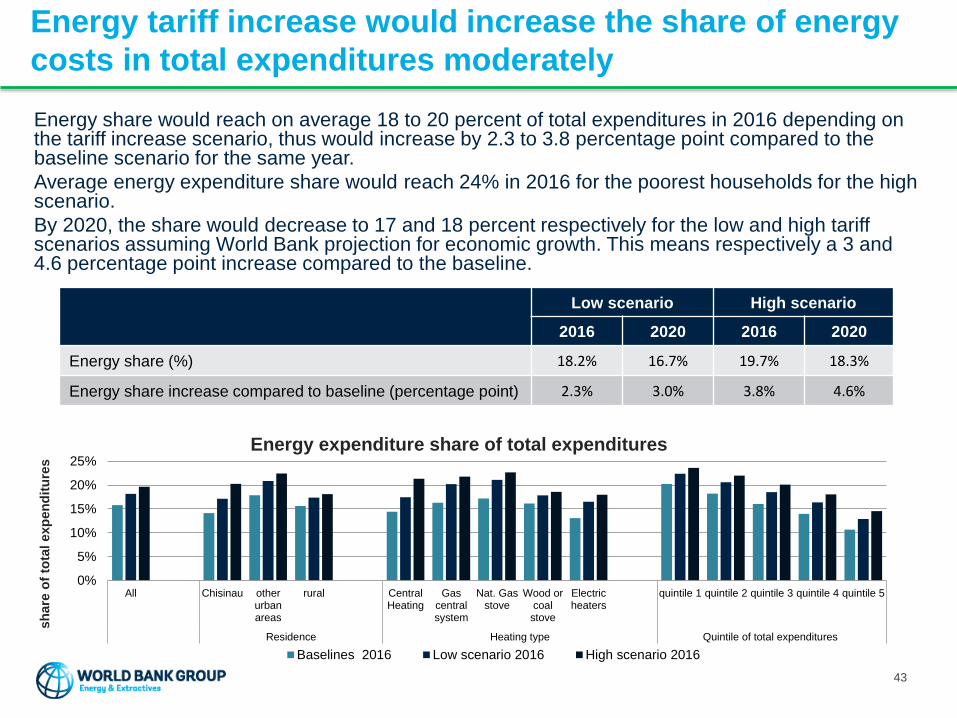
Energy tariff increase would increase the share of energy
costs in total expenditures moderately
Energy share would reach on average 18 to 20 percent of total expenditures in 2016 depending on the tariff increase scenario, thus would increase by 2.3 to 3.8 percentage point compared to the baseline scenario for the same year.
Average energy expenditure share would reach 24% in 2016 for the poorest households for the high scenario.
By 2020, the share would decrease to 17 and 18 percent respectively for the low and high tariff scenarios assuming World Bank projection for economic growth. This means respectively a 3 and 4.6 percentage point increase compared to the baseline.
43
0%
5%
10%
15%
20%
25%
All Chisinau otherurbanareas
rural CentralHeating
Gascentralsystem
Nat. Gasstove
Wood orcoalstove
Electricheaters
quintile 1 quintile 2 quintile 3 quintile 4 quintile 5
Residence Heating type Quintile of total expenditures
sh
are
of
tota
l exp
en
dit
ure
s
Energy expenditure share of total expenditures
Baselines 2016 Low scenario 2016 High scenario 2016
Low scenario High scenario
2016 2020 2016 2020
Energy share (%) 18.2% 16.7% 19.7% 18.3%
Energy share increase compared to baseline (percentage point) 2.3% 3.0% 3.8% 4.6%
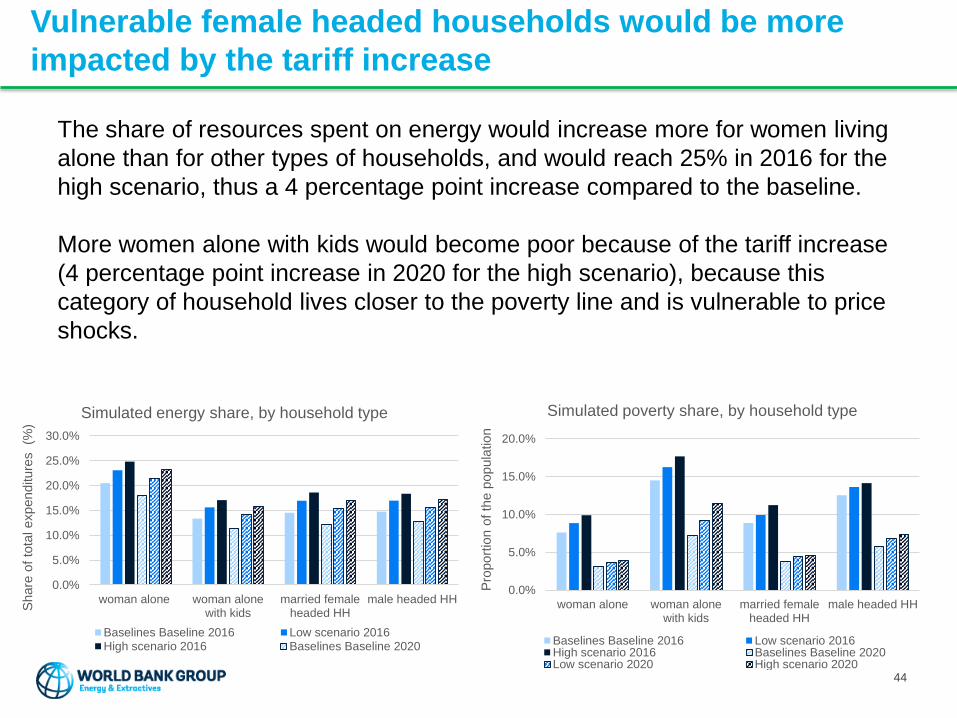
Vulnerable female headed households would be more
impacted by the tariff increase
The share of resources spent on energy would increase more for women living
alone than for other types of households, and would reach 25% in 2016 for the
high scenario, thus a 4 percentage point increase compared to the baseline.
More women alone with kids would become poor because of the tariff increase
(4 percentage point increase in 2020 for the high scenario), because this
category of household lives closer to the poverty line and is vulnerable to price
shocks.
44
0.0%
5.0%
10.0%
15.0%
20.0%
25.0%
30.0%
woman alone woman alonewith kids
married femaleheaded HH
male headed HH
Share
of
tota
l expenditure
s
(%)
Simulated energy share, by household type
Baselines Baseline 2016 Low scenario 2016High scenario 2016 Baselines Baseline 2020
0.0%
5.0%
10.0%
15.0%
20.0%
woman alone woman alonewith kids
married femaleheaded HH
male headed HH
Pro
port
ion o
f th
e p
opula
tion
Simulated poverty share, by household type
Baselines Baseline 2016 Low scenario 2016High scenario 2016 Baselines Baseline 2020Low scenario 2020 High scenario 2020
Main finding: Energy tariff increase would increase
poverty and the share of energy costs moderately
• Energy tariff increases would increase the share of energy costs in total expenditures on average to 18-20% in 2016 which is 2.3-3.8 percentage point above the baseline.
• By 2020, assuming equal distribution of World Bank projection for economic growth, the energy share of total expenditures would decrease to 17-18%, which is 3-4.6 percentage points above the baseline.
• The increase in the energy share caused by the raise in tariffs is highest for households that use gas for heating under the low scenario, while it is highest for district heating users under the high scenario.
• In 2016, the poverty rate would increase by 1.1 percentage points in the low scenario and 1.9 percentage points in the high scenario compared to the baseline, due to increasing heat, electricity and gas tariffs.
• In 2020, the increase in poverty rate ranges between 1-1.5 percentage points. Without economic growth, the increase would reach 3 percentage points.
• The increase in poverty is highest among the population that already has a high poverty rate: rural population, women living alone and people who use wood or electricity for heating.
45

SOCIAL PROTECTION
46
Moldova has targeted social assistance programs that can
help protect the poor from income and price shocks
• Two targeted social assistance programs, Ajutor Social and Heating Allowance, channel effectively social assistance to poor households.
• Since 2009, the government of Moldova has launched two targeted cash transfers, Ajutor Social (AS) and Heating Allowance (HA). The programs target the poor well: about 80% of the AS and over 50% of HA benefits go to poorest 20% of population.
• The effective coverage of the programs remains modest: in 2014 AS covered 3% of total population and HA about 7%. With the current income thresholds the coverage of HA can potentially be increased to 30 %.
• Effective coverage of the poorest quintile by AS benefits declined between 2012-14 from 19% to 12%.
• Most social assistance benefits remain categorical, i.e. they are provided to certain groups of population (disabled, elderly, children) regardless of their welfare.
• Categorical benefits accounted for 1% of GDP whereas AS and HA accounted for 0.6% of GDP in 2014.
• The beneficiaries of AS and HA mostly reside in rural areas, which is consistent with the national poverty profile.
• The municipal heating benefits in Chisinau and Balti are important to complement the national programs.
47
Key characteristics of social assistance programs
• Ajutor Social (AS)– Uses the income and proxy-means test to identify the poor.
– Benefit is provided during a year to fill out the gap between the household`s income and a Guaranteed Minimum Income (GMI) threshold set annually by the law.
– There are about 51,000 beneficiary households but with a perfect take-up (all eligible households apply and receive benefits) there would be 128,000 beneficiary households.
• Heating Allowance (HA)– Complements the AS to compensate the poor for increased cost of living during 5 months of
heating season.
– A flat monthly benefit of 250 MDL offered to all recipients of AS and to those households whose income is below 1.6 times the Guaranteed Minimum Income.
– During 2014-15 heating season, there were 136,000 beneficiary households, but with a perfect take-up could cover 446,000 households.
• Municipal heating benefits in Chisinau and Balti– Have higher income eligibility threshold than the HA program.
– Average monthly benefit paid during five months in Chisinau for gas, wood and coal users is 450 MDL and for central heating users 285 MDL. Average monthly benefit in Balti during five months is 200 MDL.
– Despite high potential coverage benefits take-up is low: in Chisinau of 189,000 HHs that could qualify for benefits only 33,000 HHs receive them.
– Application is cumbersome: high transaction and opportunity cost may discourage the poor to apply.
48
How could social assistance respond to increasing energy
tariffs?
Effective coverage of targeted cash transfers must be expanded to offer a
safety net to poor households and cushion price shocks, including those
stemming from higher energy tariffs.
The most efficient means to offset the increase of energy expenses for the
poor households are the existing targeted social assistance programs:
• Increasing electricity costs can be compensated through AS program • AS program benefits and most electricity expenses do not vary significantly throughout the
year
• Increasing district heating and gas costs can be compensated through
HA program • HA program benefits are delivered during heating season when households are mainly
impacted by increasing costs of district heating and gas
• Improving the design, implementation and coordination of municipal
heating benefits can further compensate increasing heating costs• This impact is not included in the analysis
49

Compensating increased energy costs – current impact
• Increase in energy costs do not automatically result in higher benefit and increased coverage of social assistance, because the level of benefits and the number of eligible households is determined by the defined Guaranteed Minimum Income, GMI.
• With increasing household income due to economic growth, the number of households receiving social assistance would decrease
Social Assistance Benefits with constant GMI
Source: Staff calculations based on HBS
2015 2016 2020
Income threshold for AS (MDL/month) 765 765 765
Number of HHs benefiting from AS 50,832 37,831 22,761
Number of HHs eligible for AS 127,826 95,131 57,237
Coverage by AS with current take-up (% of population) 4.3 3.2 2.1
Coverage by AS with perfect take-up (% of population) 10.8 8.2 5.4
Income threshold for HA (MDL/month) 1,224 1,224 1,224
Number of HHs benefiting from HA 136,466 101,474 47,640
Number of HHs eligible for HA 445,821 331,504 155,635
Coverage of HA with current take-up (% of population) 9.1 7.0 3.8
Coverage of HA with perfect take-up (% of population) 30.0 23.0 12.4
50
Recommended adjustments to compensate energy cost
increase
51
The following adjustments are recommended to social assistance programs to compensate for higher energy costs:
• Increase in eligibility threshold• The threshold for receiving AS (GMI) must be regularly revised to
reflect increasing cost of living (including electricity cost). Likewise, the threshold for HA should be adjusted accordingly at 1.6xGMI.
• The change in GMI should reflect increasing energy costs as part of overall increase in cost of living (inflation).
• Increase in social assistance benefits per household• The AS benefit size adjusts automatically with GMI growth as it fills the
gap between the actual household income and GMI.
• The HA benefit size should be revised in line with average increase in monthly heating cost per household during heating season.
The fiscal impact of recommended adjustments to social
assistance
52
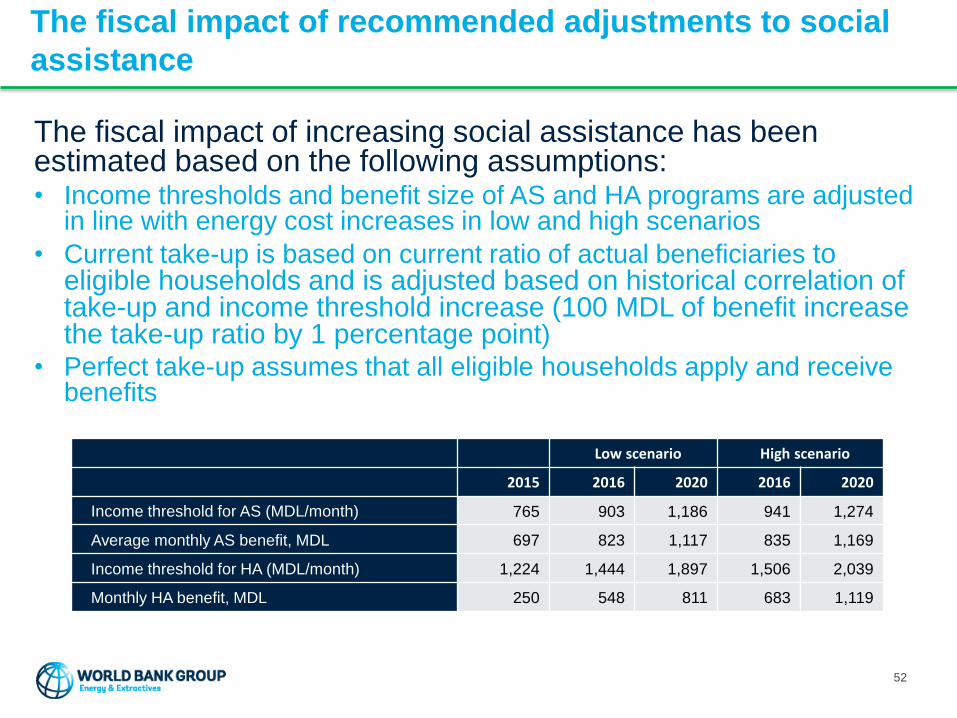
The fiscal impact of increasing social assistance has been estimated based on the following assumptions: • Income thresholds and benefit size of AS and HA programs are adjusted
in line with energy cost increases in low and high scenarios
• Current take-up is based on current ratio of actual beneficiaries to eligible households and is adjusted based on historical correlation of take-up and income threshold increase (100 MDL of benefit increase the take-up ratio by 1 percentage point)
• Perfect take-up assumes that all eligible households apply and receive benefits
Low scenario High scenario
2015 2016 2020 2016 2020
Income threshold for AS (MDL/month) 765 903 1,186 941 1,274
Average monthly AS benefit, MDL 697 823 1,117 835 1,169
Income threshold for HA (MDL/month) 1,224 1,444 1,897 1,506 2,039
Monthly HA benefit, MDL 250 548 811 683 1,119
The fiscal impact of compensating energy tariff increases
through national social assistance programs
53
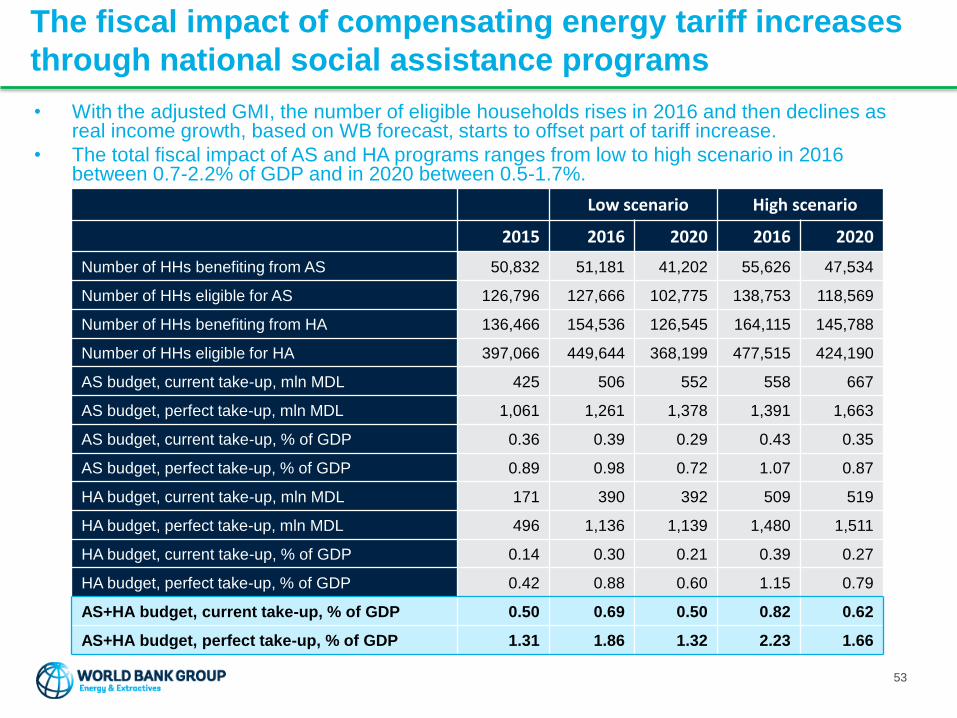
• With the adjusted GMI, the number of eligible households rises in 2016 and then declines as real income growth, based on WB forecast, starts to offset part of tariff increase.
• The total fiscal impact of AS and HA programs ranges from low to high scenario in 2016 between 0.7-2.2% of GDP and in 2020 between 0.5-1.7%.
Low scenario High scenario
2015 2016 2020 2016 2020
Number of HHs benefiting from AS 50,832 51,181 41,202 55,626 47,534
Number of HHs eligible for AS 126,796 127,666 102,775 138,753 118,569
Number of HHs benefiting from HA 136,466 154,536 126,545 164,115 145,788
Number of HHs eligible for HA 397,066 449,644 368,199 477,515 424,190
AS budget, current take-up, mln MDL 425 506 552 558 667
AS budget, perfect take-up, mln MDL 1,061 1,261 1,378 1,391 1,663
AS budget, current take-up, % of GDP 0.36 0.39 0.29 0.43 0.35
AS budget, perfect take-up, % of GDP 0.89 0.98 0.72 1.07 0.87
HA budget, current take-up, mln MDL 171 390 392 509 519
HA budget, perfect take-up, mln MDL 496 1,136 1,139 1,480 1,511
HA budget, current take-up, % of GDP 0.14 0.30 0.21 0.39 0.27
HA budget, perfect take-up, % of GDP 0.42 0.88 0.60 1.15 0.79
AS+HA budget, current take-up, % of GDP 0.50 0.69 0.50 0.82 0.62
AS+HA budget, perfect take-up, % of GDP 1.31 1.86 1.32 2.23 1.66
Main findings of social assistance analysis
• Moldova’s two targeted social assistance programs, Ajutor Social and Heating Allowance, can help protect the poor from income shocks, including energy tariff increase, in a cost-effective manner.
• Municipal heating compensations have important complementarities to the national programs especially those for the urban poor.
• Growing tariffs will increase the need for social assistance. To protect the poor, adjustment of the income threshold, GMI, as well as HA benefit size are needed.
• Higher benefits may encourage enrollment, but effective outreach is required because the take-up of both national and municipal benefits is currently low. With improved coverage, the national programs could cover over 30% of the population.
• As a result of the social assistance, energy affordability for the poorest HHs receiving AS and HA would improve.
• Significant increases in benefits would drive up the budget of targeted programs. In the high case scenario assuming perfect take-up, the total fiscal cost of HA and AS would be more than 2 % of GDP in the period of most intensive tariff growth, 2016.
• To limit the fiscal cost of social assistance, it may be necessary to adjust categorical benefits, which currently present 1 % of GDP. In addition, tightening the proxy test of social assistance may help contain the cost and decrease benefits “leakage” to better-off households.
• Municipal benefits should be better linked with the national social assistance system to streamline administration, improve targeting accuracy and better contain fiscal cost of both national and municipal programs.
54

SUMMARY OF KEY FINDINGS
55
Energy tariffs need to ensure cost recovery to ensure
security of supply and sustainable development of the sector
• Fundamental regulatory structures and billing performance are at a fairly good level:
• Moldova has in place a fundamentally well structured regulatory system that is considered to be in principle adequate also by private sector operators
• The electricity distribution service quality has improved significantly and there is good billing performance in both heat and electricity sectors
• Significant short to mid term risks are related to consumer tariffs for heat and electricity not covering all service production costs:
• Risk of major financial bail out being required with significant fiscal implications
• Risk of disruption of service due to inability to pay for bulk energy imports
• New electricity tariffs decided upon by ANRE in July cover fairly well current operating costs, but further actions are needed to ensure the long term development of the sector:
• A long term plan on recovery of past accumulated debt needs to be reached
• Without a credible long term plan, the sector operators cannot attract investments to expand and refurbish the infrastructure
• Efficiency of the sector may deteriorate as the focus of the management is on short term financing and not on developing operations
56
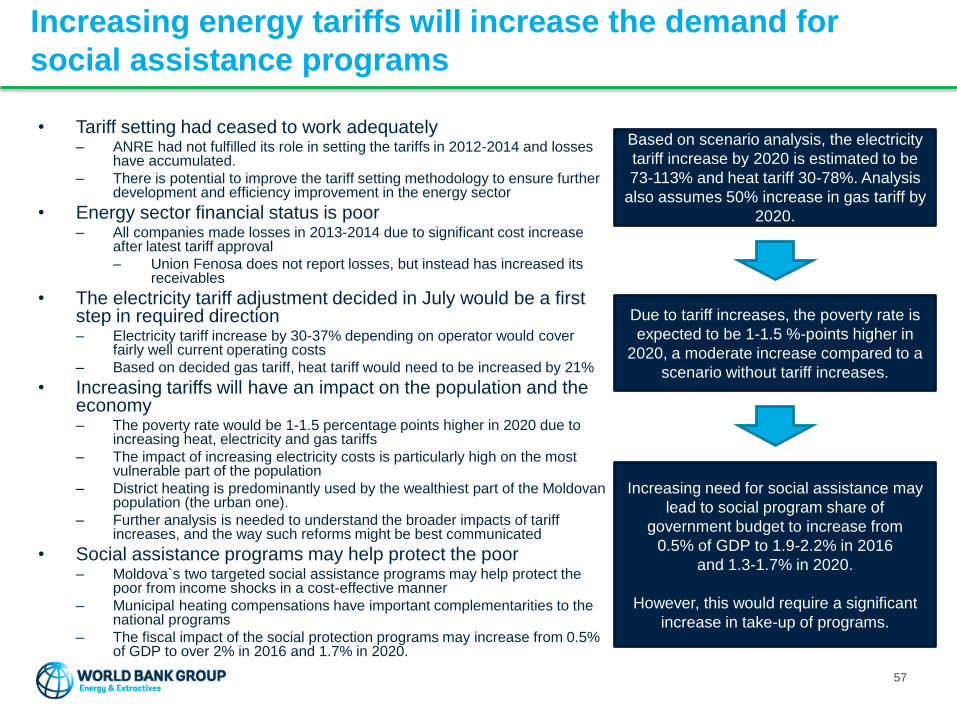
Increasing energy tariffs will increase the demand for
social assistance programs
• Tariff setting had ceased to work adequately– ANRE had not fulfilled its role in setting the tariffs in 2012-2014 and losses
have accumulated.
– There is potential to improve the tariff setting methodology to ensure further development and efficiency improvement in the energy sector
• Energy sector financial status is poor– All companies made losses in 2013-2014 due to significant cost increase
after latest tariff approval
– Union Fenosa does not report losses, but instead has increased its receivables
• The electricity tariff adjustment decided in July would be a first step in required direction– Electricity tariff increase by 30-37% depending on operator would cover
fairly well current operating costs
– Based on decided gas tariff, heat tariff would need to be increased by 21%
• Increasing tariffs will have an impact on the population and the economy– The poverty rate would be 1-1.5 percentage points higher in 2020 due to
increasing heat, electricity and gas tariffs
– The impact of increasing electricity costs is particularly high on the most vulnerable part of the population
– District heating is predominantly used by the wealthiest part of the Moldovan population (the urban one).
– Further analysis is needed to understand the broader impacts of tariff increases, and the way such reforms might be best communicated
• Social assistance programs may help protect the poor– Moldova`s two targeted social assistance programs may help protect the
poor from income shocks in a cost-effective manner
– Municipal heating compensations have important complementarities to the national programs
– The fiscal impact of the social protection programs may increase from 0.5% of GDP to over 2% in 2016 and 1.7% in 2020.
Based on scenario analysis, the electricity
tariff increase by 2020 is estimated to be
73-113% and heat tariff 30-78%. Analysis
also assumes 50% increase in gas tariff by
2020.
Due to tariff increases, the poverty rate is
expected to be 1-1.5 %-points higher in
2020, a moderate increase compared to a
scenario without tariff increases.
Increasing need for social assistance may
lead to social program share of
government budget to increase from
0.5% of GDP to 1.9-2.2% in 2016
and 1.3-1.7% in 2020.
However, this would require a significant
increase in take-up of programs.
57
RECOMMENDATIONS FOR GOVERNMENT
58
Recommendations for immediate actions by government
on tariff setting methodologies
• The credibility of the regulatory regime needs to be restored and the
financial status of the utilities improved. Tariff adjustments are required for
electricity supply, heat supply as well as heat and electricity generation.
• There should be automatic pass through of costs for fuel and imported
electricity to ensure timely adjustment of tariffs to avoid further
accumulation of losses/debt.
• Timely setting of tariffs and calculation of base costs at the beginning of a
regulatory period should be ensured by starting the consultation process
well in advance and determining a firm deadline for approval of tariffs.
• To avoid imposing a large impact on the population through big one-time
increase, it is recommended that ANRE and Government negotiate for
medium term adjustment of tariff to resolve the accumulated losses in a
structured manner.
• Design a plan to communicate about the planned tariff adjustments, their
reasons and available social assistance.
59
Recommendations on social assistance policies
60
• Improve the take-up of Ajutor Social and Heating Allowance programs as well as municipal benefits through better outreach to increase the coverage of the poorest population
• Increase the threshold for social assistance and maintain the adequacy of benefits in line with the increasing energy costs
• Increase the Guaranteed Minimum Income in line with the increasing cost of living (including electricity costs)
• Increase the Heating Allowance benefit size in line with increasing heating costs
• Prepare for the fiscal impact of increasing social assistance in the macroeconomic and fiscal management
• Consolidate categorical benefits to create fiscal space for expanding the targeted transfers and discuss the implications with IMF
Recommendations for further analysis
• To improve the regulatory framework, the following areas should be analyzed • Regulatory rules for determining the regulated asset base value, depreciation and rate of return
• Switching to valuation of asset base in real terms and real rate of return
• Better incentivizing the operators to continuously increase efficiency without compromising the service quality
• The World Bank is planning to complement the analysis with qualitative work aiming at an initial exploration of:
• The perceived quality of heat and electricity services, the acceptability of tariff increases; the expected impact and coping strategies adopted by households
• The potential impact of heat and electricity tariff increases on small businesses, and their likely coping strategies
• The expected impact of tariff increases on businesses, including developers, and their perceptions/decisions on connecting new developments to District heating if possible
• Such findings are expected to complement the existing quantitative assessment, even if by design they will be conducted on a much smaller scale
• Analyze how to further improve the effectiveness of the social assistance• Consider consolidation of categorical benefits and tightening proxy means-test to prevent
“leakage” of benefits to better off households
• Increase cooperation of municipal and national authorities on social assistance to analyze how to link municipal benefits to national social protection system and work towards further integration
• Analyze how to promote supply and demand-side energy efficiency to decrease the energy expenditures in the long-term
61
APPENDICES
62
Appendix 1 – Detailed analysis of tariff setting methodologies
Appendix 2 – Detailed scenario analysis and sensitivity analysis of heat and electricity tariffs
Appendix 3 – Recommendations on tariff methodology and implementation
Appendix 4 – Detailed analysis of relations of heating type and poverty
Appendix 5 – Detailed analysis and conclusions on social protection
Appendix 6 – Summary of scenario analysis
APPENDIX 1 – DETAILED ANALYSIS OF TARIFF
SETTING METHODOLOGIES
63

Main principles of tariff methodologies provide a good
basis for tariff design
All tariff setting methodologies are based on common principles:
• Reliable supply
• Efficient operation
• Financial sustainability of the operators
In addition, the following principles are stated:
Electricity and heat
generationElectricity
transmission
Heat supply • Operator should be able to invest in the development and upgrading of the assets
• Phasing out cross-subsidies tariffs are equal for all consumers connected to the same voltage level
Electricity distribution
Electricity supply
64
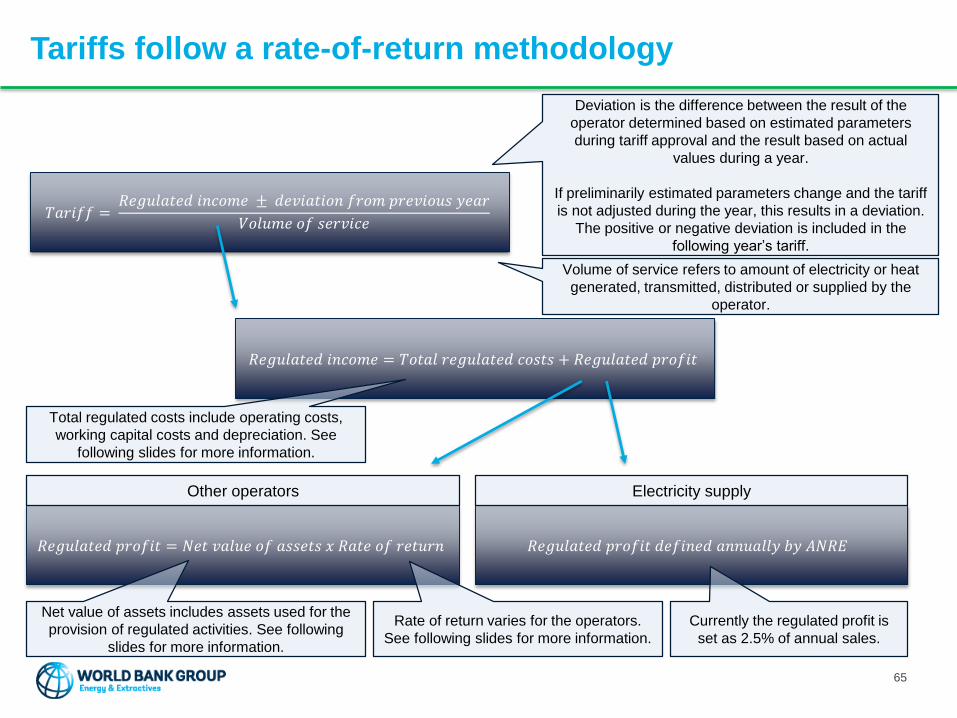
Tariffs follow a rate-of-return methodology
𝑇𝑎𝑟𝑖𝑓𝑓 =𝑅𝑒𝑔𝑢𝑙𝑎𝑡𝑒𝑑 𝑖𝑛𝑐𝑜𝑚𝑒 ± 𝑑𝑒𝑣𝑖𝑎𝑡𝑖𝑜𝑛 𝑓𝑟𝑜𝑚 𝑝𝑟𝑒𝑣𝑖𝑜𝑢𝑠 𝑦𝑒𝑎𝑟
𝑉𝑜𝑙𝑢𝑚𝑒 𝑜𝑓 𝑠𝑒𝑟𝑣𝑖𝑐𝑒
𝑅𝑒𝑔𝑢𝑙𝑎𝑡𝑒𝑑 𝑖𝑛𝑐𝑜𝑚𝑒 = 𝑇𝑜𝑡𝑎𝑙 𝑟𝑒𝑔𝑢𝑙𝑎𝑡𝑒𝑑 𝑐𝑜𝑠𝑡𝑠 + 𝑅𝑒𝑔𝑢𝑙𝑎𝑡𝑒𝑑 𝑝𝑟𝑜𝑓𝑖𝑡
𝑅𝑒𝑔𝑢𝑙𝑎𝑡𝑒𝑑 𝑝𝑟𝑜𝑓𝑖𝑡 = 𝑁𝑒𝑡 𝑣𝑎𝑙𝑢𝑒 𝑜𝑓 𝑎𝑠𝑠𝑒𝑡𝑠 𝑥 𝑅𝑎𝑡𝑒 𝑜𝑓 𝑟𝑒𝑡𝑢𝑟𝑛
Deviation is the difference between the result of the
operator determined based on estimated parameters
during tariff approval and the result based on actual
values during a year.
If preliminarily estimated parameters change and the tariff
is not adjusted during the year, this results in a deviation.
The positive or negative deviation is included in the
following year’s tariff.
Volume of service refers to amount of electricity or heat
generated, transmitted, distributed or supplied by the
operator.
Total regulated costs include operating costs,
working capital costs and depreciation. See
following slides for more information.
𝑅𝑒𝑔𝑢𝑙𝑎𝑡𝑒𝑑 𝑝𝑟𝑜𝑓𝑖𝑡 𝑑𝑒𝑓𝑖𝑛𝑒𝑑 𝑎𝑛𝑛𝑢𝑎𝑙𝑙𝑦 𝑏𝑦 𝐴𝑁𝑅𝐸
Electricity supplyOther operators
Currently the regulated profit is
set as 2.5% of annual sales.
Net value of assets includes assets used for the
provision of regulated activities. See following
slides for more information.
Rate of return varies for the operators.
See following slides for more information.
65
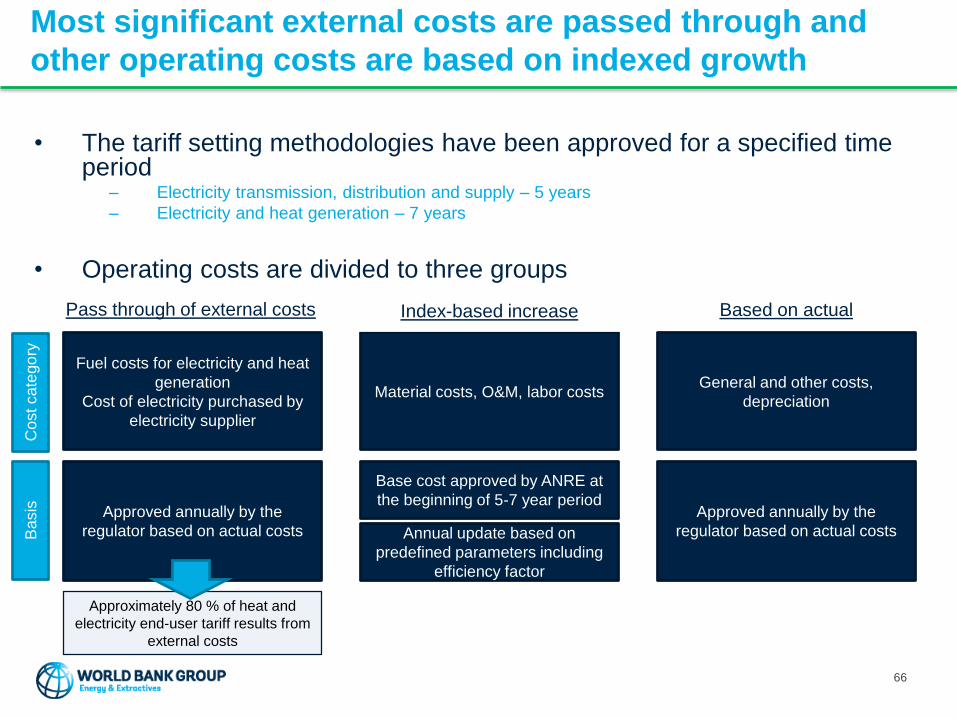
Most significant external costs are passed through and
other operating costs are based on indexed growth
• The tariff setting methodologies have been approved for a specified time period
– Electricity transmission, distribution and supply – 5 years
– Electricity and heat generation – 7 years
• Operating costs are divided to three groups
Fuel costs for electricity and heat
generation
Cost of electricity purchased by
electricity supplier
Approved annually by the
regulator based on actual costs
Base cost approved by ANRE at
the beginning of 5-7 year period
Annual update based on
predefined parameters including
efficiency factor
Material costs, O&M, labor costsGeneral and other costs,
depreciation
Approved annually by the
regulator based on actual costs
Pass through of external costs Index-based increase Based on actual
Approximately 80 % of heat and
electricity end-user tariff results from
external costs
Cost ca
tego
ryB
asis
66
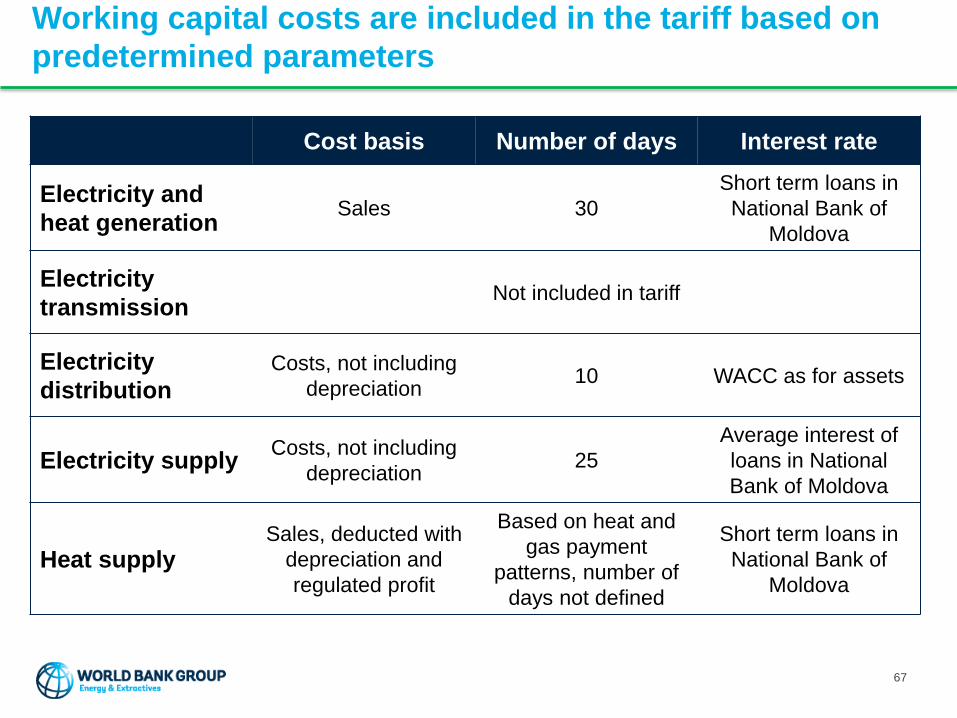
Working capital costs are included in the tariff based on
predetermined parameters
Cost basis Number of days Interest rate
Electricity and
heat generationSales 30
Short term loans in
National Bank of
Moldova
Electricity
transmissionNot included in tariff
Electricity
distribution
Costs, not including
depreciation10 WACC as for assets
Electricity supplyCosts, not including
depreciation25
Average interest of
loans in National
Bank of Moldova
Heat supplySales, deducted with
depreciation and
regulated profit
Based on heat and
gas payment
patterns, number of
days not defined
Short term loans in
National Bank of
Moldova
67
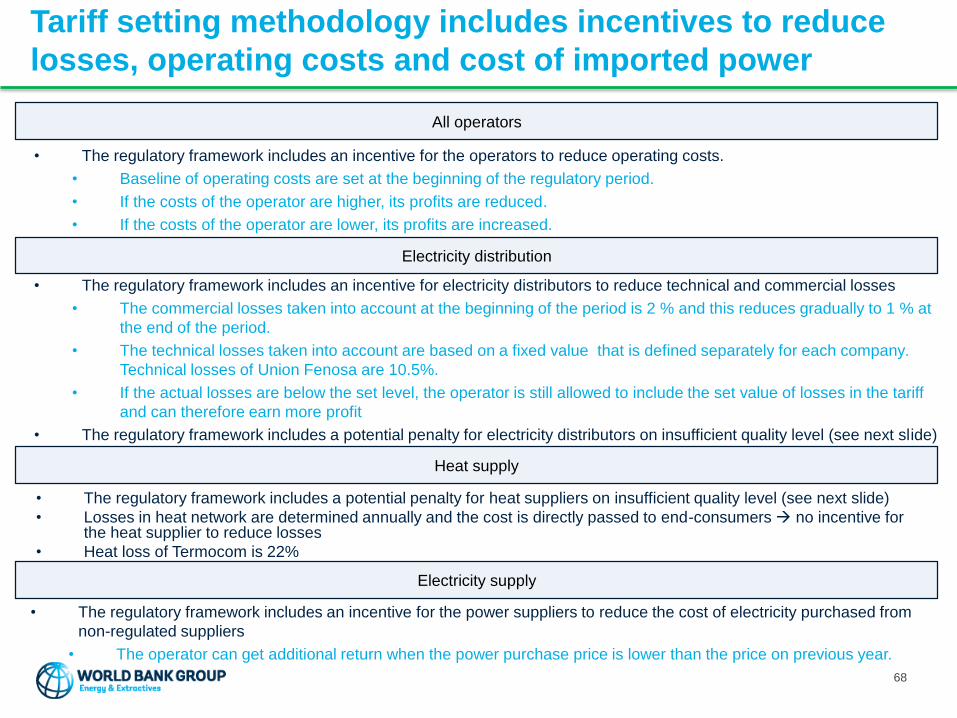
Tariff setting methodology includes incentives to reduce
losses, operating costs and cost of imported power
• The regulatory framework includes an incentive for the operators to reduce operating costs.
• Baseline of operating costs are set at the beginning of the regulatory period.
• If the costs of the operator are higher, its profits are reduced.
• If the costs of the operator are lower, its profits are increased.
Electricity distribution
All operators
Electricity supply
• The regulatory framework includes an incentive for the power suppliers to reduce the cost of electricity purchased from
non-regulated suppliers
• The operator can get additional return when the power purchase price is lower than the price on previous year.
• The regulatory framework includes an incentive for electricity distributors to reduce technical and commercial losses
• The commercial losses taken into account at the beginning of the period is 2 % and this reduces gradually to 1 % at
the end of the period.
• The technical losses taken into account are based on a fixed value that is defined separately for each company.
Technical losses of Union Fenosa are 10.5%.
• If the actual losses are below the set level, the operator is still allowed to include the set value of losses in the tariff
and can therefore earn more profit
• The regulatory framework includes a potential penalty for electricity distributors on insufficient quality level (see next slide)
• The regulatory framework includes a potential penalty for heat suppliers on insufficient quality level (see next slide)
• Losses in heat network are determined annually and the cost is directly passed to end-consumers no incentive for the heat supplier to reduce losses
• Heat loss of Termocom is 22%
Heat supply
68
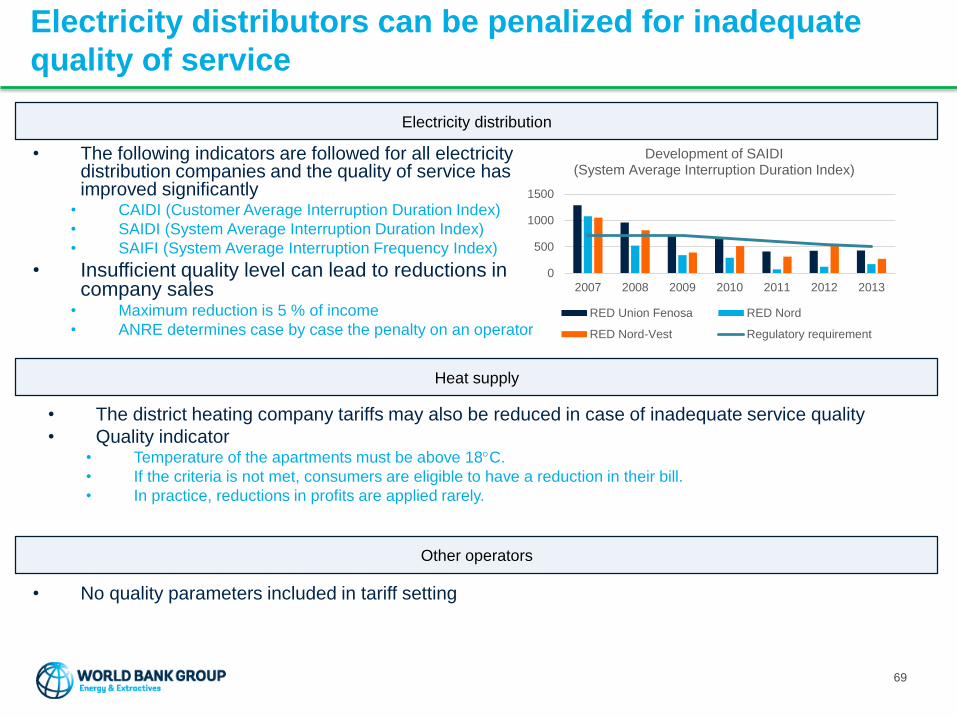
Electricity distributors can be penalized for inadequate
quality of service
• The following indicators are followed for all electricity distribution companies and the quality of service has improved significantly
• CAIDI (Customer Average Interruption Duration Index)
• SAIDI (System Average Interruption Duration Index)
• SAIFI (System Average Interruption Frequency Index)
• Insufficient quality level can lead to reductions in company sales
• Maximum reduction is 5 % of income
• ANRE determines case by case the penalty on an operator
0
500
1000
1500
2007 2008 2009 2010 2011 2012 2013
Development of SAIDI (System Average Interruption Duration Index)
RED Union Fenosa RED Nord
RED Nord-Vest Regulatory requirement
• No quality parameters included in tariff setting
Heat supply
Electricity distribution
Other operators
• The district heating company tariffs may also be reduced in case of inadequate service quality
• Quality indicator• Temperature of the apartments must be above 18C.
• If the criteria is not met, consumers are eligible to have a reduction in their bill.
• In practice, reductions in profits are applied rarely.
69

Regulated asset base is mainly based on book value of
assets
Existing assets
Value taken into account in tariff setting
New assets
Value taken into account in tariff setting
Rate of return Rate of return
• Heat and electricity generation – no return
• Electricity transmission and heat supply – Fixed rate;
return must be used for investment
• Electricity distribution - WACC
• Electricity distribution – agreed asset value
• Union Fenosa – depreciation of old assets by
end of 2014
• Other operators – based on book values or agreement
• Actual investment expenditure deducted with annual
depreciations
• Heat and electricity generation – varies depending on
whether equity or debt financing used
• Other operators – WACC
Approval of investments
• Companies submit their investment plan to ANRE at
the end of each year.
• ANRE should approve the investment within a month,
but the negotiation often continues even until next
summer.
• At the beginning of the following year, the operators
report on the actual investments done based on the
approved investment plan.
• The actual investments done by the end of year are
taken into account in the tariff of the following year. 70
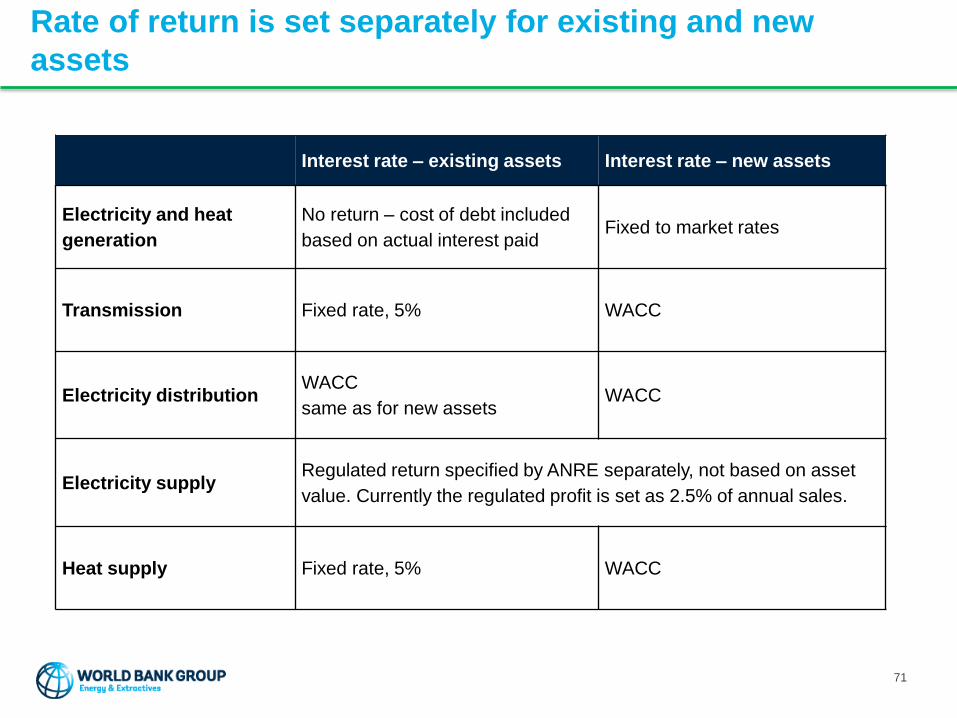
Rate of return is set separately for existing and new
assets
Interest rate – existing assets Interest rate – new assets
Electricity and heat
generation
No return – cost of debt included
based on actual interest paidFixed to market rates
Transmission Fixed rate, 5% WACC
Electricity distributionWACC
same as for new assetsWACC
Electricity supplyRegulated return specified by ANRE separately, not based on asset
value. Currently the regulated profit is set as 2.5% of annual sales.
Heat supply Fixed rate, 5% WACC
71
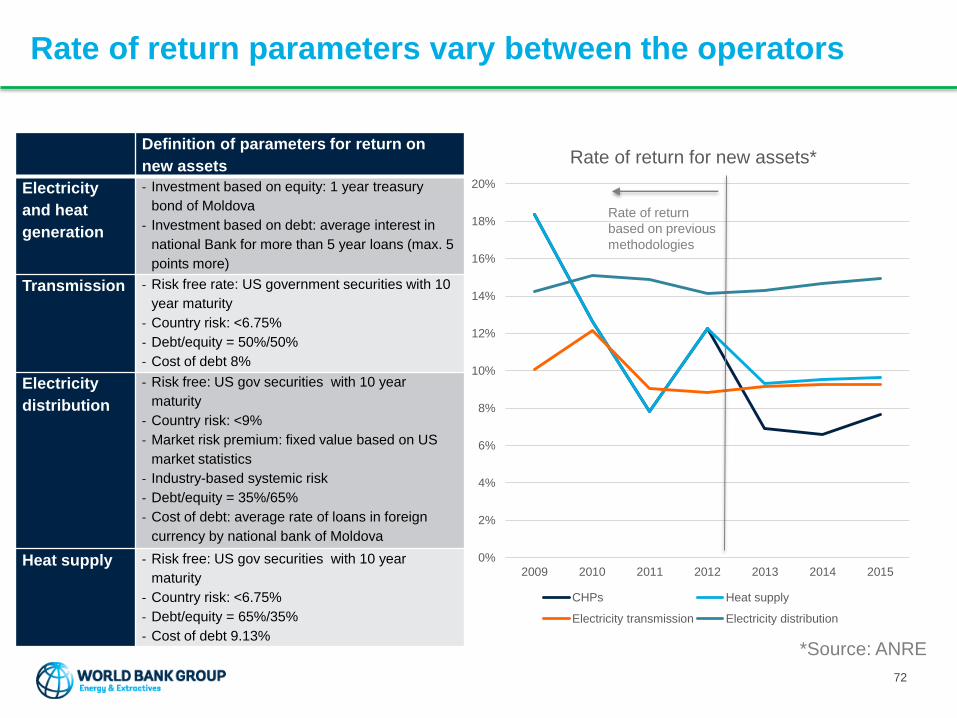
Rate of return parameters vary between the operators
0%
2%
4%
6%
8%
10%
12%
14%
16%
18%
20%
2009 2010 2011 2012 2013 2014 2015
Rate of return for new assets*
CHPs Heat supply
Electricity transmission Electricity distribution
Definition of parameters for return on
new assets
Electricity
and heat
generation
- Investment based on equity: 1 year treasury
bond of Moldova
- Investment based on debt: average interest in
national Bank for more than 5 year loans (max. 5
points more)
Transmission - Risk free rate: US government securities with 10
year maturity
- Country risk: <6.75%
- Debt/equity = 50%/50%
- Cost of debt 8%
Electricity
distribution
- Risk free: US gov securities with 10 year
maturity
- Country risk: <9%
- Market risk premium: fixed value based on US
market statistics
- Industry-based systemic risk
- Debt/equity = 35%/65%
- Cost of debt: average rate of loans in foreign
currency by national bank of Moldova
Heat supply - Risk free: US gov securities with 10 year
maturity
- Country risk: <6.75%
- Debt/equity = 65%/35%
- Cost of debt 9.13%
Rate of return
based on previous
methodologies
*Source: ANRE
72

Tariffs can be amended throughout the year
Automatic
pass-through of
external costs
Including
deviation from
year T-1
73
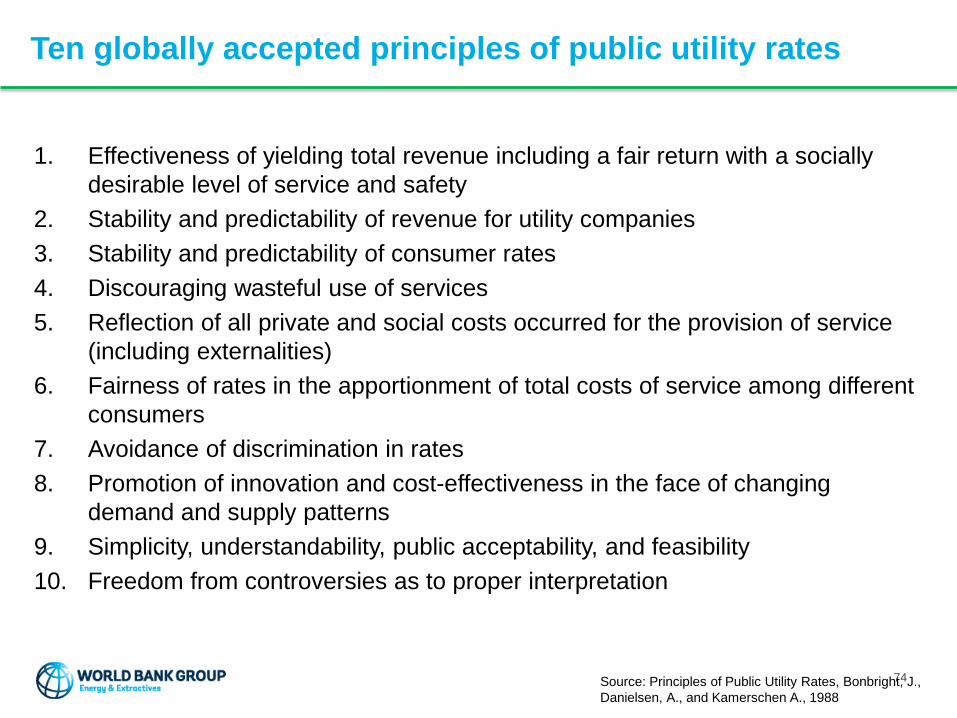
Ten globally accepted principles of public utility rates
1. Effectiveness of yielding total revenue including a fair return with a socially
desirable level of service and safety
2. Stability and predictability of revenue for utility companies
3. Stability and predictability of consumer rates
4. Discouraging wasteful use of services
5. Reflection of all private and social costs occurred for the provision of service
(including externalities)
6. Fairness of rates in the apportionment of total costs of service among different
consumers
7. Avoidance of discrimination in rates
8. Promotion of innovation and cost-effectiveness in the face of changing
demand and supply patterns
9. Simplicity, understandability, public acceptability, and feasibility
10. Freedom from controversies as to proper interpretation
Source: Principles of Public Utility Rates, Bonbright, J.,
Danielsen, A., and Kamerschen A., 1988
74
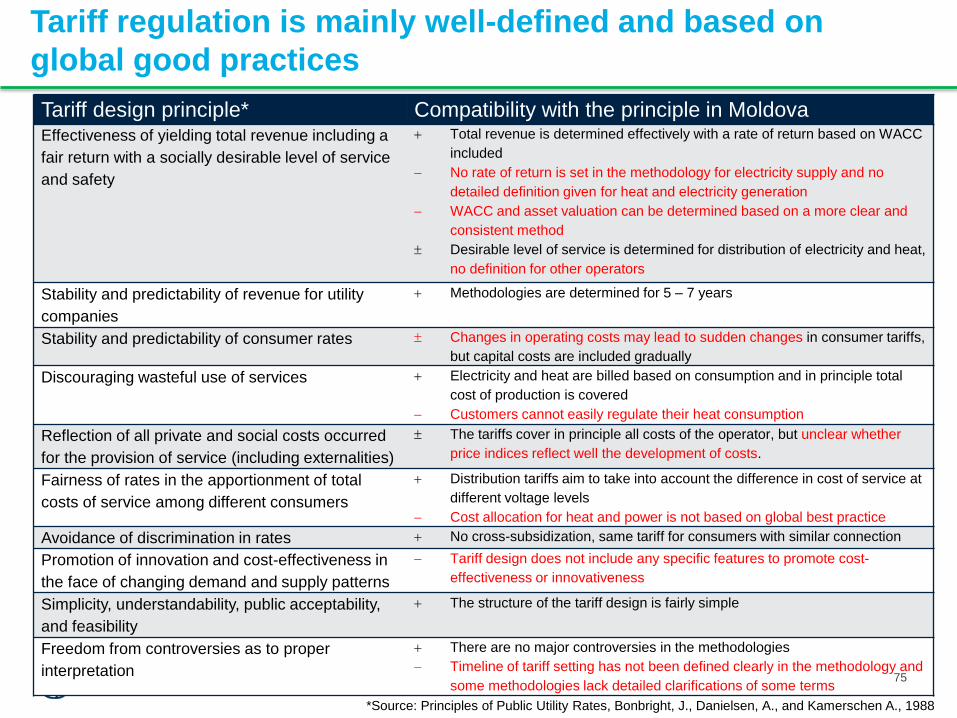
Tariff regulation is mainly well-defined and based on
global good practices
Tariff design principle* Compatibility with the principle in MoldovaEffectiveness of yielding total revenue including a
fair return with a socially desirable level of service
and safety
Total revenue is determined effectively with a rate of return based on WACC
included
No rate of return is set in the methodology for electricity supply and no
detailed definition given for heat and electricity generation
WACC and asset valuation can be determined based on a more clear and
consistent method
Desirable level of service is determined for distribution of electricity and heat,
no definition for other operators
Stability and predictability of revenue for utility
companies
Methodologies are determined for 5 – 7 years
Stability and predictability of consumer rates Changes in operating costs may lead to sudden changes in consumer tariffs,
but capital costs are included gradually
Discouraging wasteful use of services Electricity and heat are billed based on consumption and in principle total
cost of production is covered
Customers cannot easily regulate their heat consumption
Reflection of all private and social costs occurred
for the provision of service (including externalities)
The tariffs cover in principle all costs of the operator, but unclear whether
price indices reflect well the development of costs.
Fairness of rates in the apportionment of total
costs of service among different consumers
Distribution tariffs aim to take into account the difference in cost of service at
different voltage levels
Cost allocation for heat and power is not based on global best practice
Avoidance of discrimination in rates No cross-subsidization, same tariff for consumers with similar connection
Promotion of innovation and cost-effectiveness in
the face of changing demand and supply patterns
Tariff design does not include any specific features to promote cost-
effectiveness or innovativeness
Simplicity, understandability, public acceptability,
and feasibility
The structure of the tariff design is fairly simple
Freedom from controversies as to proper
interpretation
There are no major controversies in the methodologies
Timeline of tariff setting has not been defined clearly in the methodology and
some methodologies lack detailed clarifications of some terms
*Source: Principles of Public Utility Rates, Bonbright, J., Danielsen, A., and Kamerschen A., 1988
75

APPENDIX 2 – GENERAL ASSUMPTIONS AND
DETAILED SCENARIO ANALYSIS AND SENSITIVITY
ANALYSIS OF HEAT AND ELECTRICITY TARIFFS
76
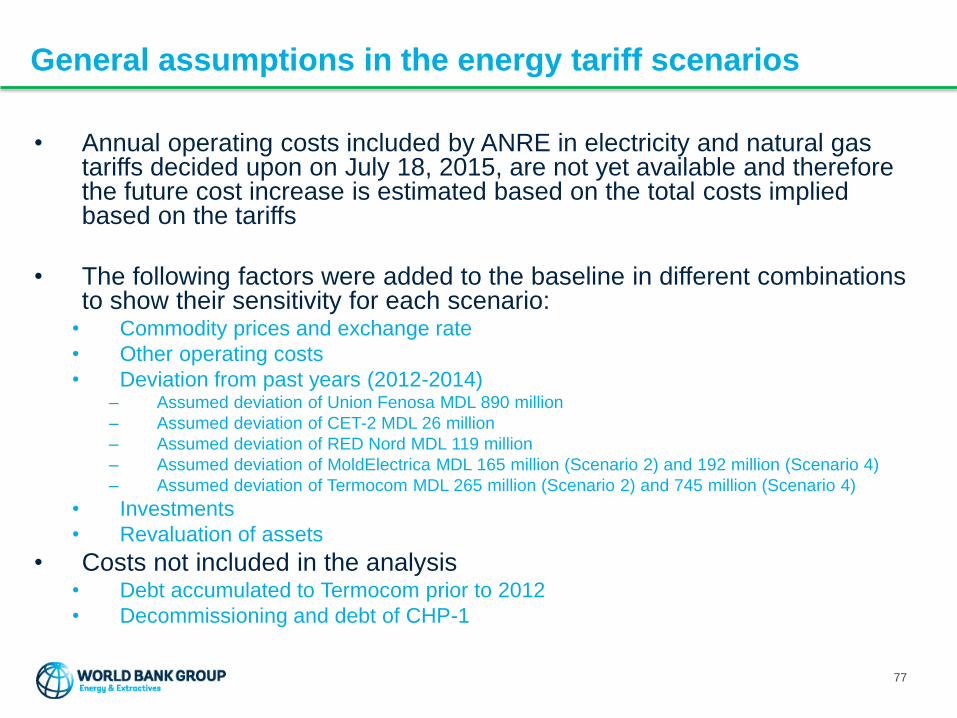
General assumptions in the energy tariff scenarios
77
• Annual operating costs included by ANRE in electricity and natural gas tariffs decided upon on July 18, 2015, are not yet available and therefore the future cost increase is estimated based on the total costs implied based on the tariffs
• The following factors were added to the baseline in different combinations to show their sensitivity for each scenario:
• Commodity prices and exchange rate
• Other operating costs
• Deviation from past years (2012-2014)– Assumed deviation of Union Fenosa MDL 890 million
– Assumed deviation of CET-2 MDL 26 million
– Assumed deviation of RED Nord MDL 119 million
– Assumed deviation of MoldElectrica MDL 165 million (Scenario 2) and 192 million (Scenario 4)
– Assumed deviation of Termocom MDL 265 million (Scenario 2) and 745 million (Scenario 4)
• Investments
• Revaluation of assets
• Costs not included in the analysis• Debt accumulated to Termocom prior to 2012
• Decommissioning and debt of CHP-1
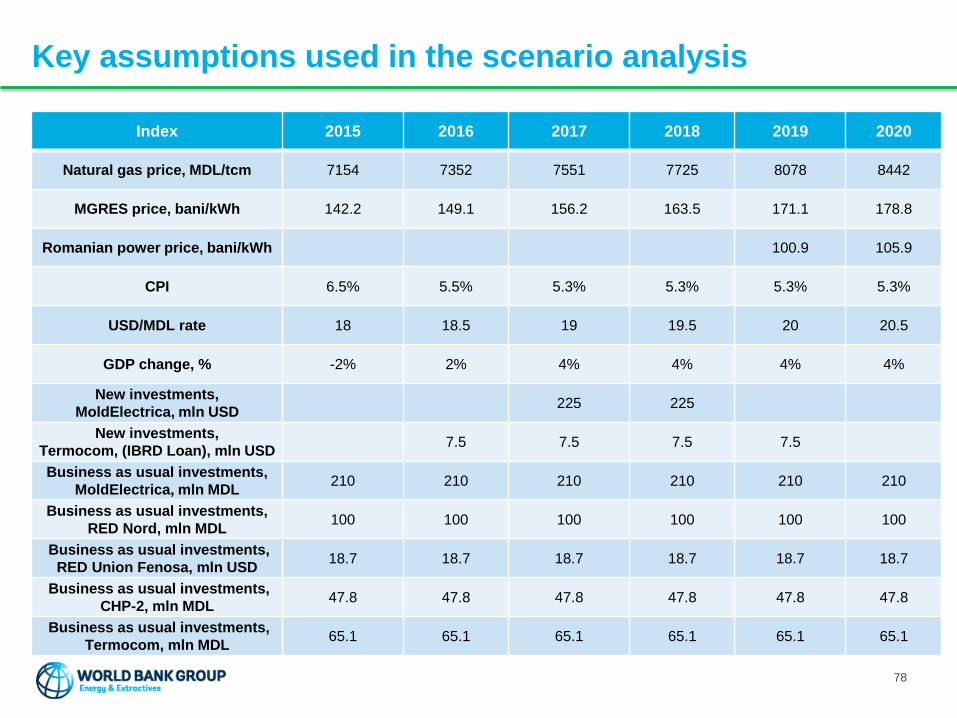
Key assumptions used in the scenario analysis
Index 2015 2016 2017 2018 2019 2020
Natural gas price, MDL/tcm 7154 7352 7551 7725 8078 8442
MGRES price, bani/kWh 142.2 149.1 156.2 163.5 171.1 178.8
Romanian power price, bani/kWh 100.9 105.9
CPI 6.5% 5.5% 5.3% 5.3% 5.3% 5.3%
USD/MDL rate 18 18.5 19 19.5 20 20.5
GDP change, % -2% 2% 4% 4% 4% 4%
New investments,
MoldElectrica, mln USD225 225
New investments,
Termocom, (IBRD Loan), mln USD7.5 7.5 7.5 7.5
Business as usual investments,
MoldElectrica, mln MDL210 210 210 210 210 210
Business as usual investments,
RED Nord, mln MDL100 100 100 100 100 100
Business as usual investments,
RED Union Fenosa, mln USD18.7 18.7 18.7 18.7 18.7 18.7
Business as usual investments,
CHP-2, mln MDL47.8 47.8 47.8 47.8 47.8 47.8
Business as usual investments,
Termocom, mln MDL65.1 65.1 65.1 65.1 65.1 65.1
78

Sources of the data used in the scenario analysis
79
Data Source
Natural gas price Moldovagaz estimate and WB Commodity markets
outlook
Romanian power price WB estimate based on European power prices
CPI WB forecast
USD/MDL rate WB forecast
GDP change % WB forecast
MGRES price company data
BAU investments company data
New investments WB

The constructed scenarios project a range of potential
tariff levels
• Tariffs as set by ANRE to be applied on July 1, 2015 and assumed inflation thereafter
• Heat tariff based on gas tariff as of July 1, 2015July tariff adjustment
• Adjustment of tariffs based on the projected natural gas and electricity import price as well as changes of currency exchange rate
Minimum tariff increase
• Adjustment of tariffs based on the projected natural gas and electricity import price as well as changes of currency exchange rate
• Past deviation divided to 2015-2019 tariffs
Recover past deviation
• Implementation of the current methodology, including past deviation in 2015 and planned investments
By the book including investments
• Estimated high value of all parameters
• Past deviation divided to 2015-2019 tariffs
Estimated maximum tariff
80

The following parameters were set for each scenario
Scenario #Commodity prices,
exchange rate
Other operating
costs
Deviation from past
yearsInvestments
Revaluation of
assets
Scenario 0
‘July tariff
adjustment‘
Electricity: Tariff as of July 18, 2015
Heat: Gas tariff as
of July 18, 2015
Heat: As approved
in 2011 Heat: 0
Heat: BAU
(annual average)Heat: 0%
Scenario 1
‘Minimum tariff
increase’
Passed throughAs approved in
2011 0
BAU
(annual average)0%
Scenario 2
‘Recover past
deviation‘
Passed throughAs approved in
2011 +indicesSplit to 2015-2019
BAU
(annual average)0%
Scenario 3
'By the book
including
investments'
Passed throughActuals of 2011
+indicesAll in 2015
Transmission line:
2019-2020,
DH rehabilitation:
2017-2021
0%
Scenario 4
‘Estimated
maximum tariff‘
Passed throughActuals of 2014
+indices
Split to 2015-2019,
revaluation part
included
Transmission line:
2019-2020,
DH rehabilitation:
2017-2022
100%
81
Lo
w
sce
na
rio
Hig
h
sce
na
rio

152 152
222
268227
275
241
288272
321
245
323
0
50
100
150
200
250
300
350
2013 2014 2015 2016 2017 2018 2019 2020
Tariff approved Scenario 0 ‘July tariff adjustment‘ Scenario 1 'Minimum Tariff Increase'
Scenario 2 'Recover Past Deviation' Scenario 3 'By the Book Including Investments' Scenario 4 'Estimated Maximum Tariff'
ban
i/k
Wh
Based on Scenario 4, RED Union Fenosa nominal end user electricity
tariff could be twice as high in 2020 compared to 2014
End user electricity tariff includes generation,
transmission, distribution and supply of electricity
Total deviation from
2012-2014 is MDL 890
million
Scenarios 2 and 4 –
all deviation included
in 2015-2019
Scenario 3 –
all deviation included
in 2015
82

987
1211
12861375
14731450
1528
1662
1565
1773
1759
500
700
900
1100
1300
1500
1700
1900
2012 2013 2014 2015 2016 2017 2018 2019 2020
Tariff Approved Scenario 0 ‘July tariff adjustment‘
Scenario 1 'Minimum Tariff Increase' Scenario 2 'Recover Past Deviation'
Scenario 3 'By the Book Including Investments' Scenario 4 'Estimated Maximum Tariff'
MD
L/G
cal
Based on Scenario 4, nominal end user heat tariff could be
80 % higher in 2020
End user heat tariff includes generation
and distribution of heat.
83
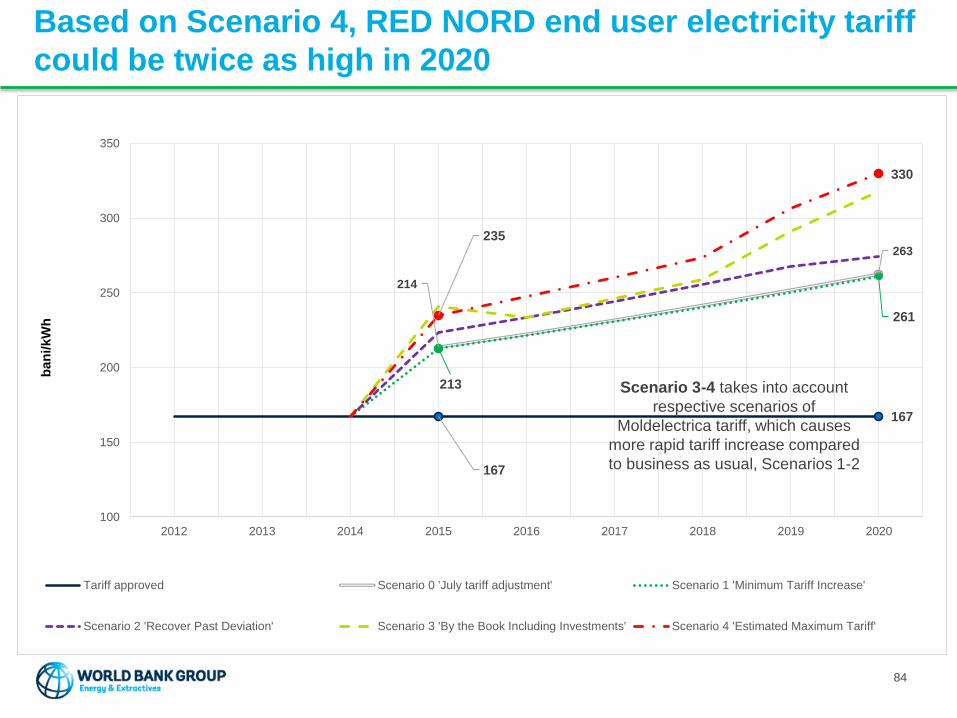
167
167
214
263
213
261
235
330
100
150
200
250
300
350
2012 2013 2014 2015 2016 2017 2018 2019 2020
Tariff approved Scenario 0 'July tariff adjustment' Scenario 1 'Minimum Tariff Increase'
Scenario 2 'Recover Past Deviation' Scenario 3 'By the Book Including Investments' Scenario 4 'Estimated Maximum Tariff'
ban
i/kW
h
Based on Scenario 4, RED NORD end user electricity tariff
could be twice as high in 2020
Scenario 3-4 takes into account
respective scenarios of
Moldelectrica tariff, which causes
more rapid tariff increase compared
to business as usual, Scenarios 1-2
84

8
15
20
14
19
20
53
19
56
0
10
20
30
40
50
60
2012 2013 2014 2015 2016 2017 2018 2019 2020
Tariff approved Scenario 0 'July tariff adjustment' Scenario 1 'Minimum Tariff Increase'
Scenario 2 'Recover Past Deviation' Scenario 3 'By the Book Including Investments' Scenario 4 'Estimated Maximum Tariff'
ban
i/kW
hBased on Scenario 4, electricity transmission tariff could
be almost seven fold in 2020 due to large investments
Big investments considered
in Scenarios 3-4 is the main
reason of significant tariff
increase
85
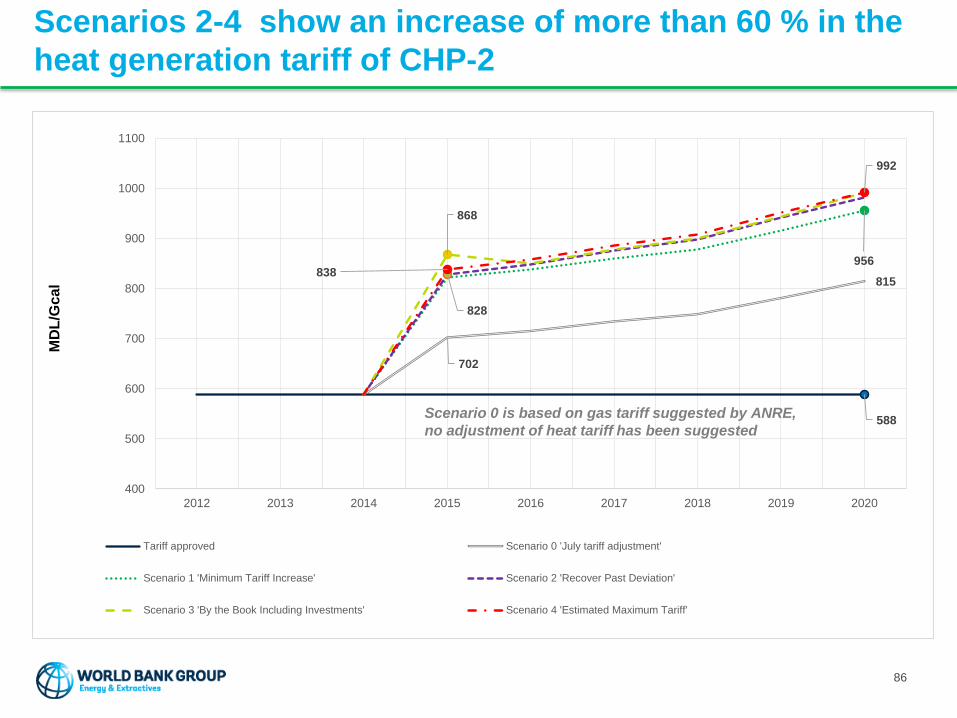
588
702
815
956
828
868
838
992
400
500
600
700
800
900
1000
1100
2012 2013 2014 2015 2016 2017 2018 2019 2020
Tariff approved Scenario 0 'July tariff adjustment'
Scenario 1 'Minimum Tariff Increase' Scenario 2 'Recover Past Deviation'
Scenario 3 'By the Book Including Investments' Scenario 4 'Estimated Maximum Tariff'
MD
L/G
cal
Scenarios 2-4 show an increase of more than 60 % in the
heat generation tariff of CHP-2
Scenario 0 is based on gas tariff suggested by ANRE,
no adjustment of heat tariff has been suggested
86
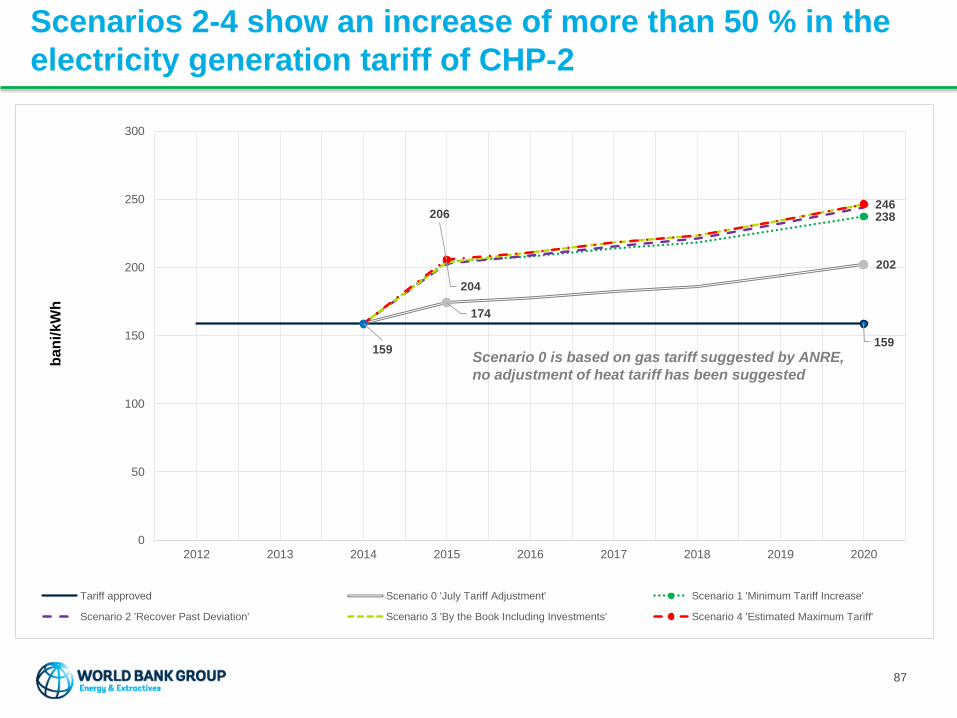
159
174
202
204
238
159
206246
0
50
100
150
200
250
300
2012 2013 2014 2015 2016 2017 2018 2019 2020
Tariff approved Scenario 0 'July Tariff Adjustment' Scenario 1 'Minimum Tariff Increase'
Scenario 2 'Recover Past Deviation' Scenario 3 'By the Book Including Investments' Scenario 4 'Estimated Maximum Tariff'
ban
i/k
Wh
Scenarios 2-4 show an increase of more than 50 % in the
electricity generation tariff of CHP-2
Scenario 0 is based on gas tariff suggested by ANRE,
no adjustment of heat tariff has been suggested
87

Sensitivity analysis for the main cost drivers were
conducted
• Sensitivity analysis on heat end user tariff• Gas import price +/- 30 %
• Sensitivity analysis on electricity end user tariff• CHP-2 electricity generation tariff based on gas import
price +/- 30 %
• MGRES electricity import price +/- 30 % based on same change in gas tariff
• Import all electricity from Romania in 2019 and 2020 based on 2017 price in Romanian power market and increase in line with 2017-2020 power price in European power markets and Romanian transmission cost
88
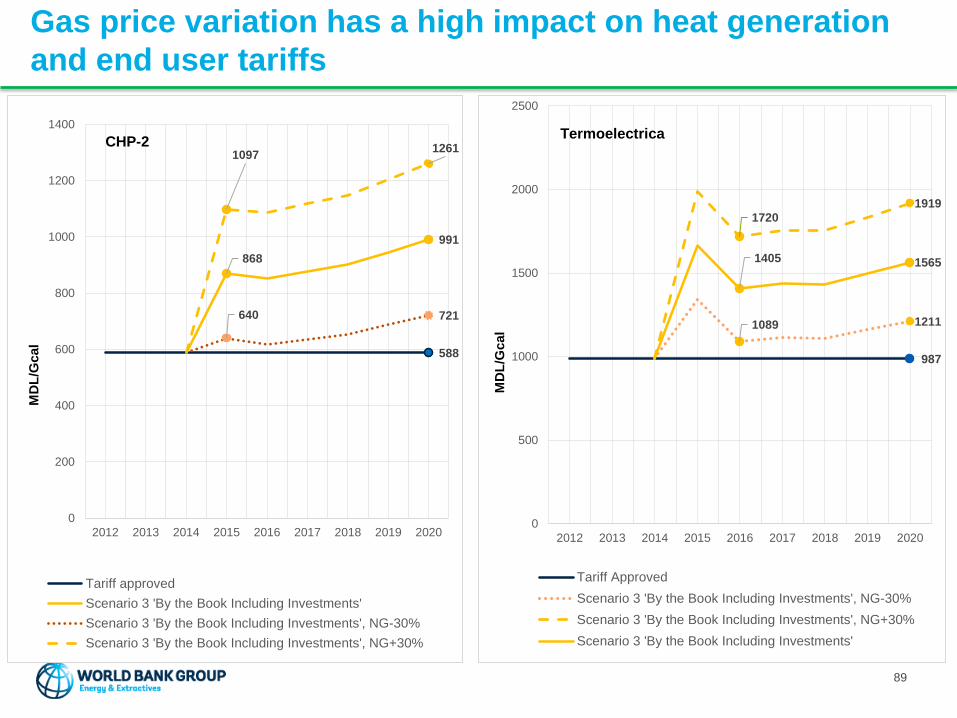
Gas price variation has a high impact on heat generation
and end user tariffs
987
1089 1211
1720
1919
1405 1565
0
500
1000
1500
2000
2500
2012 2013 2014 2015 2016 2017 2018 2019 2020
Tariff Approved
Scenario 3 'By the Book Including Investments', NG-30%
Scenario 3 'By the Book Including Investments', NG+30%
Scenario 3 'By the Book Including Investments'
MD
L/G
cal
588
868
991
640 721
10971261
0
200
400
600
800
1000
1200
1400
2012 2013 2014 2015 2016 2017 2018 2019 2020
Tariff approved
Scenario 3 'By the Book Including Investments'
Scenario 3 'By the Book Including Investments', NG-30%
Scenario 3 'By the Book Including Investments', NG+30%
MD
L/G
cal
CHP-2Termoelectrica
89
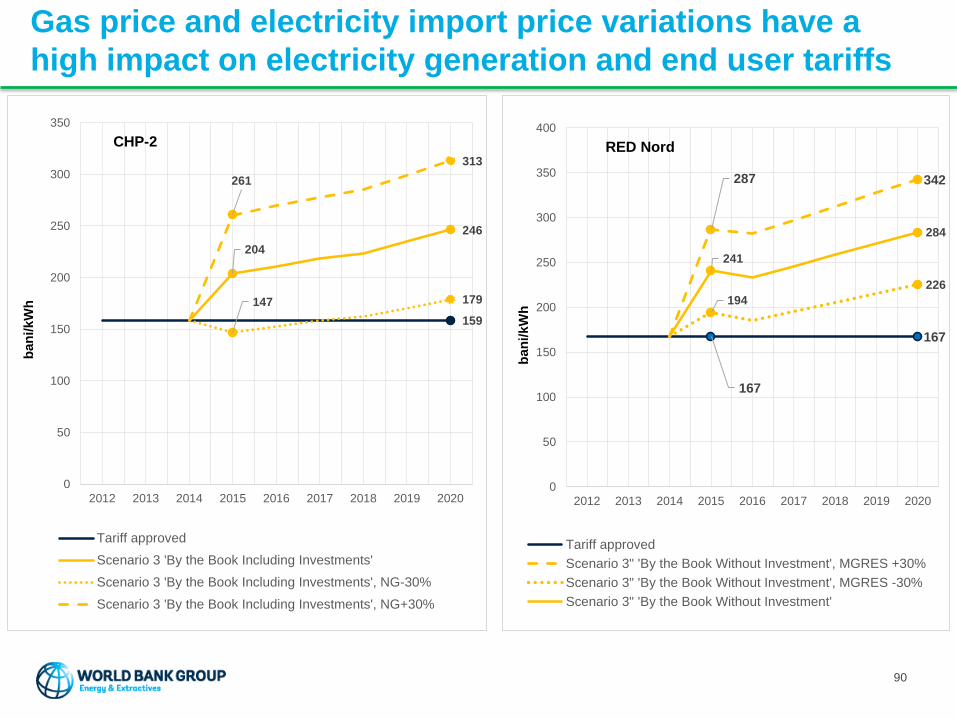
Gas price and electricity import price variations have a
high impact on electricity generation and end user tariffs
159
204
246
147 179
261
313
0
50
100
150
200
250
300
350
2012 2013 2014 2015 2016 2017 2018 2019 2020
Tariff approved
Scenario 3 'By the Book Including Investments'
Scenario 3 'By the Book Including Investments', NG-30%
Scenario 3 'By the Book Including Investments', NG+30%
ban
i/kW
h
CHP-2
167
167
287 342
194
226
241
284
0
50
100
150
200
250
300
350
400
2012 2013 2014 2015 2016 2017 2018 2019 2020
Tariff approved
Scenario 3" 'By the Book Without Investment', MGRES +30%
Scenario 3" 'By the Book Without Investment', MGRES -30%
Scenario 3" 'By the Book Without Investment'
ban
i/kW
h
RED Nord
90
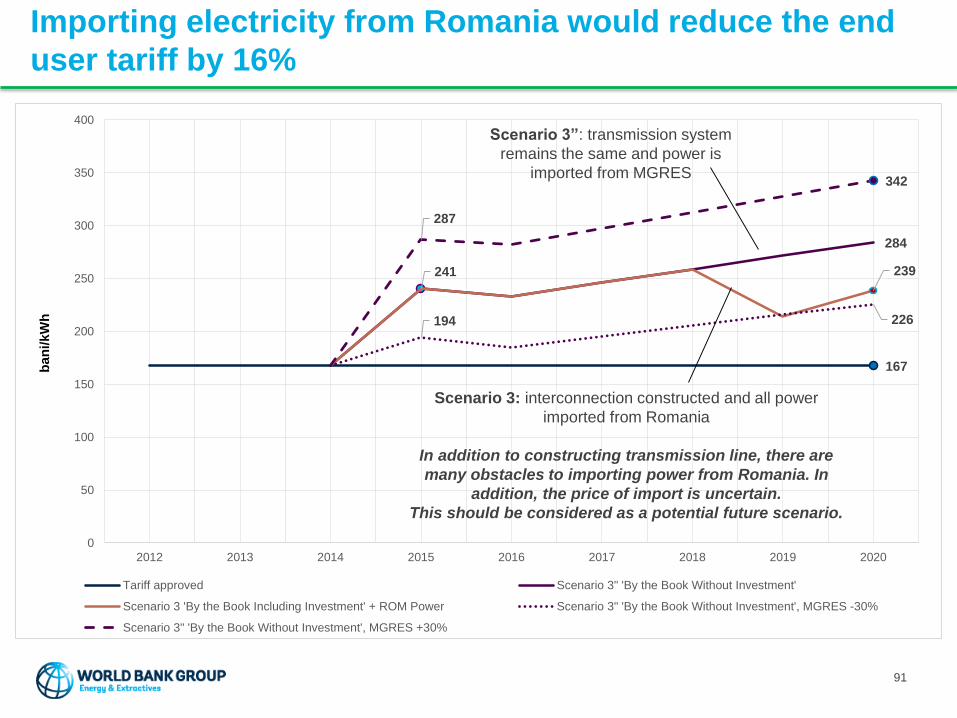
167
241
284
239
194 226
287
342
0
50
100
150
200
250
300
350
400
2012 2013 2014 2015 2016 2017 2018 2019 2020
Tariff approved Scenario 3" 'By the Book Without Investment'
Scenario 3 'By the Book Including Investment' + ROM Power Scenario 3" 'By the Book Without Investment', MGRES -30%
Scenario 3" 'By the Book Without Investment', MGRES +30%
ban
i/kW
h
Importing electricity from Romania would reduce the end
user tariff by 16%
Scenario 3”: transmission system
remains the same and power is
imported from MGRES
Scenario 3: interconnection constructed and all power
imported from Romania
In addition to constructing transmission line, there are
many obstacles to importing power from Romania. In
addition, the price of import is uncertain.
This should be considered as a potential future scenario.
91
APPENDIX 3 – RECOMMENDATIONS ON TARIFF
METHODOLOGY AND IMPLEMENTATION
92

Key areas for improvement in tariff setting
Socially desirable level
of service and safetyQuality criteria set for
electricity distribution
Set quality criteria for all
operators
Should not limit
investments that improve
service quality
Promotion of cost-
effectivenessBased on principle of
minimal costs
Incentivize reduction of
operating costs and
improving quality; Long-
term approval of
investments
Should not limit cost-
effective investments,
should not limit paying for
more qualified staff
Reflection of all private
and social costs
occurred
Updated tariff levels
close to cost recovery
Analyze how well price
indices used reflect the
actual cost drivers
All reasonable costs
should be reflected in
tariffs with update on a
regular basis
Need to develop tariff
methodology
implementation in Moldova
Need to develop tariff
methodology in Moldova
General good practice in
tariff setting
Good practice in tariff
setting in Moldova
Attraction of capital
with a fair returnFair return determined
and at acceptable level
Set rate of return for heat
and electricity generation;
Set asset value based on
economic value (not
accounting)
More regular updating of
tariffs required
93
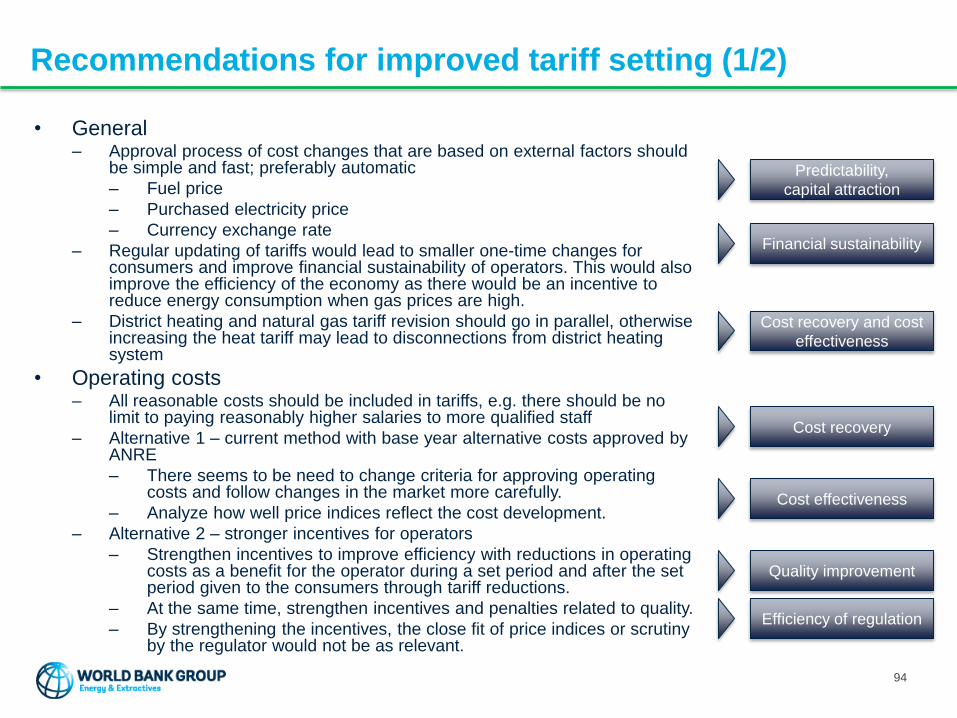
Recommendations for improved tariff setting (1/2)
• General– Approval process of cost changes that are based on external factors should
be simple and fast; preferably automatic
– Fuel price
– Purchased electricity price
– Currency exchange rate
– Regular updating of tariffs would lead to smaller one-time changes for consumers and improve financial sustainability of operators. This would also improve the efficiency of the economy as there would be an incentive to reduce energy consumption when gas prices are high.
– District heating and natural gas tariff revision should go in parallel, otherwise increasing the heat tariff may lead to disconnections from district heating system
• Operating costs– All reasonable costs should be included in tariffs, e.g. there should be no
limit to paying reasonably higher salaries to more qualified staff
– Alternative 1 – current method with base year alternative costs approved by ANRE
– There seems to be need to change criteria for approving operating costs and follow changes in the market more carefully.
– Analyze how well price indices reflect the cost development.
– Alternative 2 – stronger incentives for operators
– Strengthen incentives to improve efficiency with reductions in operating costs as a benefit for the operator during a set period and after the set period given to the consumers through tariff reductions.
– At the same time, strengthen incentives and penalties related to quality.
– By strengthening the incentives, the close fit of price indices or scrutiny by the regulator would not be as relevant.
Cost recovery and cost
effectiveness
Cost recovery
Cost effectiveness
Quality improvement
Predictability,
capital attraction
Efficiency of regulation
Financial sustainability
94
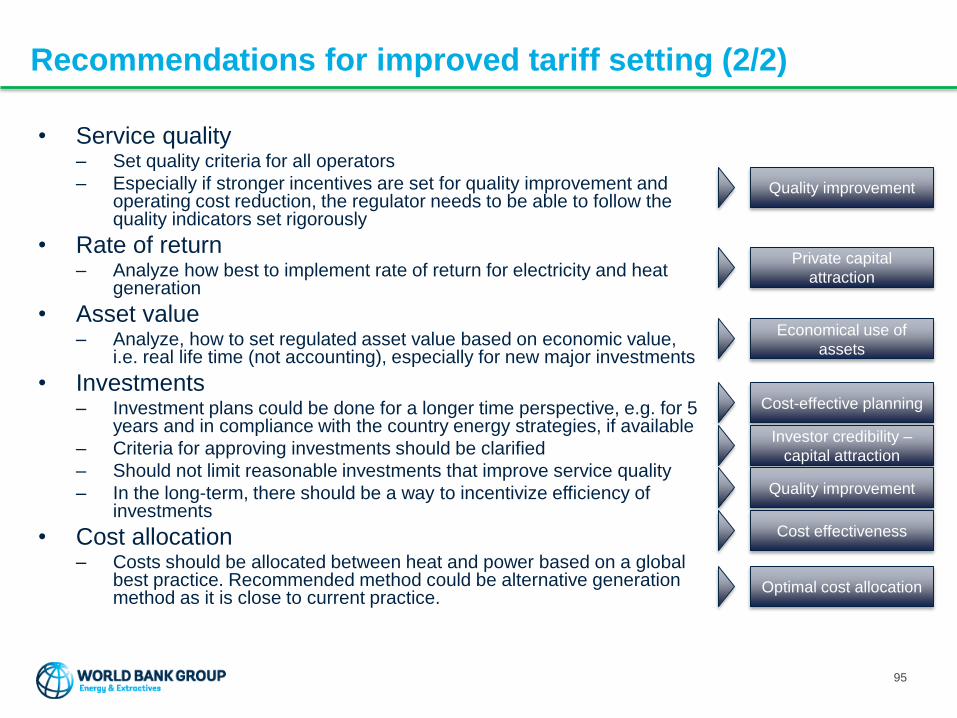
Recommendations for improved tariff setting (2/2)
• Service quality– Set quality criteria for all operators
– Especially if stronger incentives are set for quality improvement and operating cost reduction, the regulator needs to be able to follow the quality indicators set rigorously
• Rate of return– Analyze how best to implement rate of return for electricity and heat
generation
• Asset value– Analyze, how to set regulated asset value based on economic value,
i.e. real life time (not accounting), especially for new major investments
• Investments– Investment plans could be done for a longer time perspective, e.g. for 5
years and in compliance with the country energy strategies, if available
– Criteria for approving investments should be clarified
– Should not limit reasonable investments that improve service quality
– In the long-term, there should be a way to incentivize efficiency of investments
• Cost allocation– Costs should be allocated between heat and power based on a global
best practice. Recommended method could be alternative generation method as it is close to current practice.
Private capital
attraction
Economical use of
assets
Cost-effective planning
Investor credibility –
capital attraction
Quality improvement
Cost effectiveness
Quality improvement
Optimal cost allocation
95
APPENDIX 4 – DETAILED ANALYSIS OF RELATIONS OF
HEATING TYPE AND POVERTY
96
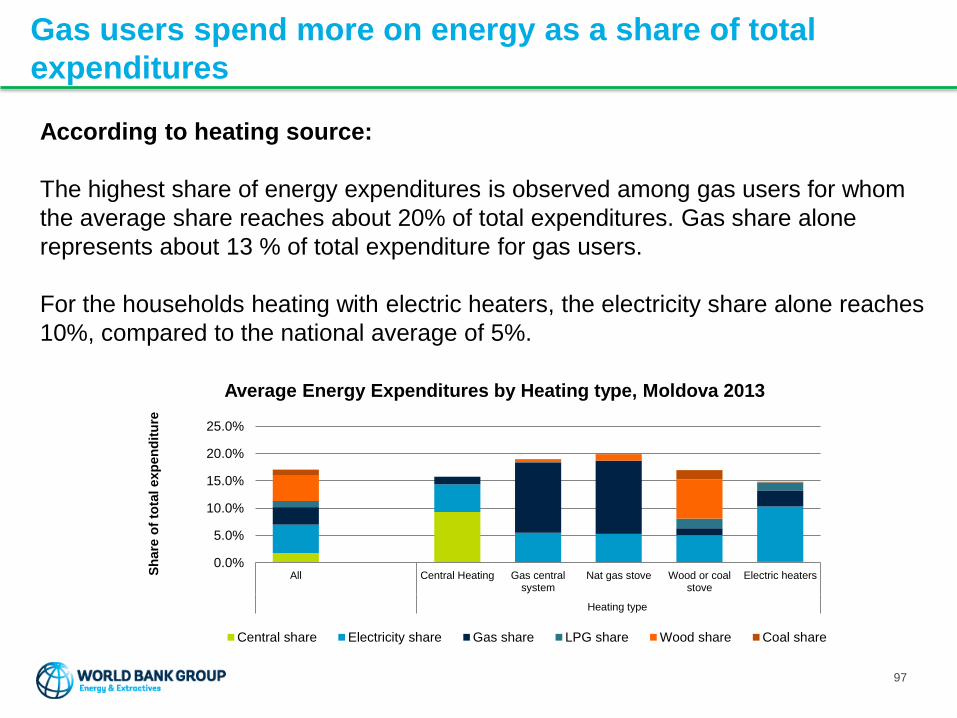
Gas users spend more on energy as a share of total
expenditures
According to heating source:
The highest share of energy expenditures is observed among gas users for whom
the average share reaches about 20% of total expenditures. Gas share alone
represents about 13 % of total expenditure for gas users.
For the households heating with electric heaters, the electricity share alone reaches
10%, compared to the national average of 5%.
0.0%
5.0%
10.0%
15.0%
20.0%
25.0%
All Central Heating Gas centralsystem
Nat gas stove Wood or coalstove
Electric heaters
Heating type
Sh
are
of
tota
l exp
en
dit
ure
Average Energy Expenditures by Heating type, Moldova 2013
Central share Electricity share Gas share LPG share Wood share Coal share
97
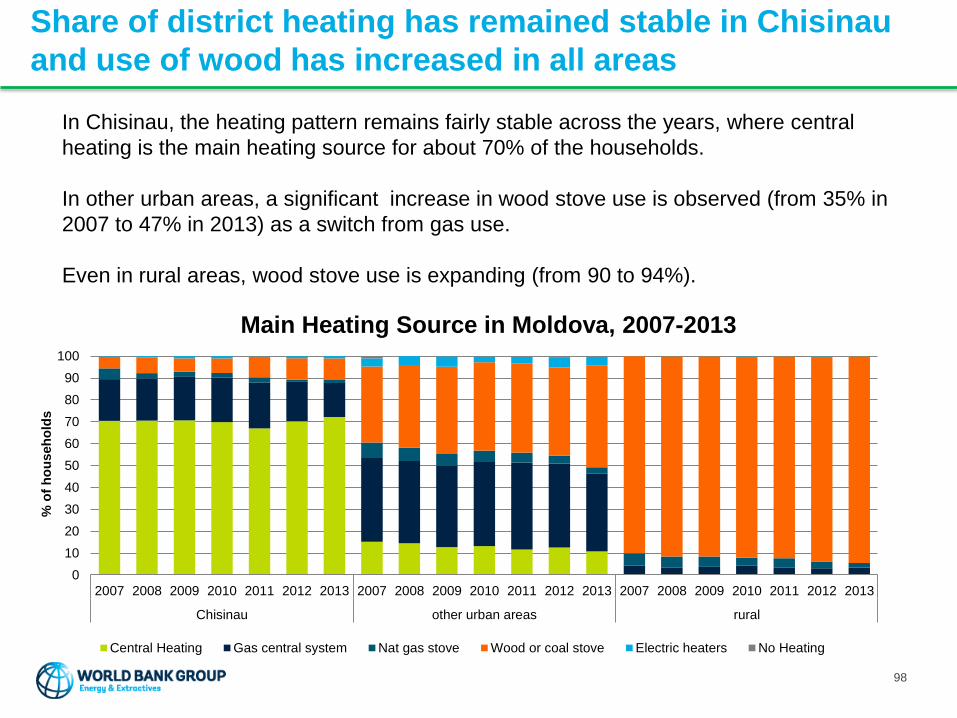
Share of district heating has remained stable in Chisinau
and use of wood has increased in all areas
In Chisinau, the heating pattern remains fairly stable across the years, where central
heating is the main heating source for about 70% of the households.
In other urban areas, a significant increase in wood stove use is observed (from 35% in
2007 to 47% in 2013) as a switch from gas use.
Even in rural areas, wood stove use is expanding (from 90 to 94%).
0
10
20
30
40
50
60
70
80
90
100
2007 2008 2009 2010 2011 2012 2013 2007 2008 2009 2010 2011 2012 2013 2007 2008 2009 2010 2011 2012 2013
Chisinau other urban areas rural
% o
f h
ou
seh
old
s
Main Heating Source in Moldova, 2007-2013
Central Heating Gas central system Nat gas stove Wood or coal stove Electric heaters No Heating
98

Methodology and assumptions for the impact analysis
I- Baselines for the simulations :
Baselines for years 2016 and 2020 assume a constant nominal tariff for gas, electricity and central heating since 2014. All
other expenditures are extrapolated using households expenditures from 2013 Household Budget survey, assuming inflation
and uniform private consumption growth as per World Bank projection (average annual private consumption growth 0.6% by
2016 and 2.6% by 2020). Also, electricity consumption is assumed to increase by 2% per year.
Poverty rate of baseline scenarios is calculated using the national poverty line, increased by the inflation.
II- Assumptions for impact of tariff increase, a low and a high scenario, for central heating, gas and electricity as in table below.
Both low and high tariff scenarios also use World Bank projection for economic growth, as well as inflation for all other
expenditures than central heating, gas and electricity. Poverty is calculated using the national poverty line, increased by the
inflation.
III- Increase in poverty is calculated in adjusting the welfare aggregate for each individual (total expenditures per adult
equivalent) for the loss of purchasing power due to the energy tariff increase
We do not apply price elasticity for conservative estimates. In the long term, it is possible that demand side energy efficiency investments reduce
consumption.
99
2014Low scenario High scenario
2016 2020 2016 2020
Heat tariff (MDL/Gcal) and increase compared to
2014 (%)987 21% 30% 80% 78%
Electricity tariff (bani/kWh) and increase
compared to 2014 (%)152 42% 73% 61% 113%
Average consumer gas tariff (MDL/tcm) and
increase compared to 2014 (%)6096 25% 47% 25% 47%
Inflation compared to 2014 (%) - 16% 47% 16% 47%
APPENDIX 5 – ADDITIONAL DETAILES TO SOCIAL
PROTECTION ANALYSIS
100
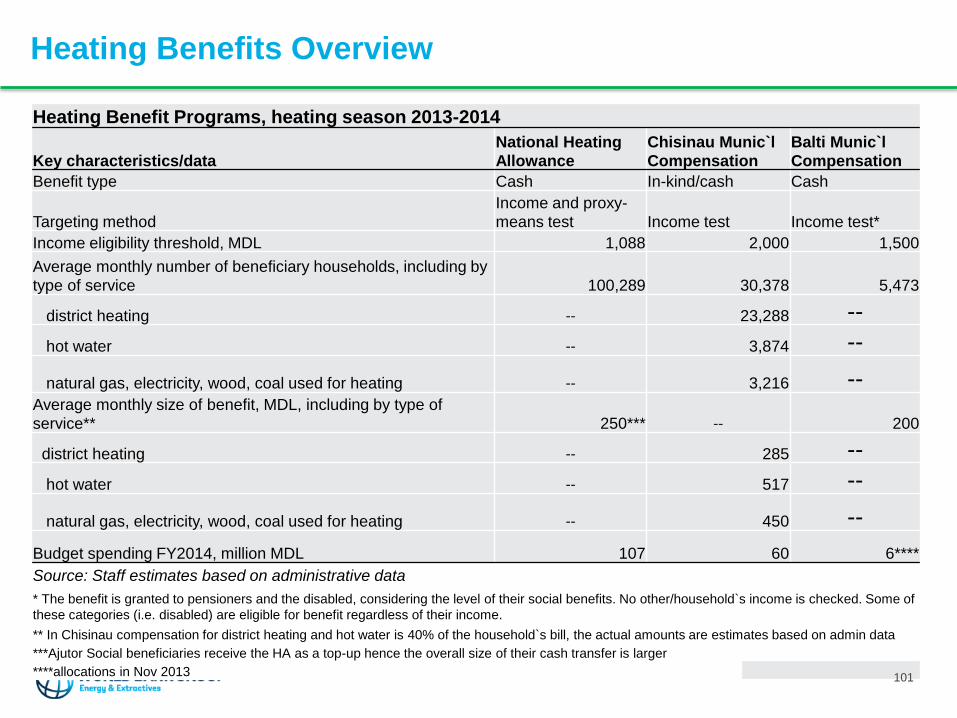
Heating Benefits Overview
Heating Benefit Programs, heating season 2013-2014
Key characteristics/data
National Heating
Allowance
Chisinau Munic`l
Compensation
Balti Munic`l
Compensation
Benefit type Cash In-kind/cash Cash
Targeting method
Income and proxy-
means test Income test Income test*
Income eligibility threshold, MDL 1,088 2,000 1,500
Average monthly number of beneficiary households, including by
type of service 100,289 30,378 5,473
district heating -- 23,288 --
hot water -- 3,874 --
natural gas, electricity, wood, coal used for heating -- 3,216 --Average monthly size of benefit, MDL, including by type of
service** 250*** -- 200
district heating -- 285 --
hot water -- 517 --
natural gas, electricity, wood, coal used for heating -- 450 --
Budget spending FY2014, million MDL 107 60 6****
Source: Staff estimates based on administrative data
* The benefit is granted to pensioners and the disabled, considering the level of their social benefits. No other/household`s income is checked. Some of
these categories (i.e. disabled) are eligible for benefit regardless of their income.
** In Chisinau compensation for district heating and hot water is 40% of the household`s bill, the actual amounts are estimates based on admin data
***Ajutor Social beneficiaries receive the HA as a top-up hence the overall size of their cash transfer is larger
****allocations in Nov 2013 101
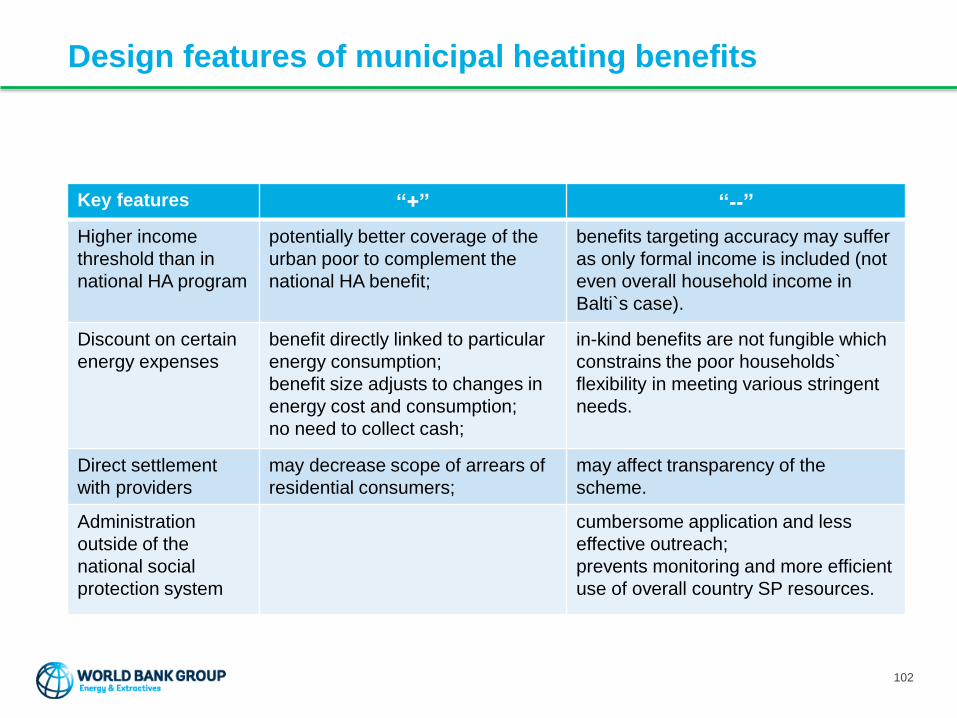
Design features of municipal heating benefits
Key features “+” “--”
Higher income
threshold than in
national HA program
potentially better coverage of the
urban poor to complement the
national HA benefit;
benefits targeting accuracy may suffer
as only formal income is included (not
even overall household income in
Balti`s case).
Discount on certain
energy expenses
benefit directly linked to particular
energy consumption;
benefit size adjusts to changes in
energy cost and consumption;
no need to collect cash;
in-kind benefits are not fungible which
constrains the poor households`
flexibility in meeting various stringent
needs.
Direct settlement
with providers
may decrease scope of arrears of
residential consumers;
may affect transparency of the
scheme.
Administration
outside of the
national social
protection system
cumbersome application and less
effective outreach;
prevents monitoring and more efficient
use of overall country SP resources.
102
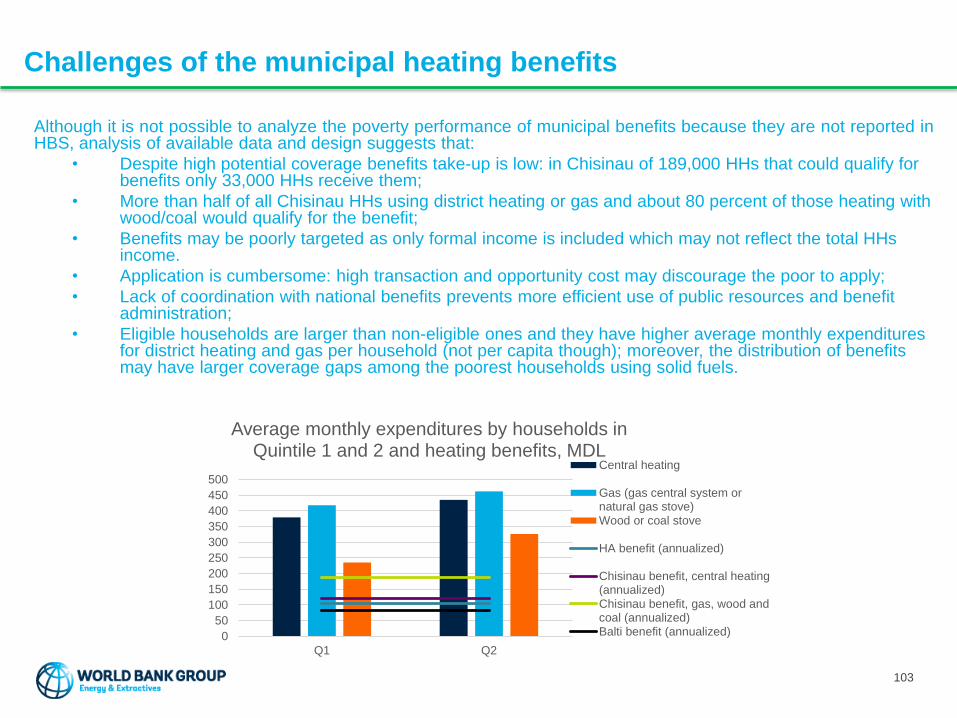
Challenges of the municipal heating benefits
Although it is not possible to analyze the poverty performance of municipal benefits because they are not reported inHBS, analysis of available data and design suggests that:
• Despite high potential coverage benefits take-up is low: in Chisinau of 189,000 HHs that could qualify for benefits only 33,000 HHs receive them;
• More than half of all Chisinau HHs using district heating or gas and about 80 percent of those heating with wood/coal would qualify for the benefit;
• Benefits may be poorly targeted as only formal income is included which may not reflect the total HHs income.
• Application is cumbersome: high transaction and opportunity cost may discourage the poor to apply;
• Lack of coordination with national benefits prevents more efficient use of public resources and benefit administration;
• Eligible households are larger than non-eligible ones and they have higher average monthly expenditures for district heating and gas per household (not per capita though); moreover, the distribution of benefits may have larger coverage gaps among the poorest households using solid fuels.
103
0
50
100
150
200
250
300
350
400
450
500
Q1 Q2
Average monthly expenditures by households in Quintile 1 and 2 and heating benefits, MDL
Central heating
Gas (gas central system ornatural gas stove)Wood or coal stove
HA benefit (annualized)
Chisinau benefit, central heating(annualized)Chisinau benefit, gas, wood andcoal (annualized)Balti benefit (annualized)

Adjusting Heating Allowance to compensate increased
district heating and gas costs
• Higher benefit may encourage more HHs to enroll for HA; yet, the gap between
effective and potential coverage of HA is even higher than that of AS and must be
reduced via effective rural outreach and better coordination with municipal benefits;
Low scenario High scenario
2015 2016 2020 2016 2020
Income threshold for HA, MDL 1,224 1,444 1,897 1,506 2,039
Number of HHs benefiting from HA 136,466 154,536 126,545 164,115 145,788
Number of HHs eligible for HA 397,066 449,644 368,199 477,515 424,190
Coverage by HA (current), % of population 9.2 10.4 8.6 11.1 9.8
Coverage by HA (perfect), % of population 26.8 30.4 25.2 32.2 28.6
HA budget, current take-up, mln MDL 171 390 392 509 519
HA budget, perfect take-up, mln MDL 496 1,136 1,139 1,480 1,511
HA budget, current take-up, % of GDP 0.14 0.30 0.21 0.39 0.27
HA budget, perfect take-up, % of GDP 0.42 0.88 0.60 1.15 0.79
Parameters of Targeted Social Assistance Benefits with adjusted GMI and HA benefit size
Source: Staff calculations based on HBS
104
Low scenario High scenario
2016 2020 2016 2020
Increase in energy cost (without
electricity) per winter month, MDL 298 561 433 869
Adjustment in monthly HA benefit, MDL 548 811 683 1119
Increase in energy costs and adjusted HA benefit size
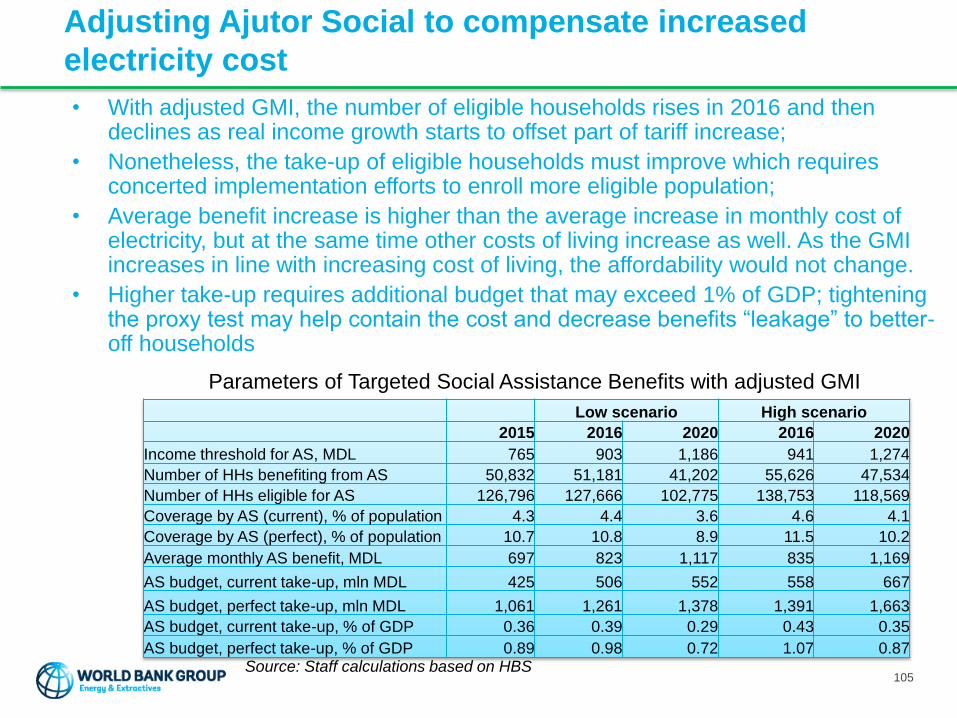
Adjusting Ajutor Social to compensate increased
electricity cost
• With adjusted GMI, the number of eligible households rises in 2016 and then declines as real income growth starts to offset part of tariff increase;
• Nonetheless, the take-up of eligible households must improve which requires concerted implementation efforts to enroll more eligible population;
• Average benefit increase is higher than the average increase in monthly cost of electricity, but at the same time other costs of living increase as well. As the GMI increases in line with increasing cost of living, the affordability would not change.
• Higher take-up requires additional budget that may exceed 1% of GDP; tightening the proxy test may help contain the cost and decrease benefits “leakage” to better-off households
Low scenario High scenario
2015 2016 2020 2016 2020
Income threshold for AS, MDL 765 903 1,186 941 1,274
Number of HHs benefiting from AS 50,832 51,181 41,202 55,626 47,534
Number of HHs eligible for AS 126,796 127,666 102,775 138,753 118,569
Coverage by AS (current), % of population 4.3 4.4 3.6 4.6 4.1
Coverage by AS (perfect), % of population 10.7 10.8 8.9 11.5 10.2
Average monthly AS benefit, MDL 697 823 1,117 835 1,169
AS budget, current take-up, mln MDL 425 506 552 558 667
AS budget, perfect take-up, mln MDL 1,061 1,261 1,378 1,391 1,663
AS budget, current take-up, % of GDP 0.36 0.39 0.29 0.43 0.35
AS budget, perfect take-up, % of GDP 0.89 0.98 0.72 1.07 0.87
Parameters of Targeted Social Assistance Benefits with adjusted GMI
Source: Staff calculations based on HBS105

Detailed recommendations on social assistance policies
• Improve the take-up of AS and HA programs to increase the coverage of the poor by national benefits through design and implementation measures
• Introduce mandatory annual revision of the income threshold (GMI) by CPI growth to maintain its real value and make further adjustments over the budget year, as necessary to address acute income shocks such as significant energy tariff increases
• Streamline eligibility for rural self-employed and households without workable members
• Better outreach by local social assistants
• Better coordination with municipal benefits
• Increase the coverage of the poor and targeting accuracy of municipal benefits
• The national and municipal programs should be coordinated better to improve their performance and to manage fiscal pressure on local budget
• Incremental cost of covering the urban poor with national benefits is high, hence municipal benefits are important complementarity
• The potential coverage of municipal benefits is high but the targeting accuracy and take-up can be significantly improved
• Streamline administration by linking municipal benefits to national social protection system to reduce paper work (MIS, cross-checks with registries), to prevent overlap and enhance take-up through referrals, to reduce abuse (expand mandate of the Social Inspection), and to better manage municipal budgets` fiscal risks
• Maintain adequacy of benefits:
• HA will have to raise while AS benefit will adjust through higher income threshold
• Municipal programs may offer higher benefits for lower income and larger households through offering higher compensation at lower income threshold and an increment for the third and above household member
• Contain fiscal cost:
• Proxy means-test may need to tighten to prevent high “leakage” of benefits to better off households
• The increased benefits could cost the budget over 2% of GDP in 2016. Therefore categorical benefits` consolidation is needed to reallocate budget resources to targeted transfers
• Linking of the municipal and national programs is needed to avoid overlap and to ensure complementarity of benefits (e.g. for the households eligible for both national HA and municipal benefits the local budget can pay the difference between the two). This would require a lot of changes in benefits delivery.
106
MIS = national management information systems
APPENDIX 6 – SUMMARY OF SCENARIO ANALYSIS
107
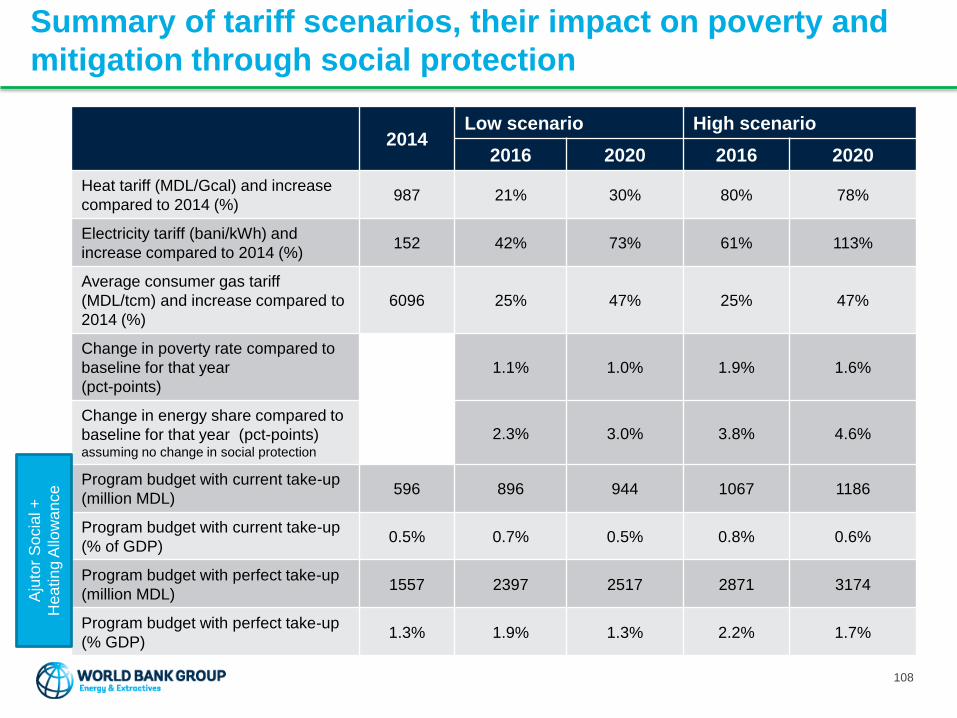
Summary of tariff scenarios, their impact on poverty and
mitigation through social protection
2014Low scenario High scenario
2016 2020 2016 2020
Heat tariff (MDL/Gcal) and increase
compared to 2014 (%)987 21% 30% 80% 78%
Electricity tariff (bani/kWh) and
increase compared to 2014 (%)152 42% 73% 61% 113%
Average consumer gas tariff
(MDL/tcm) and increase compared to
2014 (%)
6096 25% 47% 25% 47%
Change in poverty rate compared to
baseline for that year
(pct-points)
1.1% 1.0% 1.9% 1.6%
Change in energy share compared to
baseline for that year (pct-points)assuming no change in social protection
2.3% 3.0% 3.8% 4.6%
Program budget with current take-up
(million MDL)596 896 944 1067 1186
Program budget with current take-up
(% of GDP)0.5% 0.7% 0.5% 0.8% 0.6%
Program budget with perfect take-up
(million MDL)1557 2397 2517 2871 3174
Program budget with perfect take-up
(% GDP)1.3% 1.9% 1.3% 2.2% 1.7%
Aju
tor
So
cia
l +
Hea
tin
g A
llow
an
ce
108
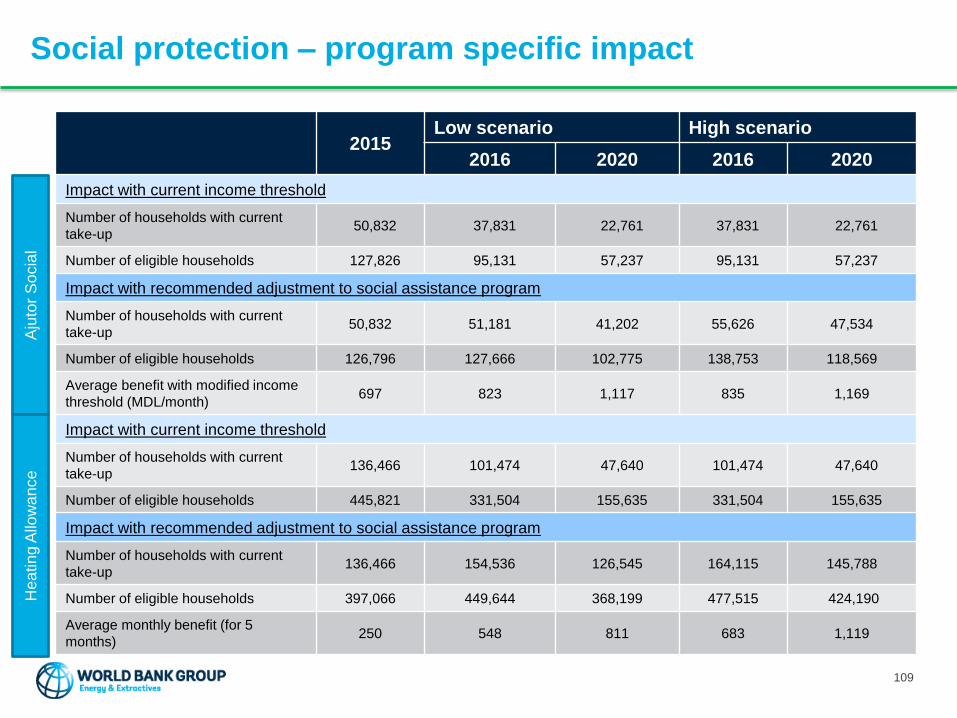
Social protection – program specific impact
2015Low scenario High scenario
2016 2020 2016 2020
Impact with current income threshold
Number of households with current
take-up50,832 37,831 22,761 37,831 22,761
Number of eligible households 127,826 95,131 57,237 95,131 57,237
Impact with recommended adjustment to social assistance program
Number of households with current
take-up50,832 51,181 41,202 55,626 47,534
Number of eligible households 126,796 127,666 102,775 138,753 118,569
Average benefit with modified income
threshold (MDL/month)697 823 1,117 835 1,169
Impact with current income threshold
Number of households with current
take-up136,466 101,474 47,640 101,474 47,640
Number of eligible households 445,821 331,504 155,635 331,504 155,635
Impact with recommended adjustment to social assistance program
Number of households with current
take-up136,466 154,536 126,545 164,115 145,788
Number of eligible households 397,066 449,644 368,199 477,515 424,190
Average monthly benefit (for 5
months)250 548 811 683 1,119
Aju
tor
So
cia
lH
ea
tin
g A
llow
an
ce
109

Assumptions related to social protection estimates
2014Low scenario High scenario
2016 2020 2016 2020
No change in social assistance programs
Income threshold for Ajutor Social 765 765 765 765 765
Income threshold for Heat Allowance 1,224 1,224 1,224 1,224 1,224
Adjustments in social assistance programs based on energy tariff increases
Income threshold for Ajutor Social 765 903 1,186 941 1,274
Income threshold for Heat Allowance 1,224 1,444 1,897 1,506 2,039
110