Embed Size (px)
Citation preview
DISCUSSION PAPER SERIES
IZA DP No. 11612
Catalina Amuedo-DorantesCynthia BansakSusan Pozo
Refugee Admissions and Public Safety: Are Refugee Settlement Areas More Prone to Crime?
JUNE 2018

Any opinions expressed in this paper are those of the author(s) and not those of IZA. Research published in this series may include views on policy, but IZA takes no institutional policy positions. The IZA research network is committed to the IZA Guiding Principles of Research Integrity.The IZA Institute of Labor Economics is an independent economic research institute that conducts research in labor economics and offers evidence-based policy advice on labor market issues. Supported by the Deutsche Post Foundation, IZA runs the world’s largest network of economists, whose research aims to provide answers to the global labor market challenges of our time. Our key objective is to build bridges between academic research, policymakers and society.IZA Discussion Papers often represent preliminary work and are circulated to encourage discussion. Citation of such a paper should account for its provisional character. A revised version may be available directly from the author.
Schaumburg-Lippe-Straße 5–953113 Bonn, Germany
Phone: +49-228-3894-0Email: [email protected] www.iza.org
IZA – Institute of Labor Economics
DISCUSSION PAPER SERIES
IZA DP No. 11612
Refugee Admissions and Public Safety: Are Refugee Settlement Areas More Prone to Crime?
JUNE 2018
Catalina Amuedo-DorantesSan Diego State University and IZA
Cynthia BansakSt. Lawrence University and IZA
Susan PozoWestern Michigan University and IZA

ABSTRACT
IZA DP No. 11612 JUNE 2018
Refugee Admissions and Public Safety: Are Refugee Settlement Areas More Prone to Crime?*
According to United Nations High Commissioner for Refugees, the number of refugees
worldwide rose to 21.3 million in 2015. Yet, resistance to the welcoming of refugees
appears to have grown. The possibility that refugees may commit acts of terrorism or
engage in criminal behavior has served as fuel for the Trump Administration’s position in
2017. Is there any basis for these fears? We exploit the variation in the geographic and
temporal distribution of refugees across U.S. counties to ascertain if there is a link between
refugee settlements and local crime rates or terrorist events in the United States. We fail to
find any statistically significant evidence of such a connection.
JEL Classification: F22, J61, J68
Keywords: refugees, crime, United States, terrorism
Corresponding author:Cynthia BansakDepartment of EconomicsSt. Lawrence UniversityCanton, NY 13617USA
E-mail: [email protected]
* We are grateful to Paolo Verme and participants at the Conference and Policy Forum on Impacts of Refugees and
IDPs on Host Communities organized by the World Bank for their comments to an earlier draft.

1
1. Introduction
According to the United Nations High Commissioner for Refugees (UNHCR), the number
of refugees worldwide rose to 21.3 million in 2015. Conflicts, political upheaval, deteriorating
security and grinding poverty have contributed to the growing flow of refugees around the world,
particularly from the Middle East, Africa and Asia. Most recently, following the five-year-old
civil war, the focus has been on Syria, even though Afghans escaping the Taliban war and Eritreans
fleeing forced labor preceded the flow of Syrians in their search for safety and freedom. According
to UNHCR (2016), the war in Syria has resulted in 4.6 million refugees and 6.6 million internally
displaced individuals. These numbers are the largest in decades and have resulted in controversy
regarding the long-term implications for refugee-receiving countries (Del Carpio and Wagner,
2015).
In 2016, the situation became untenable as thousands of refugees awaited resettlement in
overflowing refugee camps with individuals unable to return home and with no prospects for
settlement elsewhere. Due to their relative proximity to Syria, European and Middle Eastern
countries had been bearing the brunt of this humanitarian crisis.1 In response, former President
Obama reiterated the commitment of the United States to contribute more by raising the overall
annual admissions quota to 110,000 for 2017, a nearly 60 percent increase over 2015 admission
1 While the United States runs large settlement programs, most refugees tend to go to countries that share a border
with their home country. For example, about 95 percent of refugees from Afghanistan go to Pakistan and Iran. There
were approximately eleven million refugees in 2013, according to the UNHCR (2014).The Middle East and North
Africa have approximately 2.63 million refugees. Asia hosts 3.5 million refugees, and Africa 2.9 million refugees
(UNHCR, 2013). Thus, the vast majority of refugees (nearly 90 percent in 2013) are hosted by low- and middle-
income countries.

2
levels.2 At the conclusion of the 2016 fiscal year, the United States had resettled 84,955 refugees,3
making progress on its commitment to raise refugee admission and playing a more prominent role
in accommodating refugees.4
With the new administration in 2017, however, the United States has completely changed
its course of action regarding its admittance policy for new refugees. Only one week into President
Trump’s term, the executive order: Protecting the Nation from Terrorist Attacks by Foreign
Nationals, mandated a 120-day suspension the U.S. refugee program along with a 90-day ban for
admissions of any national from a list of countries, thought to be a risk for producing terrorists –
namely: Iran, Iraq, Libya, Somalia, Sudan, Syria, and Yemen (Davis, 2017; National Public Radio,
2017)5. The executive order singled out Syrians as being subject to the ban indefinitely, while
allowing for an exception for certain religious minorities in Syria (believed to refer to Christian
Syrians). This has been interpreted as introducing a religious test for access to refugee status
(Shear and Cooper, 2017). In addition, the numerical 2017-refugee admission ceiling of 110,000
was cut by more than half to 50,000 by President Trump’s order.
The competing visions of the Obama and Trump presidencies have launched a national
discussion concerning the role of the United States in addressing the global refugee crisis and the
pros and cons to doing so. Should the United States step up, maintain, restructure or close the
refugee program? The main point of contention in this discussion is with respect to crime and
2 See: http://www.migrationpolicy.org/article/us-meets-2016-syrian-refugee-admission-goal-opposition-new-
resettlement-mounts 3 See: https://www.state.gov/j/prm/ra/admissions/index.html 4 See: http://www.huffingtonpost.com/entry/refugees-us-germany-comparison_us_55f73b32e4b0c2077efbc52e and
Capps, R., & Newland, K. (2015). The integration outcomes of US refugees: Successes and challenges. Migration
Policy Institute. 5 In a subsequent order, Iraq was left off the list of banned nations (Glenn Thrush, “Trumps New Ban Halts
Travelers from 6 Nations, New York Times, March 7, 2017, p. A1.)
3
national security, with a number of individuals voicing concerns that refugees will raise crime
levels and put settlement areas at risk for terrorist activities.6
We test this hypothesis. Specifically, we exploit the geographic and temporal variation in
the distribution of refugees across U.S. counties to ascertain whether there is a link between U.S.
refugee settlements and crime. Using county-level data from the Refugee Processing Center in the
Bureau of Population, Refugees and Migration at the Department of State from 2006 through 2014,
we assess whether refugee placements are tied to the crime reports collected from the Uniform
Crime Reporting Program (UCR), as well as to terrorist incidents gathered from the
Global Terrorism Database (GTD).
Given the ongoing refugee crises around the world and the increasingly restrictive policy
regarding the admission of refugees, gaining a better understanding of the facts is essential in order
to devise immigration policies that address native concerns, avoid the misrepresentation of the
refugee phenomenon, and is not used for political opportunism.
2. Background on the U.S. Refugee Program
How does the refugee resettlement process work in the United States? First, migrants have
to fit the refugee definition in section 101(a)(42) of the Immigration and Nationality Act. The
requirement implies that an individual cannot return to their country of nationality due to a well-
founded fear of persecution because of their religion, race, political opinion or membership in a
social group. They must be outside their country of nationality when they apply for refugee status,
but not in the U.S. and must have been referred to the U.S. program –generally, by the UNCHR
6 While welcoming refugees had been phrased in terms of a collective security issue, this commitment did not sit well
with a number of officials, specifically in terms of accepting Syrian refugees. In November 2015, CNN reported that
31 U.S. governors were opposed to settling Syrian refugees in their states. According to a new poll by The Associated
Press-NORC Center for Public Affairs Research, fifty-two percent of those interviewed say refugees pose a great
enough risk to further limit their entry into the United States (March 2017). See: http://www.apnorc.org/news-
media/Pages/Poll-Americans-divided-on-admitting-refugees.aspx
4
(Mossad, 2016). This triggers a lengthy investigative process (carried out by the U.S. Citizenship
and Immigration Services or USCIS) involving interviews to determine eligibility and stringent
security checks. The length of this process will vary from case to case, with the U.S. Department
of State estimating it to take from 18 to 24 months since the referral to U.S. authorities by
UNCHR.7,8
Once a refugee is determined to be eligible for admission into the United States, the USCIS
refers them to one of nine resettlement agencies (e.g. U.S. Conference of Catholic Bishops,
International Rescue Committee, or the Hebrew Immigrant Aid Society). The agency works with
their affiliates located across the United States to find a spot for the refugee. The objective is to
place refugees where they can more easily adjust, and where the conditions are best for their
successful social and economic integration. The location of other family members and the
concentration of communities that speak the refugee’s language are two variables that agencies
pay special attention to when determining where to geographically place refugees.9 In addition,
the Office of Refugee Resettlement works with local agencies to place refugees and provide them
with services, including language instruction, job training, job placement services, housing and
health care.
Refugees must apply for legal permanent residency (LPR) status after being present in the
U.S. as refugees for one year. After four years of LPR status, the refugee may then apply for
naturalization. While applying for LPR status after being present in the United States as a refugee
7 See: https://www.state.gov/j/prm/ra/admissions/index.htm. 8 Refugees are often confused with asylum seekers. Asylum seekers are international migrants who apply for asylum,
or protection as a refugee, after entering the country in which they petition for asylum. In essence, asylum seekers are
people who have left their home country and whose claims for refugee status have not yet been evaluated. The country
they are in must determine whether they meet the grounds for being considered an asylee. Asylum seekers who are
denied asylee status usually must leave the destination country and are deported back to their origin country. 9 See: https://www.rescue.org/topic/refugees-america#how-does-the-resettlement-process-work

5
for one year is required, it is not necessary that the individual applies to change their status from
LPR to a U.S. citizen (www.state.gov/j/prm/releases/factsheets/2017/266447.html). That said, an
advantage to citizenship is that it protects individuals from deportation should they commit a
crime.10
3. Related Literature
While there is a wider literature examining the criminal involvement of immigrants,11 to
our knowledge, this is the first paper examining the criminal involvement of refugees in the United
States. However, possibly due to their larger refugee flows, there is a literature examining the
criminal involvement of refugees or individuals of alike legal status in a few European countries.
For instance, focusing on a large wave of asylum seekers settling in the United Kingdom in the
1990-2000 period, Bell, Fasani and Machin (2013) explore if crime rates are related to asylee
inflows within the same jurisdictions. They conclude that, while violent crime is unaffected by
asylum inflows, there is a very slight upward bump to property crime. The authors note that these
refugees had relatively few economic opportunities, as they were barred from working for six
months. This may have raised their propensity to commit property crimes relative to immigrants
with immediate work-eligibility.12
10 See: http://www.nolo.com/legal-encyclopedia/grounds-deportability-when-legal-us-residents-can-be-
removed.html 11 Instead of focusing on refugees, a number of studies have either examined the role of legal status on migrants’
criminal involvement (e.g. Mastrobuoni and Pinotti 2015, Pinotti 2017, or Freedman, Owens and Bohn (forthcoming)),
or on the overall link between immigration flows and criminal activity. Within this latter group, much of the work
has been focused on Europe (e.g. Bianchi, Buonanno and Pirotti 2012, Nunziata 2015, or Piopiunik and Ruhose 2017).
In the United States, Butcher and Piehl (1998) fail to find a significant link between immigration flows and crime at
the city level. Spenkuch (2013), however, concludes that immigration has a small positive impact on property crime,
but none on violent crime. More recently, Chalfin (2014) claims that there is little to no evidence linking immigration
to crime. Only in the case of aggravated assault are crime rates lifted by immigration (Chalfin 2015). 12 Their findings prove robust to identification checks assessing the potential biases in their estimates due to the
endogenous location of immigrants. They make use of exogenous variation in the location of asylees, by virtue of the
U.K.’s “dispersal policy” (i.e. the National Asylum Support Service chooses destinations for the settlers needing
accommodations with the intent of achieving a wide geographic spread of the newcomers) to instrument for the
location of migrants.

6
Likewise, Gehrsitz and Ungerer (2017) point to similar patterns. They document increases
in non-violent crime rates associated with the recent and large 2014 and 2015 refugee influx into
Germany. The uptick is modest, however, and revolves mostly around drug activity and fare
dodging, and as in the United Kingdom case, is possibly related to the lack of employment
opportunities for refugees over the time period of the study.
A somewhat more ominous finding is obtained using Switzerland as a refugee destination.
Couttenier et al. (2017) conclude that asylees exposed to civil conflict or mass killings as children
are more likely to commit violent crime relative to asylees from the same country, who were not
exposed to the same events during their childhood. While this study does show how childhood
exposure to violence might have impacts years later, it does not answer whether refugee status in
itself is associated to a higher criminal proclivity. After all, natives subject to violence in childhood
might also be found to be more prone to criminal activities than natives not subject to violence
during childhood.
Our research also relates to an area of work that examines how refugees assimilate into
labor markets. If refugees quickly find employment and do not suffer considerable income losses
upon arrival to their new location, they would be less likely to engage in criminal behavior. The
speed and ease of labor market assimilation of refugees has been studied in both Europe and the
United States. While there is mixed evidence, on net, most studies of refugees in Europe find that
initial gaps in labor market outcomes between refugees and native-born workers close faster than
those of other immigrant groups when compared with their native-born counterparts. According
to Dustmann et al. (2016), the refugee-native employment gap is initially sizable, the difference is
cut in half after one decade, and is essentially non-existent after 25 years in the host country. This
pattern is not observed among economic migrants, who do not catch-up with native-born as
7
refugees do. Other studies of European refugees also find evidence of a catch-up effect among
refugees that suggests they transition quickly into new labor markets (Aiyar et al. 2016, Luik et al
2016).13 Based on these findings, we would not expect a significant increase in crime resulting
from refugee arrivals. In fact, crime rates could possibly decline if refugees assimilate more
quickly than non-refugees do.
In the United States, Cortes (2004) finds that refugees who arrived between 1975 and 1980
fared better than their economic immigrant counterparts by 1990 in terms of earnings and English
skills and attributed these gains to investment in country specific human capital. More recently,
Giri (2016) focuses on age at entry and finds that wage gains are concentrated among younger
refugees, who are motivated to invest in human capital and get jobs. At any rate, neither the young
nor old should be more likely to resort to criminal activity compared to their non-refugee
counterparts because: (1) the young fare well in the labor market, and (2) older refugees have
access to social and welfare benefits that alleviate their poverty exposure. Overall, then, refugees
should be less likely to suffer from negative income shocks potentially linked to engagement in
criminal activity as a means to address economic needs.
4. Methodology
4.1 Conceptual Framework and Main Hypothesis
Models of criminal behavior predict that the decision to commit crime is a function of
economic opportunities or lack thereof. The seminal work in this area is the study by Becker
(1968) followed by Ehrlich (1973), who described the decision to commit a crime as one involving
a cost-benefit analysis under uncertainty. Individuals rationally decide how to allocate their time
13 An exception is the study by (Bratsberg et al. (2014, 2016), who find evidence of increased use of social services
among refugees in Norway, as opposed to increased ties to the labor market.

8
between legal and illegal activities. If, for example, the benefits from committing a crime outweigh
the costs and are, on net, higher than the utility derived from legal earnings, individuals will choose
the path of illegal pursuits. That is:
(1) [(1-p)*U(Wc) – p*U(S)] > U(W)
where U(Wc) represents the utility of criminal earnings or wage, p is the probability of getting
caught engaging in said activities, S represents the sanctions imposed if arrested, and W is the
ongoing market wage for licit work.
This basic model, which has informed numerous empirical analyses assessing the role of
socioeconomic factors in guiding individuals’ criminal engagement (e.g. Buonanno 2003), can be
updated to reflect the decision-making of refugees to commit a crime, relative to that of non-
refugees. Our unit of analysis is the county. In particular, because refugees immediately have
access to a number of resources upon arrival, their payoff to criminal activities is likely to be lower
than that non-refugees.14 That is, assuming both choose to engage in criminal activities:
(2) {[(1-p)*U(Wcr) – p*U(Sr)] > U(Wr)} < {[(1-p)*U(Wcn) – p*U(Sn)] > U(Wn)}
where p is the probability of getting caught, U(Wcr) represents the utility of the wage a refugee
could garner if committing a crime, Sr represents the sanctions from getting caught as a refugee,
and Wr is the legal wage for refugees. The subscript ‘n’ denotes non-refugee individuals.
According to equation (2), relative to non-refugees, refugees will display a lower tendency of
getting involved in criminal activities. After all, they have more to lose as they face a higher cost
(Sr) from being caught given the benefits they receive, the lengthy vetting process they have to
submit themselves to, and their inability to return home. Non-refugees migrants have likely gone
through a less cumbersome vetting process, or none at all, and are more likely to be able to return
14 We are assuming here that non-refugees are either native-born individuals or non-refugee migrants who
have arrived in the US as possible economic migrants or for family reunification reasons.
9
home than their refugee counterparts. Native-born individuals have no risk of deportation. Hence,
all else equal, we would expect the following relationship to hold for the various costs of
committing a crime for the three groups: Sr ≥ Snon-refugee immigrant ≥ Snative.
Along these lines, it has been shown that the criminal propensity of immigrants is lower
than that of natives. One would expect that of refugees to be even lower. Given the forced
migration of refugees, it appears reasonable to assume that refugees face the largest costs and will
have the lowest propensity to commit a crime, followed by other immigrants and, then, by native
born individuals. In what follows, we assess whether that is, indeed, the case, by examining if the
concentration of refugees is directly linked to differential criminal rates.
4.2 Empirical Model Specification
Our main goal is to learn how refugees might be influencing local crime rates, if at all.
Property crimes, which account for the vast majority of crimes, have been frequently modeled
using the orthodox economic model of crime participation proposed by Becker (1968) and Ehrlich
(1973), with some authors applying it to explain participation in violent criminal activity (see
Grogger 2000). Following the Becker/Ehrlich framework and its adaptation to the behavior of
refugees and non-refugees as outlined in equation (2), we estimate the following benchmark
model:
(3) 𝑌𝑐𝑡 = 𝛼 + 𝛽𝑅𝑐𝑡 + (𝑋𝑐1980 ∗ 𝑡𝑟𝑒𝑛𝑑)𝛾 + 𝛿𝑍𝑐𝑡 + 𝜃𝑐 + 𝜗𝑡 + 휀𝑐𝑡
where our dependent variable (𝑌𝑐𝑡) is the number of arrests per 1,000 people in county c and year
t. The only exception is when examining terrorism incidents. Since they are not as common, we
use a simple count variable –namely, the overall number of incidents in the county c in year t.15
15 We also experimented with Poisson and negative binomial models to accommodate the nature of the dependent
variable; however, both models proved non-tractable due to the large number of county fixed-effects. As an
10
Our explanatory variable of interest (𝑅𝑐𝑡) is the number of refugees per 1,000 people in county c
in year t.16 In counties with no refugee inflows, 𝑅𝑐𝑡 is set to zero.
The vector 𝑋𝑐1980 includes aggregate characteristics of each county potentially correlated
with crime rates given their link to the relative economic payoff of engaging in illicit activities,
such as the share of the county’s population with different levels of educational attainment, as well
as the county’s employment rates, per capita income, per capita housing construction –a proxy for
economic growth, and spending on police protection per capita. These controls, all reflective of
either labor market opportunities, the economic environment in the county or police spending, help
us capture the returns to illicit (Wcr, Wcn) and legal (Wr, Wn) labor market activities. Because of
endogeneity concerns with county crime rates, they are all measured prior to the period under
examination in 1980. To address their variability over time, they are included in the model
interacted with a time trend. Finally, equation (3) also includes information on housing costs –an
important contemporaneous determinant of refugee placements by agencies given the housing
assistance provided to refugees during the first few months.
To conclude, the model also includes county and year fixed-effects. The county-level
controls address any unobserved time-invariant characteristics potentially correlated to criminal
reports, such as traditionally tougher-on-crime counties, which may impact the likelihood of
alternative, we estimated linear probability models (LPM) using an alternative dichotomous variable indicative of
whether any terror event took place as our dependent variable. The results from these estimations, which are displayed
in the Table B in the appendix, confirm our general findings. There is no statistically significant evidence of a link
between refugee admissions and the likelihood of a terrorist event. 16 We use flows instead of stocks as refugees are only categorized as refugees for a short period. Refugees are able
and likely expected to apply for naturalization after a year in the US. Most benefits, such as the Refugee Cash
Assistance (RCA) program are only available to those in a refugee status for the first 8 months in the US. Afterwards,
refugees may apply for additional assistance at the state level and can also apply for Medicaid, TANF and other
benefits as naturalized immigrants. Thus, identifying a stock of immigrants would be difficult due to the short-term
nature of refugee status. (Source: GAO Report Iraqi Refugees and Special Immigrant Visa Holders Face Challenges
Resettling in the United States and Obtaining U.S. Government Employment, available at:
http://www.gao.gov/new.items/d10274.pdf)
11
sanctions, p, or the intensity of sanctions: Sn and Sr. Additionally, to address macroeconomic
shocks, such as the Great Recession that started in 2008 in the United States, we incorporate year
fixed-effects. As such, identification comes from variation within a county over time.17 The
coefficient of interest is 𝛽, which measures how an increase in the share of refugees in a given
county alters local crime rates. Equation (3) is estimated using ordinary least squares (OLS) for
all crimes, as well as separately for violent crimes, property crimes and the incidence of terrorism
events.
4.3 Endogeneity of U.S. Refugee Settlements
At this point in the analysis, it is worth discussing one of the most notable threats to
identification. Equation (3) treats the location of refugees as exogenous, which would be justified
if the U.S. resettlement program selects the destinations of incoming refugees randomly.
Nonetheless, these locations might be subject to endogeneity concerns if, for example, some
counties are more welcoming of refugee settlements and actively seek them to revitalize certain
geographic areas or sectors of their economies. If crime rates are higher in less economically
active areas and refugees are placed in those areas with the hope they might help revitalized them,
the impact of refugee settlements on crime could be biased upwards.
To address the possible non-random location of refugees, we employ an instrumental
variable (IV) approach that exploits migrants’ tendency to locate and be placed together,18 often
into communities with immigrants from the refugee’s geographic area to facilitate their social and
economic assimilation.19 Specifically, we construct a “shift-share” prediction of the placement of
17 We do not include county-specific time trends because the number of fixed-effects would exceed the number of
observations. 18 E.g. Bartel (1989), Munshi (2003), Card (2001) or Cortés and Tessada (2010), among many others. 19 While the settlement of refugees varies from year to year depending on the volume of applications, most refugees
reside in what are considered predominantly immigrant states –namely California, New York and Texas (Krogstad
and Radford 2017), which justifies using prior networks of countrymen as an instrument for their current location.

12
refugees from origin, o, into each county, c, in each year, t, along the lines of Altonji and Card
(1991) and Card (2001). The prediction is based on the idea that refugee placement is likely to be
influenced by immigration networks. In the interest of easing assimilation, agencies seek to place
refugees into communities with concentrations of immigrants from similar regions/countries. The
instrument is, therefore, given by:
(4) 𝑠ℎ𝑖𝑓𝑡 𝑠ℎ𝑎𝑟𝑒_𝑟𝑒𝑓𝑢𝑔𝑒𝑒𝑠𝑜𝑐𝑡̂ = 𝜑𝑜𝑐1980 × 𝑟𝑒𝑓𝑢𝑔𝑒𝑒𝑠𝑜𝑡
where 𝑠ℎ𝑖𝑓𝑡 𝑠ℎ𝑎𝑟𝑒_𝑟𝑒𝑓𝑢𝑔𝑒𝑒𝑠𝑜𝑐𝑡̂ is the estimated number of new refugees from country of origin
o in county c in year t and 𝜑𝑜𝑐1980 is the share of all U.S. immigrants from country of origin o who
resided in county c in 1980 –more than 25 years ago, and 𝑟𝑒𝑓𝑢𝑔𝑒𝑒𝑠𝑜𝑡 is the inflow of refugees
from country o in year t.
5. Data and Descriptive Statistics
5.1 Data Sources
To perform our analysis, we gather data from various sources. Because of different data
restrictions, we focus on the 2006 through 2014 period. First, data on the city placements of
refugees from various origins originate from the Refugee Processing Center in the Bureau of
Population, Refugees and Migration at the Department of State.
In addition, measures of crime at the county level are gathered from the ICPSR’s Uniform
Crime Reporting Program Data: County-Level Detailed Arrest and Offense Data (henceforth
UCR).20 This data is a compilation of monthly crime reports submitted to the FBI from law
enforcement agencies around the country. The FBI classifies crimes into two categories: Part 1
crimes and Part 2 crimes. Part 1 crimes refer to more egregious and violent criminal activities,
20 See: www.icpsr.umich.edu/icpsrweb/ICPSR/series/57

13
including murder, rape, robberies and aggravated assaults. Part 2 incidents refer to other criminal
activities including property crimes, forgery, vice, and drug abuse. The reports provide nationwide
counts of arrests for Part 1 and Part 2 crimes. We rely on arrest data counts since the FBI imputes
values for jurisdictions within each county that provided no or only partial information. This
allows us to obtain county-level measures of crime for the entire United States.21 Finally, it is
worth noting that, unlike the National Incident Based Reporting System (NIBRS), which details
each criminal incident, thus providing much richer information concerning criminal activity22, the
UCR data is nationally representative.23
The UCR dataset does not classify crime in such a way to identify which criminal acts are
motivated by terrorism. Yet, much of the ongoing concern centers on the possibility that greater
U.S. exposure to refugee inflows will cause a spike in acts of terrorism. In order to address this
more specific concern, we construct a separate dependent variable: terrorism incidents, and assess
if there is a link between refugee admissions and terrorism incidents in the United States. The data
are derived from the Global Terrorism Database (GTD). The GTD is a product of the National
Consortium for the study of Terrorism and Responses to Terrorism (START) and is headquartered
at the University of Maryland. The data are obtained by identifying “terrorist incidents” via the
consultation of newspapers and other media from around the world. Researchers comb these
sources of information in order to categorize, date, and geographically code events that can be
described as incidents of terrorism. The database tries to err on the side of inclusiveness. In order
to be considered terrorism, the event must fulfill a number of conditions (see GTD Codebook,
21 In contrast, the offense data is less useful since the FBI only imputes crime in jurisdictions that provide partial
information. 22 While the data are richer, they still do not report the nativity of the perpetuator. 23 While the UCR data currently cover about 98 percent of the U.S. population, only 30 percent of the U.S.
population is represented in NIBRS reports.
14
2016). The incident must be intentional, entail violence or immediate threat of violence, and it
must be perpetuated by a subnational group. Next, the incident must satisfy two of the following
three conditions: 1) intended to attain a political, social, religious or systemic economic goal; 2)
the incident must be attempting to convey a message/intimidate a broader audience, and not only
those who were impacted by the incident; 3) the incident must be outside the realm of legitimate
warfare. Since the location variable is provided at the city level, we mapped incidents by city into
county level data.
An additional point should be made concerning the GTD. The project to construct this
database is fairly recent. Consequently, much of the series in this database is constructed using
retrospective techniques. According to the START manual, there is a significant and discernible
increase in the number of terror events starting in 2012. This is due to an improvement in the
construction of the series at that time due to the contemporaneous nature of the data collection
going forward. We address these changes in the series with the inclusion of year fixed-effects.
Finally, we account for a number of county-level characteristics in our analysis: (1) trends
in county level statistics from 1980, and (2) housing price data at the (county, year) level. The
former include information on educational attainment, income, employment, police enforcement
and housing markets intended to capture the possible economic drivers of crime as they relate to
our model of the decision to engage in criminal behavior. For all those indicators, we use county
level data several decades prior to the period under examination in order to avoid any reverse
causality biases. We then include these variables in the model interacted with a time trend to
capture their variation over time. All the 1980 data series are obtained from the Census Bureau’s

15
county download website. Their construction and sources are detailed in the appendix.24 The
series are merged to the refugee and crime data by county.
In addition to the trends in the aforementioned county level traits, we include a housing
price index that varies yearly for each county to address one of the key determinants in the
placement of refugees by agencies –namely, housing costs. The series, which is merged to our
crime data at the (county, year) level, measures the change in the home price index (HPI) from the
Federal Housing Finance Agency.25 According to the FHFA, it serves as a broad measure of
changes in single-family housing prices.26 By having county-level time varying data on housing,
we are also able to control for county characteristics that change over time related to the important
and cyclical housing and construction industries. Annual county-level housing prices allow for
variations in county conditions that are not being picked up by a common trend or a linear
projection from 1980.
5.2 Some Descriptive Evidence
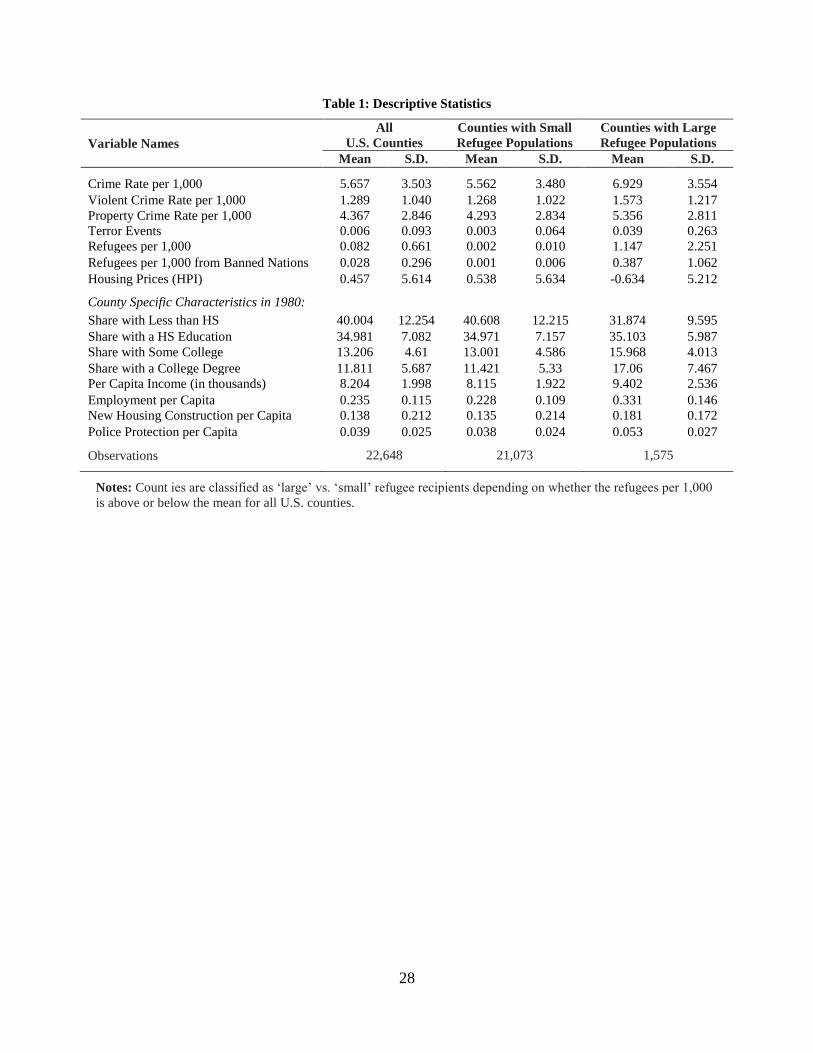
Table 1 provides some basic descriptive statistics for the sample we work with covering
the 2006 through 2014 period. Our key variables are:
(a) Total refugees by county-year: The United States has the largest refugee resettlement
program in the world and refugees are placed after an interview process that aims to find a location
for the best social and economic integration. Given the large established immigrant networks in
24 The excel spreadsheets were downloaded from https://www.census.gov/support/USACdataDownloads.html#LOG 25 The data can be downloaded at:
https://www.fhfa.gov/DataTools/Downloads/Documents/HPI/HPI_AT_BDL_county.xlsxv 26 In addition, the FHFA states that: “The HPI is a weighted, repeat-sales index, meaning that it measures average
price changes in repeat sales or refinancing on the same properties. This information is obtained by reviewing repeat
mortgage transactions on single-family properties whose mortgages have been purchased or securitized by Fannie
Mae or Freddie Mac since January 1975.” (https://www.fhfa.gov/DataTools/Downloads/pages/house-price-
index.aspx).

16
Texas, California, Arizona, and New York, it is not surprising that over half of the refugees placed
between 2006 and 2014 resided in these four states (see Table 2). At the county-level unit of
analysis, the top five counties in our sample are San Diego County (CA), Maricopa County (AZ),
Fort Bend County (TX), Los Angeles County (CA), and Denver County (CO).27 The overall share
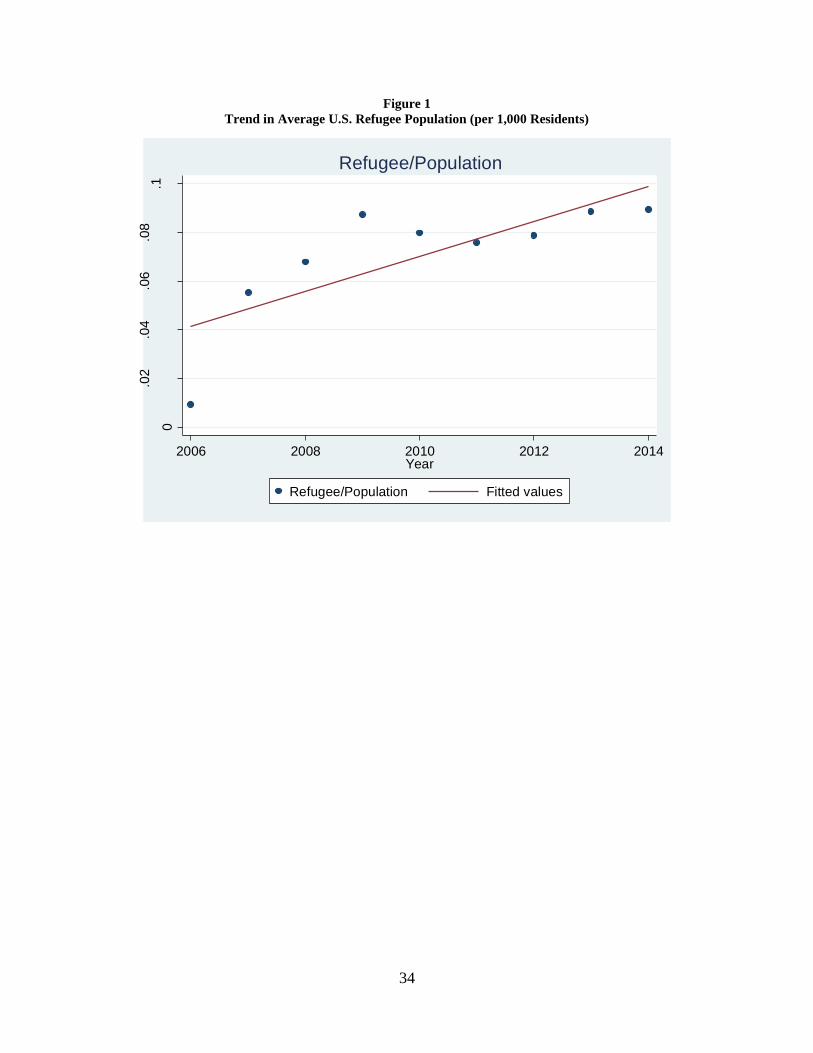
of refugee inflows in the United States is 0.08 per thousand or 8 refugees per 100,000 people. And
while the United States has run the largest resettlement programs in the world, the share of refugees
in the U.S. population is quite small.28
(b) County-level crime statistics: The second type of data we use measures crime. The raw
data are annual counts of arrests for the year at the county level. We construct ‘crime rates’ defined
as the number of recorded arrests per 1,000 people. Because of the distinct nature of property and
violent crimes, we distinguish between crimes associated with property offenses (e.g. burglary,
robbery, theft), and those linked to violent crimes. Average crime rates over the 2006-2014 period
(see Table 1) are at about five and a half per 1,000 people –most being property crimes, which
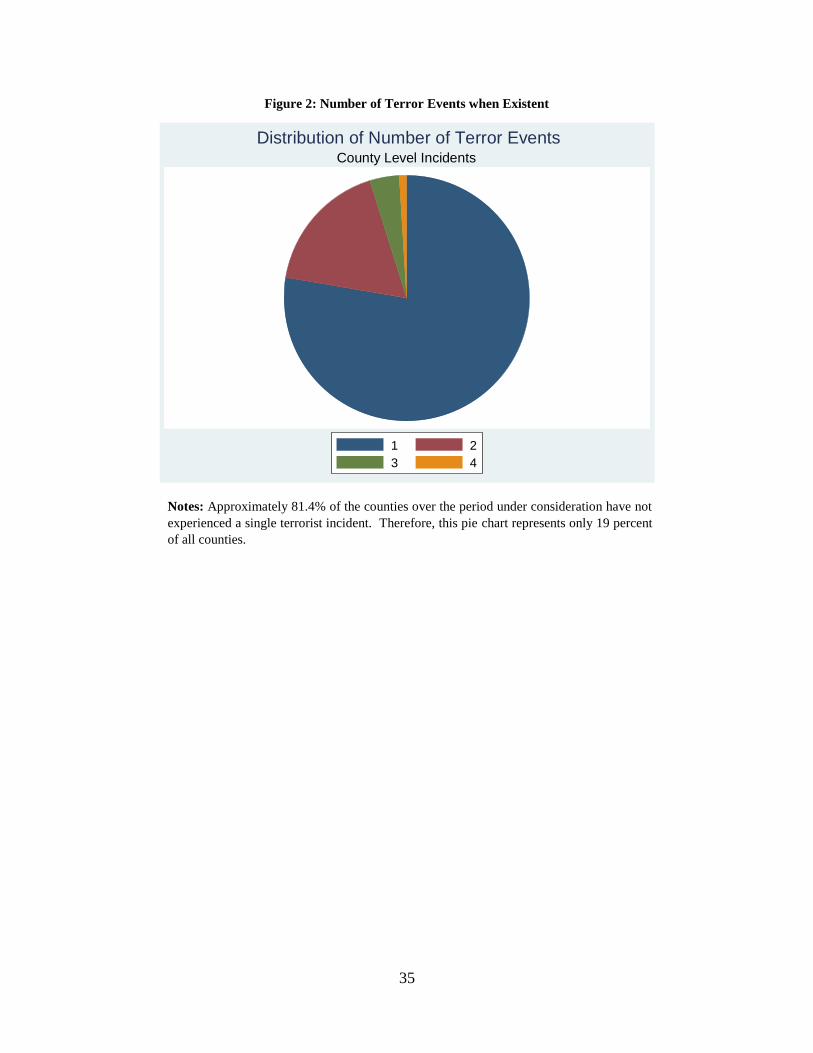
averaged about 4.4 per one thousand inhabitants. Terror events (measured simply as the number
of incidents) are quite rare in the United States. As reflected in the pie chart included as Figure 2,
if any, they fluctuate between 1 and 4 at the county/year level. Given the many counties without
a single terrorism event, the average at the county level is approximately 0.006 incidents over the
entire period of analysis (see Table 1) –on average, approximately 15 terror incidents per year.
27 Of those receiving refugees, the average number in a given county and year is 117 with a minimum of one refugee
and a maximum of 3,196. 28 In light of the ban on refugees from certain countries issued by the Trump Administration earlier this year, we also
created a measure to assess this group separately. The banned refugee country origins listed in Trump’s first executive
order were Iran, Iraq, Libya, Somalia, Syria, Sudan, and Yemen. What impact could the banning of refugees from the
seven-targeted nations in President Trump’s executive order have on the refugee admission program? As shown in
Table A in the appendix, a total of 36,722 refugees in 2016 originated from these 7 countries, with 48,272 originating
from elsewhere in the world. Nationals from the seven barred countries made up 43 percent of total admissions in
2016.

17
We also distinguish counties according to their refugee inflows in Table 1. Counties with
a refugee population that falls below the mean of 0.08 per thousand constitute the vast majority of
counties in the United States. At a purely descriptive level, crime rates are higher in counties
receiving more refugees –particularly with regards to property crimes.29 However, a couple of
things are worth noting. Counties with a higher concentration of refugees might also differ from
their counterparts with small refugee concentrations in other regards. According to the county-
level characteristics in 1980, counties with relatively larger refugee flows in our recent sample
period were those with economies that were more vibrant in the past. More specifically, counties
with a higher concentration of refugee flows over the 2006 to 2014 period were locations with a
more educated population, a higher per capita income and higher employment rates. These
counties also invested more in single and multi-family housing and police enforcement in 1980 as
measured by new housing construction and police protection spending per capita. Thus, it appears
important to control for the non-random placement of refugees and to purge the estimated impact
of refugee placements on criminal behavior from that of county characteristics.
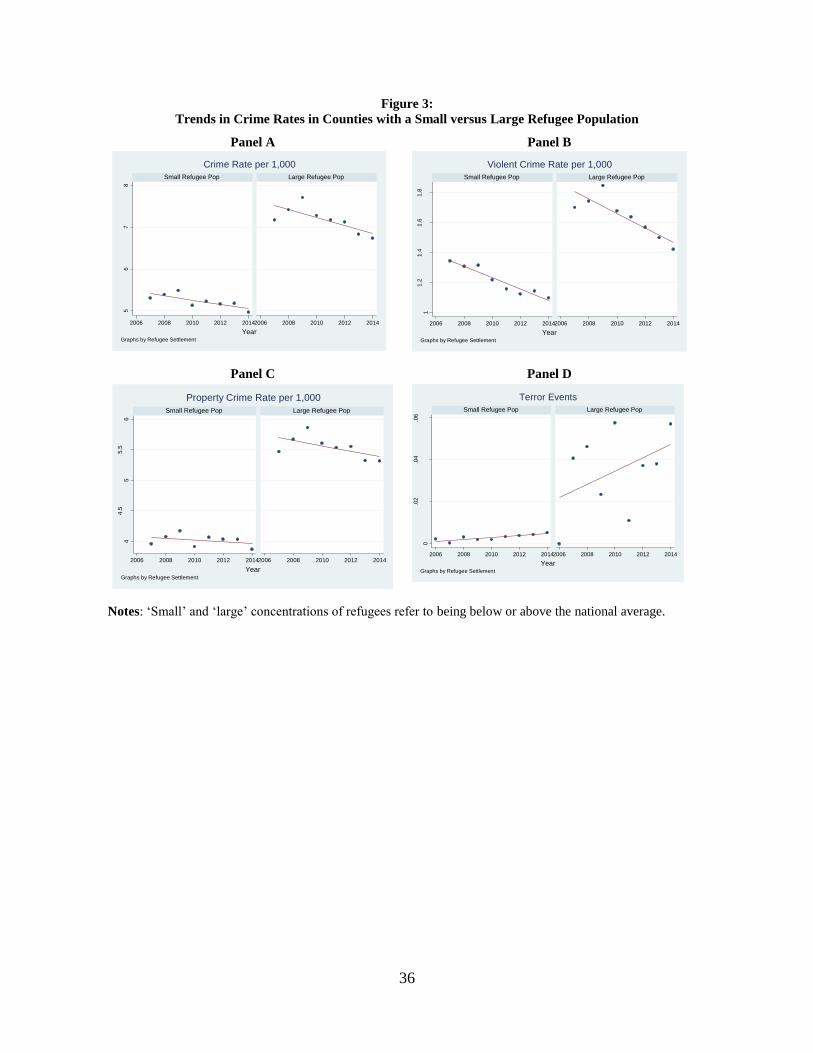
Secondly, a closer look at the trends in crime rates in these two sets of counties in Panels
A through C in Figure 3 reveals, in fact, faster declines in crime in counties with a higher
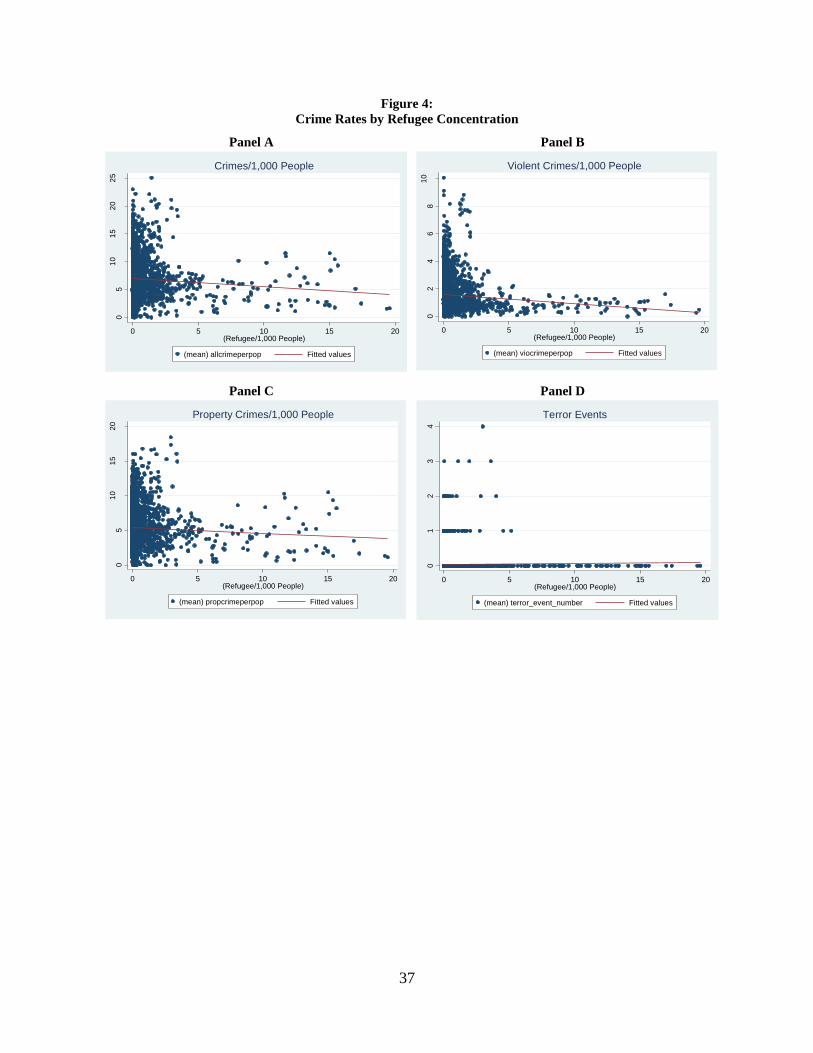
concentration of refugees than among their counterparts with fewer refugees. In fact, if we further
plot crime rates against the specific refugee concentration in a given (county, year) cell and fit a
regression line to the data, as in Panels A through C in Figure 4, it becomes evident that, if
anything, there seems to be a negative relationship between crime rates and refugee concentrations.
The pattern, however, differs for the incidence of terrorist events in Panels D in Figures 3 and 4.
Terrorism incidents are rising over time. Furthermore, counties with a larger concentration of
29 The differences in crime rates are all statistically significant at the 1 percent level.
18
refugees experience more terrorism events when compared to counties with a smaller refugee
concentration. Is the increase in terrorist events over time a function of improvements in the
collection of data on terrorism? And, more importantly, are the trends in terrorist incidents in
counties with large versus small refugee populations suggestive of a causal link? Or is it simply
the case that terrorist acts can be more easily carried out in more populated counties (typically the
ones receiving most refugees) where it is easier for criminals to remain unidentified? In what
follows, we address these questions and, overall, explore if the links revealed at a descriptive level
persist once we account for other county level traits and time trends, as well as for the potential
endogeneity of refugee placements.
6. Assessing the Impact of Refugee Settlements on Local Criminal Activity
6.1 Main Findings
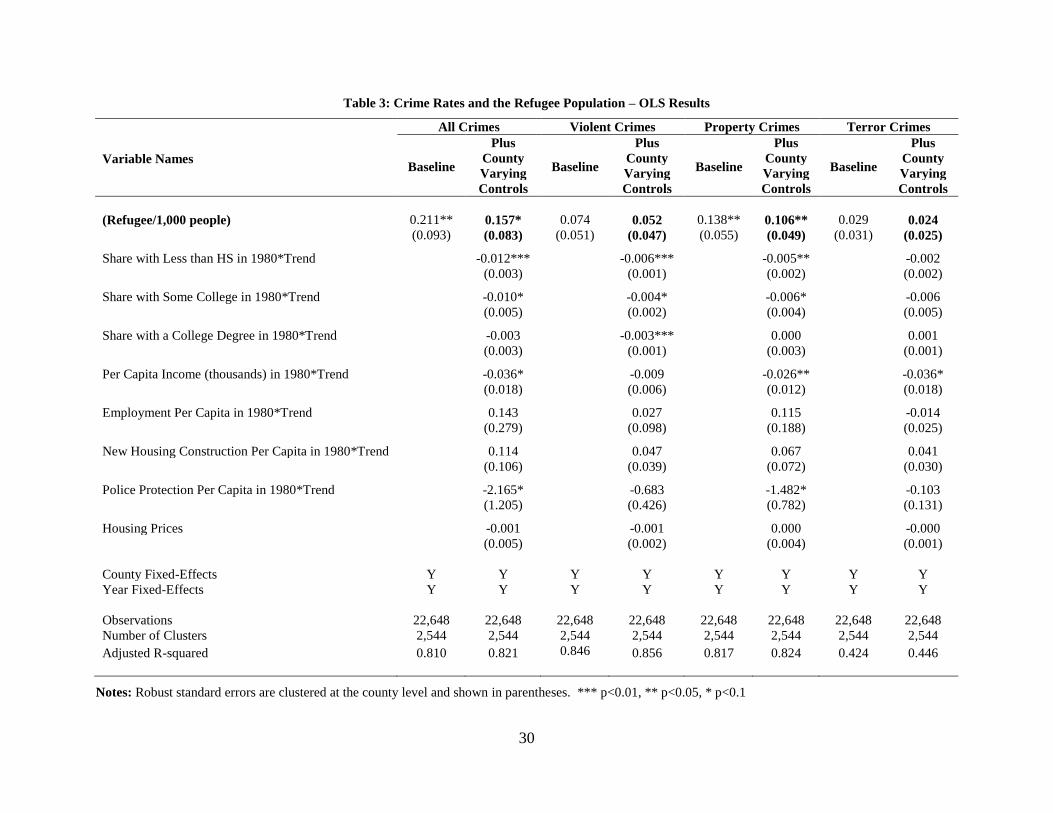
Table 3 displays the results from estimating equation (3) using OLS, without taking into
account the potential endogeneity of refugee placements. We first show the results using a baseline
specification that only includes county and year fixed-effects to account for unobserved time-
invariant county level traits, as well as for economy-wide shocks, like the Great Recession.
Subsequently, we include a number of time-varying county-level traits potentially correlated with
crime rates. As noted earlier, these are all measured in 1980, prior to the period under examination,
to avoid reverse causality biases. To address their variability over time, they are interacted with a
time trend and included in the model. Likewise, we account for housing prices as an additional
factor influencing the placement of refugees. In all instances, the impact of additional refugees on
criminal rates remain consistent across both model specifications, suggesting that the potential
endogeneity of some of the regressors is not driving our main results.

19
For conciseness, we will focus our discussion on the most complete model specification.
As shown in Table 3, refugee placements do not seem to be rising local violent crime rates or the
likelihood of a terrorism event. However, as it has been recently found for asylees in the United
Kingdom (Bell, Fasani and Machin 2013), refugee placement appear to be directly linked to
property crime rates and, given that the latter account for the vast majority of crimes in any given
location, to overall crime rates. The impact is, however, small. Specifically, an additional 8
refugees per 100,000 would raise property and overall crime rates by 0.2 percent –approximately
one additional crime per 1,000 inhabitants.30
In addition, some of the trends in county-specific traits appear to help explain local crime
rates. For instance, trends in the educational attainment of the county population are statistically
different from zero in our estimations. Specifically, we find that localities where the shares of the
population with either some college or, in some instances, a college degree have trended upwards
more rapidly than the share of the population with a high school education display lower property,
violent and overall crime rates. This could be reflecting better economic opportunities and, in turn,
a lesser incentive to engage in potentially lucrative illicit activities. Yet, we also find that localities
where the share of the population with less than a high school education has trended upwards faster
than the share of the population with a high school diploma display lower property, violent and
overall crime rates. Perhaps, these are areas with a relatively older population more likely to have
a lower educational attainment and, given their age, less inclined to engage in criminal activities.
Other determinants display the expected signs. In particular, localities where per capita income
(measured in thousands of dollars) have trended upwards display lower property and overall crime
rates, as well as a lower propensity to be the victims of a terrorist event. Similarly, counties in
30 The exact amount would be 0.87 additional property crimes/1000 inhabitants, and 1.29 overall crimes/1000
inhabitants.
20
which police expenditures per capita have trended upwards display lower property and overall
crime rates.
In sum, the estimates in Table 3 suggest that areas receiving more refugees display a
slightly higher property and overall crime rate. This result seems, however, at odds with the fitted
regression lines in Panels A through C in Figure 4, and they could be biased if, for example,
refugees are welcomed in cities that hope to foster economic growth, but currently have
significantly higher crime rates, as it appears to be the case in Panels A through C of Figure 3. In
those instances, the impact of refugees on the property and overall crime rates could be biased
upwards.
To address that possibility, we instrument for the placement of refugees using information
on the residential choices of their countrymen in the past, as described in section 4.3. The results
from such an exercise are displayed in Table 4. The last rows reassure us about the suitability of
the instrument being used. The F-stat from the first stage regression is larger than the
recommended size of 10 (Stock and Yogo 2005) and the adjusted R-squared suggests the model
does a fairly good job at predicting the share of refugees in each county by year. Additionally, the
estimated coefficient from the first stage regression is positive and statistically significant,
confirming the tendency for refugees to locate in areas with established networks of their
countrymen.
Focusing on the estimates from the second stage regressions, we find that they generally
confirm the OLS results for the violent crime rate and for the likelihood of a terrorism event. In
particular, we continue to find that the share of refugees in the locality has no significant impact
on either outcome. Additionally, we now find that the impact of refugee settlements on the
incidence of property crimes and, in turn, the overall crime rate, is not statistically different from

21
zero when we address the non-random location of refugees. The results thus seem to confirm the
propensity for the OLS estimates of the impact of refugees on the incidence of property crimes
and the overall crime rate to be upward biased.
6.2 Robustness Checks
So far, our estimates reveal that refugee settlements do not result in higher crime rates or
in a higher incidence of terrorism. These results make sense, as there is no a priori reason to
suspect that refugees should exhibit higher levels of crime. Refugees are carefully screened before
being admitted to the United States. They are likely to have relatively high levels of education
given the long process they must follow in order to petition for refugee status from abroad. The
refugee resettlement process, which pairs refugees to specific local resettlement agencies, is likely
to facilitate the adjustment of refugees and providing them with an additional “network” and with
well-connected intermediaries to help refugees navigate the settlement system and get matched in
jobs that lead to successful economic adjustment. Refugees admitted to the United States often
come as a family unit, and if not, can petition for family reunification visas provided that they
remain in good standing. Finally, they have left everything to escape conflict, war, oppression and
start anew somewhere else, and they are unlikely to be able to return to their home country in the
near future. All these factors naturally imply that the cost of engaging in any criminal activity and
losing refugee status is quite high.
Because the refugee population represents a relatively small share of the population in most
instances, one might be concerned about the ability to detect an impact of refugee placements on
overall crime rates when including localities that either do not welcome refugees or rarely do so.
To address that concern, we repeat the analysis in Table 5 focusing, instead, on counties receiving
a number of refugees that is above the national average in any given year. The results, displayed

22
in Table 5, continue to support our prior findings –namely, the fact that refugee placements do not
help explain local crime rates or the likelihood of a terrorist event.
Alternatively, one might be concerned about the composition of the refugee inflow. In
particular, following President Trump’s executive order from January 27, 2017, some might
question whether refugees from the seven nations on the list of banned countries of origin behave
differently from other refugees. To investigate this possibility, we re-estimate equation (3) using
the flow of refugees originating from Iran, Iraq, Libya, Somalia, Sudan, Syria, and Yemen. Once
more, we obtain qualitatively similar results (see Table 6) to those found in Tables 4 and 5.
Although the coefficients and standard errors are larger owing to the very small magnitude of these
flows, we continue to lack any evidence of a positive contribution of refugee inflows to local crime
rates or the incidence of terrorism.
6.3 Limitations
Despite the robustness check, our analysis is limited in a number of dimensions. First,
while we know the initial placement of refugees, we cannot be assured that they remain in that
location. Odds are that they will stay put, at least initially. Housing stipends given to refugees,
upon admission, as well as the assistance afforded by the designated resettlement agency will likely
keep the refugee put. Furthermore, the networks that seem to play in placement will likely further
incentivize refugees to remain even in the longer run.
A second concern that might be raised is with respect to the idea that once refugees gain
LPR status, they have more protections and, therefore, might be more inclined to engage in
criminal activity beyond the initial placement year. While it is true that LPRs have more rights
than do individuals still under refugee status, the more significant distinction arises when an LPR
obtains citizenship. In this case, bad behavior cannot result in deportation back to the home
23
country. That is, LPRs can be deported and returned to their home countries in the case of an
egregious crime, whereas citizens cannot.
7. Summary and Conclusions
Refugee flows around the world have been on the rise in response to a growing incidence
of international crises. Yet, the welcome received by refugees has varied worldwide. In the United
States, growing skepticism about refugees has resulted in expressed concerns regarding their
impact on public safety and the possibility that they might bring with them the terror and crime
that afflicts many of their countries of origin. In this study, we attempt to take a first step at
assessing if there is empirical evidence supportive of such a link. To that end, we use city-level
data (mapped into county-level data) from the Refugee Processing Center in the Bureau of
Population, Refugees and Migration at the Department of State from 2006 through 2014 to assess
whether refugee placements are tied to county-level crime data collected from the Uniform Crime
Reporting Program administered by the FBI.
The analysis, which exploits the geographic and temporal variation in the distribution of
refugees across U.S. counties, reveals that, overall, refugees do not seem to have a significant
impact on local crime rates. Qualitatively similar results are obtained when we limit our analysis
to refugees from the seven banned countries listed in President Trump’s original, January 27, 2017
executive order, Protecting the Nation from Terrorist Attacks by Foreign Nationals. That refugee
inflows are not associated with increases in crime rates seems plausible. Refugees are carefully
screened making it highly unlikely that individuals predisposed to criminal activity will pass the
vetting process. Furthermore, refugees are matched to sponsoring agencies, which provide them
with services to facilitate their integration into the job market. The local sponsoring agencies also
likely monitor refugees, enabling them to detect and correct inappropriate behaviors early on. In
sum, it is not clear why one would expect refugees that are settled through these channels to be

24
prone to crime and, indeed, our findings confirm that expectation. The results are also robust to
focusing on counties receiving larger refugee inflows or to restricting our attention to refugees
from specific national origins.
We believe these findings contribute to our understanding of the link between refugee
settlements and crime –a crucial element in shaping public attitudes towards refugees and a key
component of current immigration policy proposals. Given the ongoing refugee crises around the
world, gaining a better understanding of the facts is essential in order to devise immigration
policies that address native concerns and avoid the misrepresentation of the refugee phenomenon
or political opportunism.

25
References
Aiyar, S., Barkbu, B., Batini, N., Berger, H., Detragiache, E., and A. Dizoli. 2016. “The refugee
surge in Europe”, IMF Discussion Note 16/02.
Altonji, Joseph J., and David Card. 1991. “The Effects of Immigration on the Labor Market
Outcomes of Less-Skilled Natives” in John Abowd and Richard Freeman (eds.), Immigration,
Trade and Labor, University of Chicago Press, 201 – 34.
Bartel, Ann P. 1989. “Where Do the New U . S . Immigrants Live ?” Journal of Labor
Economics 7 (4): 371–91. doi:10.1086/298388.
Becker, Gary. 1968. “Crime and Punishment: An Empirical Approach” Journal of Political
Economy, 76, 175-209.
Bell, Brian, Francesco Fasani and Stephen Machin. 2013. “Crime and Immigration: Evidence
from Large Immigrant Waves” The Review of Economics and Statistics, 95(4): 1278-1290.
Bianchi, Milano, Paolo Buonanno and Paulo Pirotti. 2012. “Do Immigrants Cause Crime?”
Journal of the European Economic Association, 10(6): 1318-47.
Bratsberg, B., Raaum, O., and K. Røed. 2014. “Immigrants, labour market performance and social
insurance” The Economic Journal, 124(580): F644-F683.
Buonanno, Paolo. 2003. “The Socioeconomic Determinants of Crime. A Review of the
Literature”. Working Paper No.63, Dipartimento di Economia Politica Università degli Studi di
Milano Bicocca.
Butcher, Kristin F. and Anne Morrison Piehl. 1998. “Cross-City Evidence on the Relationship
between Immigration and Crime” Journal of Policy Analysis and Management, 17(3): 457 – 493.
Capps, R., and K. Newland. (2015). The integration outcomes of US refugees: Successes and
challenges. Migration Policy Institute.
Card, David. 2001. “Immigrant Inflows , Native Outflows , and the Local Labor Market
Impacts of Higher Immigration” Journal of Labor Economics 19 (1): 22–64.
Cortes, Patricia and Jose Tessada. 2011. “Low-Skilled Immigration and the Labor Supply of
Highly Skilled Women” American Economic Journal: Applied Economics 3 (July): 88–123.
Chalfin, Aaron. 2015. “The Long-Run Effects of Mexican Immigration on Crime in US Cities:
Evidence from Variation in Mexican Fertility Rates” American Economic Review, 105(5): 220-
25.
Chalfin, Aaron. 2014. “What is the Contribution of Mexican Immigration to U.S. Crime Rates?
Evidence from Rainfall Shocks in Mexico” American Law and Economics Review, 16(1): 220-
68.

26
Cortes, K. E. 2004. “Are refugees different from economic immigrants? Some empirical
evidence on the heterogeneity of immigrant groups in the United States” Review of Economics
and Statistics, 86(2): 465-480.
Couttenier, Mathieu, Veronica Preotu, Dominic Rohner, and Mathias Thoenig, 2017. “The
Violent Legacy of Victimization: Post-Conflict Evidence on Asylum Seekers, Crime and Public
Policy in Switzerland,” February 2017, available at: http://kie.vse.cz/wp-
content/uploads/Rohner.pdf
Davis, Julie Hirschfeld. 2017. “Trump Orders Mexican Border Wall to Be Built and Plans to
Block Syrian Refugees,” NYT, Jan 25.
Del Carpio, Ximena V., and Mathis C. Wagner. 2015. “The impact of Syrians refugees on the
Turkish labor market.” World Bank Policy Research working paper 7402.
Dustmann, Christian, Francesco Fasani, Tommaso Frattini, Luigi Minale, and Uta Schönberg.
2016. “On the Economics and Politics of Refugee Migration” Available at:
http://voxeu.org/article/economics-and-politics-refugee-migration [Last accessed on May 22,
2017].
Ehrlich, Isaac. 1973. “Participation in Illegitimate Activities: A Theoretical and Empirical
Investigation” Journal of Political Economy, 81: 521-63.
Freedman, Matthew, Emily Owens and Sarah Bohn (forthcoming), “Immigration, Employment
Opportunities, and Criminal Behavior, American Economic Journal: Economic Policy.
GAO Report Iraqi Refugees and Special Immigrant Visa Holders Face Challenges Resettling in
the United States and Obtaining U.S. Government Employment.
http://www.gao.gov/new.items/d10274.pdf
Gehrsitz, Markus and Martin Ungerer. 2017, “Jobs, Crime, and Votes: A short-run Evaluation of
the Refugee Crisis in Germany,” IZA Discussion Paper 10494. Available at:
http://ftp.iza.org/dp10494.pdf
Giri, Animesh. 2016. “From Refuge to Riches? An Analysis of Refugees' Wage Assimilation in
the United States” International Migration Review doi:10.1111/imre.12285
Global Terrorism Database. 2016. “Codebook: Inclusion Criteria and Variables,” National
Consortium for the Study of Terrorism and Response to Terrorism, University of Maryland.,
start.umd.edu.
Grogger, Jeffrey. 2000. “An Economic Model of Recent Trends in Violence” in A. Blumstein
and J. Wallman (Eds). The Crime Drop in America, Cambridge University Press.
Krogstad, Jens Manuel and Jynnah Radford. 2017. “Key facts about refugees to the U.S.”, Pew
Research Center, Washington DC. Available at: http://www.pewresearch.org/fact-
tank/2017/01/30/key-facts-about-refugees-to-the-u-s/ [Last accessed on 3/21/2017]
27
Luik, Marc-André and Emilsson, Henrik and Pieter Bevelander. 2016. “Explaining the Male
Native-Immigrant Employment Gap in Sweden: The Role of Human Capital and Migrant
Categories” IZA Discussion Paper No. 9943. Available at SSRN:
https://ssrn.com/abstract=2786027
Mastrobuoni, Giovanni and Paolo Pinotti. 2015. “Legal Status and Criminal Activity of
Immigrants,” American Economic Journal: Applied Economics, 7(2); 175-206.
Munshi, Kaivan. 2003. “Networks in the Modern Economy: Mexican Migrants in the U. S. Labor
Market” Quarterly Journal of Economics, 118 (2): 549-599.
National Public Radio. January 30, 2017. “7 Targeted Countries React to Trump's Ban On
Immigration”, retrieved February 27, 2017 from http://www.npr.org/sections/thetwo-
way/2017/01/30/512438879/7-targeted-countries-react-to-trumps-ban-on-immigration.
Nunziata, Luca. 2015. “Immigration and Crime: Evidence from Victimization data,” Journal of
Population Economics, 28:697-736.
Pinotti, Paolo. 2017. “Clicking on Heaven’s Door: The Effect of Immigrant Legalization on
Crime” American Economic Review, 107(1): 138-168.
Piopiunik, Marc and Jens Ruhose. 2017, “Immigration, regional conditions, and crime: Evidence
from an allocation policy in Germany, European Economic Review, 92, 258-82.
Shear, Michael D. and Helene Cooper. 2017. “Trump Bars Refugees and Citizens of 7 Muslim
Countries,” NYT, Jan 27.
Spenkuch, Jörg L. 2013. “Understanding the Impact of Immigration on Crime,” American Law
and Economics Review, doi:1093/aler/aht017
Stock, James, and Motohiro Yogo. 2005. “Testing for Weak Instruments in Linear IV
Regression.” In Identification and Inference for Econometric Models: Essays in Honor of
Thomas Rothenberg, Andrew DWK, 80–105. New York: Cambridge: Cambridge University
Press.
UNHCR. 2016. Global Trends, Forced Displacement in 2015. Geneva: UNHCR.
28
Table 1: Descriptive Statistics
Variable Names
All
U.S. Counties
Counties with Small
Refugee Populations
Counties with Large
Refugee Populations
Mean S.D. Mean S.D. Mean S.D.
Crime Rate per 1,000 5.657 3.503 5.562 3.480 6.929 3.554
Violent Crime Rate per 1,000 1.289 1.040 1.268 1.022 1.573 1.217
Property Crime Rate per 1,000 4.367 2.846 4.293 2.834 5.356 2.811
Terror Events 0.006 0.093 0.003 0.064 0.039 0.263
Refugees per 1,000 0.082 0.661 0.002 0.010 1.147 2.251
Refugees per 1,000 from Banned Nations 0.028 0.296 0.001 0.006 0.387 1.062
Housing Prices (HPI) 0.457 5.614 0.538 5.634 -0.634 5.212
County Specific Characteristics in 1980:
Share with Less than HS 40.004 12.254 40.608 12.215 31.874 9.595
Share with a HS Education 34.981 7.082 34.971 7.157 35.103 5.987
Share with Some College 13.206 4.61 13.001 4.586 15.968 4.013
Share with a College Degree 11.811 5.687 11.421 5.33 17.06 7.467
Per Capita Income (in thousands) 8.204 1.998 8.115 1.922 9.402 2.536
Employment per Capita 0.235 0.115 0.228 0.109 0.331 0.146
New Housing Construction per Capita 0.138 0.212 0.135 0.214 0.181 0.172
Police Protection per Capita 0.039 0.025 0.038 0.024 0.053 0.027
Observations 22,648 21,073 1,575
Notes: Count ies are classified as ‘large’ vs. ‘small’ refugee recipients depending on whether the refugees per 1,000
is above or below the mean for all U.S. counties.

29
Table 2: Top Refugee Receiving States
States Percentage
TX 21.59
CA 13.64
AZ 10.23
NY 10.23
GA 7.95
CO 6.82
IL 4.55
IN 4.55
FL 3.41
KY 3.41
MI 3.41
UT 3.41
OH 2.27
WA 2.27
MN 1.14
TN 1.14
Notes: Computed by the authors from 2006-2014 city
placements of refugees as reported by the Refugee
Processing Center in the Bureau of Population, Refugees
and Migration at the U.S. Department of State.
30
Table 3: Crime Rates and the Refugee Population – OLS Results
Variable Names
All Crimes Violent Crimes Property Crimes Terror Crimes
Baseline
Plus
Baseline
Plus
Baseline
Plus
Baseline
Plus
County County County County
Varying Varying Varying Varying
Controls Controls Controls Controls
(Refugee/1,000 people) 0.211** 0.157* 0.074 0.052 0.138** 0.106** 0.029 0.024
(0.093) (0.083) (0.051) (0.047) (0.055) (0.049) (0.031) (0.025)
Share with Less than HS in 1980*Trend -0.012*** -0.006*** -0.005** -0.002
(0.003) (0.001) (0.002) (0.002)
Share with Some College in 1980*Trend -0.010* -0.004* -0.006* -0.006
(0.005) (0.002) (0.004) (0.005)
Share with a College Degree in 1980*Trend -0.003 -0.003*** 0.000 0.001
(0.003) (0.001) (0.003) (0.001)
Per Capita Income (thousands) in 1980*Trend -0.036* -0.009 -0.026** -0.036*
(0.018) (0.006) (0.012) (0.018)
Employment Per Capita in 1980*Trend 0.143 0.027 0.115 -0.014
(0.279) (0.098) (0.188) (0.025)
New Housing Construction Per Capita in 1980*Trend 0.114 0.047 0.067 0.041
(0.106) (0.039) (0.072) (0.030)
Police Protection Per Capita in 1980*Trend -2.165* -0.683 -1.482* -0.103
(1.205) (0.426) (0.782) (0.131)
Housing Prices -0.001 -0.001 0.000 -0.000
(0.005) (0.002) (0.004) (0.001)
County Fixed-Effects Y Y Y Y Y Y Y Y
Year Fixed-Effects Y Y Y Y Y Y Y Y
Observations 22,648 22,648 22,648 22,648 22,648 22,648 22,648 22,648
Number of Clusters 2,544 2,544 2,544 2,544 2,544 2,544 2,544 2,544
Adjusted R-squared 0.810 0.821 0.846 0.856 0.817 0.824 0.424 0.446
Notes: Robust standard errors are clustered at the county level and shown in parentheses. *** p<0.01, ** p<0.05, * p<0.1

31
Table 4: Crime Rates and the Refugee Population – IV Results
Variable Names All Violent Property Terror
Crimes Crimes Crimes Crimes
(Refugee/1,000 people) 0.095 -0.007 0.103 0.087
(0.256) (0.122) (0.173) (0.075)
Share with Less than HS in 1980*Trend -0.012*** -0.006*** -0.005** -0.002
(0.003) (0.001) (0.002) (0.001)
Share with Some College in 1980*Trend -0.010* -0.004** -0.006* -0.006
(0.005) (0.002) (0.004) (0.005)
Share with a College Degree in 1980*Trend -0.003 -0.003*** 0.000 0.001
(0.003) (0.001) (0.003) (0.001)
Per Capita Income (thousands) in 1980*Trend -0.036* -0.009 -0.026** -0.004
(0.018) (0.006) (0.012) (0.004)
Employment Per Capita in 1980*Trend 0.146 0.030 0.115 -0.017
(0.287) (0.100) (0.193) (0.027)
New Housing Construction Per Capita in 1980*Trend 0.113 0.047 0.067 0.042
(0.105) (0.039) (0.071) (0.031)
Police Protection Per Capita in 1980*Trend -2.165* -0.683 -1.482* -0.103
(1.206) (0.427) (0.782) (0.131)
Housing Prices -0.001 -0.001 0.000 -0.000
(0.005) (0.002) (0.004) (0.001)
County Fixed-Effects Y Y Y Y
Year Fixed-Effects Y Y Y Y
Observations 22,648 22,648 22,648 22,648
Number of Clusters 2,544 2,544 2,544 2,544
R-squared 0.821 0.856 0.824 0.444
First-Stage Results
IV 2.305***
(0.183)
F-stat 159.420
Adjusted R-squared 0.864
Notes: Robust standard errors are clustered at the county level and shown in parentheses. *** p<0.01, ** p<0.05, *
p<0.1.

32
Table 5: Crime Rates and the Refugee Population for Counties with a Large Refugee Population – IV Results
Variable Names All Violent Property Terror
Crimes Crimes Crimes Crimes
(Refugee/1,000 people) 0.135 0.069 0.066 -0.145
(0.180) (0.078) (0.126) (0.120)
Share with Less than HS in 1980*Trend -0.017*** -0.005** -0.012*** -0.007*
(0.006) (0.002) (0.004) (0.004)
Share with Some College in 1980*Trend -0.021** -0.004 -0.016** -0.016*
(0.010) (0.005) (0.007) (0.009)
Share with a College Degree in 1980*Trend -0.010* -0.004 -0.006* -0.000
(0.005) (0.002) (0.003) (0.002)
Per Capita Income (thousands) in 1980*Trend -0.028 -0.010 -0.018 -0.005
(0.018) (0.009) (0.012) (0.009)
Employment Per Capita in 1980*Trend 0.216 0.046 0.170 0.055
(0.330) (0.158) (0.209) (0.088)
New Housing Construction Per Capita in 1980*Trend 0.130 0.101 0.030 0.143
(0.203) (0.079) (0.144) (0.089)
Police Protection Per Capita in 1980*Trend -0.595 -0.431 -0.165 -0.775
(0.974) (0.558) (0.590) (0.491)
Housing Prices -0.003 -0.003 -0.001 -0.008*
(0.011) (0.004) (0.008) (0.005)
County Fixed-Effects Y Y Y Y
Year Fixed-Effects Y Y Y Y
Observations 1,575 1,575 1,575 1,575
Number of Clusters 390 390 390 390
R-squared 0.910 0.933 0.912 0.545
First-Stage Results
IV 10.352***
(1.817)
F-stat 32.450
Adjusted R-squared 0.854
Notes: Robust standard errors are clustered at the county level and shown in parentheses. *** p<0.01, ** p<0.05, *
p<0.1.

33
Table 6: Crime Rates and the Banned Refugee Population – IV Results
Variable Names All Violent Property Terror
Crimes Crimes Crimes Crimes
(Refugee/1,000 people) 0.824 0.334 0.491 0.357
(0.614) (0.245) (0.431) (0.224)
Share with Less than HS in 1980*Trend -0.011*** -0.006*** -0.005** -0.002
(0.003) (0.001) (0.002) (0.001)
Share with Some College in 1980*Trend -0.010* -0.004** -0.007* -0.006
(0.005) (0.002) (0.004) (0.005)
Share with a College Degree in 1980*Trend -0.003 -0.003*** -0.000 0.001
(0.003) (0.001) (0.003) (0.001)
Per Capita Income (thousands) in 1980*Trend -0.000* -0.000 -0.000** -0.000
(0.000) (0.000) (0.000) (0.000)
Employment Per Capita in 1980*Trend 0.138 0.025 0.113 -0.018
(0.283) (0.099) (0.190) (0.027)
New Housing Construction Per Capita in 1980*Trend 0.116 0.048 0.068 0.042
(0.105) (0.039) (0.072) (0.030)
Police Protection Per Capita in 1980*Trend -2.165* -0.683 -1.482* -0.103
(1.203) (0.425) (0.781) (0.130)
Housing Prices -0.001 -0.001 0.000 0.000
(0.005) (0.002) (0.004) (0.002)
County Fixed-Effects Y Y Y Y
Year Fixed-Effects Y Y Y Y
Observations 22,654 22,654 22,654 22,654
Number of Clusters 2,559 2,559 2,559 2,559
Adjusted R-squared 0.820 0.856 0.824 0.439
First-Stage Results
IV 2.045***
(0.192)
F-stat 112.95
Adjusted R-squared 0.757
Notes: Robust standard errors are clustered at the county level and shown in parentheses. *** p<0.01, ** p<0.05, *
p<0.1.
34
Figure 1
Trend in Average U.S. Refugee Population (per 1,000 Residents)
0
.02
.04
.06
.08
.1
2006 2008 2010 2012 2014Year
Refugee/Population Fitted values
Refugee/Population
35
Figure 2: Number of Terror Events when Existent
Notes: Approximately 81.4% of the counties over the period under consideration have not
experienced a single terrorist incident. Therefore, this pie chart represents only 19 percent
of all counties.
1 2
3 4
County Level Incidents
Distribution of Number of Terror Events
36
Figure 3:
Trends in Crime Rates in Counties with a Small versus Large Refugee Population
Panel A Panel B
Panel C Panel D
Notes: ‘Small’ and ‘large’ concentrations of refugees refer to being below or above the national average.
56
78
2006 2008 2010 2012 20142006 2008 2010 2012 2014
Small Refugee Pop Large Refugee Pop
YearGraphs by Refugee Settlement
Crime Rate per 1,000
11
.21
.41
.61
.8
2006 2008 2010 2012 20142006 2008 2010 2012 2014
Small Refugee Pop Large Refugee Pop
YearGraphs by Refugee Settlement
Violent Crime Rate per 1,000
44
.55
5.5
6
2006 2008 2010 2012 20142006 2008 2010 2012 2014
Small Refugee Pop Large Refugee Pop
YearGraphs by Refugee Settlement
Property Crime Rate per 1,000
0
.02
.04
.06
2006 2008 2010 2012 20142006 2008 2010 2012 2014
Small Refugee Pop Large Refugee Pop
YearGraphs by Refugee Settlement
Terror Events
37
Figure 4:
Crime Rates by Refugee Concentration
Panel A Panel B
Panel C Panel D
05
10
15
20
25
0 5 10 15 20(Refugee/1,000 People)
(mean) allcrimeperpop Fitted values
Crimes/1,000 People
02
46
81
0
0 5 10 15 20(Refugee/1,000 People)
(mean) viocrimeperpop Fitted values
Violent Crimes/1,000 People
05
10
15
20
0 5 10 15 20(Refugee/1,000 People)
(mean) propcrimeperpop Fitted values
Property Crimes/1,000 People
01
23
4
0 5 10 15 20(Refugee/1,000 People)
(mean) terror_event_number Fitted values
Terror Events
38
Appendix
Data Sources
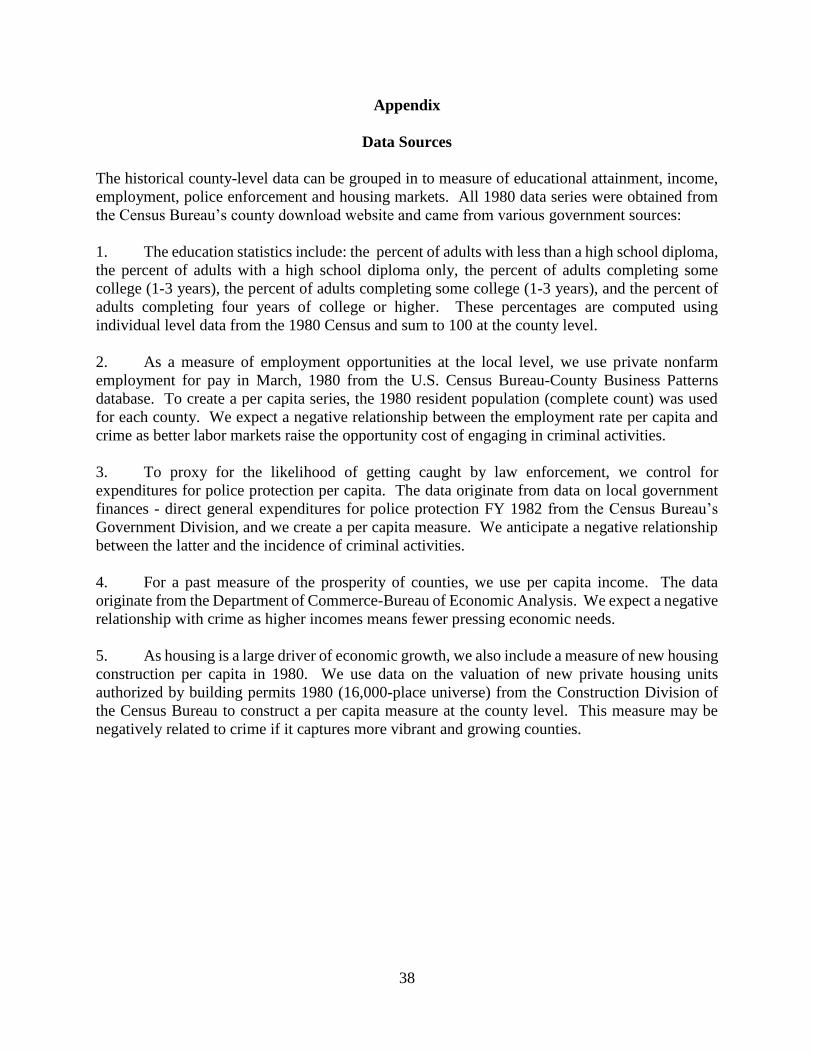
The historical county-level data can be grouped in to measure of educational attainment, income,
employment, police enforcement and housing markets. All 1980 data series were obtained from
the Census Bureau’s county download website and came from various government sources:
1. The education statistics include: the percent of adults with less than a high school diploma,
the percent of adults with a high school diploma only, the percent of adults completing some
college (1-3 years), the percent of adults completing some college (1-3 years), and the percent of
adults completing four years of college or higher. These percentages are computed using
individual level data from the 1980 Census and sum to 100 at the county level.
2. As a measure of employment opportunities at the local level, we use private nonfarm
employment for pay in March, 1980 from the U.S. Census Bureau-County Business Patterns
database. To create a per capita series, the 1980 resident population (complete count) was used
for each county. We expect a negative relationship between the employment rate per capita and
crime as better labor markets raise the opportunity cost of engaging in criminal activities.
3. To proxy for the likelihood of getting caught by law enforcement, we control for
expenditures for police protection per capita. The data originate from data on local government
finances - direct general expenditures for police protection FY 1982 from the Census Bureau’s
Government Division, and we create a per capita measure. We anticipate a negative relationship
between the latter and the incidence of criminal activities.
4. For a past measure of the prosperity of counties, we use per capita income. The data
originate from the Department of Commerce-Bureau of Economic Analysis. We expect a negative
relationship with crime as higher incomes means fewer pressing economic needs.
5. As housing is a large driver of economic growth, we also include a measure of new housing
construction per capita in 1980. We use data on the valuation of new private housing units
authorized by building permits 1980 (16,000-place universe) from the Construction Division of
the Census Bureau to construct a per capita measure at the county level. This measure may be
negatively related to crime if it captures more vibrant and growing counties.

39
Table A: 2016 Refugee Admissions
Somalia Sudan Iran Iraq Syria Yemen Libya ROW
9,020 1,458 3,750 9,880 12,587 26 1 48,272
Source: ROW= Rest of World. Derived from Refugees Admissions Report, December 2016,
http://www.wrapsnet.org/admissions-and-arrivals/

40
Table B: OLS Using Terror Events as a LDV Model – ‘Any Terror Event’
Variable Names Baseline Plus County Varying Controls
(Refugee/1,000 people) 0.012 0.010
(0.016) (0.014)
Share with Less than HS in 1980*Trend -0.001
(0.001)
Share with Some College in 1980*Trend -0.003
(0.002)
Share with a College Degree in 1980*Trend 0.001
(0.000)
Per Capita Income (thousands) in 1980*Trend -0.001
(0.002)
Employment Per Capita in 1980*Trend -0.007
(0.014)
New Housing Construction Per Capita in 1980*Trend 0.021
(0.015)
Police Protection Per Capita in 1980*Trend -0.045
(0.061)
Housing Prices -0.000
(0.001)
County Fixed-Effects Y Y
Year Fixed-Effects Y Y
Observations 22,648 22,648
Number of Clusters 2,544 2,544
Adjusted R-squared 0.431 0.440
Notes: Robust standard errors are clustered at the county level and shown in parentheses. *** p<0.01, ** p<0.05,
* p<0.1.