Embed Size (px)
Citation preview
PBMI SYSTEM: A CROSS FUNCTIONAL APPROACHDivision of Instructional SupportOffice of School Improvement, Accountability & Compliance
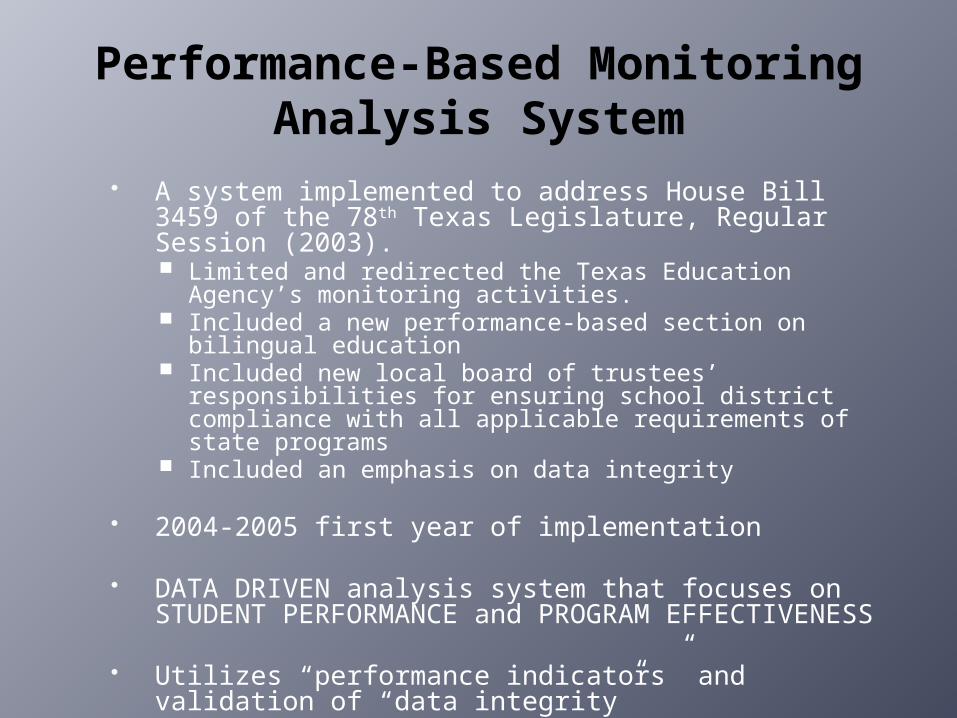
Performance-Based Monitoring Analysis System
A system implemented to address House Bill 3459 of the 78th Texas Legislature, Regular Session (2003). Limited and redirected the Texas Education Agency’s
monitoring activities. Included a new performance-based section on bilingual
education Included new local board of trustees’ responsibilities for
ensuring school district compliance with all applicable requirements of state programs
Included an emphasis on data integrity
2004-2005 first year of implementation
DATA DRIVEN analysis system that focuses on STUDENT PERFORMANCE and PROGRAM EFFECTIVENESS
Utilizes “performance indicators” and validation of “data integrity”
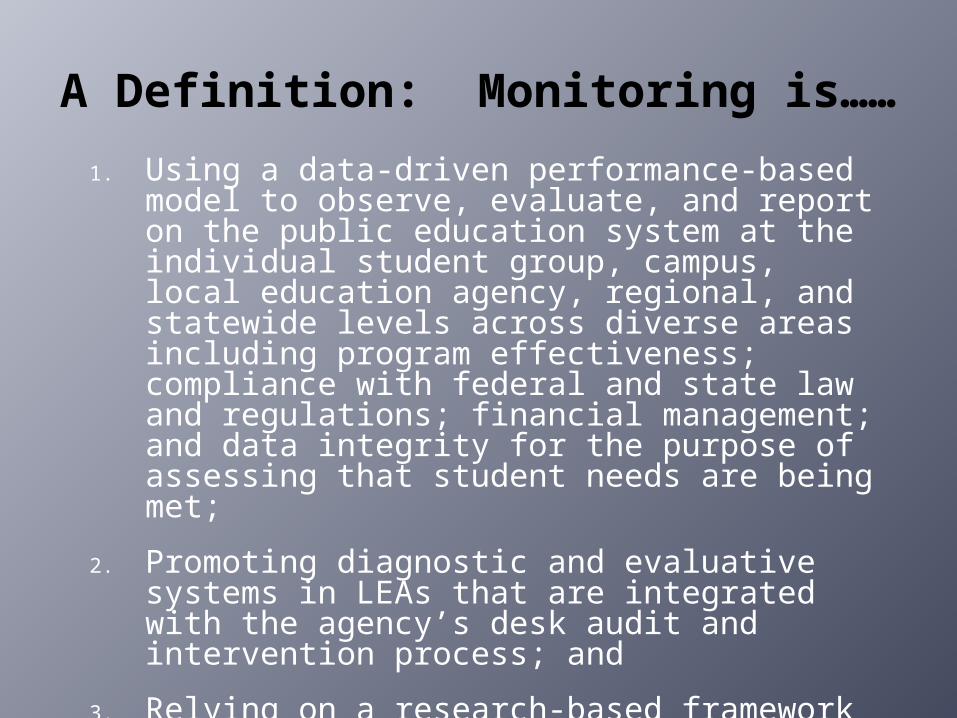
A Definition: Monitoring is……
1. Using a data-driven performance-based model to observe, evaluate, and report on the public education system at the individual student group, campus, local education agency, regional, and statewide levels across diverse areas including program effectiveness; compliance with federal and state law and regulations; financial management; and data integrity for the purpose of assessing that student needs are being met;
2. Promoting diagnostic and evaluative systems in LEAs that are integrated with the agency’s desk audit and intervention process; and
3. Relying on a research-based framework of interventions that ensure compliance and enhance student success.
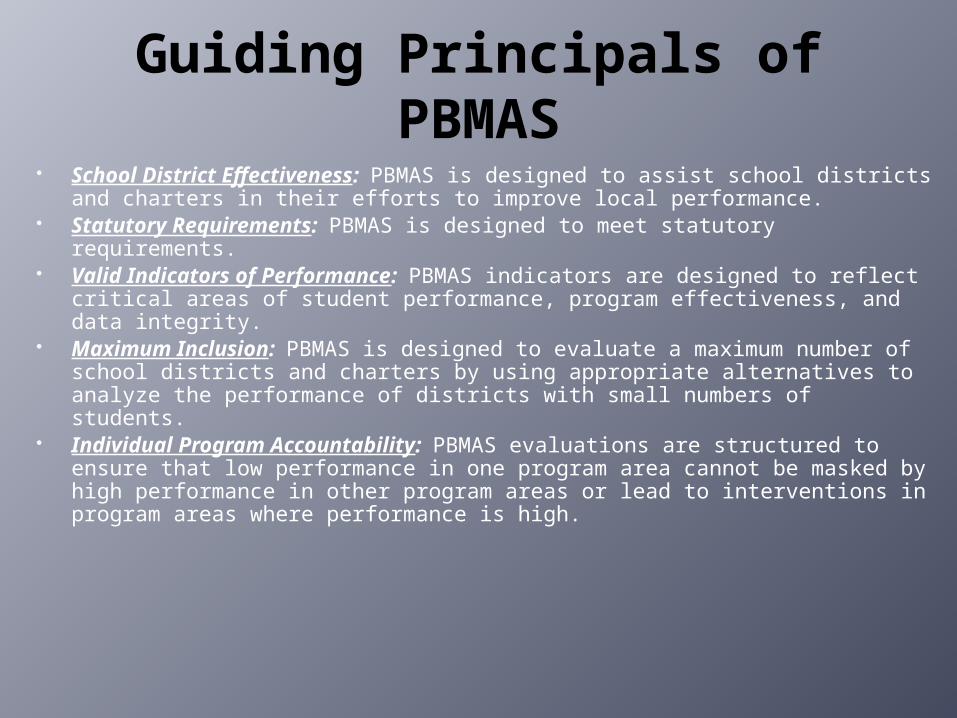
Guiding Principals of PBMAS
School District Effectiveness: PBMAS is designed to assist school districts and charters in their efforts to improve local performance.
Statutory Requirements: PBMAS is designed to meet statutory requirements.
Valid Indicators of Performance: PBMAS indicators are designed to reflect critical areas of student performance, program effectiveness, and data integrity.
Maximum Inclusion: PBMAS is designed to evaluate a maximum number of school districts and charters by using appropriate alternatives to analyze the performance of districts with small numbers of students.
Individual Program Accountability: PBMAS evaluations are structured to ensure that low performance in one program area cannot be masked by high performance in other program areas or lead to interventions in program areas where performance is high.
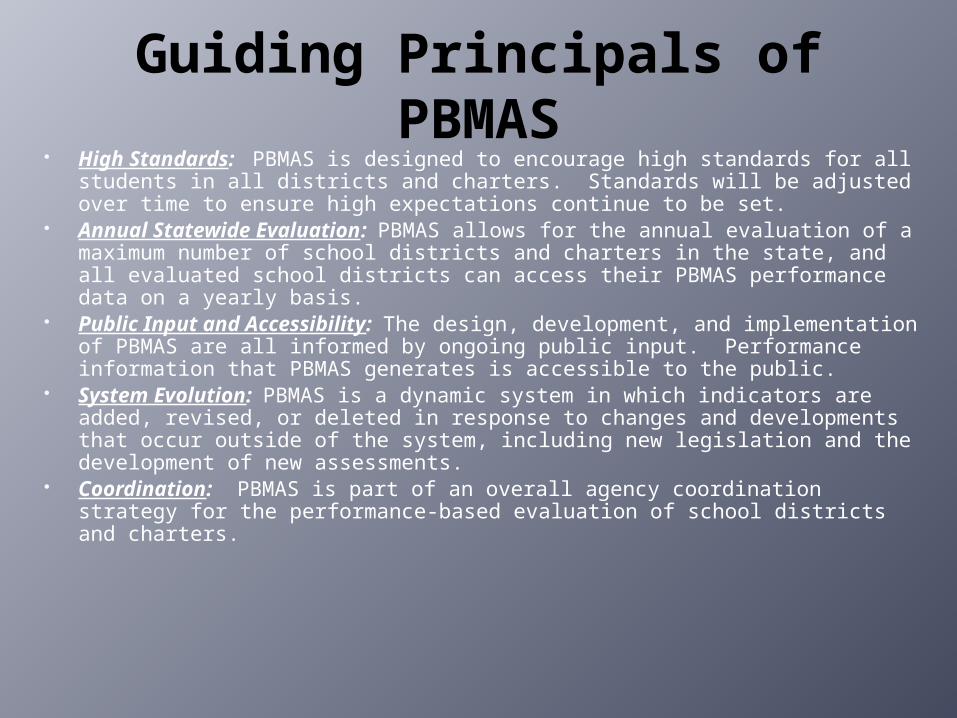
Guiding Principals of PBMAS
High Standards: PBMAS is designed to encourage high standards for all students in all districts and charters. Standards will be adjusted over time to ensure high expectations continue to be set.
Annual Statewide Evaluation: PBMAS allows for the annual evaluation of a maximum number of school districts and charters in the state, and all evaluated school districts can access their PBMAS performance data on a yearly basis.
Public Input and Accessibility: The design, development, and implementation of PBMAS are all informed by ongoing public input. Performance information that PBMAS generates is accessible to the public.
System Evolution: PBMAS is a dynamic system in which indicators are added, revised, or deleted in response to changes and developments that occur outside of the system, including new legislation and the development of new assessments.
Coordination: PBMAS is part of an overall agency coordination strategy for the performance-based evaluation of school districts and charters.
Components of PBM
• Student Performance• Program Effectiveness• Compliance with State & Federal
Requirements• Date Quality & Integrity
Program Areas
PBMAS is comprised of:Special EducationBilingual/ESLCareer and Technical EducationNo Child Left Behind
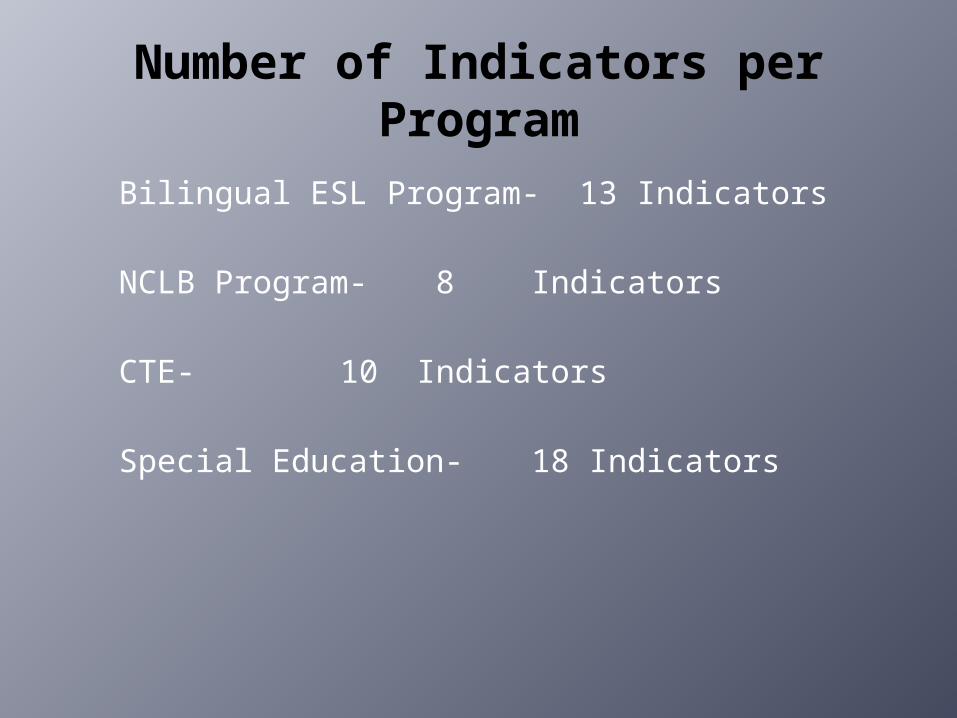
Number of Indicators per Program
Bilingual ESL Program- 13 Indicators
NCLB Program- 8 Indicators
CTE- 10 Indicators
Special Education- 18 Indicators
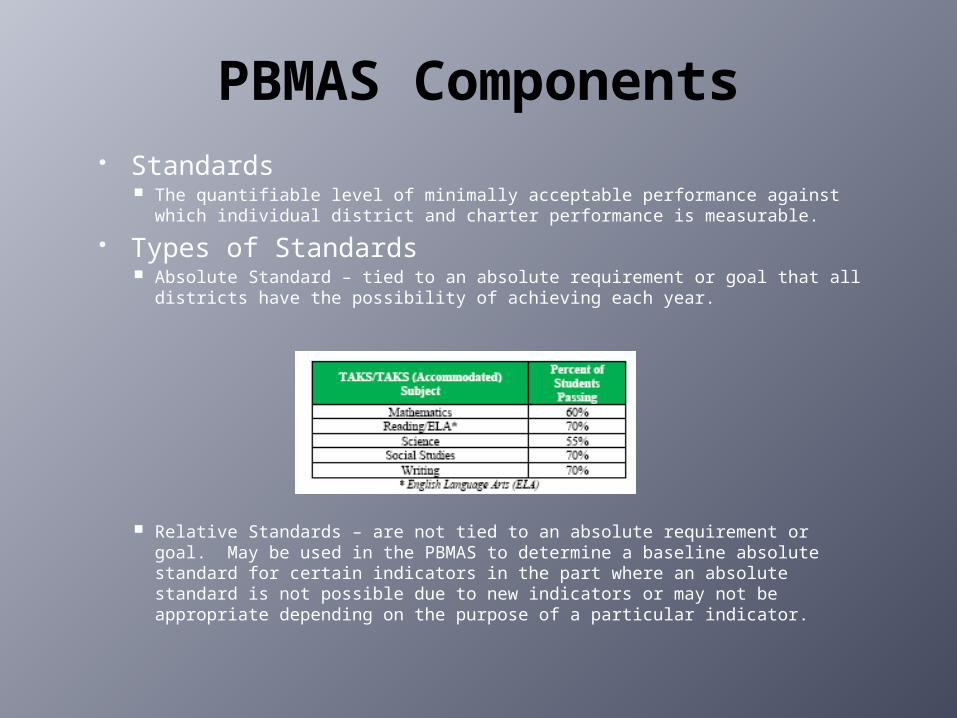
PBMAS Components Standards
The quantifiable level of minimally acceptable performance against which individual district and charter performance is measurable.
Types of Standards Absolute Standard – tied to an absolute requirement or goal that all
districts have the possibility of achieving each year.
Relative Standards – are not tied to an absolute requirement or goal. May be used in the PBMAS to determine a baseline absolute standard for certain indicators in the part where an absolute standard is not possible due to new indicators or may not be appropriate depending on the purpose of a particular indicator.
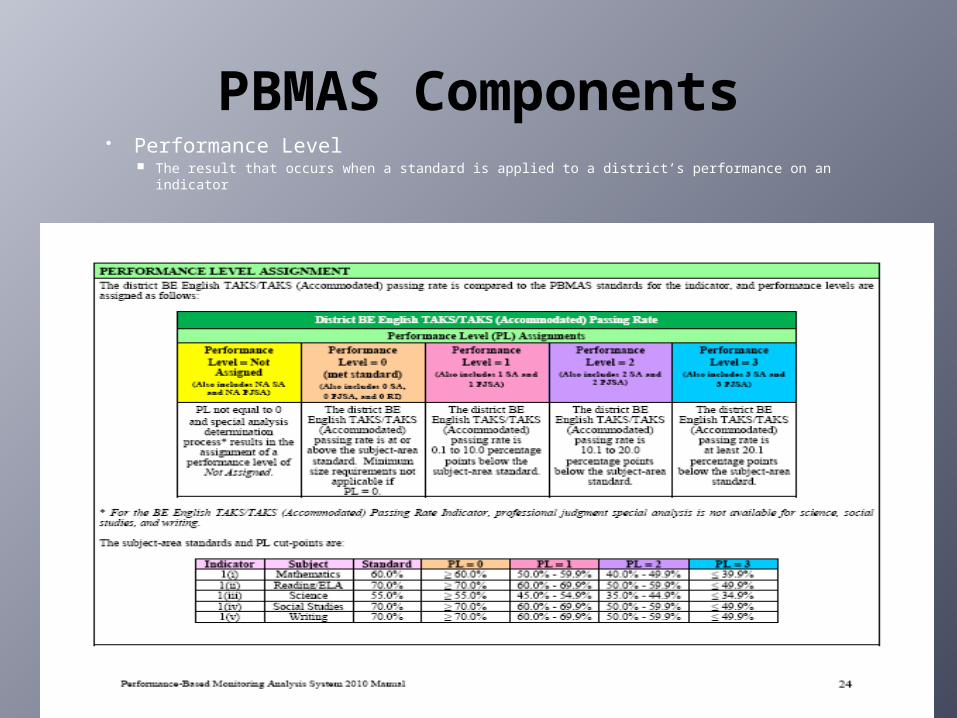
PBMAS Components Performance Level
The result that occurs when a standard is applied to a district’s performance on an indicator
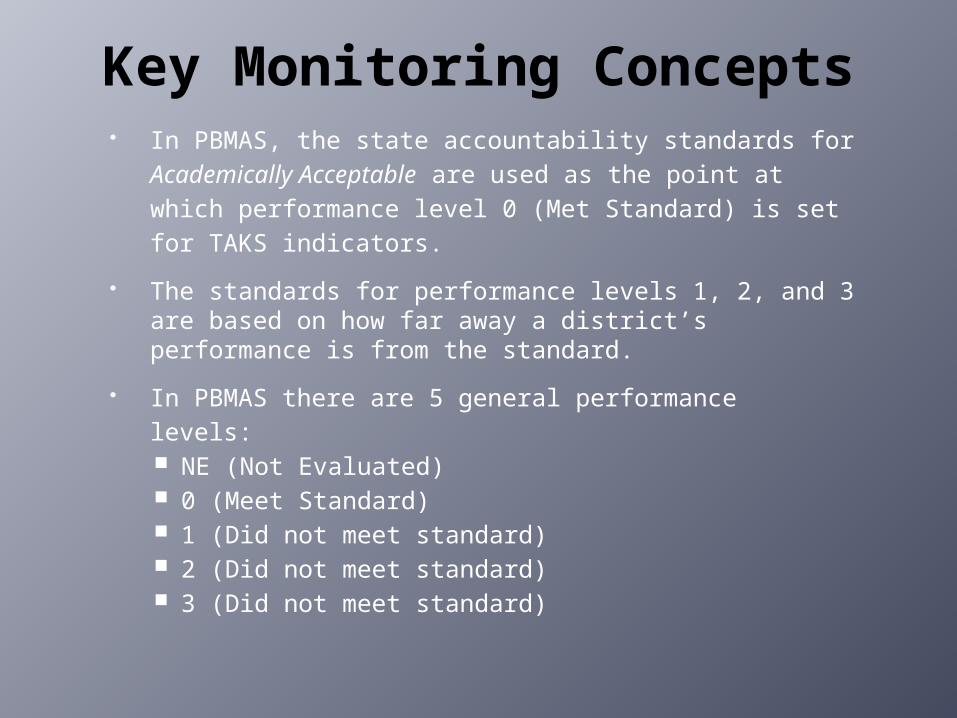
Key Monitoring Concepts In PBMAS, the state accountability standards for
Academically Acceptable are used as the point atwhich performance level 0 (Met Standard) is setfor TAKS indicators.
The standards for performance levels 1, 2, and 3 are based on how far away a district’s performance is from the standard.
In PBMAS there are 5 general performancelevels: NE (Not Evaluated) 0 (Meet Standard) 1 (Did not meet standard) 2 (Did not meet standard) 3 (Did not meet standard)
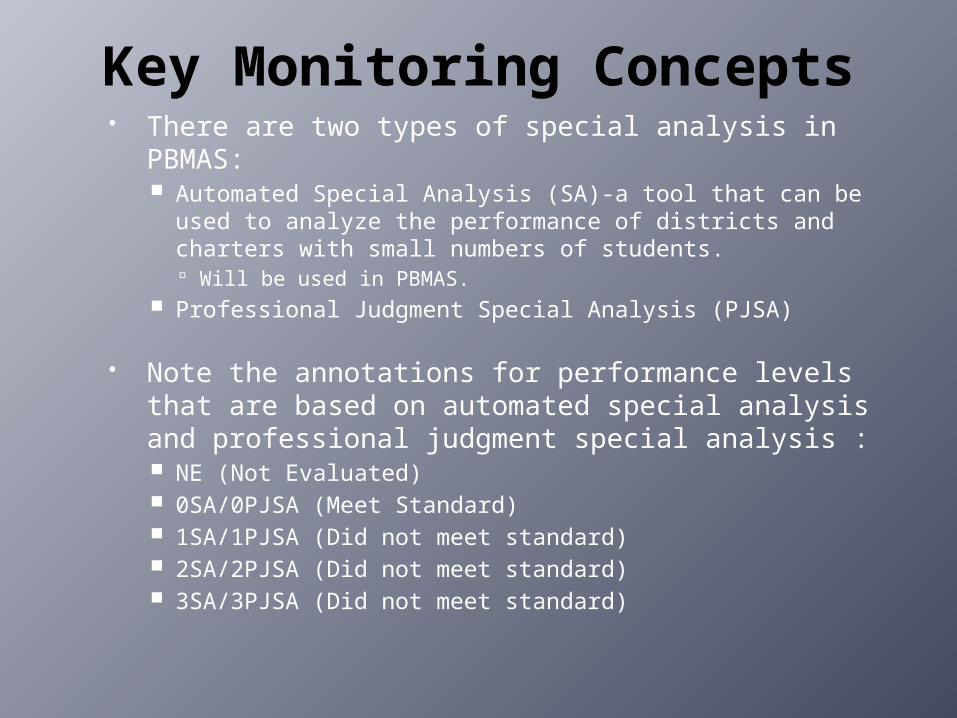
Key Monitoring Concepts There are two types of special analysis in
PBMAS: Automated Special Analysis (SA)-a tool that can be
used to analyze the performance of districts and charters with small numbers of students. Will be used in PBMAS.
Professional Judgment Special Analysis (PJSA)
Note the annotations for performance levels that are based on automated special analysis and professional judgment special analysis : NE (Not Evaluated) 0SA/0PJSA (Meet Standard) 1SA/1PJSA (Did not meet standard) 2SA/2PJSA (Did not meet standard) 3SA/3PJSA (Did not meet standard)
Stages of Intervention
See Handout
Stages of Intervention
Summary of Interventions
Trigger TEA Visit Bilingual Education – Stage 4 CTE – Stage 4 NCLB – Stage 4 Special Education – Stage 4
Introduction to and Discussion of PBMAS Intervention Strategies
Interventions are not one-size-fits-all. When higher levels of agency involvement are needed, they will be individually designed based on specific LEA data and identified issues.
The primary focus is a continuous improvement plan with strategies and activities that positively impact student performance and program effectiveness.
TEA follow up on implementation of the CIP is a given.
Analyzing performance level data and examining patterns or trends across indicators and program areas to inform interventions decision-making
Taking into account both the extent and the duration of a district’s area(s) of low performance/program ineffectiveness
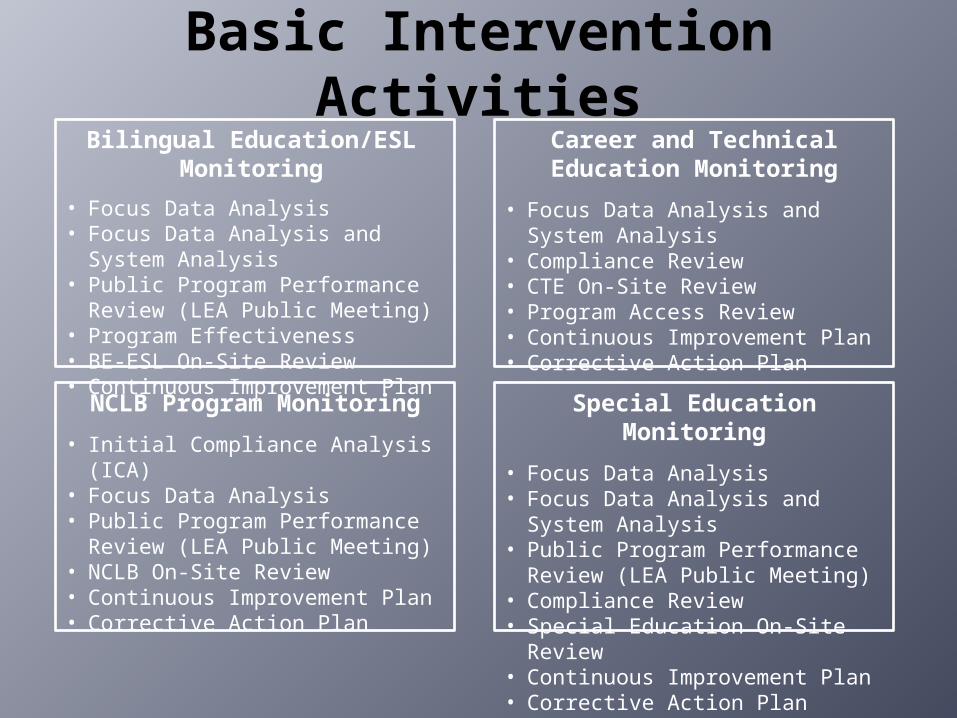
Basic Intervention Activities
Bilingual Education/ESL Monitoring
• Focus Data Analysis• Focus Data Analysis and System
Analysis• Public Program Performance
Review (LEA Public Meeting)• Program Effectiveness• BE-ESL On-Site Review• Continuous Improvement Plan
Career and Technical Education Monitoring
• Focus Data Analysis and System Analysis
• Compliance Review• CTE On-Site Review• Program Access Review• Continuous Improvement Plan• Corrective Action Plan
NCLB Program Monitoring
• Initial Compliance Analysis (ICA)• Focus Data Analysis• Public Program Performance
Review (LEA Public Meeting)• NCLB On-Site Review• Continuous Improvement Plan• Corrective Action Plan
Special Education Monitoring
• Focus Data Analysis• Focus Data Analysis and System
Analysis• Public Program Performance
Review (LEA Public Meeting)• Compliance Review• Special Education On-Site Review• Continuous Improvement Plan• Corrective Action Plan
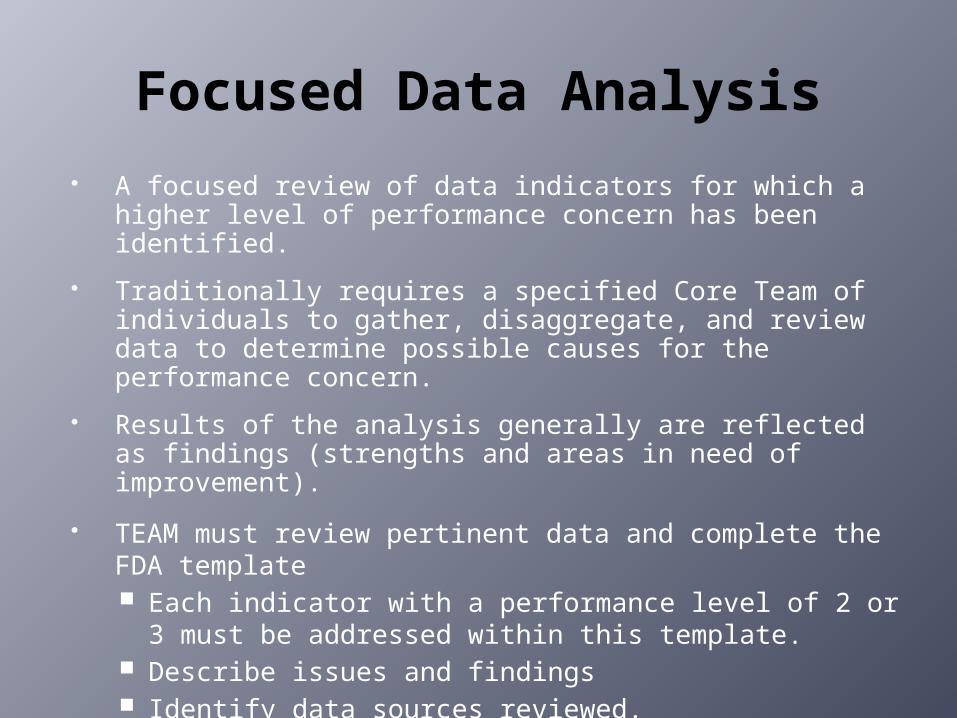
Focused Data Analysis A focused review of data indicators for which a higher
level of performance concern has been identified.
Traditionally requires a specified Core Team of individuals to gather, disaggregate, and review data to determine possible causes for the performance concern.
Results of the analysis generally are reflected as findings (strengths and areas in need of improvement).
TEAM must review pertinent data and complete the FDA template Each indicator with a performance level of 2 or 3 must
be addressed within this template. Describe issues and findings Identify data sources reviewed.
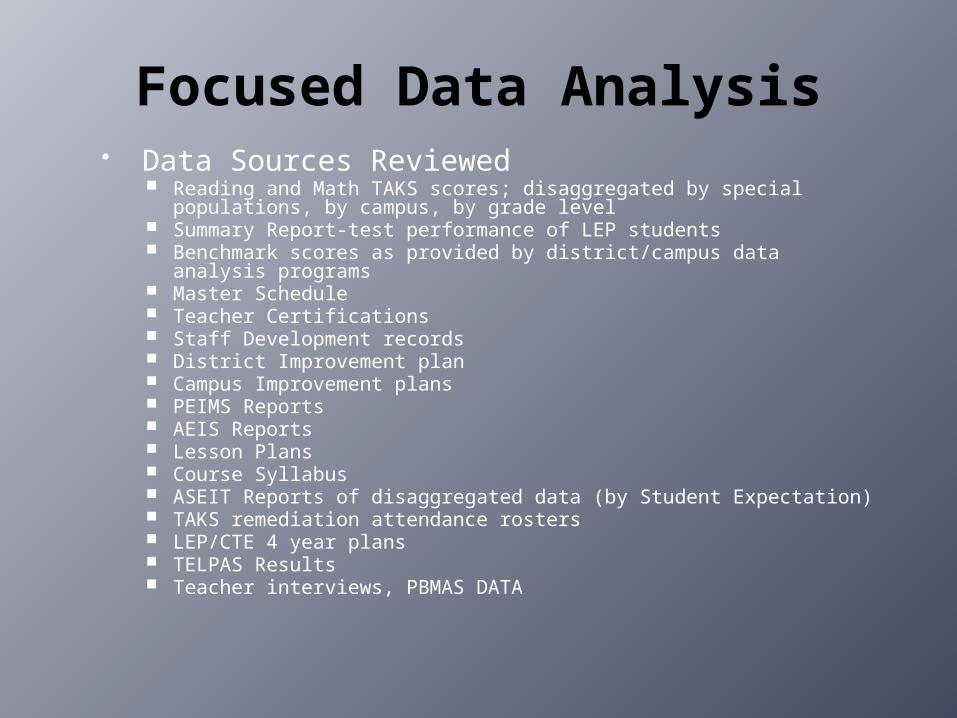
Focused Data Analysis Data Sources Reviewed
Reading and Math TAKS scores; disaggregated by special populations, by campus, by grade level
Summary Report-test performance of LEP students Benchmark scores as provided by district/campus data analysis
programs Master Schedule Teacher Certifications Staff Development records District Improvement plan Campus Improvement plans PEIMS Reports AEIS Reports Lesson Plans Course Syllabus ASEIT Reports of disaggregated data (by Student Expectation) TAKS remediation attendance rosters LEP/CTE 4 year plans TELPAS Results Teacher interviews, PBMAS DATA
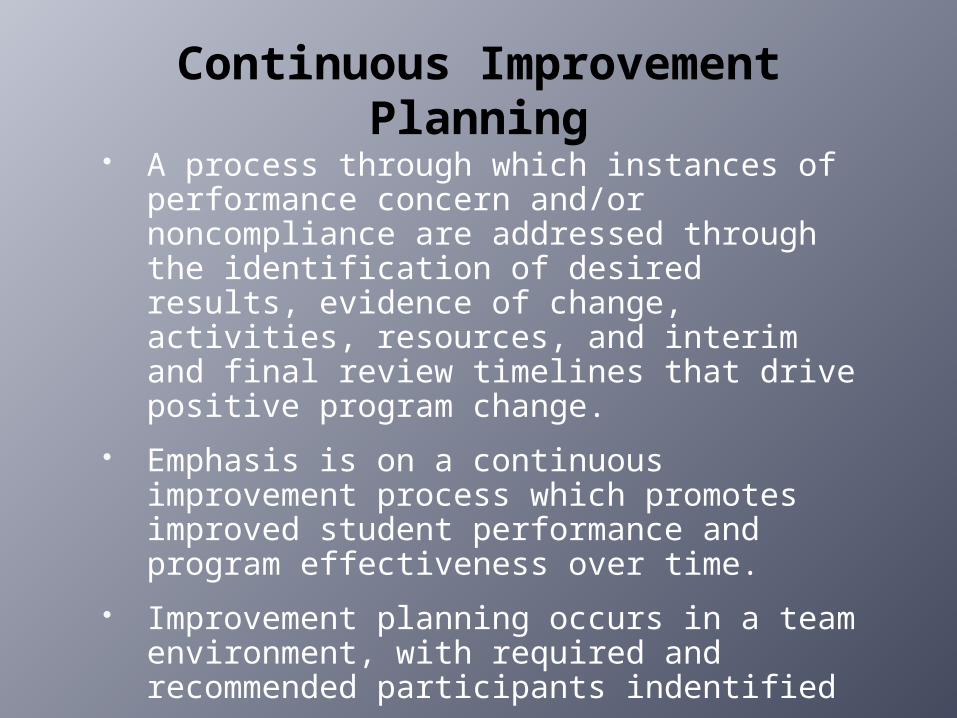
Continuous Improvement Planning
A process through which instances of performance concern and/or noncompliance are addressed through the identification of desired results, evidence of change, activities, resources, and interim and final review timelines that drive positive program change.
Emphasis is on a continuous improvement process which promotes improved student performance and program effectiveness over time.
Improvement planning occurs in a team environment, with required and recommended participants indentified
FDA Findings --> District Level Plan
Information from System Analysis and FDA must be integrated into the Continuous Improvement Planning Process – this is at the District level.
Implementation of CIP All district level reviews should lead to
interventions and/or improvements to the program.
This is NOT a cyclical system – continuous review and progress is monitored.
Bottom line is that the state systems are now interrelated and campus/district teams must work together to improve students performance.
Campus Staff Needs to Know….
Why the district was selected for on-site and how their campus impacted that?
What did the Focused Data Analysis show?
What is in the CIP?
What activities in the CIP should they be doing to address the targeted needs?
What specifically are they doing on their campus to meet the PBMAS standards?
24
Copyright © Texas Education Agency 2010. All rights reserved.
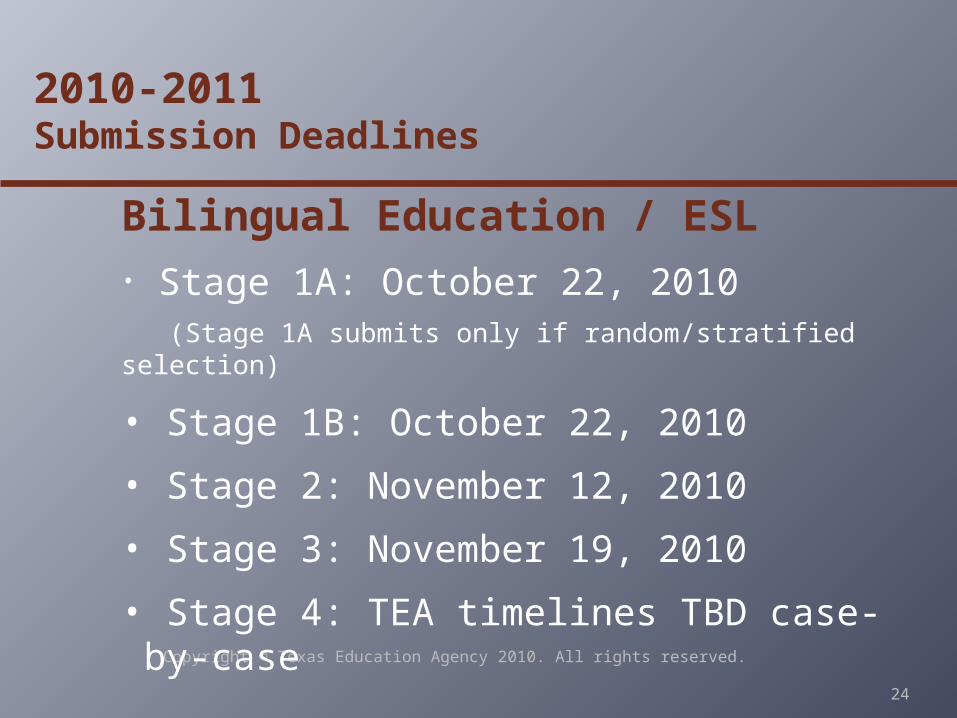
2010-2011 Submission Deadlines
Bilingual Education / ESL• Stage 1A: October 22, 2010
(Stage 1A submits only if random/stratified selection)
• Stage 1B: October 22, 2010
• Stage 2: November 12, 2010
• Stage 3: November 19, 2010
• Stage 4: TEA timelines TBD case-by-case
25
Copyright © Texas Education Agency 2010. All rights reserved.
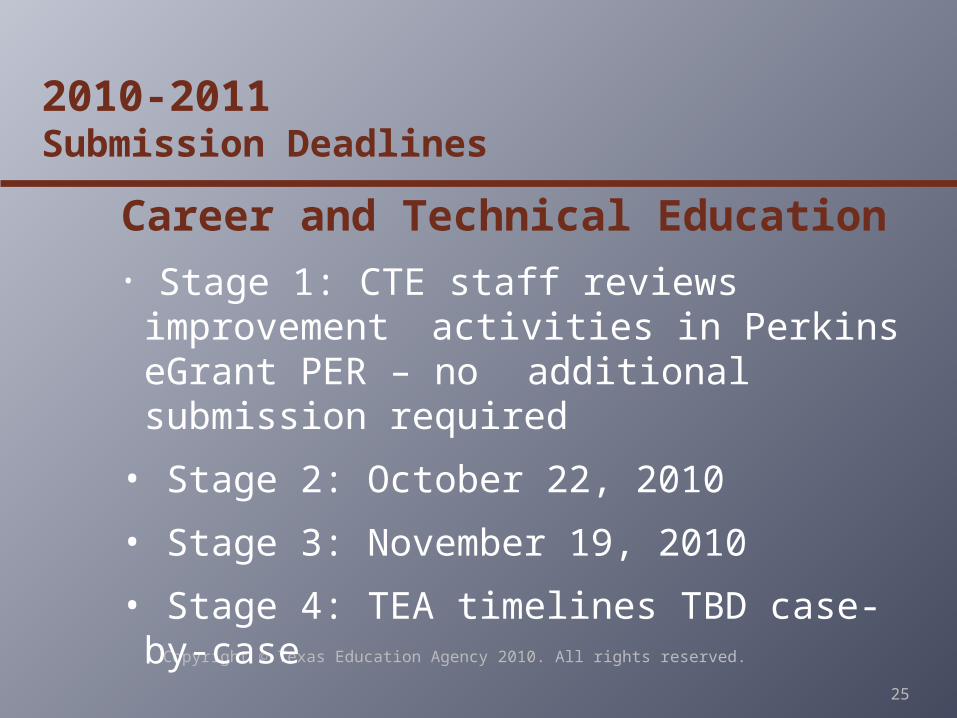
2010-2011 Submission Deadlines
Career and Technical Education• Stage 1: CTE staff reviews improvement
activities in Perkins eGrant PER – no additional submission required
• Stage 2: October 22, 2010
• Stage 3: November 19, 2010
• Stage 4: TEA timelines TBD case-by-case
26
Copyright © Texas Education Agency 2010. All rights reserved.
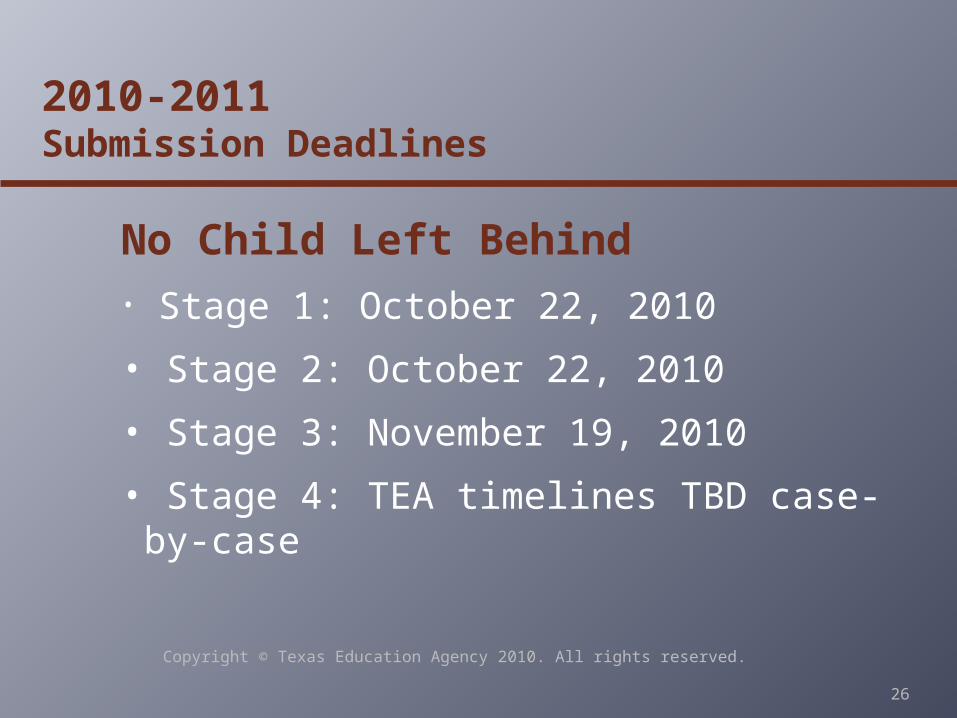
2010-2011 Submission Deadlines
No Child Left Behind• Stage 1: October 22, 2010
• Stage 2: October 22, 2010
• Stage 3: November 19, 2010
• Stage 4: TEA timelines TBD case-by-case
27
Copyright © Texas Education Agency 2010. All rights reserved.
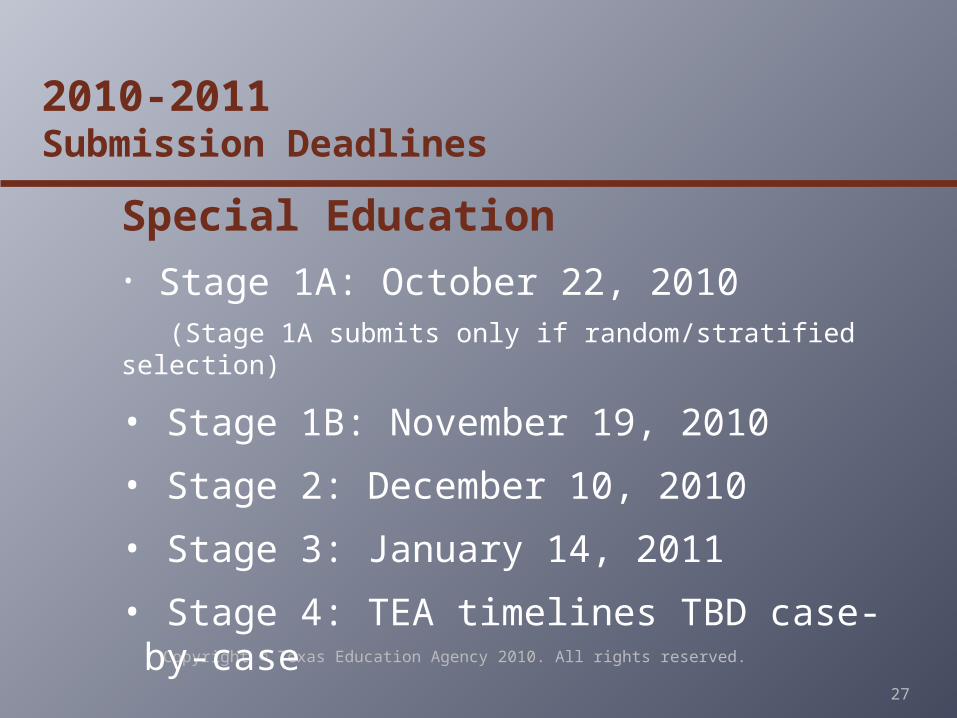
2010-2011 Submission Deadlines
Special Education• Stage 1A: October 22, 2010
(Stage 1A submits only if random/stratified selection)
• Stage 1B: November 19, 2010
• Stage 2: December 10, 2010
• Stage 3: January 14, 2011
• Stage 4: TEA timelines TBD case-by-case
28
Copyright © Texas Education Agency 2010. All rights reserved.
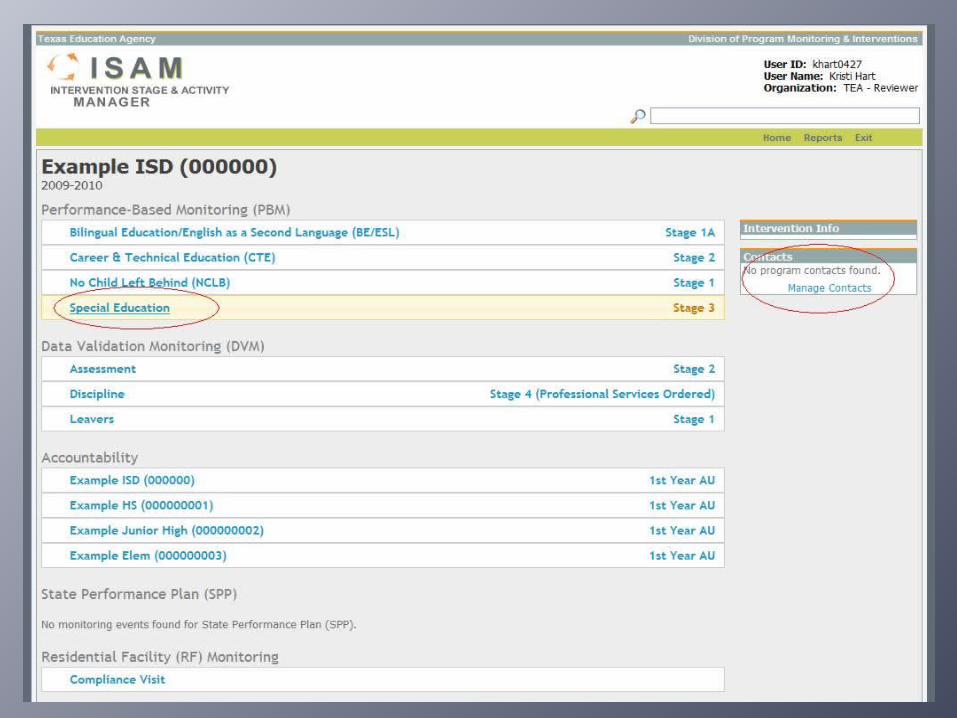
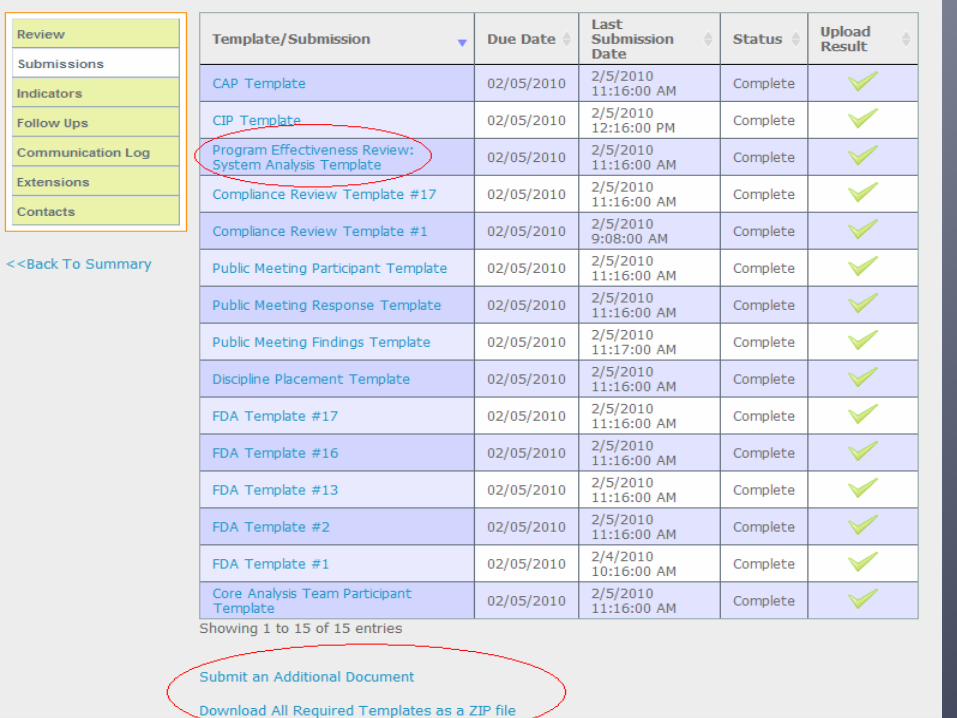
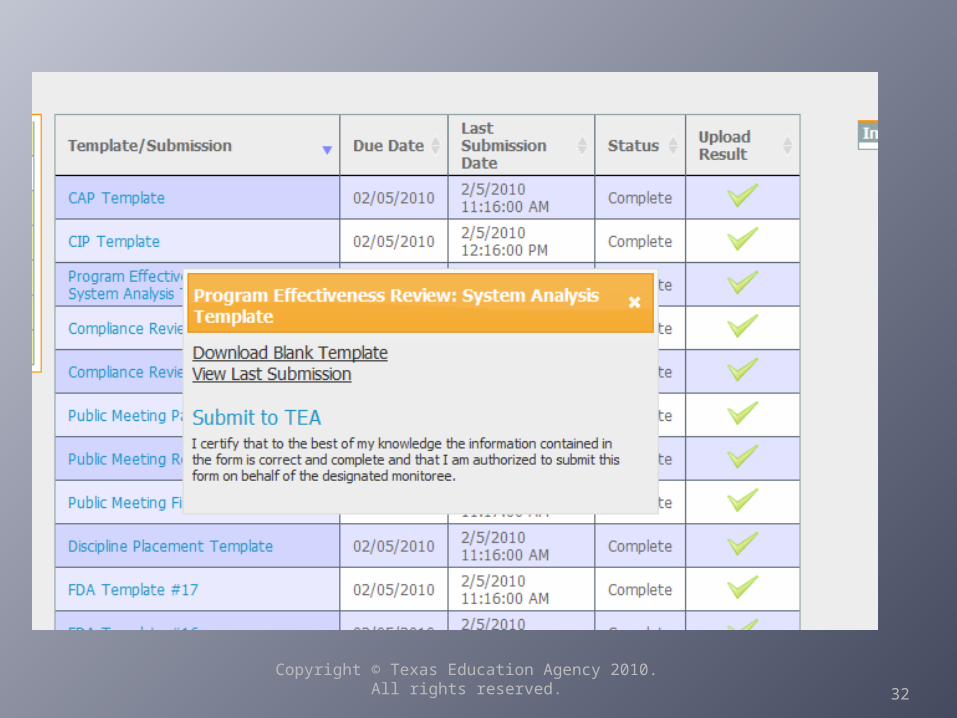
Enhanced ISAM
Changes were made to underlying data structures and the user interface to improve the following:
Transparency
Communication
Tracking
Letter Generation
Reporting
29
Copyright © Texas Education Agency 2009. All rights reserved. 29

Copyright © Texas Education Agency 2010. All rights reserved.
Copyright © Texas Education Agency 2009. All rights reserved.
32
Copyright © Texas Education Agency 2010. All rights reserved.
FDA ACTIVITY
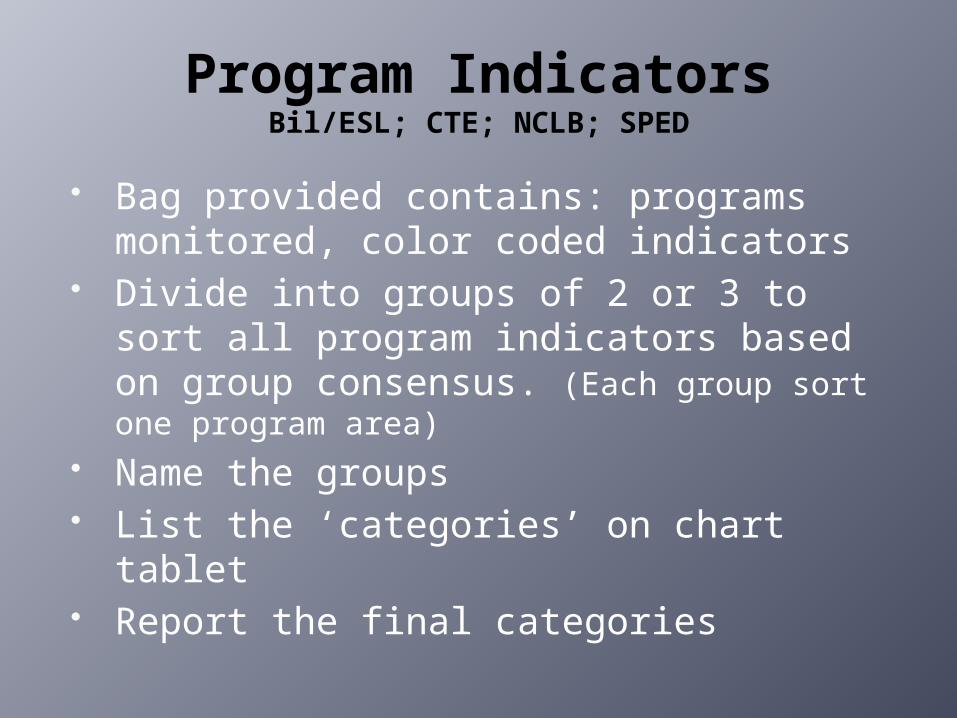
Program IndicatorsBil/ESL; CTE; NCLB; SPED
Bag provided contains: programs monitored, color coded indicators
Divide into groups of 2 or 3 to sort all program indicators based on group consensus. (Each group sort one program area)
Name the groups List the ‘categories’ on chart tablet Report the final categories
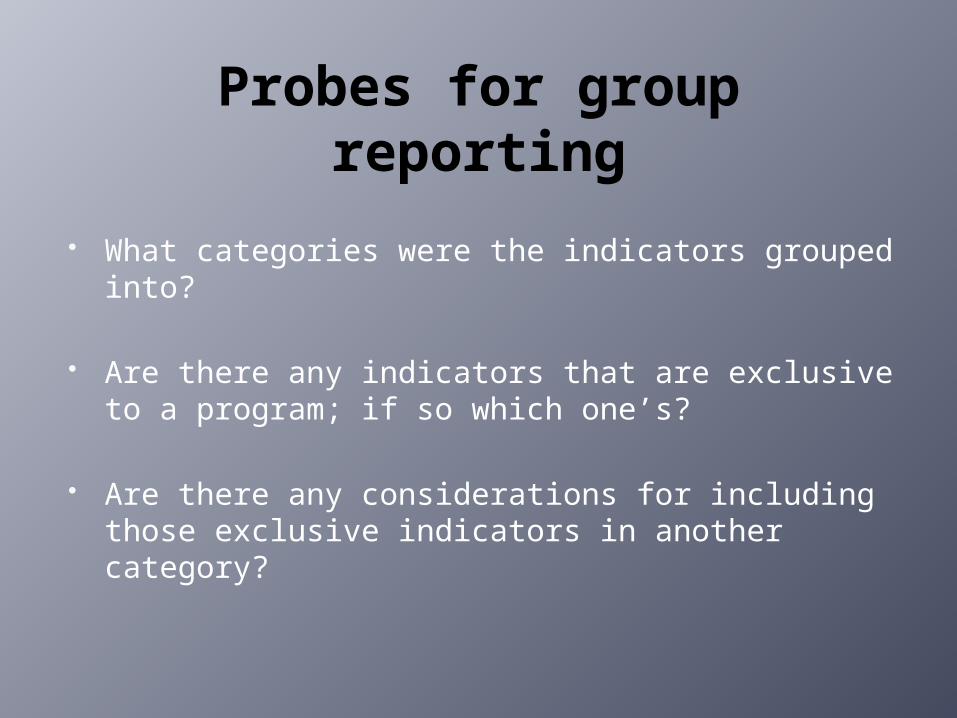
Probes for group reporting
What categories were the indicators grouped into?
Are there any indicators that are exclusive to a program; if so which one’s?
Are there any considerations for including those exclusive indicators in another category?
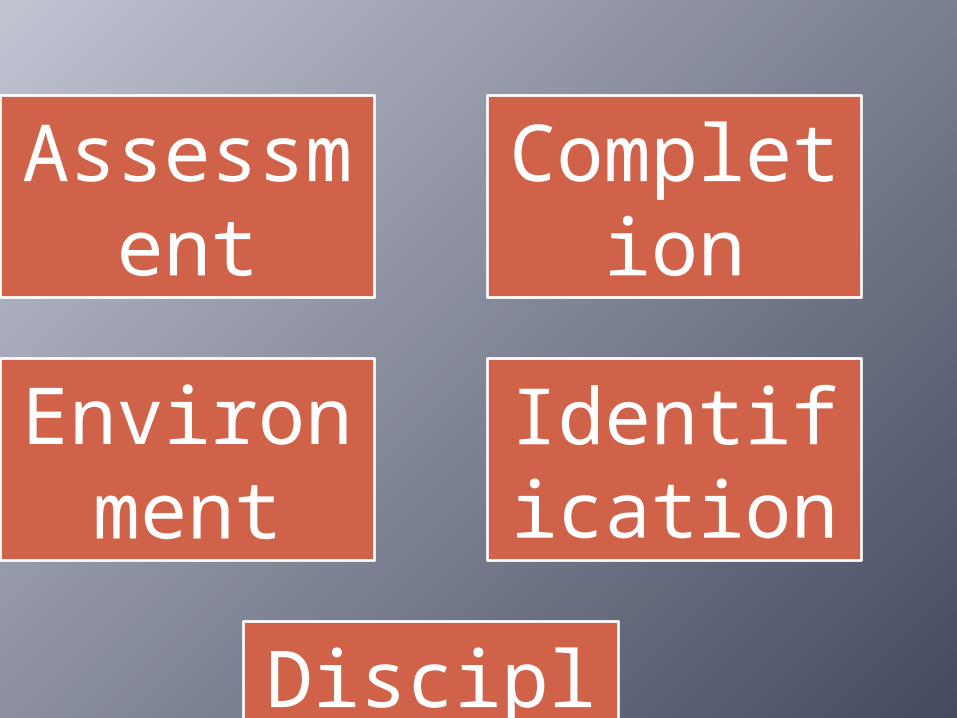
Assessment
Completion
Environment
Identification
Discipline
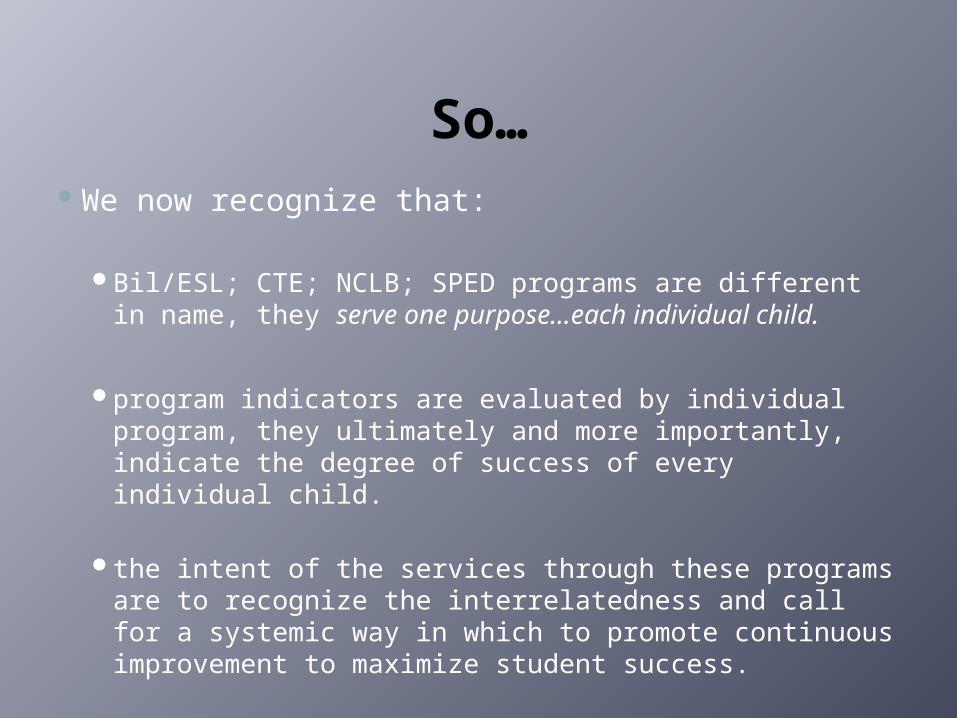
So… We now recognize that:
Bil/ESL; CTE; NCLB; SPED programs are different in name, they serve one purpose…each individual child.
program indicators are evaluated by individual program, they ultimately and more importantly, indicate the degree of success of every individual child.
the intent of the services through these programs are to recognize the interrelatedness and call for a systemic way in which to promote continuous improvement to maximize student success.
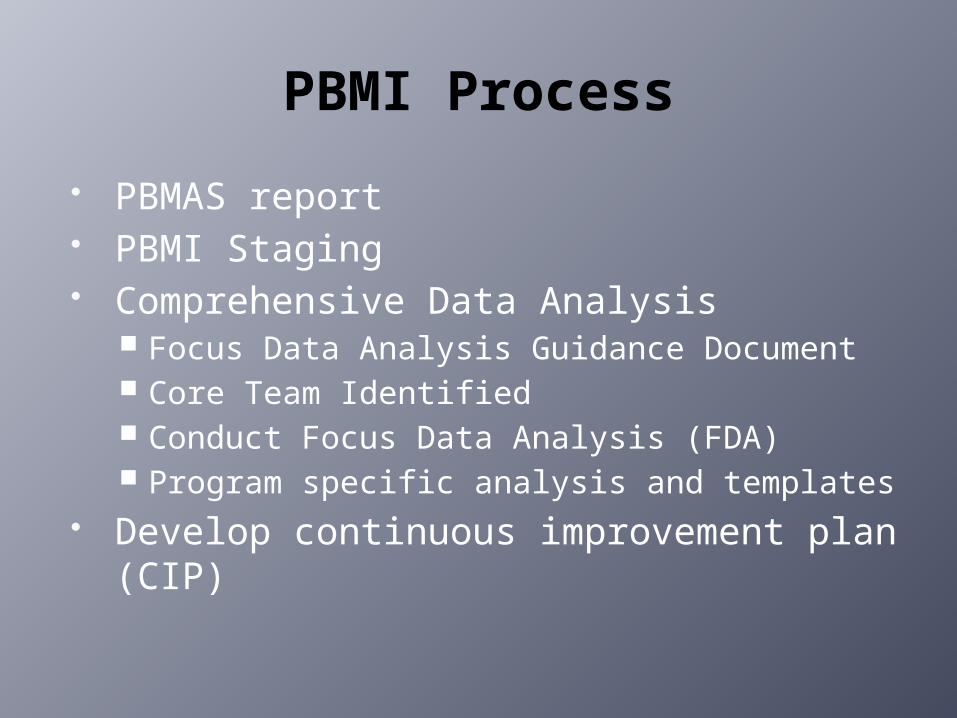
PBMI Process
PBMAS report PBMI Staging Comprehensive Data Analysis
Focus Data Analysis Guidance Document Core Team Identified Conduct Focus Data Analysis (FDA) Program specific analysis and templates
Develop continuous improvement plan (CIP)
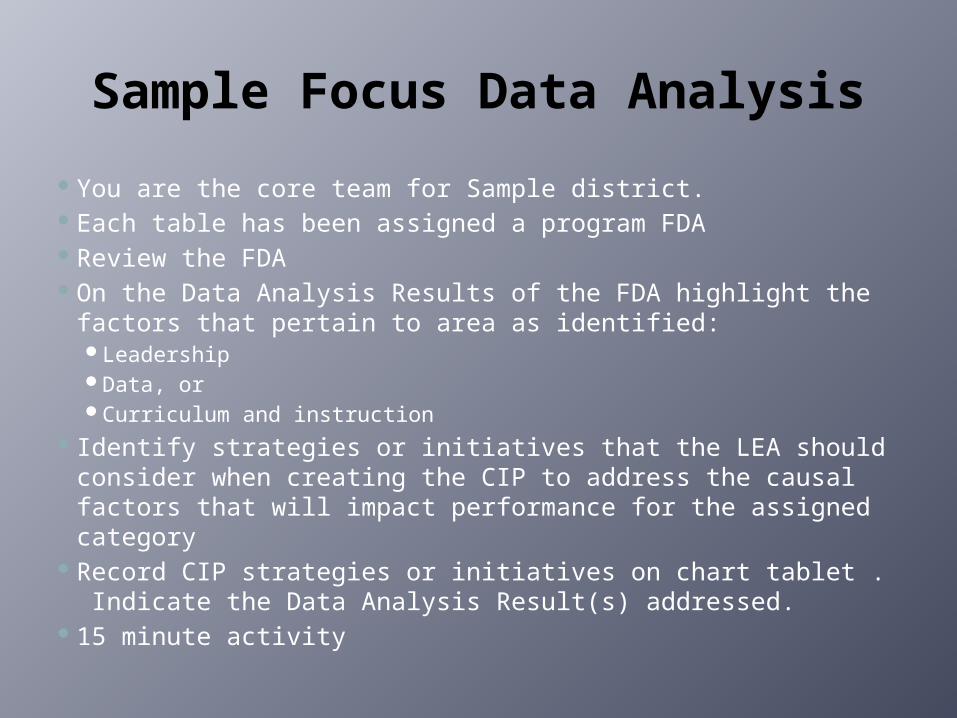
Sample Focus Data Analysis
You are the core team for Sample district. Each table has been assigned a program FDA Review the FDA On the Data Analysis Results of the FDA highlight the factors
that pertain to area as identified: Leadership Data, or Curriculum and instruction
Identify strategies or initiatives that the LEA should consider when creating the CIP to address the causal factors that will impact performance for the assigned category
Record CIP strategies or initiatives on chart tablet . Indicate the Data Analysis Result(s) addressed.
15 minute activity

What we would recommend
Report to whole group What category did you have? Summarize causal factor(s) that you wrote
strategies for? What strategies did you determine for the
CIP to address the causal factors to impact performance in the assigned category?
For each category and program, are there strategies that are relevant to the other programs.
Will it work?
Evidence of implementation Evidence of impact
What data sources might the district use to measure progress and
impact?
Migrant Only
LEP Only
Special ED Only
CTE Only
3,998
6,648LS
3,549LM
6,091CLP 703
3,416CMS
699
6,817LEP & CTE
6,073CS
6,219
50,182
4,845CM
389
6,817LEP & CTE
48,610
371
Migrant & Special Ed
371
Migrant & Special Ed
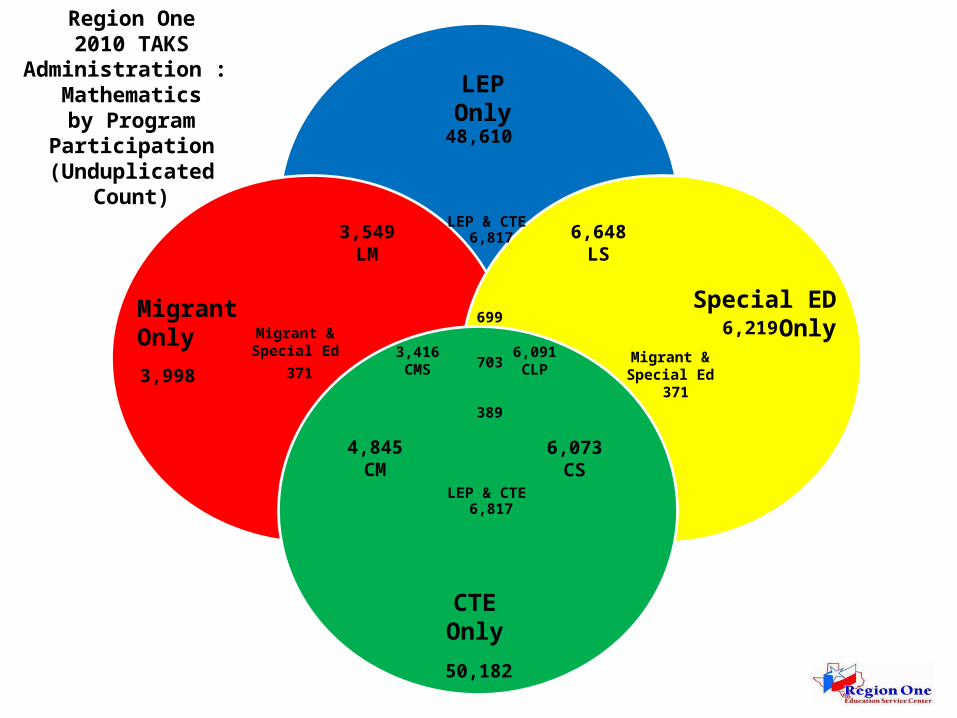
Region One2010 TAKS
Administration : Mathematicsby Program
Participation(Unduplicated
Count)

6219, 3%3998, 2%
48610, 25%
50182, 26%
83962, 44%
Region One2010 TAKS Administration : Mathematics
by Program Participation(Unduplicated Count)
Special Ed Migrant LEP CTE No Program
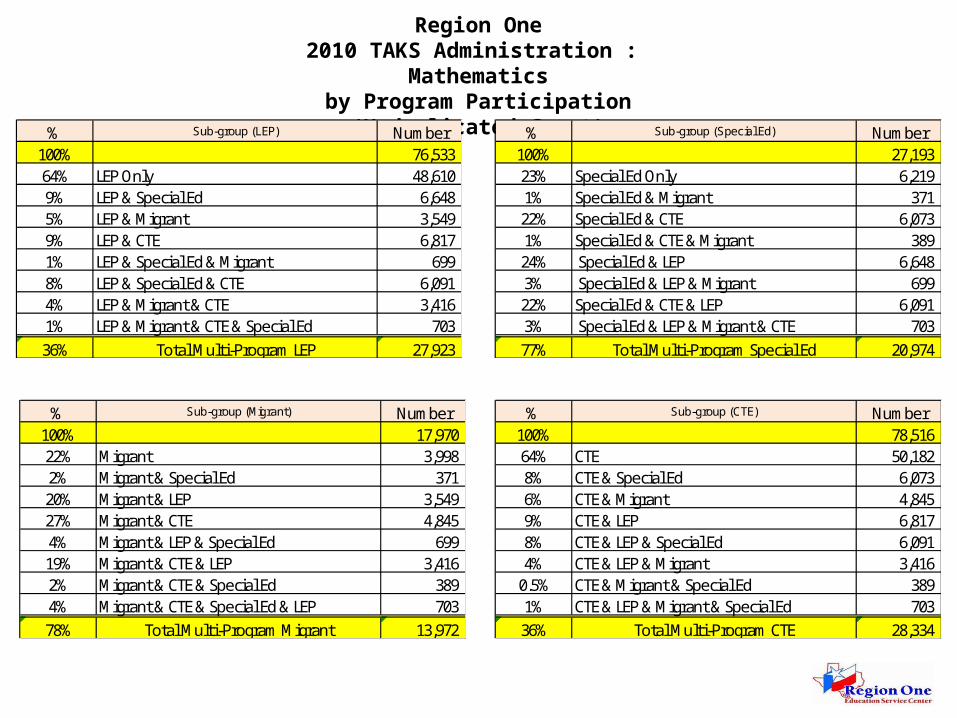
Region One2010 TAKS Administration :
Mathematicsby Program Participation
(Unduplicated Count)% Sub-group (LEP) Number100% 76,533 64% LEP Only 48,610 9% LEP & Special Ed 6,648 5% LEP & Migrant 3,549 9% LEP & CTE 6,817 1% LEP & Special Ed & Migrant 699 8% LEP & Special Ed & CTE 6,091 4% LEP & Migrant & CTE 3,416 1% LEP & Migrant & CTE & Special Ed 703 36% Total Multi-Program LEP 27,923
% Sub-group (Special Ed) Number100% 27,193 23% Special Ed Only 6,219 1% Special Ed & Migrant 371 22% Special Ed & CTE 6,073 1% Special Ed & CTE & Migrant 389 24% Special Ed & LEP 6,648 3% Special Ed & LEP & Migrant 699 22% Special Ed & CTE & LEP 6,091 3% Special Ed & LEP & Migrant & CTE 703 77% Total Multi-Program Special Ed 20,974
% Sub-group (Migrant) Number100% 17,970 22% Migrant 3,998 2% Migrant & Special Ed 371 20% Migrant & LEP 3,549 27% Migrant & CTE 4,845 4% Migrant & LEP & Special Ed 699 19% Migrant & CTE & LEP 3,416 2% Migrant & CTE & Special Ed 389 4% Migrant & CTE & Special Ed & LEP 703 78% Total Multi-Program Migrant 13,972
% Sub-group (CTE) Number100% 78,516 64% CTE 50,182 8% CTE & Special Ed 6,073 6% CTE & Migrant 4,845 9% CTE & LEP 6,817 8% CTE & LEP & Special Ed 6,091 4% CTE & LEP & Migrant 3,416
0.5% CTE & Migrant & Special Ed 389 1% CTE & LEP & Migrant & Special Ed 703 36% Total Multi-Program CTE 28,334

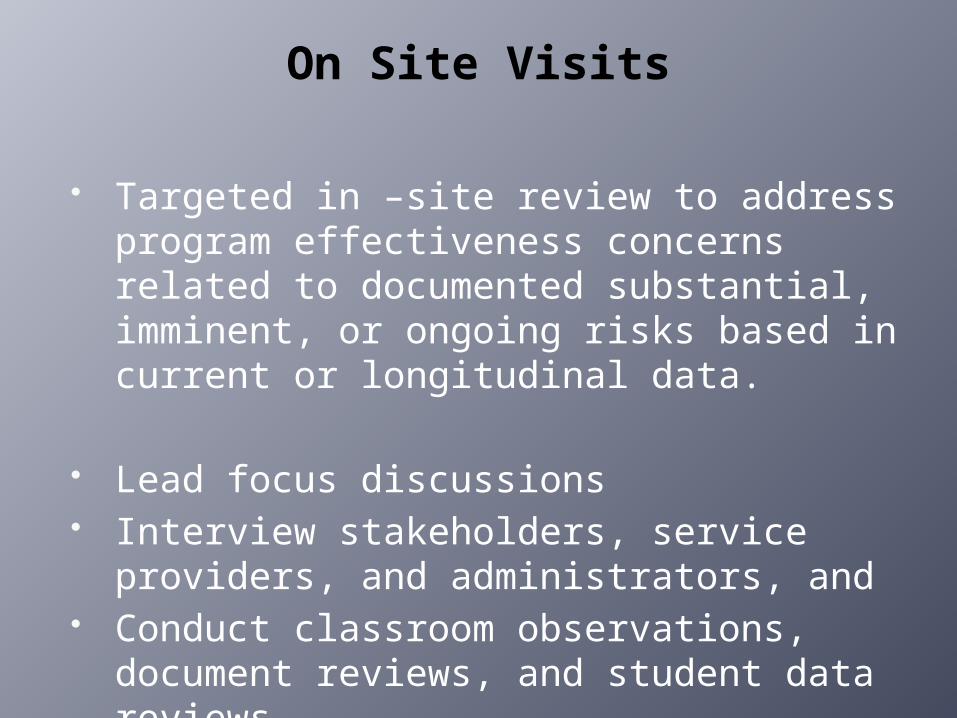
On Site Visits
Targeted in –site review to address program effectiveness concerns related to documented substantial, imminent, or ongoing risks based in current or longitudinal data.
Lead focus discussions Interview stakeholders, service providers,
and administrators, and Conduct classroom observations,
document reviews, and student data reviews
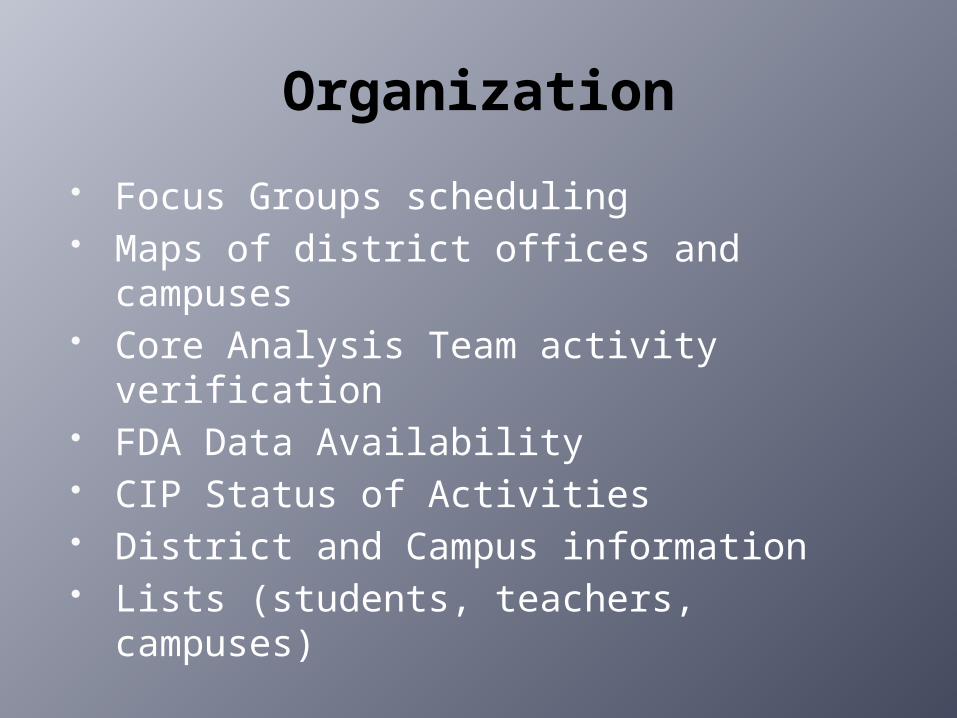
Organization
Focus Groups scheduling Maps of district offices and campuses Core Analysis Team activity verification FDA Data Availability CIP Status of Activities District and Campus information Lists (students, teachers, campuses)
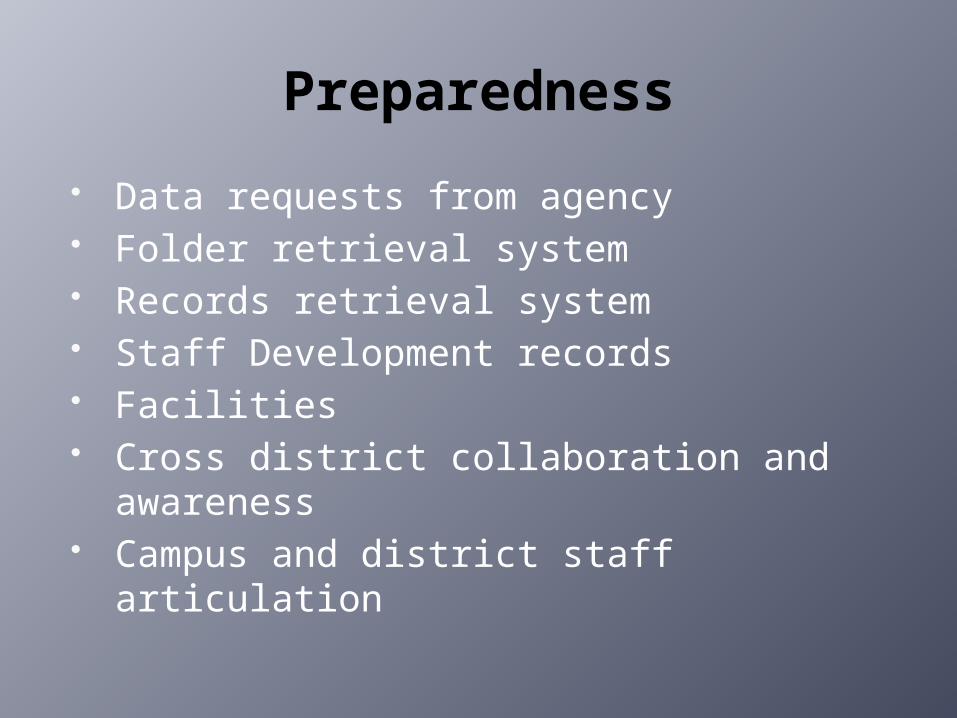
Preparedness
Data requests from agency Folder retrieval system Records retrieval system Staff Development records Facilities Cross district collaboration and
awareness Campus and district staff articulation
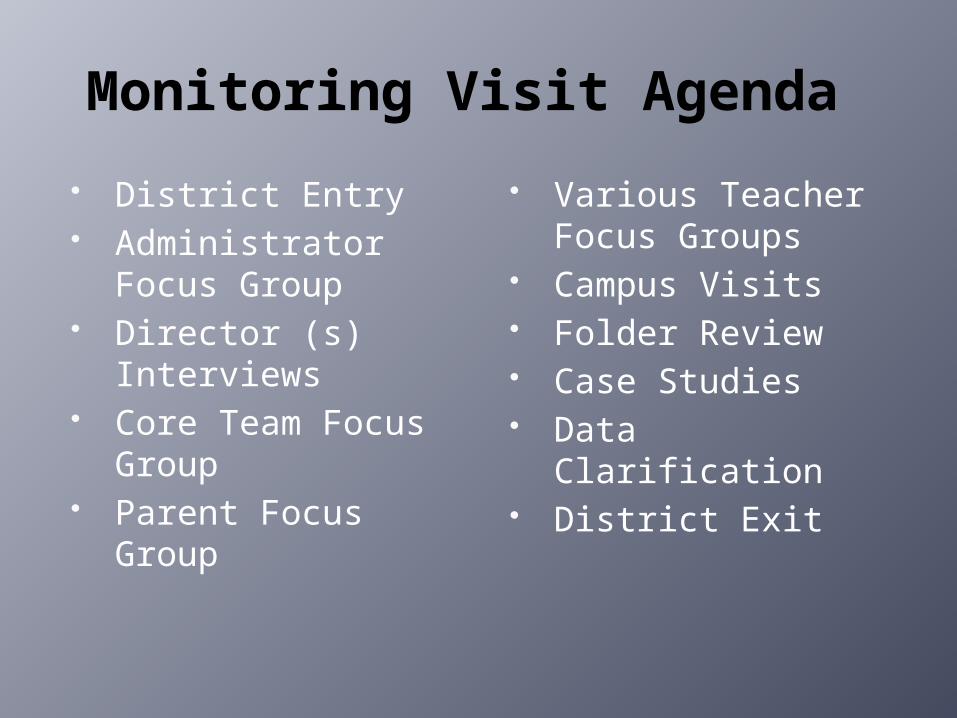
Monitoring Visit Agenda
District Entry Administrator Focus
Group Director (s)
Interviews Core Team Focus
Group Parent Focus Group
Various Teacher Focus Groups
Campus Visits Folder Review Case Studies Data Clarification District Exit
Keys to Success
Campus and district staff articulation
Implementation with fidelity
Student Progress

“You cannot solve a problem from the same consciousness that created it. You must learn to see the world anew.”
Albert Einstein

ESC Contacts
Connie Guerra, B/ESL, [email protected] Christina Salas, CTE, [email protected] Omar Chavez, Migrant,
[email protected] Belinda Gorena, Title I,
[email protected] Kelly Solis, Sp. Ed., [email protected]