Embed Size (px)
Citation preview
Contract No. EDH-I-00-05-00029-00 Task Order AID-OAA-TO-10-00010 September 2015 This document was produced for review by the United States Agency for International Development. It was prepared by Creative Associates International.
Do Early Warning Systems and Student Engagement Activities Reduce Dropout?
Findings from the School Dropout Prevention Pilot Program Impact Evaluation in Cambodia
Volume 1: Main Findings

Do Early Warning Systems and Student Engagement
Activities Reduce Dropout?
Findings from the School Dropout Prevention Pilot
Program Impact Evaluation in Cambodia
Volume 1: Main Findings
Submitted to:
United States Agency for International Development
Washington, DC
Submitted by:
Creative Associates International, Inc.
Washington, DC
September 2015
This report was made possible by the American people through the United States Agency for
International Development (USAID). The contents of this report are the sole responsibility of
Creative Associates International and do not necessarily reflect the views of USAID or the
United States Government.

DEC Submission Requirements
a. USAID Award Number Contract No. EDH-I-00-05-00029-00
Task Order AID-OAA-TO-10-00010
b. USAID Objective Title
and Number Investing in People (IIP)
c. USAID Project Title and
Number
USAID Asia and Middle East Regional School Dropout
Prevention Pilot (SDPP) Program
d. USAID Program Area and
Program Element
Education (program area 3.2)
Basic Education (program element 3.2.1)
e. Descriptive Title
Findings from the School Dropout Prevention Pilot
Program Impact Evaluation in Cambodia, Volume 1:
Main Findings
f. Author Name(s) Creative Associates International and Mathematica
Policy Research
g. Contractor name
Creative Associates International, Inc.
5301 Wisconsin Avenue, NW, Suite 700
Washington, DC 20015
Telephone: 202 966 5804 Fax: 202 363 4771
Contact: [email protected]
h. Sponsoring USAID
Operating Unit and COTR
Asia/TS
Eric Bergthold, COTR
i. Date of Publication September 2015
j. Language of Document English, Khmer
Findings from the School Dropout Prevention Pilot Program Impact Evaluation in Cambodia Page i
TABLE OF CONTENTS
List of Tables ................................................................................................................................. iii
List of Figures ................................................................................................................................ iii
Acronyms ...................................................................................................................................... vii
Acknowledgements ...................................................................................................................... viii
Executive Summary ....................................................................................................................... ix
I. Introduction .............................................................................................................................1
II. SDPP Program in Cambodia ...................................................................................................4
A. Targeting grades and geographic areas for intervention ................................................4
B. Interventions ..................................................................................................................5
1. Selecting SDPP interventions .................................................................................5 2. Early warning system ...............................................................................................9
3. Computer Labs .....................................................................................................10
C. Program implementation ..............................................................................................10
D. Fidelity of Implementation ..........................................................................................13
III. Evaluation Design .................................................................................................................16
A. SDPP Theory of Change ................................................................................................16
B. Research Questions ........................................................................................................17
C. Evaluation Design ..........................................................................................................17
1. Study eligibility ....................................................................................................18 2. Primary impact analysis .......................................................................................19 3. Impact analysis for at-risk students ......................................................................20 4. Additional subgroup analyses ..............................................................................20
5. Primary and additional measures of SDPP’s effectiveness ..................................21
IV. Sampling and data collection ................................................................................................23
V. Characteristics of the sample prior to implementation .........................................................25
VI. Impacts of SDPP ...................................................................................................................29
A. Impacts on teacher outcomes .........................................................................................30
1. Impact on teacher take-up of dropout prevention practices.....................................30 2. Impact on additional teacher outcomes ...................................................................35 3. Impact on additional school administrator outcomes ..............................................40
Findings from the School Dropout Prevention Pilot Program Impact Evaluation in Cambodia Page ii
B. Impacts on at-risk students’ attitudes toward school ......................................................44
1. Impact on primary measure of student attitudes toward school ..............................44 2. Impact on additional measures of student attitudes toward school .........................51
C. Impacts on student engagement in school ...................................................................58
1. Impact on student’s daily attendance in school .......................................................58 2. Impact on additional measures of student engagement in school ...........................61
D. Impacts on school dropout ...........................................................................................64
1. Impact on primary measure of school dropout ........................................................64 2. Impact on additional measures of school dropout ...................................................70
VII. School-level dropout trends...................................................................................................74
VIII. Discussion .............................................................................................................................77
A. Overview of findings ......................................................................................................77
B. Contextual factors related to findings ..........................................................................80
C. Conclusion ...................................................................................................................81
References ......................................................................................................................................82
Findings from the School Dropout Prevention Pilot Program Impact Evaluation in Cambodia Page iii
List of Tables
Table ES.1. SDPP Program impacts on primary measures of program effectiveness in
Cambodia ................................................................................................................ xix
Table ES.2. SDPP Program impacts on additional outcome measures in Cambodia .................. xix
Table III.C.1. Primary and additional subgroup analyses ..............................................................21
Table III.C.2. Primary and additional measures of Cambodia SDPP Program’s
effectiveness at endline (SY 2012–2013 and SY 2013–2014) .................................22
Table IV.1. Study sample sizes ......................................................................................................24
Table V.1. Average school and target grade teacher characteristics before intervention
(7th, 8th, and 9th grade, SY 2011–2012) (percentage unless indicated
otherwise) ..................................................................................................................26
Table V.2. Average student characteristics before intervention (7th and 8th grade, SY
2011–2012) (percentage of students unless otherwise indicated).............................28
Table VIII.A.1. SDPP Program impacts on primary measures of program
effectiveness in Cambodia ........................................................................................79
Table VIII.A.2. SDPP Program impacts on additional outcome measures in Cambodia ..............79
List of Figures
Figure ES.1. Impacts of the Cambodia SDPP Program on teacher dropout prevention
practices .................................................................................................................. xiii
Figure ES.2. Impacts of the Cambodia SDPP Program on at-risk student attitudes
toward school ............................................................................................................xv
Figure ES.3. Impacts of the Cambodia SDPP Program on daily attendance, overall
and by at-risk status ................................................................................................ xvi
Figure ES.4. Impacts of the Cambodia SDPP Program on school dropout, overall and
by at-risk status ...................................................................................................... xvii
Figure II.A.1. National dropout rates by grade (2009–2010) ..........................................................4
Figure II.A.2. Target regions of the SDPP Program ........................................................................5
Figure II.B.1. Reported causes of dropout .......................................................................................6
Findings from the School Dropout Prevention Pilot Program Impact Evaluation in Cambodia Page iv
Figure II.B.2. Absenteeism reported by dropouts and at-risk students ............................................7
Figure II.B.3. Treatment by teachers reported by at-risk students ...................................................8
Figure II.B.4. At-risk student engagement in school .......................................................................8
Figure II.C.1. Rollout of the interventions in Cambodia ...............................................................12
Figure II.C.2. Grades by academic year for SDPP students in Cambodia.....................................13
Figure II.D.1. EWS: Proportion of schools meeting or exceeding 80% FOI threshold ................14
Figure II.D.2. EWS: Proportion of schools meeting or exceeding FOI threshold by
component .................................................................................................................14
Figure II.D.3. Computer labs: proportion of schools meeting or exceeding 80 percent
FOI threshold ............................................................................................................15
Figure II.D.4. CL: Average FOI scores by component and data collection round ........................15
Figure III.A.1. Cambodia SDPP conceptual model .......................................................................16
Figure III.C.1. SDPP randomized control trial design in Cambodia .............................................18
Figure VI.A.1. SDPP Program impacts on teacher dropout prevention practices at
endline (SY 2012–2013 and SY 2013–2014) ...........................................................31
Figure VI.A.2. SDPP Program impacts on teacher dropout prevention practices at
endline, by subgroup .................................................................................................33
Figure VI.A.3. SDPP Program impacts on teacher sense of self-efficacy at endline
(SY 2012–2013 and SY 2013–2014) ........................................................................36
Figure VI.A.4. SDPP Program impacts on teacher sense of responsibility at endline
(SY 2012-2013 and SY 2013-2014) .........................................................................37
Figure VI.A.5. SDPP Program impacts on administrators’ dropout prevention
practices scale ...........................................................................................................40
Figure VI.A.6. SDPP Program impacts on administrator sense of self-efficacy ...........................41
Figure VI.A.7. SDPP Program impacts on administrator sense of responsibility .........................42
Figure VI.B.1. SDPP Program impacts on at-risk students’ emotional attitudes toward
school ........................................................................................................................45
Figure VI.B.2. SDPP Program impacts on at-risk students’ emotional attitudes toward
school, by subgroup ..................................................................................................46
Findings from the School Dropout Prevention Pilot Program Impact Evaluation in Cambodia Page v
Figure VI.B.3. SDPP Program impacts on at-risk students’ cognitive attitudes toward
school ........................................................................................................................47
Figure VI.B.4. SDPP Program impacts on at-risk students’ cognitive attitudes toward
school, by subgroup ..................................................................................................48
Figure VI.B.5. SDPP Program impacts on at-risk students’ behavioral attitudes
toward school at endline ...........................................................................................49
Figure VI.B.6. SDPP Program impacts on at-risk students’ behavioral attitudes
toward school, by subgroup ......................................................................................50
Figure VI.B.7. SDPP Program impacts on at-risk students’ perceptions of teacher
support at endline ......................................................................................................52
Figure VI.B.8. SDPP Program impacts on at-risk students’ perceptions of parental
support at endline ......................................................................................................54
Figure VII.B.9. SDPP Program impacts on at-risk students’ perceptions of computer
training at endline .....................................................................................................56
Figure VI.C.1. SDPP Program impact on daily attendance, overall and by at-risk
status .........................................................................................................................59
Figure VI.C.2. SDPP Program impacts on daily attendance for students overall at
endline, by subgroup .................................................................................................60
Figure VI.C.3. SDPP Program impacts on math performance at endline ......................................61
Figure VI.C.4. SDPP Program impacts on Khmer language performance at endline ...................62
Figure VI.C.5. SDPP Program impacts on student behavior .........................................................63
Figure VI.D.1. SDPP Program impact on school dropout, overall and by at-risk status ...............66
Figure VI.D.2. SDPP Program impacts on school dropout, by cohort (SY 2012–2013
and SY 2013–2014) ..................................................................................................67
Figure VI.D.3. SDPP Program impacts on school dropout at endline, by subgroup .....................68
Figure VI.D.4. SDPP Program impact on grade progression at endline........................................70
Figure VII.1. School between-grade dropout rates, by grade and school year ..............................75
Figure VII.2. School within-grade dropout rates by grade and school year ..................................76
Figure VIII.A.1. SDPP conceptual model with program impacts .................................................78
Findings from the School Dropout Prevention Pilot Program Impact Evaluation in Cambodia Page vi
VOLUME 2: TECHNICAL APPENDICES
APPENDIX A. Evaluation Design A.1
APPENDIX B. Analytic Methods A.13
APPENDIX C. Analyzing Teacher and School Administrator Outcomes A.20
APPENDIX D. Analyzing At-Risk Student Attitudes A.32
APPENDIX E. Analyzing School Engagement A.36
APPENDIX F. Analyzing School Dropout A.39
APPENDIX G. Exposure Analysis A.45
APPENDIX H. Supplemental Tables A.48
APPENDIX I. School–Level Trend Analysis A.65
APPENDIX J. Propensity Score Analysis of Students Identified by the EWS A.73
APPENDIX K. Data Collection Instruments A.82

Findings from the School Dropout Prevention Pilot Program Impact Evaluation in Cambodia Page vii
Acronyms
CARE Care International
CL Computer Labs
EWS Early Warning System
FOI Fidelity of Implementation
ICT Information and Communication Technology
ITT Intent-to-Treat
KAPE Kampuchean Action for Primary Education
LAN Local Area Network
MDI Minimum Detectable Impact
MOEYS Ministry of Education, Youth and Sport
QUEST Quest Alliance
RCT Randomized Control Trial
SDPP School Dropout Prevention Pilot
STS School-to-School International
SY School Year
TOT Treatment-on-the-Treated
USAID United States Agency for International Development
Findings from the School Dropout Prevention Pilot Program Impact Evaluation in Cambodia Page viii
Acknowledgements
These findings are the result of the work of the collective SDPP team in the United States and
Cambodia in its stages from research design and instrument development to data collection and
entry to analysis and reporting. The following people played a major role in the process:
Karen Tietjen (Creative Associates)
Nancy Murray (Mathematica Policy Research)
Quinn Moore (Mathematica Policy Research)
Emilie Bagby (Mathematica Policy Research)
Ali Protik (Mathematica Policy Research)
Mark Strayer (Mathematica Policy Research)
Kristine Johnston (Mathematica Policy Research)
Kathy Buek (formerly Mathematica Policy Research)
Larissa Campuzano (Mathematica Policy Research)
Jane Fortson (Mathematica Policy Research)
Ebo Dawson-Andoh (Mathematica Policy Research)
Owen Schochet (Mathematica Policy Research)
Ron Palanca (Mathematica Policy Research)
Jeremy Page (Mathematica Policy Research)
Linda Molinari (Mathematica Policy Research)
Serge Lukashanets (Mathematica Policy Research)
Brendan Kirwan (Mathematica Policy Research)
Carol Razafindrakoto (Mathematica Policy Research)
Jonathan McCay (Mathematica Policy Research)
Ivonne Padilla
Espinosa (Mathematica Policy Research)
Chea Kosal (Kampuchean Action for Primary Education)
Carole Williams (Kampuchean Action for Primary Education)
Lork Ratha (Kampuchean Action for Primary Education)
Neangpouv Yi (Indochina Research Ltd – IRL)
Chantha Kuon (Indochina Research Ltd – IRL)
The final report was prepared by Nancy Murray, Quinn Moore, Emilie Bagby, Ali Protik,
Kristine Johnston, Mark Strayer, Ebo Dawson-Andoh, Owen Schochet, Anitha Sivasankaran and
Karen Tietjen.
Findings from the School Dropout Prevention Pilot Program Impact Evaluation in Cambodia Page ix
Executive Summary
Over the past two decades, considerable progress has been made in increasing school enrollment.
However, many children do not complete primary or secondary cycles once they enroll. In many
countries and regions, a greater percentage of out-of-school children have dropped out of school
than have never enrolled in school. Interventions have been conducted in the United States and
abroad to prevent dropout, but there is limited evidence on how well they work, particularly in
developing countries.
The School Dropout Prevention Pilot (SDPP) Program, a five-year multicountry program funded
by the U.S. Agency for International Development (USAID), is designed to identify successful
means of decreasing student dropout rates in primary and secondary schools.1 Its goal is to pilot
and test the effectiveness of dropout prevention interventions in four countries—Cambodia, India,
Tajikistan, and Timor-Leste—to generate evidence-based programming guidance for USAID
missions and countries in Asia and the Middle East. In all four countries, SDPP introduced an early
warning system (EWS) and a student engagement intervention to motivate greater student
engagement, better attendance and desire to stay in school. This report presents findings from the
impact evaluation of the SDPP program in Cambodia.
SDPP Program in Cambodia
Cambodia’s SDPP program had two main components: (1) an EWS; and (2) computer labs (CL)
with computer literacy training (Creative Associates International 2012a and Creative Associates
International 2012b). The SDPP program was targeted to 7th-, 8th-, and 9th-grade students in six
provinces, as these grades and geographic areas exhibited the highest dropout rates and would
benefit most from a dropout prevention program (Shrestha, Rajani, Jennifer Shin, and Karen
Tietjen 2011a).
The EWS consists of three components: (1) identification of students at risk of school dropout, (2)
first response strategies, and (3) community engagement. For Component 1, the SDPP program
worked with teachers to identify at-risk students based on six predictors of dropout risk. For
Component 2, SDPP helped teachers use a “track and trigger” approach to closely monitor the
attendance, behavior and coursework of at-risk students and initiate “first response” activities
when students showed signs of struggling, ranging from in-class attention to contact via letter,
phone call and/or home visit to case management meetings with school staff. Component 3 focused
on raising community awareness about the problem of dropout, working with parent-teacher
associations and other community groups on advocacy activities and enlisting their support for the
first response activities, working closely with the school.
The CL program consisted of the installation of computer labs and the provision of computer
literacy training to target-grade students. Each school receiving this intervention had a dedicated
computer room with a host computer, 16 additional computers for students, and a laser printer.
1 SDPP is implemented by Creative Associates International, with international partners Mathematica Policy Research and School-
to-School International and local partners Kampuchean Action for Primary Education (KAPE) in Cambodia, Quest Alliance
(QUEST) in India, and Care International (CARE) in Timor-Leste. Creative Associates has a corporate office in Tajikistan, which
covers the responsibilities of a local partner in that country.
Findings from the School Dropout Prevention Pilot Program Impact Evaluation in Cambodia Page x
Solar panels installed on computer room roofs provided the computer rooms with electricity.
Students received computer lab access for two hours per week (Creative Associates International
2012a). Unique among SDPP countries, this additional intervention was only provided to a subset
of schools receiving the EWS intervention. Thus, Cambodian schools were divided into three
groups: one treatment group receiving the EWS intervention (the EWS group); one treatment
group receiving the EWS and computer lab interventions (the EWS+Computers group); and one
control group. The intervention was developed in compliance with the Ministry of Education,
Youth and Sport (MOEYS) policy of expanding computer literacy education to lower secondary
school and utilized a low-cost CL model to increase the likelihood of continued implementation
in Cambodia beyond the funding period.
The SDPP Program was active in schools during two school years (SY), 2012–2013 and 2013–
2014. Students and teachers of target grades received a partial year of exposure during the first
year of the program (SY 2012–2013) because of the timing of the roll-out of the EWS. Students
and teachers of the target grades during the second school year received the program for at least
one full school year (SY 2013–2014).2
During two school years of program activity, the SDPP Program targeted students in grades 7, 8
and 9 and their teachers. Students in grades 7 and 8 during SY 2012–2013 received the program
for more than one year (grade 9 is the final year of lower secondary school). The evaluation
follows: (1) SY 2012–2013 8th-graders who continued to receive the program in SY 2013–2014
in their 9th grade; (2) SY 2012–2013 7th-graders who continued to receive the program in SY
2013–2014, in their 8th grade; and (3) SY 2013–2014 7th grade students.3 SDPP focuses the
analyses on the latest point in time in which these students and teachers are observed across these
two school years.4 The latest observation point occurs in SY 2013–2014 for all students followed
by the evaluation.
SDPP evaluated the fidelity of implementation of the EWS and CL components during field visits
conducted in March/April, and June 2014. Overall, schools appeared to implement the EWS as
intended (Creative Associates International and School-to-School International 2015). All schools
appeared to implement the computer labs as intended; however, assessments of 7th-grade students
showed that students’ computer knowledge and skills remained low after one year of the computer
lab trainings (Creative Associates International and School-to-School International 2015).
2 The teachers and school administrators were first trained in August and September of 2012, before the beginning of SY 2012–
2013 in October. Another training occurred in October 2013 at the beginning of SY 2013–2014. The computer labs were installed
prior to SY 2012–2013, and the computer literacy classes began in October 2012. Because of delays in the identification of at-risk
students, the EWS did not begin until January 2013 for 7th-, 8th-, and 9th-grade students in SY 2012–2013. For new 7th-graders
and returning 8th and 9th-graders in SY 2013–2014, both the EWS and computer lab sessions began in October 2013.
3 Please see Appendix A for further details about data collection. An eligible subset of the total students and teachers was used in
the analysis.
4 Please see Appendix A for further details about data collection. An eligible subset of the total students and teachers was used in
the analysis.
Findings from the School Dropout Prevention Pilot Program Impact Evaluation in Cambodia Page xi
Evaluation design
SDPP hypothesized that academic and social support, combined with additional enrichment
activities, particularly for at-risk students, and changes in teacher practices, would improve student
attitudes and behavior, translating into increased student engagement and reduced school dropout.
Guided by this conceptual model, SDPP designed the impact evaluation to address five primary
research questions:
1. Does SDPP improve teacher behavior and attitudes?
2. Does SDPP improve student attitudes?
3. Does SDPP improve student engagement in school associated with retention, such as
attendance?
4. Does SDPP improve the dropout rate?
5. What are SDPP’s impacts for students most at risk of dropping out of school?
The SDPP evaluation addressed these research questions using a Randomized Control Trial (RCT)
in which SDPP compares the outcomes of students and teachers in 108 schools randomly assigned
to provide the SDPP Program’s EWS+Computers services and 107 schools randomly assigned to
provide the SDPP Program’s EWS-only services, to those of teachers and students in 107 schools
randomly assigned to a control group providing business-as-usual services. SDPP also compared
outcomes between the two SDPP Program intervention groups (EWS-only and EWS+Computers).
With random assignment, exposure to the SDPP Program is not directly related to the choices or
pre-existing characteristics of study participants, allowing attribution of any observed treatment-
control differences in outcomes to the SDPP Program.
Data collection
The data used in this report were collected from school records and through interviews with
teachers and at-risk students. SDPP collected data five times from all 322 schools in the study over
four school years, between SY 2011–2012 and SY 2014–2015, to follow the three cohorts of
students who were exposed to the SDPP intervention for at least one full school year. SDPP
collected information from school records for 191,776 students, and conducted interviews with
18,920 at-risk students and 6,041 teachers and administrators.5 All final outcomes were measured
during SY 2013–2014 for the three cohorts followed (SY 2012–2013 8th graders, SY 2012–2013
7th graders, and SY 2013–2014 7th graders).
EWS+Computers, EWS, and control group schools had comparable characteristics at baseline,
with only a few statistically significant differences between the groups.6 The typical
EWS+Computers group school enrolls about 389 7th-, 8th-, and 9th- grade students, compared
with 386 students in the EWS group schools, and 356 in the control group schools. Schools in the
5 Please see Appendix A for further details about data collection. An eligible subset of the total students and teachers was used in
the analysis.
6 There were statistically significant differences for 3 of the 90 comparisons of baseline characteristics; 5 would be expected due
to chance.
Findings from the School Dropout Prevention Pilot Program Impact Evaluation in Cambodia Page xii
EWS+Computers group and the EWS group had an average of 11 9th grade teachers, compared
with 10 teachers in the control group schools. Schools in the EWS group have fewer active school
infrastructure programs than schools in the control group, while EWS+Computers group schools
were further from the district capital than EWS group schools.
Impacts of SDPP
A conceptual model of SDPP Program activities and how they might affect student and teacher
outcomes guided the design of the program and the impact evaluation. This model posits that
teacher and parent knowledge and practices—shared and reinforced by the larger community—
are inputs into students’ attitudes toward school and educational aspirations. These student
attitudes translate into student engagement in school, including their attendance, behavior, and
academic performance. The complex, cumulative interactions of these factors are inputs into the
student’s ability, desire and decision to remain in school or drop out.
The evaluation estimated the SDPP Program impacts on teacher outcomes, student attitudes,
student engagement in school, and school dropout. In each domain, SDPP focused on a small set
of key outcomes, identified before the analysis began.
The text boxes and figures below summarize findings for the primary measures of effectiveness in
domains related to teacher practices, at-risk students’ attitudes toward school, student engagement
in school, and school dropout. Estimates of the impact of the SDPP program are based on
differences in average outcomes for SDPP and control group students and teachers. These impact
estimates represent the difference in the outcome of interest at endline that is attributable to the
EWS+Computers and EWS-only programs relative to the status quo. The estimates are expressed
as percentage point differences between the treatment and control group; we also present
percentage increases or decreases in the primary outcomes across the treatment and control groups.
These “percentage changes” should not be interpreted as the percentage “change” that might be
calculated in a pre-post or baseline/endline change, but rather, as the increase or decrease in the
treatment group’s outcome measure in relation to the control group at endline.
Statistical tests were conducted to assess whether each impact is significantly different from zero.
Impacts estimates are described as statistically significant if there is less than a 5 percent
probability that it is due to chance (and not to the SDPP Program). Impact estimates are described
SDPP effectiveness in influencing teacher outcomes
Primary research question
Did SDPP affect teacher dropout prevention practices?
Primary measure of SDPP Program’s effectiveness
Teacher take-up of dropout prevention practices
Additional measures of SDPP Program’s effectiveness
Teacher sense of self-efficacy
Teacher sense of responsibility
Administrator dropout prevention practices, sense of self-efficacy, and sense of
responsibility
Findings from the School Dropout Prevention Pilot Program Impact Evaluation in Cambodia Page xiii
as marginally significant if the probability that it is due to chance (and not to the SDPP Program)
is between 5 and 10 percent.
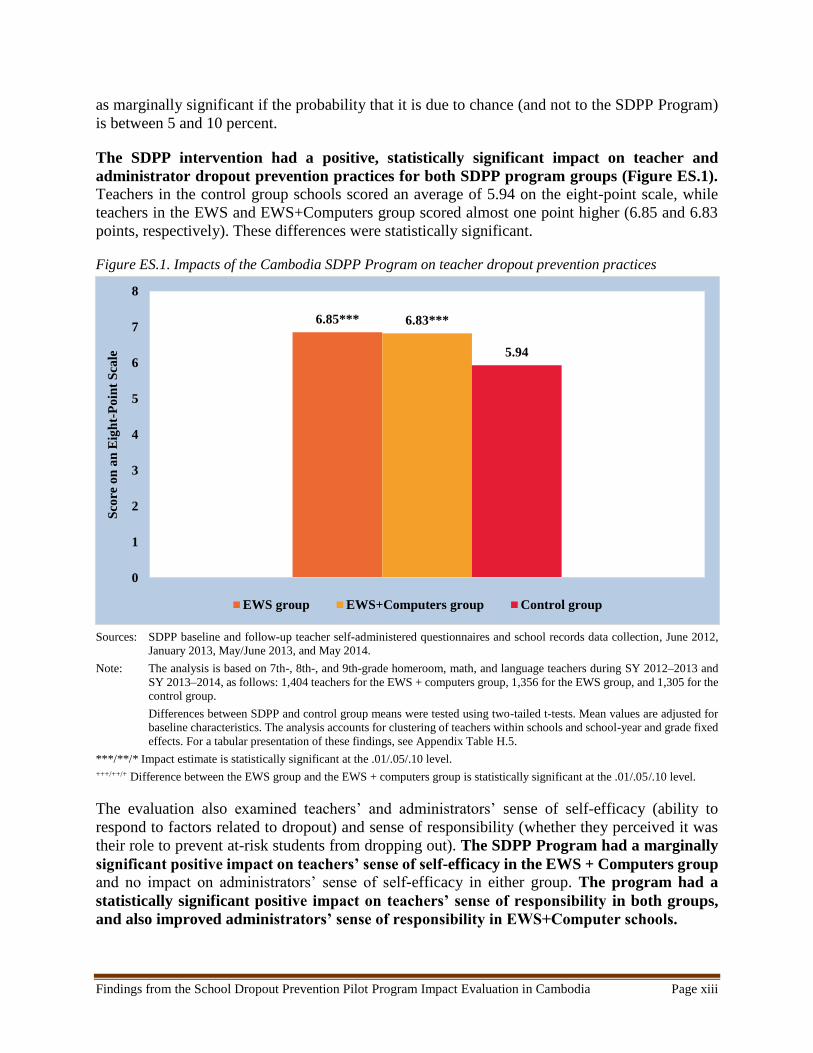
The SDPP intervention had a positive, statistically significant impact on teacher and
administrator dropout prevention practices for both SDPP program groups (Figure ES.1). Teachers in the control group schools scored an average of 5.94 on the eight-point scale, while
teachers in the EWS and EWS+Computers group scored almost one point higher (6.85 and 6.83
points, respectively). These differences were statistically significant.
Figure ES.1. Impacts of the Cambodia SDPP Program on teacher dropout prevention practices
Sources: SDPP baseline and follow-up teacher self-administered questionnaires and school records data collection, June 2012,
January 2013, May/June 2013, and May 2014.
Note: The analysis is based on 7th-, 8th-, and 9th-grade homeroom, math, and language teachers during SY 2012–2013 and
SY 2013–2014, as follows: 1,404 teachers for the EWS + computers group, 1,356 for the EWS group, and 1,305 for the
control group.
Differences between SDPP and control group means were tested using two-tailed t-tests. Mean values are adjusted for
baseline characteristics. The analysis accounts for clustering of teachers within schools and school-year and grade fixed
effects. For a tabular presentation of these findings, see Appendix Table H.5.
***/**/* Impact estimate is statistically significant at the .01/.05/.10 level.
+++/++/+ Difference between the EWS group and the EWS + computers group is statistically significant at the .01/.05/.10 level.
The evaluation also examined teachers’ and administrators’ sense of self-efficacy (ability to
respond to factors related to dropout) and sense of responsibility (whether they perceived it was
their role to prevent at-risk students from dropping out). The SDPP Program had a marginally
significant positive impact on teachers’ sense of self-efficacy in the EWS + Computers group and no impact on administrators’ sense of self-efficacy in either group. The program had a
statistically significant positive impact on teachers’ sense of responsibility in both groups,
and also improved administrators’ sense of responsibility in EWS+Computer schools.
6.85*** 6.83***
5.94
0
1
2
3
4
5
6
7
8
Sco
re o
n a
n E
igh
t-P
oin
t S
cale
EWS group EWS+Computers group Control group
Findings from the School Dropout Prevention Pilot Program Impact Evaluation in Cambodia Page xiv
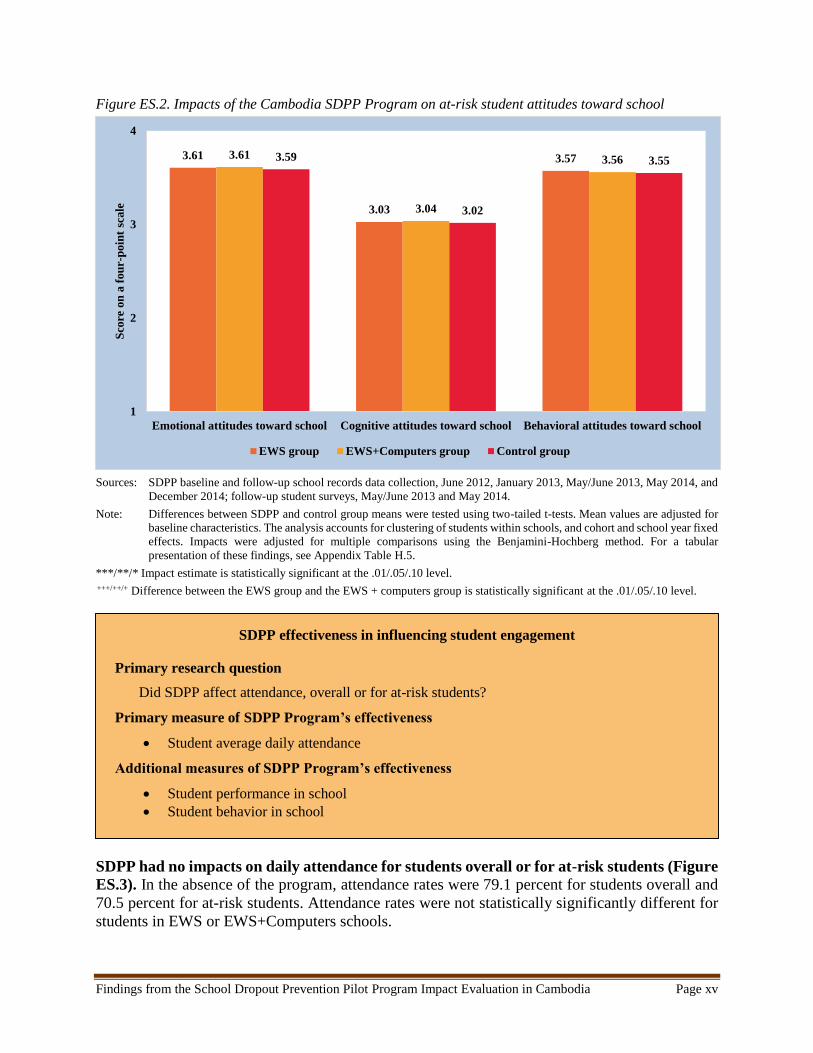
The SDPP Program had no impacts on at-risk students’ emotional, cognitive, or behavioral
attitudes toward school (Figure ES.2), although it did have a positive, statistically significant
impact on students’ perceptions of parental support and a marginal impact on students’
perceptions of teacher support. These measures of student attitudes toward school—which
SDPP captured by surveying students identified as being at risk of school dropout based on
baseline characteristics—could have changed because of changes in teacher or parent attitudes and
practices or due to the intervention activities.7 However, in Cambodia they did not improve for
at-risk students exposed to the SDPP Program.
7 The three measures of student attitudes are constructed from responses to a survey administered to a sample of at-risk students in
each cohort. This survey is explained in further detail in the Technical Appendix – Section A.
SDPP effectiveness in influencing student attitude outcomes
Primary research question
Did SDPP affect at-risk students’ attitudes toward school?
Primary measures of SDPP Program’s effectiveness
Emotional attitudes toward school (e.g., student likes school).
Cognitive attitudes toward school (e.g., student adapts better study habits).
Behavioral attitudes toward school (e.g., student observes school requirements and rules).
Additional measures of SDPP Program’s effectiveness
Students’ perceptions of teacher support
Students’ perceptions of parental support
Findings from the School Dropout Prevention Pilot Program Impact Evaluation in Cambodia Page xv
Figure ES.2. Impacts of the Cambodia SDPP Program on at-risk student attitudes toward school
Sources: SDPP baseline and follow-up school records data collection, June 2012, January 2013, May/June 2013, May 2014, and
December 2014; follow-up student surveys, May/June 2013 and May 2014.
Note: Differences between SDPP and control group means were tested using two-tailed t-tests. Mean values are adjusted for
baseline characteristics. The analysis accounts for clustering of students within schools, and cohort and school year fixed
effects. Impacts were adjusted for multiple comparisons using the Benjamini-Hochberg method. For a tabular
presentation of these findings, see Appendix Table H.5.
***/**/* Impact estimate is statistically significant at the .01/.05/.10 level.
+++/++/+ Difference between the EWS group and the EWS + computers group is statistically significant at the .01/.05/.10 level.
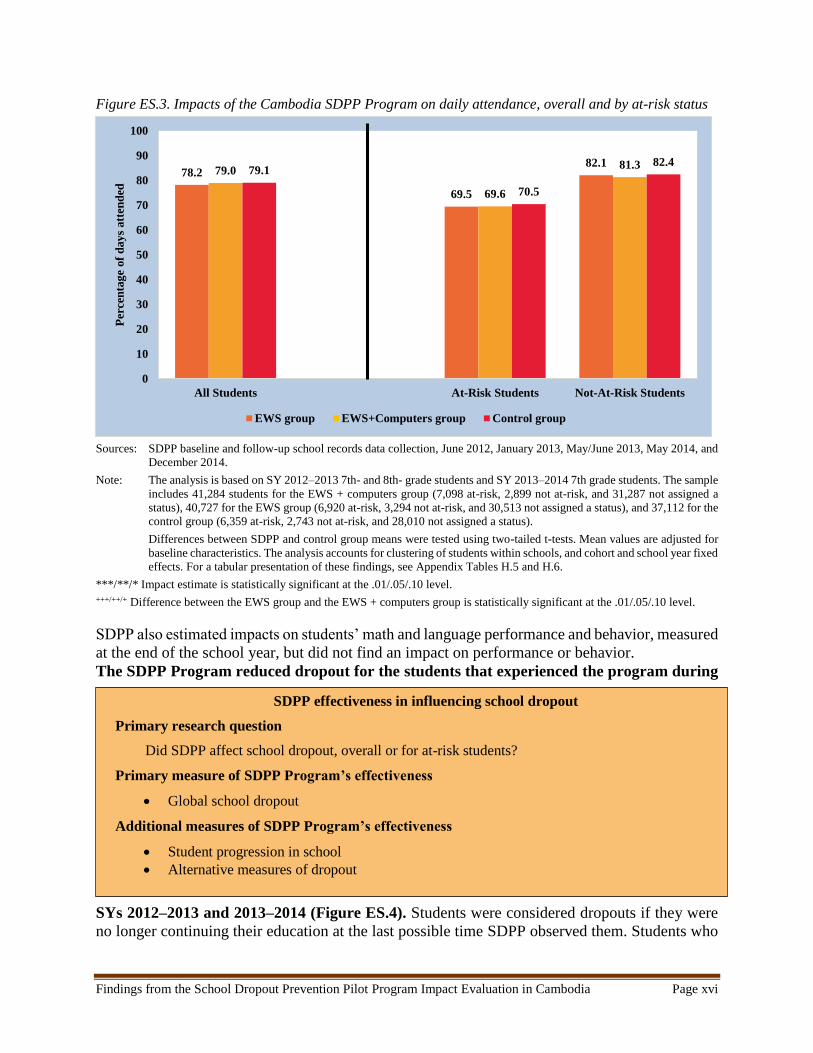
SDPP had no impacts on daily attendance for students overall or for at-risk students (Figure
ES.3). In the absence of the program, attendance rates were 79.1 percent for students overall and
70.5 percent for at-risk students. Attendance rates were not statistically significantly different for
students in EWS or EWS+Computers schools.
3.61
3.03
3.573.61
3.04
3.563.59
3.02
3.55
1
2
3
4
Emotional attitudes toward school Cognitive attitudes toward school Behavioral attitudes toward school
Sco
re o
n a
fou
r-p
oin
t sc
ale
EWS group EWS+Computers group Control group
SDPP effectiveness in influencing student engagement
Primary research question
Did SDPP affect attendance, overall or for at-risk students?
Primary measure of SDPP Program’s effectiveness
Student average daily attendance
Additional measures of SDPP Program’s effectiveness
Student performance in school
Student behavior in school
Findings from the School Dropout Prevention Pilot Program Impact Evaluation in Cambodia Page xvi
Figure ES.3. Impacts of the Cambodia SDPP Program on daily attendance, overall and by at-risk status
Sources: SDPP baseline and follow-up school records data collection, June 2012, January 2013, May/June 2013, May 2014, and
December 2014.
Note: The analysis is based on SY 2012–2013 7th- and 8th- grade students and SY 2013–2014 7th grade students. The sample
includes 41,284 students for the EWS + computers group (7,098 at-risk, 2,899 not at-risk, and 31,287 not assigned a
status), 40,727 for the EWS group (6,920 at-risk, 3,294 not at-risk, and 30,513 not assigned a status), and 37,112 for the
control group (6,359 at-risk, 2,743 not at-risk, and 28,010 not assigned a status).
Differences between SDPP and control group means were tested using two-tailed t-tests. Mean values are adjusted for
baseline characteristics. The analysis accounts for clustering of students within schools, and cohort and school year fixed
effects. For a tabular presentation of these findings, see Appendix Tables H.5 and H.6.
***/**/* Impact estimate is statistically significant at the .01/.05/.10 level.
+++/++/+ Difference between the EWS group and the EWS + computers group is statistically significant at the .01/.05/.10 level.
SDPP also estimated impacts on students’ math and language performance and behavior, measured
at the end of the school year, but did not find an impact on performance or behavior.
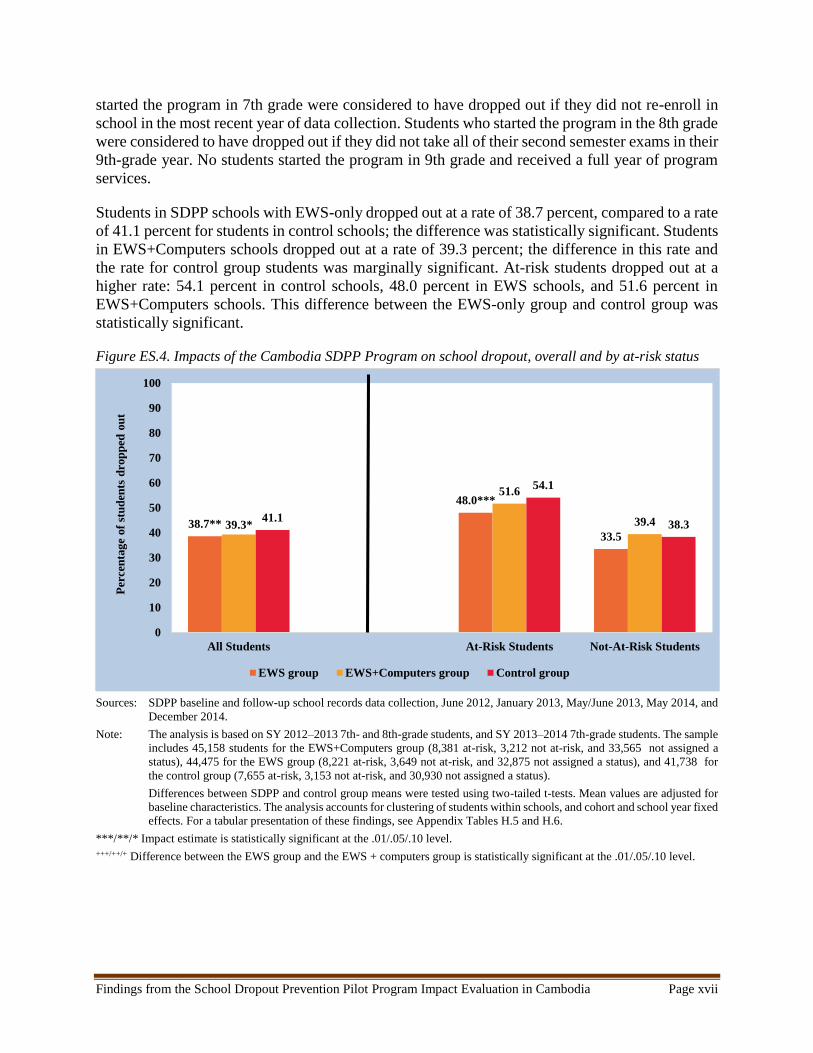
The SDPP Program reduced dropout for the students that experienced the program during
SYs 2012–2013 and 2013–2014 (Figure ES.4). Students were considered dropouts if they were
no longer continuing their education at the last possible time SDPP observed them. Students who
78.2
69.5
82.179.0
69.6
81.379.1
70.5
82.4
0
10
20
30
40
50
60
70
80
90
100
All Students At-Risk Students Not-At-Risk Students
Per
cen
tag
e of
day
s att
end
ed
EWS group EWS+Computers group Control group
SDPP effectiveness in influencing school dropout
Primary research question
Did SDPP affect school dropout, overall or for at-risk students?
Primary measure of SDPP Program’s effectiveness
Global school dropout
Additional measures of SDPP Program’s effectiveness
Student progression in school
Alternative measures of dropout
Findings from the School Dropout Prevention Pilot Program Impact Evaluation in Cambodia Page xvii
started the program in 7th grade were considered to have dropped out if they did not re-enroll in
school in the most recent year of data collection. Students who started the program in the 8th grade
were considered to have dropped out if they did not take all of their second semester exams in their
9th-grade year. No students started the program in 9th grade and received a full year of program
services.
Students in SDPP schools with EWS-only dropped out at a rate of 38.7 percent, compared to a rate
of 41.1 percent for students in control schools; the difference was statistically significant. Students
in EWS+Computers schools dropped out at a rate of 39.3 percent; the difference in this rate and
the rate for control group students was marginally significant. At-risk students dropped out at a
higher rate: 54.1 percent in control schools, 48.0 percent in EWS schools, and 51.6 percent in
EWS+Computers schools. This difference between the EWS-only group and control group was
statistically significant.
Figure ES.4. Impacts of the Cambodia SDPP Program on school dropout, overall and by at-risk status
Sources: SDPP baseline and follow-up school records data collection, June 2012, January 2013, May/June 2013, May 2014, and
December 2014.
Note: The analysis is based on SY 2012–2013 7th- and 8th-grade students, and SY 2013–2014 7th-grade students. The sample
includes 45,158 students for the EWS+Computers group (8,381 at-risk, 3,212 not at-risk, and 33,565 not assigned a
status), 44,475 for the EWS group (8,221 at-risk, 3,649 not at-risk, and 32,875 not assigned a status), and 41,738 for
the control group (7,655 at-risk, 3,153 not at-risk, and 30,930 not assigned a status).
Differences between SDPP and control group means were tested using two-tailed t-tests. Mean values are adjusted for
baseline characteristics. The analysis accounts for clustering of students within schools, and cohort and school year fixed
effects. For a tabular presentation of these findings, see Appendix Tables H.5 and H.6.
***/**/* Impact estimate is statistically significant at the .01/.05/.10 level.
+++/++/+ Difference between the EWS group and the EWS + computers group is statistically significant at the .01/.05/.10 level.
38.7**
48.0***
33.539.3*
51.6
39.441.1
54.1
38.3
0
10
20
30
40
50
60
70
80
90
100
All Students At-Risk Students Not-At-Risk Students
Per
cen
tag
e of
stu
den
ts d
rop
ped
ou
t
EWS group EWS+Computers group Control group
Findings from the School Dropout Prevention Pilot Program Impact Evaluation in Cambodia Page xviii
SDPP also measured grade progression, or whether a student enrolled in the next grade or higher
in the following school year. For example, if a student repeated 9th grade, he/she would not be
considered a between-grade dropout, but he/she would not be considered as having progressed to
the next grade or higher. The SDPP Program had a marginally significant positive impact on
grade progression in EWS+Computers schools in Cambodia.
Discussion
This study shows that the SDPP Program in Cambodia was successful in reducing school dropout,
its ultimate goal in the SDPP’s theory of change for dropout. Among primary outcomes, it
improved teacher dropout prevention practices. It also improved several secondary outcomes. It
did not effect improvements in primary outcomes for student attitudes and behaviors, such as
attendance.
What do beneficiaries say about the SDPP interventions?
Insight into how beneficiaries interacted with the SDPP interventions was obtained through a
qualitative research study. Responses from parents, students, teachers and administrators was very
positive about both the Early Warning System (EWS) and the Computer Labs (CL) program.
EWS: Most of the parents—of both at-risk students and dropouts—claimed they were unaware of their
child’s vulnerable status until they received the initial letter from the school. Parents’ initial reaction to
being contacted by the school was anger and embarrassment, followed by surprise and then happiness
at being apprised of their child’s problems. Nonetheless, students reported their parents became more
supportive following contact. Parents encouraged them to study, pressured them to improve their
attendance, provided study materials, paid for extra classes, and reduced household chores and outside
work. As a result, a majority of at-risk students (88%) said they became aware of the need to change
their own behavior, although less than 42% of those who dropped out felt the same need. Most teachers
(86%) reported the EWS made their job easier and changed their sense of responsibility for supporting
at-risk students. They liked the structured EWS process for tracking students’ attendance and
performance, and saw the value of collecting and using data on attendance and performance for
discussions with parents. Community members thought the contact with the parents was particularly
effective, and school directors noted that once contacted, parents initiated other contact on their own.
Virtually all (97%) homeroom teachers reported they intended to continue using the EWS.
CL: There was overwhelming enthusiasm for Computer Labs (CL) from students, teachers, school
directors and parents. All at-risk students and most dropouts believed computer skills would help them
to obtain employment in the future and helped them in their subject classes They noted the computer
classes were a powerful draw in getting them to attend school more regularly. Parents appreciated that
the classes were free and believed that computer skills enhanced their child’s future job opportunities.
Several confessed they transferred their child to the school to benefit from CL classes. Most of the CL
teachers and all of the school directors reported seeing positive effects of the computer labs: they
suggested that students who used to be absent a lot were attending school more and behaved better.
However, CL teachers complained that there was not enough time or computer stations for
individualized practice, especially for students who needed more time. They also expressed concern
about their own level of computer knowledge and being able to deal with the CL program on their own.
When asked about continuing without the support of SDPP, 96 percent of the teachers hoped they
could.
The ECA program was popular among all the students, although most felt one day per week was
sufficient and denied it improved their attendance on the day it was held. Parents were. They noted
how engaging in games together improved their skills in collaboration and conflict resolution, and that
the sessions helped to improve their language and math skills. Parents generally favored ECA, noting
that it did seem to make their child more positive about school, but they remained ambivalent about its
impact on attendance. Teachers disagreed. They strongly felt the ECA had a positive impact on
improved attendance, behavior and general performance. The teachers also felt they had benefitted from
the ECA training, noting that it helped them to use more interactive and hands-on instructional
techniques in their regular classes. While teacher were concerned that the lack of supplies might hinder
their ability to continue the ECA program, school directors worried whether the teachers were
adequately trained to lead the ECA program on their own, and suggested additional training and guides.
.
Findings from the School Dropout Prevention Pilot Program Impact Evaluation in Cambodia Page xix
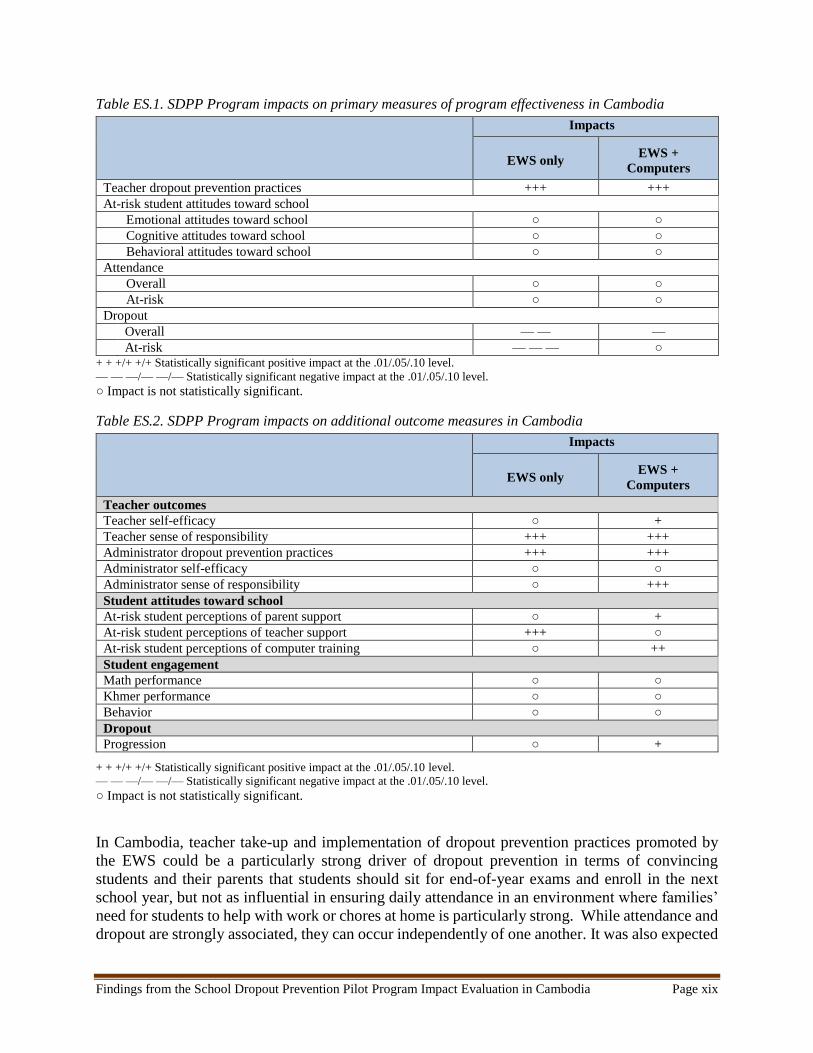
Table ES.1. SDPP Program impacts on primary measures of program effectiveness in Cambodia
Impacts
EWS only EWS +
Computers
Teacher dropout prevention practices +++ +++
At-risk student attitudes toward school
Emotional attitudes toward school ○ ○
Cognitive attitudes toward school ○ ○
Behavioral attitudes toward school ○ ○
Attendance
Overall ○ ○
At-risk ○ ○
Dropout
Overall — — —
At-risk — — — ○ + + +/+ +/+ Statistically significant positive impact at the .01/.05/.10 level.
— — —/— —/— Statistically significant negative impact at the .01/.05/.10 level.
○ Impact is not statistically significant.
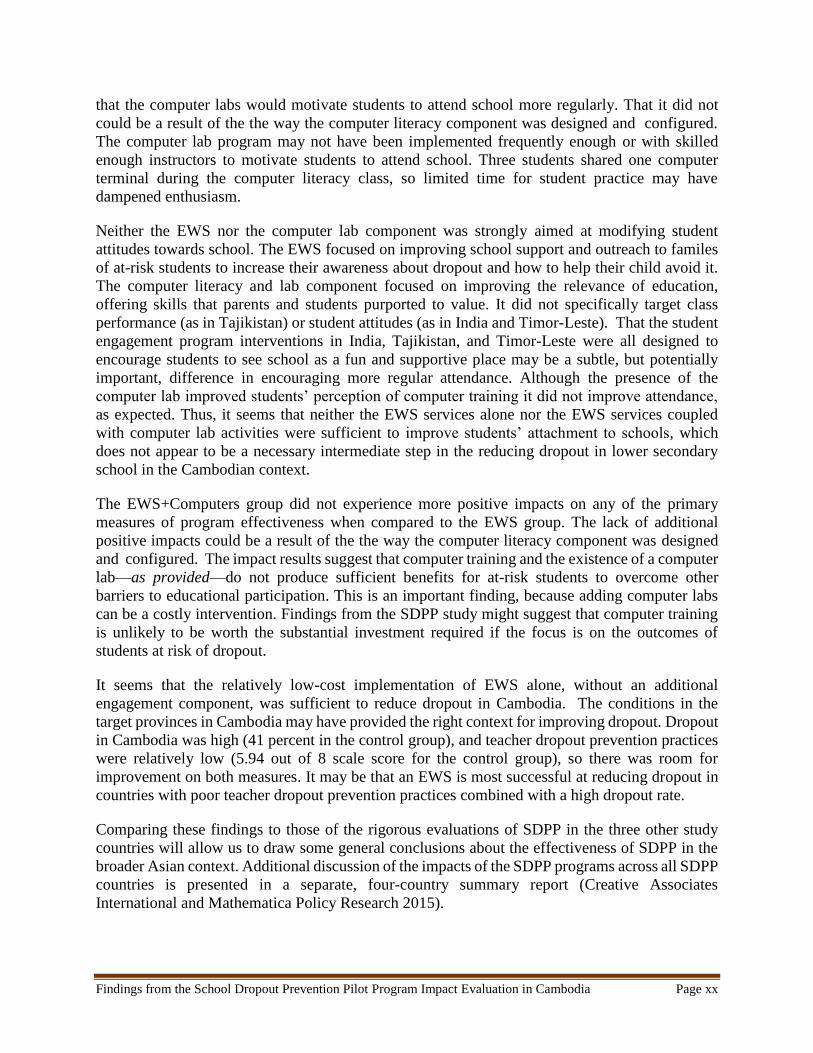
Table ES.2. SDPP Program impacts on additional outcome measures in Cambodia
Impacts
EWS only EWS +
Computers
Teacher outcomes
Teacher self-efficacy ○ +
Teacher sense of responsibility +++ +++
Administrator dropout prevention practices +++ +++
Administrator self-efficacy ○ ○
Administrator sense of responsibility ○ +++
Student attitudes toward school
At-risk student perceptions of parent support ○ +
At-risk student perceptions of teacher support +++ ○
At-risk student perceptions of computer training ○ ++
Student engagement
Math performance ○ ○
Khmer performance ○ ○
Behavior ○ ○
Dropout
Progression ○ +
+ + +/+ +/+ Statistically significant positive impact at the .01/.05/.10 level.
— — —/— —/— Statistically significant negative impact at the .01/.05/.10 level.
○ Impact is not statistically significant.
In Cambodia, teacher take-up and implementation of dropout prevention practices promoted by
the EWS could be a particularly strong driver of dropout prevention in terms of convincing
students and their parents that students should sit for end-of-year exams and enroll in the next
school year, but not as influential in ensuring daily attendance in an environment where families’
need for students to help with work or chores at home is particularly strong. While attendance and
dropout are strongly associated, they can occur independently of one another. It was also expected
Findings from the School Dropout Prevention Pilot Program Impact Evaluation in Cambodia Page xx
that the computer labs would motivate students to attend school more regularly. That it did not
could be a result of the the way the computer literacy component was designed and configured.
The computer lab program may not have been implemented frequently enough or with skilled
enough instructors to motivate students to attend school. Three students shared one computer
terminal during the computer literacy class, so limited time for student practice may have
dampened enthusiasm.
Neither the EWS nor the computer lab component was strongly aimed at modifying student
attitudes towards school. The EWS focused on improving school support and outreach to familes
of at-risk students to increase their awareness about dropout and how to help their child avoid it.
The computer literacy and lab component focused on improving the relevance of education,
offering skills that parents and students purported to value. It did not specifically target class
performance (as in Tajikistan) or student attitudes (as in India and Timor-Leste). That the student
engagement program interventions in India, Tajikistan, and Timor-Leste were all designed to
encourage students to see school as a fun and supportive place may be a subtle, but potentially
important, difference in encouraging more regular attendance. Although the presence of the
computer lab improved students’ perception of computer training it did not improve attendance,
as expected. Thus, it seems that neither the EWS services alone nor the EWS services coupled
with computer lab activities were sufficient to improve students’ attachment to schools, which
does not appear to be a necessary intermediate step in the reducing dropout in lower secondary
school in the Cambodian context.
The EWS+Computers group did not experience more positive impacts on any of the primary
measures of program effectiveness when compared to the EWS group. The lack of additional
positive impacts could be a result of the the way the computer literacy component was designed
and configured. The impact results suggest that computer training and the existence of a computer
lab—as provided—do not produce sufficient benefits for at-risk students to overcome other
barriers to educational participation. This is an important finding, because adding computer labs
can be a costly intervention. Findings from the SDPP study might suggest that computer training
is unlikely to be worth the substantial investment required if the focus is on the outcomes of
students at risk of dropout.
It seems that the relatively low-cost implementation of EWS alone, without an additional
engagement component, was sufficient to reduce dropout in Cambodia. The conditions in the
target provinces in Cambodia may have provided the right context for improving dropout. Dropout
in Cambodia was high (41 percent in the control group), and teacher dropout prevention practices
were relatively low (5.94 out of 8 scale score for the control group), so there was room for
improvement on both measures. It may be that an EWS is most successful at reducing dropout in
countries with poor teacher dropout prevention practices combined with a high dropout rate.
Comparing these findings to those of the rigorous evaluations of SDPP in the three other study
countries will allow us to draw some general conclusions about the effectiveness of SDPP in the
broader Asian context. Additional discussion of the impacts of the SDPP programs across all SDPP
countries is presented in a separate, four-country summary report (Creative Associates
International and Mathematica Policy Research 2015).
Findings from the School Dropout Prevention Pilot Program Impact Evaluation in Cambodia Page 1
I. Introduction
Over the past two decades, considerable progress has been made in increasing school enrollment.
From 2000 to 2011, the number of children not enrolled in school worldwide has declined from
102 million to 57 million—a reduction of almost 45 percent (Millennium Development Goals
Report 2013). This effort has been supported by extensive research evaluating interventions aimed
at increasing access to schooling in developing countries (Petrosino, Anthony, Claire Morgan,
Trevor Fronius, Emily Tanner-Smith, and Robert Boruch 2012). However, many children do not
complete primary or secondary cycles once they enroll; out of the 137 million children worldwide
who entered 1st grade in 2011, 34 million are likely to leave school before reaching the last grade
in primary school (Millennium Development Goals Report 2013). In many countries and regions,
a greater percentage of out-of-school children have dropped out of school than have never enrolled
in school. Interventions have been conducted in the United States and abroad to prevent dropout;
however, there is limited evidence on how well they work, particularly in developing countries.
The School Dropout Prevention Pilot (SDPP) Program, a five-year multicountry program funded
by the U.S. Agency for International Development (USAID), is designed to identify successful
means of decreasing student dropout rates in primary and secondary schools.8 Its objective is to
provide evidence-based programming guidance to USAID missions and countries in Asia and the
Middle East (AME) on student dropout prevention by piloting and testing the effectiveness of
dropout prevention interventions in four countries: Cambodia, India, Tajikistan, and Timor-Leste.
In order to understand ways of mitigating dropout in the four target countries, SDPP used a three-
stage process: (1) undertaking a literature review to identify international best practices in school
dropout prevention; (2) analyzing dropout trends and identifying risk factors and conditions
associated with dropout in each country as part of a situational analysis; and (3) designing,
implementing, and rigorously evaluating interventions to keep students at risk of dropout in school.
Earlier reports describe findings from the first two stages of the project (Brush, Lorie, Jennifer
Shin, Rajani Shrestha, and Karen Tietjen 2011; Creative Associates International 2014a, 2014b;
Shin, Jennifer, Rajani Shrestha, and Karen Tietjen 2011a, 2011b; Shrestha, Rajani, Jennifer Shin,
and Karen Tietjen 2011a, 2011b).
Based on the findings from the literature review and situational analyses, as well as input from key
stakeholders in the four countries, SDPP worked with the Ministry of Education in each country
to identify two interventions to address dropout. In all four countries, SDPP introduced an Early
Warning System (EWS) and a student engagement intervention to motivate students to stay in
school.
Early Warning System (EWS) is a dropout prevention strategy that has shown promise in the
United States, but for which little international evidence exists.9 EWS interventions involve
identifying students at risk of school dropout (“at-risk students”), monitoring the progress of these
8 SDPP is implemented by Creative Associates International, with international partners Mathematica Policy Research and School-
to-School International and local partners Kampuchean Action for Primary Education (KAPE) in Cambodia, Quest Alliance
(QUEST) in India, and Care International (CARE) in Timor-Leste. Creative Associates has a corporate office in Tajikistan, which
covers the responsibilities of a local partner in that country.
9 The SDPP dropout prevention interventions were contractually prohibited from including conditional cash transfers or economic
incentives, which have already been demonstrated to be effective by prior research.
Findings from the School Dropout Prevention Pilot Program Impact Evaluation in Cambodia Page 2
students by using regularly updated school records, and then taking “first-response” actions when
students show signs of struggling. In reviews of dropout prevention research conducted by the
What Works Clearinghouse, U.S. Department of Education, two versions of EWS, the Check &
Connect program and ALAS program, were found to help keep middle and high school students
from dropping out and potentially help them progress in school (American Institutes of Research
2006a, 2006b). However, existing research does not tell us whether EWS would have similar
impacts in developing countries, given the different educational and cultural contexts in these
countries. Similarly, the effectiveness of these types of programs on students of younger ages and
lower grades is not known.
In developing countries, there is evidence that other types of interventions designed to mitigate the
factors that affect dropout, such as cash transfers (in specific contexts), scholarships, and school
construction, can improve enrollment, attendance, and retention (see, for example, Angrist, Joshua,
Eric Bettinger, Erik Bloom, Elizabeth King, and Michael Kremer 2002; Levy, Dan, Matt Sloan,
Leigh Linden, and Harounan Kazianga. 2009; Schultz 2001). Interventions that target specific
groups of students, such as girls (see, for example, Friedman, Willa, Michael Kremer, Edward
Miguel, and Rebecca Thornton 2011; Oster, Emily, and Rebecca Thornton 2011) and students in
rural areas (see, for example, Miguel, Edward, and Michael Kremer 2004) have also proven
successful. However, to our knowledge, the SDPP evaluations present the first rigorous evidence
on the effectiveness of EWS in the developing country context. Studies of interventions that have
incorporated academic activities, such as tutoring, computer labs, and other after-school activities,
have had mixed results, though there is little rigorous evidence from evaluations that focus
specifically on these activities (Banerjee, Abhijit, Shawn Cole, Esther Duflo, and Leigh Linden
2007; Brush, Lorie, Jennifer Shin, Rajani Shrestha, and Karen Tietjen 2011).
The SDPP Program for each of the four countries included an EWS combined with additional
activities in the schools that varied depending on the country.10 The additional activities were
designed to motivate greater student engagement, better attendance, and increase the desire to stay
in school. The interventions were rolled out to the target grades in each country at various times
during 2012.
Although all of the SDPP programs included the EWS, they were distinct enough to merit
independent evaluations in each country. The implementation of the EWS in four diverse countries
allowed experimental evaluation of the effectiveness of these interventions in several contexts with
different populations, strengthening the external validity of our findings.
SDPP conducted rigorous evaluations of the effectiveness of the SDPP Program in each of the four
countries. In each country, schools that were eligible to receive the program were identified,
recruited, and asked to consent to participate in the study. Eligible schools in targeted regions were
then randomly assigned to either a SDPP treatment group, which offered the SDPP intervention
package, or a control group, which did not. For each country, SDPP estimated program effects by
10 The grades targeted in each country are as follows: grades 7, 8, and 9 in Cambodia; grade 5 in India; grade 9 in Tajikistan; and
grades 4, 5, and 6 in Timor-Leste.
Findings from the School Dropout Prevention Pilot Program Impact Evaluation in Cambodia Page 3
comparing the outcomes of students and teachers in SDPP schools with the outcomes of those in
control schools.
This report presents findings from the impact evaluation of the SDPP Program in Cambodia. In
Cambodia, the program included an EWS in all schools, which was combined with computer labs
and computer literacy training in a selected subset of schools. The impact evaluation draws on
school records and survey data collected in 108 EWS+Computers schools, 107 EWS-only schools,
and 107 control schools across six provinces in Cambodia. The student sample consists of 7th, 8th,
and 9th-grade students from each of the two school years (2012–2013 and 2013–2014) during
which the SDPP Program was in effect.
The findings and information on the impact evaluation for SDPP in Cambodia are presented in
two volumes. Volume 1 presents the impact evaluation findings and Volume 2 details the
methodology used.
This report––Volume 1––is organized as follows. Section II describes the SDPP Program and its
implementation in Cambodia. Section III discusses the impact evaluation design and describes the
types of outcome domains used to evaluate the program. Section IV discusses the sample and data
collection Section V describes the characteristics of the sample prior to implementation. Sections
VI presents the impacts of the program on teacher outcomes, attitudes toward school, engagement
in school, and school dropout. Section VII presents school level dropout trends. Section VIII
discusses the findings and conclusions.
Volume 2––a technical appendix––provides more details on the study, including the further detail
on the sample frame, data collection, estimation procedures, subgroup analyses, robustness checks,
and additional exploratory analyses.
Findings from the School Dropout Prevention Pilot Program Impact Evaluation in Cambodia Page 4
II. SDPP Program in Cambodia
The SDPP Program in Cambodia had two main components: (1) an EWS; and (2) computer labs
with computer literacy training. (Creative Associates International 2012a, 2012b). To the extent
possible, these activities built on existing Ministry of Education curriculum and procedures to
facilitate sustainability after the project ended.
A. Targeting grades and geographic areas for intervention
Using data from the national education management information system, SDPP identified the
population for whom dropout was most prevalent and who would benefit most from a dropout
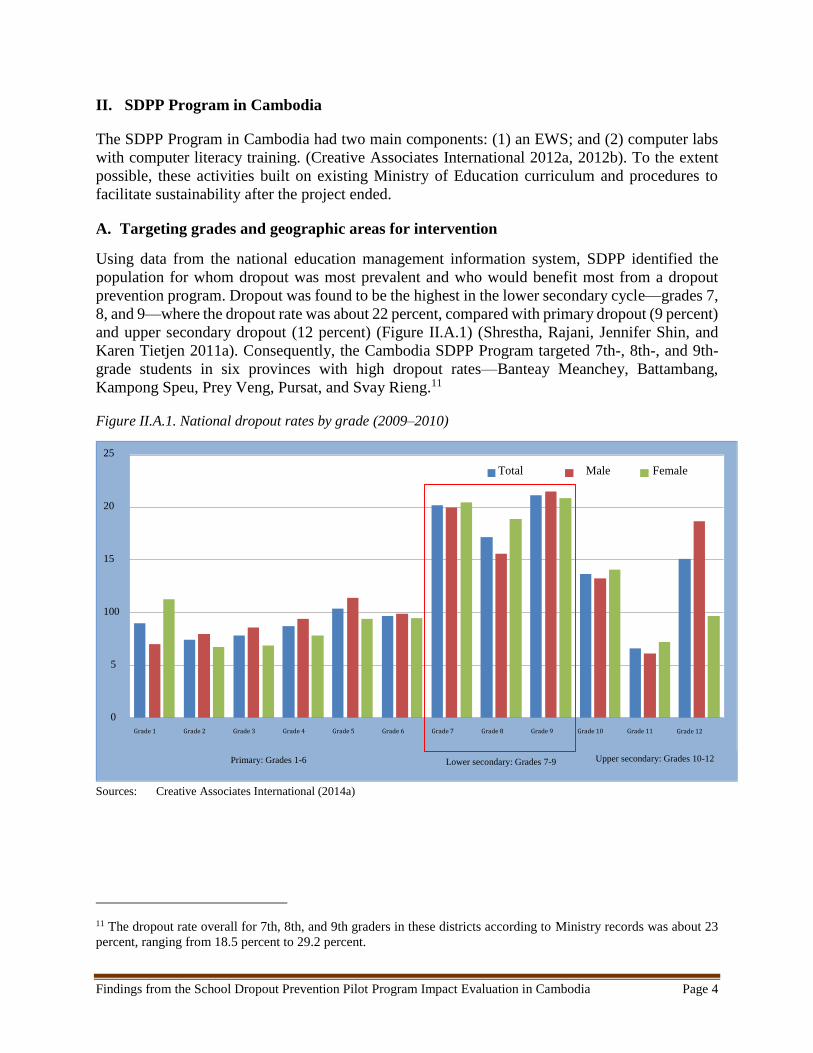
prevention program. Dropout was found to be the highest in the lower secondary cycle—grades 7,
8, and 9—where the dropout rate was about 22 percent, compared with primary dropout (9 percent)
and upper secondary dropout (12 percent) (Figure II.A.1) (Shrestha, Rajani, Jennifer Shin, and
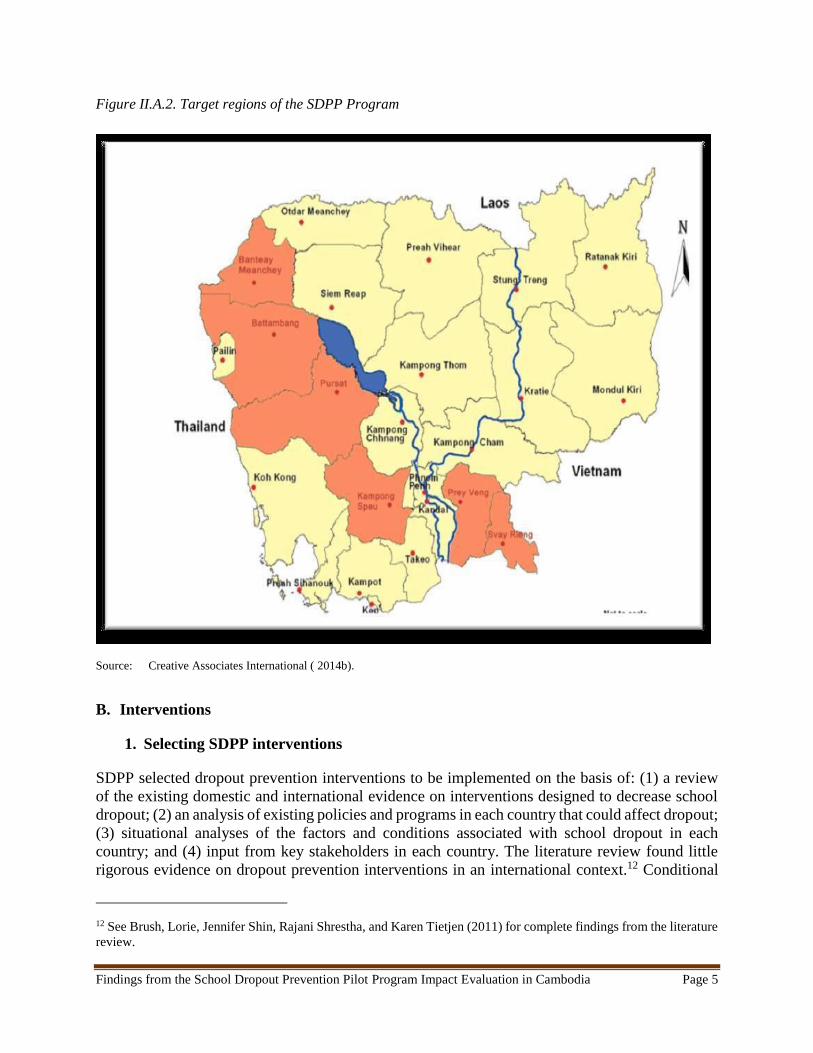
Karen Tietjen 2011a). Consequently, the Cambodia SDPP Program targeted 7th-, 8th-, and 9th-
grade students in six provinces with high dropout rates—Banteay Meanchey, Battambang,
Kampong Speu, Prey Veng, Pursat, and Svay Rieng.11
Figure II.A.1. National dropout rates by grade (2009–2010)
Sources: Creative Associates International (2014a)
11 The dropout rate overall for 7th, 8th, and 9th graders in these districts according to Ministry records was about 23
percent, ranging from 18.5 percent to 29.2 percent.
0
5
100
15
20
25
Grade 1 Grade 2 Grade 3 Grade 4 Grade 5 Grade 6 Grade 7 Grade 8 Grade 9 Grade 10 Grade 11 Grade 12
Total Male Female
Primary: Grades 1-6
Lower secondary: Grades 7-9 Upper secondary: Grades 10-12
Findings from the School Dropout Prevention Pilot Program Impact Evaluation in Cambodia Page 5
Figure II.A.2. Target regions of the SDPP Program
Source: Creative Associates International ( 2014b).
B. Interventions
1. Selecting SDPP interventions
SDPP selected dropout prevention interventions to be implemented on the basis of: (1) a review
of the existing domestic and international evidence on interventions designed to decrease school
dropout; (2) an analysis of existing policies and programs in each country that could affect dropout;
(3) situational analyses of the factors and conditions associated with school dropout in each
country; and (4) input from key stakeholders in each country. The literature review found little
rigorous evidence on dropout prevention interventions in an international context.12 Conditional
12 See Brush, Lorie, Jennifer Shin, Rajani Shrestha, and Karen Tietjen (2011) for complete findings from the literature
review.
Findings from the School Dropout Prevention Pilot Program Impact Evaluation in Cambodia Page 6
cash transfer interventions showed consistently positive impacts on school dropout, but other
evidence was mixed or focused on U.S.-based interventions.
SDPP conducted primary research focused on grades 7-9 in three provinces (Banteay Meanchey,
Battambang, and Pursat) identified in the analysis of dropout rates, in order to identify key factors
and conditions associated with school dropout in Cambodia. 13 The situational analysis collected
data from at-risk students, dropouts, their parents/guardians, school administrators and teachers,
community members and local education officials in 30 school-communities.
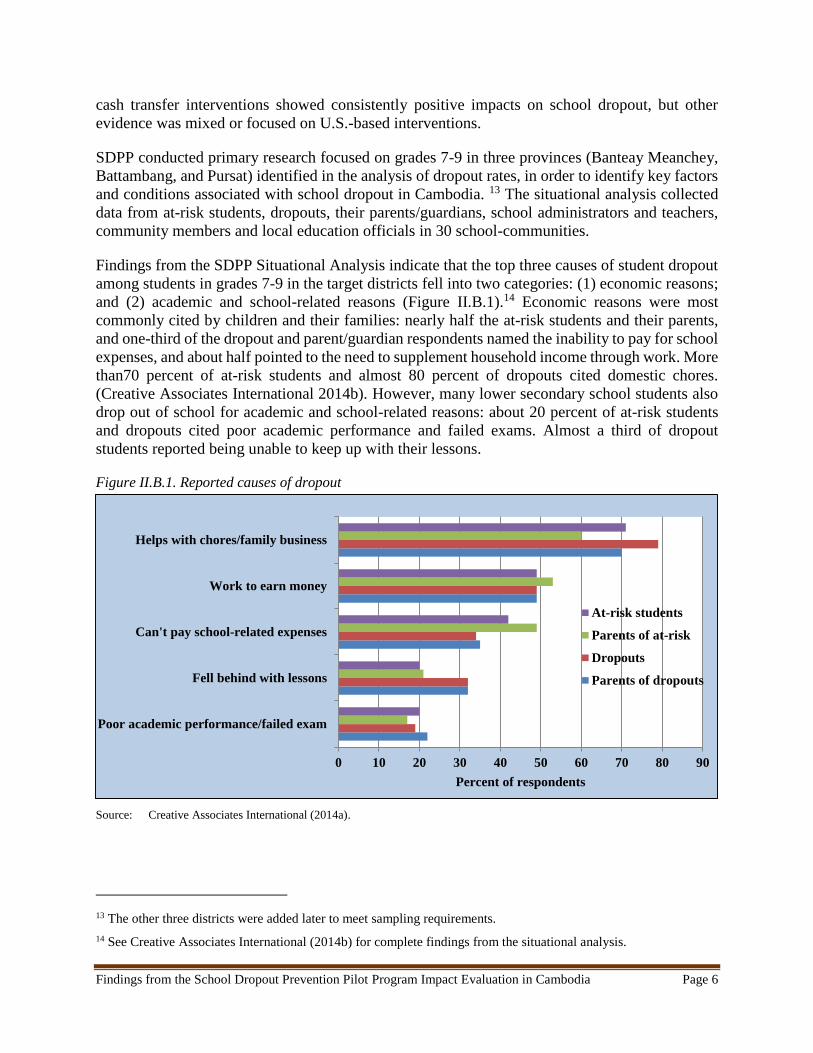
Findings from the SDPP Situational Analysis indicate that the top three causes of student dropout
among students in grades 7-9 in the target districts fell into two categories: (1) economic reasons;
and (2) academic and school-related reasons (Figure II.B.1).14 Economic reasons were most
commonly cited by children and their families: nearly half the at-risk students and their parents,
and one-third of the dropout and parent/guardian respondents named the inability to pay for school
expenses, and about half pointed to the need to supplement household income through work. More
than70 percent of at-risk students and almost 80 percent of dropouts cited domestic chores.
(Creative Associates International 2014b). However, many lower secondary school students also
drop out of school for academic and school-related reasons: about 20 percent of at-risk students
and dropouts cited poor academic performance and failed exams. Almost a third of dropout
students reported being unable to keep up with their lessons.
Figure II.B.1. Reported causes of dropout
Source: Creative Associates International (2014a).
13 The other three districts were added later to meet sampling requirements.
14 See Creative Associates International (2014b) for complete findings from the situational analysis.
0 10 20 30 40 50 60 70 80 90
Poor academic performance/failed exam
Fell behind with lessons
Can't pay school-related expenses
Work to earn money
Helps with chores/family business
Percent of respondents
At-risk students
Parents of at-risk
Dropouts
Parents of dropouts
Findings from the School Dropout Prevention Pilot Program Impact Evaluation in Cambodia Page 7
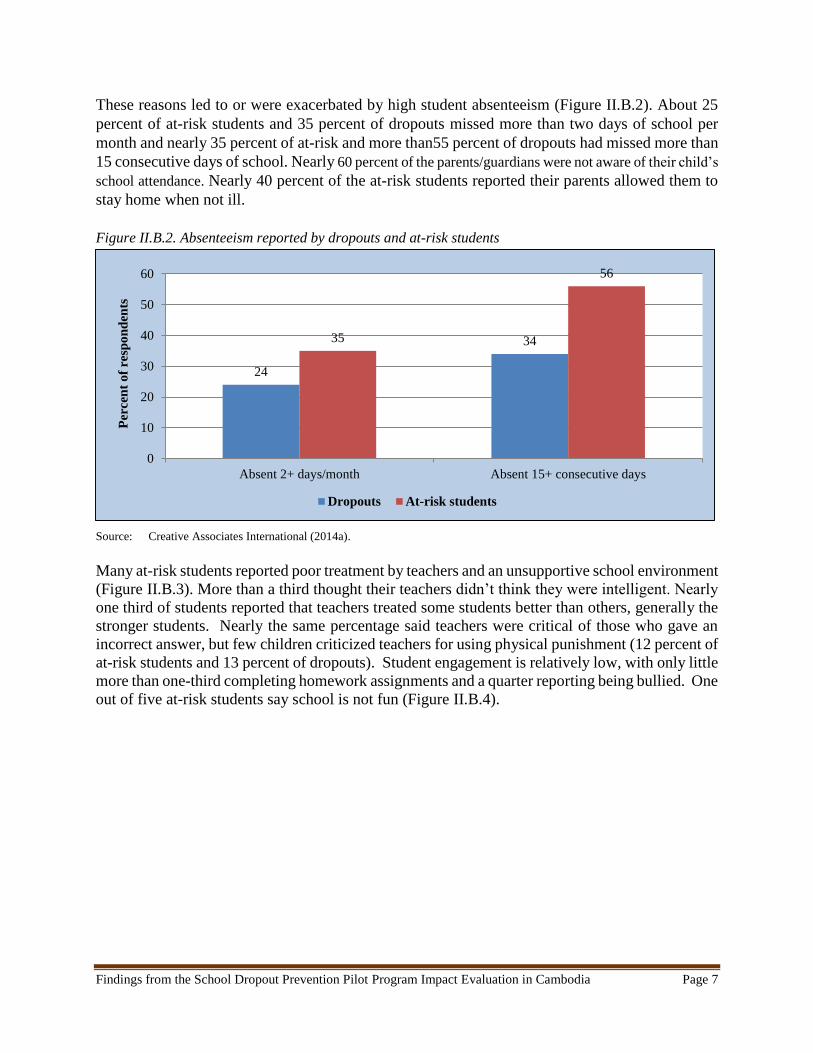
These reasons led to or were exacerbated by high student absenteeism (Figure II.B.2). About 25
percent of at-risk students and 35 percent of dropouts missed more than two days of school per
month and nearly 35 percent of at-risk and more than55 percent of dropouts had missed more than
15 consecutive days of school. Nearly 60 percent of the parents/guardians were not aware of their child’s
school attendance. Nearly 40 percent of the at-risk students reported their parents allowed them to
stay home when not ill.
Figure II.B.2. Absenteeism reported by dropouts and at-risk students
Source: Creative Associates International (2014a).
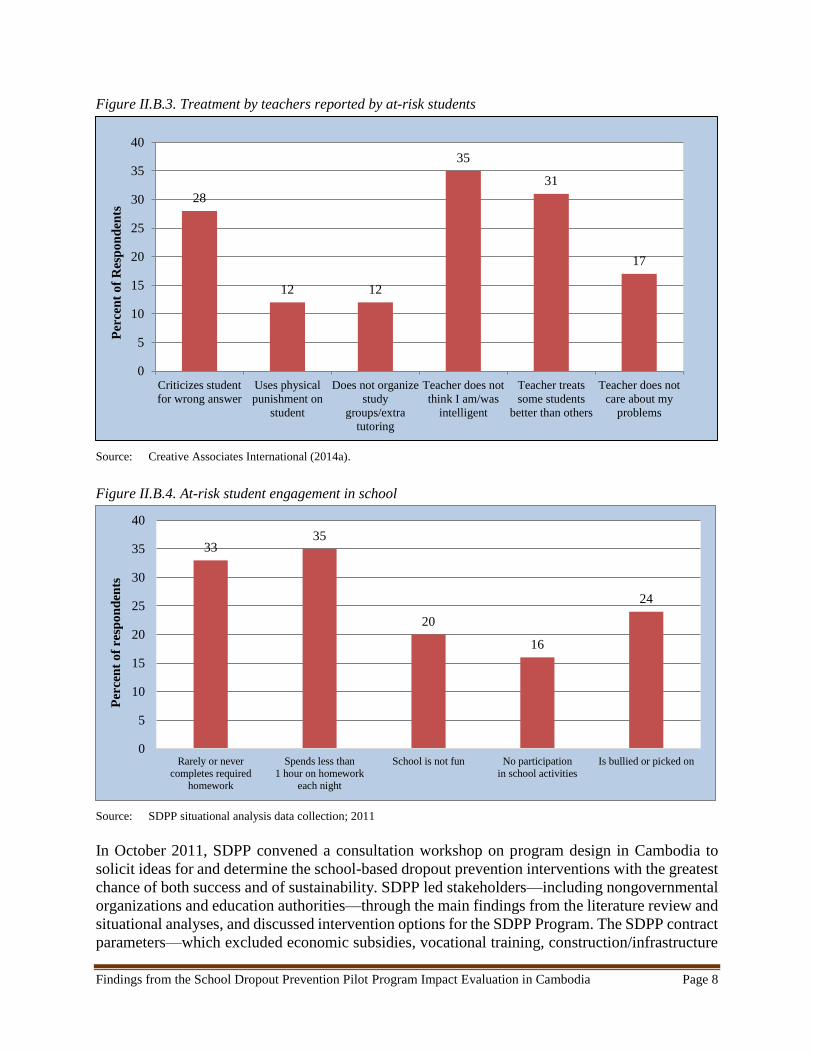
Many at-risk students reported poor treatment by teachers and an unsupportive school environment
(Figure II.B.3). More than a third thought their teachers didn’t think they were intelligent. Nearly
one third of students reported that teachers treated some students better than others, generally the
stronger students. Nearly the same percentage said teachers were critical of those who gave an
incorrect answer, but few children criticized teachers for using physical punishment (12 percent of
at-risk students and 13 percent of dropouts). Student engagement is relatively low, with only little
more than one-third completing homework assignments and a quarter reporting being bullied. One
out of five at-risk students say school is not fun (Figure II.B.4).
24
3435
56
0
10
20
30
40
50
60
Absent 2+ days/month Absent 15+ consecutive days
Per
cen
t o
f re
spo
nd
ents
Dropouts At-risk students
Findings from the School Dropout Prevention Pilot Program Impact Evaluation in Cambodia Page 8
Figure II.B.3. Treatment by teachers reported by at-risk students
Source: Creative Associates International (2014a).
Figure II.B.4. At-risk student engagement in school
Source: SDPP situational analysis data collection; 2011
In October 2011, SDPP convened a consultation workshop on program design in Cambodia to
solicit ideas for and determine the school-based dropout prevention interventions with the greatest
chance of both success and of sustainability. SDPP led stakeholders—including nongovernmental
organizations and education authorities—through the main findings from the literature review and
situational analyses, and discussed intervention options for the SDPP Program. The SDPP contract
parameters—which excluded economic subsidies, vocational training, construction/infrastructure
28
12 12
35
31
17
0
5
10
15
20
25
30
35
40
Criticizes student
for wrong answer
Uses physical
punishment on
student
Does not organize
study
groups/extra
tutoring
Teacher does not
think I am/was
intelligent
Teacher treats
some students
better than others
Teacher does not
care about my
problems
Per
cen
t o
f R
esp
on
den
ts
3335
20
16
24
0
5
10
15
20
25
30
35
40
Rarely or never
completes required
homework
Spends less than
1 hour on homework
each night
School is not fun No participation
in school activities
Is bullied or picked on
Per
cen
t o
f re
spo
nd
ents
Findings from the School Dropout Prevention Pilot Program Impact Evaluation in Cambodia Page 9
improvements and general teacher training—were reviewed.15 Design workshop participants
ranked a set of intervention options. SDPP then selected the interventions for Cambodia using
these rankings along with additional program considerations. Two complementary inventions were
planned, based on power calculations, sample size parameters and timeline.16
One of the complementary interventions was aimed at reducing negative student behaviors
associated with dropout, such as attendance, and the other aimed at student motivation, based on
the findings of the situational analysis, which found that students and their parents did not perceive
schooling as useful or providing the skills needed in the job market. Stakeholders in Cambodia
selected EWS as the primary program component and computer labs with computer literacy
instruction as a second intervention.17
2. Early warning system
The purpose of the EWS was to identify and provide targeted support to students at risk of dropping
out of school. The EWS used existing data in schools as well as teacher input to identify at-risk
students, closely monitor them, and target them for additional support. It was intended to enhance
the capacity of schools to address the needs of at-risk pupils, strengthen the partnership between
the parents/guardians and school personnel to monitor and improve school attendance and
performance, and raise awareness among parents/guardians and the community about the value of
children staying in school and what parents/guardians can do to support their children. The EWS
consisted of three components: (1) identification of students at risk of school dropout; (2) first
response strategies; and (3) community engagement.
In Component 1, the SDPP Program in Cambodia worked with teachers to identify at-risk students
based on six measures of dropout risk. These included the globally recognized ABCs of dropout –
attendance, behavior, and coursework—and were augmented with other contextually specific
indicators—overage and distance to school (Associates International 2014b). SDPP worked with
teachers to score and rank students’ relative risk level. Students with the highest score were deemed
at-risk students.18
Component 2 used a “track and trigger” approach to closely monitor the progress of at-risk students
and initiate “first response” activities when students showed signs of struggling. Teachers recorded
15 While USAID’s AME Regional Bureau recognized the role that economic, infrastructure/construction, and school
quality barriers could play in families’ decisions not to send their children to school, these types of interventions were
excluded from experimentation for a variety of reasons. A solid research base already existed for economic subsidies
and cost alleviation measures. Infrastructure improvements and construction exceeded USAID manageable interests.
Desire to focus on dropout-specific interventions eliminated general teacher training for instructional improvement,
which was already funded under other programs. Finally, funding for USAID Basic Education prohibited expenditure
of SDPP budget on vocational education activities.
16 The SDPP contract specified two recommendations for interventions. SDPP was originally a three-year program,
and did not provide sufficient time to design, develop, and implement multiple interventions in each country.
17 See Shrestha, R. and K. Tietjen, SDPP Pilot Design Plan: Cambodia (February 2012).
18 Please see Appendix A for more details on the SDPP determination of dropout risk.
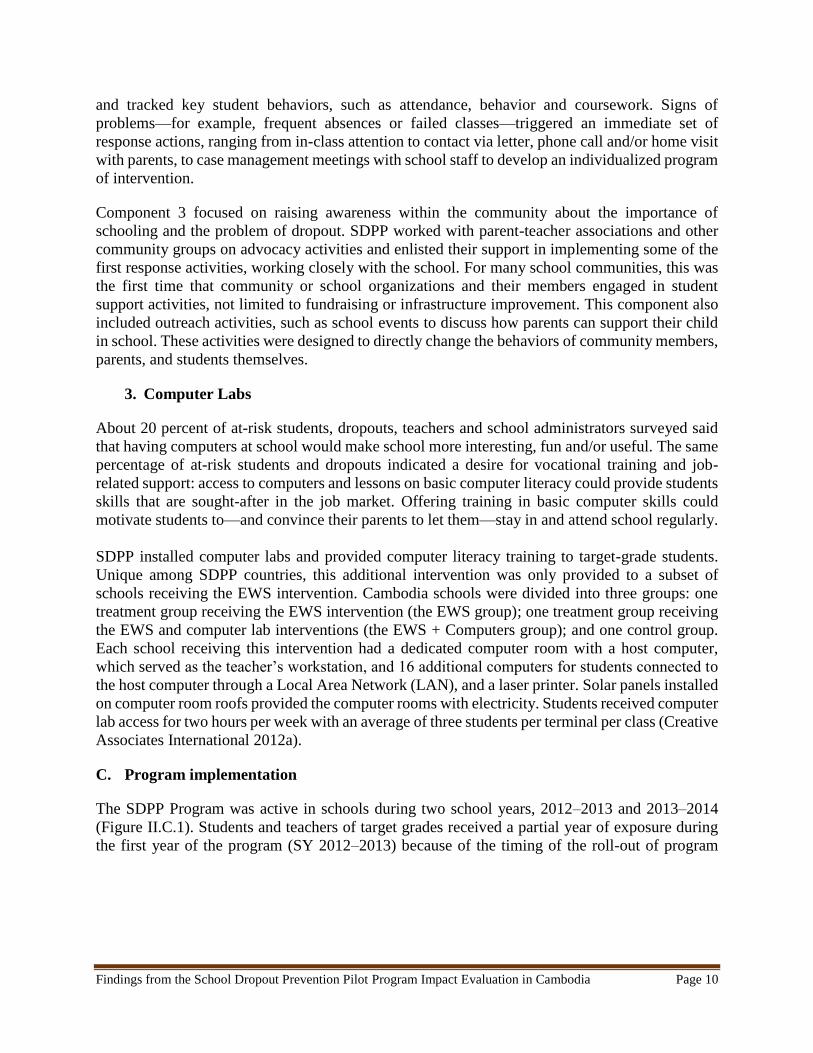
Findings from the School Dropout Prevention Pilot Program Impact Evaluation in Cambodia Page 10
and tracked key student behaviors, such as attendance, behavior and coursework. Signs of
problems—for example, frequent absences or failed classes—triggered an immediate set of
response actions, ranging from in-class attention to contact via letter, phone call and/or home visit
with parents, to case management meetings with school staff to develop an individualized program
of intervention.
Component 3 focused on raising awareness within the community about the importance of
schooling and the problem of dropout. SDPP worked with parent-teacher associations and other
community groups on advocacy activities and enlisted their support in implementing some of the
first response activities, working closely with the school. For many school communities, this was
the first time that community or school organizations and their members engaged in student
support activities, not limited to fundraising or infrastructure improvement. This component also
included outreach activities, such as school events to discuss how parents can support their child
in school. These activities were designed to directly change the behaviors of community members,
parents, and students themselves.
3. Computer Labs
About 20 percent of at-risk students, dropouts, teachers and school administrators surveyed said
that having computers at school would make school more interesting, fun and/or useful. The same
percentage of at-risk students and dropouts indicated a desire for vocational training and job-
related support: access to computers and lessons on basic computer literacy could provide students
skills that are sought-after in the job market. Offering training in basic computer skills could
motivate students to—and convince their parents to let them—stay in and attend school regularly.
SDPP installed computer labs and provided computer literacy training to target-grade students.
Unique among SDPP countries, this additional intervention was only provided to a subset of
schools receiving the EWS intervention. Cambodia schools were divided into three groups: one
treatment group receiving the EWS intervention (the EWS group); one treatment group receiving
the EWS and computer lab interventions (the EWS + Computers group); and one control group.
Each school receiving this intervention had a dedicated computer room with a host computer,
which served as the teacher’s workstation, and 16 additional computers for students connected to
the host computer through a Local Area Network (LAN), and a laser printer. Solar panels installed
on computer room roofs provided the computer rooms with electricity. Students received computer
lab access for two hours per week with an average of three students per terminal per class (Creative
Associates International 2012a).
C. Program implementation
The SDPP Program was active in schools during two school years, 2012–2013 and 2013–2014
(Figure II.C.1). Students and teachers of target grades received a partial year of exposure during
the first year of the program (SY 2012–2013) because of the timing of the roll-out of program
Findings from the School Dropout Prevention Pilot Program Impact Evaluation in Cambodia Page 11
activities. Students and teachers of the target grades during the second school year received the
program for at least one full school year (SY 2013–2014).19
19 The teachers and school administrators were first trained in August and September of 2012, before the beginning of SY 2012–
2013 in October. Another training occurred in October 2013 at the beginning of SY 2013–2014. The computer labs were installed
prior to SY 2012–2013, and the computer literacy classes began in October 2012. Because of delays in the identification of at-risk
students, the EWS did not begin until January 2013 for 7th-, 8th-, and 9th-grade students in SY 2012–2013. For new 7th-graders
and returning 8th and 9th-graders in SY 2013–2014, both the EWS and computer lab sessions began in October 2013.
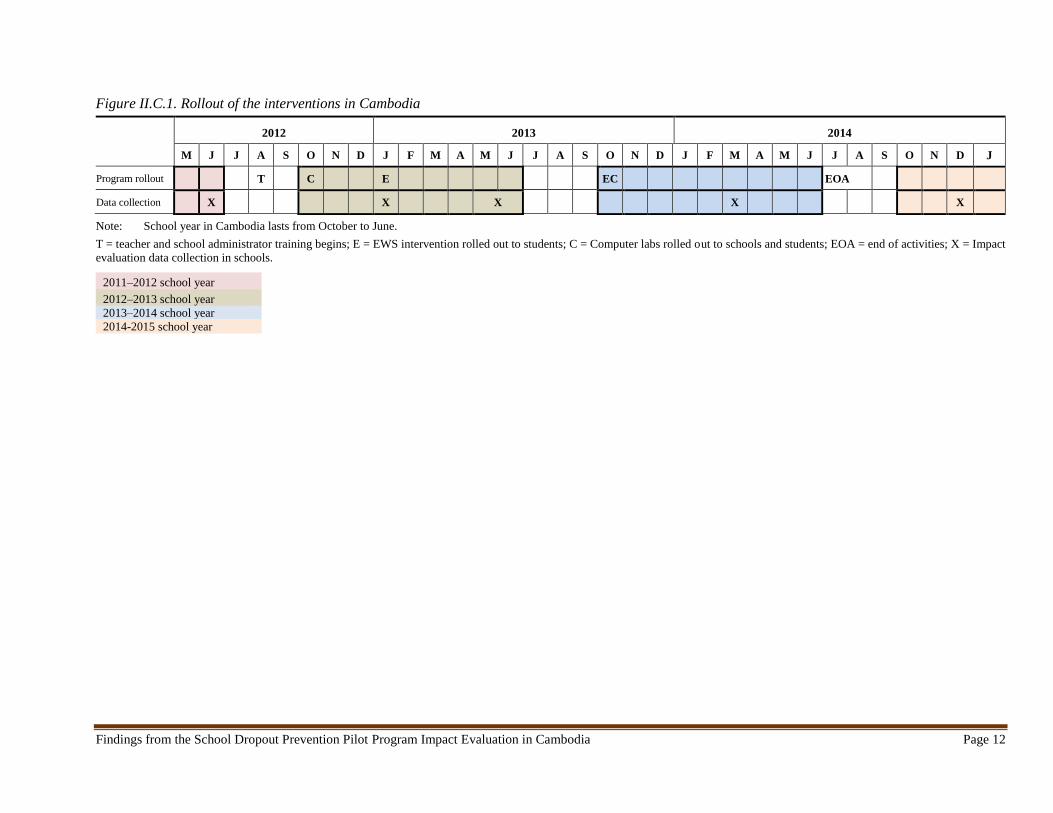
Findings from the School Dropout Prevention Pilot Program Impact Evaluation in Cambodia Page 12
Figure II.C.1. Rollout of the interventions in Cambodia
2012 2013 2014
M J J A S O N D J F M A M J J A S O N D J F M A M J J A S O N D J
Program rollout T C E EC EOA
Data collection X X X X X
Note: School year in Cambodia lasts from October to June.
T = teacher and school administrator training begins; E = EWS intervention rolled out to students; C = Computer labs rolled out to schools and students; EOA = end of activities; X = Impact
evaluation data collection in schools.
2011–2012 school year
2012–2013 school year
2013–2014 school year
2014-2015 school year
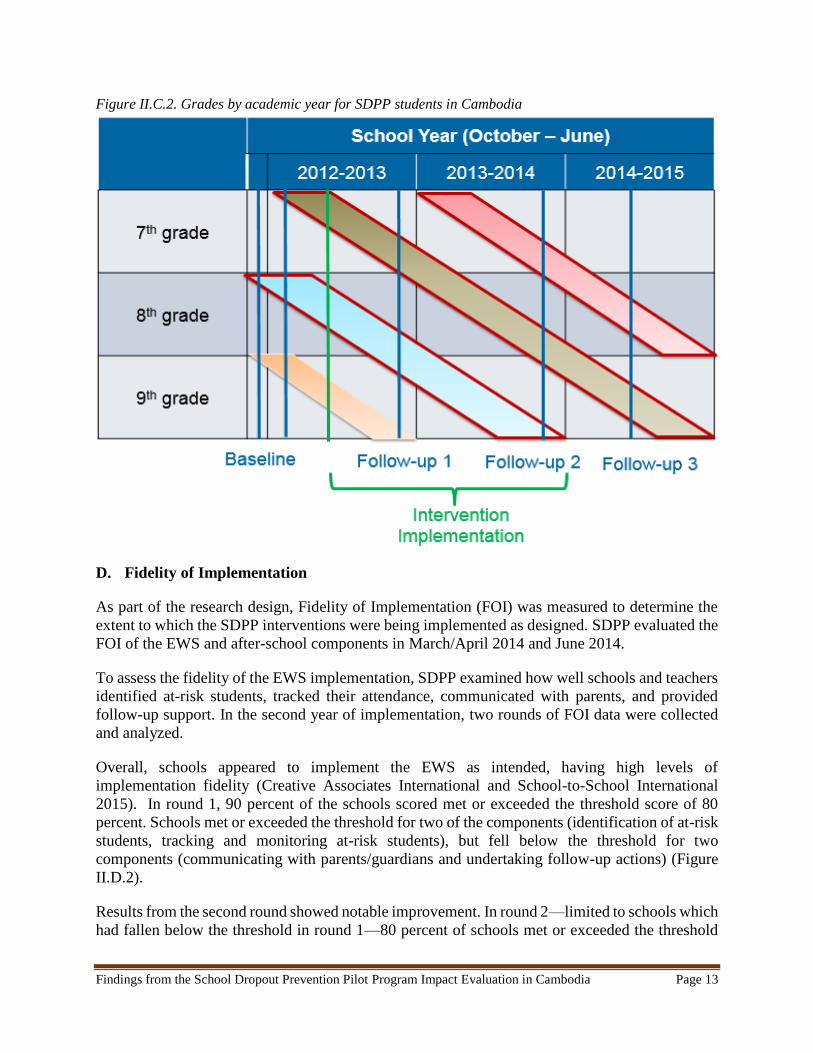
Findings from the School Dropout Prevention Pilot Program Impact Evaluation in Cambodia Page 13
Figure II.C.2. Grades by academic year for SDPP students in Cambodia
D. Fidelity of Implementation
As part of the research design, Fidelity of Implementation (FOI) was measured to determine the
extent to which the SDPP interventions were being implemented as designed. SDPP evaluated the
FOI of the EWS and after-school components in March/April 2014 and June 2014.
To assess the fidelity of the EWS implementation, SDPP examined how well schools and teachers
identified at-risk students, tracked their attendance, communicated with parents, and provided
follow-up support. In the second year of implementation, two rounds of FOI data were collected
and analyzed.
Overall, schools appeared to implement the EWS as intended, having high levels of
implementation fidelity (Creative Associates International and School-to-School International
2015). In round 1, 90 percent of the schools scored met or exceeded the threshold score of 80
percent. Schools met or exceeded the threshold for two of the components (identification of at-risk
students, tracking and monitoring at-risk students), but fell below the threshold for two
components (communicating with parents/guardians and undertaking follow-up actions) (Figure
II.D.2).
Results from the second round showed notable improvement. In round 2—limited to schools which
had fallen below the threshold in round 1—80 percent of schools met or exceeded the threshold
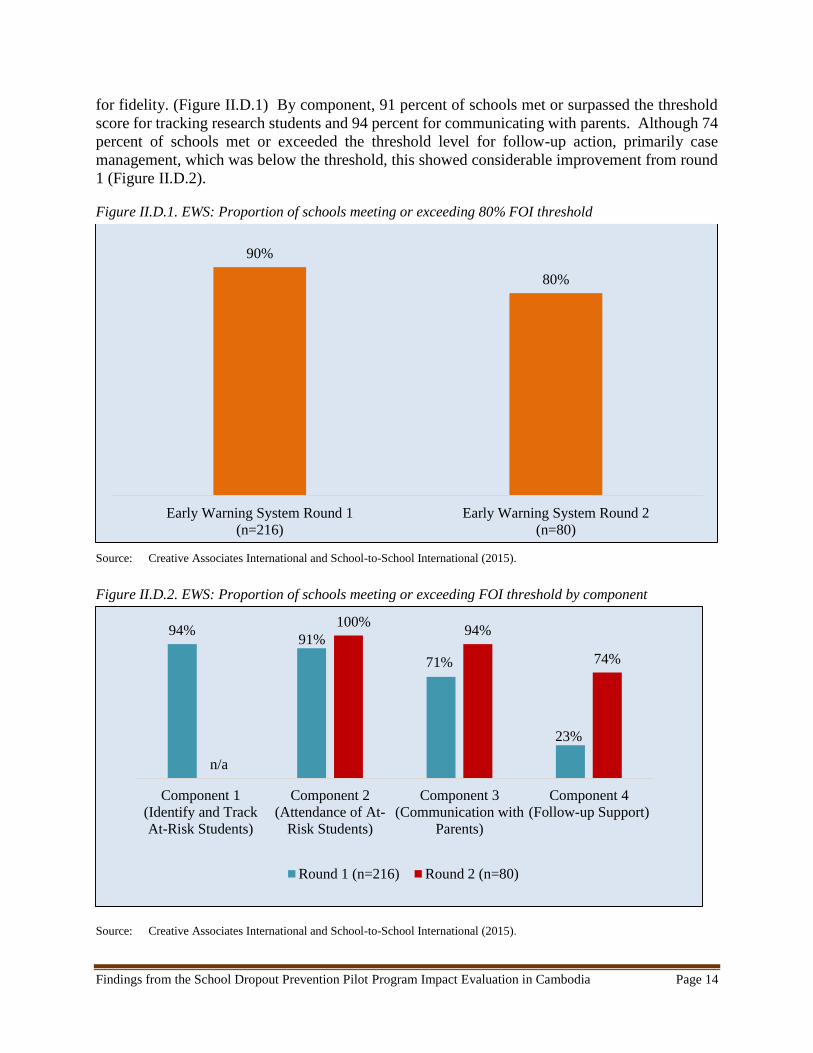
Findings from the School Dropout Prevention Pilot Program Impact Evaluation in Cambodia Page 14
for fidelity. (Figure II.D.1) By component, 91 percent of schools met or surpassed the threshold
score for tracking research students and 94 percent for communicating with parents. Although 74
percent of schools met or exceeded the threshold level for follow-up action, primarily case
management, which was below the threshold, this showed considerable improvement from round
1 (Figure II.D.2).
Figure II.D.1. EWS: Proportion of schools meeting or exceeding 80% FOI threshold
Source: Creative Associates International and School-to-School International (2015).
Figure II.D.2. EWS: Proportion of schools meeting or exceeding FOI threshold by component
Source: Creative Associates International and School-to-School International (2015).
90%
80%
Early Warning System Round 1
(n=216)
Early Warning System Round 2
(n=80)
94%91%
71%
23%
n/a
100%94%
74%
Component 1
(Identify and Track
At-Risk Students)
Component 2
(Attendance of At-
Risk Students)
Component 3
(Communication with
Parents)
Component 4
(Follow-up Support)
Round 1 (n=216) Round 2 (n=80)
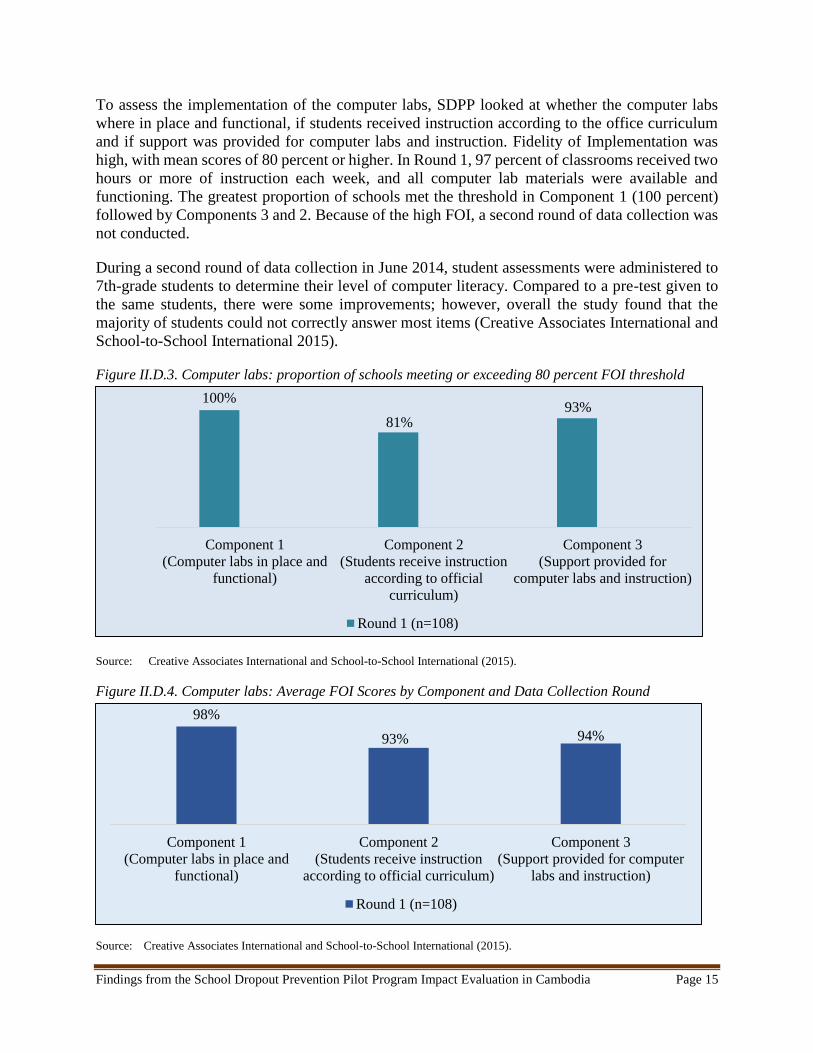
Findings from the School Dropout Prevention Pilot Program Impact Evaluation in Cambodia Page 15
To assess the implementation of the computer labs, SDPP looked at whether the computer labs
where in place and functional, if students received instruction according to the office curriculum
and if support was provided for computer labs and instruction. Fidelity of Implementation was
high, with mean scores of 80 percent or higher. In Round 1, 97 percent of classrooms received two
hours or more of instruction each week, and all computer lab materials were available and
functioning. The greatest proportion of schools met the threshold in Component 1 (100 percent)
followed by Components 3 and 2. Because of the high FOI, a second round of data collection was
not conducted.
During a second round of data collection in June 2014, student assessments were administered to
7th-grade students to determine their level of computer literacy. Compared to a pre-test given to
the same students, there were some improvements; however, overall the study found that the
majority of students could not correctly answer most items (Creative Associates International and
School-to-School International 2015).
Figure II.D.3. Computer labs: proportion of schools meeting or exceeding 80 percent FOI threshold
Source: Creative Associates International and School-to-School International (2015).
Figure II.D.4. Computer labs: Average FOI Scores by Component and Data Collection Round
Source: Creative Associates International and School-to-School International (2015).
100%
81%93%
Component 1
(Computer labs in place and
functional)
Component 2
(Students receive instruction
according to official
curriculum)
Component 3
(Support provided for
computer labs and instruction)
Round 1 (n=108)
98%
93% 94%
Component 1
(Computer labs in place and
functional)
Component 2
(Students receive instruction
according to official curriculum)
Component 3
(Support provided for computer
labs and instruction)
Round 1 (n=108)
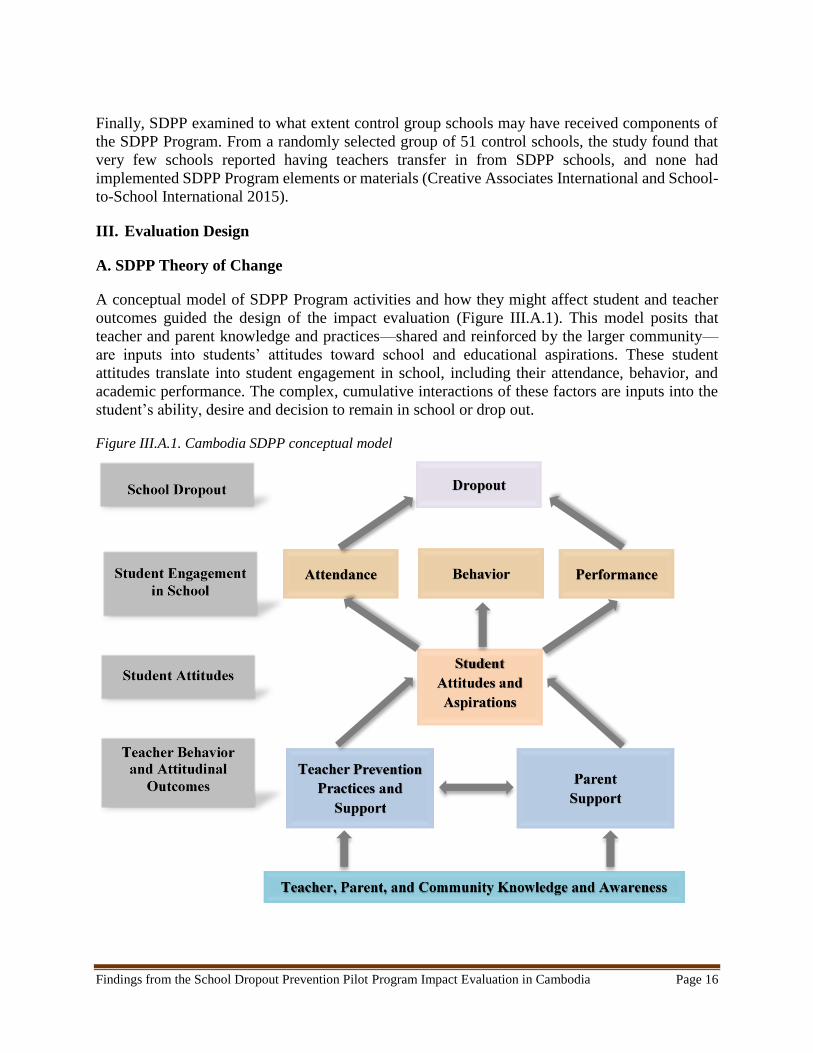
Findings from the School Dropout Prevention Pilot Program Impact Evaluation in Cambodia Page 16
Finally, SDPP examined to what extent control group schools may have received components of
the SDPP Program. From a randomly selected group of 51 control schools, the study found that
very few schools reported having teachers transfer in from SDPP schools, and none had
implemented SDPP Program elements or materials (Creative Associates International and School-
to-School International 2015).
III. Evaluation Design
A. SDPP Theory of Change
A conceptual model of SDPP Program activities and how they might affect student and teacher
outcomes guided the design of the impact evaluation (Figure III.A.1). This model posits that
teacher and parent knowledge and practices—shared and reinforced by the larger community—
are inputs into students’ attitudes toward school and educational aspirations. These student
attitudes translate into student engagement in school, including their attendance, behavior, and
academic performance. The complex, cumulative interactions of these factors are inputs into the
student’s ability, desire and decision to remain in school or drop out.
Figure III.A.1. Cambodia SDPP conceptual model
Findings from the School Dropout Prevention Pilot Program Impact Evaluation in Cambodia Page 17
The ultimate goal of these activities is to reduce school dropout, and SDPP activities involved
working directly with teachers, administrators, and parents with this goal in mind. Teachers
received extensive training to influence their attitudes toward and practices used with at-risk
students, as well as instruction on how to use a new EWS. The EWS was designed to improve
student attendance and attitudes toward school, both directly (through interactions with students)
and indirectly (through interactions with teachers and parents). The idea behind this system is that,
by changing teacher, administrator, and parent knowledge and behaviors toward students, student
attitudes toward school should change. This improvement in attitudes should lead to more student
engagement in and attachment to school, which in turn should reduce school dropout. Likewise,
the computer lab activities were designed to improve student attitudes toward school and
encourage attendance by teaching students computer literacy skills.
Recognizing the complex processes that lead to dropping out, mechanisms through which the
SDPP interventions aim to reduce dropout are varied and focused on influencing intermediate
outcomes—specifically the attitudes, practices, and behaviors of teachers, parents, and
students—that that may be related to dropout.
B. Research Questions
Based on this conceptual model, SDPP designed the impact evaluation to address five primary
research questions: 20
1. Does SDPP improve teacher behavior and attitudes?
2. Does SDPP improve student attitudes toward school?
3. Does SDPP improve student engagement in school associated with retention, such as
attendance?
4. Does SDPP improve the dropout rate?
5. What are SDPP’s impacts for students most at risk of dropping out of school?
C. Evaluation Design
To answer these questions, SDPP used a randomized controlled trial design, as depicted in Figure
III.C.1. SDPP randomly assigned schools to either an SDPP EWS-only group that provided the
SDPP EWS program, an SDPP EWS+Computers group that provided the SDPP EWS program
and the CL program, or a control group that operated as usual by comparing relevant outcomes for
students, teachers, and administrators in schools with the SDPP program (the EWS-only group and
the EWS+Computers group) to the outcomes of students and teachers in schools randomly
assigned to the control group.
20 See Murray, Nancy, Quinn Moore, Larissa Campuzano, Kathy Buek, Emilie Bagby, and Mark Strayer 2012 for details on the evaluation design.
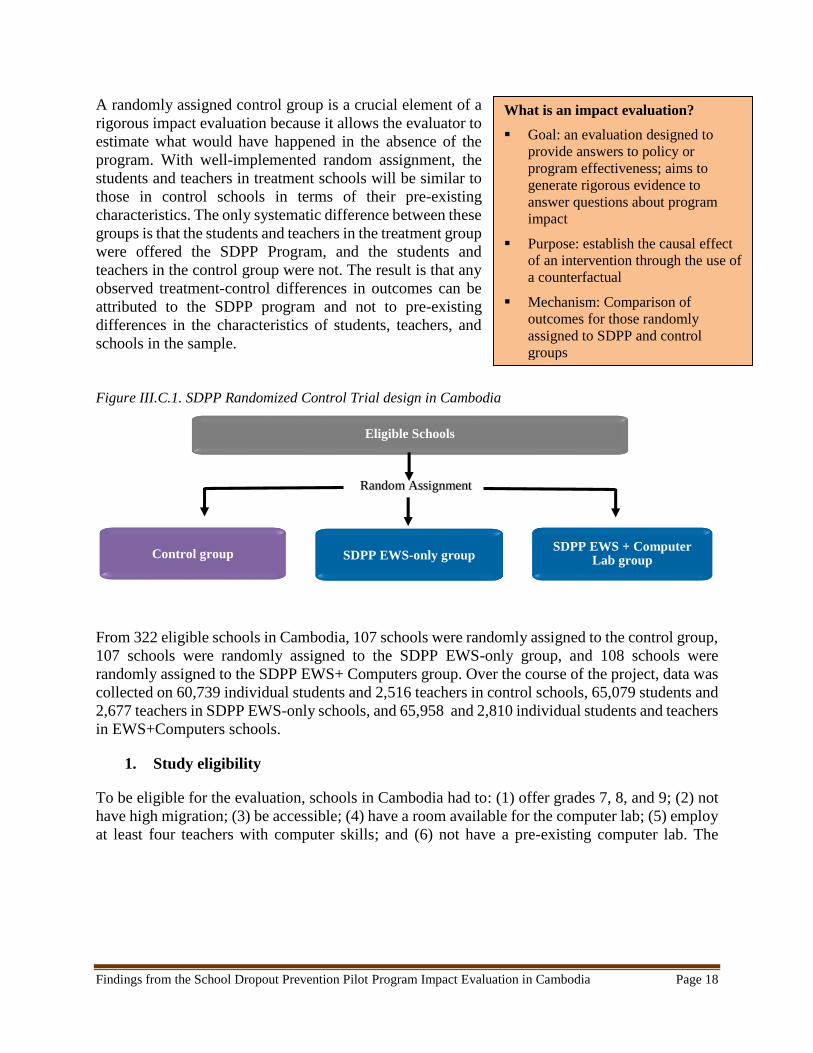
Findings from the School Dropout Prevention Pilot Program Impact Evaluation in Cambodia Page 18
A randomly assigned control group is a crucial element of a
rigorous impact evaluation because it allows the evaluator to
estimate what would have happened in the absence of the
program. With well-implemented random assignment, the
students and teachers in treatment schools will be similar to
those in control schools in terms of their pre-existing
characteristics. The only systematic difference between these
groups is that the students and teachers in the treatment group
were offered the SDPP Program, and the students and
teachers in the control group were not. The result is that any
observed treatment-control differences in outcomes can be
attributed to the SDPP program and not to pre-existing
differences in the characteristics of students, teachers, and
schools in the sample.
Figure III.C.1. SDPP Randomized Control Trial design in Cambodia
From 322 eligible schools in Cambodia, 107 schools were randomly assigned to the control group,
107 schools were randomly assigned to the SDPP EWS-only group, and 108 schools were
randomly assigned to the SDPP EWS+ Computers group. Over the course of the project, data was
collected on 60,739 individual students and 2,516 teachers in control schools, 65,079 students and
2,677 teachers in SDPP EWS-only schools, and 65,958 and 2,810 individual students and teachers
in EWS+Computers schools.
1. Study eligibility
To be eligible for the evaluation, schools in Cambodia had to: (1) offer grades 7, 8, and 9; (2) not
have high migration; (3) be accessible; (4) have a room available for the computer lab; (5) employ
at least four teachers with computer skills; and (6) not have a pre-existing computer lab. The
Random Assignment
SDPP EWS-only group
Eligible Schools
SDPP EWS + Computer Lab group
Control group
What is an impact evaluation?
Goal: an evaluation designed to
provide answers to policy or
program effectiveness; aims to
generate rigorous evidence to
answer questions about program
impact
Purpose: establish the causal effect
of an intervention through the use of
a counterfactual
Mechanism: Comparison of
outcomes for those randomly
assigned to SDPP and control
groups
Findings from the School Dropout Prevention Pilot Program Impact Evaluation in Cambodia Page 19
evaluation team identified 322 schools that met these criteria21; 107 were randomly assigned to the
SDPP EWS-only group, 108 were assigned to the SDPP EWS plus computer lab group, and 107
were randomly assigned to the control group.
2. Primary impact analysis
Given the RCT design, the assessment of the SDPP program’s effectiveness focuses on the
difference in average outcomes at our final follow-up between students and teachers randomly
assigned to the SDPP group and those randomly assigned to the control group. Because random
assignment means that there should be no systematic differences in baseline characteristics
between the SDPP and control groups, a simple difference in outcomes across groups provides a
rigorous, unbiased estimate of the SDPP Program’s impact. However, we are able to increase the
precision of the impact estimates and our ability to identify impacts as statistically significant by
using statistical models that adjusted for small differences in the initial characteristics of the study
groups that may have arisen by chance or because of survey nonresponse.22 In this way, the impact
estimates adjust for baseline values of the outcomes of interest, as well as individual and school-
level characteristics. RCT impact estimates are considered the gold standard in evaluating program
effectiveness. 23, 24
These impact estimates represent the difference in the outcome of interest at endline that is
attributable to the SDPP Program relative to the status quo. The estimates are expressed as
percentage point differences between the treatment and control group. The impact estimates
reported in this study should be interpreted as the difference in outcomes that resulted from
exposure to SDPP. For example, an “X” percentage point favorable impact on school dropout
indicates that, on average, the dropout rate under SDPP is “X” percentage points lower than it
would have been under business-as-usual operations. We also present percentage increases or
decreases in the primary outcomes across the treatment and control groups. These “percentage
changes” should not be interpreted as the percentage “change” that might be calculated in a pre-
post measure or baseline/endline change, but rather the increase or decrease in the treatment
group’s outcome measure in relation to the control group at endline.
The impact analysis includes all students in targeted grades in SDPP and control schools,
regardless of whether the students in the SDPP schools participated in SDPP Program activities.
Therefore, the estimates represent the average impact of the SDPP Program on all students in the
enrolled schools. These are called intent-to-treat (ITT) estimates—they reflect the fact that not
every school or student intended to be treated (via program services) actually participated in the
program. The ITT estimates therefore answer the policy-relevant question—do programs make a
21 Power calculations conducted as a part of the study design and conversations with the SDPP team in Cambodia suggested that a
sample size of 322 schools would need to be included in the study in order to detect a 7 percentage point impact on dropout. This
sample size was much larger than in other SDPP countries given the three study arms and the number of schools meeting the
eligibility criteria in the targeted geographies. See Appendix A for more information on these calculations.
22 Statistical significance is explained in Section IV; see text box on “statistical significance.”
23 Multiple comparison concerns apply in the analysis of multiple treatments. Given that there are three research groups in
Cambodia, SDPP adjusts for the additional comparisons that emerge from this design using the Scheffé method, which adjusts the
statistical significance level for all possible comparisons (Scheffé 1959). This correction is applied to all analyses in Cambodia.
24 Please see Appendix B for more details on the impact estimation methods.
Findings from the School Dropout Prevention Pilot Program Impact Evaluation in Cambodia Page 20
difference for schools that choose to enroll? These types of estimates are widely used in large-
scale evaluations and preserve the integrity of the random assignment design.
SDPP worked with 7th, 8th, and 9th graders from SY 2012–2013 and SY 2013–2014. Therefore,
SDPP worked with: (1) SY 2012-2013 8th graders, who continued to receive the program in SY
2013-2014 in their 9th grade year; (2) SY 2012-2013 7th graders, who continued to receive the
program in SY 2013-2014 in their 8th grade year; and (3) SY 2013-2014 7th graders, who received
the program only during SY 2013-2014. The analyses look at outcomes for these cohorts of
students. SDPP schools and control school outcomes are compared, and differences are estimated
while controlling for school-level and individual-level information regarding the school year
during which they received SDPP.
3. Impact analysis for at-risk students
The SDPP Program was intended to affect outcomes more strongly for students at risk of dropout
than for students not at risk, since the goal of the EWS was to train teachers to identify and work
with students that are at risk of dropping out of school. Therefore, SDPP analyzed the impacts on
students at risk of dropout. SDPP identified students in SDPP and control schools as at risk based
on student characteristics before they entered the 8th grade, mimicking the EWS identification
process as closely as possible with available data. SDPP was limited to the SY 2012–2013 8th
grade students in looking at at-risk subgroups, since SDPP was only able to get baseline
information from student records for students who had been in school in 7th grade (7th graders’
school records do not follow them from primary school), Therefore, SDPP was unable to use
baseline data to characterize either SY 2012–2013 or SY 2013–2014 7th graders’ at risk status;
SY 2012–2013 9th graders were not included in any of our impact analyses, since they received
the SDPP Program for less than a year. SDPP conducted a subgroup analysis of the SY 2012–2013
8th grade students that SDPP identified as at-risk. This subgroup analysis is part of our primary
assessment of whether the SDPP Program effectively accomplished its goals (or was effective).
Importantly, the students identified as at risk for the subgroup analysis in SDPP schools based on
baseline characteristics are not necessarily the same as those identified by the EWS in SDPP
schools. However, there is substantial overlap in these groups. SDPP focused the primary analysis
on the subgroup of students identified as at risk of dropout based on their baseline characteristics
because it would allow us to identify at-risk students in the control group using an analogous
process. More critically, preserving the integrity of the random assignment design requires that
subgroup analysis be based on baseline characteristics observed before receiving program services,
and students in both SDPP and control schools are thus identified as being at-risk in the same
manner.
4. Additional subgroup analyses
In addition to looking at impacts separately for at-risk students, SDPP also conducted several
additional subgroup analyses. The SDPP Program was not designed to have different impacts for
different subgroups of students (other than students at-risk of dropout), however the literature
suggests that outcomes and impacts might vary for different types of students. There might be
differential impacts for students with certain characteristics (such as gender, or being over-age for
their grade), for different types of schools (such as the percentage of at-risk students in a school
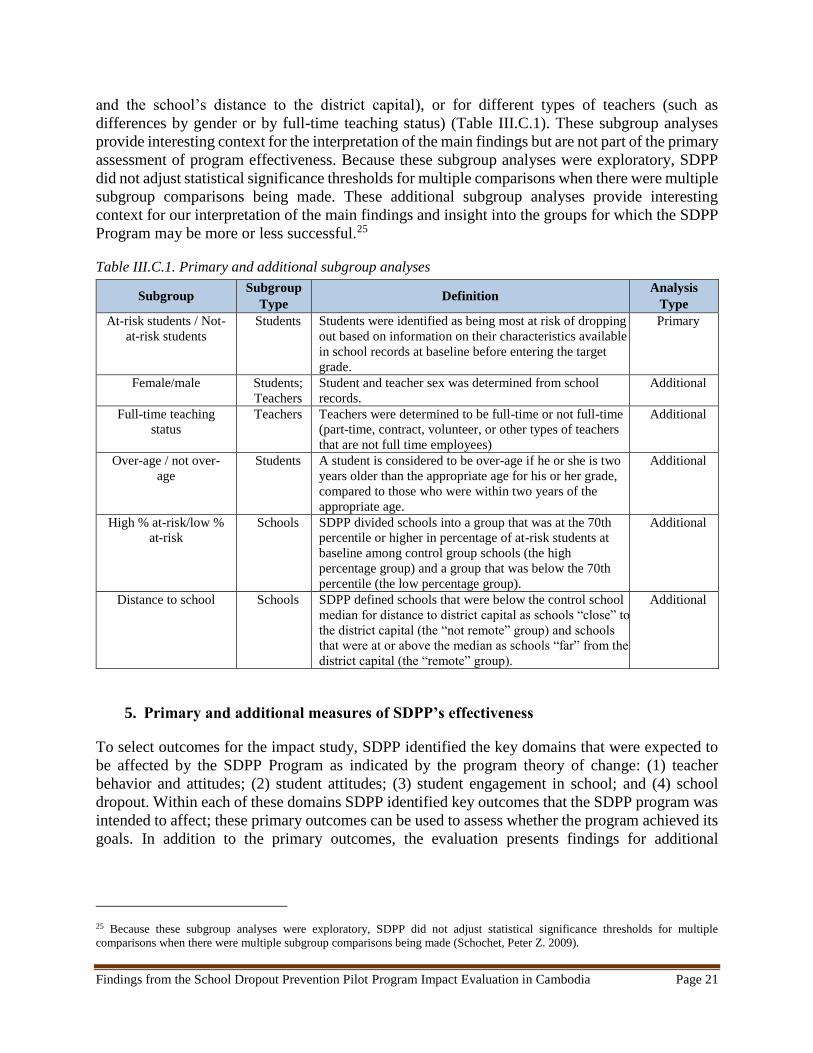
Findings from the School Dropout Prevention Pilot Program Impact Evaluation in Cambodia Page 21
and the school’s distance to the district capital), or for different types of teachers (such as
differences by gender or by full-time teaching status) (Table III.C.1). These subgroup analyses
provide interesting context for the interpretation of the main findings but are not part of the primary
assessment of program effectiveness. Because these subgroup analyses were exploratory, SDPP
did not adjust statistical significance thresholds for multiple comparisons when there were multiple
subgroup comparisons being made. These additional subgroup analyses provide interesting
context for our interpretation of the main findings and insight into the groups for which the SDPP
Program may be more or less successful.25
Table III.C.1. Primary and additional subgroup analyses
Subgroup Subgroup
Type Definition
Analysis
Type
At-risk students / Not-
at-risk students
Students Students were identified as being most at risk of dropping
out based on information on their characteristics available
in school records at baseline before entering the target
grade.
Primary
Female/male Students;
Teachers
Student and teacher sex was determined from school
records.
Additional
Full-time teaching
status
Teachers Teachers were determined to be full-time or not full-time
(part-time, contract, volunteer, or other types of teachers
that are not full time employees)
Additional
Over-age / not over-
age
Students A student is considered to be over-age if he or she is two
years older than the appropriate age for his or her grade,
compared to those who were within two years of the
appropriate age.
Additional
High % at-risk/low %
at-risk
Schools SDPP divided schools into a group that was at the 70th
percentile or higher in percentage of at-risk students at
baseline among control group schools (the high
percentage group) and a group that was below the 70th
percentile (the low percentage group).
Additional
Distance to school Schools SDPP defined schools that were below the control school
median for distance to district capital as schools “close” to
the district capital (the “not remote” group) and schools
that were at or above the median as schools “far” from the
district capital (the “remote” group).
Additional
5. Primary and additional measures of SDPP’s effectiveness
To select outcomes for the impact study, SDPP identified the key domains that were expected to
be affected by the SDPP Program as indicated by the program theory of change: (1) teacher
behavior and attitudes; (2) student attitudes; (3) student engagement in school; and (4) school
dropout. Within each of these domains SDPP identified key outcomes that the SDPP program was
intended to affect; these primary outcomes can be used to assess whether the program achieved its
goals. In addition to the primary outcomes, the evaluation presents findings for additional
25 Because these subgroup analyses were exploratory, SDPP did not adjust statistical significance thresholds for multiple
comparisons when there were multiple subgroup comparisons being made (Schochet, Peter Z. 2009).
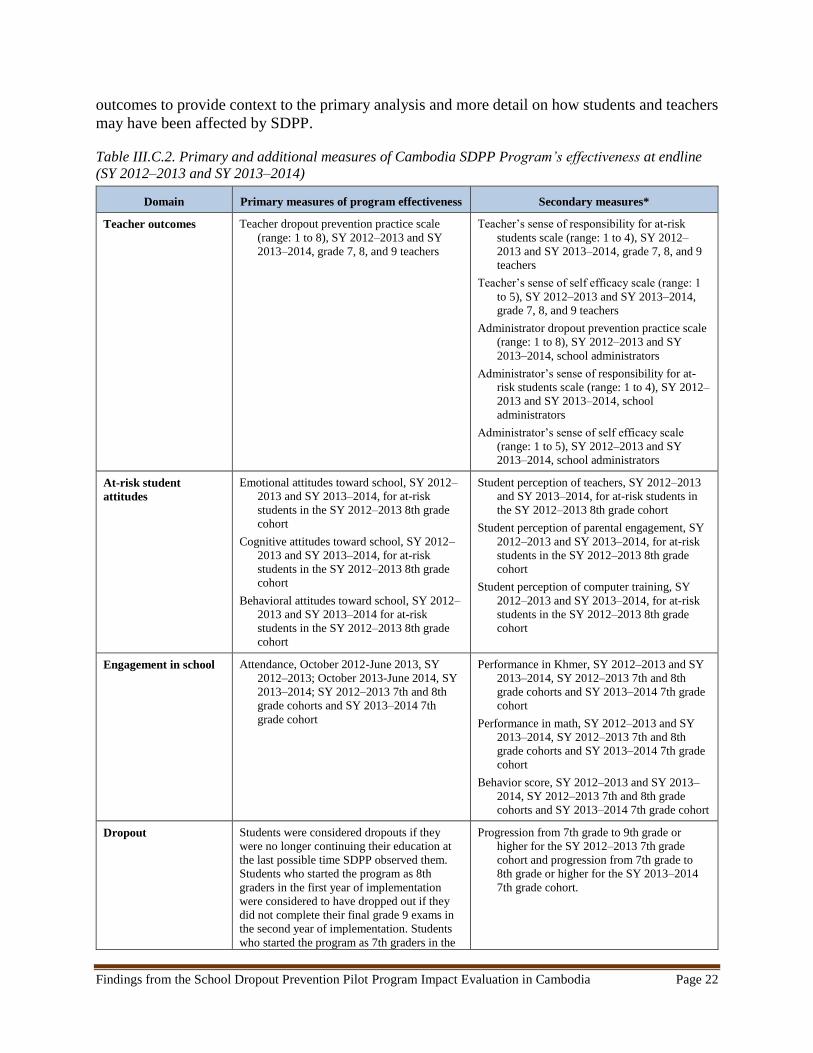
Findings from the School Dropout Prevention Pilot Program Impact Evaluation in Cambodia Page 22
outcomes to provide context to the primary analysis and more detail on how students and teachers
may have been affected by SDPP.
Table III.C.2. Primary and additional measures of Cambodia SDPP Program’s effectiveness at endline
(SY 2012–2013 and SY 2013–2014)
Domain Primary measures of program effectiveness Secondary measures*
Teacher outcomes Teacher dropout prevention practice scale
(range: 1 to 8), SY 2012–2013 and SY
2013–2014, grade 7, 8, and 9 teachers
Teacher’s sense of responsibility for at-risk
students scale (range: 1 to 4), SY 2012–
2013 and SY 2013–2014, grade 7, 8, and 9
teachers
Teacher’s sense of self efficacy scale (range: 1
to 5), SY 2012–2013 and SY 2013–2014,
grade 7, 8, and 9 teachers
Administrator dropout prevention practice scale
(range: 1 to 8), SY 2012–2013 and SY
2013–2014, school administrators
Administrator’s sense of responsibility for at-
risk students scale (range: 1 to 4), SY 2012–
2013 and SY 2013–2014, school
administrators
Administrator’s sense of self efficacy scale
(range: 1 to 5), SY 2012–2013 and SY
2013–2014, school administrators
At-risk student
attitudes
Emotional attitudes toward school, SY 2012–
2013 and SY 2013–2014, for at-risk
students in the SY 2012–2013 8th grade
cohort
Cognitive attitudes toward school, SY 2012–
2013 and SY 2013–2014, for at-risk
students in the SY 2012–2013 8th grade
cohort
Behavioral attitudes toward school, SY 2012–
2013 and SY 2013–2014 for at-risk
students in the SY 2012–2013 8th grade
cohort
Student perception of teachers, SY 2012–2013
and SY 2013–2014, for at-risk students in
the SY 2012–2013 8th grade cohort
Student perception of parental engagement, SY
2012–2013 and SY 2013–2014, for at-risk
students in the SY 2012–2013 8th grade
cohort
Student perception of computer training, SY
2012–2013 and SY 2013–2014, for at-risk
students in the SY 2012–2013 8th grade
cohort
Engagement in school Attendance, October 2012-June 2013, SY
2012–2013; October 2013-June 2014, SY
2013–2014; SY 2012–2013 7th and 8th
grade cohorts and SY 2013–2014 7th
grade cohort
Performance in Khmer, SY 2012–2013 and SY
2013–2014, SY 2012–2013 7th and 8th
grade cohorts and SY 2013–2014 7th grade
cohort
Performance in math, SY 2012–2013 and SY
2013–2014, SY 2012–2013 7th and 8th
grade cohorts and SY 2013–2014 7th grade
cohort
Behavior score, SY 2012–2013 and SY 2013–
2014, SY 2012–2013 7th and 8th grade
cohorts and SY 2013–2014 7th grade cohort
Dropout Students were considered dropouts if they
were no longer continuing their education at
the last possible time SDPP observed them.
Students who started the program as 8th
graders in the first year of implementation
were considered to have dropped out if they
did not complete their final grade 9 exams in
the second year of implementation. Students
who started the program as 7th graders in the
Progression from 7th grade to 9th grade or
higher for the SY 2012–2013 7th grade
cohort and progression from 7th grade to
8th grade or higher for the SY 2013–2014
7th grade cohort.
Findings from the School Dropout Prevention Pilot Program Impact Evaluation in Cambodia Page 23
Domain Primary measures of program effectiveness Secondary measures*
first and second years of implementation were
considered to have dropped out if they did not
enroll in school for the 2014/2015 school year
(as 8th and 9th graders, respectively).
* Exploring the impact of SDPP on these additional outcomes of interest is meant to be descriptive in nature, to provide context
and better understand the impacts on the primary measures by which SDPP’s effectiveness is determined. In these exploratory
analyses on additional outcomes, SDPP did not adjust statistical significance thresholds for multiple comparisons when presenting
impacts of the program. SY = school year.
Within the teacher outcomes domain, the primary outcome measure is a scale representing teacher
dropout prevention practices (Table III.C.2). SDPP worked directly with teachers to improve their
knowledge and practices related to preventing dropout. Since teachers inspire and shape student
attitudes and behaviors, changes in teacher practices may represent catalysts for student change.
Changes in student attitudes should then result from these changes in teacher attitudes and
practices, and so SDPP looks at outcomes within the student attitudes domain. The three primary
outcomes in this domain are student emotional, cognitive, and behavioral attitudes toward school.
Changes in student attitudes should then result in changes in student engagement in school,
including in their attendance. Low attendance may indicate that students are less active participants
in their own education, which could be a sign that students are on their way to dropping out of
school. Finally, SDPP analyzes student dropout at the time of the final data collection.
In addition to the primary outcomes, the evaluation analyzes additional information to provide
context to the primary analysis and increase understanding of the ways in which the program was
and was not effective in influencing a particular domain. Table III.C.2 lists these additional
outcomes, which include teacher attitudes and practices, student perceptions of teachers and
parents, academic performance, behavior, and grade progression.
IV. Sampling and data collection
This report draws on data from three sources: (1) student records collected from schools;
(2) surveys conducted with at-risk students; and (3) surveys conducted with school administrators
and teachers teaching 7th, 8th, or 9th-grade homeroom, math, and Khmer language courses. SDPP
collected this data at five points in time, over four school years, from the school year before the
rollout of the program (SY 2011–2012) to the school year after completion of the program (SY
2014–2015) (Figure II.C.1). Across the five rounds of data collection, SDPP gathered information
on the three cohorts used in the analysis, their teachers, and their schools.
Across all data collection rounds SDPP gathered data from 322 schools—108 in the
EWS+Computers group, 107 in the EWS group, and 107 in the control group—that are used in the
impact analysis (Table IV.1). SDPP analyzed data on students from school records for 54,855
students in the EWS+Computers group, 54,323 students in the EWS group, and 50,336 students
in the control group. Similarly, SDPP analyzed information collected from interviews with 1,755
students from the EWS+Computers group, 1,817 students from the EWS group, and 1,694 students
from the control group. SDPP administered 1,639 interviews to eligible 7th-, 8th-, and 9th-grade
teachers in the EWS+Computers group, 1,591 interviews to eligible 7th-, 8th-, and 9th-grade
teachers in the EWS group, and 1,587 interviews to eligible 7th-, 8th-, and 9th-grade teachers in
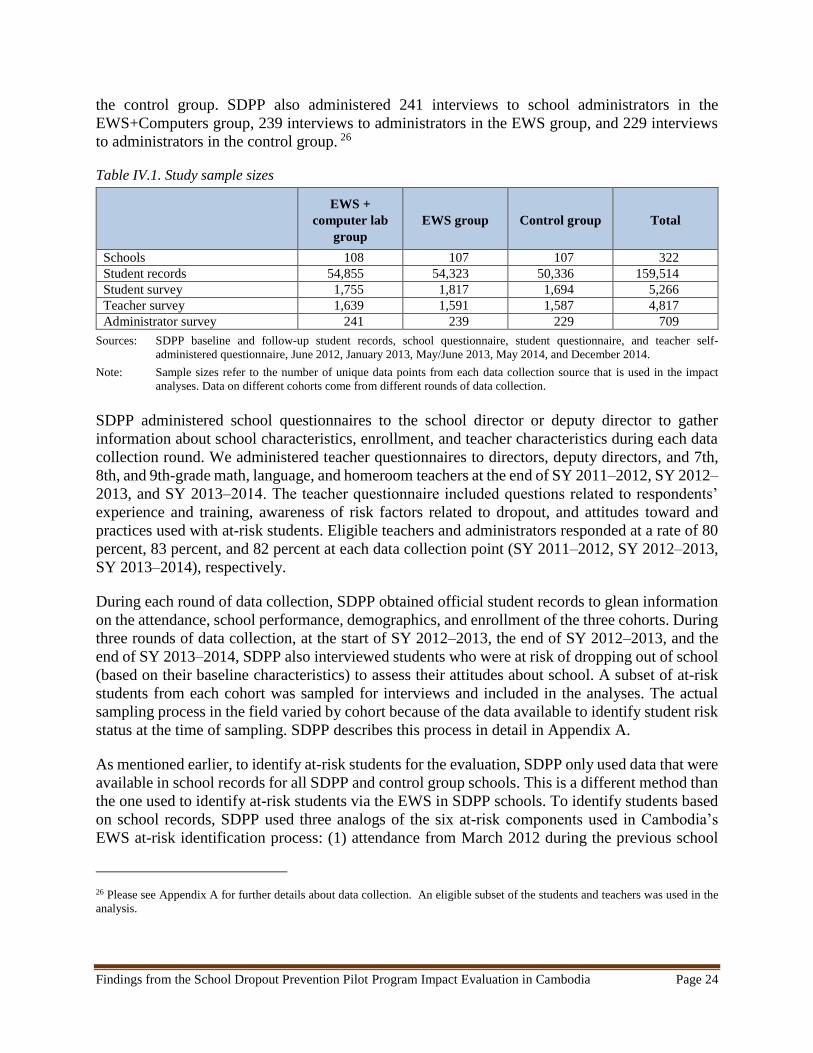
Findings from the School Dropout Prevention Pilot Program Impact Evaluation in Cambodia Page 24
the control group. SDPP also administered 241 interviews to school administrators in the
EWS+Computers group, 239 interviews to administrators in the EWS group, and 229 interviews
to administrators in the control group. 26
Table IV.1. Study sample sizes
EWS +
computer lab
group
EWS group Control group Total
Schools 108 107 107 322
Student records 54,855 54,323 50,336 159,514
Student survey 1,755 1,817 1,694 5,266
Teacher survey 1,639 1,591 1,587 4,817
Administrator survey 241 239 229 709
Sources: SDPP baseline and follow-up student records, school questionnaire, student questionnaire, and teacher self-
administered questionnaire, June 2012, January 2013, May/June 2013, May 2014, and December 2014. Note: Sample sizes refer to the number of unique data points from each data collection source that is used in the impact
analyses. Data on different cohorts come from different rounds of data collection.
SDPP administered school questionnaires to the school director or deputy director to gather
information about school characteristics, enrollment, and teacher characteristics during each data
collection round. We administered teacher questionnaires to directors, deputy directors, and 7th,
8th, and 9th-grade math, language, and homeroom teachers at the end of SY 2011–2012, SY 2012–
2013, and SY 2013–2014. The teacher questionnaire included questions related to respondents’
experience and training, awareness of risk factors related to dropout, and attitudes toward and
practices used with at-risk students. Eligible teachers and administrators responded at a rate of 80
percent, 83 percent, and 82 percent at each data collection point (SY 2011–2012, SY 2012–2013,
SY 2013–2014), respectively.
During each round of data collection, SDPP obtained official student records to glean information
on the attendance, school performance, demographics, and enrollment of the three cohorts. During
three rounds of data collection, at the start of SY 2012–2013, the end of SY 2012–2013, and the
end of SY 2013–2014, SDPP also interviewed students who were at risk of dropping out of school
(based on their baseline characteristics) to assess their attitudes about school. A subset of at-risk
students from each cohort was sampled for interviews and included in the analyses. The actual
sampling process in the field varied by cohort because of the data available to identify student risk
status at the time of sampling. SDPP describes this process in detail in Appendix A.
As mentioned earlier, to identify at-risk students for the evaluation, SDPP only used data that were
available in school records for all SDPP and control group schools. This is a different method than
the one used to identify at-risk students via the EWS in SDPP schools. To identify students based
on school records, SDPP used three analogs of the six at-risk components used in Cambodia’s
EWS at-risk identification process: (1) attendance from March 2012 during the previous school
26 Please see Appendix A for further details about data collection. An eligible subset of the students and teachers was used in the
analysis.
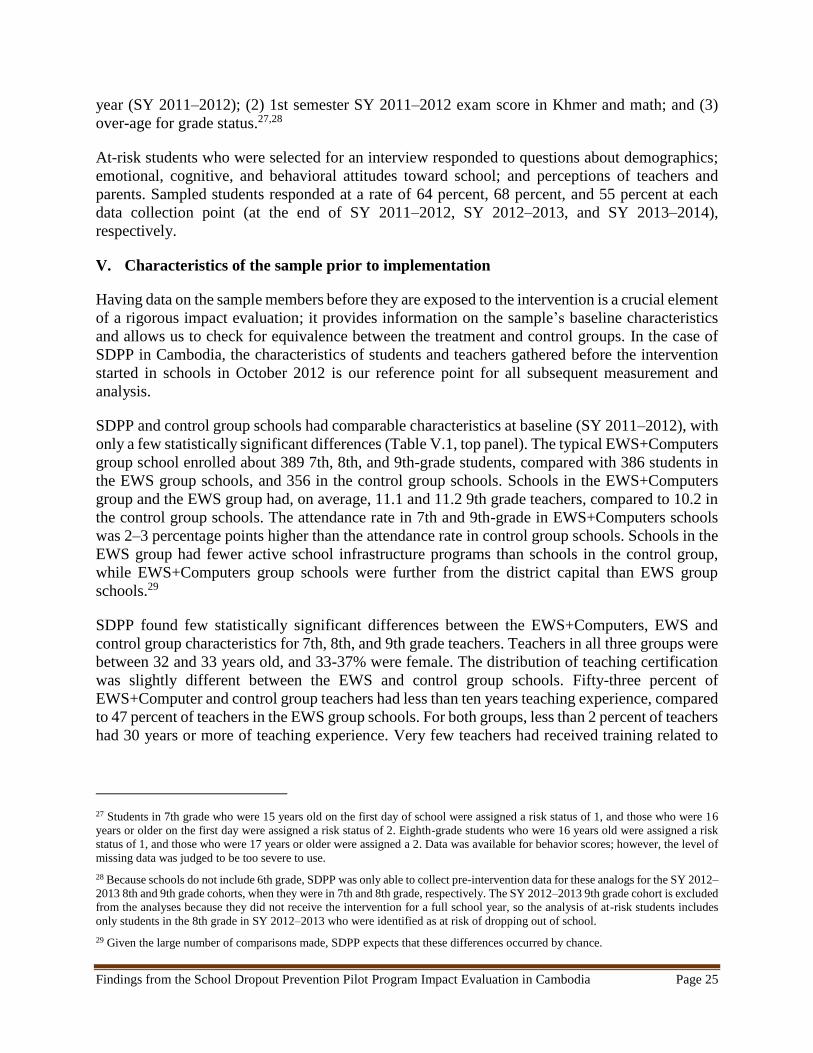
Findings from the School Dropout Prevention Pilot Program Impact Evaluation in Cambodia Page 25
year (SY 2011–2012); (2) 1st semester SY 2011–2012 exam score in Khmer and math; and (3)
over-age for grade status.27,28
At-risk students who were selected for an interview responded to questions about demographics;
emotional, cognitive, and behavioral attitudes toward school; and perceptions of teachers and
parents. Sampled students responded at a rate of 64 percent, 68 percent, and 55 percent at each
data collection point (at the end of SY 2011–2012, SY 2012–2013, and SY 2013–2014),
respectively.
V. Characteristics of the sample prior to implementation
Having data on the sample members before they are exposed to the intervention is a crucial element
of a rigorous impact evaluation; it provides information on the sample’s baseline characteristics
and allows us to check for equivalence between the treatment and control groups. In the case of
SDPP in Cambodia, the characteristics of students and teachers gathered before the intervention
started in schools in October 2012 is our reference point for all subsequent measurement and
analysis.
SDPP and control group schools had comparable characteristics at baseline (SY 2011–2012), with
only a few statistically significant differences (Table V.1, top panel). The typical EWS+Computers
group school enrolled about 389 7th, 8th, and 9th-grade students, compared with 386 students in
the EWS group schools, and 356 in the control group schools. Schools in the EWS+Computers
group and the EWS group had, on average, 11.1 and 11.2 9th grade teachers, compared to 10.2 in
the control group schools. The attendance rate in 7th and 9th-grade in EWS+Computers schools
was 2–3 percentage points higher than the attendance rate in control group schools. Schools in the
EWS group had fewer active school infrastructure programs than schools in the control group,
while EWS+Computers group schools were further from the district capital than EWS group
schools.29
SDPP found few statistically significant differences between the EWS+Computers, EWS and
control group characteristics for 7th, 8th, and 9th grade teachers. Teachers in all three groups were
between 32 and 33 years old, and 33-37% were female. The distribution of teaching certification
was slightly different between the EWS and control group schools. Fifty-three percent of
EWS+Computer and control group teachers had less than ten years teaching experience, compared
to 47 percent of teachers in the EWS group schools. For both groups, less than 2 percent of teachers
had 30 years or more of teaching experience. Very few teachers had received training related to
27 Students in 7th grade who were 15 years old on the first day of school were assigned a risk status of 1, and those who were 16
years or older on the first day were assigned a risk status of 2. Eighth-grade students who were 16 years old were assigned a risk
status of 1, and those who were 17 years or older were assigned a 2. Data was available for behavior scores; however, the level of
missing data was judged to be too severe to use.
28 Because schools do not include 6th grade, SDPP was only able to collect pre-intervention data for these analogs for the SY 2012–
2013 8th and 9th grade cohorts, when they were in 7th and 8th grade, respectively. The SY 2012–2013 9th grade cohort is excluded
from the analyses because they did not receive the intervention for a full school year, so the analysis of at-risk students includes
only students in the 8th grade in SY 2012–2013 who were identified as at risk of dropping out of school.
29 Given the large number of comparisons made, SDPP expects that these differences occurred by chance.
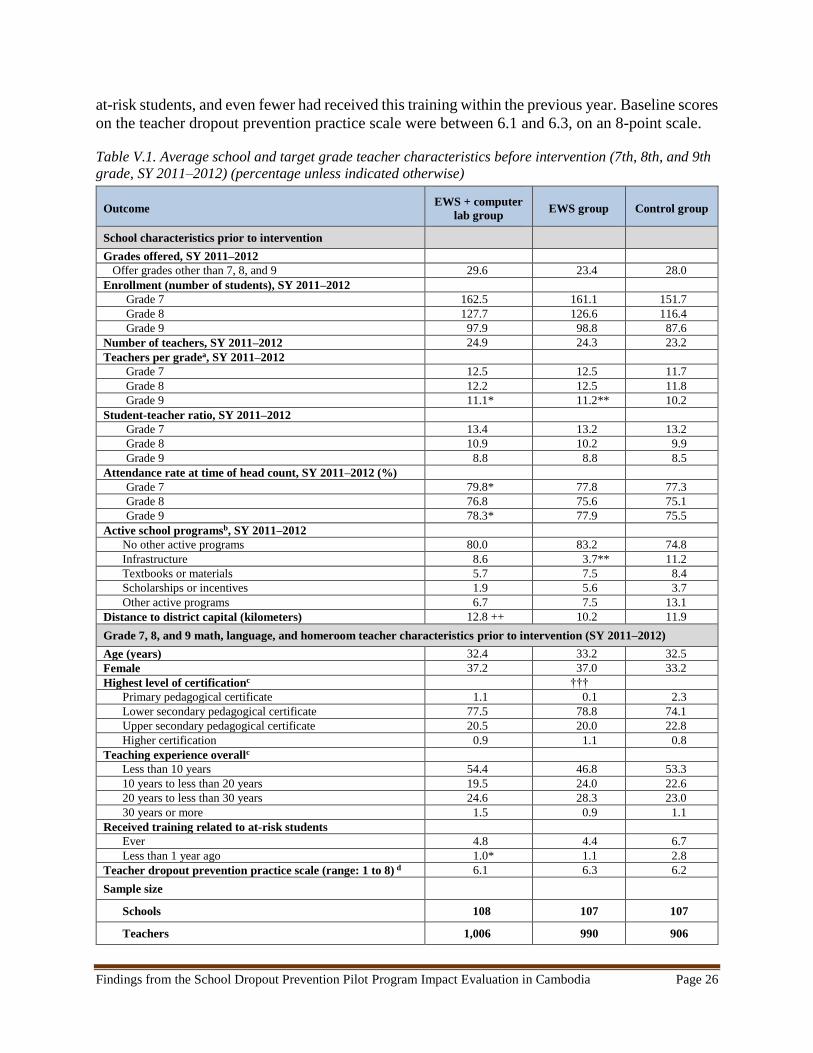
Findings from the School Dropout Prevention Pilot Program Impact Evaluation in Cambodia Page 26
at-risk students, and even fewer had received this training within the previous year. Baseline scores
on the teacher dropout prevention practice scale were between 6.1 and 6.3, on an 8-point scale.
Table V.1. Average school and target grade teacher characteristics before intervention (7th, 8th, and 9th
grade, SY 2011–2012) (percentage unless indicated otherwise)
Outcome EWS + computer
lab group EWS group Control group
School characteristics prior to intervention
Grades offered, SY 2011–2012
Offer grades other than 7, 8, and 9 29.6 23.4 28.0
Enrollment (number of students), SY 2011–2012
Grade 7 162.5 161.1 151.7
Grade 8 127.7 126.6 116.4
Grade 9 97.9 98.8 87.6
Number of teachers, SY 2011–2012 24.9 24.3 23.2
Teachers per gradea, SY 2011–2012
Grade 7 12.5 12.5 11.7
Grade 8 12.2 12.5 11.8
Grade 9 11.1* 11.2** 10.2
Student-teacher ratio, SY 2011–2012
Grade 7 13.4 13.2 13.2
Grade 8 10.9 10.2 9.9
Grade 9 8.8 8.8 8.5
Attendance rate at time of head count, SY 2011–2012 (%)
Grade 7 79.8* 77.8 77.3
Grade 8 76.8 75.6 75.1
Grade 9 78.3* 77.9 75.5
Active school programsb, SY 2011–2012
No other active programs 80.0 83.2 74.8
Infrastructure 8.6 3.7** 11.2
Textbooks or materials 5.7 7.5 8.4
Scholarships or incentives 1.9 5.6 3.7
Other active programs 6.7 7.5 13.1
Distance to district capital (kilometers) 12.8 ++ 10.2 11.9
Grade 7, 8, and 9 math, language, and homeroom teacher characteristics prior to intervention (SY 2011–2012)
Age (years) 32.4 33.2 32.5
Female 37.2 37.0 33.2
Highest level of certificationc †††
Primary pedagogical certificate 1.1 0.1 2.3
Lower secondary pedagogical certificate 77.5 78.8 74.1
Upper secondary pedagogical certificate 20.5 20.0 22.8
Higher certification 0.9 1.1 0.8
Teaching experience overallc
Less than 10 years 54.4 46.8 53.3
10 years to less than 20 years 19.5 24.0 22.6
20 years to less than 30 years 24.6 28.3 23.0
30 years or more 1.5 0.9 1.1
Received training related to at-risk students
Ever 4.8 4.4 6.7
Less than 1 year ago 1.0* 1.1 2.8
Teacher dropout prevention practice scale (range: 1 to 8) d 6.1 6.3 6.2
Sample size
Schools 108 107 107
Teachers 1,006 990 906
Findings from the School Dropout Prevention Pilot Program Impact Evaluation in Cambodia Page 27
Sources: SDPP baseline teacher self-administered questionnaire and school questionnaire, June 2012 and January 2013.
Note: Differences between SDPP and control group means were tested using two-tailed t-tests unless otherwise indicated.
The teacher analysis accounts for clustering of teachers within schools. Sample sizes for some characteristics may be
smaller due to missing responses.
aA single teacher may teach multiple grades/subjects.
b External programs are those funded and implemented by organizations other than the school system. More than one external
program can operate in a school. Examples of other programs include tutoring or remediation programs and community
mobilization programs.
c Differences between treatment and control group distributions were tested using a chi-squared test.
d This scale represents the sum of teacher responses to eight items that indicate whether the teacher reports recording daily
attendance, taking action if the student is absent three days in a month, giving weak students feedback, discussing support for weak
students with other teachers, developing plans to support weak students, communicating with parents of weak students, meeting
with weak students, and being willing to come early or stay late to help weak students.
***/**/* Difference between the indicated treatment group and the control group means is statistically significant at the
.01/.05/.10 level.
+++/++/+ Difference between early warning system + computer lab group and early warning system group means is
statistically significant at the .01/.05/.10 level.
†††/††/† Difference between the indicated treatment group and control group distributions is statistically significant at the
.01/.05/.10 level.
●●●/●●/● Difference between early warning system + computer lab group and early warning system group distributions is
statistically significant at the .01/.05/.10 level.
Students who were in 7th and 8th grade in SY 2011–2012 were also similar across the
EWS+Computers, EWS, and control groups (Table V.2).30 About 48 to 49 percent of students in
all groups were female, and about 3.6 to 4.3 percent of students in all groups were not appropriately
aged for their grade. Of the EWS+Computers group students, 75.2 percent were at risk of school
dropout at baseline, compared with 72.5 percent of EWS only group students and 75 percent of
control group students. The difference between the EWS+Computers group and the EWS only
group was marginally significant. 31 Daily attendance was high across all groups, at about 96
percent. Average math scores across all groups were between 63.3 and 64.1 percent. The difference
between Khmer scores in the EWS group (66.5 percent) and in the control group (68.5 percent)
was marginally significant. Students in the at-risk sample were more likely to be over-age for their
grade, but otherwise had similar characteristics to the students in the full sample.32
30 Assuming regular progression, the 7th and 8th grade students in SY 2011–2012 would have been in 8th and 9th grade in SY
2012–2013.
31 Throughout the report, SDPP uses the term “marginally significant” to refer to differences with p-values of 0.10 or lower and
“statistically significant” to refer to differences with p-values of 0.05 or lower.
32 At baseline, SDPP examined a large number of comparisons (3 comparisons each for 193 school, student, teacher, and school
administrator characteristics). Of the comparisons related to student attitudes, SDPP found more differences between groups than
what one would expect based on chance. There was little evidence of systematic differences in the treatment and control groups in
baseline characteristics other than student attitudes. Please see Appendix H for further discussion on baseline characteristics.
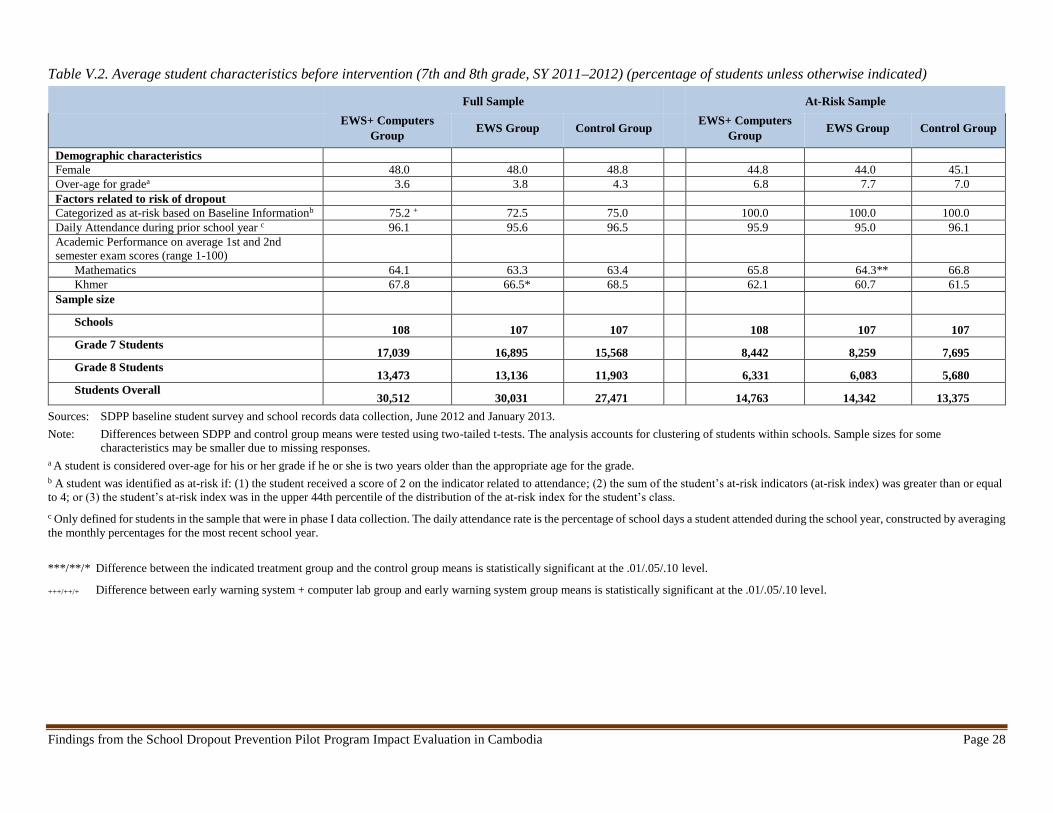
Findings from the School Dropout Prevention Pilot Program Impact Evaluation in Cambodia Page 28
Table V.2. Average student characteristics before intervention (7th and 8th grade, SY 2011–2012) (percentage of students unless otherwise indicated)
Full Sample At-Risk Sample
EWS+ Computers
Group EWS Group Control Group
EWS+ Computers
Group EWS Group Control Group
Demographic characteristics
Female 48.0 48.0 48.8 44.8 44.0 45.1
Over-age for gradea 3.6 3.8 4.3 6.8 7.7 7.0
Factors related to risk of dropout
Categorized as at-risk based on Baseline Informationb 75.2 + 72.5 75.0 100.0 100.0 100.0
Daily Attendance during prior school year c 96.1 95.6 96.5 95.9 95.0 96.1
Academic Performance on average 1st and 2nd
semester exam scores (range 1-100)
Mathematics 64.1 63.3 63.4 65.8 64.3** 66.8
Khmer 67.8 66.5* 68.5 62.1 60.7 61.5
Sample size
Schools 108 107 107 108 107 107
Grade 7 Students 17,039 16,895 15,568 8,442 8,259 7,695
Grade 8 Students 13,473 13,136 11,903 6,331 6,083 5,680
Students Overall 30,512 30,031 27,471 14,763 14,342 13,375
Sources: SDPP baseline student survey and school records data collection, June 2012 and January 2013.
Note: Differences between SDPP and control group means were tested using two-tailed t-tests. The analysis accounts for clustering of students within schools. Sample sizes for some
characteristics may be smaller due to missing responses.
a A student is considered over-age for his or her grade if he or she is two years older than the appropriate age for the grade.
b A student was identified as at-risk if: (1) the student received a score of 2 on the indicator related to attendance; (2) the sum of the student’s at-risk indicators (at-risk index) was greater than or equal
to 4; or (3) the student’s at-risk index was in the upper 44th percentile of the distribution of the at-risk index for the student’s class.
c Only defined for students in the sample that were in phase I data collection. The daily attendance rate is the percentage of school days a student attended during the school year, constructed by averaging
the monthly percentages for the most recent school year.
***/**/* Difference between the indicated treatment group and the control group means is statistically significant at the .01/.05/.10 level.
+++/++/+ Difference between early warning system + computer lab group and early warning system group means is statistically significant at the .01/.05/.10 level.
Findings from the School Dropout Prevention Pilot Program Impact Evaluation in Cambodia Page 29
VI. Impacts of SDPP
The evaluation estimated the SDPP Program’s impacts on teacher outcomes, student attitudes,
student engagement in school, and school dropout. This chapter discusses the extent to which the
SDPP Program was successful in improving the primary measures of program effectiveness in
each of these domains. The assessment of the SDPP Program’s effectiveness focuses on program
impacts measured as the difference in average outcomes at final follow-up between students and
teachers randomly assigned to the SDPP group and those randomly assigned to the control group,
adjusting for baseline characteristics. The impact estimates reported in this study should be
interpreted as the difference in outcomes that resulted from exposure to SDPP. For example, an
“X” percentage point favorable impact on school dropout indicates that, on average, the dropout
rate under SDPP is “X” percentage points lower than it would have been under business-as-usual
operations. In some places, to provide additional context we also present percentage increases or
decreases in the primary outcomes across the treatment and control groups. These “percentage
changes” should not be interpreted as the percentage “change” that might be calculated in a pre-
post measure or baseline/endline change, but rather the increase or decrease in the treatment
group’s outcome measure in relation to the control group at endline.
The discussion is organized by outcome domain, as follows: (1) teacher behavior and attitudinal
outcomes; (2) student attitudes; (3) student engagement in school; and (4) school dropout. Impact
findings for primary and additional measures of program effectiveness are presented with bar
charts corresponding to the mean outcome level by random assignment group status. Differences
that are statistically different than zero are indicated with asterisks.
Statistical significance
Estimates of the impact of the SDPP Program are based on differences in average outcomes for SDPP
and control group students and teachers. In interpreting these estimates, it is important to evaluate
whether they are sufficiently large that it is unlikely that the difference is due to chance (indicating
that the SDPP Program did have an impact). With this in mind, statistical tests were conducted to
assess whether each impact is significantly different than zero. Impacts estimates are described as
statistically significant if there is less than a 5 percent probability that they are due to chance (and
not to the SDPP Program). Impact estimates are described as marginally significant if the probability
that they are due to chance (and not to the SDPP Program) is between 5 and 10 percent. In tables and
figures, the statistically significant impacts at the 1 percent, 5 percent, and 10 percent levels are
denoted with asterisks as ***, ** or *.
The chance (1%, 5% or 10%) that the reported findings are falsely reporting an impact increases as
additional tests are conducted. Therefore, caution should be used when interpreting the meaning of
our exploratory analyses of additional outcomes and subgroups because we do not correct for the
total number of comparisons being made. Individual tests of these additional contrasts of program
effects for other subgroups are provided as additional context for the main findings.
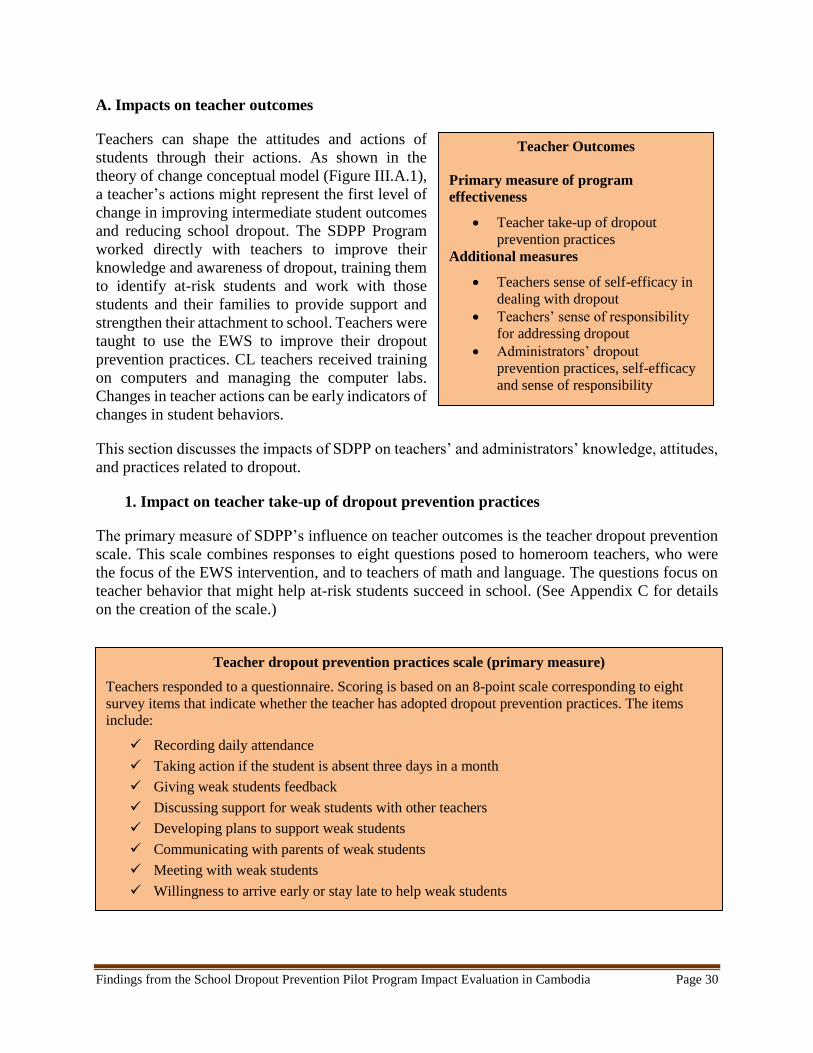
Findings from the School Dropout Prevention Pilot Program Impact Evaluation in Cambodia Page 30
A. Impacts on teacher outcomes
Teachers can shape the attitudes and actions of
students through their actions. As shown in the
theory of change conceptual model (Figure III.A.1),
a teacher’s actions might represent the first level of
change in improving intermediate student outcomes
and reducing school dropout. The SDPP Program
worked directly with teachers to improve their
knowledge and awareness of dropout, training them
to identify at-risk students and work with those
students and their families to provide support and
strengthen their attachment to school. Teachers were
taught to use the EWS to improve their dropout
prevention practices. CL teachers received training
on computers and managing the computer labs.
Changes in teacher actions can be early indicators of
changes in student behaviors.
This section discusses the impacts of SDPP on teachers’ and administrators’ knowledge, attitudes,
and practices related to dropout.
1. Impact on teacher take-up of dropout prevention practices
The primary measure of SDPP’s influence on teacher outcomes is the teacher dropout prevention
scale. This scale combines responses to eight questions posed to homeroom teachers, who were
the focus of the EWS intervention, and to teachers of math and language. The questions focus on
teacher behavior that might help at-risk students succeed in school. (See Appendix C for details
on the creation of the scale.)
Teacher dropout prevention practices scale (primary measure)
Teachers responded to a questionnaire. Scoring is based on an 8-point scale corresponding to eight
survey items that indicate whether the teacher has adopted dropout prevention practices. The items
include:
Recording daily attendance
Taking action if the student is absent three days in a month
Giving weak students feedback
Discussing support for weak students with other teachers
Developing plans to support weak students
Communicating with parents of weak students
Meeting with weak students
Willingness to arrive early or stay late to help weak students
Teacher Outcomes
Primary measure of program
effectiveness
Teacher take-up of dropout
prevention practices
Additional measures
Teachers sense of self-efficacy in
dealing with dropout
Teachers’ sense of responsibility
for addressing dropout
Administrators’ dropout
prevention practices, self-efficacy
and sense of responsibility
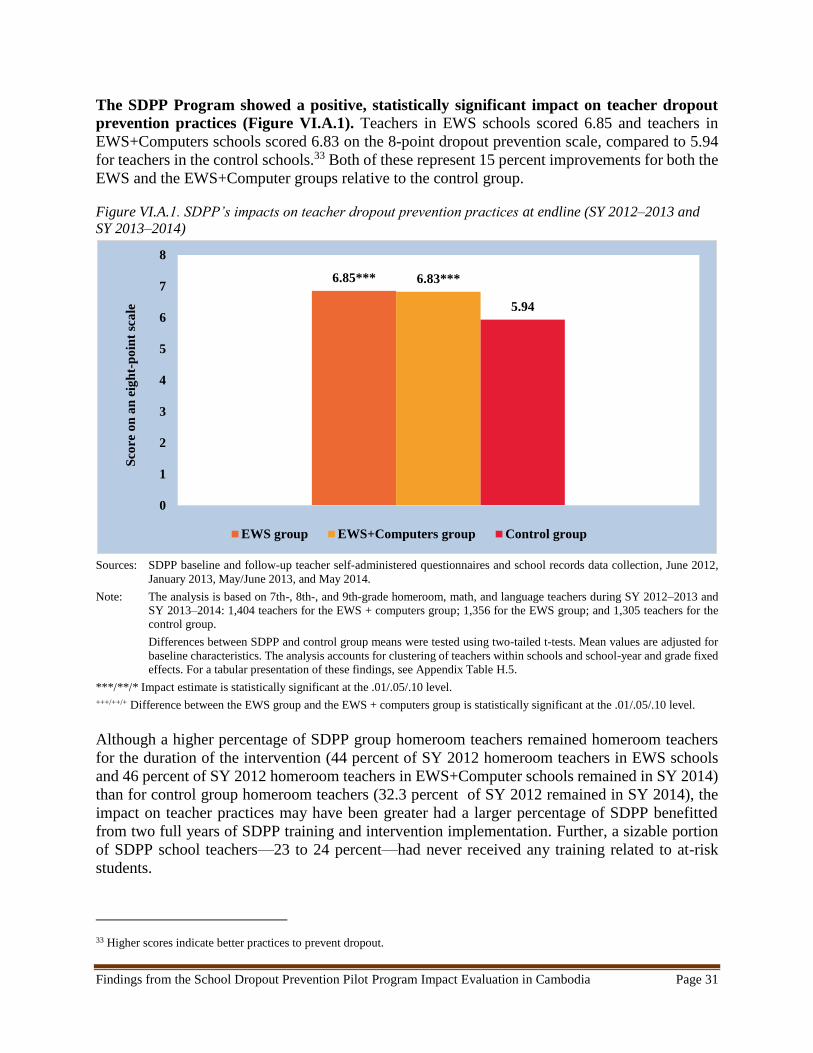
Findings from the School Dropout Prevention Pilot Program Impact Evaluation in Cambodia Page 31
The SDPP Program showed a positive, statistically significant impact on teacher dropout
prevention practices (Figure VI.A.1). Teachers in EWS schools scored 6.85 and teachers in
EWS+Computers schools scored 6.83 on the 8-point dropout prevention scale, compared to 5.94
for teachers in the control schools.33 Both of these represent 15 percent improvements for both the
EWS and the EWS+Computer groups relative to the control group.
Figure VI.A.1. SDPP’s impacts on teacher dropout prevention practices at endline (SY 2012–2013 and
SY 2013–2014)
Sources: SDPP baseline and follow-up teacher self-administered questionnaires and school records data collection, June 2012,
January 2013, May/June 2013, and May 2014.
Note: The analysis is based on 7th-, 8th-, and 9th-grade homeroom, math, and language teachers during SY 2012–2013 and
SY 2013–2014: 1,404 teachers for the EWS + computers group; 1,356 for the EWS group; and 1,305 teachers for the
control group.
Differences between SDPP and control group means were tested using two-tailed t-tests. Mean values are adjusted for
baseline characteristics. The analysis accounts for clustering of teachers within schools and school-year and grade fixed
effects. For a tabular presentation of these findings, see Appendix Table H.5.
***/**/* Impact estimate is statistically significant at the .01/.05/.10 level.
+++/++/+ Difference between the EWS group and the EWS + computers group is statistically significant at the .01/.05/.10 level.
Although a higher percentage of SDPP group homeroom teachers remained homeroom teachers
for the duration of the intervention (44 percent of SY 2012 homeroom teachers in EWS schools
and 46 percent of SY 2012 homeroom teachers in EWS+Computer schools remained in SY 2014)
than for control group homeroom teachers (32.3 percent of SY 2012 remained in SY 2014), the
impact on teacher practices may have been greater had a larger percentage of SDPP benefitted
from two full years of SDPP training and intervention implementation. Further, a sizable portion
of SDPP school teachers—23 to 24 percent—had never received any training related to at-risk
students.
33 Higher scores indicate better practices to prevent dropout.
6.85*** 6.83***
5.94
0
1
2
3
4
5
6
7
8
Sco
re o
n a
n e
igh
t-p
oin
t sc
ale
EWS group EWS+Computers group Control group
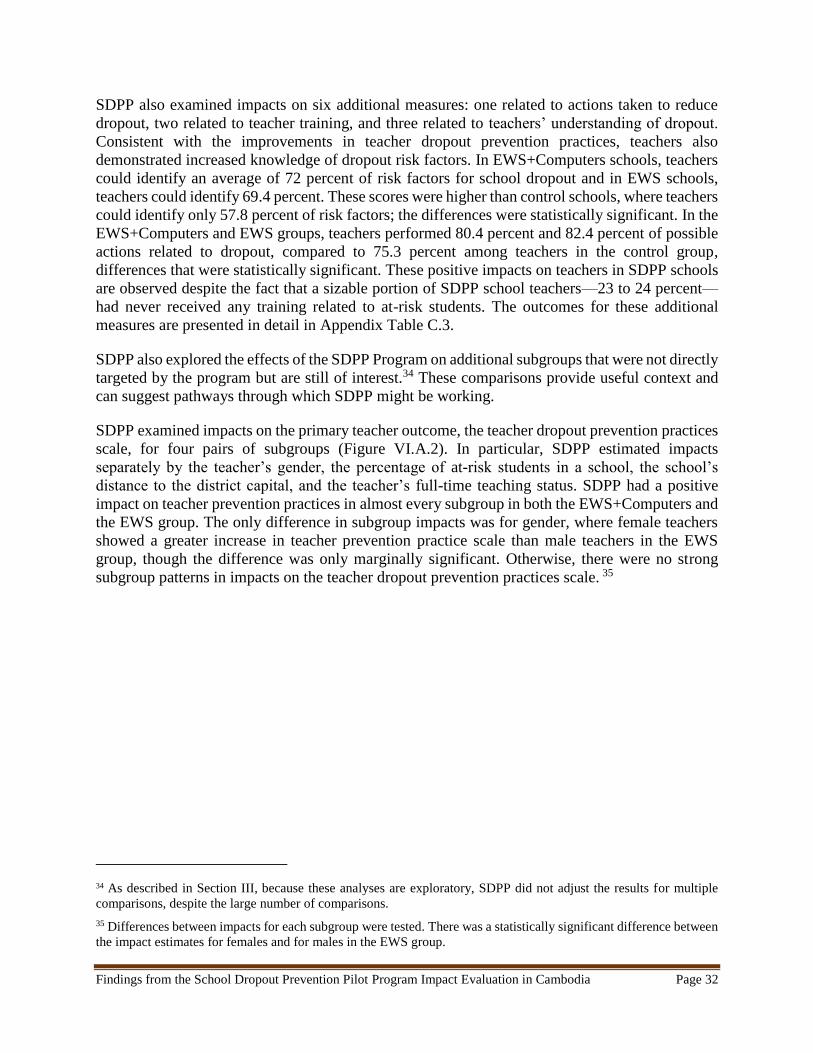
Findings from the School Dropout Prevention Pilot Program Impact Evaluation in Cambodia Page 32
SDPP also examined impacts on six additional measures: one related to actions taken to reduce
dropout, two related to teacher training, and three related to teachers’ understanding of dropout.
Consistent with the improvements in teacher dropout prevention practices, teachers also
demonstrated increased knowledge of dropout risk factors. In EWS+Computers schools, teachers
could identify an average of 72 percent of risk factors for school dropout and in EWS schools,
teachers could identify 69.4 percent. These scores were higher than control schools, where teachers
could identify only 57.8 percent of risk factors; the differences were statistically significant. In the
EWS+Computers and EWS groups, teachers performed 80.4 percent and 82.4 percent of possible
actions related to dropout, compared to 75.3 percent among teachers in the control group,
differences that were statistically significant. These positive impacts on teachers in SDPP schools
are observed despite the fact that a sizable portion of SDPP school teachers—23 to 24 percent—
had never received any training related to at-risk students. The outcomes for these additional
measures are presented in detail in Appendix Table C.3.
SDPP also explored the effects of the SDPP Program on additional subgroups that were not directly
targeted by the program but are still of interest.34 These comparisons provide useful context and
can suggest pathways through which SDPP might be working.
SDPP examined impacts on the primary teacher outcome, the teacher dropout prevention practices
scale, for four pairs of subgroups (Figure VI.A.2). In particular, SDPP estimated impacts
separately by the teacher’s gender, the percentage of at-risk students in a school, the school’s
distance to the district capital, and the teacher’s full-time teaching status. SDPP had a positive
impact on teacher prevention practices in almost every subgroup in both the EWS+Computers and
the EWS group. The only difference in subgroup impacts was for gender, where female teachers
showed a greater increase in teacher prevention practice scale than male teachers in the EWS
group, though the difference was only marginally significant. Otherwise, there were no strong
subgroup patterns in impacts on the teacher dropout prevention practices scale. 35
34 As described in Section III, because these analyses are exploratory, SDPP did not adjust the results for multiple
comparisons, despite the large number of comparisons.
35 Differences between impacts for each subgroup were tested. There was a statistically significant difference between
the impact estimates for females and for males in the EWS group.
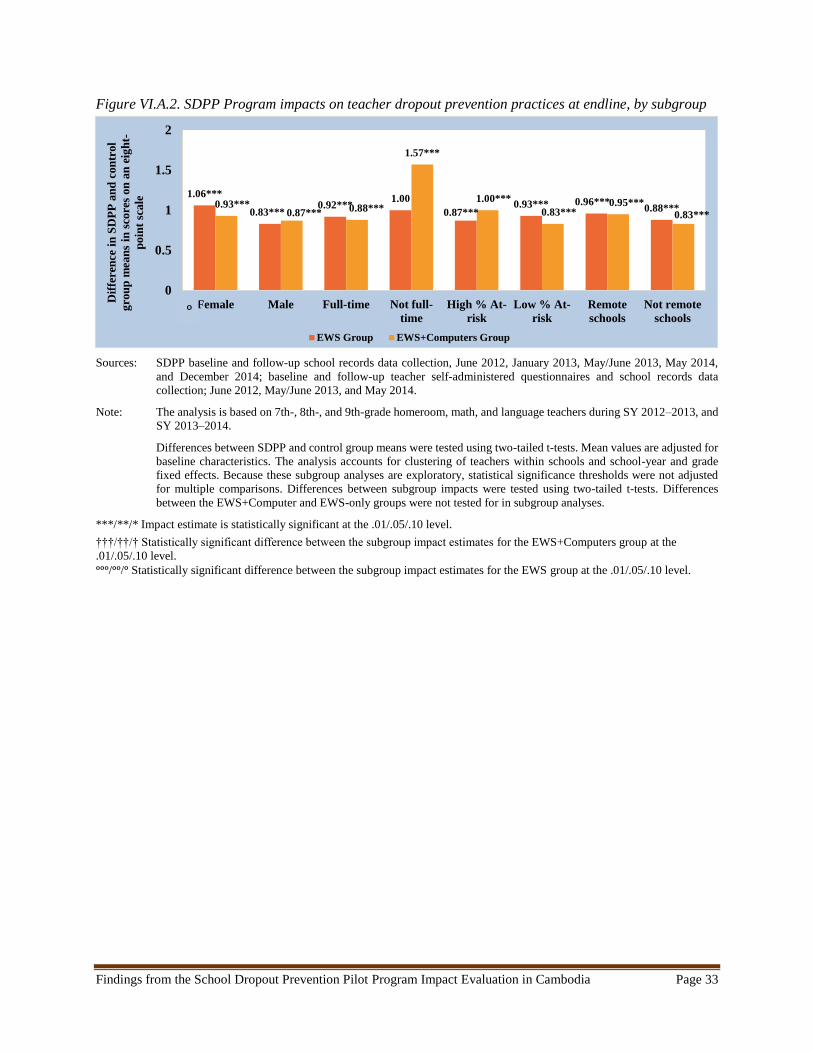
Findings from the School Dropout Prevention Pilot Program Impact Evaluation in Cambodia Page 33
Figure VI.A.2. SDPP Program impacts on teacher dropout prevention practices at endline, by subgroup
Sources: SDPP baseline and follow-up school records data collection, June 2012, January 2013, May/June 2013, May 2014,
and December 2014; baseline and follow-up teacher self-administered questionnaires and school records data
collection; June 2012, May/June 2013, and May 2014.
Note: The analysis is based on 7th-, 8th-, and 9th-grade homeroom, math, and language teachers during SY 2012–2013, and
SY 2013–2014.
Differences between SDPP and control group means were tested using two-tailed t-tests. Mean values are adjusted for
baseline characteristics. The analysis accounts for clustering of teachers within schools and school-year and grade
fixed effects. Because these subgroup analyses are exploratory, statistical significance thresholds were not adjusted
for multiple comparisons. Differences between subgroup impacts were tested using two-tailed t-tests. Differences
between the EWS+Computer and EWS-only groups were not tested for in subgroup analyses.
***/**/* Impact estimate is statistically significant at the .01/.05/.10 level.
†††/††/† Statistically significant difference between the subgroup impact estimates for the EWS+Computers group at the
.01/.05/.10 level.
ᵒᵒᵒ/ᵒᵒ/ᵒ Statistically significant difference between the subgroup impact estimates for the EWS group at the .01/.05/.10 level.
1.06***
0.83***0.92***
1.00
0.87***0.93*** 0.96***
0.88***0.93***0.87*** 0.88***
1.57***
1.00***
0.83***0.95***
0.83***
0
0.5
1
1.5
2
Female Male Full-time Not full-
time
High % At-
risk
Low % At-
risk
Remote
schools
Not remote
schools
Dif
fere
nce
in
SD
PP
an
d c
on
trol
gro
up
mea
ns
in s
core
s on
an
eig
ht-
poin
t sc
ale
EWS Group EWS+Computers Group
ᵒ
Findings from the School Dropout Prevention Pilot Program Impact Evaluation in Cambodia Page 34
Tenacious Teacher Keeps Student in School
Now that teachers in SDPP schools are armed with a
new approach to keeping at-risk students in school, they
see they can make a big difference. Even their students
can see the impact their teachers are having. Chantha
Raksmei is one student who credits the efforts of his
teacher, Phoeurn Samphors, to keeping him in school.
“I’m very happy that I could come to class again and I
commit to completing secondary school,” says
Raksmei.
A Grade 7 student at Banteay Kraing Secondary School
in Cambodia, Raksmei had never found school easy. He
struggled for years. At age 16, he had repeated two
grades and now was older than his classmates.
Discouraged, he now missed school frequently.
Samphors, his teacher, knew Raksmei was on a fast
track to dropping out of school, but he also knew what
he could do to prevent that from happening.
Samphors had received Early Warning System (EWS)
training, so he was able to identify Raksmei as at-risk of
dropping out of school. When he noticed all of Raksmei’s absences, he immediately sent a letter
to Raksmei’s parents to let them know their son was missing school. He followed up the letter
with a phone call, but nothing changed. After sharing Raksmei’s story during a school case
management meeting to discuss at-risk students, Samphors planned for the next step in the EWS
process.
Samphors visited Raksmei’s home to find out what was going on and come up with a plan with
his parents to keep Raksmei in school. Raksmei’s mother was stunned to see her son’s teacher
at the door. “At first I wondered why the teacher visited my home, and then I realized that it
must have been about my son’s absences,” says Raksmei’s mother. She explained she needed
her son to watch the family’s cattle while his father was away working as a taxi driver. It was
simply a matter of supporting the family’s survival; she would not send her son back to school.
Samphors wasn’t about to give up. He and the school director, accompanied by a member of the
PTA, visited Raksmei’s home once again. They told Raksmei’s mother they understood her
situation, but urged her to reconsider since the family would much better off if her son received
a good education. They asked her to pass the message to Raksmei’s father in hopes of changing
their decision. She promised she would discuss it with her husband and would ask him to visit
the school the next time he was home. Later that week, Raksmei’s father came to meet with
Samphors and the school director, and together they came up with a plan for Raksmei to stay in
school.
“If his teacher, school director and PTA member had not visited my home and advised my
family, I would have let my son drop out of school,” says Raksmei’s father. Raksmei is only one
of many other at-risk students who are in school today because of a tenacious teacher and others
who put dropout prevention steps into practice. At Banteay Kraing, the school director noted
the dropout rate declined precipitously.
Teachers in Cambodia persistently followed
EWS steps to reduce dropout in their
schools.
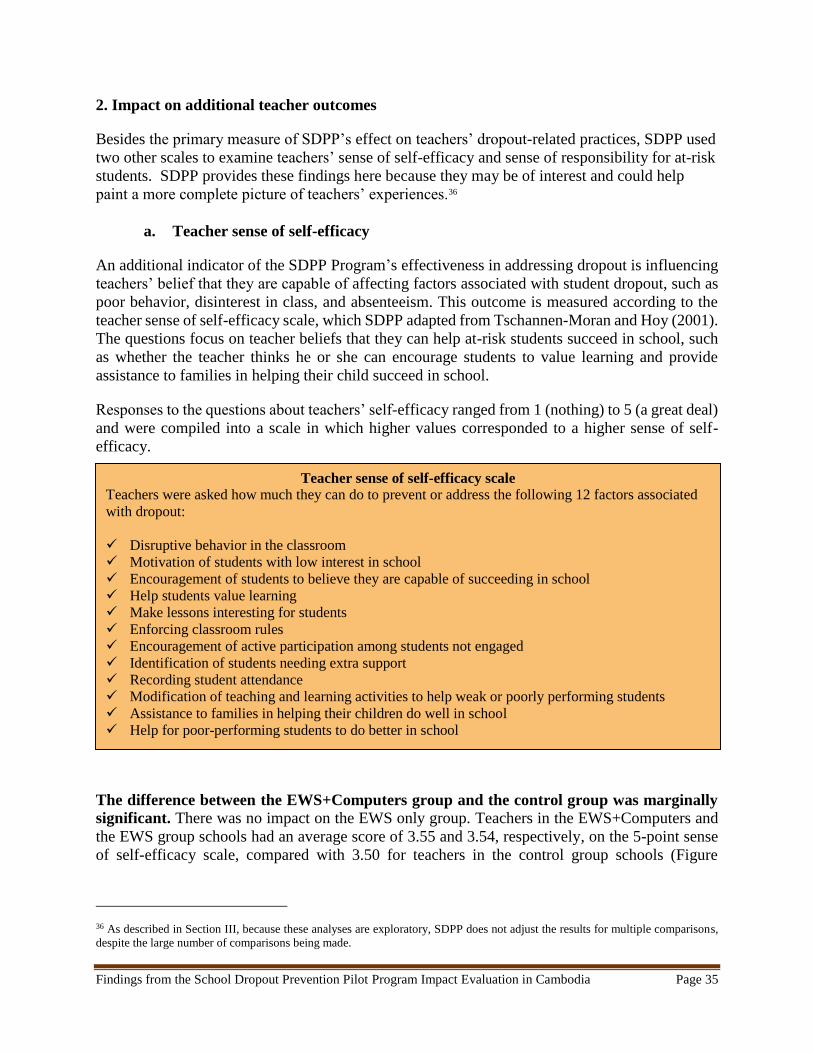
Findings from the School Dropout Prevention Pilot Program Impact Evaluation in Cambodia Page 35
2. Impact on additional teacher outcomes
Besides the primary measure of SDPP’s effect on teachers’ dropout-related practices, SDPP used
two other scales to examine teachers’ sense of self-efficacy and sense of responsibility for at-risk
students. SDPP provides these findings here because they may be of interest and could help
paint a more complete picture of teachers’ experiences.36
a. Teacher sense of self-efficacy
An additional indicator of the SDPP Program’s effectiveness in addressing dropout is influencing
teachers’ belief that they are capable of affecting factors associated with student dropout, such as
poor behavior, disinterest in class, and absenteeism. This outcome is measured according to the
teacher sense of self-efficacy scale, which SDPP adapted from Tschannen-Moran and Hoy (2001).
The questions focus on teacher beliefs that they can help at-risk students succeed in school, such
as whether the teacher thinks he or she can encourage students to value learning and provide
assistance to families in helping their child succeed in school.
Responses to the questions about teachers’ self-efficacy ranged from 1 (nothing) to 5 (a great deal)
and were compiled into a scale in which higher values corresponded to a higher sense of self-
efficacy.
The difference between the EWS+Computers group and the control group was marginally
significant. There was no impact on the EWS only group. Teachers in the EWS+Computers and
the EWS group schools had an average score of 3.55 and 3.54, respectively, on the 5-point sense
of self-efficacy scale, compared with 3.50 for teachers in the control group schools (Figure
36 As described in Section III, because these analyses are exploratory, SDPP does not adjust the results for multiple comparisons,
despite the large number of comparisons being made.
Teacher sense of self-efficacy scale Teachers were asked how much they can do to prevent or address the following 12 factors associated
with dropout:
Disruptive behavior in the classroom
Motivation of students with low interest in school
Encouragement of students to believe they are capable of succeeding in school
Help students value learning
Make lessons interesting for students
Enforcing classroom rules
Encouragement of active participation among students not engaged
Identification of students needing extra support
Recording student attendance
Modification of teaching and learning activities to help weak or poorly performing students
Assistance to families in helping their children do well in school
Help for poor-performing students to do better in school
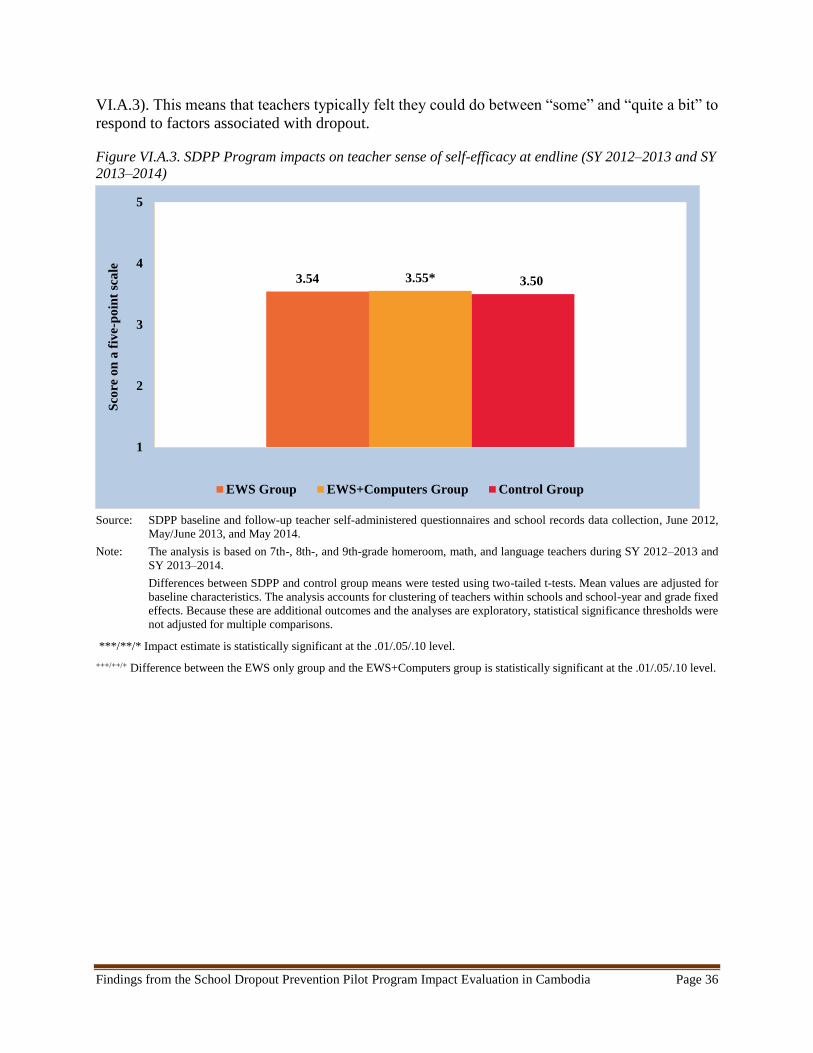
Findings from the School Dropout Prevention Pilot Program Impact Evaluation in Cambodia Page 36
VI.A.3). This means that teachers typically felt they could do between “some” and “quite a bit” to
respond to factors associated with dropout.
Figure VI.A.3. SDPP Program impacts on teacher sense of self-efficacy at endline (SY 2012–2013 and SY
2013–2014)
Source: SDPP baseline and follow-up teacher self-administered questionnaires and school records data collection, June 2012,
May/June 2013, and May 2014.
Note: The analysis is based on 7th-, 8th-, and 9th-grade homeroom, math, and language teachers during SY 2012–2013 and
SY 2013–2014.
Differences between SDPP and control group means were tested using two-tailed t-tests. Mean values are adjusted for
baseline characteristics. The analysis accounts for clustering of teachers within schools and school-year and grade fixed
effects. Because these are additional outcomes and the analyses are exploratory, statistical significance thresholds were
not adjusted for multiple comparisons.
***/**/* Impact estimate is statistically significant at the .01/.05/.10 level.
+++/++/+ Difference between the EWS only group and the EWS+Computers group is statistically significant at the .01/.05/.10 level.
3.54 3.55* 3.50
1
2
3
4
5
Sco
re o
n a
fiv
e-p
oin
t sc
ale
EWS Group EWS+Computers Group Control Group
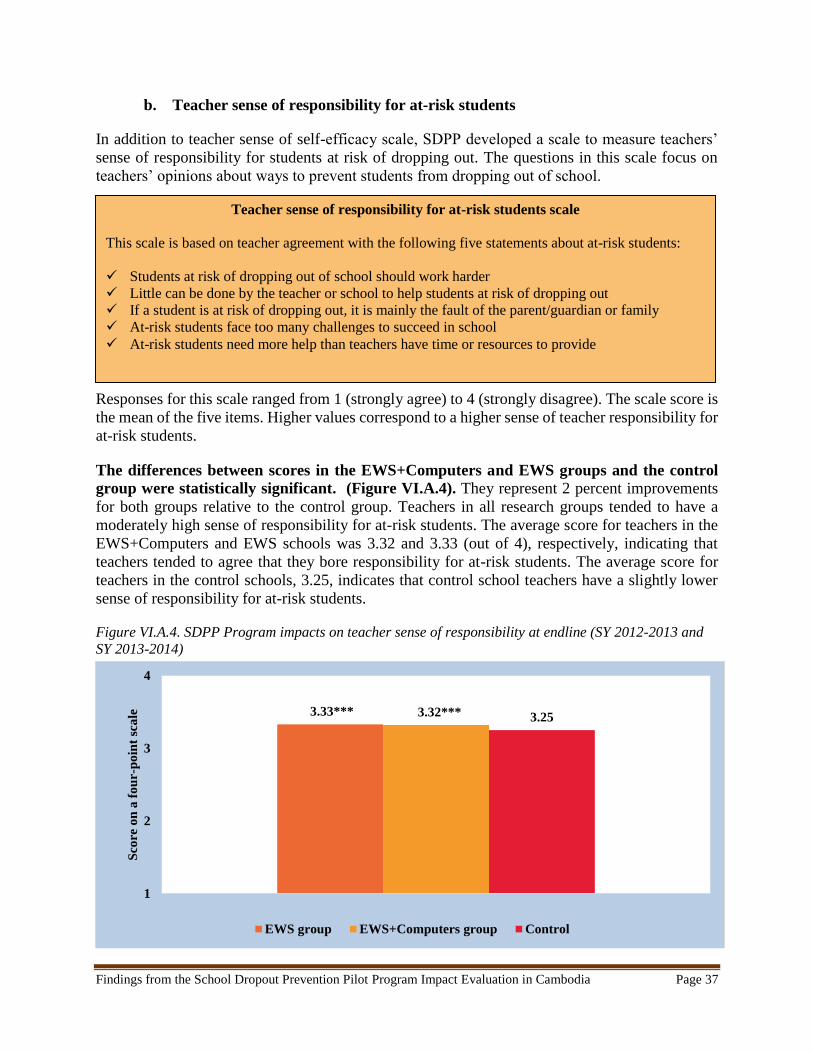
Findings from the School Dropout Prevention Pilot Program Impact Evaluation in Cambodia Page 37
b. Teacher sense of responsibility for at-risk students
In addition to teacher sense of self-efficacy scale, SDPP developed a scale to measure teachers’
sense of responsibility for students at risk of dropping out. The questions in this scale focus on
teachers’ opinions about ways to prevent students from dropping out of school.
Responses for this scale ranged from 1 (strongly agree) to 4 (strongly disagree). The scale score is
the mean of the five items. Higher values correspond to a higher sense of teacher responsibility for
at-risk students.
The differences between scores in the EWS+Computers and EWS groups and the control
group were statistically significant. (Figure VI.A.4). They represent 2 percent improvements
for both groups relative to the control group. Teachers in all research groups tended to have a
moderately high sense of responsibility for at-risk students. The average score for teachers in the
EWS+Computers and EWS schools was 3.32 and 3.33 (out of 4), respectively, indicating that
teachers tended to agree that they bore responsibility for at-risk students. The average score for
teachers in the control schools, 3.25, indicates that control school teachers have a slightly lower
sense of responsibility for at-risk students.
Figure VI.A.4. SDPP Program impacts on teacher sense of responsibility at endline (SY 2012-2013 and
SY 2013-2014)
3.33*** 3.32*** 3.25
1
2
3
4
Sco
re o
n a
fo
ur-p
oin
t sc
ale
EWS group EWS+Computers group Control
Teacher sense of responsibility for at-risk students scale
This scale is based on teacher agreement with the following five statements about at-risk students:
Students at risk of dropping out of school should work harder
Little can be done by the teacher or school to help students at risk of dropping out
If a student is at risk of dropping out, it is mainly the fault of the parent/guardian or family
At-risk students face too many challenges to succeed in school
At-risk students need more help than teachers have time or resources to provide
Findings from the School Dropout Prevention Pilot Program Impact Evaluation in Cambodia Page 38
Source: SDPP baseline and follow-up teacher self-administered questionnaires and school records data collection, June 2012,
May/June 2013, and May 2014.
Note: The analysis is based on 7th-, 8th-, and 9th-grade homeroom, math, and language teachers during SY 2012–2013 and
SY 2013–2014.
Differences between SDPP and control group means were tested using two-tailed t-tests. Mean values are adjusted for
baseline characteristics. The analysis accounts for clustering of teachers within schools and school-year and grade fixed
effects. Because these are additional outcomes and the analyses are exploratory, statistical significance thresholds were
not adjusted for multiple comparisons.
***/**/* Impact estimate is statistically significant at the .01/.05/.10 level.
+++/++/+ Difference between the EWS only group and the EWS+Computers group is statistically significant at the .01/.05/.10 level.
The moderately high scores on both the teacher sense of responsibility scale and the teacher sense
of self-efficacy scale indicate that teachers feel responsible for at-risk students, and that they have
some ability to address factors associated with dropout. SDPP presents additional information
about the findings for additional teacher outcomes and for administrators in Appendix C.

Findings from the School Dropout Prevention Pilot Program Impact Evaluation in Cambodia Page 39
EWS Fosters Teacher’s Sense of Responsibility for Her Students
Since SDPP came to work in my school I’ve been completing my school records regularly,”
says Tith Socheata, a homeroom teacher at Veal Pong Secondary School in Cambodia.
Socheata is one of 15 homeroom
teachers at Veal Pong trained by SDPP to
use an Early Warning System (EWS) in
her classroom to identify and support
students at-risk of dropping out of
school. She explains how the EWS has
made a difference in her classroom and
those of her fellow homeroom teachers.
“Before SDPP we didn’t fill in the school
documents very well.” But all that has
changed.
Low salaries have forced many school
personnel to work additional jobs to
supplement their family income. These
second jobs compete with the time
teachers should be completing work at
school. Tasks that teachers don’t
consider important, particularly
administrative duties like keeping up
their school records, are frequently the
first tasks to fall by the wayside when teachers take on second jobs.
However, since the SDPP Program began working with her school, Socheata now sees how
important these tasks are and why she should do them every day. It has changed the way she
does her job. “SDPP made me more aware of how important it is to complete all student
documents such as student attendance lists, study record books, tracking books and scoring
books. I used to occasionally check on my student attendance list, but now I know I should
record this regularly.”
Teachers have learned from SDPP that these administrative tasks are not just bureaucratic
motions, but critical activities for monitoring students and keeping them in school. The Early
Warning System helps schools to record, track, and monitor students’ attendance, behavior,
and course performance. It enables teachers to use this information to identify and then follow
up with students who are at risk of dropping out. “It’s not new, but I understand now how this
information can be used to help students.. It’s the responsibility of the homeroom teachers
like myself to fill in all school documents accurately and on time. This way I can follow up
with at-risk students,” says Socheata.
Soy Thirin, Director of Veal Pong School, admits the Early Warning System has really
changed the behavior of his homeroom teachers. “It’s not as difficult as it was before to get
my homeroom teachers to keep their student records up to date. They compete to complete
their documents on time,” says Thirin.
Cambodian teachers feel an increased sense of
responsibility for monitoring and following up with at-risk
students.
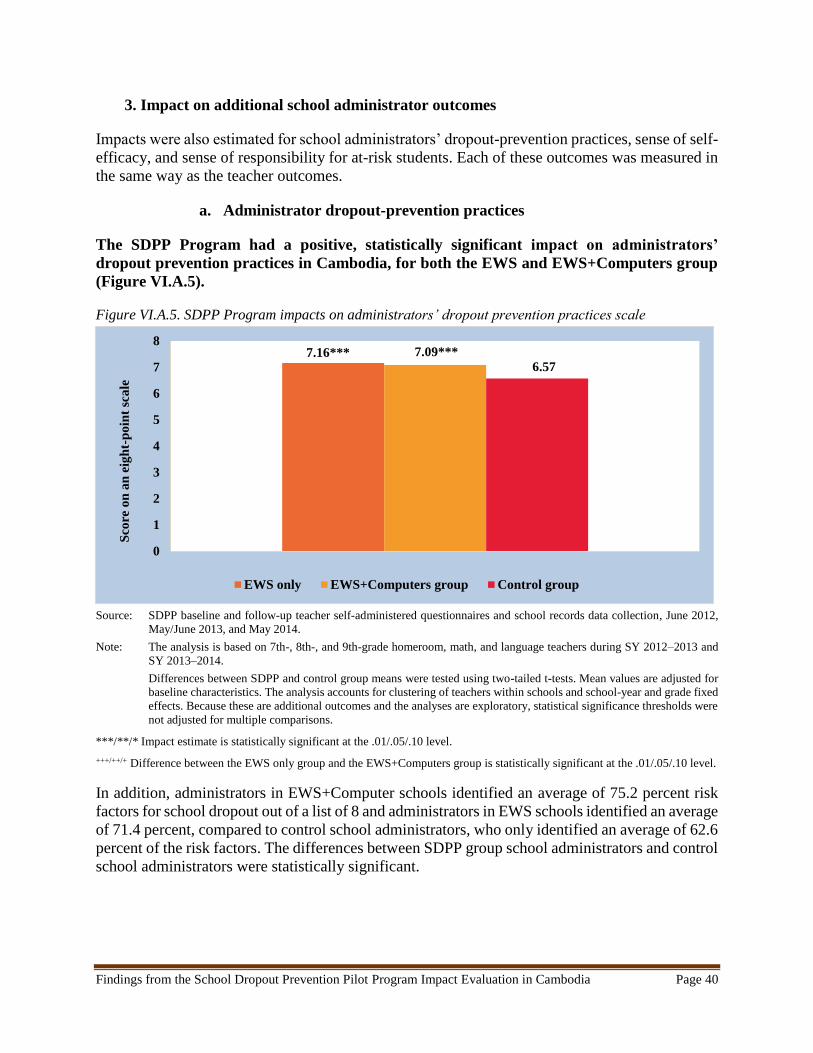
Findings from the School Dropout Prevention Pilot Program Impact Evaluation in Cambodia Page 40
3. Impact on additional school administrator outcomes
Impacts were also estimated for school administrators’ dropout-prevention practices, sense of self-
efficacy, and sense of responsibility for at-risk students. Each of these outcomes was measured in
the same way as the teacher outcomes.
a. Administrator dropout-prevention practices
The SDPP Program had a positive, statistically significant impact on administrators’
dropout prevention practices in Cambodia, for both the EWS and EWS+Computers group
(Figure VI.A.5).
Figure VI.A.5. SDPP Program impacts on administrators’ dropout prevention practices scale
Source: SDPP baseline and follow-up teacher self-administered questionnaires and school records data collection, June 2012,
May/June 2013, and May 2014.
Note: The analysis is based on 7th-, 8th-, and 9th-grade homeroom, math, and language teachers during SY 2012–2013 and
SY 2013–2014.
Differences between SDPP and control group means were tested using two-tailed t-tests. Mean values are adjusted for
baseline characteristics. The analysis accounts for clustering of teachers within schools and school-year and grade fixed
effects. Because these are additional outcomes and the analyses are exploratory, statistical significance thresholds were
not adjusted for multiple comparisons.
***/**/* Impact estimate is statistically significant at the .01/.05/.10 level.
+++/++/+ Difference between the EWS only group and the EWS+Computers group is statistically significant at the .01/.05/.10 level.
In addition, administrators in EWS+Computer schools identified an average of 75.2 percent risk
factors for school dropout out of a list of 8 and administrators in EWS schools identified an average
of 71.4 percent, compared to control school administrators, who only identified an average of 62.6
percent of the risk factors. The differences between SDPP group school administrators and control
school administrators were statistically significant.
7.16*** 7.09***
6.57
0
1
2
3
4
5
6
7
8
Sco
re o
n a
n e
igh
t-p
oin
t sc
ale
EWS only EWS+Computers group Control group
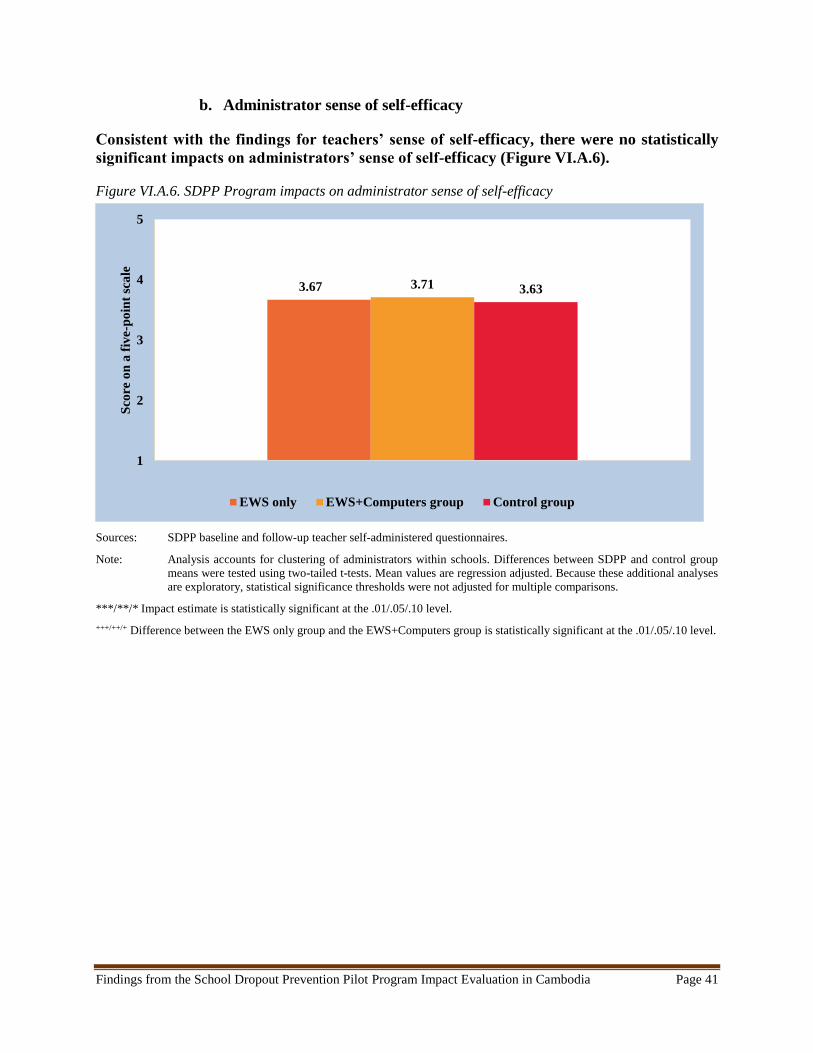
Findings from the School Dropout Prevention Pilot Program Impact Evaluation in Cambodia Page 41
b. Administrator sense of self-efficacy
Consistent with the findings for teachers’ sense of self-efficacy, there were no statistically
significant impacts on administrators’ sense of self-efficacy (Figure VI.A.6).
Figure VI.A.6. SDPP Program impacts on administrator sense of self-efficacy
Sources: SDPP baseline and follow-up teacher self-administered questionnaires.
Note: Analysis accounts for clustering of administrators within schools. Differences between SDPP and control group
means were tested using two-tailed t-tests. Mean values are regression adjusted. Because these additional analyses
are exploratory, statistical significance thresholds were not adjusted for multiple comparisons.
***/**/* Impact estimate is statistically significant at the .01/.05/.10 level.
+++/++/+ Difference between the EWS only group and the EWS+Computers group is statistically significant at the .01/.05/.10 level.
3.67 3.71 3.63
1
2
3
4
5
Sco
re o
n a
fiv
e-p
oin
t sc
ale
EWS only EWS+Computers group Control group
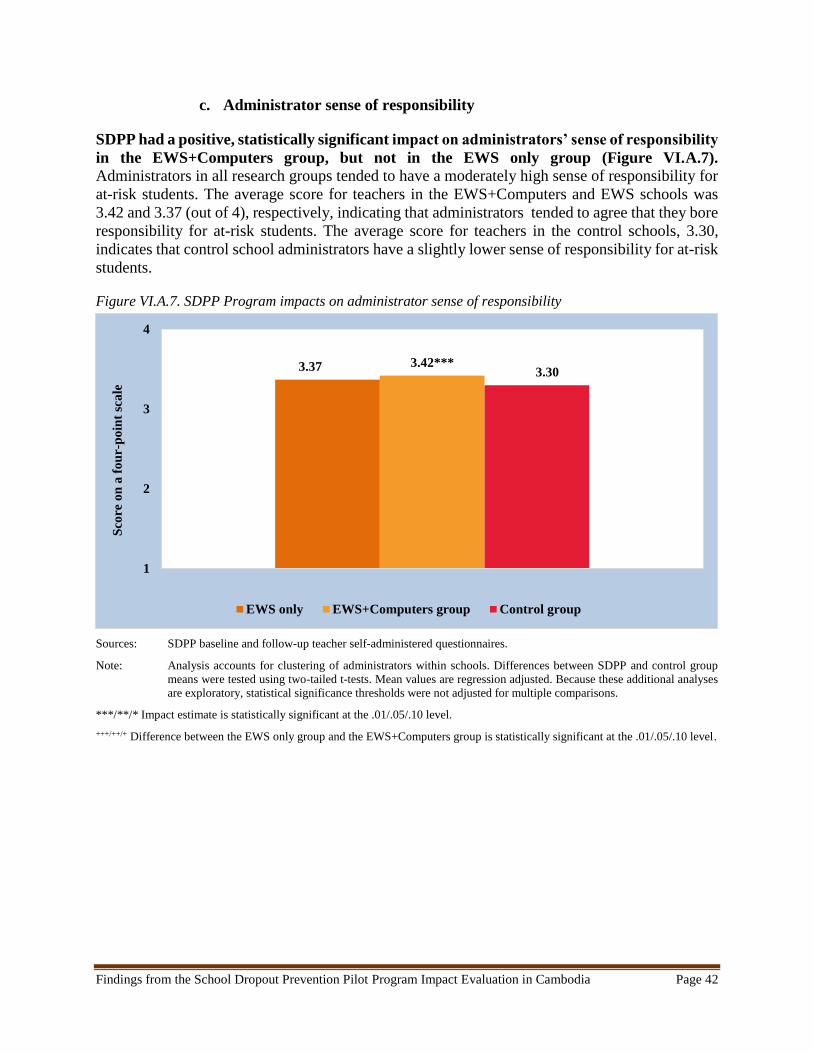
Findings from the School Dropout Prevention Pilot Program Impact Evaluation in Cambodia Page 42
c. Administrator sense of responsibility
SDPP had a positive, statistically significant impact on administrators’ sense of responsibility
in the EWS+Computers group, but not in the EWS only group (Figure VI.A.7).
Administrators in all research groups tended to have a moderately high sense of responsibility for
at-risk students. The average score for teachers in the EWS+Computers and EWS schools was
3.42 and 3.37 (out of 4), respectively, indicating that administrators tended to agree that they bore
responsibility for at-risk students. The average score for teachers in the control schools, 3.30,
indicates that control school administrators have a slightly lower sense of responsibility for at-risk
students.
Figure VI.A.7. SDPP Program impacts on administrator sense of responsibility
Sources: SDPP baseline and follow-up teacher self-administered questionnaires.
Note: Analysis accounts for clustering of administrators within schools. Differences between SDPP and control group
means were tested using two-tailed t-tests. Mean values are regression adjusted. Because these additional analyses
are exploratory, statistical significance thresholds were not adjusted for multiple comparisons.
***/**/* Impact estimate is statistically significant at the .01/.05/.10 level.
+++/++/+ Difference between the EWS only group and the EWS+Computers group is statistically significant at the .01/.05/.10 level.
3.37 3.42***3.30
1
2
3
4
Sco
re o
n a
fo
ur-p
oin
t sc
ale
EWS only EWS+Computers group Control group
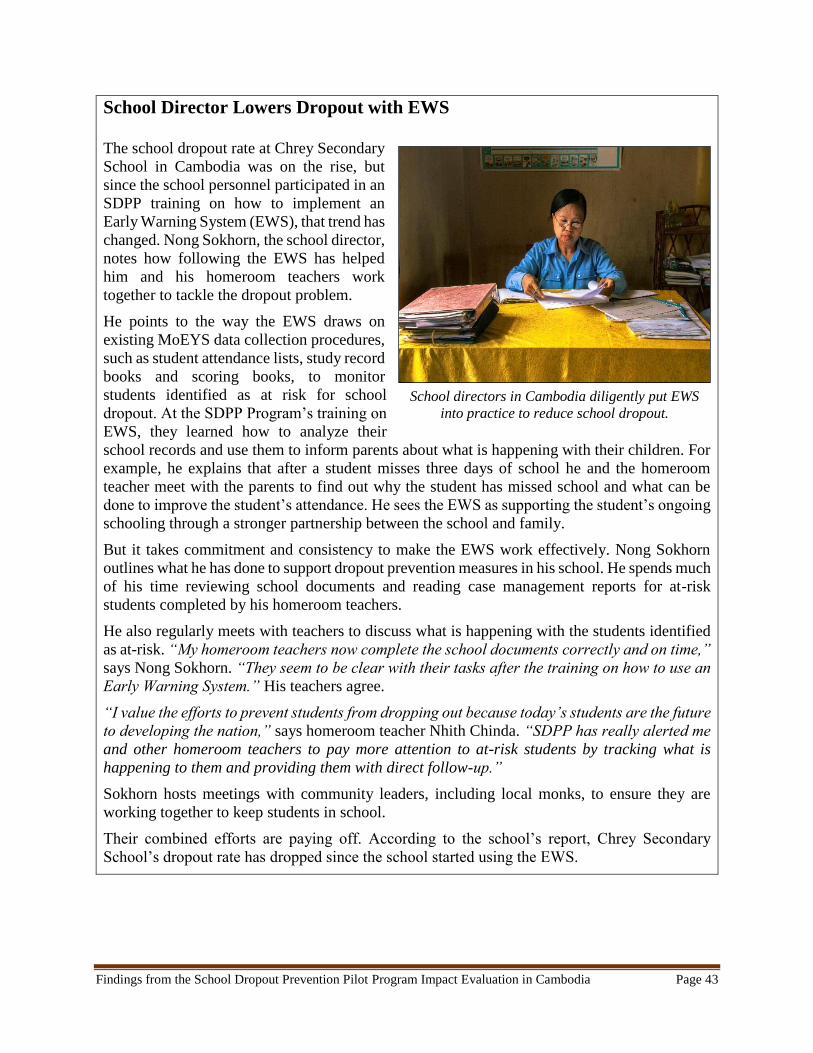
Findings from the School Dropout Prevention Pilot Program Impact Evaluation in Cambodia Page 43
School Director Lowers Dropout with EWS
The school dropout rate at Chrey Secondary
School in Cambodia was on the rise, but
since the school personnel participated in an
SDPP training on how to implement an
Early Warning System (EWS), that trend has
changed. Nong Sokhorn, the school director,
notes how following the EWS has helped
him and his homeroom teachers work
together to tackle the dropout problem.
He points to the way the EWS draws on
existing MoEYS data collection procedures,
such as student attendance lists, study record
books and scoring books, to monitor
students identified as at risk for school
dropout. At the SDPP Program’s training on
EWS, they learned how to analyze their
school records and use them to inform parents about what is happening with their children. For
example, he explains that after a student misses three days of school he and the homeroom
teacher meet with the parents to find out why the student has missed school and what can be
done to improve the student’s attendance. He sees the EWS as supporting the student’s ongoing
schooling through a stronger partnership between the school and family.
But it takes commitment and consistency to make the EWS work effectively. Nong Sokhorn
outlines what he has done to support dropout prevention measures in his school. He spends much
of his time reviewing school documents and reading case management reports for at-risk
students completed by his homeroom teachers.
He also regularly meets with teachers to discuss what is happening with the students identified
as at-risk. “My homeroom teachers now complete the school documents correctly and on time,”
says Nong Sokhorn. “They seem to be clear with their tasks after the training on how to use an
Early Warning System.” His teachers agree.
“I value the efforts to prevent students from dropping out because today’s students are the future
to developing the nation,” says homeroom teacher Nhith Chinda. “SDPP has really alerted me
and other homeroom teachers to pay more attention to at-risk students by tracking what is
happening to them and providing them with direct follow-up.”
Sokhorn hosts meetings with community leaders, including local monks, to ensure they are
working together to keep students in school.
Their combined efforts are paying off. According to the school’s report, Chrey Secondary
School’s dropout rate has dropped since the school started using the EWS.
School directors in Cambodia diligently put EWS
into practice to reduce school dropout.
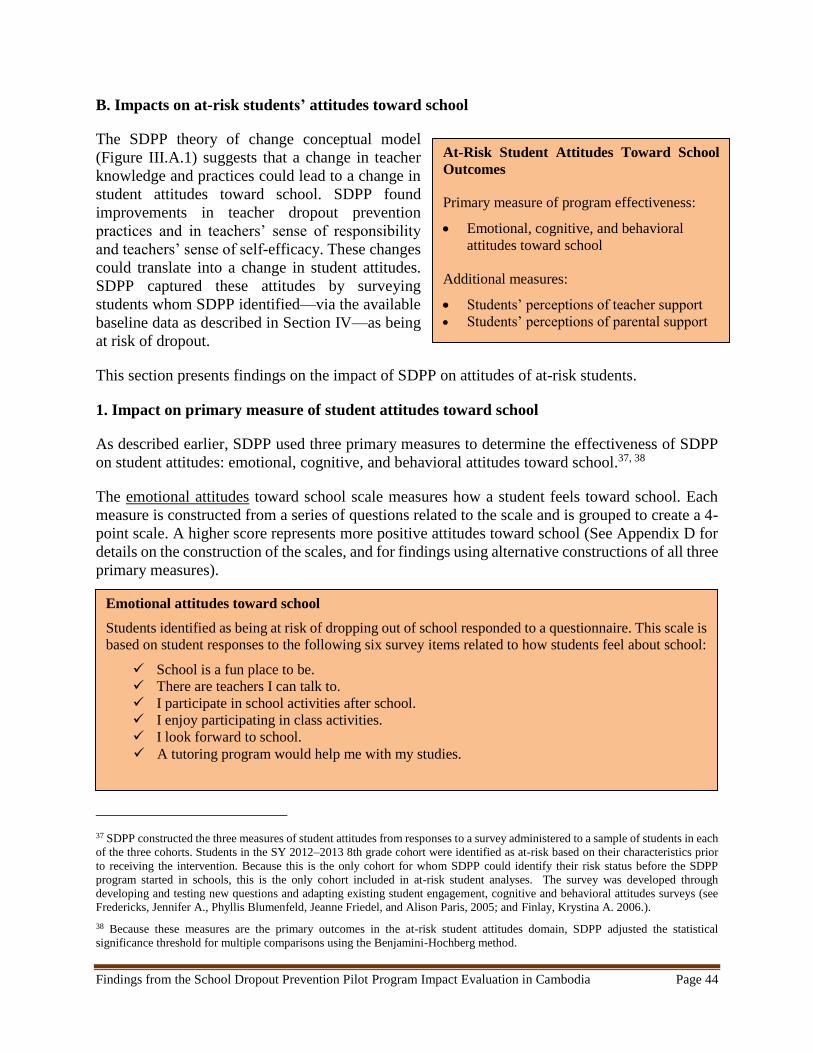
Findings from the School Dropout Prevention Pilot Program Impact Evaluation in Cambodia Page 44
B. Impacts on at-risk students’ attitudes toward school
The SDPP theory of change conceptual model
(Figure III.A.1) suggests that a change in teacher
knowledge and practices could lead to a change in
student attitudes toward school. SDPP found
improvements in teacher dropout prevention
practices and in teachers’ sense of responsibility
and teachers’ sense of self-efficacy. These changes
could translate into a change in student attitudes.
SDPP captured these attitudes by surveying
students whom SDPP identified—via the available
baseline data as described in Section IV—as being
at risk of dropout.
This section presents findings on the impact of SDPP on attitudes of at-risk students.
1. Impact on primary measure of student attitudes toward school
As described earlier, SDPP used three primary measures to determine the effectiveness of SDPP
on student attitudes: emotional, cognitive, and behavioral attitudes toward school.37, 38
The emotional attitudes toward school scale measures how a student feels toward school. Each
measure is constructed from a series of questions related to the scale and is grouped to create a 4-
point scale. A higher score represents more positive attitudes toward school (See Appendix D for
details on the construction of the scales, and for findings using alternative constructions of all three
primary measures).
37 SDPP constructed the three measures of student attitudes from responses to a survey administered to a sample of students in each
of the three cohorts. Students in the SY 2012–2013 8th grade cohort were identified as at-risk based on their characteristics prior
to receiving the intervention. Because this is the only cohort for whom SDPP could identify their risk status before the SDPP
program started in schools, this is the only cohort included in at-risk student analyses. The survey was developed through
developing and testing new questions and adapting existing student engagement, cognitive and behavioral attitudes surveys (see
Fredericks, Jennifer A., Phyllis Blumenfeld, Jeanne Friedel, and Alison Paris, 2005; and Finlay, Krystina A. 2006.).
38 Because these measures are the primary outcomes in the at-risk student attitudes domain, SDPP adjusted the statistical
significance threshold for multiple comparisons using the Benjamini-Hochberg method.
At-Risk Student Attitudes Toward School
Outcomes
Primary measure of program effectiveness:
Emotional, cognitive, and behavioral
attitudes toward school
Additional measures:
Students’ perceptions of teacher support
Students’ perceptions of parental support
Emotional attitudes toward school
Students identified as being at risk of dropping out of school responded to a questionnaire. This scale is
based on student responses to the following six survey items related to how students feel about school:
School is a fun place to be.
There are teachers I can talk to.
I participate in school activities after school.
I enjoy participating in class activities.
I look forward to school.
A tutoring program would help me with my studies.
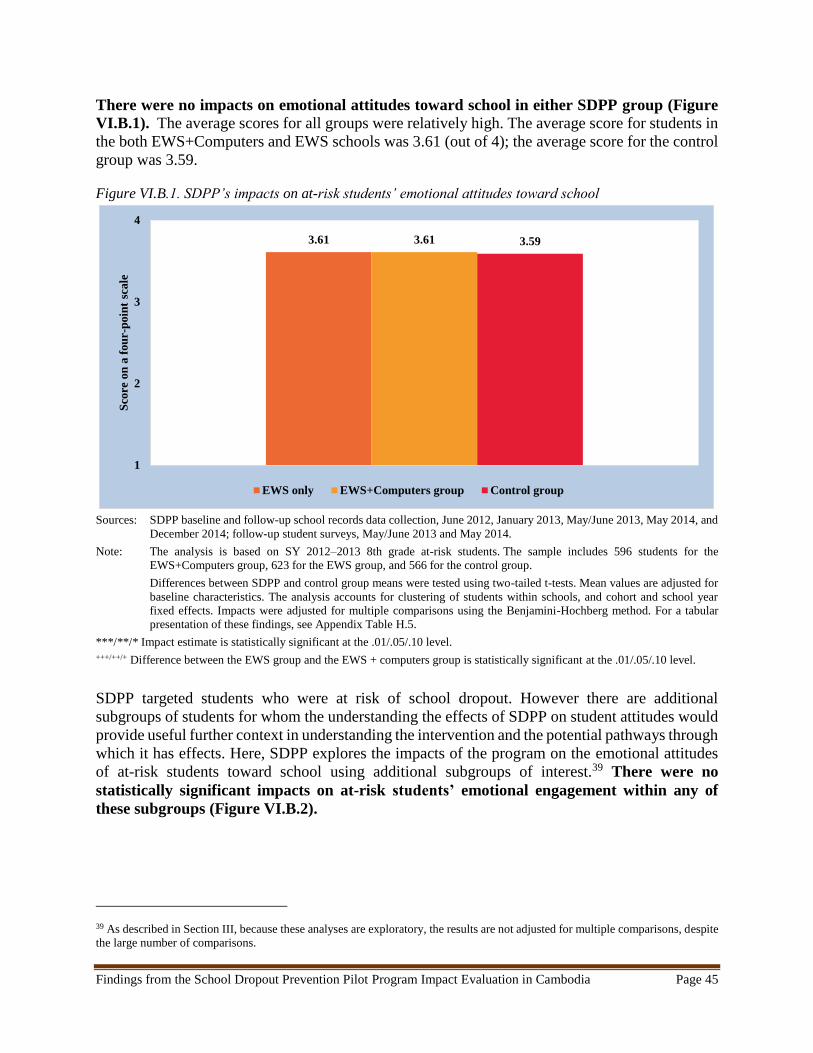
Findings from the School Dropout Prevention Pilot Program Impact Evaluation in Cambodia Page 45
There were no impacts on emotional attitudes toward school in either SDPP group (Figure
VI.B.1). The average scores for all groups were relatively high. The average score for students in
the both EWS+Computers and EWS schools was 3.61 (out of 4); the average score for the control
group was 3.59.
Figure VI.B.1. SDPP’s impacts on at-risk students’ emotional attitudes toward school
Sources: SDPP baseline and follow-up school records data collection, June 2012, January 2013, May/June 2013, May 2014, and
December 2014; follow-up student surveys, May/June 2013 and May 2014.
Note: The analysis is based on SY 2012–2013 8th grade at-risk students. The sample includes 596 students for the
EWS+Computers group, 623 for the EWS group, and 566 for the control group.
Differences between SDPP and control group means were tested using two-tailed t-tests. Mean values are adjusted for
baseline characteristics. The analysis accounts for clustering of students within schools, and cohort and school year
fixed effects. Impacts were adjusted for multiple comparisons using the Benjamini-Hochberg method. For a tabular
presentation of these findings, see Appendix Table H.5.
***/**/* Impact estimate is statistically significant at the .01/.05/.10 level.
+++/++/+ Difference between the EWS group and the EWS + computers group is statistically significant at the .01/.05/.10 level.
SDPP targeted students who were at risk of school dropout. However there are additional
subgroups of students for whom the understanding the effects of SDPP on student attitudes would
provide useful further context in understanding the intervention and the potential pathways through
which it has effects. Here, SDPP explores the impacts of the program on the emotional attitudes
of at-risk students toward school using additional subgroups of interest.39 There were no
statistically significant impacts on at-risk students’ emotional engagement within any of
these subgroups (Figure VI.B.2).
39 As described in Section III, because these analyses are exploratory, the results are not adjusted for multiple comparisons, despite
the large number of comparisons.
3.61 3.61 3.59
1
2
3
4
Sco
re o
n a
fou
r-p
oin
t sc
ale
EWS only EWS+Computers group Control group
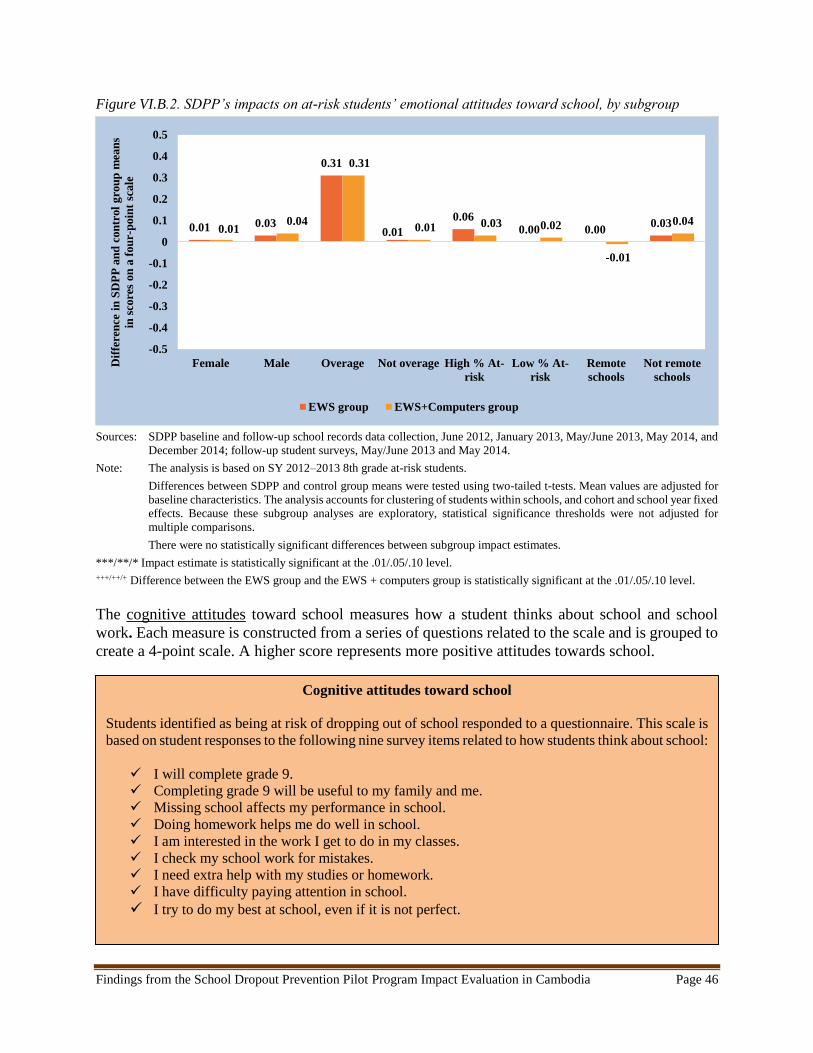
Findings from the School Dropout Prevention Pilot Program Impact Evaluation in Cambodia Page 46
Figure VI.B.2. SDPP’s impacts on at-risk students’ emotional attitudes toward school, by subgroup
Sources: SDPP baseline and follow-up school records data collection, June 2012, January 2013, May/June 2013, May 2014, and
December 2014; follow-up student surveys, May/June 2013 and May 2014.
Note: The analysis is based on SY 2012–2013 8th grade at-risk students.
Differences between SDPP and control group means were tested using two-tailed t-tests. Mean values are adjusted for
baseline characteristics. The analysis accounts for clustering of students within schools, and cohort and school year fixed
effects. Because these subgroup analyses are exploratory, statistical significance thresholds were not adjusted for
multiple comparisons.
There were no statistically significant differences between subgroup impact estimates.
***/**/* Impact estimate is statistically significant at the .01/.05/.10 level.
+++/++/+ Difference between the EWS group and the EWS + computers group is statistically significant at the .01/.05/.10 level.
The cognitive attitudes toward school measures how a student thinks about school and school
work. Each measure is constructed from a series of questions related to the scale and is grouped to
create a 4-point scale. A higher score represents more positive attitudes towards school.
0.01 0.03
0.31
0.01
0.060.00 0.00
0.030.01
0.04
0.31
0.01 0.03 0.02
-0.01
0.04
-0.5
-0.4
-0.3
-0.2
-0.1
0
0.1
0.2
0.3
0.4
0.5
Female Male Overage Not overage High % At-
risk
Low % At-
risk
Remote
schools
Not remote
schools
Dif
fere
nce
in
SD
PP
an
d c
on
trol
gro
up
mea
ns
in s
core
s on
a f
ou
r-p
oin
t sc
ale
EWS group EWS+Computers group
Cognitive attitudes toward school
Students identified as being at risk of dropping out of school responded to a questionnaire. This scale is
based on student responses to the following nine survey items related to how students think about school:
I will complete grade 9.
Completing grade 9 will be useful to my family and me.
Missing school affects my performance in school.
Doing homework helps me do well in school.
I am interested in the work I get to do in my classes.
I check my school work for mistakes.
I need extra help with my studies or homework.
I have difficulty paying attention in school.
I try to do my best at school, even if it is not perfect.
Findings from the School Dropout Prevention Pilot Program Impact Evaluation in Cambodia Page 47
Scores were lower on the cognitive attitudes toward school scale than on the other two scales, with
scores between 3.02 and 3.04, but there were no statistically significant impacts of SDPP on at-
risk students’ cognitive attitudes toward school. (Figure VI.B.3).
Figure VI.B.3. SDPP’s impacts on at-risk students’ cognitive attitudes toward school
Sources: SDPP baseline and follow-up school records data collection, June 2012, January 2013, May/June 2013, May 2014, and
December 2014; follow-up student surveys, May/June 2013 and May 2014.
Note: The analysis is based on SY 2012–2013 8th grade at-risk students. The sample includes 596 students for the
EWS+Computers group, 623 for the EWS group, and 566 for the control group.
Differences between SDPP and control group means were tested using two-tailed t-tests. Mean values are adjusted for
baseline characteristics. The analysis accounts for clustering of students within schools, and cohort and school year
fixed effects. Impacts were adjusted for multiple comparisons using the Benjamini-Hochberg method. For a tabular
presentation of these findings, see Appendix Table H.5.
***/**/* Impact estimate is statistically significant at the .01/.05/.10 level.
+++/++/+ Difference between the EWS group and the EWS + computers group is statistically significant at the .01/.05/.10 level.
As with emotional attitudes toward school, we explore the impacts of SDPP on the cognitive
attitudes of at-risk students using additional subgroups of interest. SDPP found that the SDPP
Program had a small, marginally significant impact on cognitive attitudes toward school for
over-age students in the EWS+Computers group (Figure VI.B.4).
3.03 3.04 3.02
1
2
3
4
Sco
re o
n a
fo
ur-p
oin
t sc
ale
EWS only EWS+Computers group Control group
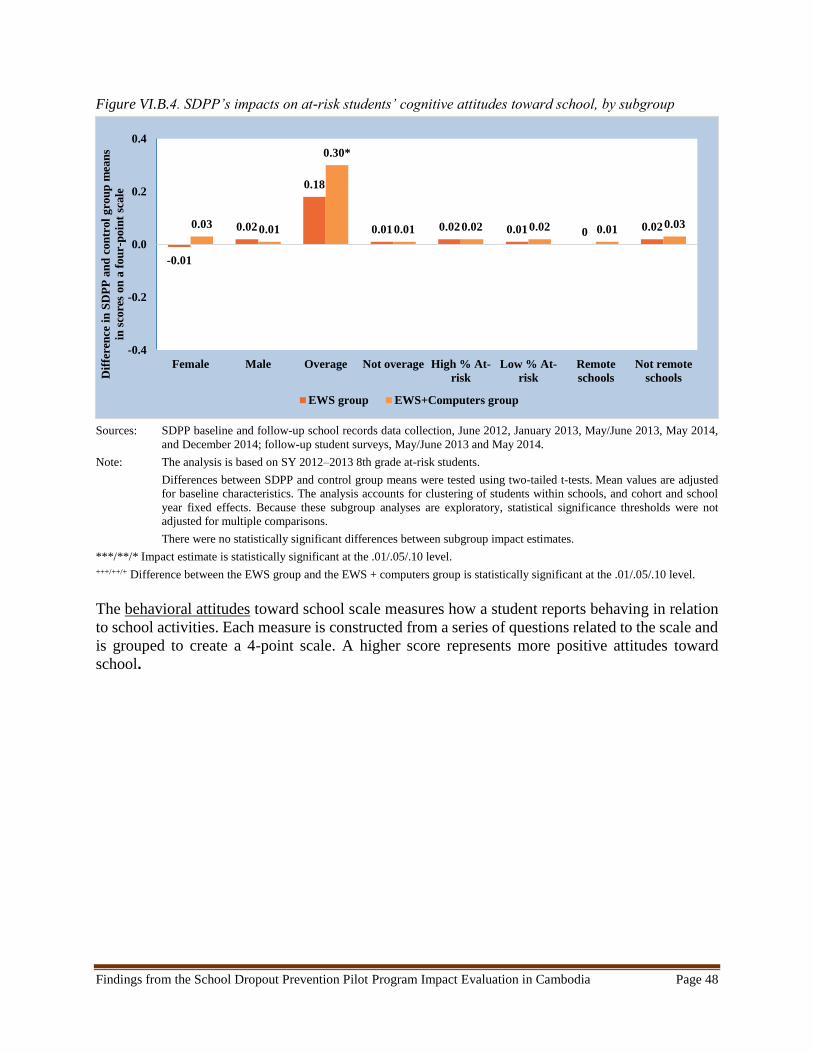
Findings from the School Dropout Prevention Pilot Program Impact Evaluation in Cambodia Page 48
Figure VI.B.4. SDPP’s impacts on at-risk students’ cognitive attitudes toward school, by subgroup
Sources: SDPP baseline and follow-up school records data collection, June 2012, January 2013, May/June 2013, May 2014,
and December 2014; follow-up student surveys, May/June 2013 and May 2014.
Note: The analysis is based on SY 2012–2013 8th grade at-risk students.
Differences between SDPP and control group means were tested using two-tailed t-tests. Mean values are adjusted
for baseline characteristics. The analysis accounts for clustering of students within schools, and cohort and school
year fixed effects. Because these subgroup analyses are exploratory, statistical significance thresholds were not
adjusted for multiple comparisons.
There were no statistically significant differences between subgroup impact estimates.
***/**/* Impact estimate is statistically significant at the .01/.05/.10 level.
+++/++/+ Difference between the EWS group and the EWS + computers group is statistically significant at the .01/.05/.10 level.
The behavioral attitudes toward school scale measures how a student reports behaving in relation
to school activities. Each measure is constructed from a series of questions related to the scale and
is grouped to create a 4-point scale. A higher score represents more positive attitudes toward
school.
-0.01
0.02
0.18
0.01 0.02 0.01 0 0.020.03 0.01
0.30*
0.01 0.02 0.02 0.01 0.03
-0.4
-0.2
0.0
0.2
0.4
Female Male Overage Not overage High % At-
risk
Low % At-
risk
Remote
schools
Not remote
schoolsDif
fere
nce
in
SD
PP
an
d c
on
trol
gro
up
mea
ns
in s
core
s on
a f
ou
r-p
oin
t sc
ale
EWS group EWS+Computers group
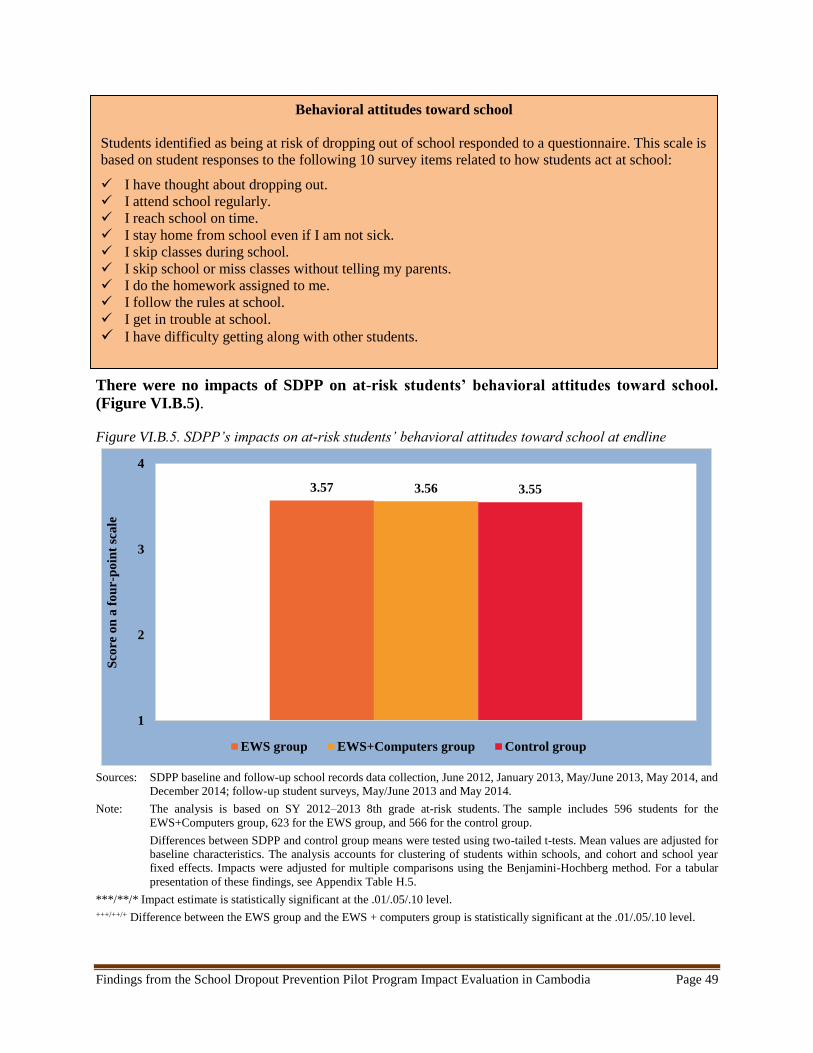
Findings from the School Dropout Prevention Pilot Program Impact Evaluation in Cambodia Page 49
There were no impacts of SDPP on at-risk students’ behavioral attitudes toward school.
(Figure VI.B.5).
Figure VI.B.5. SDPP’s impacts on at-risk students’ behavioral attitudes toward school at endline
Sources: SDPP baseline and follow-up school records data collection, June 2012, January 2013, May/June 2013, May 2014, and
December 2014; follow-up student surveys, May/June 2013 and May 2014.
Note: The analysis is based on SY 2012–2013 8th grade at-risk students. The sample includes 596 students for the
EWS+Computers group, 623 for the EWS group, and 566 for the control group.
Differences between SDPP and control group means were tested using two-tailed t-tests. Mean values are adjusted for
baseline characteristics. The analysis accounts for clustering of students within schools, and cohort and school year
fixed effects. Impacts were adjusted for multiple comparisons using the Benjamini-Hochberg method. For a tabular
presentation of these findings, see Appendix Table H.5.
***/**/* Impact estimate is statistically significant at the .01/.05/.10 level.
+++/++/+ Difference between the EWS group and the EWS + computers group is statistically significant at the .01/.05/.10 level.
3.57 3.56 3.55
1
2
3
4
Sco
re o
n a
fo
ur-p
oin
t sc
ale
EWS group EWS+Computers group Control group
Behavioral attitudes toward school
Students identified as being at risk of dropping out of school responded to a questionnaire. This scale is
based on student responses to the following 10 survey items related to how students act at school:
I have thought about dropping out.
I attend school regularly.
I reach school on time.
I stay home from school even if I am not sick.
I skip classes during school.
I skip school or miss classes without telling my parents.
I do the homework assigned to me.
I follow the rules at school.
I get in trouble at school.
I have difficulty getting along with other students.
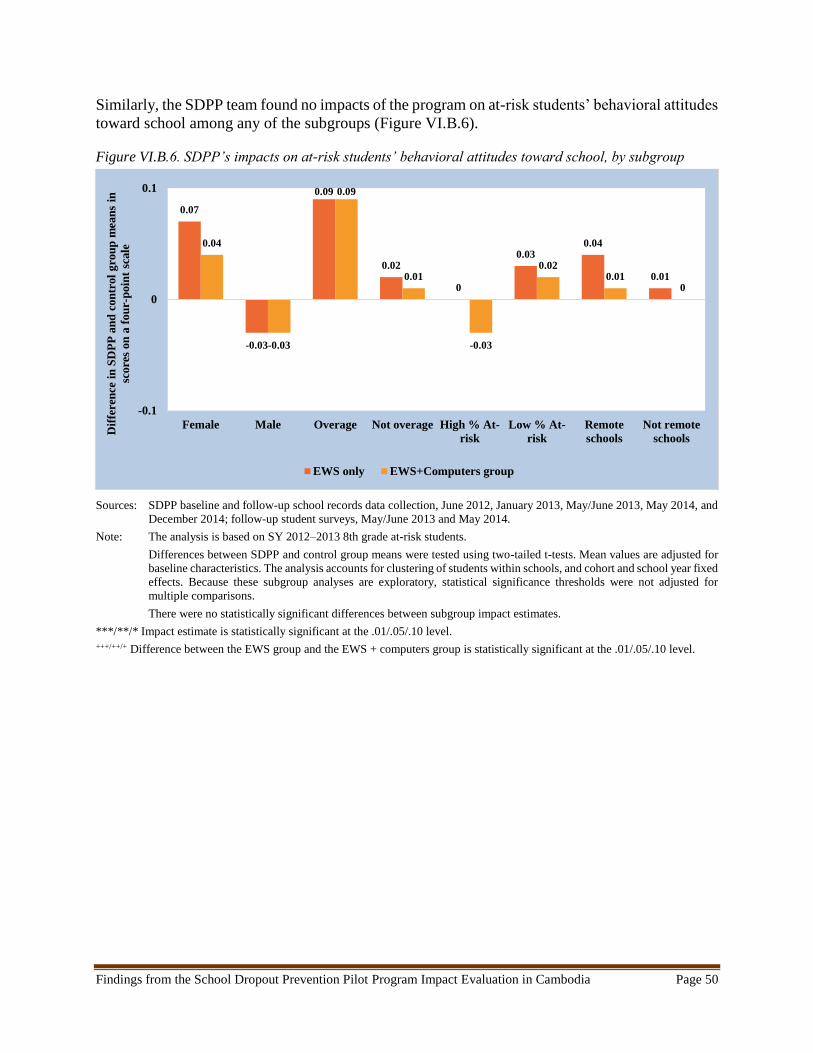
Findings from the School Dropout Prevention Pilot Program Impact Evaluation in Cambodia Page 50
Similarly, the SDPP team found no impacts of the program on at-risk students’ behavioral attitudes
toward school among any of the subgroups (Figure VI.B.6).
Figure VI.B.6. SDPP’s impacts on at-risk students’ behavioral attitudes toward school, by subgroup
Sources: SDPP baseline and follow-up school records data collection, June 2012, January 2013, May/June 2013, May 2014, and
December 2014; follow-up student surveys, May/June 2013 and May 2014.
Note: The analysis is based on SY 2012–2013 8th grade at-risk students.
Differences between SDPP and control group means were tested using two-tailed t-tests. Mean values are adjusted for
baseline characteristics. The analysis accounts for clustering of students within schools, and cohort and school year fixed
effects. Because these subgroup analyses are exploratory, statistical significance thresholds were not adjusted for
multiple comparisons.
There were no statistically significant differences between subgroup impact estimates.
***/**/* Impact estimate is statistically significant at the .01/.05/.10 level.
+++/++/+ Difference between the EWS group and the EWS + computers group is statistically significant at the .01/.05/.10 level.
0.07
-0.03
0.09
0.02
0
0.030.04
0.01
0.04
-0.03
0.09
0.01
-0.03
0.020.01
0
-0.1
0
0.1
Female Male Overage Not overage High % At-
risk
Low % At-
risk
Remote
schools
Not remote
schools
Dif
fere
nce
in
SD
PP
an
d c
on
trol
gro
up
mea
ns
in
score
s on
a f
ou
r-p
oin
t sc
ale
EWS only EWS+Computers group
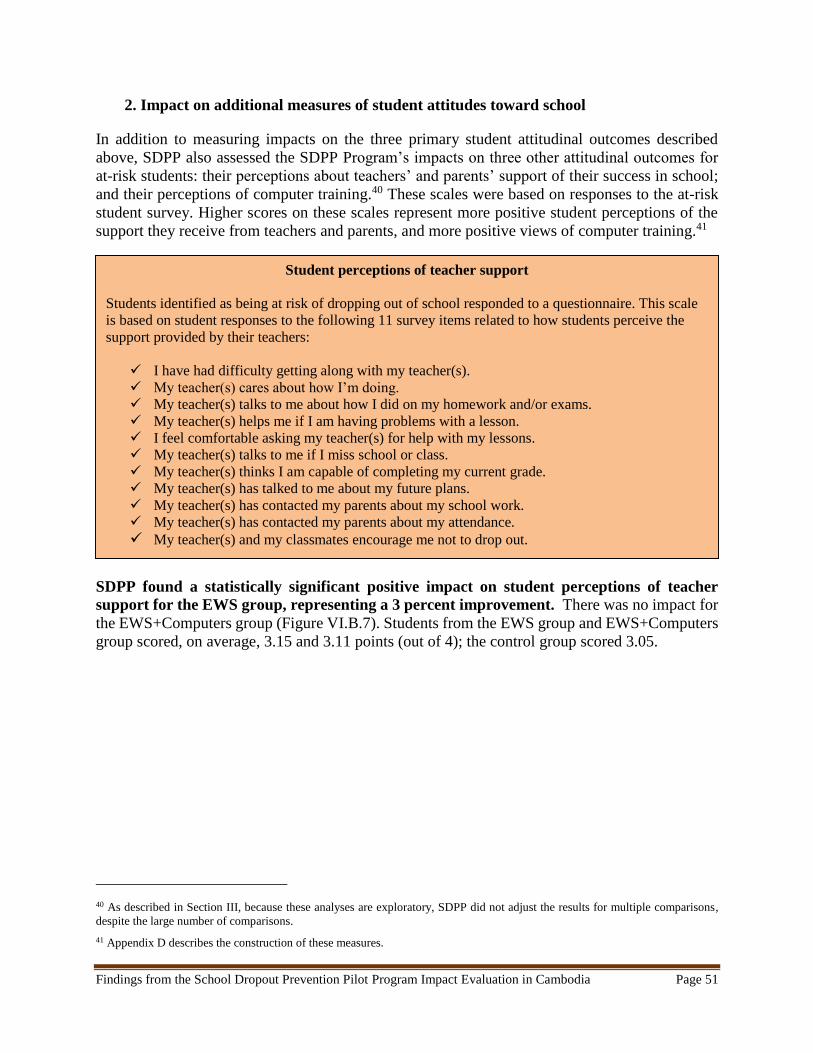
Findings from the School Dropout Prevention Pilot Program Impact Evaluation in Cambodia Page 51
2. Impact on additional measures of student attitudes toward school
In addition to measuring impacts on the three primary student attitudinal outcomes described
above, SDPP also assessed the SDPP Program’s impacts on three other attitudinal outcomes for
at-risk students: their perceptions about teachers’ and parents’ support of their success in school;
and their perceptions of computer training.40 These scales were based on responses to the at-risk
student survey. Higher scores on these scales represent more positive student perceptions of the
support they receive from teachers and parents, and more positive views of computer training.41
SDPP found a statistically significant positive impact on student perceptions of teacher
support for the EWS group, representing a 3 percent improvement. There was no impact for
the EWS+Computers group (Figure VI.B.7). Students from the EWS group and EWS+Computers
group scored, on average, 3.15 and 3.11 points (out of 4); the control group scored 3.05.
40 As described in Section III, because these analyses are exploratory, SDPP did not adjust the results for multiple comparisons,
despite the large number of comparisons.
41 Appendix D describes the construction of these measures.
Student perceptions of teacher support
Students identified as being at risk of dropping out of school responded to a questionnaire. This scale
is based on student responses to the following 11 survey items related to how students perceive the
support provided by their teachers:
I have had difficulty getting along with my teacher(s).
My teacher(s) cares about how I’m doing.
My teacher(s) talks to me about how I did on my homework and/or exams.
My teacher(s) helps me if I am having problems with a lesson.
I feel comfortable asking my teacher(s) for help with my lessons.
My teacher(s) talks to me if I miss school or class.
My teacher(s) thinks I am capable of completing my current grade.
My teacher(s) has talked to me about my future plans.
My teacher(s) has contacted my parents about my school work.
My teacher(s) has contacted my parents about my attendance.
My teacher(s) and my classmates encourage me not to drop out.
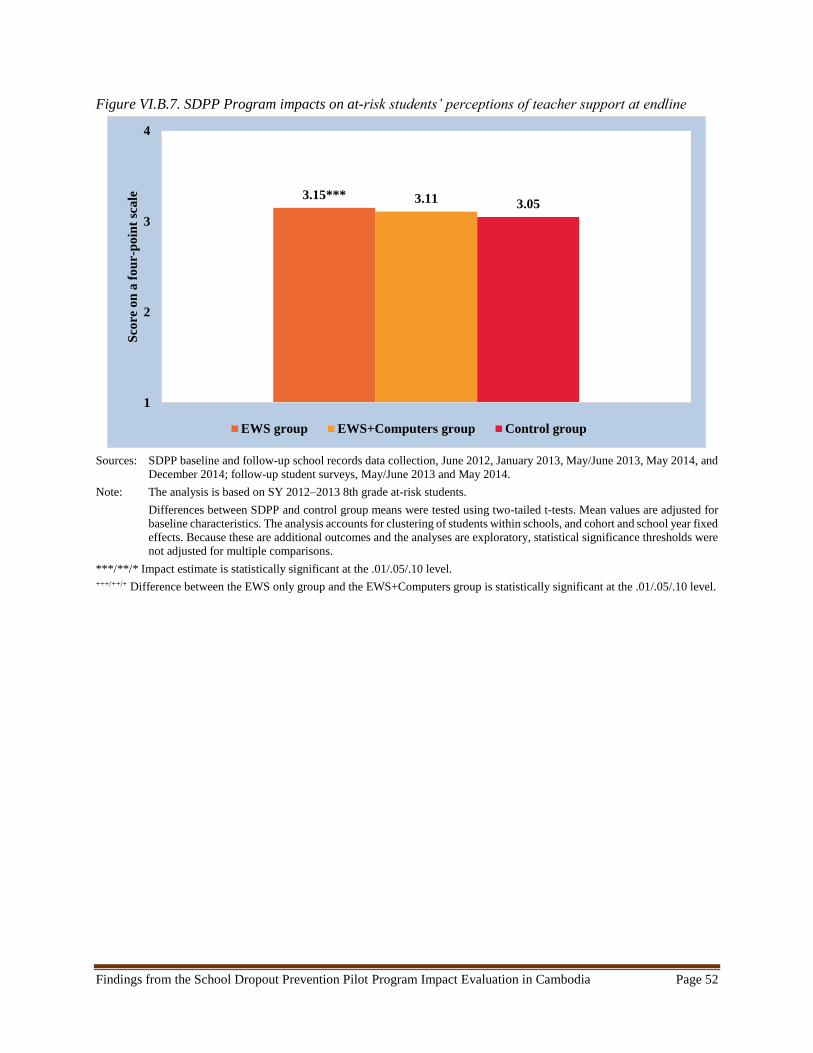
Findings from the School Dropout Prevention Pilot Program Impact Evaluation in Cambodia Page 52
Figure VI.B.7. SDPP Program impacts on at-risk students’ perceptions of teacher support at endline
Sources: SDPP baseline and follow-up school records data collection, June 2012, January 2013, May/June 2013, May 2014, and
December 2014; follow-up student surveys, May/June 2013 and May 2014.
Note: The analysis is based on SY 2012–2013 8th grade at-risk students.
Differences between SDPP and control group means were tested using two-tailed t-tests. Mean values are adjusted for
baseline characteristics. The analysis accounts for clustering of students within schools, and cohort and school year fixed
effects. Because these are additional outcomes and the analyses are exploratory, statistical significance thresholds were
not adjusted for multiple comparisons.
***/**/* Impact estimate is statistically significant at the .01/.05/.10 level.
+++/++/+ Difference between the EWS only group and the EWS+Computers group is statistically significant at the .01/.05/.10 level.
3.15*** 3.11 3.05
1
2
3
4S
core
on
a f
ou
r-p
oin
t sc
ale
EWS group EWS+Computers group Control group

Findings from the School Dropout Prevention Pilot Program Impact Evaluation in Cambodia Page 53
Teacher Support: My Teacher Helped Me Stay in School
The stories of students who drop out of school are very similar: they have high demands placed
on them at home that compete for their time and attention; they frequently miss school; and they
fall behind and perform poorly in their studies. Both Sammang Chanrey and Boerun Kimneth
share this story of struggle, failure and dropout.
As the oldest daughter in her family, Sammang was always busy helping her mother cook, clean
and watch her younger brothers. Her father was forced to travel to another province to find work,
so her mother relied heavily on Sammang’s support. Her mother admits that regular school
attendance was not a high priority.
Boerun lived with his mother, two older brothers and younger sister. His parents were divorced
and he was expected to help at home to support the family. Although his mother wanted her son
to go to school, she was too busy to monitor what was happening with his studies and was
unaware of his frequent absences and poor performance.
SDPP’s Early Warning System—which identifies students who are at-risk of dropping out so
they can be provided with the support they need to stay in school—kicked in just in time.
Once Sammang and Boerun were identified as being at high-risk for dropout, letters were sent
to their families and visits were conducted in their homes to discuss what could be done to
improve their attendance. But getting them to school every day was just the first step. If the
school and classroom weren’t inviting and supportive, at-risk students like Sammang and
Boeurn would continue to miss class and perform
poorly on their schoolwork.
Teachers at their school were taught ways to make
the classroom more inviting and supportive, ranging
from simple things to more complex. Sammang’s
and Boerun’s homeroom teacher agrees it takes more
than tracking attendance to keep students in school.
He says, “Identifying at-risk students is the first
important step of an EWS so that school staff know
who to provide extra support to.” He listed what he
was doing in his classroom to support at-risk
students: greeting them by name, asking how they
were doing, showing an interest in their schoolwork,
making sure they understood the lesson, and
providing advice and guidance.
Making teachers aware of the need to create a child-
friendly, welcoming, and supportive classroom has
reaped results. “If my homeroom teacher didn’t
follow up and motivate me, I might have stopped my
studies,” says Boerun. Sammang agrees. “I have
come to school regularly and performed better in
class because of my homeroom teacher.”
A student happy to be back in school
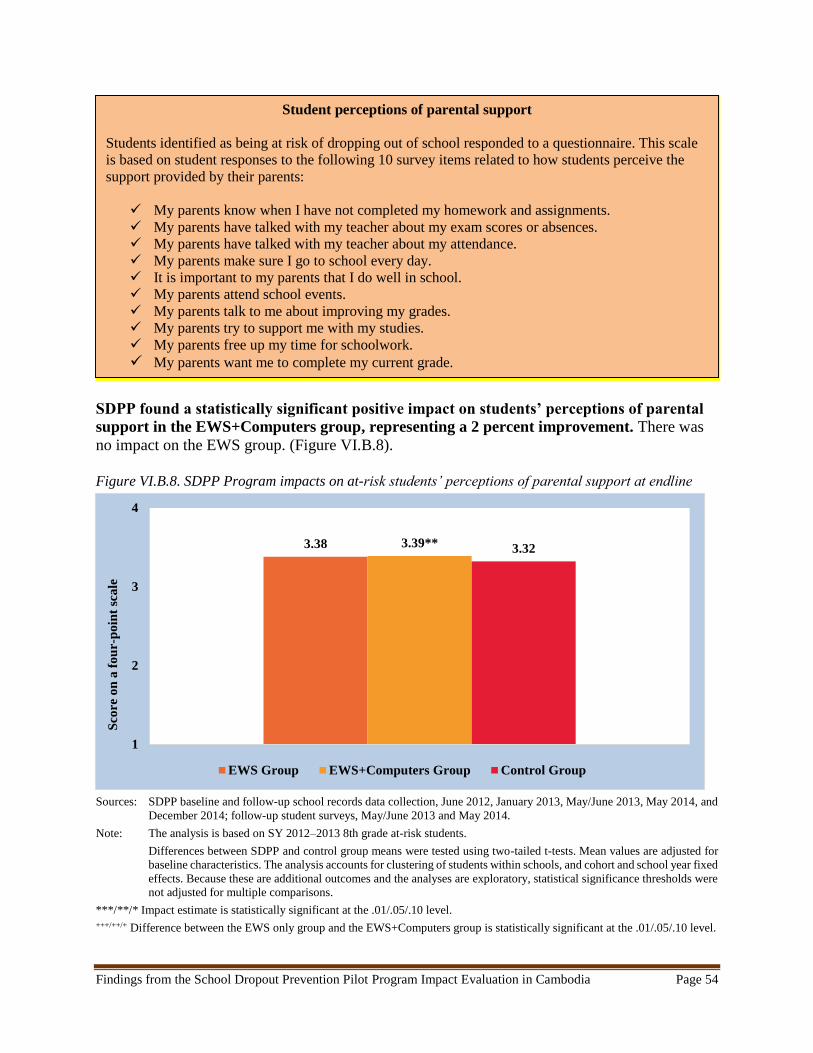
Findings from the School Dropout Prevention Pilot Program Impact Evaluation in Cambodia Page 54
SDPP found a statistically significant positive impact on students’ perceptions of parental
support in the EWS+Computers group, representing a 2 percent improvement. There was
no impact on the EWS group. (Figure VI.B.8).
Figure VI.B.8. SDPP Program impacts on at-risk students’ perceptions of parental support at endline
Sources: SDPP baseline and follow-up school records data collection, June 2012, January 2013, May/June 2013, May 2014, and
December 2014; follow-up student surveys, May/June 2013 and May 2014.
Note: The analysis is based on SY 2012–2013 8th grade at-risk students.
Differences between SDPP and control group means were tested using two-tailed t-tests. Mean values are adjusted for
baseline characteristics. The analysis accounts for clustering of students within schools, and cohort and school year fixed
effects. Because these are additional outcomes and the analyses are exploratory, statistical significance thresholds were
not adjusted for multiple comparisons.
***/**/* Impact estimate is statistically significant at the .01/.05/.10 level.
+++/++/+ Difference between the EWS only group and the EWS+Computers group is statistically significant at the .01/.05/.10 level.
3.38 3.39** 3.32
1
2
3
4
Sco
re o
n a
fo
ur-p
oin
t sc
ale
EWS Group EWS+Computers Group Control Group
Student perceptions of parental support
Students identified as being at risk of dropping out of school responded to a questionnaire. This scale
is based on student responses to the following 10 survey items related to how students perceive the
support provided by their parents:
My parents know when I have not completed my homework and assignments.
My parents have talked with my teacher about my exam scores or absences.
My parents have talked with my teacher about my attendance.
My parents make sure I go to school every day.
It is important to my parents that I do well in school.
My parents attend school events.
My parents talk to me about improving my grades.
My parents try to support me with my studies.
My parents free up my time for schoolwork.
My parents want me to complete my current grade.
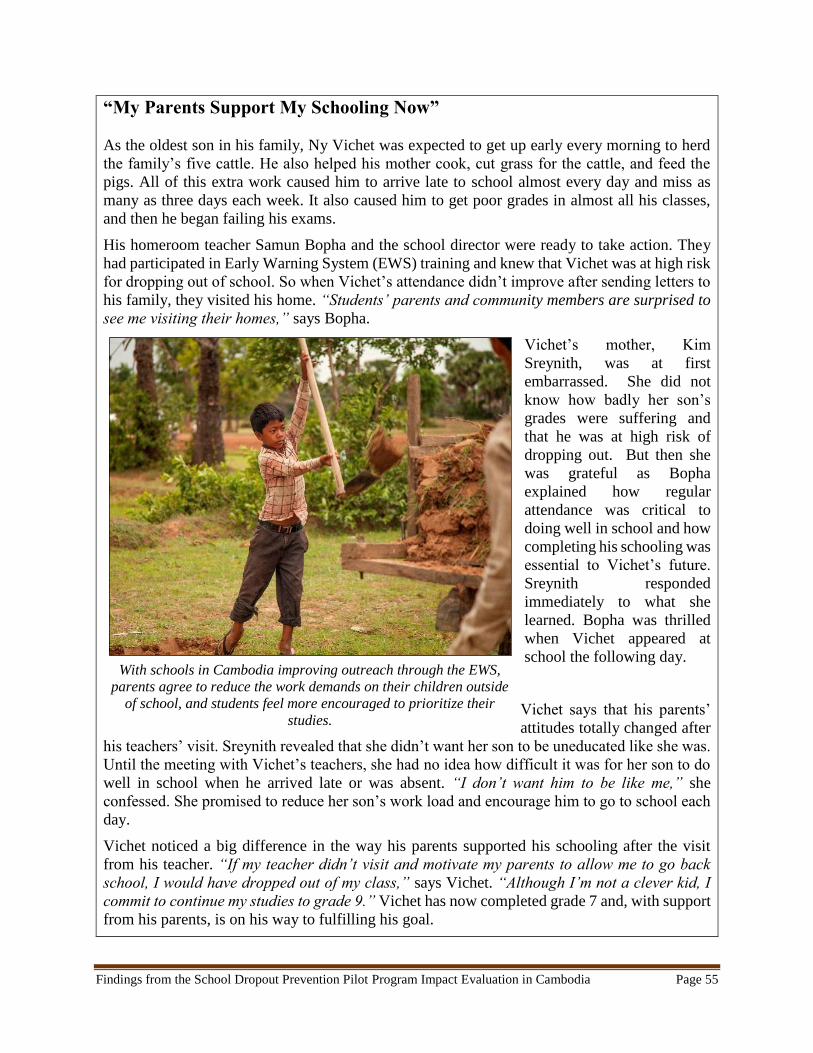
Findings from the School Dropout Prevention Pilot Program Impact Evaluation in Cambodia Page 55
“My Parents Support My Schooling Now”
As the oldest son in his family, Ny Vichet was expected to get up early every morning to herd
the family’s five cattle. He also helped his mother cook, cut grass for the cattle, and feed the
pigs. All of this extra work caused him to arrive late to school almost every day and miss as
many as three days each week. It also caused him to get poor grades in almost all his classes,
and then he began failing his exams.
His homeroom teacher Samun Bopha and the school director were ready to take action. They
had participated in Early Warning System (EWS) training and knew that Vichet was at high risk
for dropping out of school. So when Vichet’s attendance didn’t improve after sending letters to
his family, they visited his home. “Students’ parents and community members are surprised to
see me visiting their homes,” says Bopha.
Vichet’s mother, Kim
Sreynith, was at first
embarrassed. She did not
know how badly her son’s
grades were suffering and
that he was at high risk of
dropping out. But then she
was grateful as Bopha
explained how regular
attendance was critical to
doing well in school and how
completing his schooling was
essential to Vichet’s future.
Sreynith responded
immediately to what she
learned. Bopha was thrilled
when Vichet appeared at
school the following day.
Vichet says that his parents’
attitudes totally changed after
his teachers’ visit. Sreynith revealed that she didn’t want her son to be uneducated like she was.
Until the meeting with Vichet’s teachers, she had no idea how difficult it was for her son to do
well in school when he arrived late or was absent. “I don’t want him to be like me,” she
confessed. She promised to reduce her son’s work load and encourage him to go to school each
day.
Vichet noticed a big difference in the way his parents supported his schooling after the visit
from his teacher. “If my teacher didn’t visit and motivate my parents to allow me to go back
school, I would have dropped out of my class,” says Vichet. “Although I’m not a clever kid, I
commit to continue my studies to grade 9.” Vichet has now completed grade 7 and, with support
from his parents, is on his way to fulfilling his goal.
With schools in Cambodia improving outreach through the EWS,
parents agree to reduce the work demands on their children outside
of school, and students feel more encouraged to prioritize their
studies.
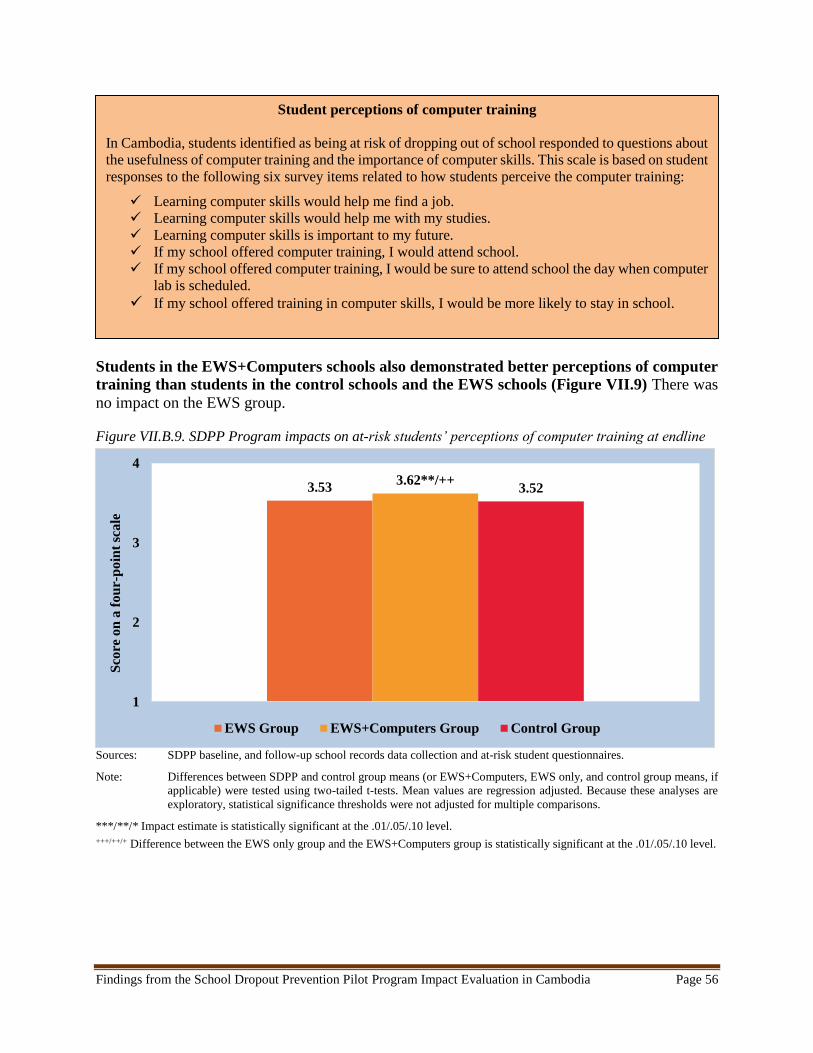
Findings from the School Dropout Prevention Pilot Program Impact Evaluation in Cambodia Page 56
Students in the EWS+Computers schools also demonstrated better perceptions of computer
training than students in the control schools and the EWS schools (Figure VII.9) There was
no impact on the EWS group.
Figure VII.B.9. SDPP Program impacts on at-risk students’ perceptions of computer training at endline
Sources: SDPP baseline, and follow-up school records data collection and at-risk student questionnaires.
Note: Differences between SDPP and control group means (or EWS+Computers, EWS only, and control group means, if
applicable) were tested using two-tailed t-tests. Mean values are regression adjusted. Because these analyses are
exploratory, statistical significance thresholds were not adjusted for multiple comparisons.
***/**/* Impact estimate is statistically significant at the .01/.05/.10 level.
+++/++/+ Difference between the EWS only group and the EWS+Computers group is statistically significant at the .01/.05/.10 level.
3.533.62**/++
3.52
1
2
3
4
Sco
re o
n a
fou
r-p
oin
t sc
ale
EWS Group EWS+Computers Group Control Group
Student perceptions of computer training
In Cambodia, students identified as being at risk of dropping out of school responded to questions about
the usefulness of computer training and the importance of computer skills. This scale is based on student
responses to the following six survey items related to how students perceive the computer training:
Learning computer skills would help me find a job.
Learning computer skills would help me with my studies.
Learning computer skills is important to my future.
If my school offered computer training, I would attend school.
If my school offered computer training, I would be sure to attend school the day when computer
lab is scheduled.
If my school offered training in computer skills, I would be more likely to stay in school.

Findings from the School Dropout Prevention Pilot Program Impact Evaluation in Cambodia Page 57
Computer Literacy Makes School More Relevant
Ry Phanith, a 15 year old Cambodian 9th
grade student, is passionate about the
computer. He is one of 292 students at
Bay Damram Lower Secondary School
receiving computer training as one of the
interventions for USAID’s School
Dropout Prevention Pilot (SDPP)
project. In response to parent and student
complaints that they were not getting the
skills that would advance their education
or improve their chances of
employment, SDPP installed a low-cost,
solar powered computer lab and trained
teachers as instructor in 108 schools.
There are 33 students in Phanith’s Grade 9 class. Although he looks younger than his fellow
classmates, his commitment to learning the computer makes him seem older and more mature.
Indeed, both his teachers and fellow students consider him to be the hardest working student in
the computer class. “I’m enthusiastic to learn the computer because being knowledgeable in
computer skills is vital for my future study and career,” Phanith said. “I’m really interested in
typing articles in the computer, inserting and modifying pictures into the article. When we are
fluent in these skills, we will be able to design layouts of newspapers and magazines.”
“Phanith is one of the most active students in my computer class,” said Meas Chanbopha,
Phanith’s computer teacher. “Whenever I give practice exercises to my students, Phanith always
completes his before the other students. When he is unclear on any points of the lessons he
always asks me to explain further.”
Phanith has two younger brothers and one sister. His parents are farmers and expect him to help
at home and in their gardens. Between his school and home obligations he keeps very busy. He
also has a long commute to school and even though he is lucky and has a bike, the 4 kilometer
ride along the country roads to school still takes a lot of time. On days when the weather is good
it takes over 20 minutes to ride to school.
Despite his long commute and competing obligations, Phanith rarely misses school since he’s
learned about the importance of attending school every day. He is even sorry when school is
closed because of public holidays! He is especially disappointed if it’s on a day when he has his
computer class. This year Phanith sits for the Grade 9 exam. He is confident he will pass and
credits the support he has received from the SDPP Program in part for getting this far in his
education.
“The combination of the computer lab and the EWS has reduced the dropout rate in my school
in this academic year,” said Tak Chankoy, Bay Damram School Director. “SDPP is not only
providing my students with a special life skill (computer literacy), but the program is also
following up with at-risk students on attendance, behavior and course performance.”
Students practice computer literacy skills
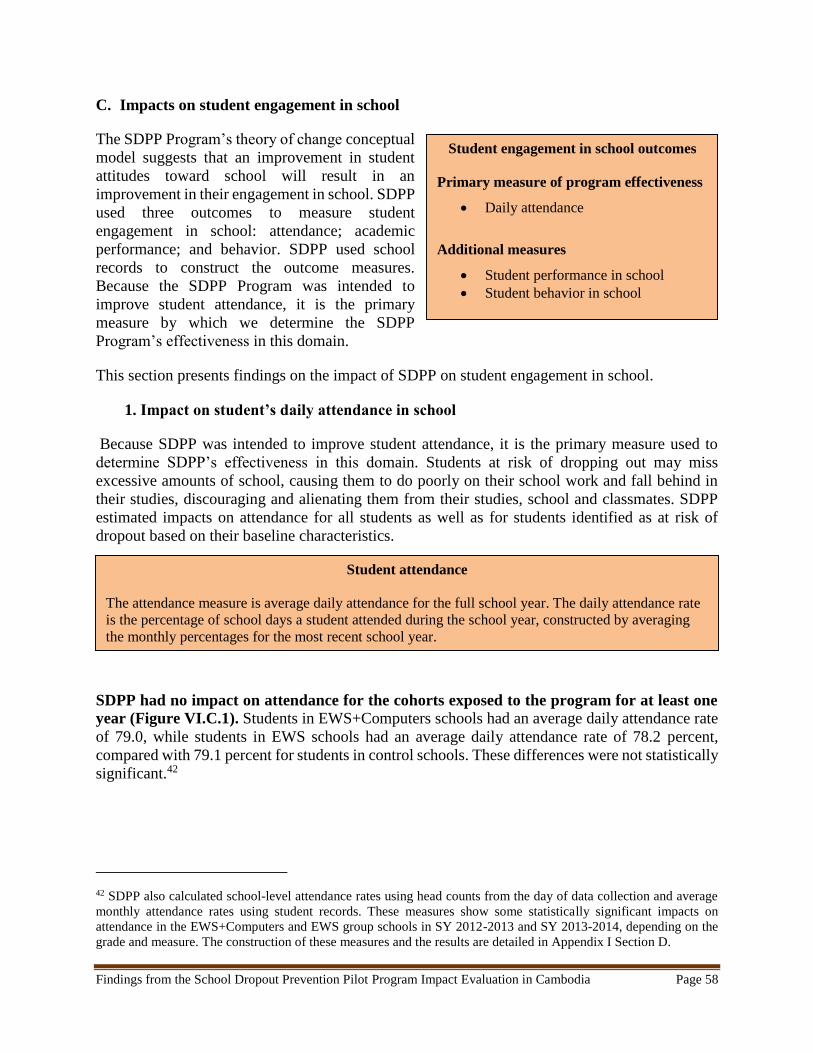
Findings from the School Dropout Prevention Pilot Program Impact Evaluation in Cambodia Page 58
C. Impacts on student engagement in school
The SDPP Program’s theory of change conceptual
model suggests that an improvement in student
attitudes toward school will result in an
improvement in their engagement in school. SDPP
used three outcomes to measure student
engagement in school: attendance; academic
performance; and behavior. SDPP used school
records to construct the outcome measures.
Because the SDPP Program was intended to
improve student attendance, it is the primary
measure by which we determine the SDPP
Program’s effectiveness in this domain.
This section presents findings on the impact of SDPP on student engagement in school.
1. Impact on student’s daily attendance in school
Because SDPP was intended to improve student attendance, it is the primary measure used to
determine SDPP’s effectiveness in this domain. Students at risk of dropping out may miss
excessive amounts of school, causing them to do poorly on their school work and fall behind in
their studies, discouraging and alienating them from their studies, school and classmates. SDPP
estimated impacts on attendance for all students as well as for students identified as at risk of
dropout based on their baseline characteristics.
SDPP had no impact on attendance for the cohorts exposed to the program for at least one
year (Figure VI.C.1). Students in EWS+Computers schools had an average daily attendance rate
of 79.0, while students in EWS schools had an average daily attendance rate of 78.2 percent,
compared with 79.1 percent for students in control schools. These differences were not statistically
significant.42
42 SDPP also calculated school-level attendance rates using head counts from the day of data collection and average
monthly attendance rates using student records. These measures show some statistically significant impacts on
attendance in the EWS+Computers and EWS group schools in SY 2012-2013 and SY 2013-2014, depending on the
grade and measure. The construction of these measures and the results are detailed in Appendix I Section D.
Student engagement in school outcomes
Primary measure of program effectiveness
Daily attendance
Additional measures
Student performance in school
Student behavior in school
Student attendance
The attendance measure is average daily attendance for the full school year. The daily attendance rate
is the percentage of school days a student attended during the school year, constructed by averaging
the monthly percentages for the most recent school year.
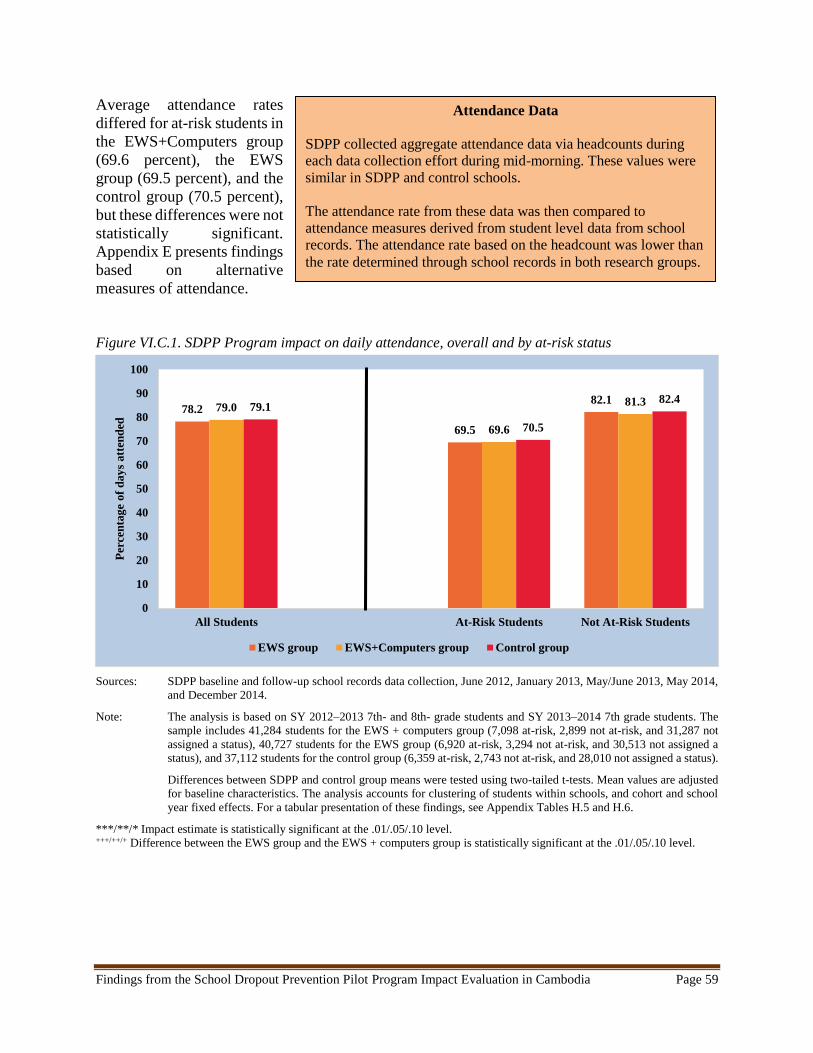
Findings from the School Dropout Prevention Pilot Program Impact Evaluation in Cambodia Page 59
Average attendance rates
differed for at-risk students in
the EWS+Computers group
(69.6 percent), the EWS
group (69.5 percent), and the
control group (70.5 percent),
but these differences were not
statistically significant.
Appendix E presents findings
based on alternative
measures of attendance.
Figure VI.C.1. SDPP Program impact on daily attendance, overall and by at-risk status
Sources: SDPP baseline and follow-up school records data collection, June 2012, January 2013, May/June 2013, May 2014,
and December 2014.
Note: The analysis is based on SY 2012–2013 7th- and 8th- grade students and SY 2013–2014 7th grade students. The
sample includes 41,284 students for the EWS + computers group (7,098 at-risk, 2,899 not at-risk, and 31,287 not
assigned a status), 40,727 students for the EWS group (6,920 at-risk, 3,294 not at-risk, and 30,513 not assigned a
status), and 37,112 students for the control group (6,359 at-risk, 2,743 not at-risk, and 28,010 not assigned a status).
Differences between SDPP and control group means were tested using two-tailed t-tests. Mean values are adjusted
for baseline characteristics. The analysis accounts for clustering of students within schools, and cohort and school
year fixed effects. For a tabular presentation of these findings, see Appendix Tables H.5 and H.6.
***/**/* Impact estimate is statistically significant at the .01/.05/.10 level. +++/++/+ Difference between the EWS group and the EWS + computers group is statistically significant at the .01/.05/.10 level.
78.2
69.5
82.179.0
69.6
81.379.1
70.5
82.4
0
10
20
30
40
50
60
70
80
90
100
All Students At-Risk Students Not At-Risk Students
Per
cen
tag
e of
day
s att
end
ed
EWS group EWS+Computers group Control group
Attendance Data
SDPP collected aggregate attendance data via headcounts during
each data collection effort during mid-morning. These values were
similar in SDPP and control schools.
The attendance rate from these data was then compared to
attendance measures derived from student level data from school
records. The attendance rate based on the headcount was lower than
the rate determined through school records in both research groups.
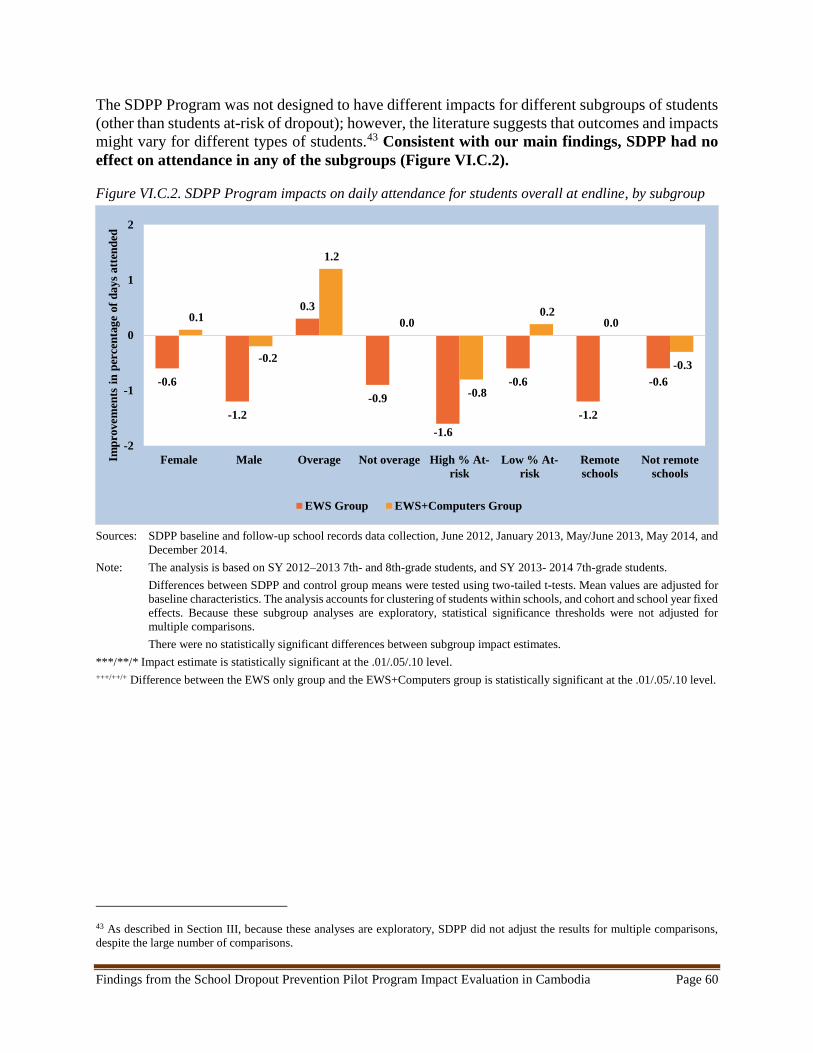
Findings from the School Dropout Prevention Pilot Program Impact Evaluation in Cambodia Page 60
The SDPP Program was not designed to have different impacts for different subgroups of students
(other than students at-risk of dropout); however, the literature suggests that outcomes and impacts
might vary for different types of students.43 Consistent with our main findings, SDPP had no
effect on attendance in any of the subgroups (Figure VI.C.2).
Figure VI.C.2. SDPP Program impacts on daily attendance for students overall at endline, by subgroup
Sources: SDPP baseline and follow-up school records data collection, June 2012, January 2013, May/June 2013, May 2014, and
December 2014.
Note: The analysis is based on SY 2012–2013 7th- and 8th-grade students, and SY 2013- 2014 7th-grade students.
Differences between SDPP and control group means were tested using two-tailed t-tests. Mean values are adjusted for
baseline characteristics. The analysis accounts for clustering of students within schools, and cohort and school year fixed
effects. Because these subgroup analyses are exploratory, statistical significance thresholds were not adjusted for
multiple comparisons.
There were no statistically significant differences between subgroup impact estimates.
***/**/* Impact estimate is statistically significant at the .01/.05/.10 level.
+++/++/+ Difference between the EWS only group and the EWS+Computers group is statistically significant at the .01/.05/.10 level.
43 As described in Section III, because these analyses are exploratory, SDPP did not adjust the results for multiple comparisons,
despite the large number of comparisons.
-0.6
-1.2
0.3
-0.9
-1.6
-0.6
-1.2
-0.6
0.1
-0.2
1.2
0.0
-0.8
0.20.0
-0.3
-2
-1
0
1
2
Female Male Overage Not overage High % At-
risk
Low % At-
risk
Remote
schools
Not remote
schools
Imp
rovem
ents
in
per
cen
tag
e of
day
s att
end
ed
EWS Group EWS+Computers Group

Findings from the School Dropout Prevention Pilot Program Impact Evaluation in Cambodia Page 61
2. Impact on additional measures of student engagement in school
In addition to measuring impact on daily attendance described above, SDPP assessed the
program’s impacts on two other engagement outcomes: academic performance in math and
language; and behavior in school.
a. Academic performance in math and language
SDPP also examined program impacts on academic performance, since an increase in attendance
might result in an overall improvement in performance in school. SDPP did not attempt to directly
influence academic performance, and therefore this is not part of our determination of program
effectiveness.44
SDPP found that the SDPP Program had no effect on academic performance (Figures VI.C.3
and Figure VI.C.4). Average math scores among the three groups ranged from 60.6 percent to
62.7 percent. Average Khmer scores ranged from 67.8 percent to 69.2 percent. The impacts on
math and Khmer exam scores were not statistically significant.
Figure VI.C.3. SDPP Program impacts on math performance at endline
44 Moreover, impact estimates for academic performance may be biased if the program was successful in keeping low-performing
students in school. Also, as described in Section III, because these analyses are exploratory, SDPP did not adjust the results for
multiple comparisons, despite the large number of comparisons.
60.6 62.7+ 61.9
0
10
20
30
40
50
60
70
80
90
100
Sco
re (
per
cen
tag
e)
EWS Group EWS+Computers Group Control Group
Math, language, and behavior performance
Performance data came from second-semester scores for students. For math and Khmer language,
schools scored students on a 100-point scale, 1 to 100. For behavior, schools scored students from 1 to
3: 1 is “good/very good,” 2 is “fair,” and 3 is “poor.” These values were reverse-coded so that higher
scores correspond to better behavior.
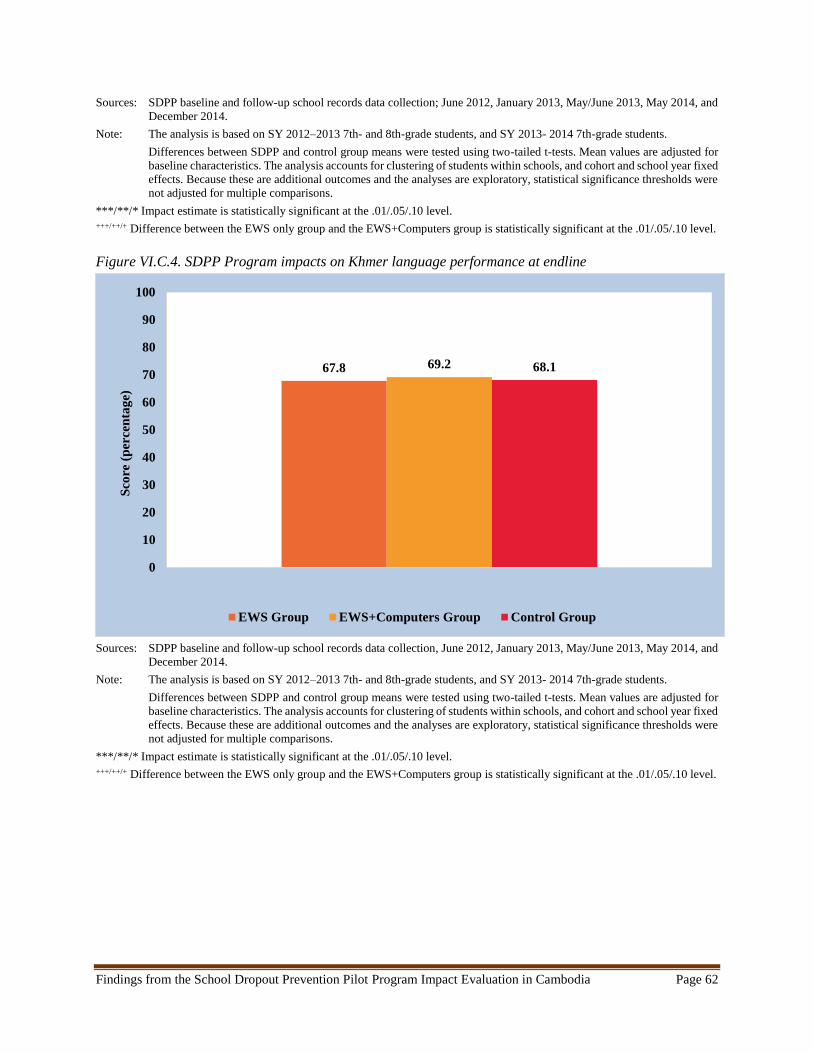
Findings from the School Dropout Prevention Pilot Program Impact Evaluation in Cambodia Page 62
Sources: SDPP baseline and follow-up school records data collection; June 2012, January 2013, May/June 2013, May 2014, and
December 2014.
Note: The analysis is based on SY 2012–2013 7th- and 8th-grade students, and SY 2013- 2014 7th-grade students.
Differences between SDPP and control group means were tested using two-tailed t-tests. Mean values are adjusted for
baseline characteristics. The analysis accounts for clustering of students within schools, and cohort and school year fixed
effects. Because these are additional outcomes and the analyses are exploratory, statistical significance thresholds were
not adjusted for multiple comparisons.
***/**/* Impact estimate is statistically significant at the .01/.05/.10 level.
+++/++/+ Difference between the EWS only group and the EWS+Computers group is statistically significant at the .01/.05/.10 level.
Figure VI.C.4. SDPP Program impacts on Khmer language performance at endline
Sources: SDPP baseline and follow-up school records data collection, June 2012, January 2013, May/June 2013, May 2014, and
December 2014.
Note: The analysis is based on SY 2012–2013 7th- and 8th-grade students, and SY 2013- 2014 7th-grade students.
Differences between SDPP and control group means were tested using two-tailed t-tests. Mean values are adjusted for
baseline characteristics. The analysis accounts for clustering of students within schools, and cohort and school year fixed
effects. Because these are additional outcomes and the analyses are exploratory, statistical significance thresholds were
not adjusted for multiple comparisons.
***/**/* Impact estimate is statistically significant at the .01/.05/.10 level.
+++/++/+ Difference between the EWS only group and the EWS+Computers group is statistically significant at the .01/.05/.10 level.
67.8 69.2 68.1
0
10
20
30
40
50
60
70
80
90
100
Sco
re (
per
cen
tag
e)
EWS Group EWS+Computers Group Control Group
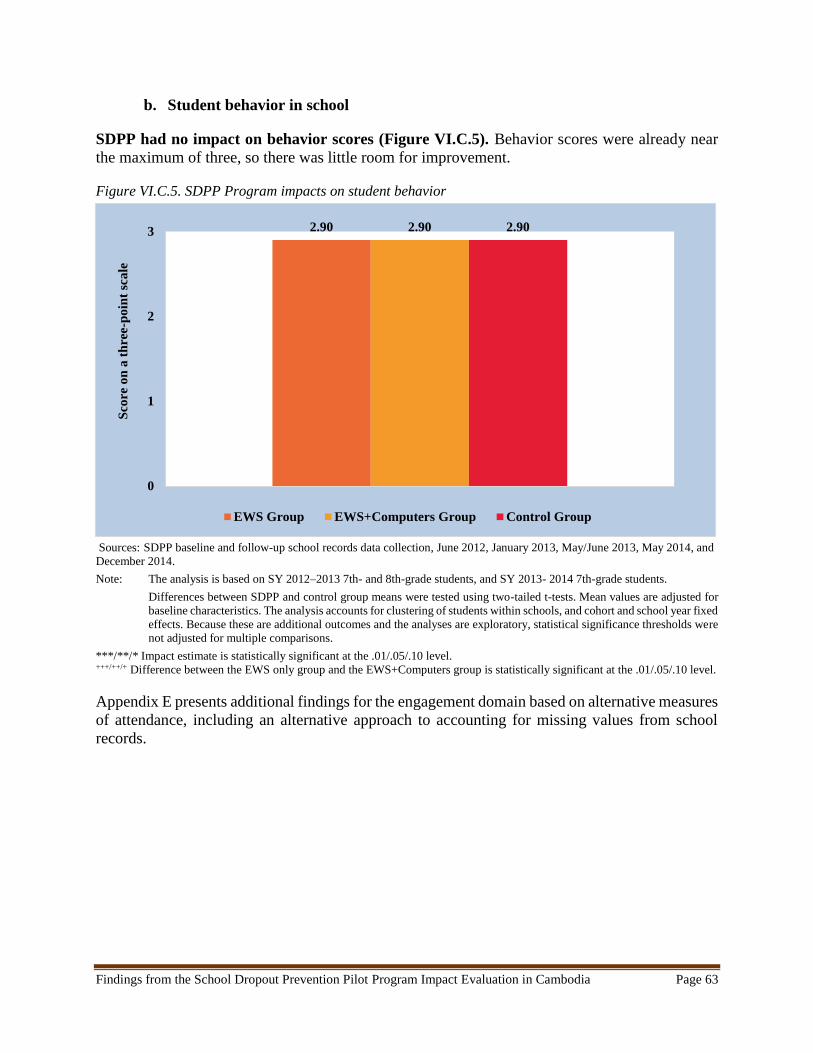
Findings from the School Dropout Prevention Pilot Program Impact Evaluation in Cambodia Page 63
b. Student behavior in school
SDPP had no impact on behavior scores (Figure VI.C.5). Behavior scores were already near
the maximum of three, so there was little room for improvement.
Figure VI.C.5. SDPP Program impacts on student behavior
Sources: SDPP baseline and follow-up school records data collection, June 2012, January 2013, May/June 2013, May 2014, and
December 2014.
Note: The analysis is based on SY 2012–2013 7th- and 8th-grade students, and SY 2013- 2014 7th-grade students.
Differences between SDPP and control group means were tested using two-tailed t-tests. Mean values are adjusted for
baseline characteristics. The analysis accounts for clustering of students within schools, and cohort and school year fixed
effects. Because these are additional outcomes and the analyses are exploratory, statistical significance thresholds were
not adjusted for multiple comparisons.
***/**/* Impact estimate is statistically significant at the .01/.05/.10 level. +++/++/+ Difference between the EWS only group and the EWS+Computers group is statistically significant at the .01/.05/.10 level.
Appendix E presents additional findings for the engagement domain based on alternative measures
of attendance, including an alternative approach to accounting for missing values from school
records.
2.90 2.90 2.90
0
1
2
3
Sco
re o
n a
th
ree-p
oin
t sc
ale
EWS Group EWS+Computers Group Control Group
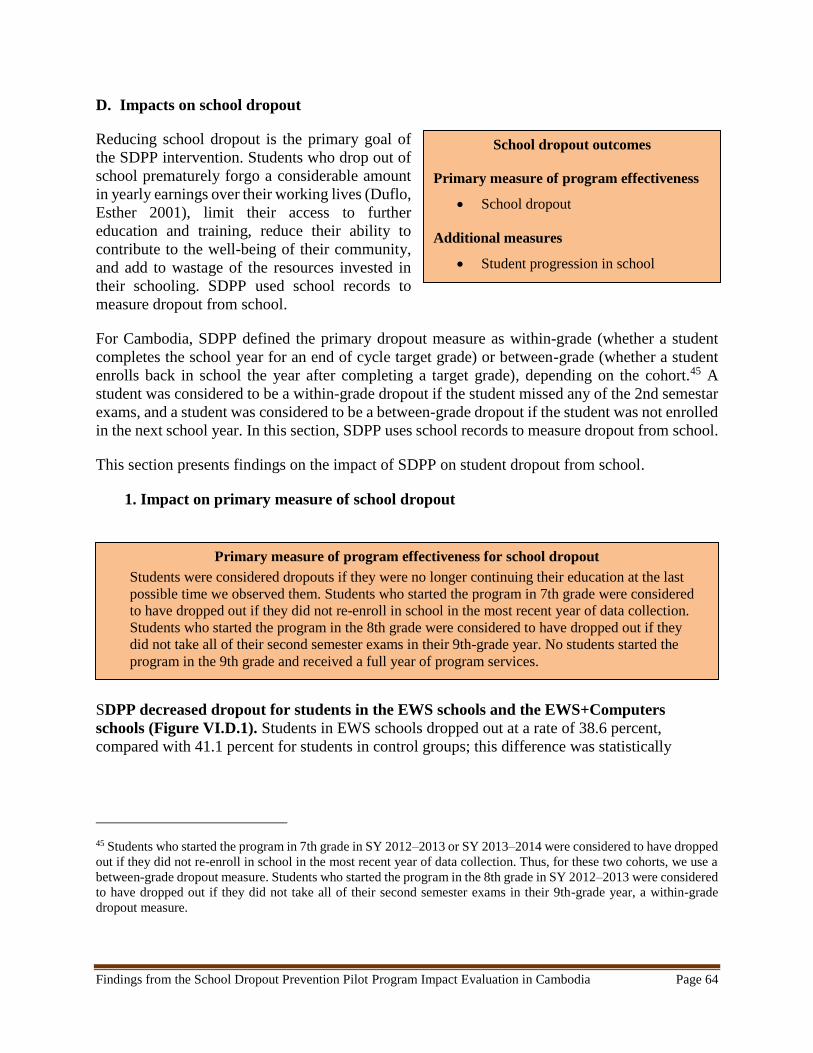
Findings from the School Dropout Prevention Pilot Program Impact Evaluation in Cambodia Page 64
D. Impacts on school dropout
Reducing school dropout is the primary goal of
the SDPP intervention. Students who drop out of
school prematurely forgo a considerable amount
in yearly earnings over their working lives (Duflo,
Esther 2001), limit their access to further
education and training, reduce their ability to
contribute to the well-being of their community,
and add to wastage of the resources invested in
their schooling. SDPP used school records to
measure dropout from school.
For Cambodia, SDPP defined the primary dropout measure as within-grade (whether a student
completes the school year for an end of cycle target grade) or between-grade (whether a student
enrolls back in school the year after completing a target grade), depending on the cohort.45 A
student was considered to be a within-grade dropout if the student missed any of the 2nd semestar
exams, and a student was considered to be a between-grade dropout if the student was not enrolled
in the next school year. In this section, SDPP uses school records to measure dropout from school.
This section presents findings on the impact of SDPP on student dropout from school.
1. Impact on primary measure of school dropout
SDPP decreased dropout for students in the EWS schools and the EWS+Computers
schools (Figure VI.D.1). Students in EWS schools dropped out at a rate of 38.6 percent,
compared with 41.1 percent for students in control groups; this difference was statistically
45 Students who started the program in 7th grade in SY 2012–2013 or SY 2013–2014 were considered to have dropped
out if they did not re-enroll in school in the most recent year of data collection. Thus, for these two cohorts, we use a
between-grade dropout measure. Students who started the program in the 8th grade in SY 2012–2013 were considered
to have dropped out if they did not take all of their second semester exams in their 9th-grade year, a within-grade
dropout measure.
Primary measure of program effectiveness for school dropout
Students were considered dropouts if they were no longer continuing their education at the last
possible time we observed them. Students who started the program in 7th grade were considered
to have dropped out if they did not re-enroll in school in the most recent year of data collection.
Students who started the program in the 8th grade were considered to have dropped out if they
did not take all of their second semester exams in their 9th-grade year. No students started the
program in the 9th grade and received a full year of program services.
School dropout outcomes
Primary measure of program effectiveness
School dropout
Additional measures
Student progression in school
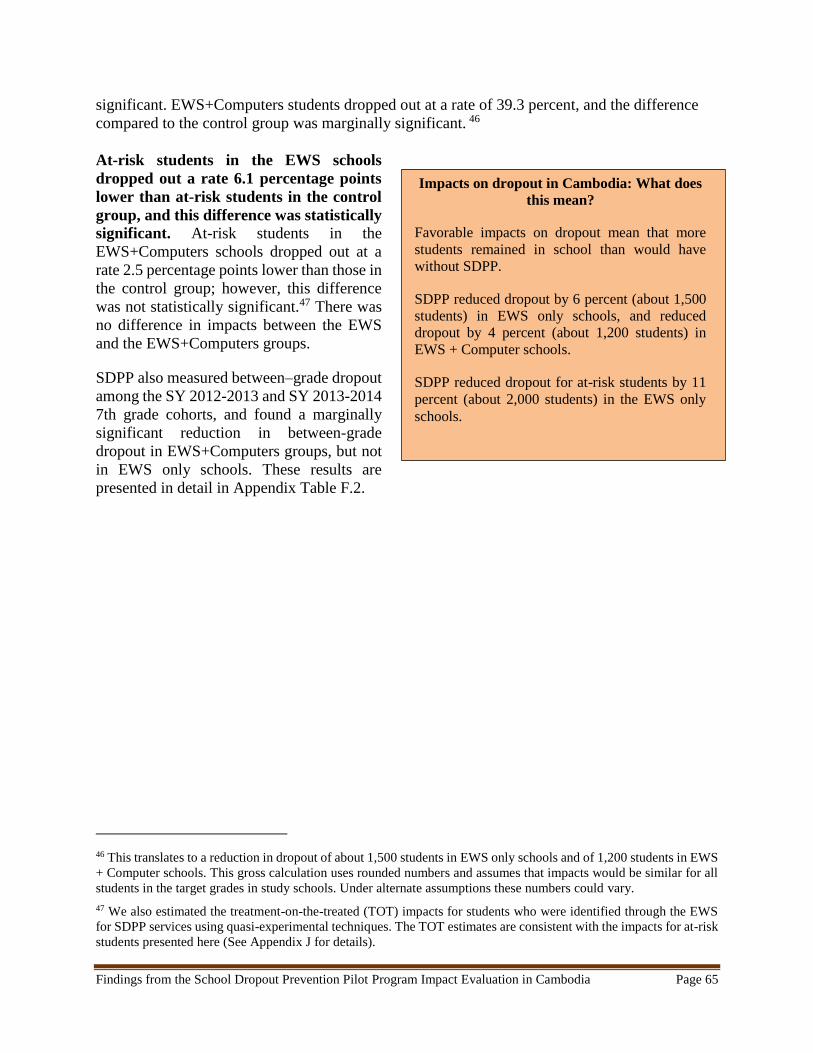
Findings from the School Dropout Prevention Pilot Program Impact Evaluation in Cambodia Page 65
significant. EWS+Computers students dropped out at a rate of 39.3 percent, and the difference
compared to the control group was marginally significant. 46
At-risk students in the EWS schools
dropped out a rate 6.1 percentage points
lower than at-risk students in the control
group, and this difference was statistically
significant. At-risk students in the
EWS+Computers schools dropped out at a
rate 2.5 percentage points lower than those in
the control group; however, this difference
was not statistically significant.47 There was
no difference in impacts between the EWS
and the EWS+Computers groups.
SDPP also measured between–grade dropout
among the SY 2012-2013 and SY 2013-2014
7th grade cohorts, and found a marginally
significant reduction in between-grade
dropout in EWS+Computers groups, but not
in EWS only schools. These results are
presented in detail in Appendix Table F.2.
46 This translates to a reduction in dropout of about 1,500 students in EWS only schools and of 1,200 students in EWS
+ Computer schools. This gross calculation uses rounded numbers and assumes that impacts would be similar for all
students in the target grades in study schools. Under alternate assumptions these numbers could vary.
47 We also estimated the treatment-on-the-treated (TOT) impacts for students who were identified through the EWS
for SDPP services using quasi-experimental techniques. The TOT estimates are consistent with the impacts for at-risk
students presented here (See Appendix J for details).
Impacts on dropout in Cambodia: What does
this mean?
Favorable impacts on dropout mean that more
students remained in school than would have
without SDPP.
SDPP reduced dropout by 6 percent (about 1,500
students) in EWS only schools, and reduced
dropout by 4 percent (about 1,200 students) in
EWS + Computer schools.
SDPP reduced dropout for at-risk students by 11
percent (about 2,000 students) in the EWS only
schools.
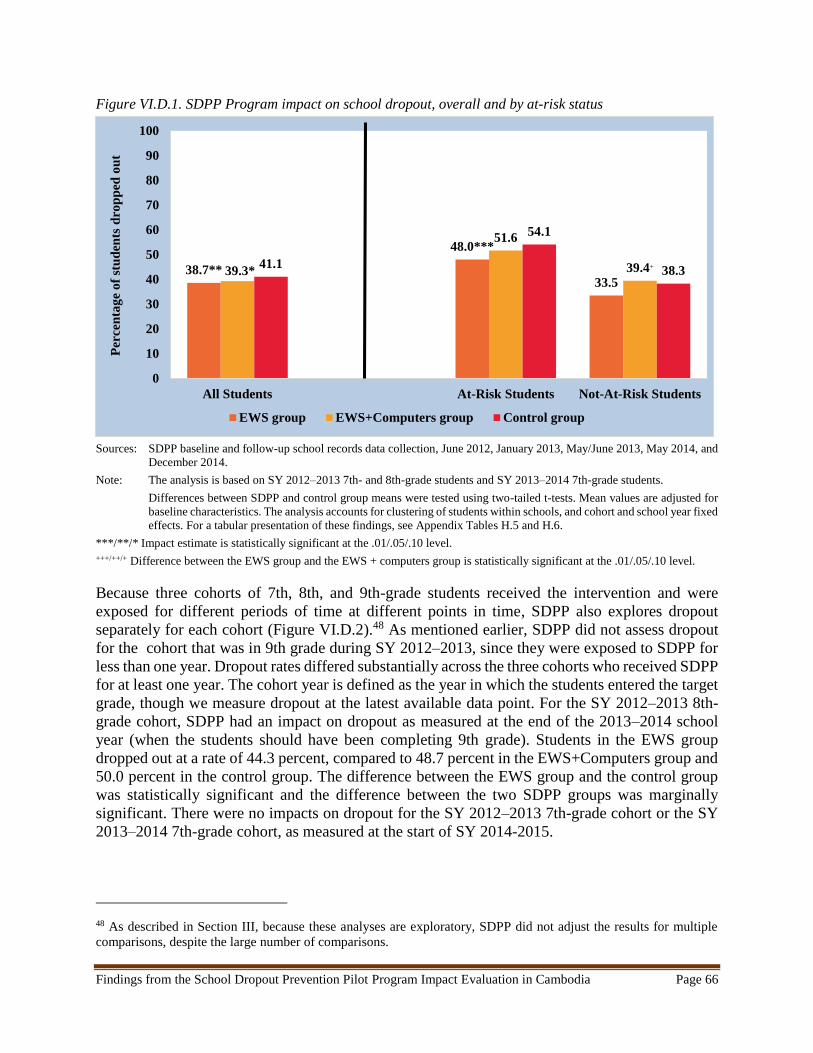
Findings from the School Dropout Prevention Pilot Program Impact Evaluation in Cambodia Page 66
Figure VI.D.1. SDPP Program impact on school dropout, overall and by at-risk status
Sources: SDPP baseline and follow-up school records data collection, June 2012, January 2013, May/June 2013, May 2014, and
December 2014.
Note: The analysis is based on SY 2012–2013 7th- and 8th-grade students and SY 2013–2014 7th-grade students.
Differences between SDPP and control group means were tested using two-tailed t-tests. Mean values are adjusted for
baseline characteristics. The analysis accounts for clustering of students within schools, and cohort and school year fixed
effects. For a tabular presentation of these findings, see Appendix Tables H.5 and H.6.
***/**/* Impact estimate is statistically significant at the .01/.05/.10 level.
+++/++/+ Difference between the EWS group and the EWS + computers group is statistically significant at the .01/.05/.10 level.
Because three cohorts of 7th, 8th, and 9th-grade students received the intervention and were
exposed for different periods of time at different points in time, SDPP also explores dropout
separately for each cohort (Figure VI.D.2).48 As mentioned earlier, SDPP did not assess dropout
for the cohort that was in 9th grade during SY 2012–2013, since they were exposed to SDPP for
less than one year. Dropout rates differed substantially across the three cohorts who received SDPP
for at least one year. The cohort year is defined as the year in which the students entered the target
grade, though we measure dropout at the latest available data point. For the SY 2012–2013 8th-
grade cohort, SDPP had an impact on dropout as measured at the end of the 2013–2014 school
year (when the students should have been completing 9th grade). Students in the EWS group
dropped out at a rate of 44.3 percent, compared to 48.7 percent in the EWS+Computers group and
50.0 percent in the control group. The difference between the EWS group and the control group
was statistically significant and the difference between the two SDPP groups was marginally
significant. There were no impacts on dropout for the SY 2012–2013 7th-grade cohort or the SY
2013–2014 7th-grade cohort, as measured at the start of SY 2014-2015.
48 As described in Section III, because these analyses are exploratory, SDPP did not adjust the results for multiple
comparisons, despite the large number of comparisons.
38.7**
48.0***
33.539.3*
51.6
39.4+41.1
54.1
38.3
0
10
20
30
40
50
60
70
80
90
100
All Students At-Risk Students Not-At-Risk Students
Per
cen
tag
e o
f st
ud
ents
dro
pp
ed o
ut
EWS group EWS+Computers group Control group
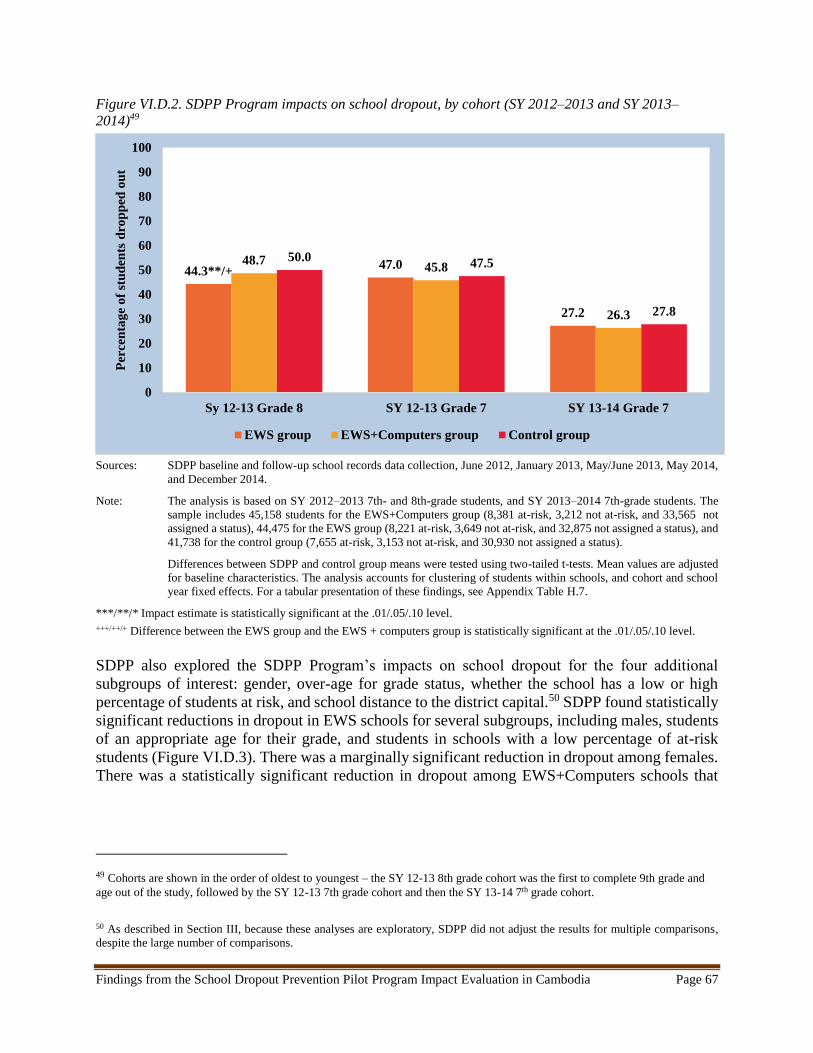
Findings from the School Dropout Prevention Pilot Program Impact Evaluation in Cambodia Page 67
Figure VI.D.2. SDPP Program impacts on school dropout, by cohort (SY 2012–2013 and SY 2013–
2014)49
Sources: SDPP baseline and follow-up school records data collection, June 2012, January 2013, May/June 2013, May 2014,
and December 2014.
Note: The analysis is based on SY 2012–2013 7th- and 8th-grade students, and SY 2013–2014 7th-grade students. The
sample includes 45,158 students for the EWS+Computers group (8,381 at-risk, 3,212 not at-risk, and 33,565 not
assigned a status), 44,475 for the EWS group (8,221 at-risk, 3,649 not at-risk, and 32,875 not assigned a status), and
41,738 for the control group (7,655 at-risk, 3,153 not at-risk, and 30,930 not assigned a status).
Differences between SDPP and control group means were tested using two-tailed t-tests. Mean values are adjusted
for baseline characteristics. The analysis accounts for clustering of students within schools, and cohort and school
year fixed effects. For a tabular presentation of these findings, see Appendix Table H.7.
***/**/* Impact estimate is statistically significant at the .01/.05/.10 level.
+++/++/+ Difference between the EWS group and the EWS + computers group is statistically significant at the .01/.05/.10 level.
SDPP also explored the SDPP Program’s impacts on school dropout for the four additional
subgroups of interest: gender, over-age for grade status, whether the school has a low or high
percentage of students at risk, and school distance to the district capital.50 SDPP found statistically
significant reductions in dropout in EWS schools for several subgroups, including males, students
of an appropriate age for their grade, and students in schools with a low percentage of at-risk
students (Figure VI.D.3). There was a marginally significant reduction in dropout among females.
There was a statistically significant reduction in dropout among EWS+Computers schools that
49 Cohorts are shown in the order of oldest to youngest – the SY 12-13 8th grade cohort was the first to complete 9th grade and
age out of the study, followed by the SY 12-13 7th grade cohort and then the SY 13-14 7th grade cohort.
50 As described in Section III, because these analyses are exploratory, SDPP did not adjust the results for multiple comparisons,
despite the large number of comparisons.
44.3**/+47.0
27.2
48.745.8
26.3
50.047.5
27.8
0
10
20
30
40
50
60
70
80
90
100
Sy 12-13 Grade 8 SY 12-13 Grade 7 SY 13-14 Grade 7
Per
cen
tag
e o
f st
ud
ents
dro
pp
ed o
ut
EWS group EWS+Computers group Control group
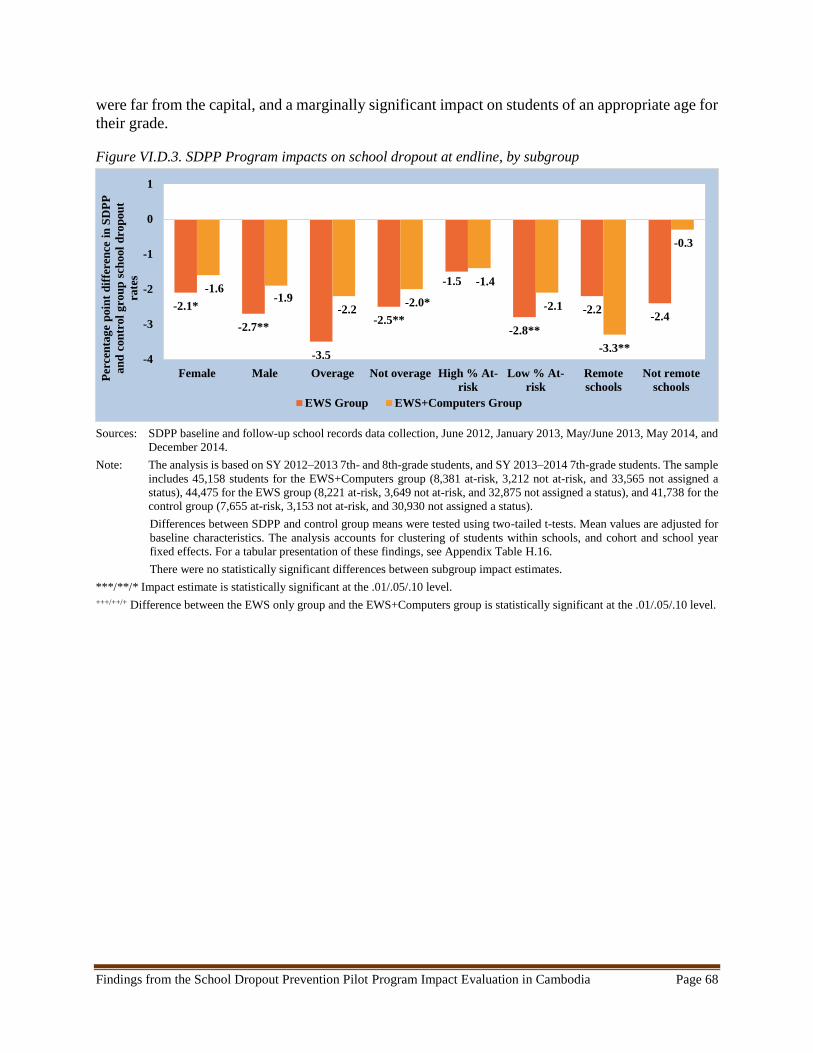
Findings from the School Dropout Prevention Pilot Program Impact Evaluation in Cambodia Page 68
were far from the capital, and a marginally significant impact on students of an appropriate age for
their grade.
Figure VI.D.3. SDPP Program impacts on school dropout at endline, by subgroup
Sources: SDPP baseline and follow-up school records data collection, June 2012, January 2013, May/June 2013, May 2014, and
December 2014.
Note: The analysis is based on SY 2012–2013 7th- and 8th-grade students, and SY 2013–2014 7th-grade students. The sample
includes 45,158 students for the EWS+Computers group (8,381 at-risk, 3,212 not at-risk, and 33,565 not assigned a
status), 44,475 for the EWS group (8,221 at-risk, 3,649 not at-risk, and 32,875 not assigned a status), and 41,738 for the
control group (7,655 at-risk, 3,153 not at-risk, and 30,930 not assigned a status).
Differences between SDPP and control group means were tested using two-tailed t-tests. Mean values are adjusted for
baseline characteristics. The analysis accounts for clustering of students within schools, and cohort and school year
fixed effects. For a tabular presentation of these findings, see Appendix Table H.16.
There were no statistically significant differences between subgroup impact estimates.
***/**/* Impact estimate is statistically significant at the .01/.05/.10 level.
+++/++/+ Difference between the EWS only group and the EWS+Computers group is statistically significant at the .01/.05/.10 level.
-2.1*
-2.7**
-3.5
-2.5**
-1.5
-2.8**
-2.2-2.4
-1.6-1.9
-2.2-2.0*
-1.4
-2.1
-3.3**
-0.3
-4
-3
-2
-1
0
1
Female Male Overage Not overage High % At-
risk
Low % At-
risk
Remote
schools
Not remote
schools
Per
cen
tag
e p
oin
t d
iffe
ren
ce i
n S
DP
P
an
d c
on
trol
gro
up
sch
ool
dro
pou
t
rate
s
EWS Group EWS+Computers Group

Findings from the School Dropout Prevention Pilot Program Impact Evaluation in Cambodia Page 69
Conquering Dropout in Cambodia—One Student at a Time
I’m very happy that I have completed 9
years of basic education and I am
committed to becoming an engineer in
the future,” says Em Vibol, a grade 10
student at Rohal High School in Banteay
Meanchey, a northwestern province in
Cambodia. A year earlier, Vibol was
identified as at risk of dropping out of
school by the Early Warning System, an
intervention of USAID’s School
Dropout Prevention Pilot (SDPP)
Program.
When Vibol was in grade 9, he lived
with his father, grandmother and younger brother and sister; his mother and older sister had
migrated to work in Thailand. Vibol was very busy with housework—cleaning, cooking, looking
after his siblings and helping his father with rice farming—and as a result was frequently absent
from school. The frequent absences caused him to perform poorly in most subjects. Frequent
absences and poor performance are two major predictors of dropout.
Using the EWS, Vibol’s homeroom teacher, Um Kot, identified him as an at-risk student who
needed to be closely monitored and provided with additional support. She visited his home to
find out the reasons for his absence and encouraged his father to allow him to attend school
regularly. Contacting parents through home visits, letters and phone calls provides an
opportunity for teachers to inform parents of their child’s absence, discuss the problems
affecting their attendance and performance, and urge them to allow their children to complete
at least 9 years of basic education.
During the visit, Um Kot explained the significance of education to Vibol’s family. Um Kot
says, “Students’ parents were surprised to see me turn up at their home when their child had
repeated absences or when they were out of school for some time.”
Vibol’s family was not only surprised, but also happy to see that his teacher was interested and
concerned about his studies. His father, Heu Ean, did not complete primary education and did
not want his son to be like him. “As a poorly educated person, I can only find low-skilled jobs
and cannot earn much from this type of work. I promise to allow my son to go to school regularly
since I don’t want him to be low educated like me.” Vibol’s 81-year-old grandmother, Tuon Ao,
shares this sentiment. “I always remind my grandson to pay attention and study because
knowledge is a treasure which cannot be stolen.”
As a result of his teacher’s visit and extra attention, Vibol’s attendance in school improved. Over
time his performance in his coursework improved as well and he was able to complete grade 9.
Vibol and his teacher Um Kot
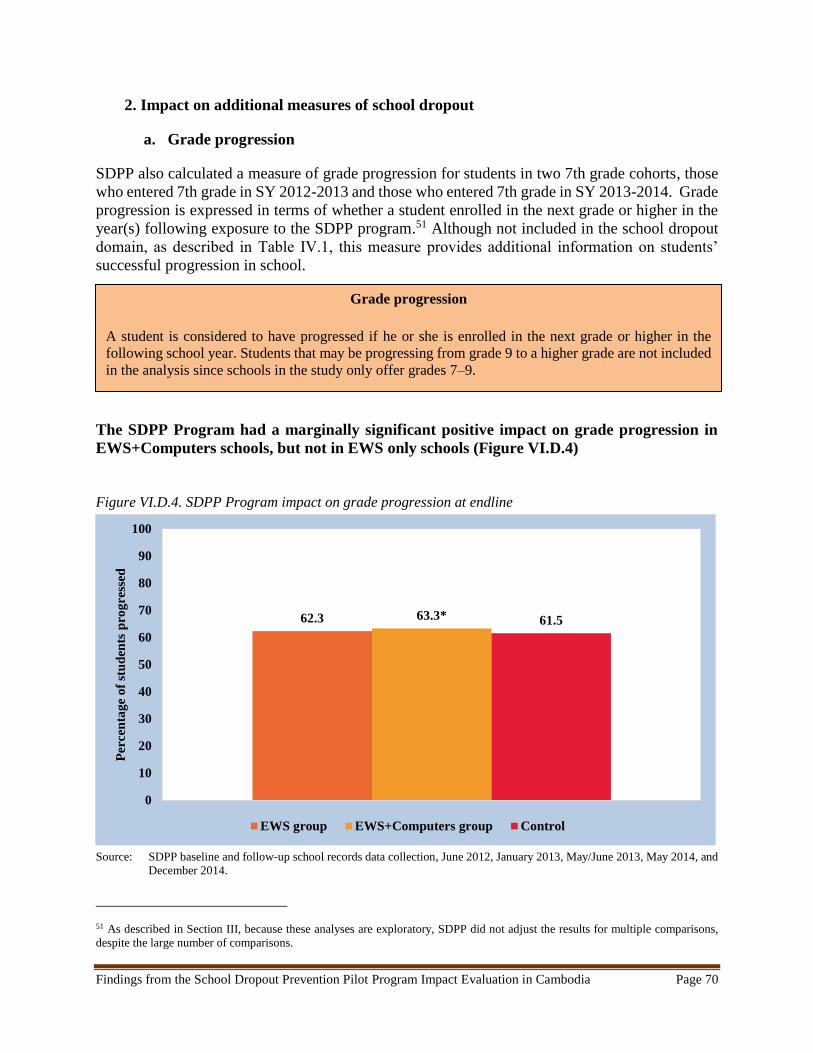
Findings from the School Dropout Prevention Pilot Program Impact Evaluation in Cambodia Page 70
2. Impact on additional measures of school dropout
a. Grade progression
SDPP also calculated a measure of grade progression for students in two 7th grade cohorts, those
who entered 7th grade in SY 2012-2013 and those who entered 7th grade in SY 2013-2014. Grade
progression is expressed in terms of whether a student enrolled in the next grade or higher in the
year(s) following exposure to the SDPP program.51 Although not included in the school dropout
domain, as described in Table IV.1, this measure provides additional information on students’
successful progression in school.
The SDPP Program had a marginally significant positive impact on grade progression in
EWS+Computers schools, but not in EWS only schools (Figure VI.D.4)
Figure VI.D.4. SDPP Program impact on grade progression at endline
Source: SDPP baseline and follow-up school records data collection, June 2012, January 2013, May/June 2013, May 2014, and
December 2014.
51 As described in Section III, because these analyses are exploratory, SDPP did not adjust the results for multiple comparisons,
despite the large number of comparisons.
62.3 63.3* 61.5
0
10
20
30
40
50
60
70
80
90
100
Per
cen
tag
e o
f st
ud
ents
pro
gre
ssed
EWS group EWS+Computers group Control
Grade progression
A student is considered to have progressed if he or she is enrolled in the next grade or higher in the
following school year. Students that may be progressing from grade 9 to a higher grade are not included
in the analysis since schools in the study only offer grades 7–9.
Findings from the School Dropout Prevention Pilot Program Impact Evaluation in Cambodia Page 71
Note: The analysis is based on SY 2012–2013 7th grade student cohort and SY 2013–2014 7th grade student cohort.
Differences between SDPP and control group means were tested using two-tailed t-tests. Mean values are adjusted for
baseline characteristics. The analysis accounts for clustering of students within schools, and cohort and school year fixed
effects. For a tabular presentation of these findings, see Appendix Table F.3.
***/**/* Impact estimate is statistically significant at the .01/.05/.10 level.
See Appendix F for findings related to the dropout domain based on alternative measures of
dropout. Also see Appendix G for findings for two additional measures of grade progression. The
first measure is defined as a student enrolling in the next grade, but not higher, in the following
school year. In the second measure, a student who started the SDPP Program while in 8th grade is
considered to have been promoted to the next grade if their school records indicated that he or she
completed 9th grade and was promoted to 10th grade.
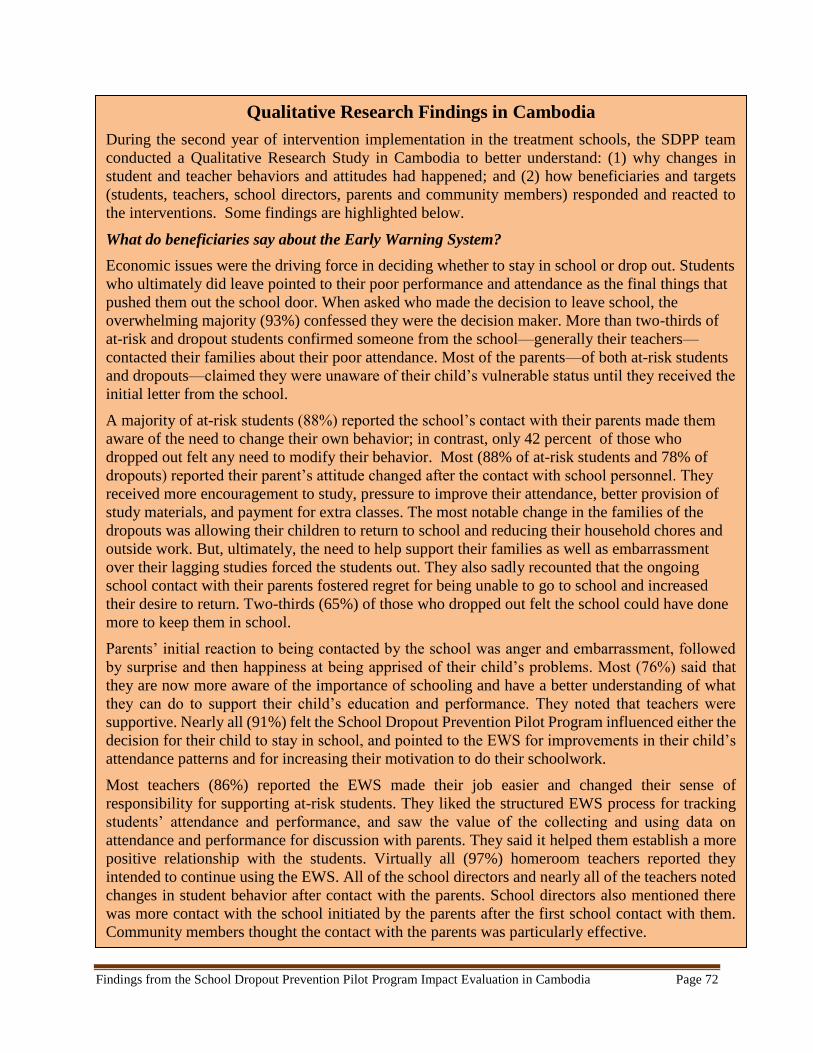
Findings from the School Dropout Prevention Pilot Program Impact Evaluation in Cambodia Page 72
Qualitative Research Findings in Cambodia
During the second year of intervention implementation in the treatment schools, the SDPP team
conducted a Qualitative Research Study in Cambodia to better understand: (1) why changes in
student and teacher behaviors and attitudes had happened; and (2) how beneficiaries and targets
(students, teachers, school directors, parents and community members) responded and reacted to
the interventions. Some findings are highlighted below.
What do beneficiaries say about the Early Warning System?
Economic issues were the driving force in deciding whether to stay in school or drop out. Students
who ultimately did leave pointed to their poor performance and attendance as the final things that
pushed them out the school door. When asked who made the decision to leave school, the
overwhelming majority (93%) confessed they were the decision maker. More than two-thirds of
at-risk and dropout students confirmed someone from the school—generally their teachers—
contacted their families about their poor attendance. Most of the parents—of both at-risk students
and dropouts—claimed they were unaware of their child’s vulnerable status until they received the
initial letter from the school.
A majority of at-risk students (88%) reported the school’s contact with their parents made them
aware of the need to change their own behavior; in contrast, only 42 percent of those who
dropped out felt any need to modify their behavior. Most (88% of at-risk students and 78% of
dropouts) reported their parent’s attitude changed after the contact with school personnel. They
received more encouragement to study, pressure to improve their attendance, better provision of
study materials, and payment for extra classes. The most notable change in the families of the
dropouts was allowing their children to return to school and reducing their household chores and
outside work. But, ultimately, the need to help support their families as well as embarrassment
over their lagging studies forced the students out. They also sadly recounted that the ongoing
school contact with their parents fostered regret for being unable to go to school and increased
their desire to return. Two-thirds (65%) of those who dropped out felt the school could have done
more to keep them in school.
Parents’ initial reaction to being contacted by the school was anger and embarrassment, followed
by surprise and then happiness at being apprised of their child’s problems. Most (76%) said that
they are now more aware of the importance of schooling and have a better understanding of what
they can do to support their child’s education and performance. They noted that teachers were
supportive. Nearly all (91%) felt the School Dropout Prevention Pilot Program influenced either the
decision for their child to stay in school, and pointed to the EWS for improvements in their child’s
attendance patterns and for increasing their motivation to do their schoolwork.
Most teachers (86%) reported the EWS made their job easier and changed their sense of
responsibility for supporting at-risk students. They liked the structured EWS process for tracking
students’ attendance and performance, and saw the value of the collecting and using data on
attendance and performance for discussion with parents. They said it helped them establish a more
positive relationship with the students. Virtually all (97%) homeroom teachers reported they
intended to continue using the EWS. All of the school directors and nearly all of the teachers noted
changes in student behavior after contact with the parents. School directors also mentioned there
was more contact with the school initiated by the parents after the first school contact with them.
Community members thought the contact with the parents was particularly effective.
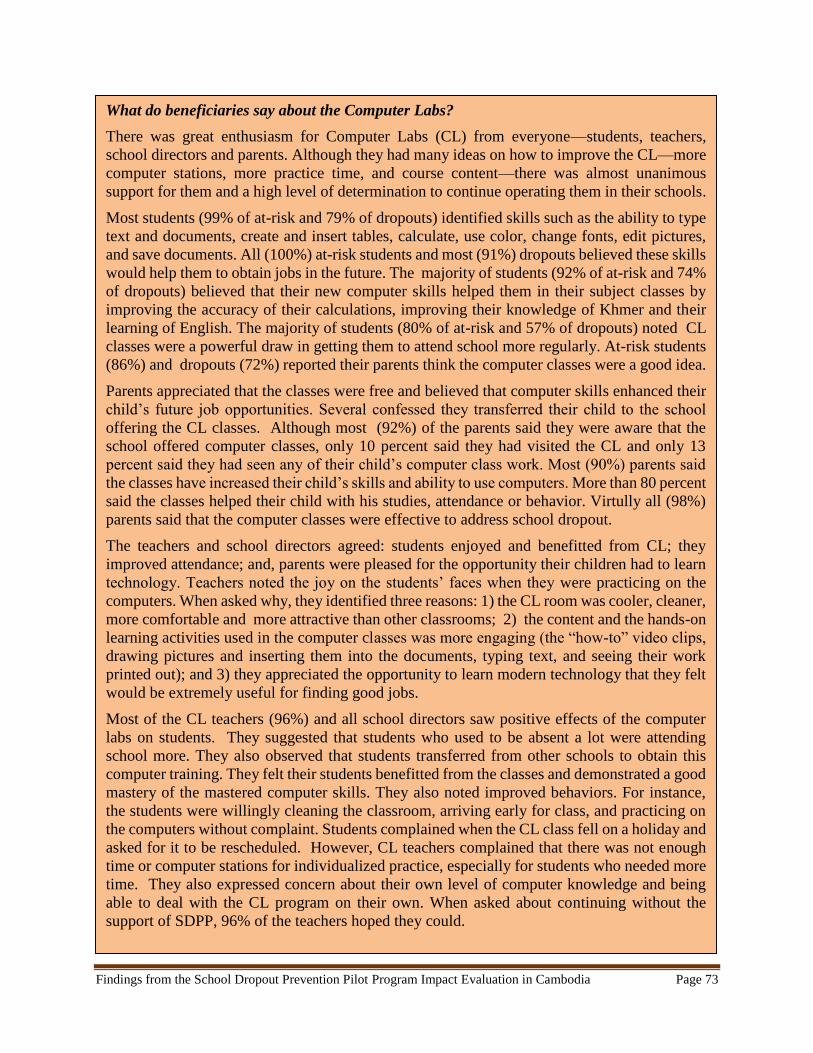
Findings from the School Dropout Prevention Pilot Program Impact Evaluation in Cambodia Page 73
What do beneficiaries say about the Computer Labs?
There was great enthusiasm for Computer Labs (CL) from everyone—students, teachers,
school directors and parents. Although they had many ideas on how to improve the CL—more
computer stations, more practice time, and course content—there was almost unanimous
support for them and a high level of determination to continue operating them in their schools.
Most students (99% of at-risk and 79% of dropouts) identified skills such as the ability to type
text and documents, create and insert tables, calculate, use color, change fonts, edit pictures,
and save documents. All (100%) at-risk students and most (91%) dropouts believed these skills
would help them to obtain jobs in the future. The majority of students (92% of at-risk and 74%
of dropouts) believed that their new computer skills helped them in their subject classes by
improving the accuracy of their calculations, improving their knowledge of Khmer and their
learning of English. The majority of students (80% of at-risk and 57% of dropouts) noted CL
classes were a powerful draw in getting them to attend school more regularly. At-risk students
(86%) and dropouts (72%) reported their parents think the computer classes were a good idea.
Parents appreciated that the classes were free and believed that computer skills enhanced their
child’s future job opportunities. Several confessed they transferred their child to the school
offering the CL classes. Although most (92%) of the parents said they were aware that the
school offered computer classes, only 10 percent said they had visited the CL and only 13
percent said they had seen any of their child’s computer class work. Most (90%) parents said
the classes have increased their child’s skills and ability to use computers. More than 80 percent
said the classes helped their child with his studies, attendance or behavior. Virtully all (98%)
parents said that the computer classes were effective to address school dropout.
The teachers and school directors agreed: students enjoyed and benefitted from CL; they
improved attendance; and, parents were pleased for the opportunity their children had to learn
technology. Teachers noted the joy on the students’ faces when they were practicing on the
computers. When asked why, they identified three reasons: 1) the CL room was cooler, cleaner,
more comfortable and more attractive than other classrooms; 2) the content and the hands-on
learning activities used in the computer classes was more engaging (the “how-to” video clips,
drawing pictures and inserting them into the documents, typing text, and seeing their work
printed out); and 3) they appreciated the opportunity to learn modern technology that they felt
would be extremely useful for finding good jobs.
Most of the CL teachers (96%) and all school directors saw positive effects of the computer
labs on students. They suggested that students who used to be absent a lot were attending
school more. They also observed that students transferred from other schools to obtain this
computer training. They felt their students benefitted from the classes and demonstrated a good
mastery of the mastered computer skills. They also noted improved behaviors. For instance,
the students were willingly cleaning the classroom, arriving early for class, and practicing on
the computers without complaint. Students complained when the CL class fell on a holiday and
asked for it to be rescheduled. However, CL teachers complained that there was not enough
time or computer stations for individualized practice, especially for students who needed more
time. They also expressed concern about their own level of computer knowledge and being
able to deal with the CL program on their own. When asked about continuing without the
support of SDPP, 96% of the teachers hoped they could.
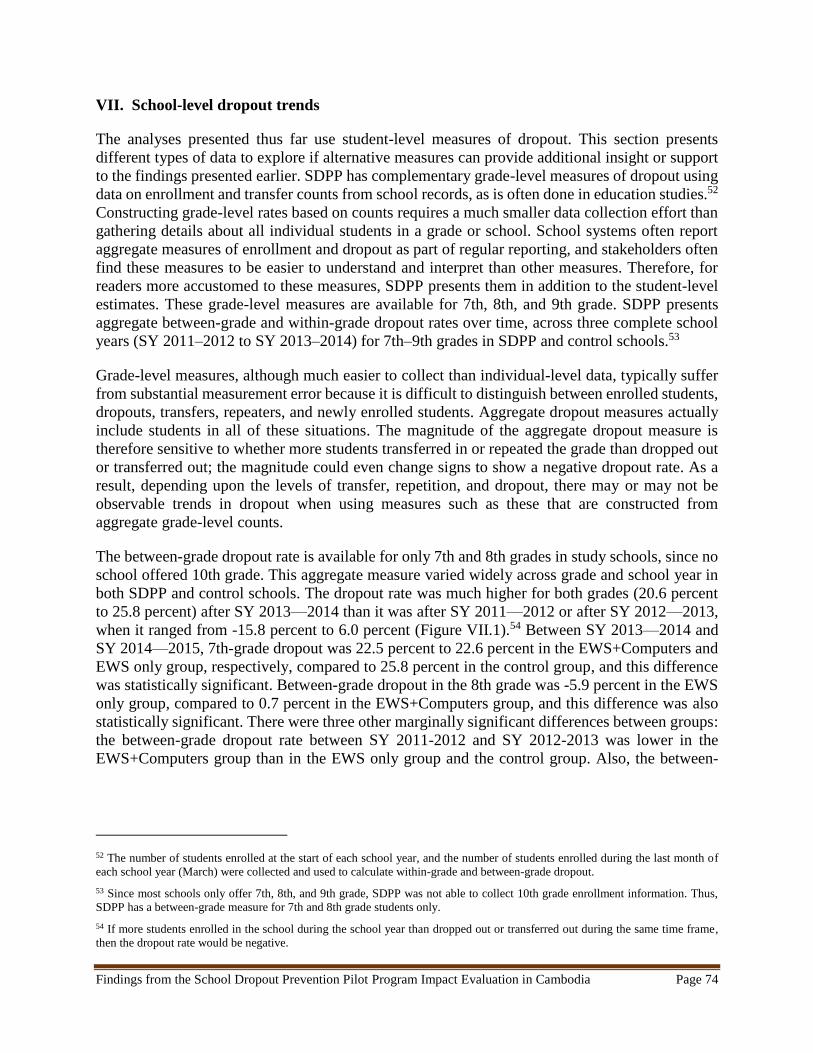
Findings from the School Dropout Prevention Pilot Program Impact Evaluation in Cambodia Page 74
VII. School-level dropout trends
The analyses presented thus far use student-level measures of dropout. This section presents
different types of data to explore if alternative measures can provide additional insight or support
to the findings presented earlier. SDPP has complementary grade-level measures of dropout using
data on enrollment and transfer counts from school records, as is often done in education studies.52
Constructing grade-level rates based on counts requires a much smaller data collection effort than
gathering details about all individual students in a grade or school. School systems often report
aggregate measures of enrollment and dropout as part of regular reporting, and stakeholders often
find these measures to be easier to understand and interpret than other measures. Therefore, for
readers more accustomed to these measures, SDPP presents them in addition to the student-level
estimates. These grade-level measures are available for 7th, 8th, and 9th grade. SDPP presents
aggregate between-grade and within-grade dropout rates over time, across three complete school
years (SY 2011–2012 to SY 2013–2014) for 7th–9th grades in SDPP and control schools.53
Grade-level measures, although much easier to collect than individual-level data, typically suffer
from substantial measurement error because it is difficult to distinguish between enrolled students,
dropouts, transfers, repeaters, and newly enrolled students. Aggregate dropout measures actually
include students in all of these situations. The magnitude of the aggregate dropout measure is
therefore sensitive to whether more students transferred in or repeated the grade than dropped out
or transferred out; the magnitude could even change signs to show a negative dropout rate. As a
result, depending upon the levels of transfer, repetition, and dropout, there may or may not be
observable trends in dropout when using measures such as these that are constructed from
aggregate grade-level counts.
The between-grade dropout rate is available for only 7th and 8th grades in study schools, since no
school offered 10th grade. This aggregate measure varied widely across grade and school year in
both SDPP and control schools. The dropout rate was much higher for both grades (20.6 percent
to 25.8 percent) after SY 2013—2014 than it was after SY 2011—2012 or after SY 2012—2013,
when it ranged from -15.8 percent to 6.0 percent (Figure VII.1).54 Between SY 2013—2014 and
SY 2014—2015, 7th-grade dropout was 22.5 percent to 22.6 percent in the EWS+Computers and
EWS only group, respectively, compared to 25.8 percent in the control group, and this difference
was statistically significant. Between-grade dropout in the 8th grade was -5.9 percent in the EWS
only group, compared to 0.7 percent in the EWS+Computers group, and this difference was also
statistically significant. There were three other marginally significant differences between groups:
the between-grade dropout rate between SY 2011-2012 and SY 2012-2013 was lower in the
EWS+Computers group than in the EWS only group and the control group. Also, the between-
52 The number of students enrolled at the start of each school year, and the number of students enrolled during the last month of
each school year (March) were collected and used to calculate within-grade and between-grade dropout.
53 Since most schools only offer 7th, 8th, and 9th grade, SDPP was not able to collect 10th grade enrollment information. Thus,
SDPP has a between-grade measure for 7th and 8th grade students only.
54 If more students enrolled in the school during the school year than dropped out or transferred out during the same time frame,
then the dropout rate would be negative.
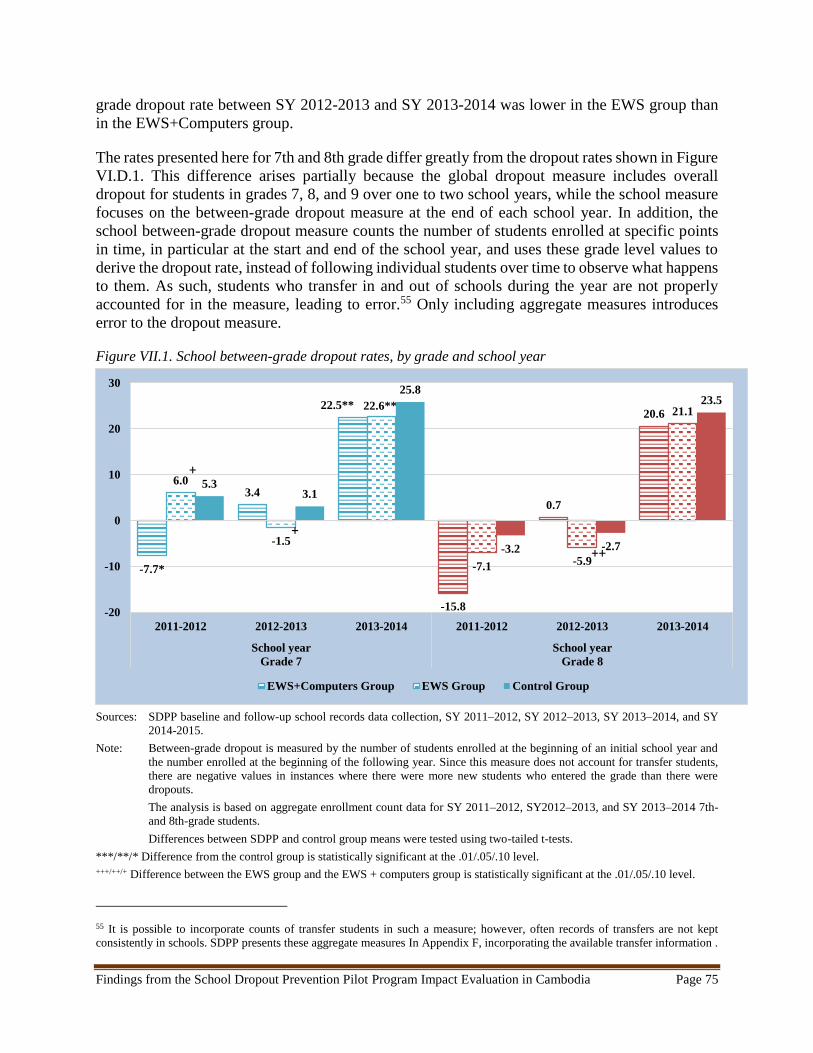
Findings from the School Dropout Prevention Pilot Program Impact Evaluation in Cambodia Page 75
grade dropout rate between SY 2012-2013 and SY 2013-2014 was lower in the EWS group than
in the EWS+Computers group.
The rates presented here for 7th and 8th grade differ greatly from the dropout rates shown in Figure
VI.D.1. This difference arises partially because the global dropout measure includes overall
dropout for students in grades 7, 8, and 9 over one to two school years, while the school measure
focuses on the between-grade dropout measure at the end of each school year. In addition, the
school between-grade dropout measure counts the number of students enrolled at specific points
in time, in particular at the start and end of the school year, and uses these grade level values to
derive the dropout rate, instead of following individual students over time to observe what happens
to them. As such, students who transfer in and out of schools during the year are not properly
accounted for in the measure, leading to error.55 Only including aggregate measures introduces
error to the dropout measure.
Figure VII.1. School between-grade dropout rates, by grade and school year
Sources: SDPP baseline and follow-up school records data collection, SY 2011–2012, SY 2012–2013, SY 2013–2014, and SY
2014-2015.
Note: Between-grade dropout is measured by the number of students enrolled at the beginning of an initial school year and
the number enrolled at the beginning of the following year. Since this measure does not account for transfer students,
there are negative values in instances where there were more new students who entered the grade than there were
dropouts.
The analysis is based on aggregate enrollment count data for SY 2011–2012, SY2012–2013, and SY 2013–2014 7th-
and 8th-grade students.
Differences between SDPP and control group means were tested using two-tailed t-tests.
***/**/* Difference from the control group is statistically significant at the .01/.05/.10 level.
+++/++/+ Difference between the EWS group and the EWS + computers group is statistically significant at the .01/.05/.10 level.
55 It is possible to incorporate counts of transfer students in such a measure; however, often records of transfers are not kept
consistently in schools. SDPP presents these aggregate measures In Appendix F, incorporating the available transfer information .
-7.7*
3.4
22.5**
-15.8
0.7
20.6
6.0
-1.5
22.6**
-7.1-5.9
21.1
5.33.1
25.8
-3.2 -2.7
23.5
-20
-10
0
10
20
30
2011-2012 2012-2013 2013-2014 2011-2012 2012-2013 2013-2014
School year
Grade 7
School year
Grade 8
EWS+Computers Group EWS Group Control Group
+
+
++
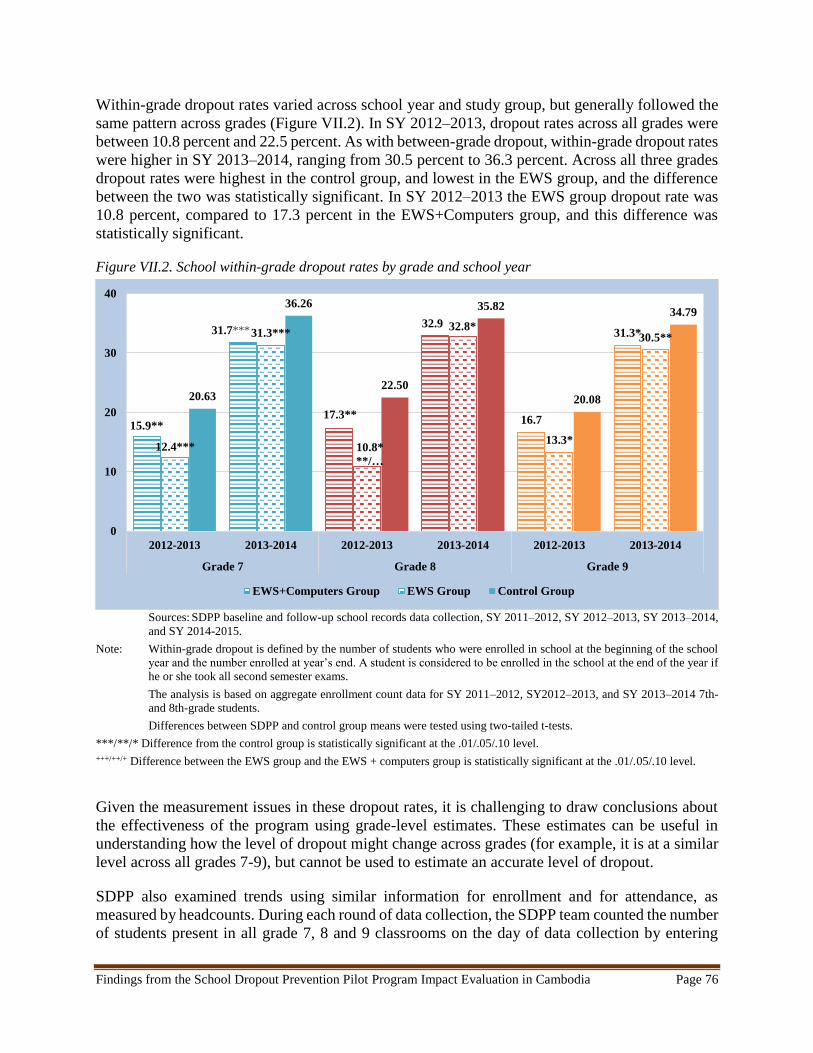
Findings from the School Dropout Prevention Pilot Program Impact Evaluation in Cambodia Page 76
Within-grade dropout rates varied across school year and study group, but generally followed the
same pattern across grades (Figure VII.2). In SY 2012–2013, dropout rates across all grades were
between 10.8 percent and 22.5 percent. As with between-grade dropout, within-grade dropout rates
were higher in SY 2013–2014, ranging from 30.5 percent to 36.3 percent. Across all three grades
dropout rates were highest in the control group, and lowest in the EWS group, and the difference
between the two was statistically significant. In SY 2012–2013 the EWS group dropout rate was
10.8 percent, compared to 17.3 percent in the EWS+Computers group, and this difference was
statistically significant.
Figure VII.2. School within-grade dropout rates by grade and school year
Sources: SDPP baseline and follow-up school records data collection, SY 2011–2012, SY 2012–2013, SY 2013–2014,
and SY 2014-2015.
Note: Within-grade dropout is defined by the number of students who were enrolled in school at the beginning of the school
year and the number enrolled at year’s end. A student is considered to be enrolled in the school at the end of the year if
he or she took all second semester exams.
The analysis is based on aggregate enrollment count data for SY 2011–2012, SY2012–2013, and SY 2013–2014 7th-
and 8th-grade students.
Differences between SDPP and control group means were tested using two-tailed t-tests.
***/**/* Difference from the control group is statistically significant at the .01/.05/.10 level.
+++/++/+ Difference between the EWS group and the EWS + computers group is statistically significant at the .01/.05/.10 level.
Given the measurement issues in these dropout rates, it is challenging to draw conclusions about
the effectiveness of the program using grade-level estimates. These estimates can be useful in
understanding how the level of dropout might change across grades (for example, it is at a similar
level across all grades 7-9), but cannot be used to estimate an accurate level of dropout.
SDPP also examined trends using similar information for enrollment and for attendance, as
measured by headcounts. During each round of data collection, the SDPP team counted the number
of students present in all grade 7, 8 and 9 classrooms on the day of data collection by entering
15.9**
31.7***
17.3**
32.9
16.7
31.3*
12.4***
31.3***
10.8*
**/…
32.8*
13.3*
30.5**
20.63
36.26
22.50
35.82
20.08
34.79
0
10
20
30
40
2012-2013 2013-2014 2012-2013 2013-2014 2012-2013 2013-2014
Grade 7 Grade 8 Grade 9
EWS+Computers Group EWS Group Control Group
Findings from the School Dropout Prevention Pilot Program Impact Evaluation in Cambodia Page 77
classrooms during a mid-point in the school day and counting the number of students present. The
headcounts collected by SDPP during each data collection round show that the average number of
grade 7, 8 and 9 students present at the time of data collection was generally similar in SDPP and
control schools, though there were some differences but no clear trend over time across groups.
This number was then compared to attendance measures derived from student level data in order
to determine how similar the two data sources were. Typically, the average number of students
present was lower as determined through the head count when compared to attendance rates
obtained directly from school records. Appendix I presents these findings in more detail.
VIII. Discussion
The SDPP Program in Cambodia aimed to reduce school dropout among students in 7th, 8th, and
9th-grade—the lower secondary grades in Cambodia. SDPP interventions included an EWS to
identify and target support to students at risk of dropout and computer labs to induce child
engagement and attachment to school. SDPP hypothesized that computer labs for students, along
with changes in teacher practices and involvement of parents introduced through the EWS, would
improve student attitudes and behavior, translating into increased student engagement and reduced
school dropout. The SDPP evaluation in Cambodia examined the effectiveness of SDPP using a
randomized controlled trial in which SDPP compares the outcomes of students and teachers in 108
schools randomly assigned to provide EWS services and computer labs (EWS+Computers) and in
107 schools randomly assigned to provide EWS services only, to those of teachers and students in
107 schools randomly assigned to a control group providing business-as-usual services. The
evaluation of the SDPP Program in Cambodia is part of a broader study of similar dropout
prevention interventions implemented in four Asian countries.
A. Overview of findings
SDPP examined the effectiveness of the SDPP Program on the primary and additional outcomes
SDPP was intended to affect related to teacher practices, at-risk student’s attitudes toward school,
student engagement in school, and school dropout. Figure VIII.A.1 shows SDPP’s impacts
according to its theory of change. The boxes banded in red show the outcomes on which SDPP
had statistically significant or marginally statistically significant impact as measured by the impact
evaluation.
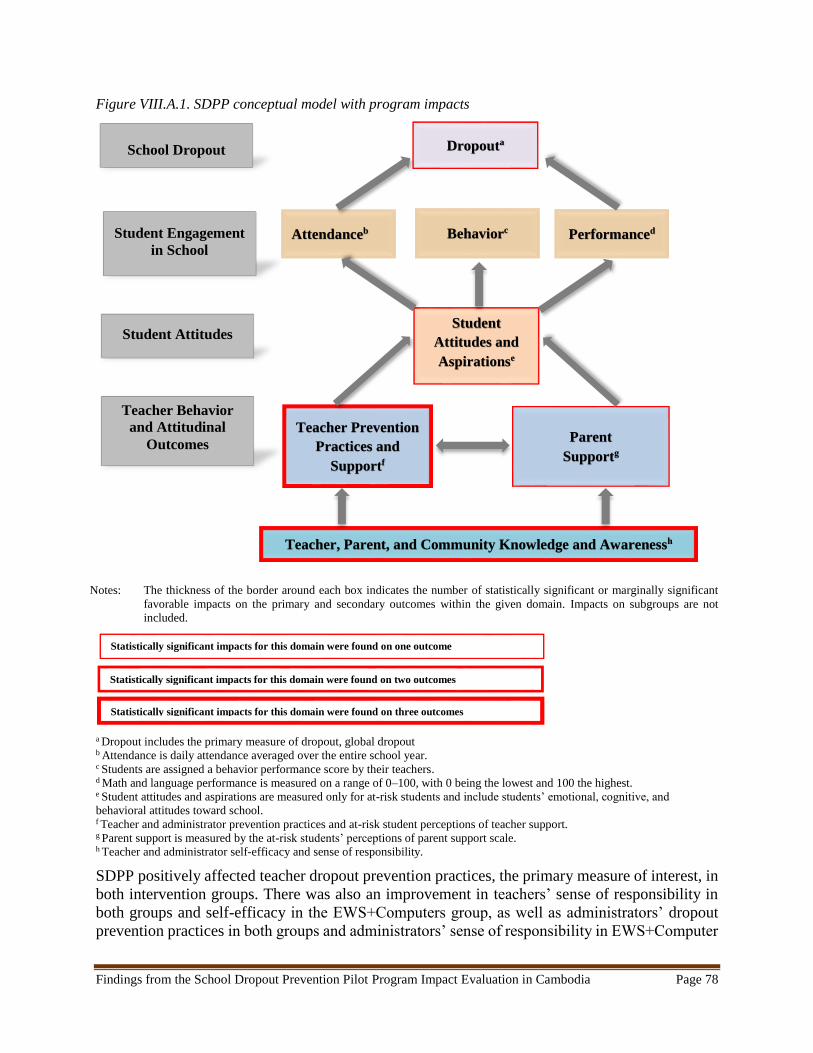
Findings from the School Dropout Prevention Pilot Program Impact Evaluation in Cambodia Page 78
Figure VIII.A.1. SDPP conceptual model with program impacts
Notes: The thickness of the border around each box indicates the number of statistically significant or marginally significant
favorable impacts on the primary and secondary outcomes within the given domain. Impacts on subgroups are not
included.
a Dropout includes the primary measure of dropout, global dropout b Attendance is daily attendance averaged over the entire school year. c Students are assigned a behavior performance score by their teachers. d Math and language performance is measured on a range of 0–100, with 0 being the lowest and 100 the highest. e Student attitudes and aspirations are measured only for at-risk students and include students’ emotional, cognitive, and
behavioral attitudes toward school. f Teacher and administrator prevention practices and at-risk student perceptions of teacher support.
g Parent support is measured by the at-risk students’ perceptions of parent support scale. h Teacher and administrator self-efficacy and sense of responsibility.
SDPP positively affected teacher dropout prevention practices, the primary measure of interest, in
both intervention groups. There was also an improvement in teachers’ sense of responsibility in
both groups and self-efficacy in the EWS+Computers group, as well as administrators’ dropout
prevention practices in both groups and administrators’ sense of responsibility in EWS+Computer
Teacher, Parent, and Community Knowledge and Awarenessh
Parent
Supportg
Teacher Prevention
Practices and
Supportf
Student
Attitudes and
Aspirationse
Behaviorc Performanced
Dropouta
Attendanceb
School Dropout
Student Engagement
in School
Student Attitudes
Teacher Behavior
and Attitudinal
Outcomes
Statistically significant impacts for this domain were found on one outcome
Statistically significant impacts for this domain were found on two outcomes
Statistically significant impacts for this domain were found on three outcomes
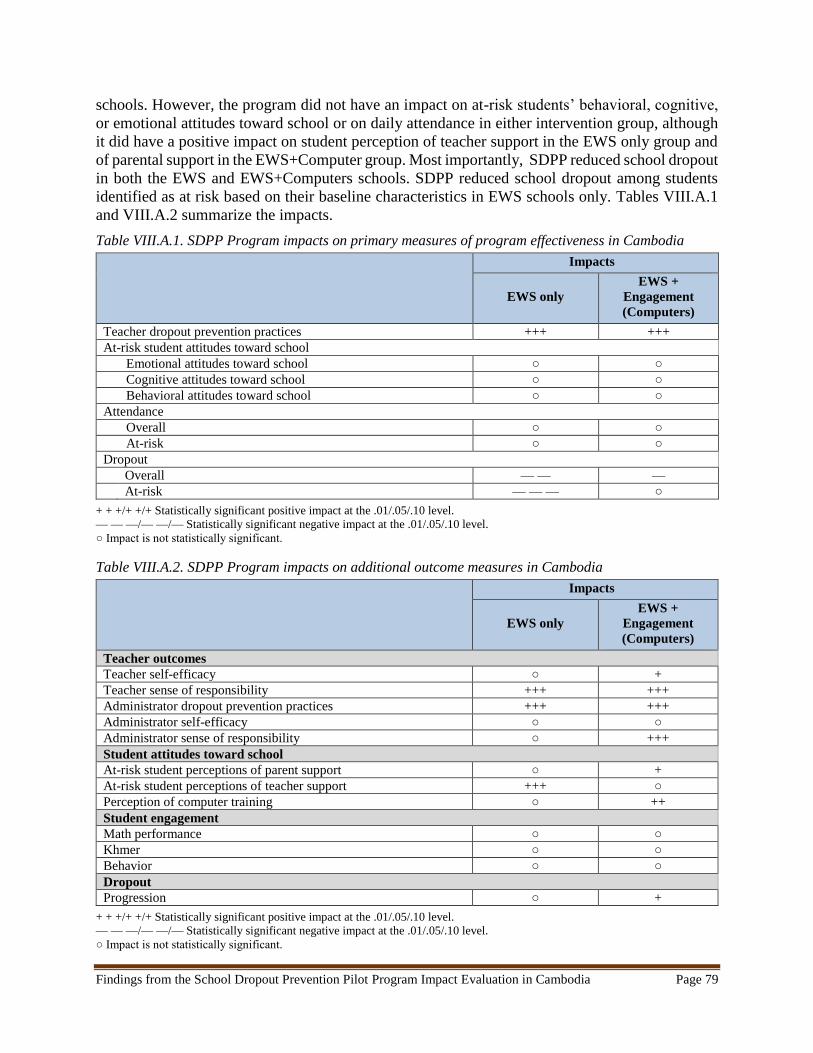
Findings from the School Dropout Prevention Pilot Program Impact Evaluation in Cambodia Page 79
schools. However, the program did not have an impact on at-risk students’ behavioral, cognitive,
or emotional attitudes toward school or on daily attendance in either intervention group, although
it did have a positive impact on student perception of teacher support in the EWS only group and
of parental support in the EWS+Computer group. Most importantly, SDPP reduced school dropout
in both the EWS and EWS+Computers schools. SDPP reduced school dropout among students
identified as at risk based on their baseline characteristics in EWS schools only. Tables VIII.A.1
and VIII.A.2 summarize the impacts.
Table VIII.A.1. SDPP Program impacts on primary measures of program effectiveness in Cambodia
Impacts
EWS only
EWS +
Engagement
(Computers)
Teacher dropout prevention practices +++ +++
At-risk student attitudes toward school
Emotional attitudes toward school ○ ○
Cognitive attitudes toward school ○ ○
Behavioral attitudes toward school ○ ○
Attendance
Overall ○ ○
At-risk ○ ○
Dropout
Overall — — —
At-risk — — — ○
+ + +/+ +/+ Statistically significant positive impact at the .01/.05/.10 level.
— — —/— —/— Statistically significant negative impact at the .01/.05/.10 level.
○ Impact is not statistically significant.
Table VIII.A.2. SDPP Program impacts on additional outcome measures in Cambodia
Impacts
EWS only
EWS +
Engagement
(Computers)
Teacher outcomes
Teacher self-efficacy ○ +
Teacher sense of responsibility +++ +++
Administrator dropout prevention practices +++ +++
Administrator self-efficacy ○ ○
Administrator sense of responsibility ○ +++
Student attitudes toward school
At-risk student perceptions of parent support ○ +
At-risk student perceptions of teacher support +++ ○
Perception of computer training ○ ++
Student engagement
Math performance ○ ○
Khmer ○ ○
Behavior ○ ○
Dropout
Progression ○ +
+ + +/+ +/+ Statistically significant positive impact at the .01/.05/.10 level.
— — —/— —/— Statistically significant negative impact at the .01/.05/.10 level.
○ Impact is not statistically significant.
Findings from the School Dropout Prevention Pilot Program Impact Evaluation in Cambodia Page 80
B. Contextual factors related to findings
In interpreting findings from the evaluation, it is useful to consider the policy environment in which
SDPP was implemented and other contextual factors that may have influenced its effectiveness.
SDPP succeded in reducing dropout, but not in increasing attendance. While attendance and
dropout are strongly associated, they can occur independently of one another. In Cambodia,
teacher take-up and implementation of dropout prevention practices promoted by the EWS could
be a particularly strong driver of dropout prevention. SDPP interventions worked directly with
teachers at school and parents at home to change their knowledge and awareness of dropout. As
part of the EWS, homeroom teachers monitored at-risk students’ attendance and contacted parents
if students were consistently absent. This work was intended to improve the dropout prevention
practices of teachers and parental support for students.
SDPP succeeded in increasing scores on the 8-point teacher dropout prevention practice scale by
almost one point in both the EWS+Computers and EWS only group, which represents a 15 percent
improvement relative to the control group. Both teachers’ and school administrators’ sense of
responsibility for at-risk students improved. The fidelity of implementation analysis found that the
EWS was implemented as intended (Creative Associates International and School-to-School
International 2015). Findings from the qualitative analysis confirmed that parents and community
members experienced increased communication with teachers and knew that they were
encouraging children to stay in school and attend regularly (Creative Associates International
2015). Using the EWS, schools and their teachers appear to be particularly effective in convincing
students and their parents that students sit for end-of-year exams and enroll in the next school year.
They do not seem to be as influential in ensuring daily attendance in an environment where
families’ need for students to help with work or chores at home is particularly strong. The
situational analysis findings presented earlier indicated that economic reasons are the predominant
factors for both dropping out and missing school. While parents and students seemed to have gotten
the message about not dropping out, the day-to-day imperatives of work and helping at home may
have made it difficult for SDPP to affect attendance positively. It appears possible that the EWS
succeeded in encouraging parents and students to not drop out of school completely, but was not
sufficient to reduce the barriers that keep children from attending school every day.
It was also expected that the computer labs would motivate students to attend school more
regularly, attracted by the prospect of gaining computer literacy, which most students lacked and
could acquire primarily only through costly private courses. That the computer lab program did
not increase attendance could be a result of the the way the computer literacy component was
designed and configured. The computer lab program may not have been implemented frequently
enough or with skilled enough instructors to motivate students to attend school. Three students
shared one computer terminal during the computer literacy class, so limited time for individual
student practice may have dampened enthusiasm. Findings from the qualitative analysis show that
both students and teachers were concerned that student acquisition of computer skills was
constrained by these factors, and the weak results from a early computer skills test seems to support
this.
Neither the EWS nor the computer lab component was strongly aimed at modifying student
attitudes towards school. The EWS focused on improving school support and outreach to familes
Findings from the School Dropout Prevention Pilot Program Impact Evaluation in Cambodia Page 81
of at-risk students to increase their awareness about dropout and how to help their child avoid it.
The computer literacy and lab component focused on improving the relevance of education,
offering skills that parents and students purported to value. It did not specifically target class
performance (as in Tajikistan) or student attitudes (as in India and Timor-Leste). That the student
engagement program interventions in India, Tajikistan, and Timor-Leste were all designed to
encourage students to see school as a fun and supportive place may be a subtle, but potentially
important, difference in encouraging more regular attendance. Although the presence of the
computer lab improved students’ perception of computer training it did not improve attendance,
as expected. Thus, it seems that neither the EWS services alone nor the EWS services coupled
with computer lab activities were sufficient to improve students’ attachment to schools, which
does not appear to be a necessary intermediate step in the reducing dropout in lower secondary
school in the Cambodian context.
It was also expected that the computer labs would motivate students to attend school and would
improve their perceptions of school; however, students and teachers in the EWS+Computers group
did not experience more positive impacts on any of the primary measures of program effectiveness
when compared to the EWS only group. The lack of additional positive impacts could be a result
of the the way the computer literacy component was designed and configured. The impact results
suggest that computer training and the existence of a computer lab—as provided—do not produce
sufficient benefits for at-risk students to overcome other barriers to educational participation. This
is an important finding, because adding computer labs can be a costly intervention. Findings from
the SDPP study might suggest that computer training is unlikely to be worth the substantial
investment required if the focus is on the outcomes of students at risk of dropout.
It seems that the relatively low-cost implementation of EWS alone, without an additional
engagement component, was sufficient to reduce dropout in Cambodia. The conditions in the
target provinces in Cambodia may have provided the right context for improving dropout. Dropout
in Cambodia was high (41 percent in the control group), and teacher dropout prevention practices
were relatively low (5.94 out of 8 scale score for the control group). After two years of
implementation, teachers in the EWS only and EWS+Computers groups had average scores of
6.85 and 6.83, respectively, which showed considerable improvement but were low compared to
the three other SDPP countries, where teachers scored at or above 7.4, including those in the
control group. This not only leaves room for improvement, but also suggests that with higher
teachers scores--coupled with teachers’ already high sense of responsibility--student attitudes and
behaviors may improve. It may be that an EWS is most successful at reducing dropout in countries
with poor teacher dropout prevention practices combined with a high dropout rate.
C. Conclusion
This study shows that the SDPP Program in Cambodia was successful in improving some
outcomes – particularly teacher dropout prevention practice and school dropout – but not some
intermediate outcomes such as attendance and student attitudes. Comparing these findings to those
of the rigorous evaluations of SDPP in the three other study countries with different contexts will
allow us to draw some general conclusions about the effectiveness of SDPP in the Asian context.
Additional discussion of the impacts of the SDPP Program across all SDPP countries is presented
in a separate, four-country summary report (Creative Associates International and Mathematica
Policy Research 2015).
Findings from the School Dropout Prevention Pilot Program Impact Evaluation in Cambodia Page 82
References
American Institutes of Research. “ALAS: Intervention Report.” Retrieved from
http://ies.ed.gov/ncee/wwc/interventionreport.aspx?sid=22, 2006a.
American Institutes of Research. “Check & Connect: Intervention Report.” Retrieved from
http://ies.ed.gov/ncee/wwc/interventionreport.aspx?sid=78, 2006b.
Angrist, Joshua, Eric Bettinger, Erik Bloom, Elizabeth King, and Michael Kremer. “Vouchers for
private schooling in Colombia: Evidence from a randomized natural experiment.” The
American Economic Review, vol. 92, no. 5, 2002, pp. 1535-1558.
Banerjee, Abhijit, Shawn Cole, Esther Duflo, and Leigh Linden. “Remedying Education: Evidence
from Two Randomized Experiments in India.” Quarterly Journal of Economics, vol. 122,
no. 3, 2007, pp. 1235–1264.
Benjamini, Yoav and Yosef Hochberg. “Controlling the false discovery rate: A practical and
powerful approach to multiple testing.” Journal of the Royal Statistical Society Series B
Methodological, vol. 57, no. 1, 1995, pp. 289–300.
Bloom, Howard S. “Accounting for No-Shows in Experimental Evaluation Designs.” Evaluation
Review, vol. 8, no. 2, 1984, pp. 225-246.
Brush, Lorie, Jennifer Shin, Rajani Shrestha, and Karen Tietjen. “School Dropout Prevention Pilot
Program Review of the Literature.” Report submitted to the U.S. Agency for International
Development. Washington, DC: Creative Associates International, Inc., 2011.
Creative Associates International. “School Dropout Prevention Pilot Program, Cambodia Early
Warning System: School Manual.” Report submitted to the U.S. Agency for International
Development. Washington, DC: Creative Associates International, Inc., 2012a.
Creative Associates International. “School Dropout Prevention Pilot Program Pilot Design Plan:
Cambodia.” Report submitted to the U.S. Agency for International Development.
Washington, DC: Creative Associates International, Inc., 2012b.
Creative Associates International. “Decision Rules for the Cut Point for At-Risk Students.”
Memorandum to SDPP Local Country Offices, 2012c.
Creative Associates International. “School Dropout Prevention Pilot Program; Findings From the
Situational Analysis: Factors and Conditions that Affect Dropout in Cambodia, India,
Tajikistan, and Timor-Leste.” Report submitted to the U.S. Agency for International
Development. Washington, DC: Creative Associates International, Inc., 2014a.
Creative Associates International. “Cambodia Situational Analysis: Factors and Conditions that
Affect Dropout.” Report submitted to the U.S. Agency for International Development.
Washington, DC: Creative Associates International, Inc., 2014b.
Findings from the School Dropout Prevention Pilot Program Impact Evaluation in Cambodia Page 83
Creative Associates International. “What Works: Beneficiary Perspectives on Dropout Prevention
Interventions in Cambodia” Report submitted to the U.S. Agency for International
Development. Washington, DC: Creative Associates International, Inc., 2015.
Creative Associates International and Mathematica Policy Research. “Findings from the
Four-Country School Dropout Prevention Pilot Program Impact Evaluation.” Report
submitted to the U.S. Agency for International Development. Washington, DC: Creative
Associates International, Inc., 2015.
Creative Associates International and School-to-School International. “School Dropout Prevention
Pilot Program: Summary of Findings, Fidelity of Implementation (FOI) of SDPP
Interventions in Cambodia, India, Tajikistan and Timor-Leste.” Report submitted to the
U.S. Agency for International Development. Washington, DC: Creative Associates
International, Inc., 2015.
Duflo, Esther. "Schooling and Labor Market Consequences of School Construction in Indonesia:
Evidence from an Unusual Policy Experiment." American Economic Review, vol. 91, no.
4, 2001, pp. 795-813.
Finlay, Krystina A. “Quantifying School Engagement: Research Report.” National Center for
School Engagement, 2006.
Fredericks, Jennifer A., Phyllis Blumenfeld, Jeanne Friedel, and Alison Paris. “School
engagement.” In What do children need to flourish?: Conceptualizing and measuring
indicators of positive development, edited by Kristin Anderson Moore and Laura H.
Lippman. New York, NY: Springer Science and Business Media, 2005.
Friedman, Willa, Michael Kremer, Edward Miguel, and Rebecca Thornton. “Education as
Liberation?” No. w16939. National Bureau of Economic Research, 2011.
Levy, Dan, Matt Sloan, Leigh Linden, and Harounan Kazianga. “Impact evaluation of Burkina
Faso’s BRIGHT program. Final Report.” Washington, DC: Mathematica Policy Research,
Inc. submitted to Millennium Challenge Corporation, 2009.
Miguel, Edward, and Michael Kremer. “Worms: Identifying impacts on education and health in
the presence of treatment externalities.” Econometrica, vol. 72, no. 1, 2004, pp. 159-217.
The Millennium Development Goals Report: 2013. New York, New York: United Nations, 2013.
Murray, Nancy, Quinn Moore, Larissa Campuzano, Kathy Buek, Emilie Bagby, and Mark Strayer.
“School Dropout Prevention Pilot Program: Impact Evaluation Research Plan.” Report
submitted to the U.S. Agency for International Development. Washington, DC: Creative
Associates International, Inc., 2012.
Oster, Emily, and Rebecca Thornton. “Menstruation, sanitary products, and school attendance:
Evidence from a randomized evaluation.” American Economic Journal: Applied
Economics, 2011, pp. 91-100.
Findings from the School Dropout Prevention Pilot Program Impact Evaluation in Cambodia Page 84
Petrosino, Anthony, Claire Morgan, Trevor Fronius, Emily Tanner-Smith, and Robert Boruch.
“Interventions in Developing Nations for Improving Primary and Secondary School
Enrollment of Children: A Systematic Review.” Campbell Systematic Reviews, vol. 8, no.
19, 2012.
Scheffé, Henry. “The Analysis of Variance.” New York: Wiley, 1999 [1959]. ISBN 0-471-34505-
9.
Schochet, Peter Z., and John Burghardt. “Using Propensity Scoring to Estimate Program-Related
Subgroup Impacts in Experimental Program Evaluations.” Evaluation Review, vol. 31, no.
2, 2007, pp. 95-120.
Schochet, Peter Z. “An Approach for Addressing the Multiple Testing Problem in Social Policy
Impact Evaluations.” Evaluation Review, vol. 33, no. 6, 2009.
Schultz, T. Paul. “School subsidies for the poor: Evaluating a Mexican strategy for reducing
poverty.” Washington, DC: International Food Policy Research Institute, 2001.
Shin, Jennifer, Rajani Shrestha, and Karen Tietjen. “School Dropout Prevention Pilot Program
Dropout Trend Analysis: India.” Final report submitted to the U.S. Agency for
International Development. Washington, DC: Creative Associates International, Inc.,
2011a.
Shin, Jennifer, Rajani Shrestha, and Karen Tietjen. “School Dropout Prevention Pilot Program
Dropout Trend Analysis: Timor-Leste.” Final report submitted to the U.S. Agency for
International Development. Washington, DC: Creative Associates International, Inc.,
2011b.
Shrestha, Rajani, Jennifer Shin, and Karen Tietjen. “School Dropout Prevention Pilot Program
Dropout Trend Analysis: Cambodia.” Final report submitted to the U.S. Agency for
International Development. Washington, DC: Creative Associates International, Inc.,
2011a.
Shrestha, Rajani, Jennifer Shin, and Karen Tietjen “School Dropout Prevention Pilot Program
Dropout Trend Analysis: Tajikistan.” Final report submitted to the U.S. Agency for
International Development. Washington, DC: Creative Associates International, Inc.,
2011b.
Tschannen-Moran, Megan and Anita Woolfolk Hoy. “Teacher Efficacy: Capturing an Elusive
Construct.” Teaching and Teacher Education, vol. 17, 2001, pp. 783-805.
Tsigilis, Nikolaos, Athanasios Koustelios, and Vasilios Grammatikopoulos. “Psychometric
Properties of the Teachers’ Sense of Efficacy Scale Within the Greek Educational
Context.” Journal of Psychoeducational Assessment, vol. 28, no. 2, 2010, pp. 153-162.