Embed Size (px)
Citation preview
© 2010 IBM Corporation© 2010 IBM Corporation
IBM Global Business Services – Financial Services Sector Forum
Kevin KoenigWednesday, June 23, 2010
IBM Global Business Services
Do you know everything you need to know about your company?A new attitude towards business analytics.
© 2010 IBM Corporation
IBM Global Business Services – Financial Services Sector Forum
Why Is Business Analytics and Optimization Important Now?
© 2010 IBM Corporation
IBM Global Business Services – Financial Services Sector Forum
.
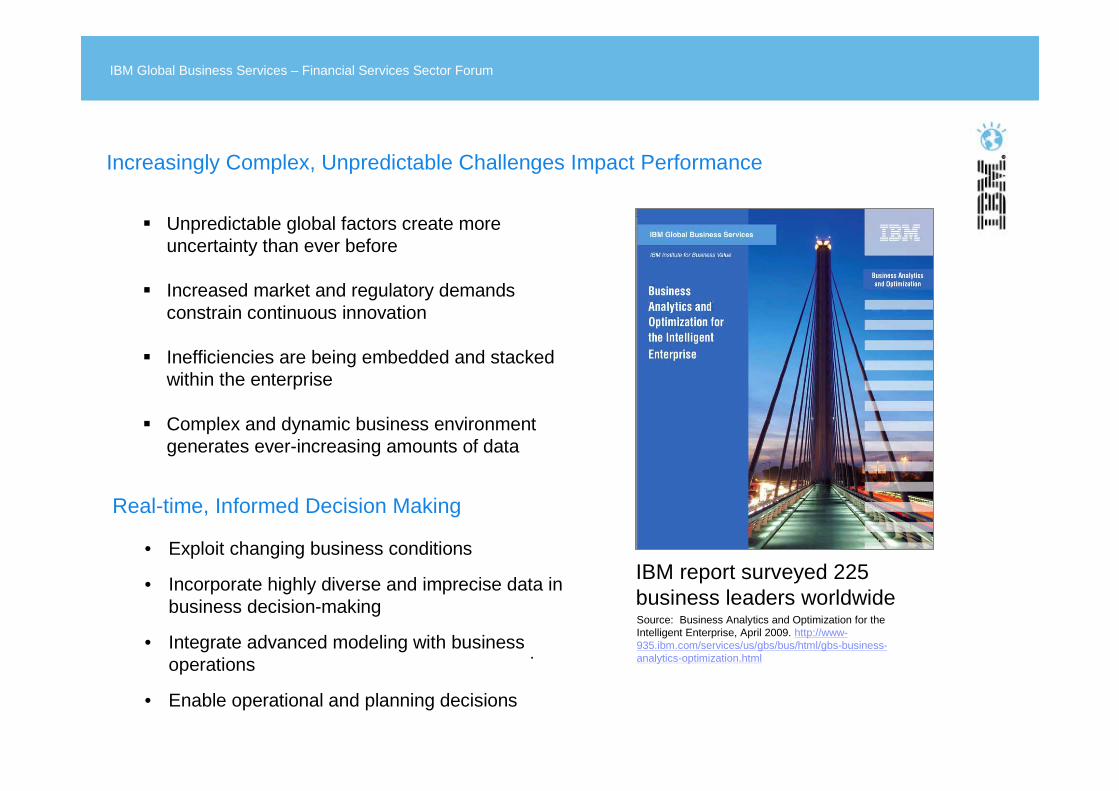
� Unpredictable global factors create more uncertainty than ever before
� Increased market and regulatory demands constrain continuous innovation
� Inefficiencies are being embedded and stacked within the enterprise
� Complex and dynamic business environment generates ever-increasing amounts of data
Increasingly Complex, Unpredictable Challenges Impact Performance
• Exploit changing business conditions
• Incorporate highly diverse and imprecise data in business decision-making
• Integrate advanced modeling with business operations
• Enable operational and planning decisions
Real-time, Informed Decision Making
IBM report surveyed 225 business leaders worldwideSource: Business Analytics and Optimization for the Intelligent Enterprise, April 2009. http://www-935.ibm.com/services/us/gbs/bus/html/gbs-business-analytics-optimization.html
© 2010 IBM Corporation
IBM Global Business Services – Financial Services Sector Forum
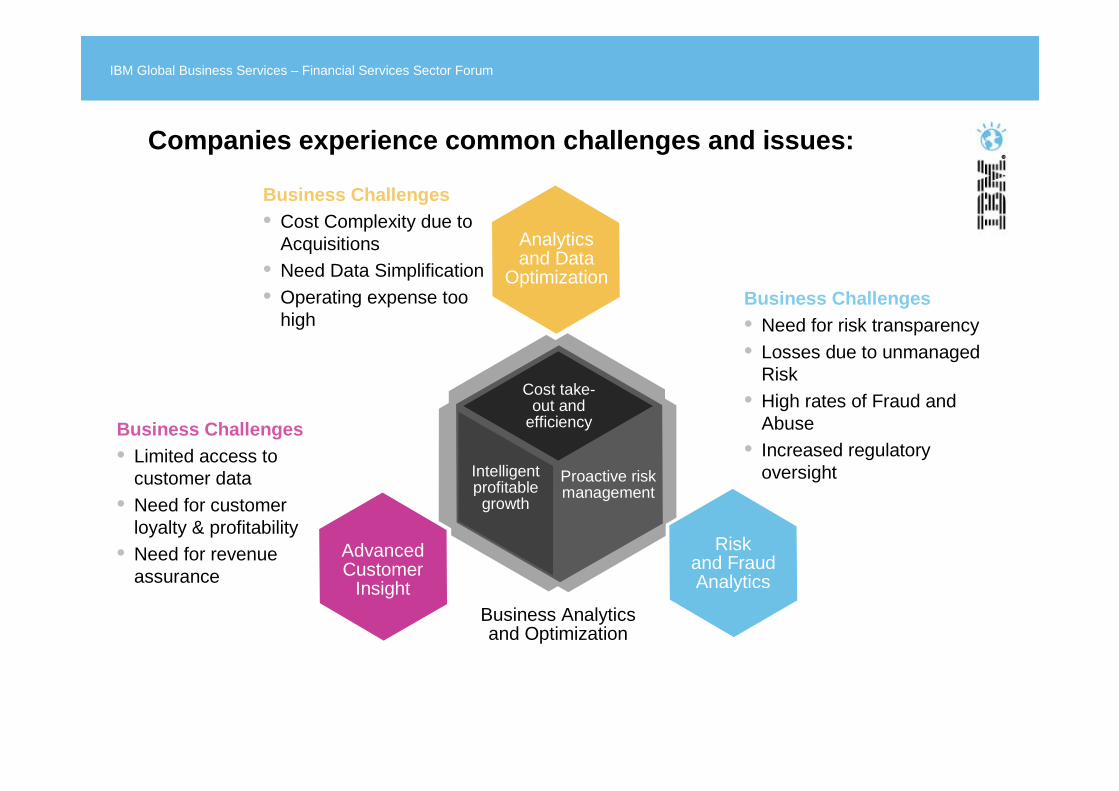
Business Challenges• Need for risk transparency• Losses due to unmanaged
Risk • High rates of Fraud and
Abuse• Increased regulatory
oversight
Business Challenges• Limited access to
customer data• Need for customer
loyalty & profitability• Need for revenue
assurance
Business Challenges• Cost Complexity due to
Acquisitions• Need Data Simplification• Operating expense too
high
Riskand Fraud Analytics
Advanced Customer
Insight
Analyticsand Data
Optimization
Intelligent profitable growth
Cost take-out and
efficiency
Proactive risk management
Business Analytics and Optimization
Companies experience common challenges and issues:
© 2010 IBM Corporation
IBM Global Business Services – Financial Services Sector Forum
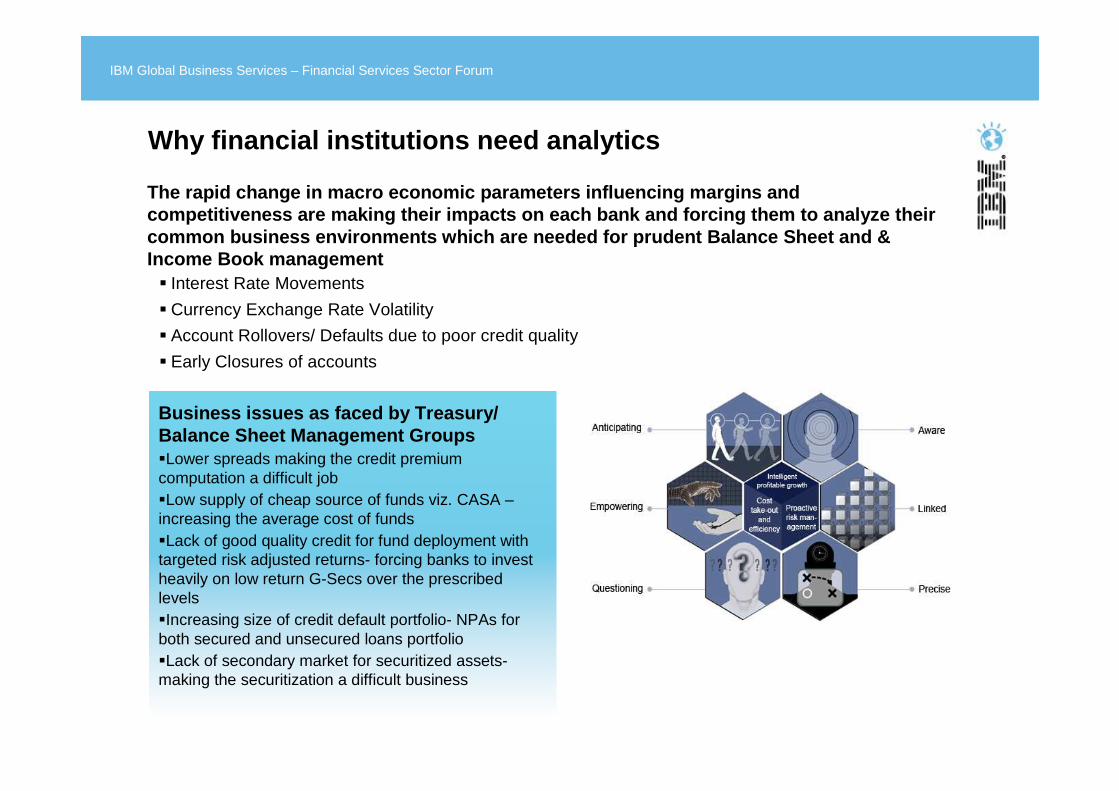
The rapid change in macro economic parameters influ encing margins and competitiveness are making their impacts on each ba nk and forcing them to analyze their common business environments which are needed for p rudent Balance Sheet and & Income Book management� Interest Rate Movements
� Currency Exchange Rate Volatility
� Account Rollovers/ Defaults due to poor credit quality
� Early Closures of accounts
Business issues as faced by Treasury/ Balance Sheet Management Groups�Lower spreads making the credit premium computation a difficult job�Low supply of cheap source of funds viz. CASA –increasing the average cost of funds�Lack of good quality credit for fund deployment with targeted risk adjusted returns- forcing banks to invest heavily on low return G-Secs over the prescribed levels �Increasing size of credit default portfolio- NPAs for both secured and unsecured loans portfolio�Lack of secondary market for securitized assets-making the securitization a difficult business
Why financial institutions need analytics
© 2010 IBM Corporation
IBM Global Business Services – Financial Services Sector Forum
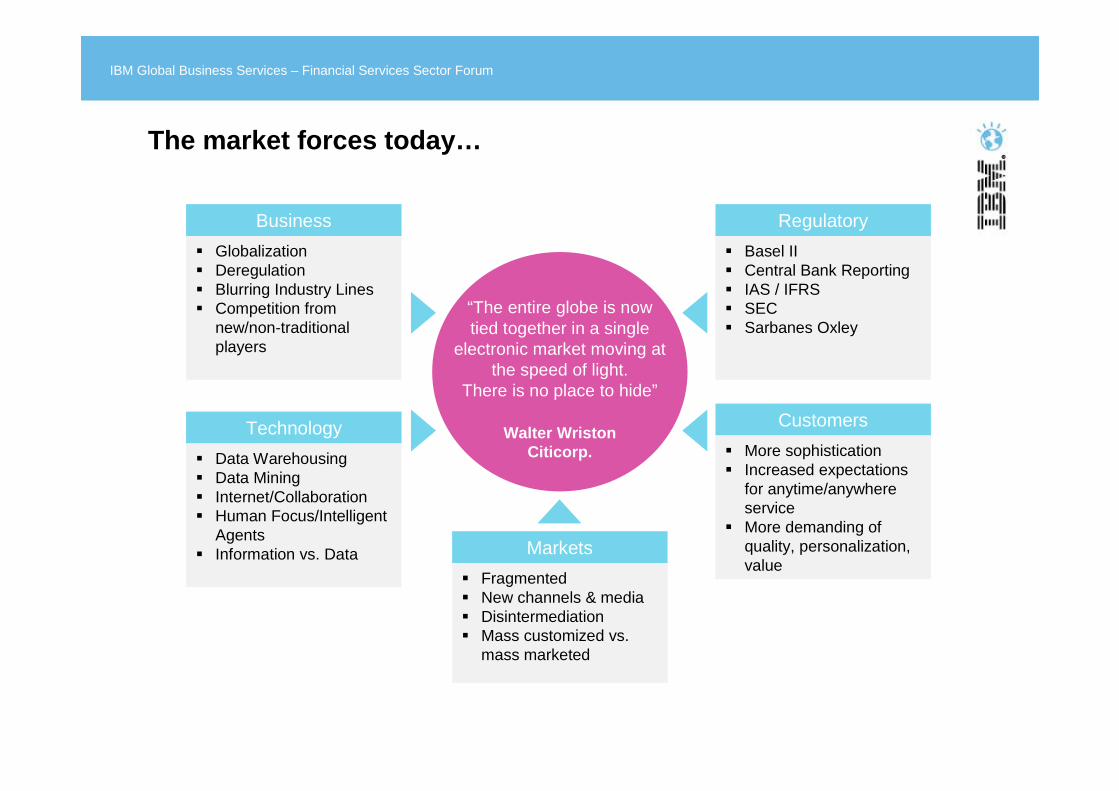
“The entire globe is now tied together in a single
electronic market moving at the speed of light.
There is no place to hide”
Walter WristonCiticorp.
Business
� Globalization� Deregulation� Blurring Industry Lines� Competition from
new/non-traditional players
Technology
� Data Warehousing� Data Mining� Internet/Collaboration� Human Focus/Intelligent
Agents� Information vs. Data
Regulatory
� Basel II� Central Bank Reporting� IAS / IFRS� SEC� Sarbanes Oxley
Customers
� More sophistication� Increased expectations
for anytime/anywhere service
� More demanding of quality, personalization, value
Markets
� Fragmented� New channels & media� Disintermediation� Mass customized vs.
mass marketed
The market forces today…
© 2010 IBM Corporation
IBM Global Business Services – Financial Services Sector Forum
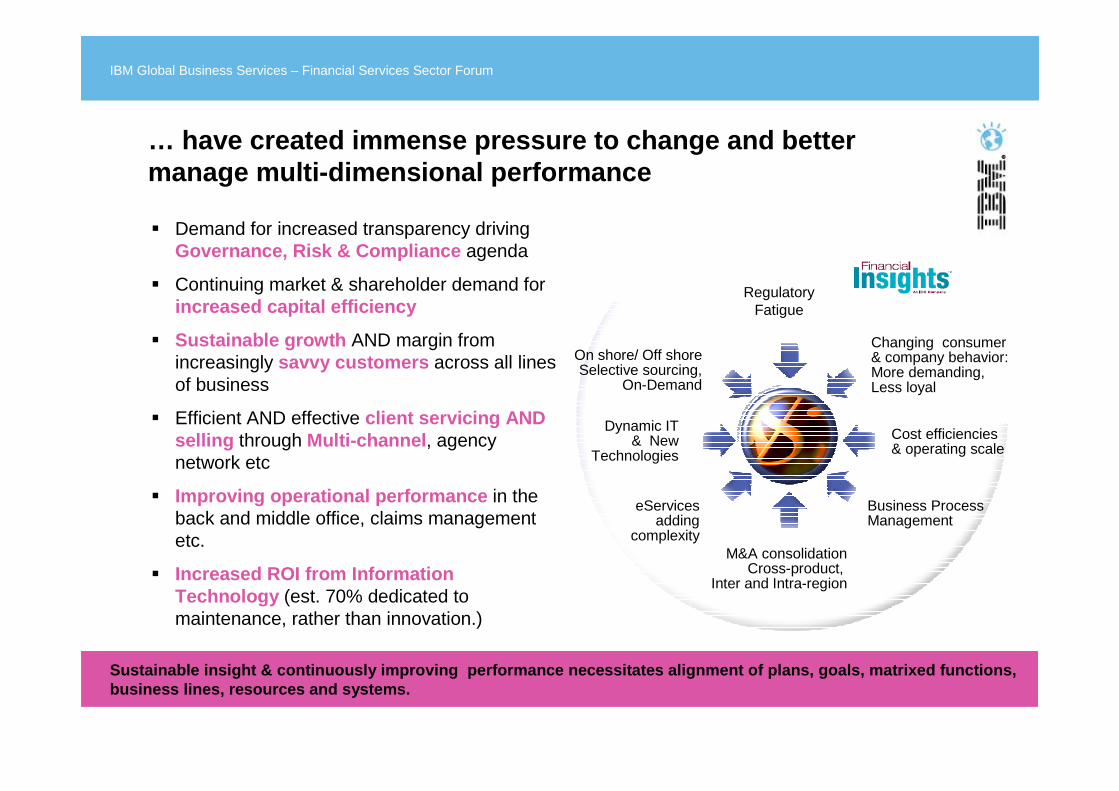
� Demand for increased transparency driving Governance, Risk & Compliance agenda
� Continuing market & shareholder demand for increased capital efficiency
� Sustainable growth AND margin from increasingly savvy customers across all lines of business
� Efficient AND effective client servicing AND selling through Multi-channel , agency network etc
� Improving operational performance in the back and middle office, claims management etc.
� Increased ROI from Information Technology (est. 70% dedicated to maintenance, rather than innovation.)
Sustainable insight & continuously improving perfo rmance necessitates alignment of plans, goals, matr ixed functions, business lines, resources and systems.
Changing consumer & company behavior:More demanding, Less loyal
Cost efficiencies& operating scale
Business ProcessManagement
M&A consolidationCross-product,
Inter and Intra-region
RegulatoryFatigue
Dynamic IT& New
Technologies
eServicesadding
complexity
On shore/ Off shore Selective sourcing,
On-Demand
… have created immense pressure to change and better manage multi-dimensional performance
© 2010 IBM Corporation
IBM Global Business Services – Financial Services Sector Forum
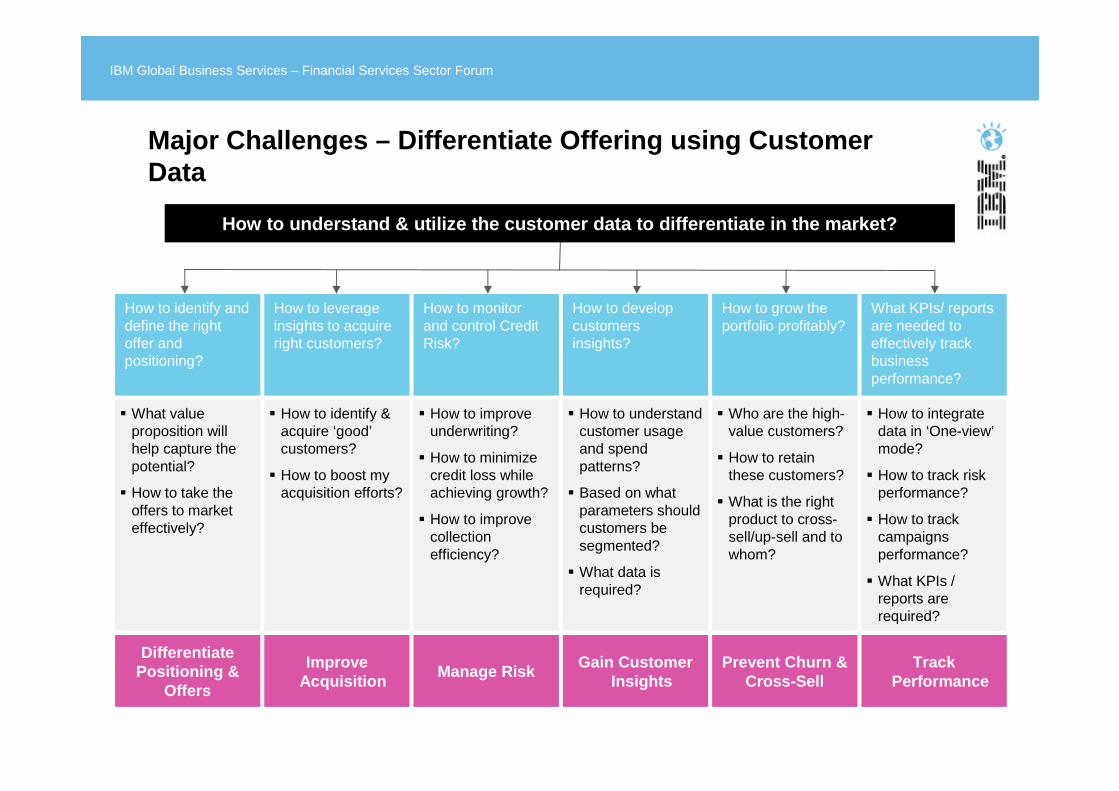
How to understand & utilize the customer data to di fferentiate in the market?
How to identify and define the right offer and positioning?
How to leverage insights to acquire right customers?
How to monitor and control Credit Risk?
How to develop customers insights?
How to grow the portfolio profitably?
What KPIs/ reports are needed to effectively track business performance?
� What value proposition will help capture the potential?
� How to take the offers to market effectively?
� How to identify & acquire ‘good’customers?
� How to boost my acquisition efforts?
� How to improve underwriting?
� How to minimize credit loss while achieving growth?
� How to improve collection efficiency?
� How to understand customer usage and spend patterns?
� Based on what parameters should customers be segmented?
� What data is required?
� Who are the high-value customers?
� How to retain these customers?
� What is the right product to cross-sell/up-sell and to whom?
� How to integrate data in ‘One-view’mode?
� How to track risk performance?
� How to track campaigns performance?
� What KPIs / reports are required?
Differentiate Positioning &
Offers
Improve Acquisition
Manage Risk Gain Customer Insights
Prevent Churn &Cross-Sell
Track Performance
Major Challenges – Differentiate Offering using Custom er Data
© 2010 IBM Corporation
IBM Global Business Services – Financial Services Sector Forum
Using analytics to succeed in the “new normal” of today’s complex world.
© 2010 IBM Corporation
IBM Global Business Services – Financial Services Sector Forum
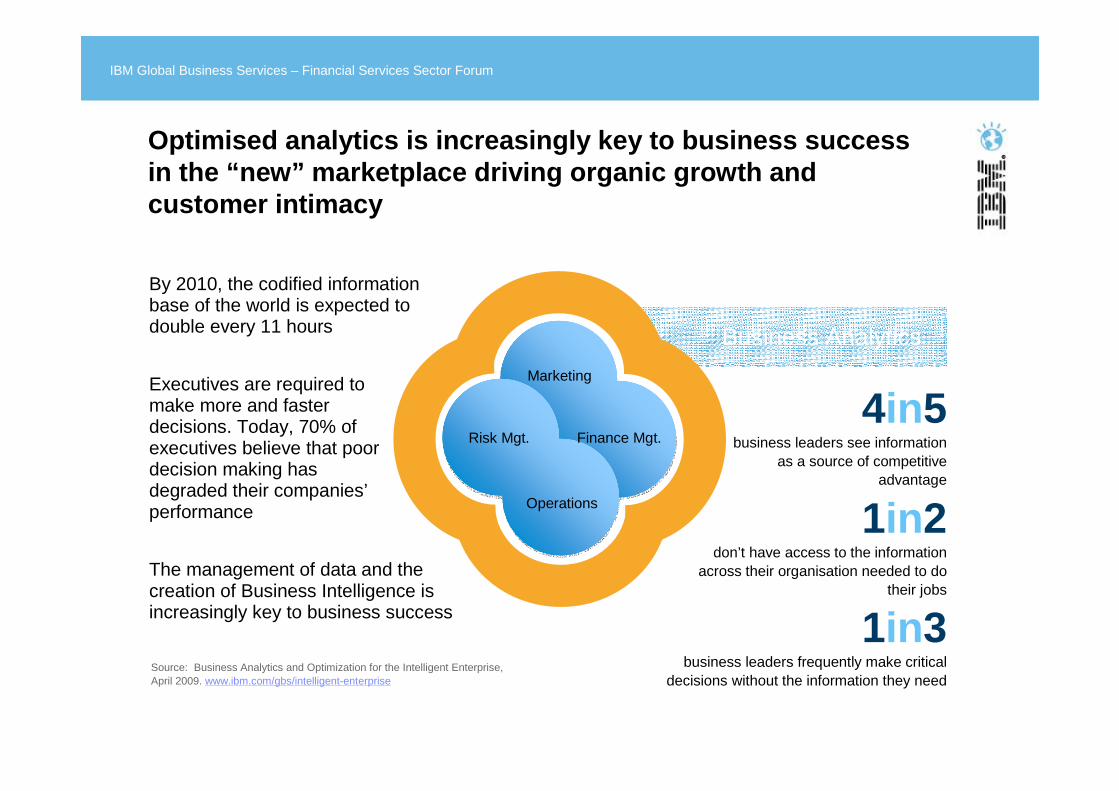
Optimised analytics is increasingly key to business s uccess in the “new” marketplace driving organic growth and customer intimacy
By 2010, the codified information base of the world is expected to double every 11 hours
Executives are required to make more and faster decisions. Today, 70% of executives believe that poor decision making has degraded their companies’performance
Business Analytics
4in5business leaders see information
as a source of competitive advantage
1in2don’t have access to the information
across their organisation needed to do their jobs
1in3business leaders frequently make critical
decisions without the information they needSource: Business Analytics and Optimization for the Intelligent Enterprise, April 2009. www.ibm.com/gbs/intelligent-enterprise
The management of data and the creation of Business Intelligence is increasingly key to business success
Business Analytics
Risk Mgt. Finance Mgt.
Operations
Marketing
© 2010 IBM Corporation
IBM Global Business Services – Financial Services Sector Forum
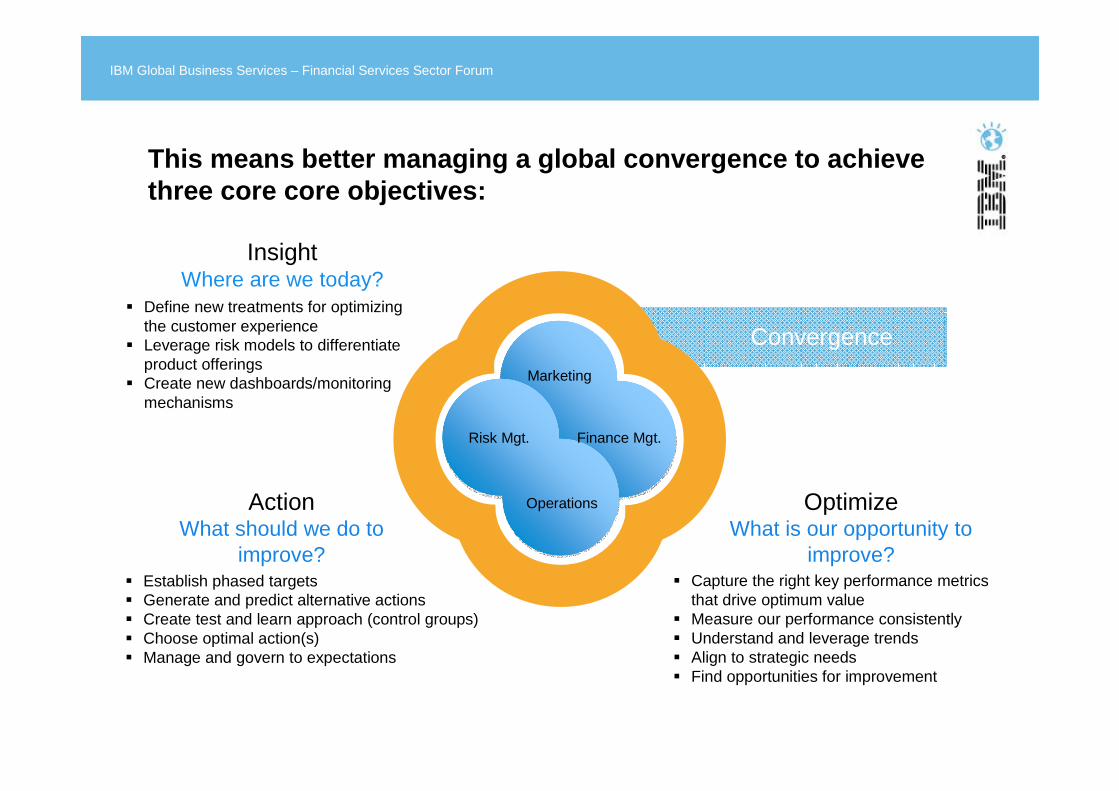
OptimizeWhat is our opportunity to
improve?
ActionWhat should we do to
improve?� Capture the right key performance metrics
that drive optimum value� Measure our performance consistently� Understand and leverage trends� Align to strategic needs� Find opportunities for improvement
� Establish phased targets� Generate and predict alternative actions� Create test and learn approach (control groups)� Choose optimal action(s)� Manage and govern to expectations
� Define new treatments for optimizing the customer experience
� Leverage risk models to differentiate product offerings
� Create new dashboards/monitoring mechanisms
Convergence
Risk Mgt. Finance Mgt.
Operations
Marketing
InsightWhere are we today?
This means better managing a global convergence to ac hieve three core core objectives:
© 2010 IBM Corporation
IBM Global Business Services – Financial Services Sector Forum
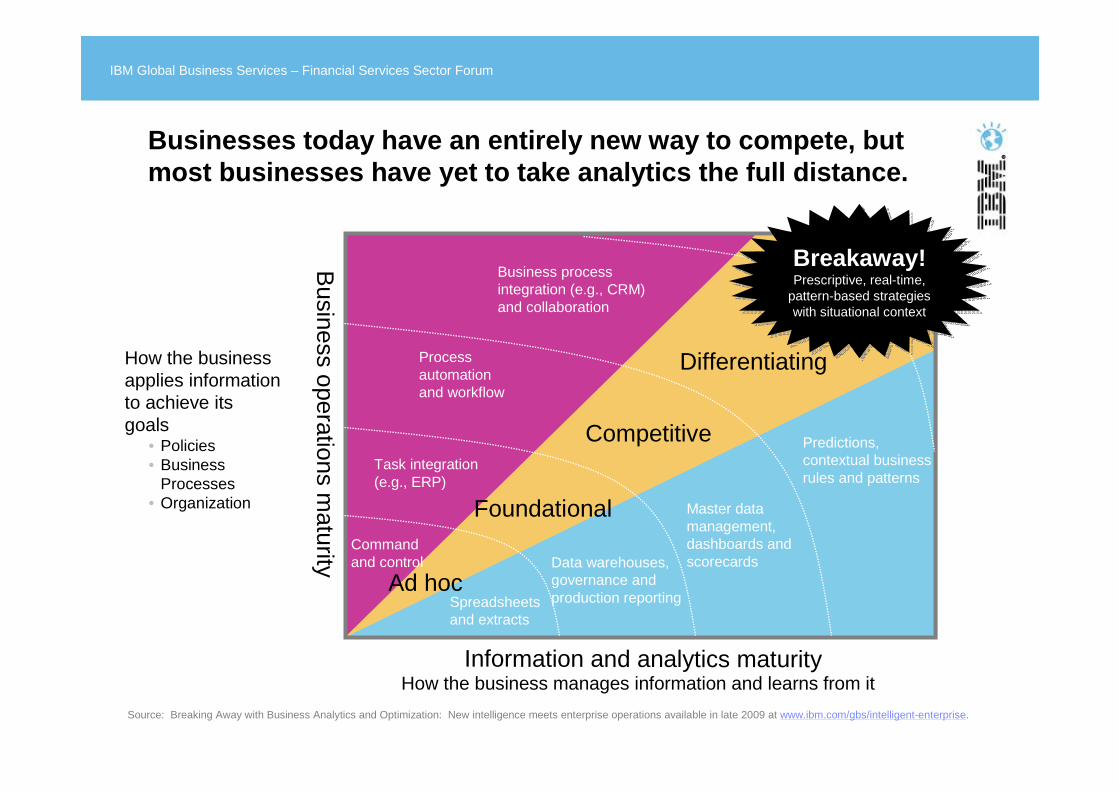
Business operations m
aturity
Information and analytics maturity
How the business applies information to achieve its goals
• Policies • Business
Processes• Organization
How the business manages information and learns from it
Spreadsheets and extracts
Data warehouses, governance and production reporting
Process automation and workflow
Master data management, dashboards and scorecards
Command and control
Task integration (e.g., ERP)
Business process integration (e.g., CRM) and collaboration
Predictions, contextual business rules and patterns
Source: Breaking Away with Business Analytics and Optimization: New intelligence meets enterprise operations available in late 2009 at www.ibm.com/gbs/intelligent-enterprise.
Ad hoc
Foundational
Competitive
Differentiating
Breakaway!Prescriptive, real-time,
pattern-based strategies with situational context
Breakaway!Prescriptive, real-time,
pattern-based strategies with situational context
Businesses today have an entirely new way to compete , butmost businesses have yet to take analytics the full distance.
© 2010 IBM Corporation
IBM Global Business Services – Financial Services Sector Forum
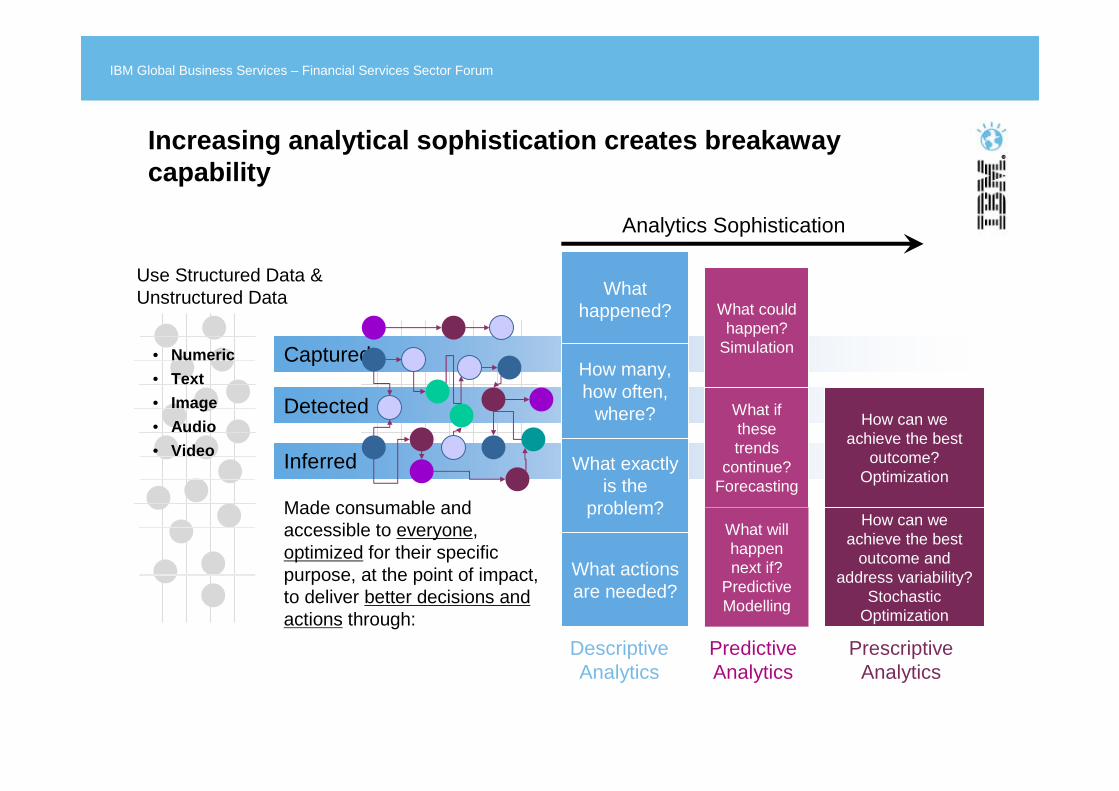
Use Structured Data & Unstructured Data
Captured
Detected
Inferred
Made consumable and accessible to everyone, optimized for their specific purpose, at the point of impact, to deliver better decisions and actions through:
Descriptive Analytics
Prescriptive Analytics
Predictive Analytics
What if these trends
continue? Forecasting
How can we achieve the best
outcome and address variability?
Stochastic Optimization
What happened?
What exactly is the
problem?
How many, how often,
where?
What actions are needed?
What could happen?
Simulation
How can we achieve the best
outcome? Optimization
What will happen next if?
Predictive Modelling
Analytics Sophistication
• Numeric
• Text
• Image
• Audio
• Video
Increasing analytical sophistication creates breakaway capability
© 2010 IBM Corporation
IBM Global Business Services – Financial Services Sector Forum
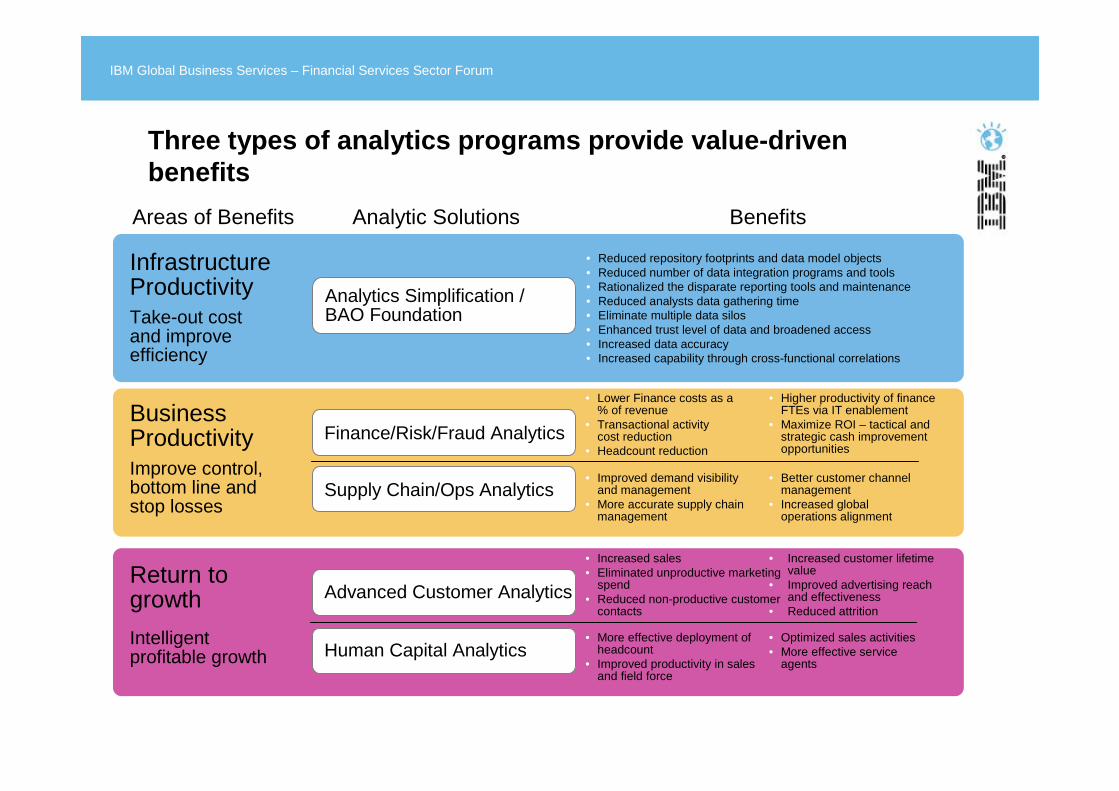
Return to growth
Intelligent profitable growth
Infrastructure ProductivityTake-out cost and improve efficiency
Business ProductivityImprove control, bottom line and stop losses
Analytics Simplification / BAO Foundation
Finance/Risk/Fraud Analytics
Supply Chain/Ops Analytics
Advanced Customer Analytics
Human Capital Analytics
Benefits Areas of Benefits Analytic Solutions
• More effective deployment of headcount
• Improved productivity in sales and field force
• Improved demand visibility and management
• More accurate supply chain management
• Increased sales• Eliminated unproductive marketing
spend• Reduced non-productive customer
contacts
• Lower Finance costs as a % of revenue
• Transactional activity cost reduction
• Headcount reduction
• Increased customer lifetime value
• Improved advertising reach and effectiveness
• Reduced attrition
• Optimized sales activities• More effective service
agents
• Higher productivity of finance FTEs via IT enablement
• Maximize ROI – tactical and strategic cash improvement opportunities
• Better customer channel management
• Increased global operations alignment
• Reduced repository footprints and data model objects• Reduced number of data integration programs and tools• Rationalized the disparate reporting tools and maintenance• Reduced analysts data gathering time• Eliminate multiple data silos• Enhanced trust level of data and broadened access• Increased data accuracy• Increased capability through cross-functional correlations
Three types of analytics programs provide value-driven benefits
© 2010 IBM Corporation
IBM Global Business Services – Financial Services Sector Forum
Where are theopportunities for
breakaway improvement?
© 2010 IBM Corporation
IBM Global Business Services – Financial Services Sector Forum
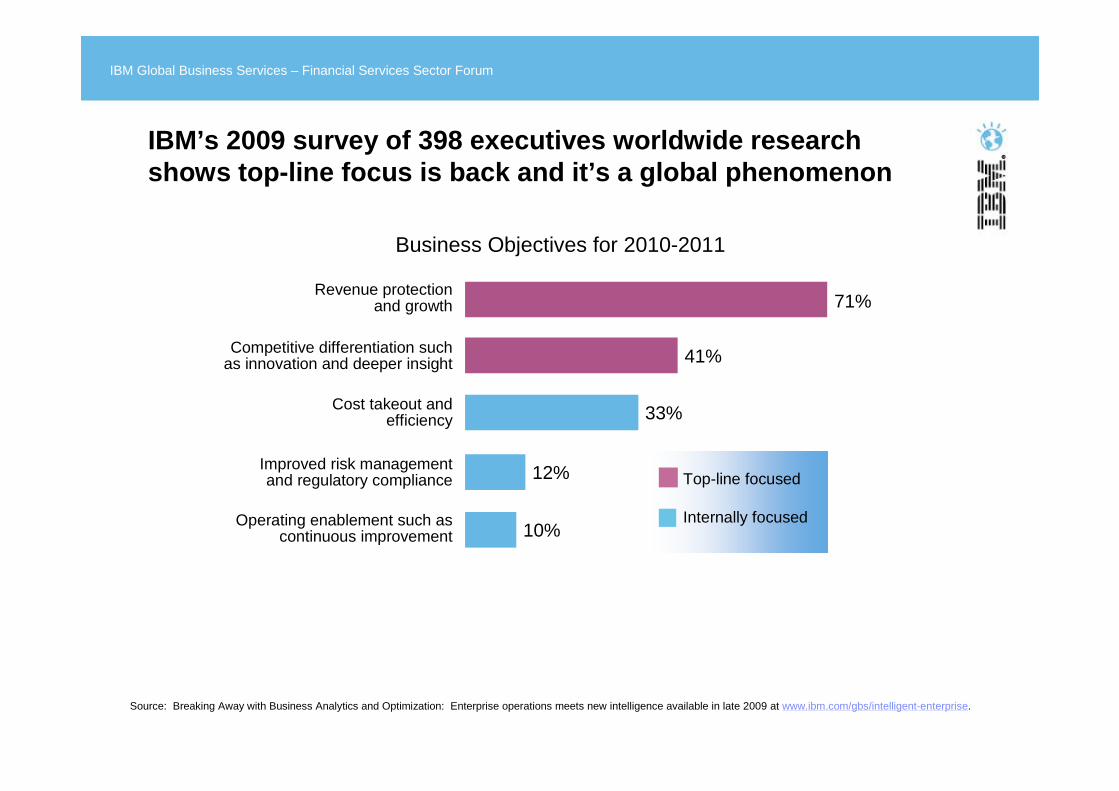
Business Objectives for 2010-2011
Revenue protection and growth
Competitive differentiation such as innovation and deeper insight
Cost takeout and efficiency
Improved risk management and regulatory compliance
Operating enablement such as continuous improvement 10%
12%
33%
41%
71%
Top-line focused
Internally focused
Source: Breaking Away with Business Analytics and Optimization: Enterprise operations meets new intelligence available in late 2009 at www.ibm.com/gbs/intelligent-enterprise.
IBM’s 2009 survey of 398 executives worldwide researc h shows top-line focus is back and it’s a global phen omenon
© 2010 IBM Corporation
IBM Global Business Services – Financial Services Sector Forum
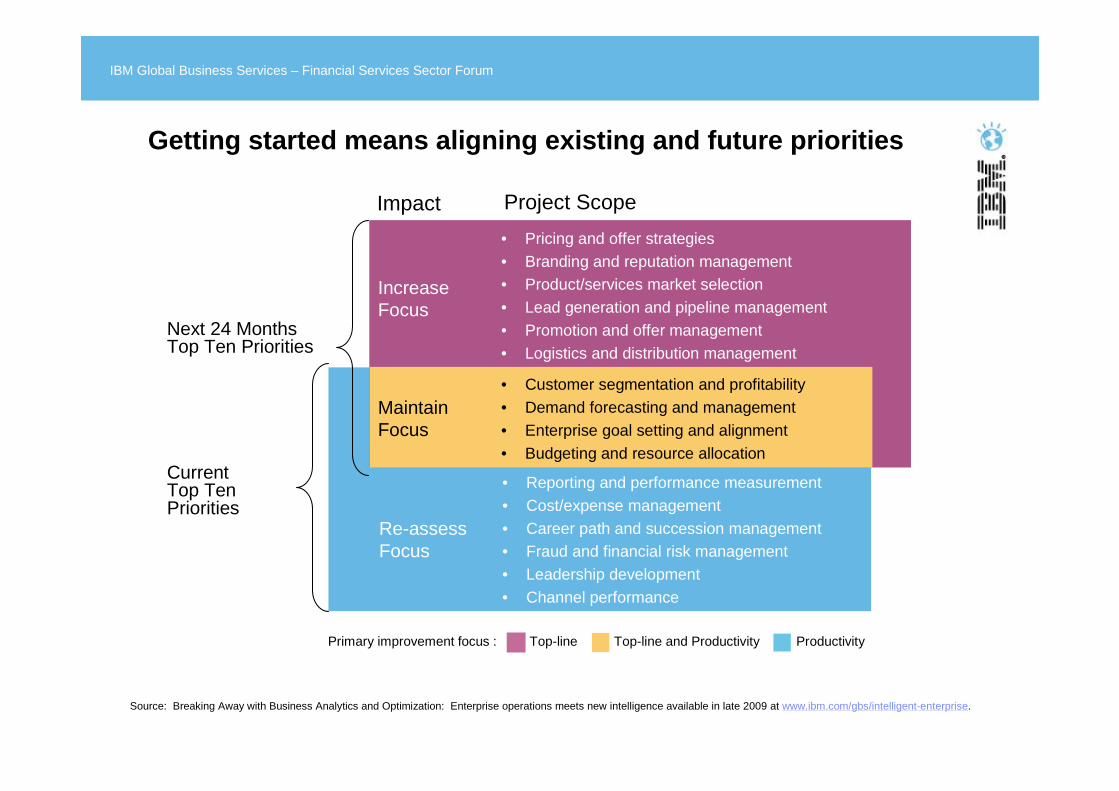
Current Top Ten Priorities
Next 24 Months Top Ten Priorities
Project Scope
• Pricing and offer strategies• Branding and reputation management• Product/services market selection• Lead generation and pipeline management• Promotion and offer management• Logistics and distribution management
Increase Focus
• Customer segmentation and profitability• Demand forecasting and management• Enterprise goal setting and alignment• Budgeting and resource allocation
Maintain Focus
• Reporting and performance measurement• Cost/expense management• Career path and succession management• Fraud and financial risk management• Leadership development• Channel performance
Re-assess Focus
Impact
Source: Breaking Away with Business Analytics and Optimization: Enterprise operations meets new intelligence available in late 2009 at www.ibm.com/gbs/intelligent-enterprise.
Primary improvement focus : Top-line Top-line and Productivity Productivity
Getting started means aligning existing and future pri orities
© 2010 IBM Corporation
IBM Global Business Services – Financial Services Sector Forum
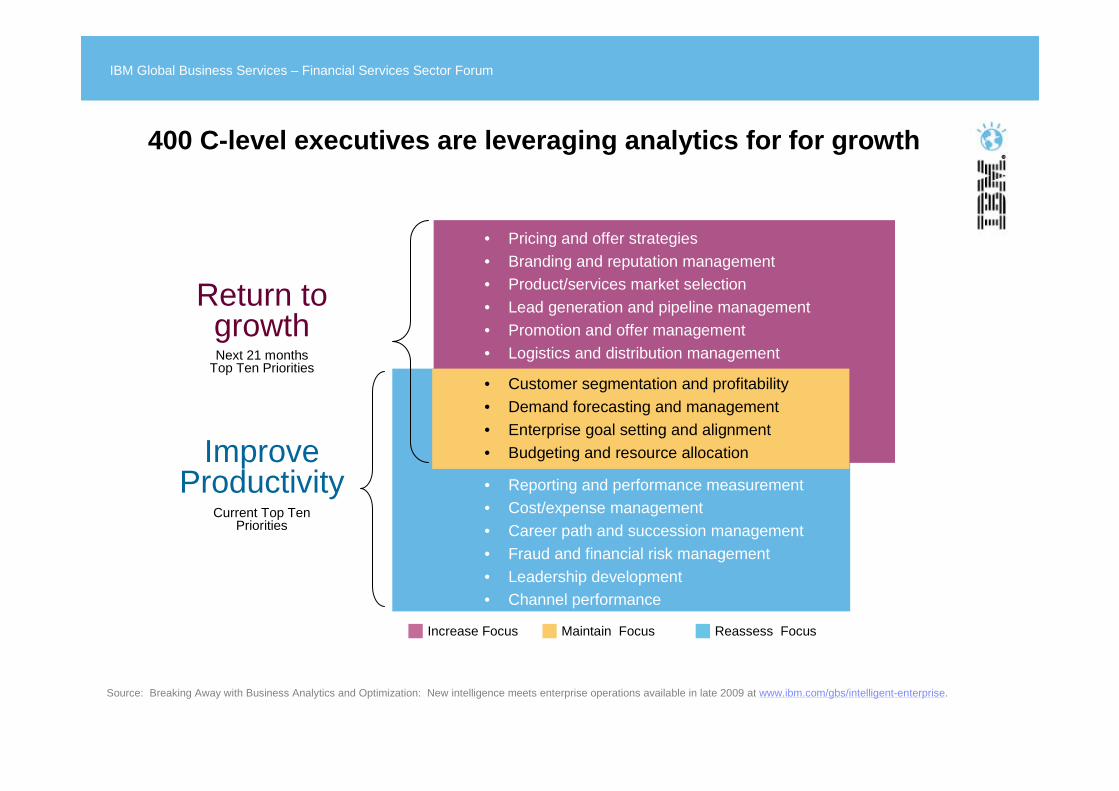
Source: Breaking Away with Business Analytics and Optimization: New intelligence meets enterprise operations available in late 2009 at www.ibm.com/gbs/intelligent-enterprise.
Current Top Ten Priorities
Next 21 months Top Ten Priorities
• Pricing and offer strategies• Branding and reputation management• Product/services market selection• Lead generation and pipeline management• Promotion and offer management• Logistics and distribution management
• Customer segmentation and profitability• Demand forecasting and management• Enterprise goal setting and alignment• Budgeting and resource allocation
• Reporting and performance measurement• Cost/expense management• Career path and succession management• Fraud and financial risk management• Leadership development• Channel performance
Increase Focus Maintain Focus Reassess Focus
Return to growth
Improve Productivity
400 C-level executives are leveraging analytics for for growth
© 2010 IBM Corporation
IBM Global Business Services – Financial Services Sector Forum
How are industry top performers able to break
away?
© 2010 IBM Corporation
IBM Global Business Services – Financial Services Sector Forum
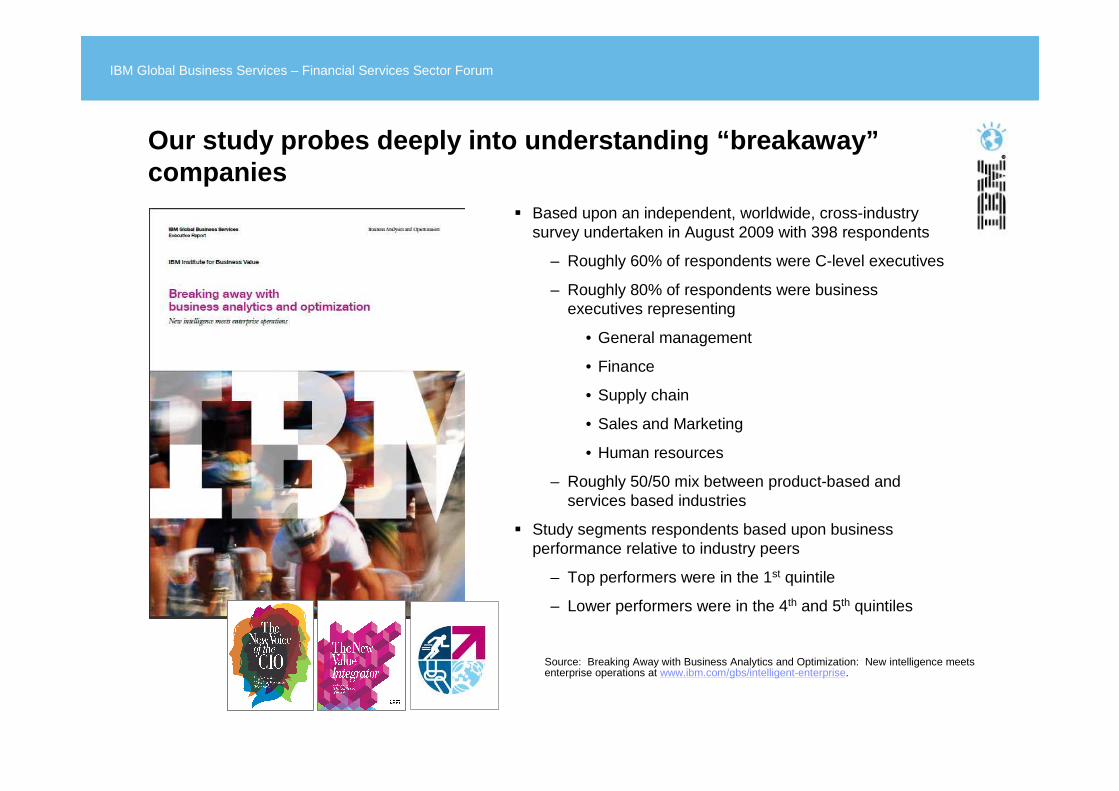
� Based upon an independent, worldwide, cross-industry survey undertaken in August 2009 with 398 respondents
– Roughly 60% of respondents were C-level executives
– Roughly 80% of respondents were business executives representing
• General management
• Finance
• Supply chain
• Sales and Marketing
• Human resources
– Roughly 50/50 mix between product-based and services based industries
� Study segments respondents based upon business performance relative to industry peers
– Top performers were in the 1st quintile
– Lower performers were in the 4th and 5th quintiles
Source: Breaking Away with Business Analytics and Optimization: New intelligence meets enterprise operations at www.ibm.com/gbs/intelligent-enterprise.
Our study probes deeply into understanding “breakaway ”companies
© 2010 IBM Corporation
IBM Global Business Services – Financial Services Sector Forum
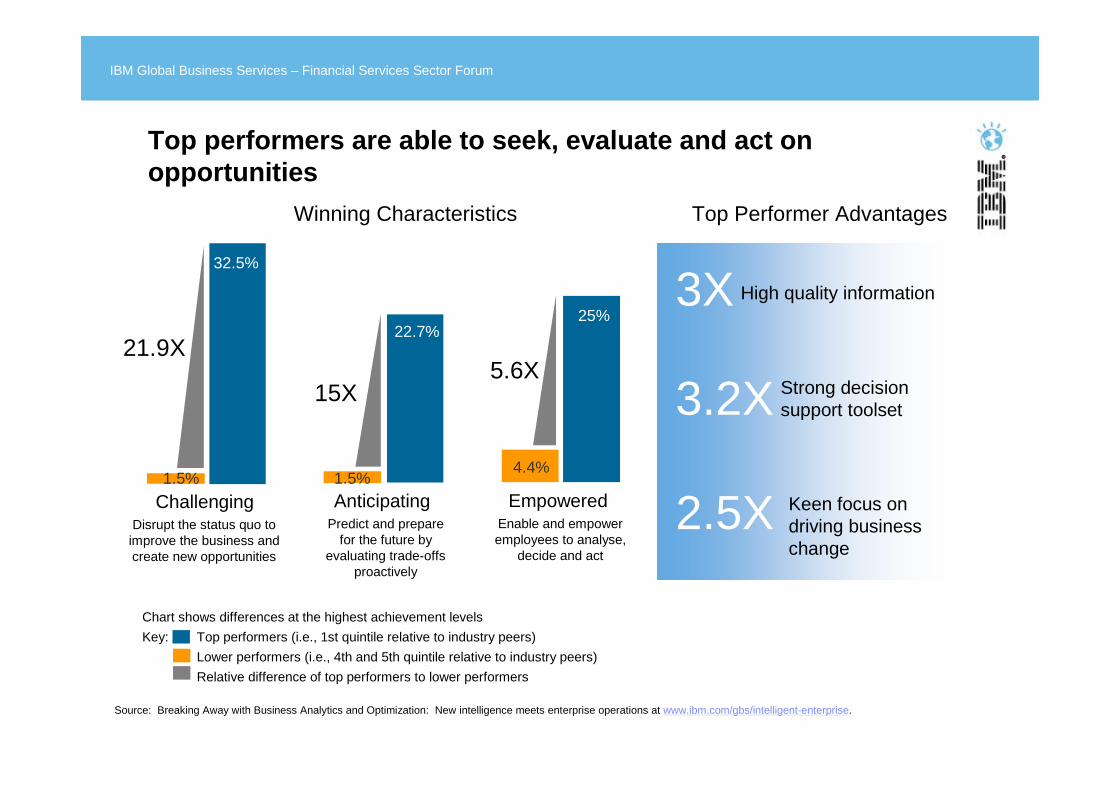
ChallengingDisrupt the status quo to improve the business and create new opportunities
EmpoweredEnable and empower employees to analyse,
decide and act
AnticipatingPredict and prepare
for the future by evaluating trade-offs
proactively
21.9X5.6X
15X
Chart shows differences at the highest achievement levels
Key: Top performers (i.e., 1st quintile relative to industry peers)
Lower performers (i.e., 4th and 5th quintile relative to industry peers)
Relative difference of top performers to lower performers
32.5%
1.5%
22.7%
1.5%4.4%
25%
Source: Breaking Away with Business Analytics and Optimization: New intelligence meets enterprise operations at www.ibm.com/gbs/intelligent-enterprise.
Top Performer AdvantagesWinning Characteristics
3X High quality information
3.2X Strong decision support toolset
2.5X Keen focus on driving business change
Top performers are able to seek, evaluate and act on opportunities
© 2010 IBM Corporation
IBM Global Business Services – Financial Services Sector Forum
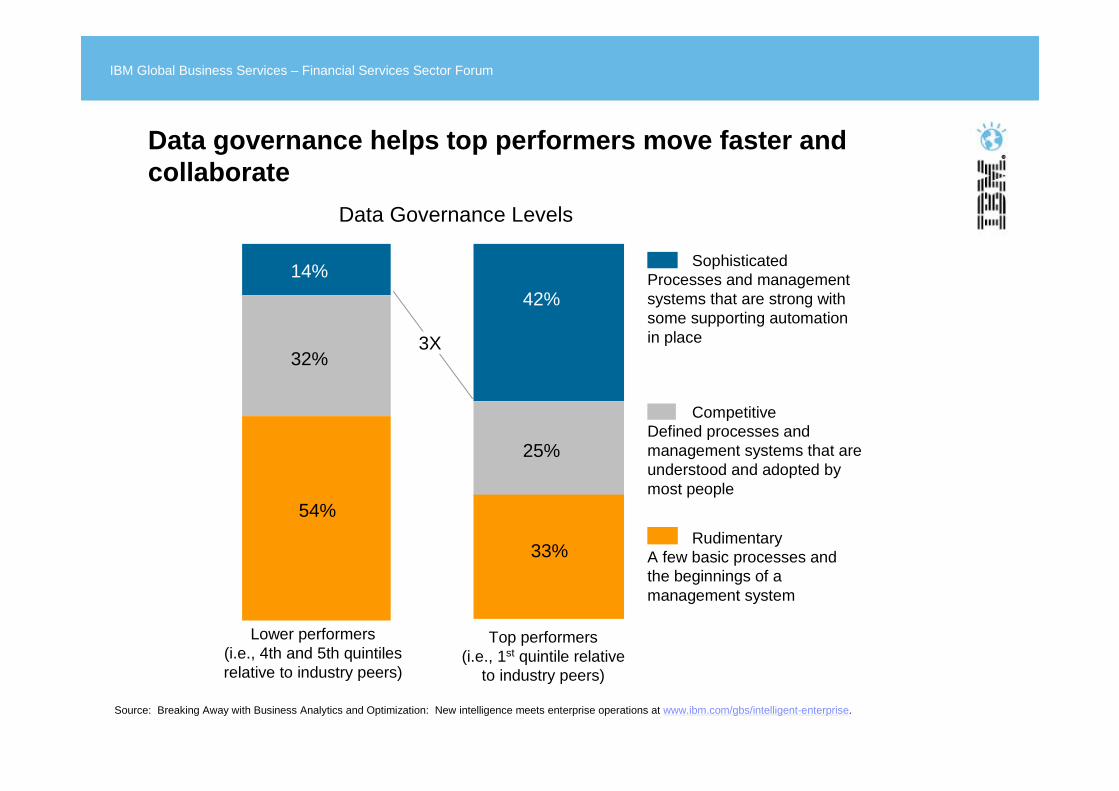
Data Governance Levels
42%
14%
25%
32%
33%
54%
SophisticatedProcesses and management systems that are strong with some supporting automation in place
Competitive Defined processes and management systems that are understood and adopted by most people
Rudimentary A few basic processes and the beginnings of a management system
Top performers(i.e., 1st quintile relative
to industry peers)
Lower performers(i.e., 4th and 5th quintiles relative to industry peers)
3X
Source: Breaking Away with Business Analytics and Optimization: New intelligence meets enterprise operations at www.ibm.com/gbs/intelligent-enterprise.
Data governance helps top performers move faster and collaborate
© 2010 IBM Corporation
IBM Global Business Services – Financial Services Sector Forum
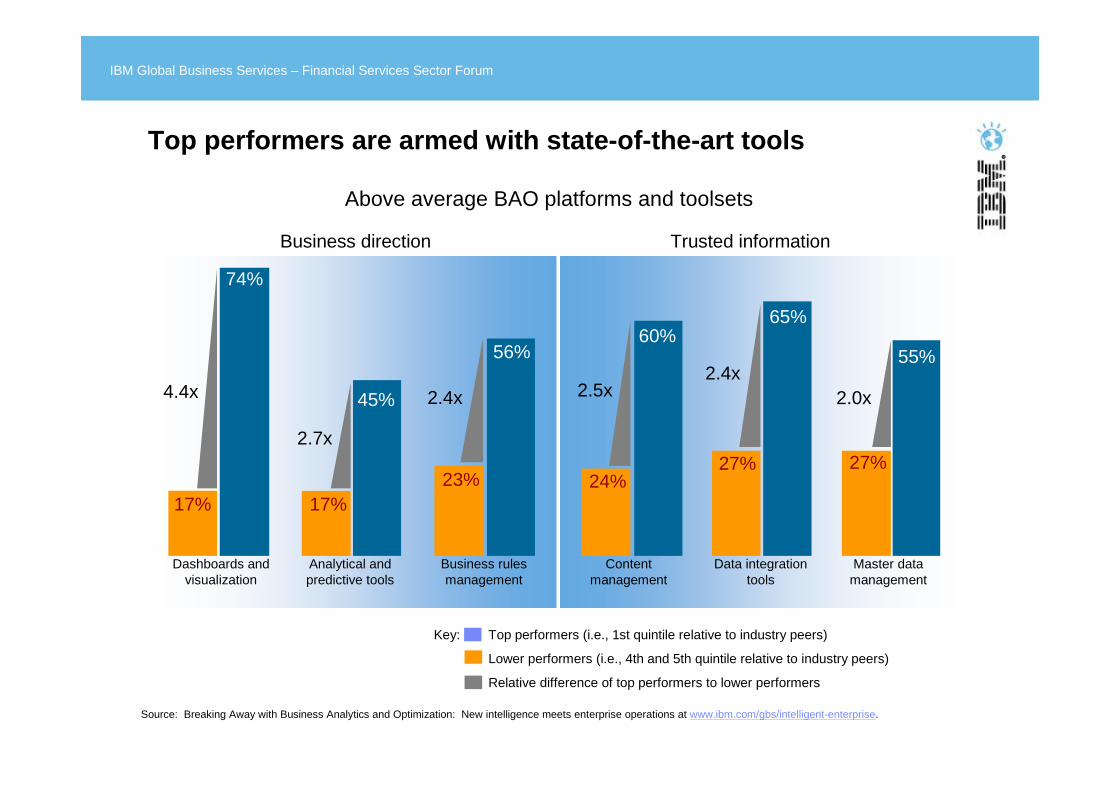
Above average BAO platforms and toolsets
Analytical and predictive tools
Content management
Dashboards and visualization
Master data management
Data integration tools
2.7x
2.5x4.4x 2.0x2.4x
Business direction Trusted information
Business rules management
2.4x
Key: Top performers (i.e., 1st quintile relative to industry peers)
Lower performers (i.e., 4th and 5th quintile relative to industry peers)
Relative difference of top performers to lower performers
17% 17%23% 24%
27% 27%
55%
65%60%
56%
45%
74%
Source: Breaking Away with Business Analytics and Optimization: New intelligence meets enterprise operations at www.ibm.com/gbs/intelligent-enterprise.
Top performers are armed with state-of-the-art tools
© 2010 IBM Corporation
IBM Global Business Services – Financial Services Sector Forum
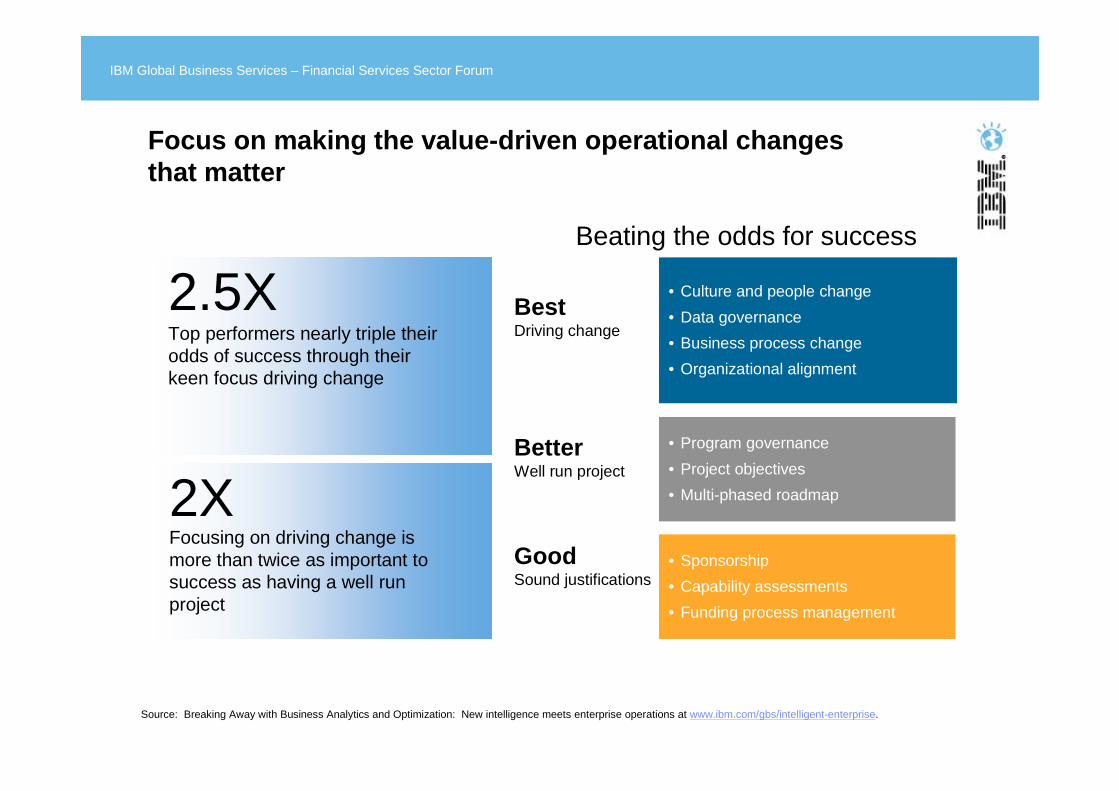
2.5XTop performers nearly triple their odds of success through their keen focus driving change
• Culture and people change
• Data governance
• Business process change
• Organizational alignment
2XFocusing on driving change is more than twice as important to success as having a well run project
• Program governance
• Project objectives
• Multi-phased roadmap
• Sponsorship
• Capability assessments
• Funding process management
GoodSound justifications
BetterWell run project
BestDriving change
Beating the odds for success
Source: Breaking Away with Business Analytics and Optimization: New intelligence meets enterprise operations at www.ibm.com/gbs/intelligent-enterprise.
Focus on making the value-driven operational changes that matter
© 2010 IBM Corporation
IBM Global Business Services – Financial Services Sector Forum
How do you get started with Business Analytics
and Optimization?
© 2010 IBM Corporation
IBM Global Business Services – Financial Services Sector Forum
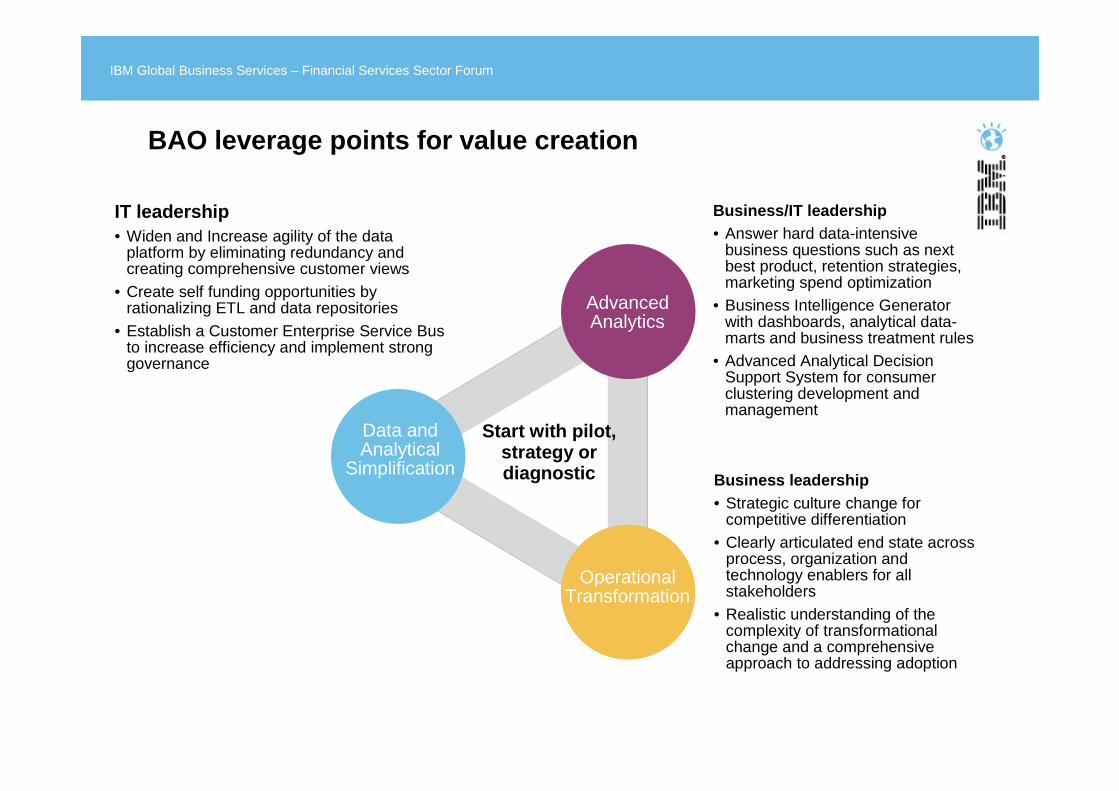
IT leadership• Widen and Increase agility of the data
platform by eliminating redundancy and creating comprehensive customer views
• Create self funding opportunities by rationalizing ETL and data repositories
• Establish a Customer Enterprise Service Bus to increase efficiency and implement strong governance
Business/IT leadership• Answer hard data-intensive
business questions such as next best product, retention strategies, marketing spend optimization
• Business Intelligence Generator with dashboards, analytical data-marts and business treatment rules
• Advanced Analytical Decision Support System for consumer clustering development and management
Business leadership• Strategic culture change for
competitive differentiation• Clearly articulated end state across
process, organization and technology enablers for all stakeholders
• Realistic understanding of the complexity of transformational change and a comprehensive approach to addressing adoption
Data and Analytical
Simplification
Advanced Analytics
Operational Transformation
Start with pilot, strategy or diagnostic
BAO leverage points for value creation
© 2010 IBM Corporation
IBM Global Business Services – Financial Services Sector Forum
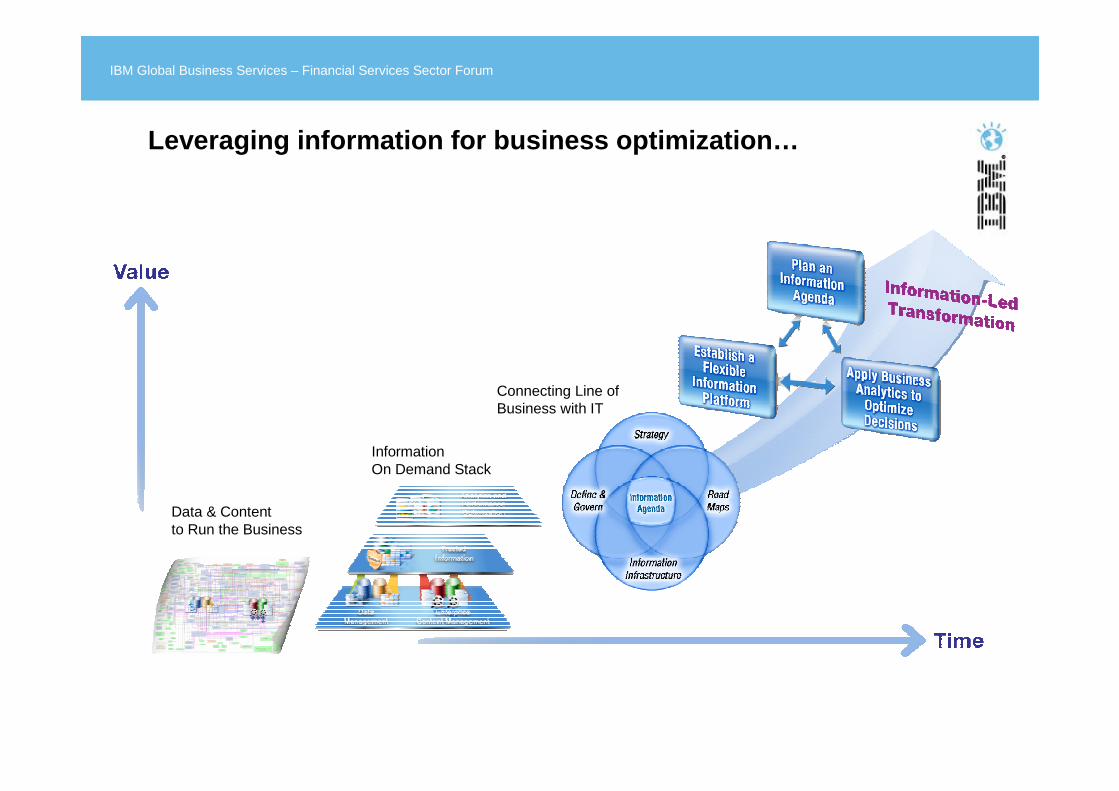
Data & Contentto Run the Business
InformationOn Demand Stack
Connecting Line of Business with IT
Leveraging information for business optimization…
© 2010 IBM Corporation
IBM Global Business Services – Financial Services Sector Forum
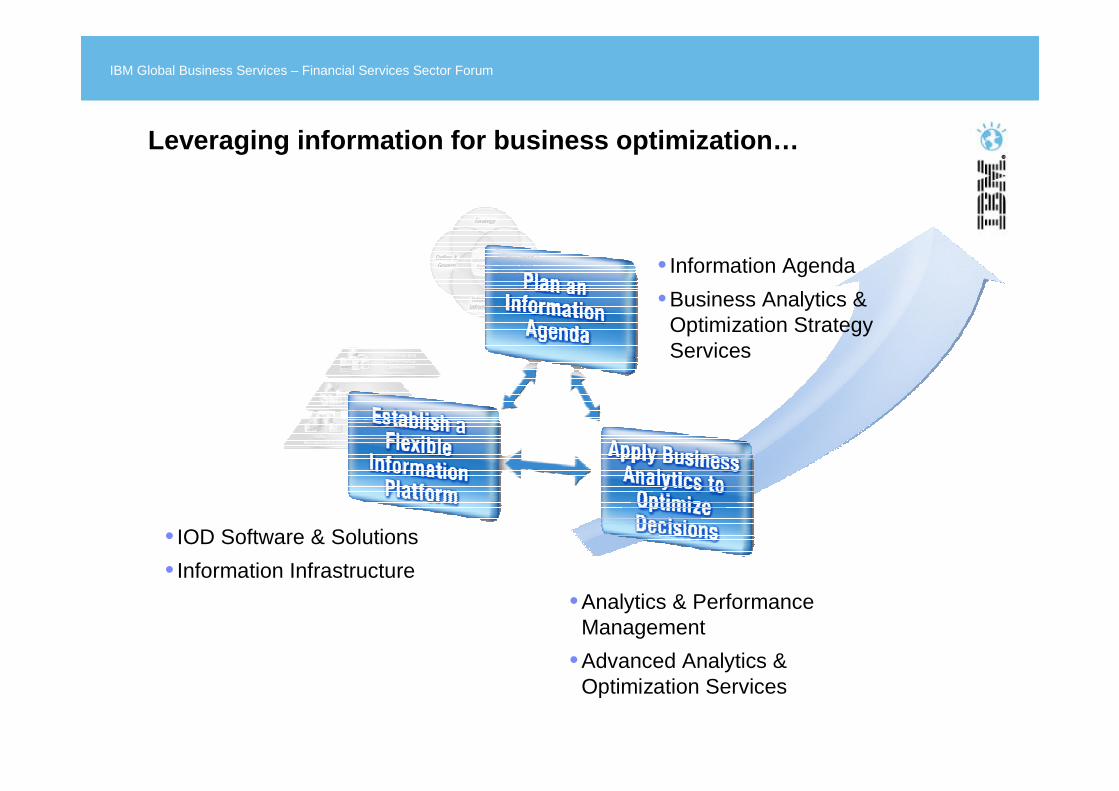
• IOD Software & Solutions
• Information Infrastructure
• Information Agenda
•Business Analytics & Optimization Strategy Services
•Analytics & Performance Management
•Advanced Analytics & Optimization Services
Leveraging information for business optimization…
© 2010 IBM Corporation
IBM Global Business Services – Financial Services Sector Forum
What value is realized through advance business
analytics and optimization?
© 2010 IBM Corporation
IBM Global Business Services – Financial Services Sector Forum
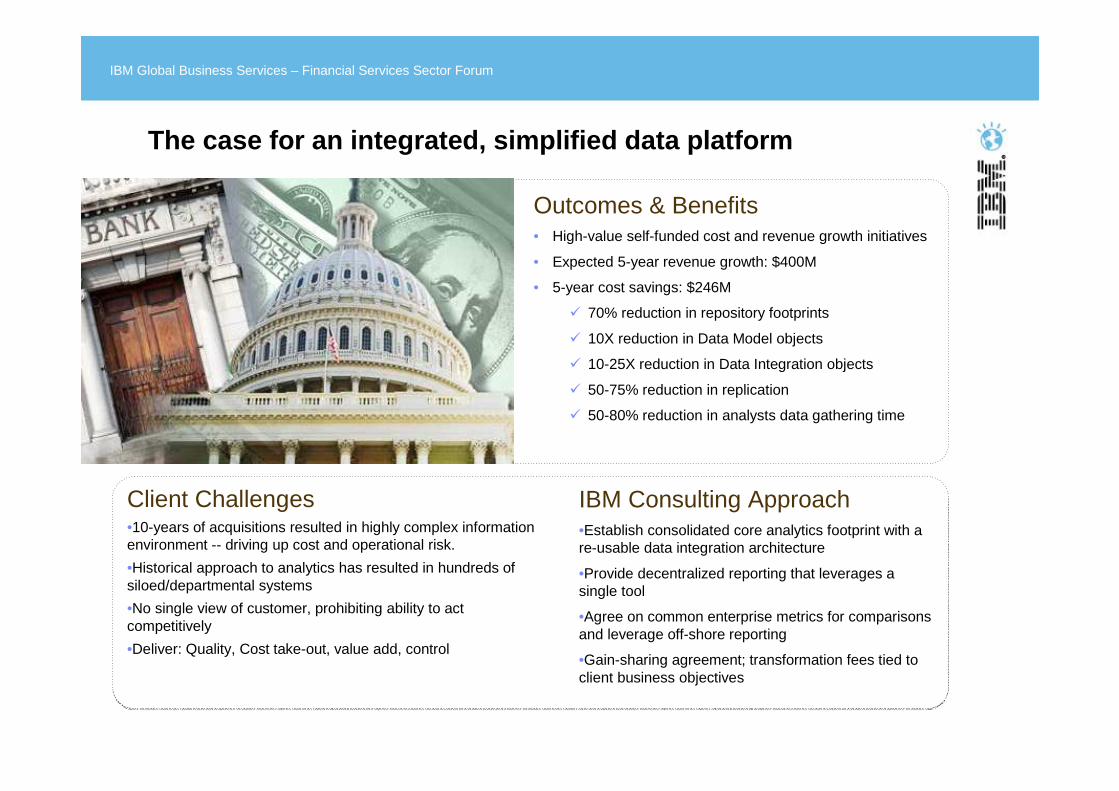
Outcomes & Benefits• High-value self-funded cost and revenue growth initiatives
• Expected 5-year revenue growth: $400M
• 5-year cost savings: $246M
� 70% reduction in repository footprints
� 10X reduction in Data Model objects
� 10-25X reduction in Data Integration objects
� 50-75% reduction in replication
� 50-80% reduction in analysts data gathering time
Client Challenges•10-years of acquisitions resulted in highly complex information environment -- driving up cost and operational risk.
•Historical approach to analytics has resulted in hundreds of siloed/departmental systems
•No single view of customer, prohibiting ability to act competitively
•Deliver: Quality, Cost take-out, value add, control
IBM Consulting Approach•Establish consolidated core analytics footprint with a re-usable data integration architecture
•Provide decentralized reporting that leverages a single tool
•Agree on common enterprise metrics for comparisons and leverage off-shore reporting
•Gain-sharing agreement; transformation fees tied to client business objectives
30 6/24/2010
The case for an integrated, simplified data platform
© 2010 IBM Corporation
IBM Global Business Services – Financial Services Sector Forum
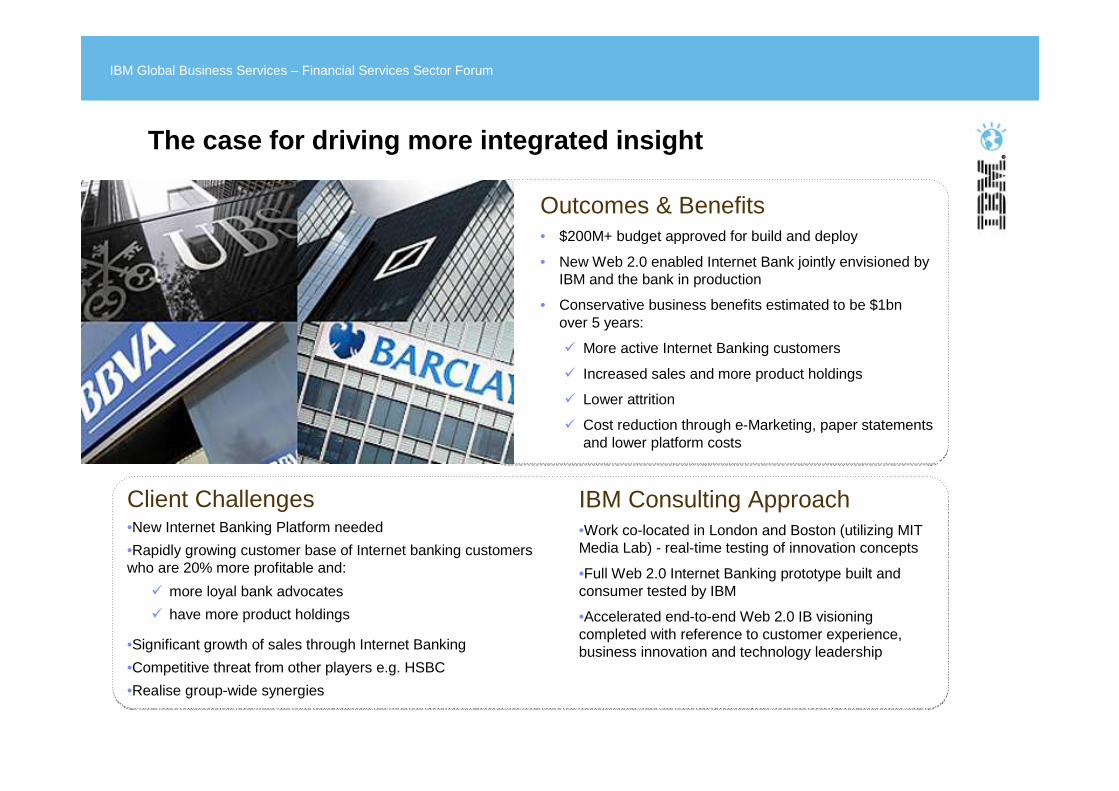
Outcomes & Benefits• $200M+ budget approved for build and deploy
• New Web 2.0 enabled Internet Bank jointly envisioned by IBM and the bank in production
• Conservative business benefits estimated to be $1bn over 5 years:
� More active Internet Banking customers
� Increased sales and more product holdings
� Lower attrition
� Cost reduction through e-Marketing, paper statements and lower platform costs
Client Challenges•New Internet Banking Platform needed
•Rapidly growing customer base of Internet banking customers who are 20% more profitable and:
� more loyal bank advocates
� have more product holdings
•Significant growth of sales through Internet Banking
•Competitive threat from other players e.g. HSBC
•Realise group-wide synergies
IBM Consulting Approach•Work co-located in London and Boston (utilizing MIT Media Lab) - real-time testing of innovation concepts
•Full Web 2.0 Internet Banking prototype built and consumer tested by IBM
•Accelerated end-to-end Web 2.0 IB visioning completed with reference to customer experience, business innovation and technology leadership
The case for driving more integrated insight
© 2010 IBM Corporation
IBM Global Business Services – Financial Services Sector Forum
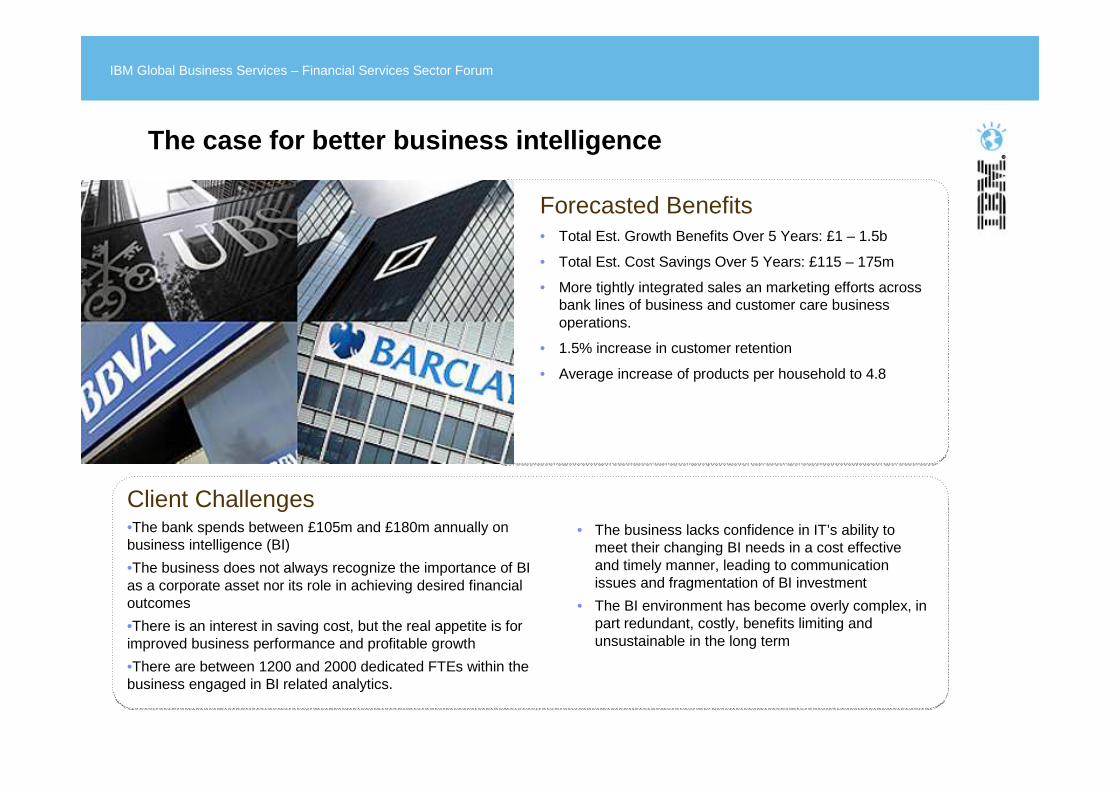
Forecasted Benefits• Total Est. Growth Benefits Over 5 Years: £1 – 1.5b
• Total Est. Cost Savings Over 5 Years: £115 – 175m
• More tightly integrated sales an marketing efforts across bank lines of business and customer care business operations.
• 1.5% increase in customer retention
• Average increase of products per household to 4.8
Client Challenges•The bank spends between £105m and £180m annually on business intelligence (BI)
•The business does not always recognize the importance of BI as a corporate asset nor its role in achieving desired financialoutcomes
•There is an interest in saving cost, but the real appetite is for improved business performance and profitable growth
•There are between 1200 and 2000 dedicated FTEs within the business engaged in BI related analytics.
• The business lacks confidence in IT’s ability to meet their changing BI needs in a cost effective and timely manner, leading to communication issues and fragmentation of BI investment
• The BI environment has become overly complex, in part redundant, costly, benefits limiting and unsustainable in the long term
The case for better business intelligence
© 2010 IBM Corporation
IBM Global Business Services – Financial Services Sector Forum
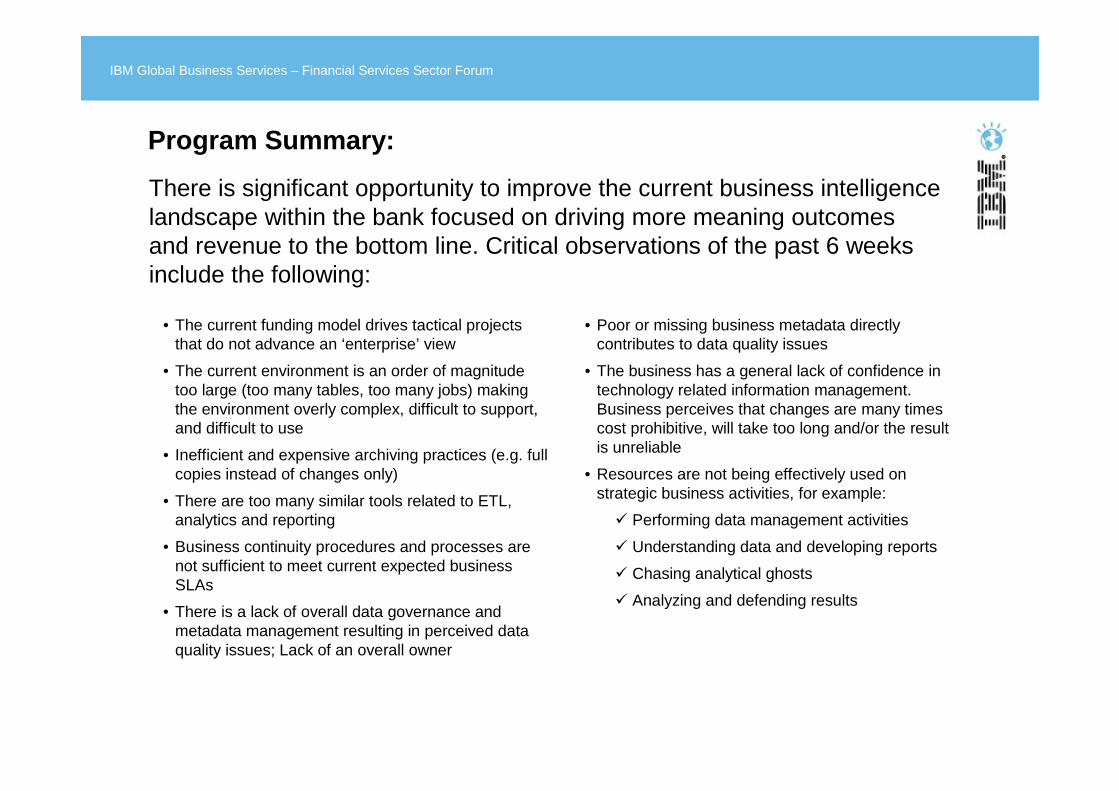
There is significant opportunity to improve the current business intelligence landscape within the bank focused on driving more meaning outcomes and revenue to the bottom line. Critical observations of the past 6 weeks include the following:
• The current funding model drives tactical projects that do not advance an ‘enterprise’ view
• The current environment is an order of magnitude too large (too many tables, too many jobs) making the environment overly complex, difficult to support, and difficult to use
• Inefficient and expensive archiving practices (e.g. full copies instead of changes only)
• There are too many similar tools related to ETL, analytics and reporting
• Business continuity procedures and processes are not sufficient to meet current expected business SLAs
• There is a lack of overall data governance and metadata management resulting in perceived data quality issues; Lack of an overall owner
• Poor or missing business metadata directly contributes to data quality issues
• The business has a general lack of confidence in technology related information management. Business perceives that changes are many times cost prohibitive, will take too long and/or the result is unreliable
• Resources are not being effectively used on strategic business activities, for example:
� Performing data management activities
� Understanding data and developing reports
� Chasing analytical ghosts
� Analyzing and defending results
Program Summary:

© 2010 IBM Corporation
IBM Global Business Services – Financial Services Sector Forum
BI Simplification & Transformation Program Lifecycl eBI Simplification & Transformation Program Lifecycl e
Year 1 Year 3Year 2 Year 4 Year 5
Year 1 Year 3Year 2 Year 4 Year 5
£10 – 15m £20 – 30m £25 – 35m £30 – 45m £30 – 50m
Cost Savings
Total Est. Cost Savings Over 5 Years: £115 – 175m
£50 – 75m £75 – 120m £120 - 180m £250 – 350m £500 - 700m
Growth
Total Est. Growth Benefits Over 5 Years: £1 – 1.5b
Even applying a very conservative level of estimation, the potential benefits to the company are inarguably significant. Although the immediate inclination is to focus on a cost reduction play, the real benefits are in the
business’ ability to drive more meaning growth leveraged through a “smarter” organization
Estimated PotentialGrowth Benefits and Cost Savings by Year

© 2010 IBM Corporation
IBM Global Business Services – Financial Services Sector Forum
Retail Bank Card New Markets
• Risk Scoring improvement created an additional $120 million (EBIT) over 5 years through more informed decision making
• Creation of a global relationship-based risk evaluation raised average per customer card net profits by more than five times, with annual profits >$140 million.
• Leveraged total relationship and external data to reduce processing backlog to less than three days (from weeks), reduced application fraud by 80%, reduced analyst staffing by 40%
• New account authentication based on geographic, risk, demographic and source factors virtually eliminating fraud, first-payment default declined 84%. Total process time reduced 90%, with staffing levels reduced by >60%.
• 35% improvement in Customer marketing event identification/conversion rate resulted in $75million (EBIT) a year in benefits
• Fact-based efforts reduced marketing campaign cycle time from 16 weeks to 4 weeks while increasing the number of campaigns generated by >20 times
• Customer-centric integrated treatments created 1 point increase in company-wide loyalty score resulting in +1.7% increase in market share and +1.2% increase in gross margins
• More informed decision making in self directed channels and among frontline associates increased cross-selling proficiency boosting average number of products owned from 3.6 to 6.7
• Decreased merchant agitation, increased merchant promotional sales, increased charge volumes by >25% among targeted groups
Competitor BI Related Business Objectives for 2010- 2011Revenue protection and growth
Competitive differentiation such as innovation and deeper insight
Cost takeout and efficiency
Improved risk management and regulatory compliance
Operating enablement such as continuous improvement 10%
12%33%
41%71%
Top-line focused
Internally focused
Note: Respondents were asked “What are the main business objectives of your enterprise over the next two years? Select two.” Source: Breaking Away with Business Analytics and Optimisation: Enterprise operations meets new intelligence available in late 2009
Top line focused
Internally focused
In order to achieve needed growth and competitive differentiation, the bank must shift focus of BI to meet demands of the market and it’s competitors. This new shift represents an optimised, cost effective model focused on deeper market penetration and customer advocacy.
New Focus
Example benefits for the bank

© 2010 IBM Corporation
IBM Global Business Services – Financial Services Sector Forum
Risk, Reporting & Compliance
Actionable Insight & Outcomes
Customer Focus and Insight
Innovation & Opportunity
Indicates focal point of business value across wave s
Year 1 Year 3Year 2 Year 4 Year 5
� Cross-sell revenues increased by 15%
� Customer loyalty score increase of 1%
� 10% to 20% Accuracy improvement in Customer profitability scores
� Campaign/Event effectiveness improving conversion rate by 35%
� Fraud/Loss reductions of 20% to 40%
� Event/incident detection across channels and products improved by 40%
� Shift in focus from 70%/30% gathering to analysis ratio to 40%/60%
� Shortened development lifecycle by 50% due to the co-location of conform data
� Predictive analytics across channels increase sales effectiveness by 20%
Deliver Improved Testing and Control
Systematically Communicate Opportunity and Problem Incidence
Improve data quality based on standardised data model, metadata strategy and rules
Align loss predictions and provision for loss reserves
Capture Event & Macro-Economic Dependencies
Integration of reconciled customer data
By example of
Estimated Opportunity of Business Benefit Over Time

© 2010 IBM Corporation
IBM Global Business Services – Financial Services Sector Forum
Example MetricsExample MetricsNo of jobs under DQ execution/measurement
Source systems though DQ(0 – XXX)
Number of tables
Number of batch jobs x y = n
Number of datamarts
Number of in-database models executed
SAS database replication on servers
0
0
166k
6600
788
0
400%
10%
100
149k
TBD
700
0
350%
20%
300
100k
TBD
500
5%
300%
40%
500
70k
TBD
400
12%
250%
60%
700
60k
TBD
300
20%
200%
80%
800
40k
TBD
200
28%
150%
This 3-year transformational program will be underpinned by three critical activities to ensure its success and delivery of value.
Program Management & CouncilProgram Management & Council
Change Management & CommunicationsChange Management & Communications
Benefits Tracking & RealisationBenefits Tracking & Realisation
Staged ApproachIntegration and simplification stages are prioritised, based upon existing complexity, cost, and potential value to the business
Incremental Value Generating CapabilitiesCost savings will be based upon clear metrics underpinning productivity gains through reduced: complexity, error rates, cycle times & improved availability
Wave 1Baseline Wave 2 Wave 3 Wave 4 Wave 5
Estimated simplification model based on what we kno w today
*Wave 1 Wave 2 Wave 3 Wave 4 Wave 5
Customer Risk & Compliance Product & Operational
Wave 6
100%
908
20k
TBD
200
35%
150%
Wave 6
*Wave = 6 month release

© 2010 IBM Corporation
IBM Global Business Services – Financial Services Sector Forum
Accountability� Lack of service-level accountability for information provided
� Lack of clear definition, in terms of rights and obligations, ofdata owners subjecting the company to unnecessary exposure, both operational and regulatory
� Total lack of insight into corporate-wide BI spend due to “federated” construct and resulting issues of traceability
� The majority of technology-related spend is devoted to tactical efficiency programs and process areas
� Exposure to FSA fines and reputational damage due to significant gaps in data protection and security policies
� Lack of flexibility in evolving reporting needs limit internal accountability and increase the cost of external compliance
Governance & Culture� Information generally not treated as a critical input for timely
day-to-day business decisions
� “Doing things right” seems to be less important than doing what has always been done or what is convenient for the situation at hand
� Past data strategy and BI initiatives have not been clearly linked to business goals/priorities
� Certain BI assets remain largely unused while others are being used for purposes other than their original intent
� Decision making tends to be done based on personal experience and gut feel rather than rigor and proof
� No BI centre of competency across lines of business to integrate learning and resolve ongoing BI issues
Technology Enablement� No focus on building a common, extensible BI infrastructure
� Legacy policies and lack of standards has resulted in multiple uncoordinated and redundant solutions
� Former attempts to create a corporate BI strategy has created a false sense of impossibility and a lingering skepticism about its potential value, resulting in a plethora of disjointed business Unit BI initiatives with limited value
� Technical competencies within critical areas of BI are noticeably lacking within the organisation
Data and Information � No corporate-wide approach to single version of the truth
� Current focus on tactical BI performance issues combined with an historical lack of quality analytical data is limiting its ability to leverage information as a competitive advantage driving growth and differentiation
� There is no common framework to address data acquisition and integration needs across business units that is timely enough toinfluence daily business decisions (client interactions, sales, marketing, risk, pricing, etc)
� Trusted data standards are not universally applied resulting in questions around quality of the data and output
� Numerous BI practices, knowledge on information location and data relationships are in the heads of “a few” resulting in potentially high risk to business operations
� Data requirements and performance metrics are almost nonexistent creating an inability to measure results and value of BI related investments
Observations, concerns and risks

© 2010 IBM Corporation
IBM Global Business Services – Financial Services Sector Forum
Key Themes
Customer Focus & Insight
Actionable Insight & Outcomes
Innovation &Opportunity
Risk, Reporting & Compliance
• Effective understanding of the customer through single view, supported by an enterprise data model and metadata strategy
• Actionable information for Customer strategies to drive higher quality & more personalised and profitable experiences
• Access to Customer interactions, behaviours, trends and events across all channels and interactions
• Improve data quality and accuracy in reporting through the radical simplification and reduction of redundant sources and repositories
• Ensure timeliness of information to front line through removal of sequential batch processing and reduction in manual intervention
• Increase efficiency and predictability of outcomes through role-based access rules, security and optimisation of supporting tools
• Leverage customer and household relationships to maximise profitable growth
• Integrated view of market, industry and customer segment trends• Predictive analytics to guide and inform of potential opportunities,
e.g. atomic level data, managed sandpit environment• Introduction of a scalable BI environment and supporting processes
• Timely access to complete customer history and transactions across the business to better track behaviours and trends and manage risk
• Profiling and analysis of account/external data for early warnings• Greater agility in meeting new reporting and compliance obligations• Predictive analytics to guide and inform next actions, mitigation and
enterprise-wide risk
Customer Profitability
Customer-related Fraud
Customer Related Regulatory Compliance
Sample Benefits
Business Model Optimisation
Operating Expenses
Process Efficiency
Compliance Losses
Credit / Risk Exposure
Mgt. Of Capital Requirements
Consumer Deposits
Profitable Growth
Marketing Effectiveness
Opportunities
Pink = cost savingsBlue = revenue generatingGovernance & CultureGovernance & Culture

© 2010 IBM Corporation
IBM Global Business Services – Financial Services Sector Forum
Marketing & Offers Management
Corporate Banking Client Manager
Financial Services Advisors
eCommerce / Online Banking
Regional Executives
Contact Centre
Banking Centre
Branch Manager
• Customer
• Risk & Compliance
• Product & Operations
• Event capture
• Branch interactions
• External events & data
• Internal customer data
• n…
Information Management BaseInformation Management Transformation
WHAT’S DIFFERENT & NEW?• Data from >150 interactions per
second (across customers-
segments-channels-products)
• Currently siloed by disparate
systems and distribution points
• Data integrated in one place
with improved ease of access
and productivity
• Robust atomic data retained
for deep quant innovation
• “De-siloed” customers, segments,
channels, and products
• Single “version of the truth” for
integrated analytical data
• Productive, closed-loop innovation
Model Optimisation
Predictive Modelling
Network Optimisation
Customer Behaviour & Response Modelling
Customer Relationship Pricing Analysis
Test & Learn
• Reduced data latency, improved
data usability, and data quality
• “Drudge work” reduced for deep
quants who want to spend time
innovating
• Embedded insight in daily processes
• Tracking of customers across
lifecycle, channel usage, and
interactions
• Real-time data feeds to improve
integrated analytics
Current State
Risk Analysis, Profiling & Treatments
Customer Solutions Development
Target Experience :
• They Know Me
• It’s Simple
• They’re Transparent
• I Trust Them to Help Me
• They Are Reliable
• Act in My Best Interest
Based On:
• Right information +
• Right Time +
• Flawless execution
Resulting In:
• More advocates
• Greater market share
• Quality business
• Higher retention rates
Information Management & Governance
Custom Views
Today Integrate the Data Provide Access Create Trust Empower the Frontline
Line of BusinessSubject / Operational Area
Views
Per
ceiv
ed V
alue
Ove
r Tim
e an
d R
elea
se –
6 S
tage
s
Data Warehouse Conformed / Modelled
Semantic Layer
Time Persistent RepositoryAtomic Data