Embed Size (px)
Citation preview
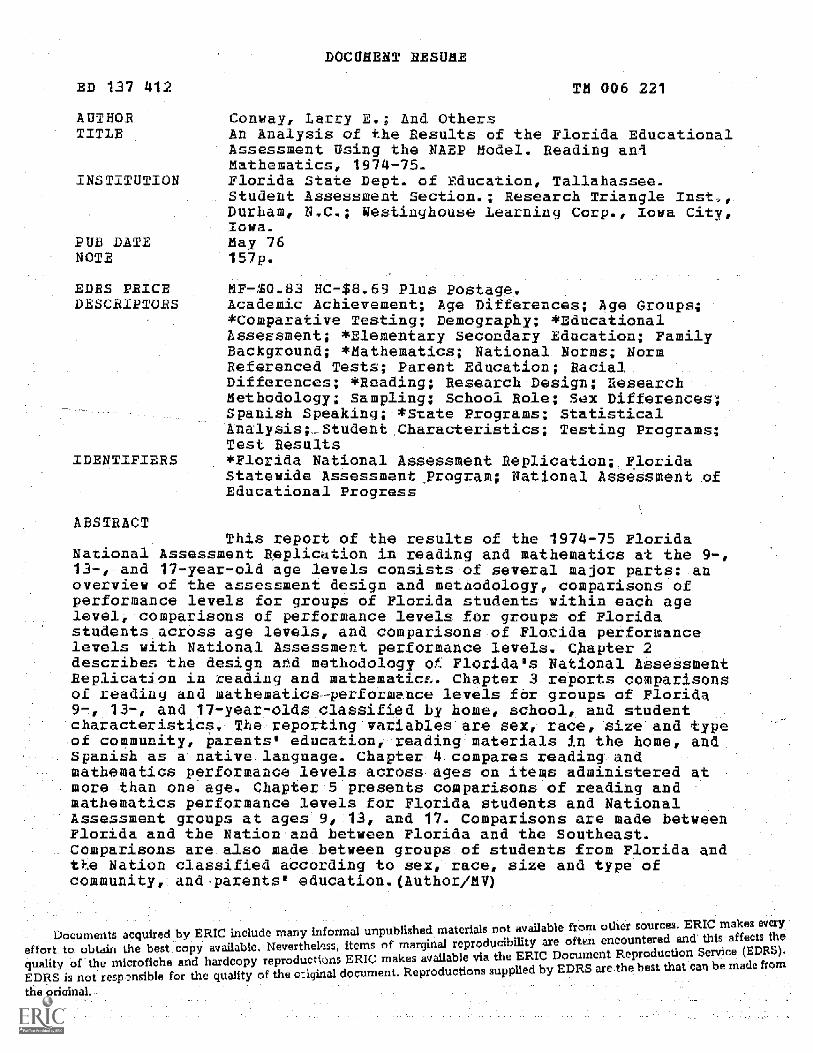
DOCUMENT RESUME
ED 137 412 TN 006 221
AUTHOR Conway, Larry E.; And OthersTITLE An Analysis of the Results of the Florida Educational
Assessment Using the NAEP Model. Reading aniMathematics, 1974-75.
INSTITUTION Florida State Dept. of Education, Tallahassee.student Assessment Section.; Research Triangle InstDurham, N.C.; Westinghouse _Learning Corp., Iowa City,Iowa.
PUB DATE May 76NOTE 157p.
EDRS PRICE MF-$0.83 BC-$8.69 Plus Postage.DESCRIPTORS Academic Achievement; Age Differences; Age Groups;
*Comparative Testing; Demography; *EducationalAssessment; *Elementary Secondary Education; FamilyBackground; *Mathematics; National Norms; NormReferenced Tests; Parent Education; RacialDifferences; *Reading; Research Design; ResearchMethodology; Sampling; School Role; Sex Differences;Spanish Speaking; *State Programs; StatisticalAnalysis;_Student Characteristics; Testing Programs;Test Results
IDENTIFIERS *Florida National Assessment Replication; FloridaStatewide Assessment Program; National Assessment ofEducational Progress
ABSTRACTThis report of the results of the 1974-75 Florida
National Assessment Replication in reading and mathematics at the. 9-,13-,--and 17-year-old age levels consists-of several major parts:_anoverview of the assessment design and metllodology, comparisons ofperformance levels for groups of Florida students within each ageleveli--comparisons -of performance levels for groups of Floridastudents.across age levels, and-_comparisons_of Florida performancelevels with. National-Assessment performance levels. Chapter 2describes the design ahd methodology_ok Florida's National ASseSsmentReplication in reading-and mathematic4. Chapter 3 reports Comparisonsof reading and mathematics-performance levels for groups.of Florida
and 17-year-olds.classified by home, school, and studentcharacteristics- The--reporting-variables- are sexi race, -size-and type-of community,- parents' educationi,,reading:materials in the home, and.Spanish as .a- native_language. Chapter-4_ compares.reading--and
.
mathematics performance levels-across-ages on items administered atFor6-than one age.. Chapter-5 presents comparisons of _reading and.mathematics-performance-levels for-Florida students and National.Assessment groups-at ages- 9013, and 17. Comparisons are made-bet eenFlorida and the Nation'and between Florida and the Southeast.Comparisons-are. also made..between groups.of students .from Florida and.tY'm Nation classified according to sex,--racei size and type ofcaimunitY,and-parents'-education._Author/IIV)
Documents acquired by ERIC include many informal unpublished materials not available from other sources. ERIC makes every
effort to obtain the best copy available. NevertheMss, items of marginal reproducibility are often encountered and this affects the
quality of the microfiche and hardcopy reproductIons ERIC makes available via the ERIC Document Reproduction Service (EDRS).
EDRS is not rasp ,nsible for the quality of the c:iginal document. Reproductions supplied by EDRS are-the best that can be made from
the original.
An Anaitsis- of the Resultsof-- the.--- lorida Educational-Asses* .-. Whig- the NAEP -Model
ding. apli Mathematics.-- -197415-1,1 c
DUCD OdEL FARET,ONAL 1+4%7'1'0U QA
01.)#: r
Department of EducationStatewide Assessment ProgramTallahassee, FbridaMAY 1976
FOREWORD
In 1974-75 Florida Statewide Assess ent conducted a study
f Florida students in reading and mathemat cs. This was a
special assessment based upon the National Assessment of
Educational Progress wh ch would provide data for comparison
of performance of our students and the nation.
This replication was a joint effort among the Florida
Department of Education, Student Assessment Section; the
Westinghouse Learning Corporation Measurement Research Center;
and the Research Triangle institute.
The authors of this report were from the Research Triangle
Institute and included Larry E. Conaway Educational Research
Scientist, Maurice D. Fisher, Educational ResearchcScientist,
a d Lynne M. Johnson, Research Assistant. The project director
was David L. Bayless, Senior Educational Sampling Statistician
with Associate Project Director Larry E. Conaway, Educational
Research Scientist.
Questions or comments about this report and requests
additional information should be directed to the Florida
Department of Education Division of Public Schools, Student
Assessment Section, Tallahassee, Florida 32304 or by calling
(904)488-8198.
LABLE COI E ITS
Faze
FORET ORD-. 4Wf00 .00 *00 #000v0 iiList.of Tables. . . 4 4 4 4 .. . vii
Chapter 1. A Pers active on Florida'sNational Assessment Rtpkis.anon
I. PURPOSE .............II. BACKGROUND. . 0006, 0.60 . diao . 0006.0 1ME UTILIZATION 3IV. OUTLINE OF THIS REPORT. . . . .. . 4
Chapter 2 ALmasmere_thodolenI. INTRODUCTION. . _ . . .
II. SUMMARY OF THE'SAMPLE DESIGN.e ogg 406
0 0- 056
A. Basid Requirements of the Sample Design. . . 6-B. Description of the School Sample and Stratfcation
Procedures 6C. Description of the Student Sample-. . . 10D. Participation Ratee of the School and Student Samples. 12
III. INSTRUMENTATION AND'SCORING 6 00.0 12
A. Selection of Assessment Items. li V 13B. Selection of Student and School Questionnaire Items. 22C. Assembly of Assessment. Booklets. 0 . . . .. . 22
, D.- Scoring. . . . 0 i, .. 0 0 V * 23
IV. DATA COLLECTION . .. .00. ...Of. 0 M 0 0 24
A. Introduction .
B. Preliminary Preparation. . . . . .
C. Training of District Coordinators.D. AasessmAnt Booklet Administration.E. Check-ln and Edit Procedures . .
Participation Data . .
Mi4
°UMMARY OF DATA ANALYSIS.
#eaO 4
242426272828
TABLE OF CONTENTS -ont eed)
Page
Chapter 3. The Rela Betwee R oand the Pe 7-Year-01ds
in eading and Mathematics
I. INTRODUCTION. . . 4 * 32THE RELATIONSHIP BETWEEN SEX AND THE PERFORMANCE OF
9-, 13-, AND 17-YEAR-OLDS IN READING AND MATHEMATICS. 34
The Relationship Between Sex and the Performance of9-, 13-, and 17-Year,Olds Ln Reading !!. 34
B. The Relationship Between Sex and the Perfo _nee of9-, 13-, and 17-Year-Olds in Matheratics . . . 36
II/. THE RELATIONSHIP BETWEEN RACE AND THE PERFORMANCE OF9-, 13-, AND 17-YEAR-OLDS IN READING AND MATHEMATICS.
The Relationship Between Race and the Performance9-, 13-, and 17-Year-Olds in Reading 39'
The Relationship Between Race and the Performance of9-, 13-, and 17-Year-Olds in Mathematics 41
IN. THE RELATIONSHIP BETWEEN SIZE AND TYPE OF COMMUNITY ANDTHE PERFORMANCE OF 9-, 13-, AND 17-YEAR-OLDS IN READINGAND MATHEMATICS . . . . .. . 6 . . . . . * 44
A. The Relationship Between Size and Type of Communityand the Performance of 9-, 137, and 17 -Year -01dain Reading . 4 6 . . 45!
B. The Relationship Between Size and Type of CoMmunity4nd the_Performance of- 9 -,A.3 -i and 17 -Year-Oldsti,Mathematics . . OOOMO* 47
THE RELATIONSHIP BETWEEN PARENTS', EDUCATION AND THEPERFORMANCE OF 9, 13-, AND 17--YEAR-OLDSAND MATHEMATICS Q.
A. The Relations ipPerformance! of
The RelationshipPerformance ofMathematics. .
Between .Parents Edueatioi d the9-, 13,and 17-Year,-OldS in Reading.:Between ParenteEducation and the9-, 13-7!,- and 17-:-Year-Olds in
TABLE OF CO
VI. THE RELATIONSHIP BETWEEN READTHE PERFORMANCE OF 9-, 13-,READING AND MATHEMATICS .
A. The RelatiOnship Betweenand the Performance ofin Reading
The Relationship Betweenand the Performance ofin Mathematics
S continued)
G MATERIALS IN HOME ANDAND 17-YEAR-OLDS IN004000080 we*Reading Materials in Home9-, 13-, and 17-Year-Olds
Reading Materials in Home9-, 13-4 and 17-Year-Olds
. . , S S .
.11a2s_.
56
57
60
VII- THE RELATIONSHIP BETWEEN SPANISH AS A NATIVE LANGUAGE ANDTHE PERFORMANCE OF 9-, 13-, AND 17-YEAR-OLDS IN READINGAND MATHEMATICS . . ... . 63
A. The Relationship Betweenand the Performance ofin Reading .
B. The Relationship Betweenand the Performance ofin Mathematics .
Spanish as a9-, 13-, and. . . .
Spanish as a9-, 137, and
00*
Native Language17-Year-Olds
. .
Native Language17-Year-Olds
0-060 0 6 00 ...
63
. 65
VIII. SUMMARY 68
Chapter 4. Oztrla_aSomg.sla.2ns_ii....s ics
I. INTRODUCTION. . . 70II. OVERLAP COMPARISONS IN READING. . . 70
III. OVERLAP COMPARISONS IN MATHEMATICS 76IV. CONCLUSIONS . .. 80
Chapter 5. Florida Ve-sus Nalona Asse ment Com.arisons
INTRODUCTION. 82-
A. Comparison Groups. . . . . , .82-
B. Interpreting the Reading and hema ca Results. ... . 83
II. READING RESULTS W 86
A. Reading Results at Age 9 . . . .... 86B. Reading Results at Age 13. . . 00000.6 0 . 88C.. Reading Results at Age 17 88
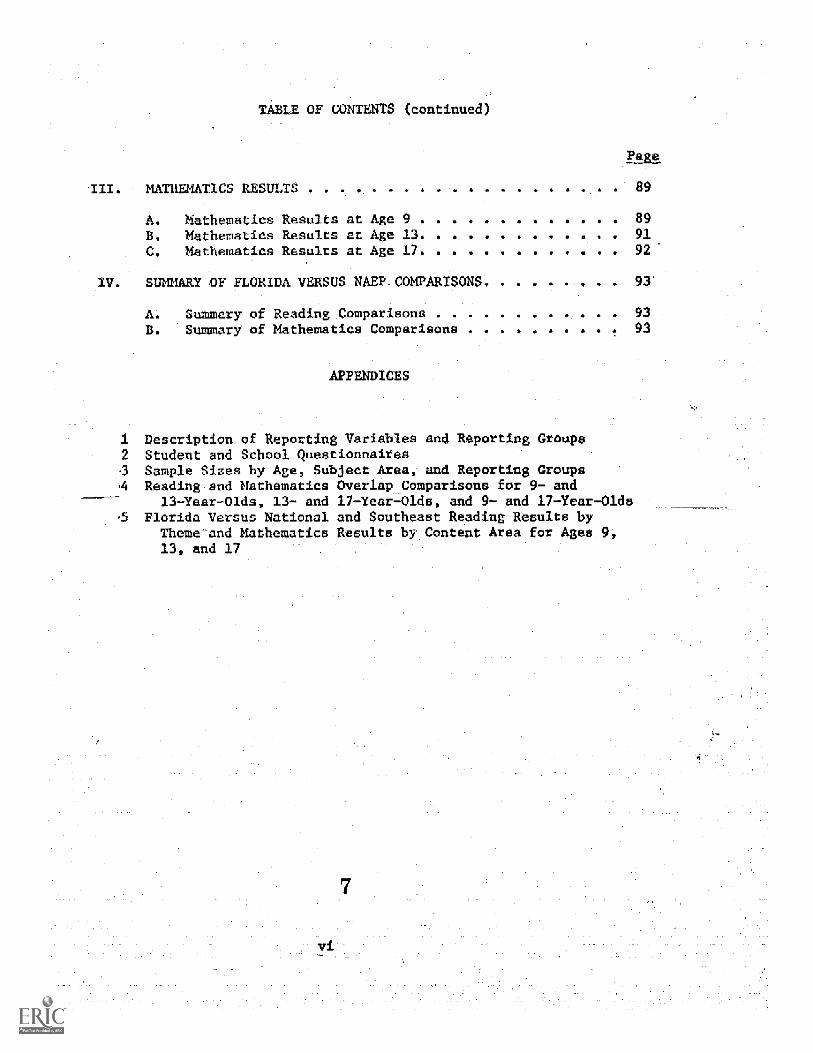
TABLE OF CONTENTS (con nued)
_tut
LATICS RESULTS . * 89
A. Mathematics Results at Age 9 89
B. Mathematics Results at Age 13. . . 91
C. Mathematics Results at Age 17. . * . 92
IV. SUMMAR/ OF FLORIDA VERSUS-NAEF_COMPARISONS. . 93'
A. Summary of Reading Comparisons 93 ,
B. Summary of Mathematics Comparisons 93
APPENDICES
1 Description of Reporting Variables and Reporting Groups2 Student and School Questionnaires-3 Sample Sizes by Age, Subject Area,- and Reporting GroupsA Reading and Mathematics Overlap_Comparisons for 9--and
13-Year-Olds 13- and 17-Year-Olds, and 9- and 17-Year-OldsFlorida Versus National and Southeast Reading Results byTheme-and Mathematics Results by Content Area for Ages 9,13, and 17
L ST OF TABLES
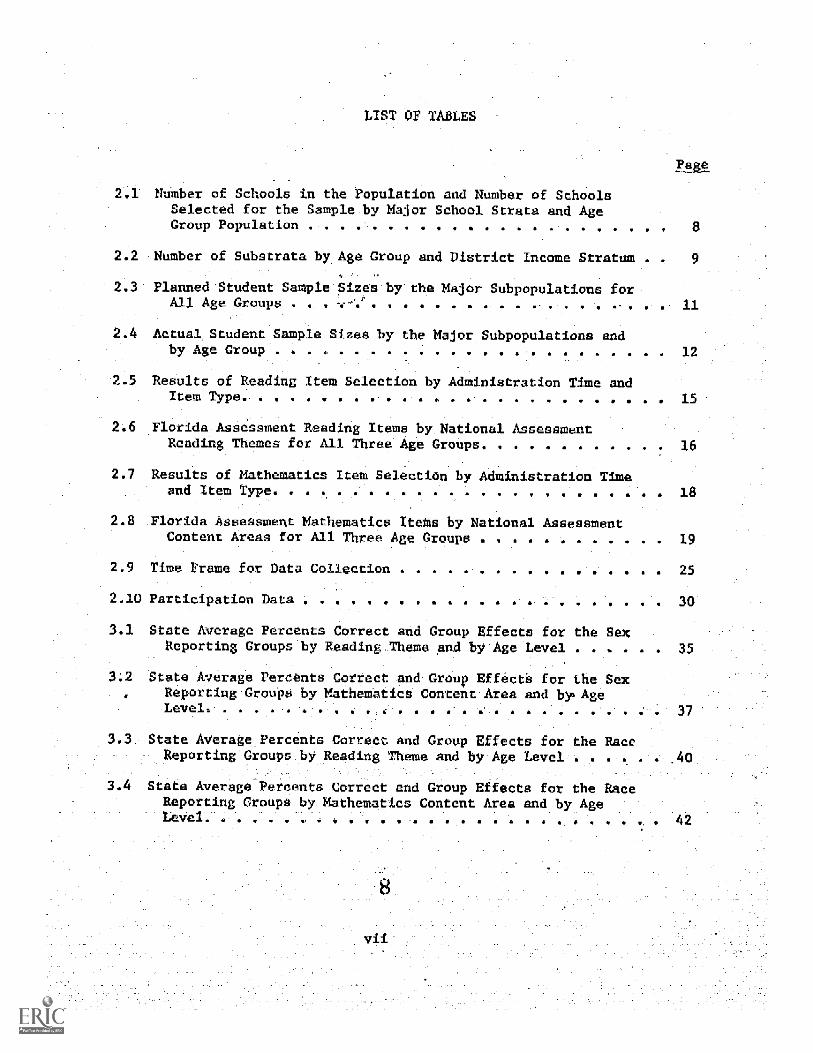
2.1' Number of Sch ols in the Population and Number of SchoolsSelected for the Sample by Major School Strata and AgeGroup Popula ion . . * 6 * *
2.2 Number of Subs rata by Age Group and District Income Stratum .
2.3: Planned S udent Sample SizeSAll Age Groups . , .
2.4 Actual Student Sample Sizeby Age Group
by'-the Major Subpopulations for
by the Major Subpopulationa and******# S .. *-0 ae
election by Administration Time00 OOOOOOOO a
2.5 Results of Reading ItemItem e., ***a a
Florida.Assessment Reading .Items by National AssessmentReading Themes for All Three Age Groups. . . .
a
and0 0 a
2.7 Results of Mathematics Item Selection by Administration Timeand Item Type. 4. S SS SSS w. S aaa.
2.8 Florida Assessment Mathematics Items by National Assessmente GroupsContent Areas for All Three
2.9 Time Frame for Data Collection
2.10 ParticipatIon Data
3.1 State Average Percents Correct and Group Effects for the SeXReporting Groups by Reading_Theme And by'Age Level .
3.2 State Average Percents Correct and Group Effect's for the SexReporting Groups by Mathematics Content Area and by, Age
. ......... .
State Average Percents Correct and Group Effects for the RaceReporting Groups by Reading TheMe and by Age Level .
Page
11
12
15
16
18
19
25
30
35
37
3.4 State Average Percents Correct and Group Effects for theReporting Croups by Mathematics Content Area and by AgeLevel. **Maga. * a
LIST OF TABLES ntinued)
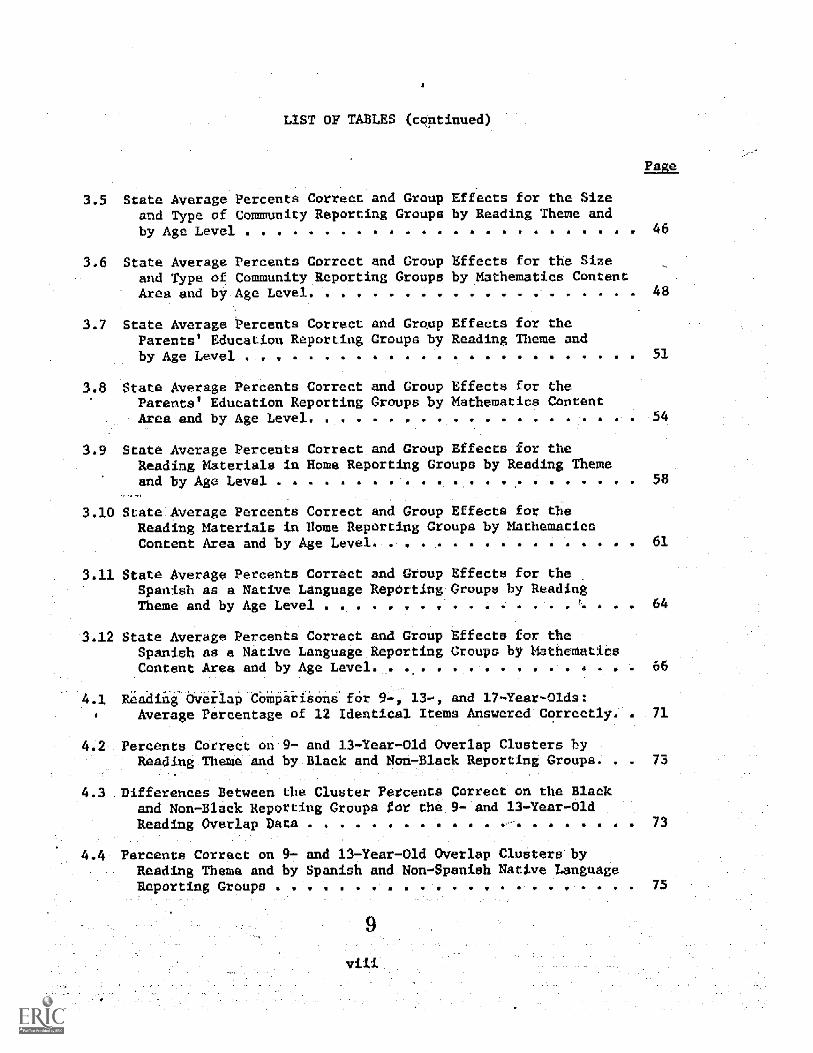
3.5 State Average Percents Correct and Group Effects for the Sizeand Type of Community Reporting Groups by Reading Theme and
by Age Level
Pace
46
3.6 State Average Percents Correct and Croup Effects for the Sizeand Type of Community Reporting Groups by Mathematics ContentArea and by Age Level. . . . . . ..... ..... . 48
3.7 State Average Percents Correct and Group Effects for theParents' Education Reporting Groups by Reading Theme and
byAge Level .:. . . . . . . 0900 51State Average Percents Correct and Group Effects for theParents' Education Reporting Groups by Mathematics ContentArea and by Age Level. . PO id . W. . .. 0 54
3.9 State Average Percents Correct and Group Effects for theReading Materials in Home Reporting Groups by Reading Themeand by Age Level . . . . . . . 58
3.10 State,Average Percents Correct and Group Effects for theReading Materials in Home Reporting Groups by Mathemat csContent Area and by Age Level. . . . . . 61
3.11 State Average Percents Correct and Group Effects for theSpanish as a Native Language Reporting Groups by ReadingTheme and by Age Level . #0 64
3.12 State Average Percents Co rect and Group Effects for theSpanish as a Native Language Reporting Craups by HatheMa lesContent Area and by Age Level. . . . . . . . . 66
4.1 ading Overlap Comparison for 9-, 13-, and 17-Year-Olds:Average Percentage of 12 Identical Items Answered Correc y.
4.2- Percents Correct on 9- and 13-Year-Old Overlap Clusters byReading Theme and by Black and Non-Black Reporting Groups.-
4.3 .Differences Between the Cluster Percents, Correct on the Black
and Non-Black Reporting Groups for the 9- and 13-Year-OldReading Overlap Data . . s . 73
71
4.4 Percents Correct on 97 and 137Year-Old Overlap Clusters byReading Theme and by Spanish and Non-Spanish Native LanguageReporting Groups . . 0 . . . . . . a a . . .
9
75
LIST OF TABLES (coutimued)
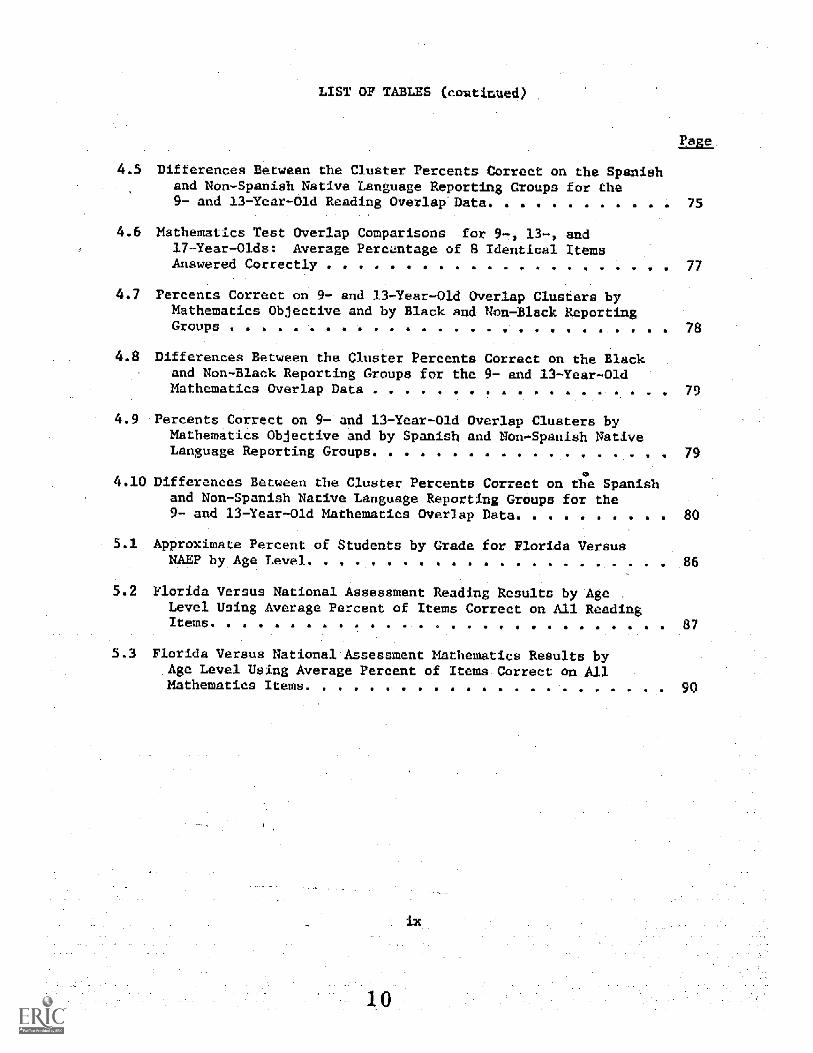
4.5 Differences Between the Cluster Percents Correct on the SpanIshand Non-Spanish Native Language Reporting Groups for the9- and 13-Year-Old Reading Overlap'Data. . . . . . . 75
4.6 Mathematics Test Overlap Comparisons for 97, 13-, and17-Year-Olds: Average Percentage of 8 Identical ItemsAnswered Correctly . . . . ... . . . 77
4.7 Percents Correct on 9- and 13-Year-Old Overlap Clusters byMathematics Objective and by Black and Hon-Black ReportingGroups..... .... . . ....-.. 78
4.8 Differences Between the Cluster Percents Correct on the Blackand Non-Black Reporting Groups for the 9- and 13-Year-OldMathematics Overlap Data . . . . . 79
4.9 Percents Correct on 9- and 13-Year-Old Overlap Clusters byMathematics Objective and by Spanish and Non-Spanish NativeLanguage Reporting Groups. . . ... . . . . 79
4.10 Differences Between the Cluster Percents Correct on t1-1 Spanishand Non-Spanish Native Language Reporting Groups for the9- and 13-Year-Old Mathematics Overlap Data 80
5.1 Approximate Percent of Students by Grade for Florida VersusNAEP by Age Level. . . 90.990.-990 86
5.2 Florida Versus National Asse -ment Reading Results by Age ,
Level Using Average Percent of Items Correct on All ReadingItems ... .. . ..... ... .0009.99 !Oa 87
Florida Versus National Assessment Mathematics Results byAge Level Using Average Percent of Items Correct on AllMathematics Items. . . . . . . . . . . . . . . 90
Chap e
A Persnective_on Plorida's_National Assessment R -lication
I. PURPOSE
Florida's accountability movement was created out of A need to
improve the quality of education, make:the state's educational program
efficient and economical, and accomplish constructIve educational
change. The Statewide. Assessment Program wa5 created as an outgrowth of
the accountability movement. Statewide assessment is'responsible for
both objective-referenced testing And norm-referenced testing of Florida
students.
oi;jective-referenced assessment provide6 information on the extent
to which students are acquiring established basic skills. The rationale
behind such -a-program,involves a need for discovering whether the state
isv in feet, fulfilling its responsibility to Aid student-s in acquiring
basic skills.-- Norm-referenced assessment provides information on the
performance of Florida students compared to similar students in other
places in the United States. This report, Floridal- National Assessment
Replication, is one portion
testing program.
The purpose of the Statewide AssessraLmt Program is to identify
student strengths and weaknesses. Such identification is a necessary
first step in designing educational programs which offer remediation in
the areas of weakness.
f Statewide Assessment's norm-referenced
II. BACKGROUND
Legislation passed in 1970 (Chapter 70-399, Laws of Florida) required
the Commissioner of Education to develop evaluation procedures to objec
tively assess the progress of students at various grade levels and in
various educational programs of the public schools.
1 1

in 1971, the State Board of Education adopted Goals for Education
in Florida, which identified geiteral outcomes expected of the. educational
.system. The Legislature adopted the Educational Accountability Act-of
1971 (Chapter 229.57, Florida Statutes), with --ijor provisions relating
to:
1. Establishment of major or ultimate statewide educational
objectives for each grade level and subject area including,
but not limited to, reading, writing, and mathematics, in the
public schools.
2. Development of a uniform, statewide system of assessment,
based in part on objective-referenced and in part on norm-
referenced tests, to periodically determine pupil status,
pupil progress, and the degree of achievement of established
educational objectives.
3. Implementation of annual public reporting of assessment results
by grade and subject area for each school, each district, and
the state.
4. Administration of tests to students in selected grades in the
basic areas of reading, writing, and mathematics.
The objective-referenced assessment program began operation in 1971
testing a sample of second and fourth graders on selected reading-
related skills. In 1972-73, the program tested students in the third,
sixth, and ninth grades on skills in reading, writing, and mathematics.
A fourth domain, science, wa8 added in 1973-74 at the sixth and ninth
grade levels. In 1974-75, census testing was instituted in place of
sampling procedures. Reading, writing, and mathematics,were stabilized
as testing domains, and science was dropped.
Norm-referenced data were collected for the first time in 1974-75
through:this assessment, referred to as the National Assessment Replica-
tion (NAR). The NAR used test items from the National Assessment of
EduCational Progress (NAEP). '-Although NAEP items were objective based,
the results were used in a normative manner by comparing the performance
of representative samples-of Florida, Southeast, and United States
students on each item.
12
eLe repurLb are wricn or eacn auoience.
Classroom teachers use the results to identify specific skills i
which individual students or groups of students require special attention.
Teachers can then develop specific remediation for improvement in those
areas.
School administrators use the reports to evaluate the performs ce
their school programs They also report the results to parents
ough the Annual Report of School Progress.
Districts use the data to identify areas in which groups of studen s
are performing at an unsatisfactory level. In this way priorities can
be set and resources allocated to the weakest Areas in the district'
curriculum.
The legislative audience must be able to see the basic educational
picture in each district and in the entire state. Their responsibilities
lie In the broad policy area; thus, the unique information which they
need is more detailed than that required by the general public The
legislative audience must know much more shout the relationship between
resource allocation, processes and outcomes in order to make decisions
between competing requests for funds and other scarce resources
State law requires that assessment results be made public.
general public is informed through statewide press releases. Ariother
way the'date are made publid is through the Annual-,ReportofiSchool
Progrese Whickeach'parent receives-from his or:her chiles-school.
i.This report is required to contain inforOtion on the educational progress
the school including-results of the-Statewide Assesoment_Program.
Decision-makers and the public neeclto-,know if:.the-gOalS and ObjeCtiveO
are being met.::By measuring achievement of the-Objectives and reporting
-theresults, the:Statewide Astessment Program playsa major role in
Hestablishing and maintaining educational accountabili y.
OUTLINE OF:THIS
This report of the results of'the 1974-75 Florida National Assessment
ication in reading and mathematicsat :the 9-, 13-, and 17-yea old
age levels consists of several major parts: an overview of the assessment
design and methodology, corparisons of performance levels for groups of
Florida students within each age level comparisons of performance
groups ,of Florida students across age levels, and compar sons
of Florida performance levels with National Assessment performance
levels.
Chapter 2 describes the design and methodology of Florida s National
Assessment Replication in reading and mathematics. Various aspects of
sampling, instrumentation, scoring, data collection, and data analysis
are described to enable the reader to place.the assessment results in
perspective with the assessment design
Chapter 3 reports comparions of reading and mathematics performance
levels for groups of Florida 9-, 13-, and 17-year-olds classified by
home, school, and student characteris ics. The reporting variables are
sex, race, size and type of community, parents' education, reading
materials in the home, and Spanish as a native language.
Chapter 4 compares reading and mathematics performance levels
oss ages on items administered at more than one age.
Chapter 5 presents comparisons of reading and mathematics performance
levels for Florida students and National Assessment groups at ages 9,
13 and 17. Comparisons are made between Florida and the Nation and
between Florida and the Southeast. Comparisons are also made between
groups of students from Florida and the Nation classified according to
sex, race size and type of community, and parents' education.
Chapter
Assessment DesizILAILL121.sily
INTRODUCTION
The design chosen for the Florida National Assessment Replication is
similar to the one used by the National Assessment of Educational Progress
(NAEP). NAEP conducts au annual nationwide survey that is designed to pro-
vide comprehensive information about the educational attainments of American
children, youth, and young adults in certain subject areas. Florida's repli-
cation is an adaptation of the NAEP model and has as its primary goal the
comparison of Florida's student performance in reading and mathematics with
the nation To insure compatability between the two designs, the sampling,
instrumentation, scoring, data collection, and analysis procedures employed
by NAEP were very carefully replicated. The Research Triangle Institute (RTI)
of North Carolina designed the sample, assisted the Florida Department of Ed-
ucation (FDOE) in instrumentation and data collection, and performed analysis
and reporting tasks. The Measurement Research Center C of Iowa printed
and scored the assessment booklets. Both RTI and MRC have perforMed similar
tasks for NAEP, and both have worked extensively with other statewide assess-
ent projects.
This chapter of the
of the assessment design:
tion, and data analysis .
eport presents an overview of the various aspects
sampling, instrumentation and scoring, data collec-
Its purpose is to enable the reader to place the
assesamenrresults in perspeetive with the total assessment design-. The:re.-
sults of-Floridals NationalJAssessment Replication are presented in detail_
in this report howeverii the more technical descriptions of some of the -method:.
ological aspects have been submitted to the EDOE as separate reports.-
SUMMARY OF THE SA1IPLE DESIGN
A. Basic Re uirements of the Sample Design
The sample design was planned to fulfill the following sample requirements
specified by the FDOE for the In-school 9- 1 And 17-year-olds:
1) A statewide sample using NAEP definitions of 97, 13-, and 177year-,-
olds attending both public and non-publicschools should be selected
using random sampling methods.
2) At least one school should be selected across the th
populations from:each of Floridesi67 school districts.
3) Oversamplin should be used to provide results approximate y equal
in statistical precision for the following three ethnic groups:
Non7Black, English native language-students
b) Black, English native language students
c) : Spanish native language students
RTI statisticians determined that a sample-size of 500 to 600 students per
group would meet the specified statiStical precision.
4) The sampled population shouldinclude non-English speaking students.
This subpopulationis not included in the NAEP sampleand consequently will- - -
be exCluded:ln all analYses_involving Florida:to NAEP comparisonsbut will-
be included in the within-Florida analyses involving the Spanish as a Native
Language variable.:iThe non-English speaking students are mostly in the
special "English as a Second Language (ESL)" classes.
Descriøtion of the School Sam-le and Stratification Procedure
In order .to insure representationlof the three ethnic groups
sary to form three maiorstrata, or-graups of schools, based:on ethnicityt_
4 non-Spanish,- or regular,--school stratum; 2):a Spanish language:school stra7
tut; and:3) a small school stratum. The Spanish population is:concentrated in
:the school:districts.of Dade,- Hillsborough,.:Monroe,-Bendry; and Palt B -eh;
therefore the Spanish language, large school stratum was formed from these
OverSatpling, f a group means that theprOpartion of stUdents selected _forthe_sample from the group-is higher than the attual proportion of the population.The weighting of each student in relation to his/her overallchance of being se7:lectedinto the sample accounts for oversampling.in the analysesof-the assessment data.-
districts so that the likelihood of Spanish language students being represented
in the sample would be increased. A school was classified as Spanish if at
least four-Spanish-speaking students were enrolled. The remaining-school popu°
lation in the:stateiwas divided into the-:non7Spanish, or regular, school stratum'
and the small, or-standby, chool stratum. A schoel was classified as small if
it'had 14 or fewer estimated eligible students in the age group being considered,
The regUlar school stratum represented all of the:remaining schools which were
not included in the Spanish language and small sehool'strata. It -should be
emphasized that these three strata were formed forsampling purposes only, and
the data for these groups were not analyzed separately. The composition of the
'school population and the sample by these three major school strata and by age-
classes iS provided in Table 2 1 As shown in Table 2.1, a larger percentageof,
schools containing Spanish nat± language pUpils were selected into the Sample
in order to meet the requirement of oversampling.
For all data analyses performed for the assessment, the students of hese:
schools were weighted in relation to their chance of being selected into he sam--pie. For eiample, if a Spanish student had a selection chance of 1 out'of 10,
he was given a weight of 10; i.e., he represented ten students:bn the:assessed'
population. If a non-Spanish student had a selection chance of 1 out of 30,:he
was.given a weight:of 30; he represented 30 students in the assessedpopu7._.:
iation. Thus all reported assessment-results were !Lweighted" using weightt-:that
reflected the way in which the-students:were selected into the sample.
1. -Non-S anish School Stratification
Within the non-Spanish, or regular, large school major stratum, _the
schools in each of the three age grObyvsampling frames were stratified
----using-school district-incomeTlevel,-School-siZe,-,-And raCiaideMpoSition
as stratification variables.
The school district income levels were defined as follows:
1) The lew income district stratum was composed of the 28 districtswith 20 percent or more of the families in 1970 with incomesbelow the poverty level.
The high income district stratum was composedwith 1970 median family incomes of $8,000 or more
The middle income district stratum was composed of the 25 districtsnot categorized as low income or high income.
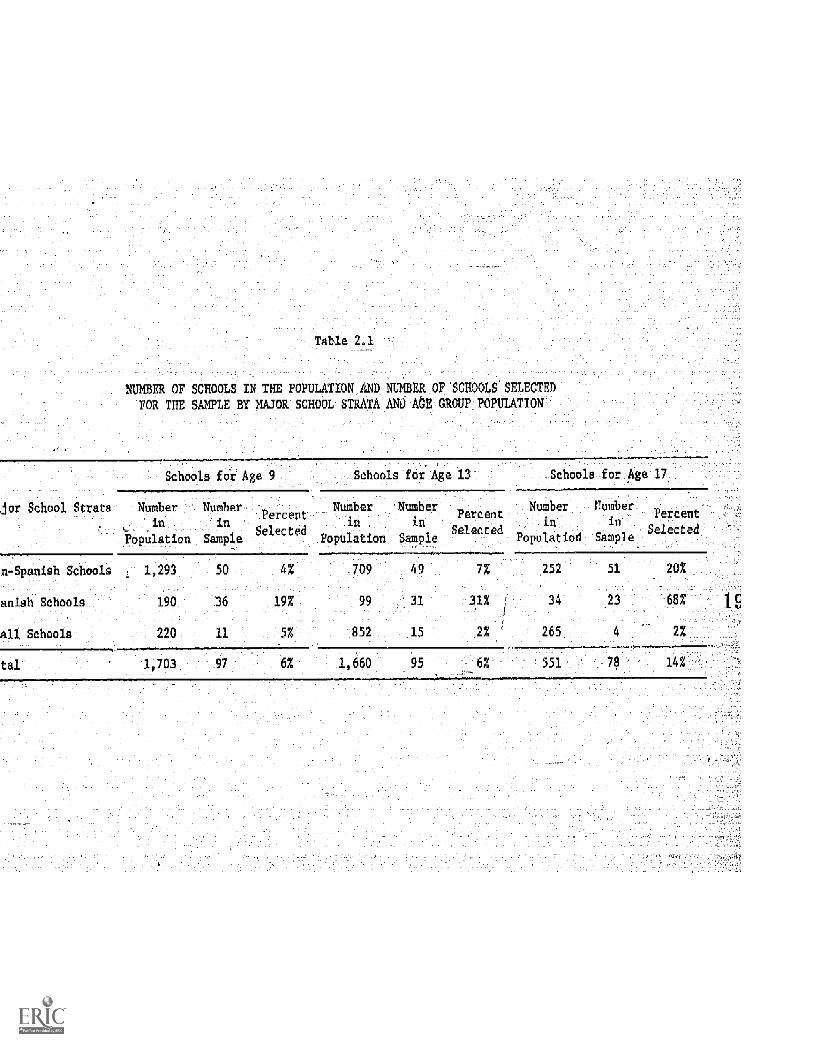
Table 2.1
OF SCHOOLS IN THE POPULATION ANO NUMBER OF SCHOOLS SELECTED
FOR THE SAMPLE BY MAJOR SCHOOL STRATA ANO AGE GROUP POPULATION
Schools for A e 9 Schools for Age 13 ,Schools for Age 17
or School Strata Number
in
Population_ .
Number
in
ample
Percent
Selected
_ler
in
Population
Number
in
Semple
Percent
Selected
Number
in
Populatiod
umber
in
Sample
Percent
Selected
rn-Spa_ Schools 1,293 50 4% .709 49 7% 252 51 20%
anish Schools_ 190 36 1 99 31 31% 34 23 68%
all Schools: 220 11 57 852 15 2% ' 265 -4 2%
tal 1,703 97 6% 1,660 95 551;.---
1S
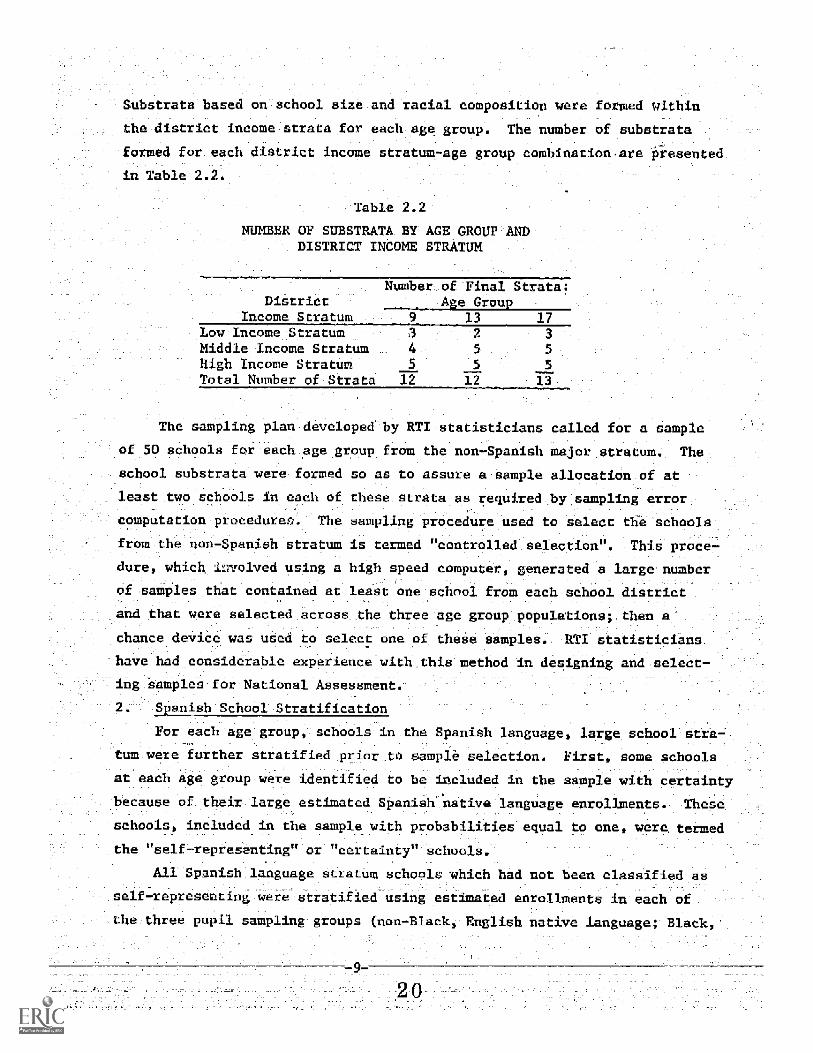
Substrata based on school size and:racial coMposition wereformed -ithin
e-distriet incomestrata.for- each-age group. _.The number of substrata .
formed.for. each-district income stratum-age group combinationiare presented.
Table 2.2
NUMBER OF SUBSTRATA BY AGE GROUP ANDDISTRICT INCOME STRATUM
DistrictNumber-of Final Strata:
A e GrouIncome Stratum 9 13 17
Low-Income Stratum 3 2 3
Middle Income Stratum 4 5 5
High income Stratum 5 5 5Total NuMber of Strata _12 12 13
The sampling plan developed by RTI statisticians called for a sample
of 50 schools for each age group from the non-Spanish major stratum. The
school substrata were formed so as to assure a sample allocation of at
least two schools in each of these strata as required by sampling error
computation procedures. The sampling procedure used to select the schools
from the non-Spanish stratum is termed "Controlled selection". This proce-
dure, which in-yolved using a high speed computer, generated a large number
samples that contained at least one school from each school district
t were selected across the three age group populations; then a
chance device was used to select one of these samples. RTI statisticians
have had considerable experience with this method in designing and select-
ing -samples for National Assessment.
2. Spanish School Stratification
For each age group, schools in the Spanish language, large school stra-
ere further stratified prior to sample selection. First, some schools
at each age group were identified to be included in the sample with certainty
because of their large estimated Spanish native language enrollments. These
schools included in the sample with probabilities equal to one, were termed
the "self-representing" or certainty" schools.
All Spanish language stratum schools which had not been ied as
self-representing were stratified using estimated enrollments in each of
the three pupil sampling groups (non-Black English native language; Black,
English native language; Spanish native language) as the variables for classi-
fication:.: Thus, ezcho.f_ these substrata contained schools which were :imi-
lar in student enrollment characteristics.
.To the extent possible, the substrata were formed which were of approx
mately equalsize in terms of "adjusted" total enrollment. The 3chools!
"adjusted" enrollments were computed by multiplying the estimated enrollments-,
-in each,of the three pupil sampling,groups'by appropriate oversampling rates,
and then:summing. Creation of approximately,equal sized strata based on the
adjusted enrollments assured that sampling weights for the selected pupils
woUld be relatively uniform within each pupil samplinggroup.
The total number of sampling substrata formed within:the Spanish language
major.stratum was 16 for the 97year-old age group, nine for'the_13year-old
age group:, and four for the 17-year-old.age-group., In general, two sample
schoels were allotated to each substratum, and the schools were selected
with equal probabilities without replacement:.
Small School Stratification
The small school substrata were also formed to include schools with
similar characteristics. Thus, schools were placed into the same situation
if their ethnic compositions and total number of students were similar.
The total number of substrata for the 9-, 13-, and 17-year-old age groups
were 9, 12, and 2, respectively. The small school sample was selected from
21 small districts which appeared to have 20 or fewer eligible students in
some of their schools, and 9 other small schools were chosen from the
balance of the small school sampling frame by using equal probability
sampling without replacement.
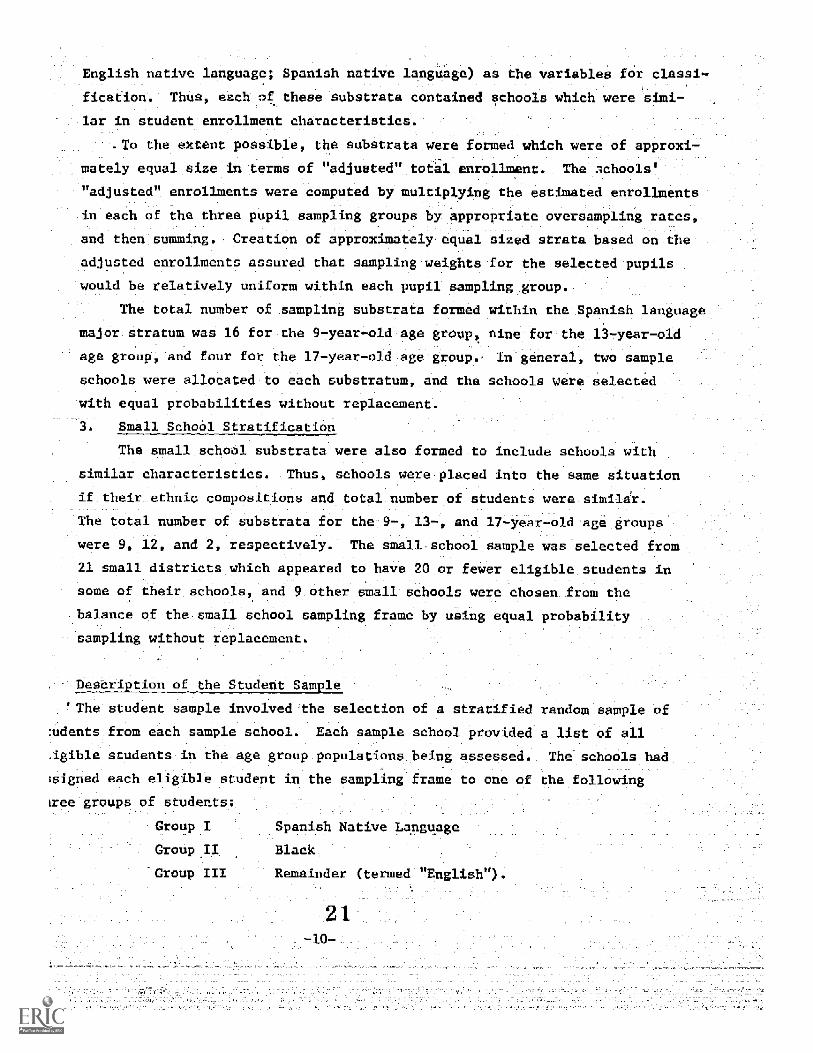
Desdr tion o_ the Student Sam.le
!The student sample involved the selection of a stratified random sample
:udents from each sample school. Each sample school provided a list of all
.igible students-in the age group populations being assessed. The schools had
;signed _each eligible student in the sampling frame to one of the following__
kree groups of student
Croupj
GroupiII Blackj
Group III termed 14liee
Spanish Na-ive Language
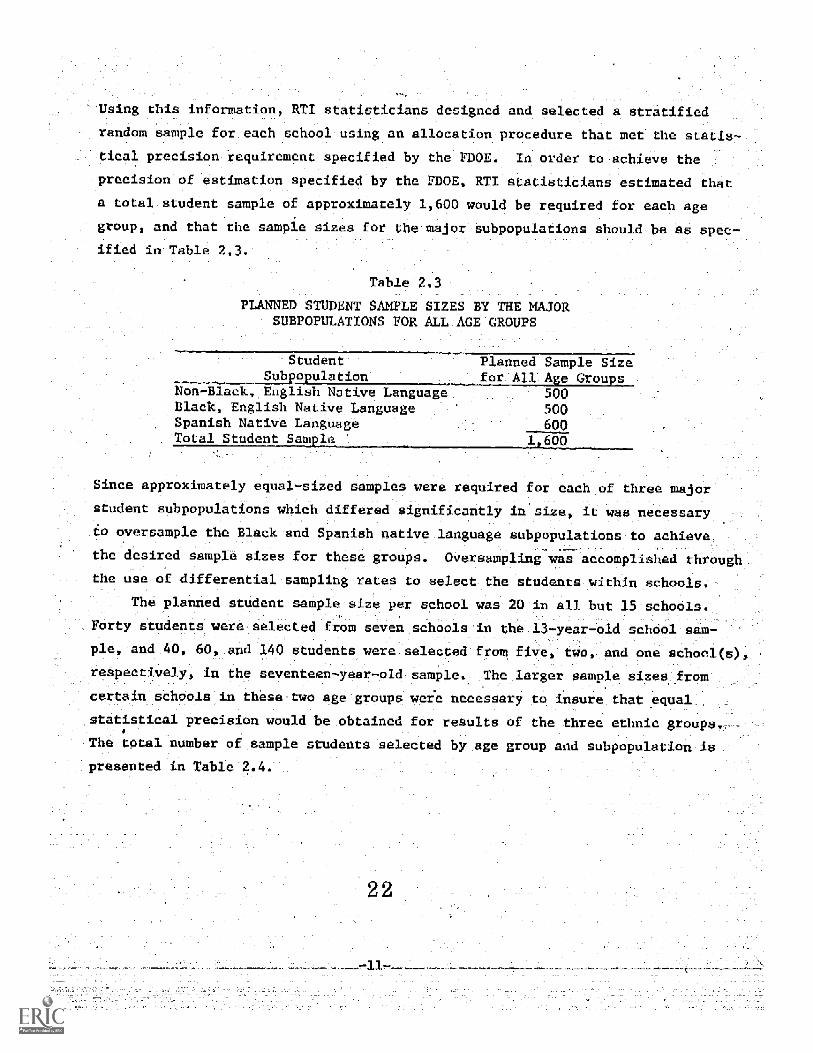
information, RTI statisticians designed and selected a stratified :
_random sample for.each school-using an allocation procedure that met statis-
tical predisiomiequirement specified by theJDOE. In order to achieve the_
:precision of estimation-specified by-the .FDOE,- RTI statistician-- estimated that
-a total:student sample of approximately 1,,600 would be required for each age
group and that the sample sizes-for themajo .-Subpopulations, should,be as specified in:Table 2.3-
Table 2.3
PLANNED STUDENT SAMPLE SIZES BY THE MAJORSUB OPULATIONS FOR ALL AGE GROUPS
Student Planned Sample Size_-_§,mhpapm2.2yion for:All A-e Groups
Non-Black,:English Native Language 500.)31ack, English Native Language 500Spanish Native Language 600Total Student Sam le 1 600
S nce approximately equal-sized samples were requ_red for each of three ma
necessary,
to oversample the Black-and Spanish native language subpopulationsito achieve
the desired sample sizes for these groups. Oversampling was accomplished through
the use:of differential sampling rates to select:the students within schools.-J
The planned student sample:size:per school was 29 in all but 15 schools.'
Forty students wereselected from seven schools:in the 13-year-old schdol sam-
,ple, and 40, 60 and 140 students were selected from five, two and one school
reapectively, in the seventeen-year-plcLsample. .:The :larger sample sizerom
certain schools in these-two age groups: weie necessary to insure that equal
statistical precision would be obtained for resOlts of the three ethnic--.groups.,
The total number of sample students selected by age group and subpopulation is
preaented _n Table.2.4.:
student subpopulations which differed significantly in size, it was
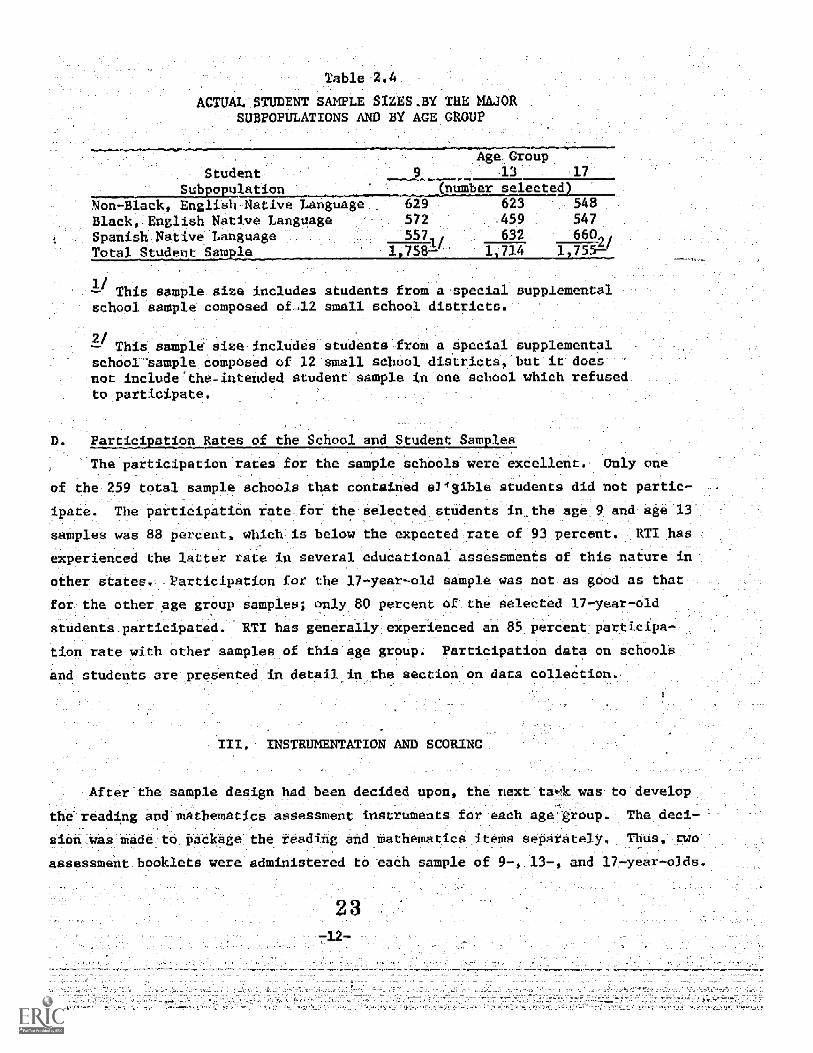
Table 2.4
ACTUAL STUDENT SAMPLE SIZES..BY THE MAJORSUBPOPULATIONS AND BY AGE GROUP
StudentSub4cloulation:
e twirl
13 17
number selectedNon-Black, English- Native LanguBlack, English Native LanguageSpanishlgative LanguageTotal Student Sam.le
a 629 ,_ 623 548572 -459 547557 632_ ::66N
.177M11 1 :714 1 7554.-
This sample size includes students from a:special supplementalschool sample composed of-12 small school districts.
2/ __- - -This sample size includes students from a special supplemental
School-sample composed of 12 small school districts, but:it.doesnot include'theintended student sample in one school which refusedto participate.
Participation_Rates of the School-and Student Samples
The participation ratestfor the sample schools were excellent.
the 259 total sample Schools that contained eligible students did not partic-
ipate. The participation rate for:the:selected student§ in_th&age9 and age 13
samples was 88:percent, whick is below the expectedtate of:93-:percent RTI has
experienced the latter rate-in several educational assessments of this nature
other states. Participation for the 17-year-old sample was natasgood as that-
the other age group samples; only 80 percent ofthe selected 17-year-old
stddents_participated. RT1 has generallyexperiended an 85 percent-participa-:
tion rate with other samples of this age group Participation data on schools
and students are presented in detailjn the section on:data colletiam.,
Onlyone
III. INSTRUME
the sample design had been decided upon the next:tatlk was to develop
the'reading and mathematics assessment instruments for each:age:group. The deci.
sion-was mede:to_padkage: the reading and tatheMatics it6MS separately. Thus, two
assessment booklets were administered te,7each sample of 9-, 13- and 17-yea -olds.
The first part of the reading assessment booklet contained the items and the sec-
end part consisted of a seven-item Student Questionnaire.-
Instrument development was accomplished through the following three steps,
which are discussed in the spbsequent sections selection of assessment i ems,
selection of School and Student Questionnaire z.ma, ead assembly of assessment'
booklets..
f Assessment,Items
In:August of 1974
select the reading and mathematics items beet suited to the objectives pf the
Florida National Assessment Replication. '_The meeting of the mathematics item
selection committee on August 16 was followed by a meeting of the reading item
selection committee on August 17. The members of the mathematicsritem selection
committee were: Dr. Thomas Denmark, Professor,of Mathematics Education at Florida
State University, Mb Renee Henry, FDOE-Methematice Consultant- and Dr. Kenneth
Loewe, FDOE Evaluation Consultant. The,reading item selection: committee members
were: Dr. Martha Cheek- FDOE Reading Consultant, and Dr. Kenneth Loewe,- FDOE:
Evaluation Consultant. Dr. David Bayless, RTI Educat onal Sampling Statistician,
Mr. Larry Conaway, RTI Educational Research Scientist, and Dr. Wayne Martinof
the National Assessment of Edudational Progress served as resource consultants
Jor,both selection committees.
It had been concluded prior to the conference that t_e National Assessment
released reading and mathematics item pools would provide the bestvehiclefor
conference was held with staff from FDO and RTI to
comparison of Florida's student performance with the nation's. The selection
committees first eliminated from the NAEP released item pools those items with
obVious construction or formatting problems. Some of the remain;7.ng items had
be elIminated'in order to meet design Itonstraints associated with costs and
Imam testing time for each student The total administration time limit for-
reading and mathematics was 90 minutes for 9-yeer-olds, 120 minutes for 13-year-
-olds, and 120 minutes for 17-year-olds. Both committees established Item selec-
rion criteria related to reading:and mathematics content in selecting the items
to be included in the assessment at each age.
The reading selection committee placed emphasis on items frem theteS
rhrough 8 (gleaning sIgnificant facts from passages,
tion, drawing inferences
main_ideas and organize-
and critical reading) Items were eliminated that
could readily_ be answered through a process_of eliminating:response choicesi*
that were mastered at a younger age level, that were regional in concept-or
vocabulary, or that did hot appear to measure the theme in which they were
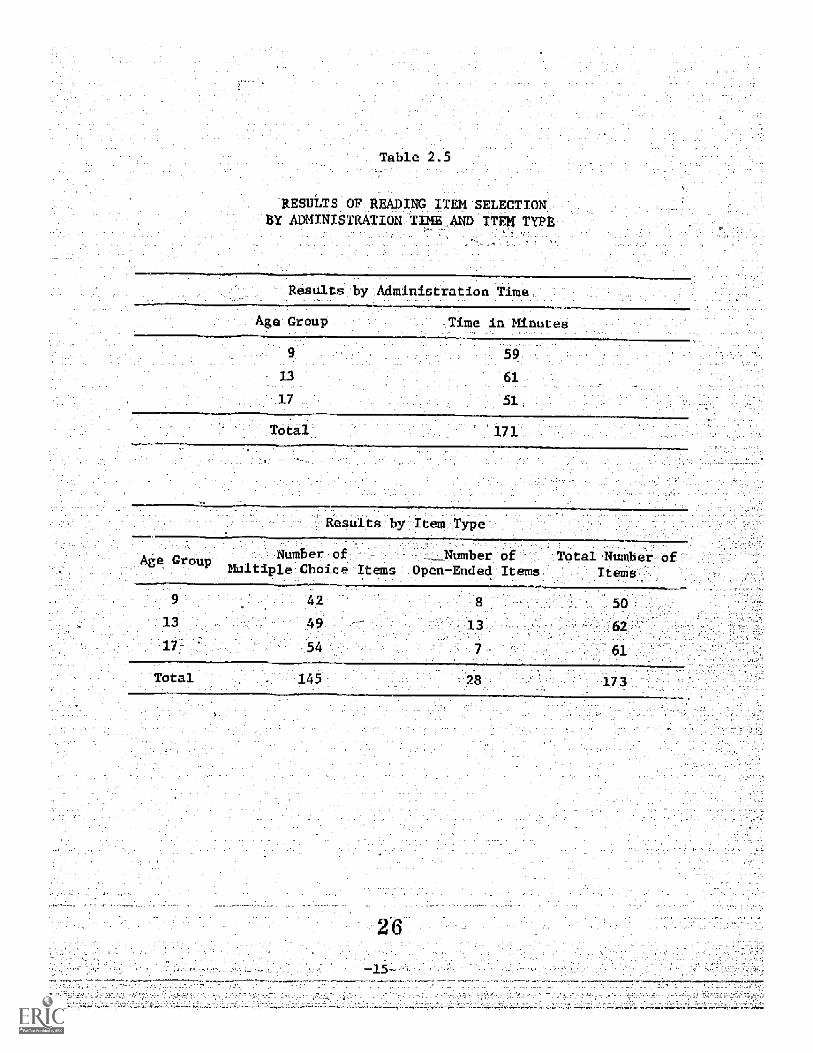
placed by NAEP. The results of the reading item selection for each-age group
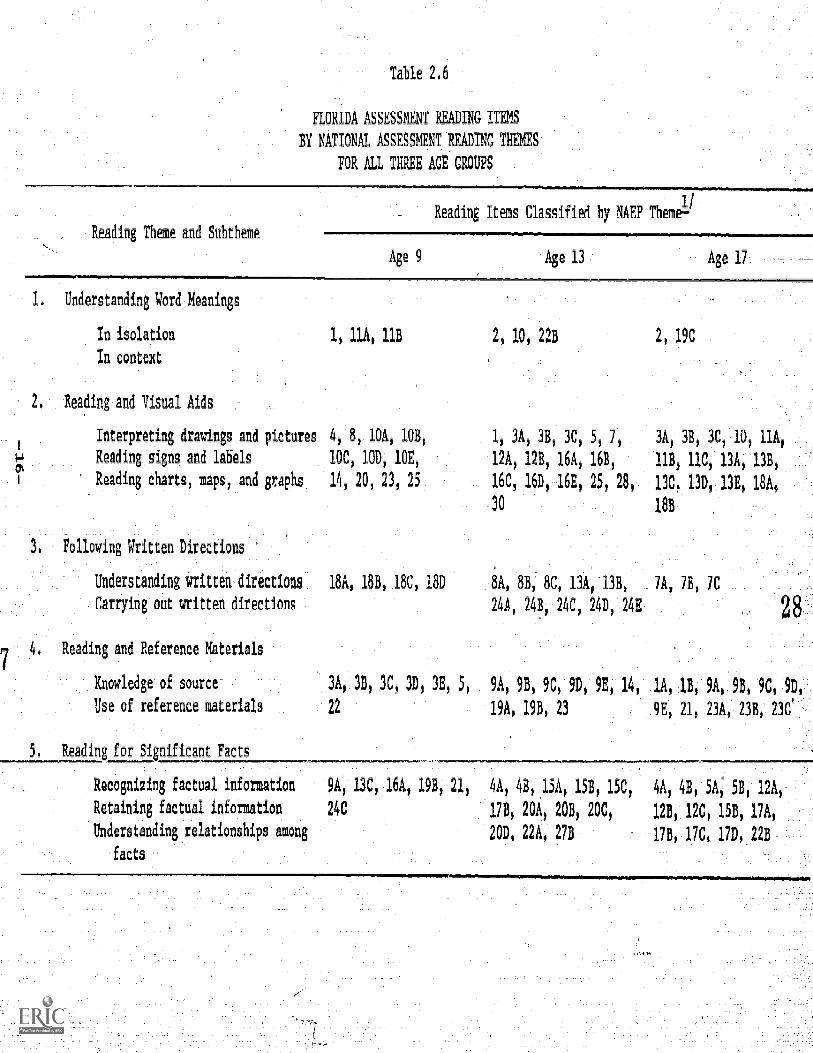
by administration time and type of item aregiven in Table-:2-.5'.. The Florida:
reading items for each age groUp are identified by NAEP themeaJn Table
The mathematics group selected items that measure skillslimportant- for
Florida 13, and 17-year-old Studenta and that Are the mest apprapriate
for these students. Mathematics items werere ected when they appeared to be
inappropriate for Florida students at a particular age level', or when a younger_
age group had achieved a very high ievel of performance on the same item. The--
results of the mathematics item selection for each age:group by administration
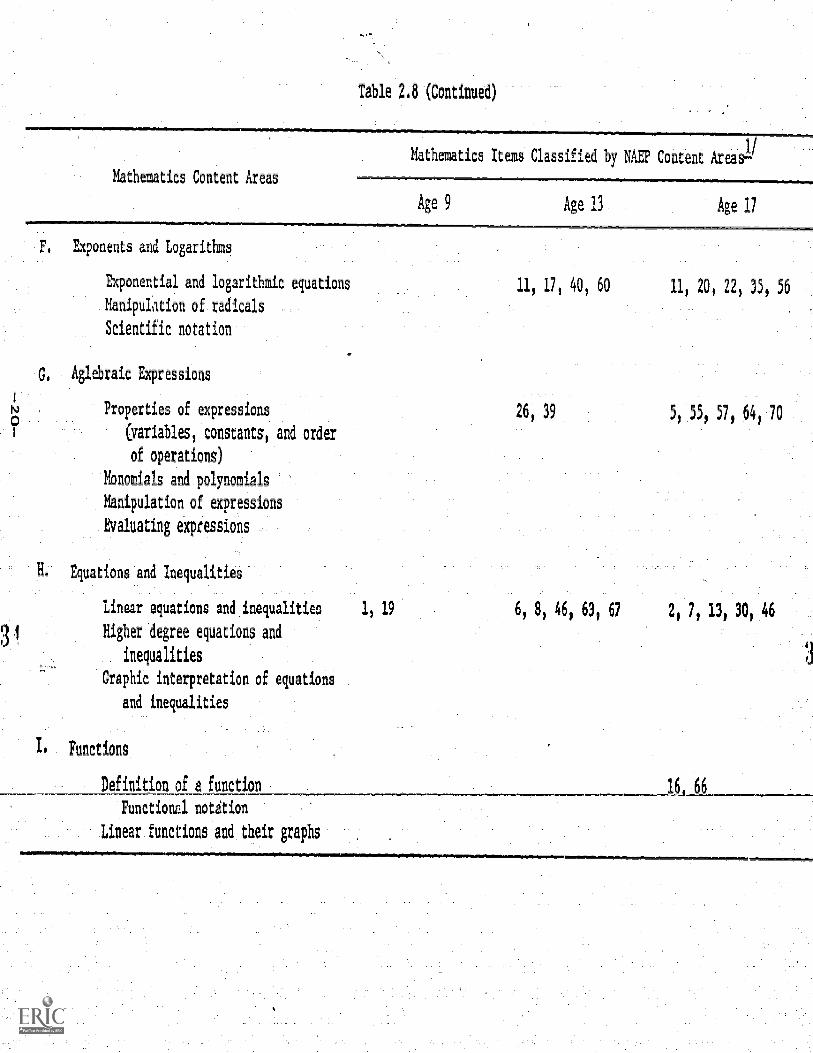
time and type of item are given in Table 2.7. The Florida mathematics items
are identified by NAEP content!reas for eadh age group in Table
In the !election ProCess both committees considered item difficulty level
relative to the age group and attempted to insure coverage of those themes:and
content areas-that were best suited to the needs of the Florida Assessment. Within
the constraints of Cost and design factors associated with the assessment, both
_committees also considered balance across item difficulty levels and balance:be--
tween multiple choice and open-ended items=
=
Table 2.5
RESBLTS OF READING ITEM SELECTIONBY ADMINISTRATION TIMB_AND ITM-TYPE
Resultsiv Administration Time
e Group -Time in Minutes
13 61
17 51
Total 171
Results by Ited Tyne-
Group Number of , Number of Total NimiberMul iple Choice Items Open-Ended Items Items
9 42 50
49 13 62
54 7 61
Totai 145 28 173
2 6
-15-
Reading Theme and Subtheme
Table 2.6
FLORIDA ASSESSMENT READING ITEMS
BY NATIONAL ASSESSMENT READING THEMES
FOR ALL THREE AGE GROUPS
Understanding Word Meanings
In isolation
In context
eading and Visual Aids
Interpreting drawings and pictures
Reading signs and labels
Reading charts, maps, and graphs
Following Written-Directions
.Understanding witteltdirectiona.
Carryingout written.directions:.
Reading and Reference Materials
Reading Items Classified
,
Age 9 Age 13 Age 17
11A, 118 228 2, 19C
4, 8, 101, 10B, 1, 3A, 38, 3C, 5, 7, 3A, 38, 3C, 10, 1111
10C, 10D, 10E, 12A, 128, 161, 168, I1B, 11C, 131, 138,
14, 20 23, 25 16C, 16D, 16B, 25, 28 13C, 130, 13E 181,
30 188
181, 1 B 18C 1 D 81, 88, 8C, 131,1313,
24A 248, 24C, 24D, 24E
Knowledge of source 31, 38, 3C, 30 91, 9B, 9C, 9D, 9E, 14 11, 18, 9A, 98 9C, 90
Use of reference mate ials 22 191 19B, 23 9E, 21, 231, 238, 23e
5. Reading for Significant Facts
Recognizing factual information 91, 13C 16A, 198, 21 4A, 43, 151, 15B, 15C, 41, 48, 51; 5B, 121,
Retaining factual information 24C 178, 20A, 20B, 20C, 12B, 12C, 158, 171,
Understanding relationships among
facts
20D 221, 278 17B, 17C, 170 228
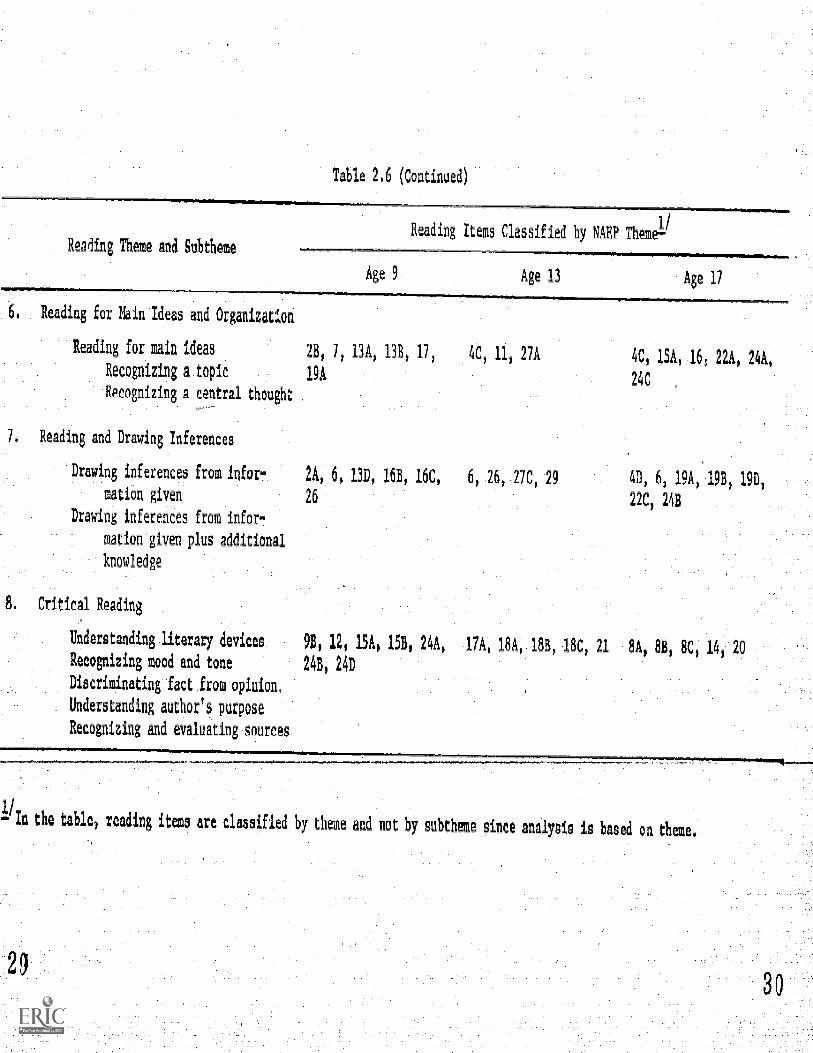
Table 2.6 Continued)
Reading Items Classified by NAEP ThemReading Theme and Subtheme
Age 9 Age 13
Reading for Main Ideas and Organizat n
Reading for main ideas 2B, 7 13A, 13B, 17, 4C, 117 27A
Recognizing a topic 19A
Recognizing a central hought
Reading and Drawing Inferences
Drawing inferences from infor!
mation givev
2A 6 13D, 1 B 16C,
26
6, 26 27C, 29
Drawing inferences from infor7
mation given plus additional
knowledge
Age 17
4C, 15A, 16, 22A, 24 ,
24C
4D, 6, 19A 1 B 1 D,
22C, 24B
Critical Reading
Ainderstanding literary deyices, 9B, 12, 15A, 15B, 24A, 17A, 18A 18B 18C, 21 8A, 8B, 8C 14 20Recognizing Mood and tone 24B, 24D
Discriminating fact frog opiti n,
Understanding author's purpose
Recognizing and evaluating sou c
1/-Iu the table, reading items are classIfied by theme and not by subtheme since analysis is bas on theme.
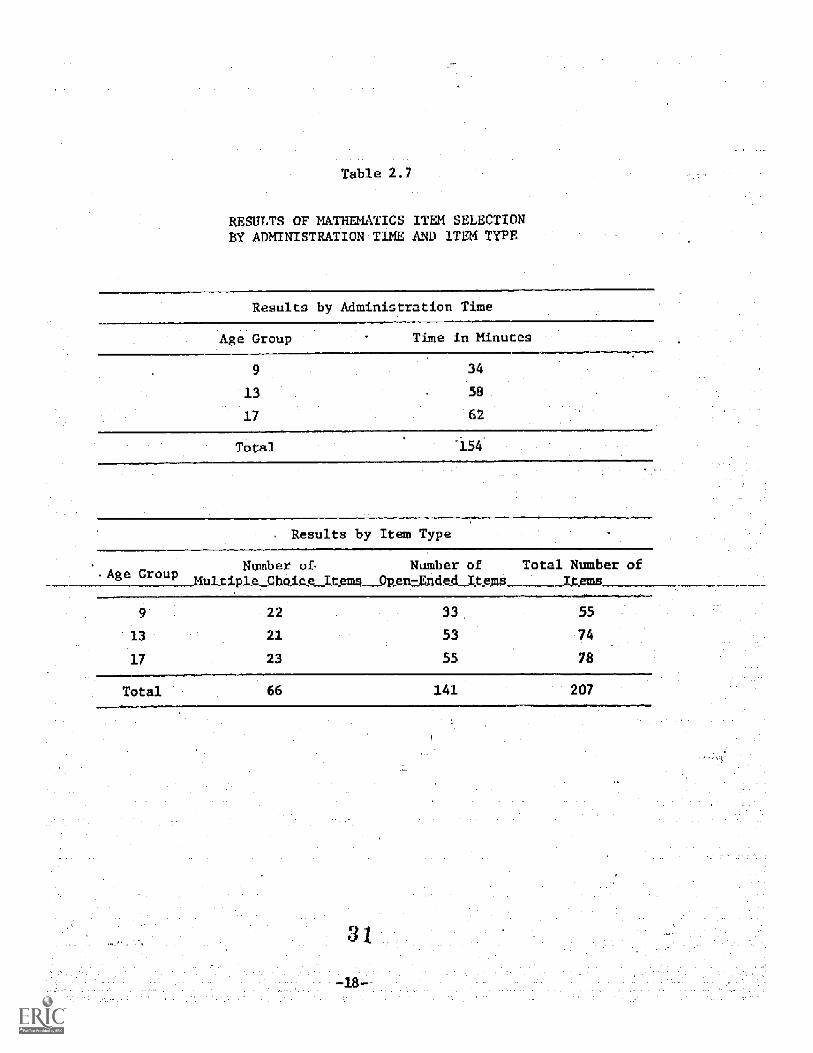
Table 2.7
RESULTS OF MATHEMATICS ITEM SELECTIONBY ADMINISTRATION TIME AN1) ITEM TYPE
Results by Administration Time
Age Group Time in Minutes
9 34
13 58
17 62
Total -154
. Results by Item Type
Number of Number of.Age Group MultpleChojce Items__ Open-Ended Items
13
17
-22
21
23
Total Number ofItems
55
55
74
78
Total 66 141 207
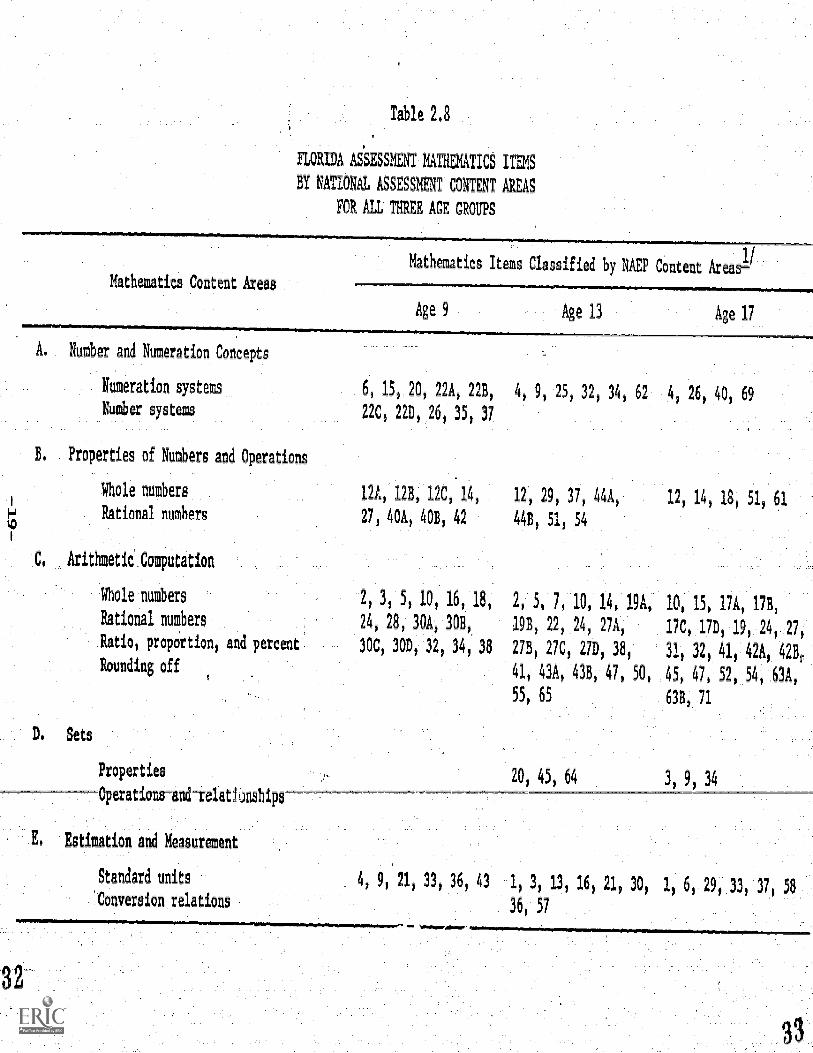
Table 2.8
FLORIDA AiSESSMENT MATHEMATICS ITEMS
BY NATIONAL ASSESSMENT CONTENT AlEAS
FOR ALL THREE AGE GROUPS
Mathetatits Content Areas
Number and Numeration Concepts
Numeration systems
Number systems
Properties of Numbers and Operations
Vhole numbers
Rational numbers
Arithmetic Computation
Mathematics items Classified by NAEP Content AreaR-
Age 9 Age 13
6, 15, 20, 22A, 228, 4, 9, 25, 32 34 62
220, 22D 26 35, 37
la, 12B, 120, 14, 12, 29, 37, 44A,
27, 40A 408, 42 44B 51 54
Phole numbers 2, 3, 5, 10, 16, 1 2, 5, 7, 10, 14, 19A,
Rational numbers 24, 28, 30A, 30B, 19B, 22, 24, 27A,
Ratio, proportion, and percent 300 30D 32, 34, 38 27B, 27C, 27D, 38,
Rounding off41, 43A, 438, 47, 50,
55, 65
Sets
Properties 20, 45 64
Operations-and-relatlAsbips-
Estimation and Measurement
Standard units
Conversion relations
4, 9, 21, 33, 3 , 43 1, 3, 13 16, 21,
36, 57
Age17
12, 14, 18, 51, 61
10, 15, 17A, 178,
170, 17D, 19, 24, 27,
31, 32, 41, 42A, 42B,
45, 47, 52, 54, 63A,
63B 71
Mathemati s Content Areas
Exponents and Logarithms
Exponential and logarithmic equations
Manipulation of radicals
Scientific notation
Aglebraic Expressions
1
Properties of expressions
(variables, constants and ord
of operations)
Monomials and polynomials
Manipulation of expressions
Evaluating expressions
Equations and Inequalities
linear equations and inequalities 1, 19 6, 8, 46 63 67 2 7, 13 30 46
Higher degree equations and
inequalities
Graphic interpretation of equations
and inequalities
._
Table Continued)
1/
Mathematics Items Classified by NAEP Content Ann=
Age 9 Age 13
11, 17 40 60 11,
26,39
Age 17
56
Functions
Definition of a function
Functiond notation
Linear functions and their graphs
_6
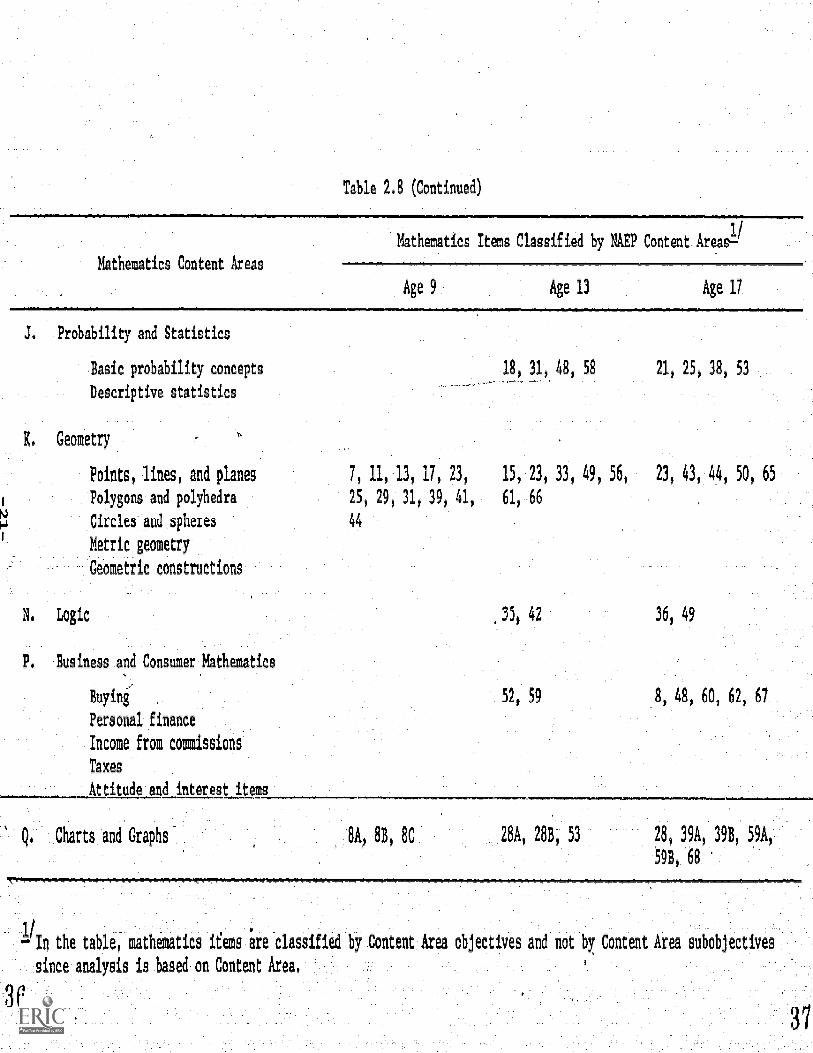
Table 2,8 (Continued)
Mathematics Content Areas
1/Mathematics Items Classified by NAEP Content Areas=
Age 9 Age 13 Age 17
Probability and Statistics
Basic probability concepts
Descriptive statistics
Geometry
Points, lines, and planes
Polygons and polyhedra
Circles and spheres
Metric geometry
Geometric constructions
Logic
Business and Consumer Mathematics
Buying ,
Personal finance
Income from coo. ssions
Taxes
_Attitude_and interest items
.Charts:And 0raphs..
7,
25
44
11, 13,
29, 31
17,
39
23,
41,
18,
15
61
31,
23,
66
4
33, 49, 56
21,
23,
25,
4_
38,
4
53
50, 65
3649
- In the tahle, mathematics ii sire classified by Content 'Area objectives and not by Content Area subohjectives,
since analysis is hase&on Content Area,
Selection of Student and Sch ool uestionnai e Items
It was decided that the questionnaire items utilized in the National Assess-
ment would provide the demographic and background data sufficient for analysis
while staying within allotted administration time limits and personal privacy
constraints. Furthermore, the use of NAEP items assured comparability between
Florida and NAEP reporting variables and reporting groups.1/
The seven-item
Student Questionnaire was duplicated using NAEP wording and format at the end
of the reading assessment booklet. The data obtained from these items were used
in defining three of the six reporting variables: Sex, Reading Materials in the
Home, and Parents Education. The School Questionnaire was sent to the princi-
pals of the sample schools for completion. The data from two of the items was
:usediin defining the reporting variable Size and Type of Community. The remaining
two reporting variables, Race and Spanish as-a Native Language were obtained
from data gridded on the assessment booklet coverse2/-
C. Assembly of Assessment Booklets
After item selection hd beer. J-ompleted by the committee members, and the
decision to use NAE? Student el,2,!,3tionnaire items had been made_ the reading and
mathematics items uars.at;mbled into six-assessment booklets (one readingand
one mathematics for )f tbe three age groups) by RT1 personnel experienced
in packaging NAEP mcria1s. The total number of items and the amount of space
needed for mathema=;c4 items necessitated two machine scorable booklets at each
Age level. One booklet contained reading items with sample exercises and the
other mathematics it2MS With sample exercises. The Student Questionnaire was
placed at the end of the reading nklet.
The packaging was accomplishf)01 close cooperation with MRC who would print
and score the booklets as it had done for NAB?. It was importnt that the format
for the items be as nearly identical os possible and practical with the format
:used by NAEP, that the sequence of Itfms be appropriate, and that the answer
marking and scoring areas be formatted to;minimize student errcirs. To insure
that these requirements were Met, the booklets were reviewed by RTI and NAEP
Reporting variables 'tnd groups are described in Appendix A-1
2/The coding of supplev&Atal data on assessment covers is described
in the section on data cclimc;.ioil.urther
personnel prior to administration. RTI was primarily responsible for spacing
the items so that adequate working area was available andfor ordering the
items in the booklet on the basis of their content and their difficulty levels.
Packaging of reading items did not pose any problems; however, because of the
quantity of mathematics items, the spacing of some open-ended mathematics items
had to be changed. The degree to which spacing within an item is changed could
adversely affect student performance; therefore, RTI had the mathematics booklets
carefully reviewed by both NAEP and MRC staff members involved in the scoring
process. NAEP staff members also checked the ordering of mathematics items for
answer cueing in items placed consecutively in the booklet for each of the threeAge groups.
A paced audio tape was created to accompany each booklet. Students were to
respond to each item within the time provided on the tape. The response times
for both reading and mathematics items were carefully set to be ceMparable to those
used in NAEP administrations. At the 9-year-old age level there was a break during
the administration of the reading booklet and between administration of the reading
and mathematics booklets. There was no break during the administration of the
mathematics'booklet since there were only 30 minutes of items. At the 13- and
17-year-old age levels, a break occurred only between reading and mathematics ad-
ministrations.
After-the preliminary-ahecks of booklets and tapes had been completed by RTI,
NAEP, and MRC staff, the 13-year-old reading and mathematics booklets were field-
tested by RTI Survey Specialists. Several students were asked to give their opin-
ions on the space for working out answers, the length of response time, the clarity
of the instructions, and the legibility of the printed material. Because ho ma or
problems were encountered, no field tests of the 9- and 17-year-old booklets and
tapes were conducted.
D. Scoring=
The Measurement Research Center was responsible for scoring the assessment
booklets. Special precautions were taken to assure that the error rate for cate7
gorization was no higher than that for the original NAEP scoring. NAEP staff
assisted RTI and MRC in setting up the scoring process; the NAEP scoring catego- es
were well-defined; and MRC staff experienced in NAEP scoring procedures scored
the Florida assessment items.
Students marked responses to both multiple choice items and to open-ended
items directly in the booklets. After the scorers marked scoring categories for
-each openendad-item in-a-student's booklet, both the multiple choice responses
and scoring categories were optically scanned, the information was placed on a
data tape, and the data tape was sent to RTI for analysis. MRC created a data
tape with one record for each student. This record included the student's
responses to each of the assessment and Student Questionnaire items, information
collected from school officials about the student's school or community, and
student identification information. The student's name did not appear on the
tape. The data tape for each age was then sent to_RTI to be merged with student
weight information in preparation for data analysis.
IV. DATA COLLECTION
A. Introduct
From August 20, 1974, to April 8,.1975, RTI Survey Specialists in thc
Survey Methodology and Operations Department (SMOD) developed methodological
materials and supervised field operations for the Florida National Assessment
Replication. They were responsible for preparation of materials used 'in brief-
ing Florida school personnel on the assessment, development of training manuals
and procedures, and receipt and final edit of data collection instrumentE7--To
insure the comparability of Florida assessment data with imational Assessment
data, SMOD duplicated, to the extent possible, NAEP administrative procedures
and conducted the assessment during the same time periods in which the National
Assessment was conducted. The basic tasks related to preliminary preparation,
training of District Coordinators, data collection, and check-in and edit pro-
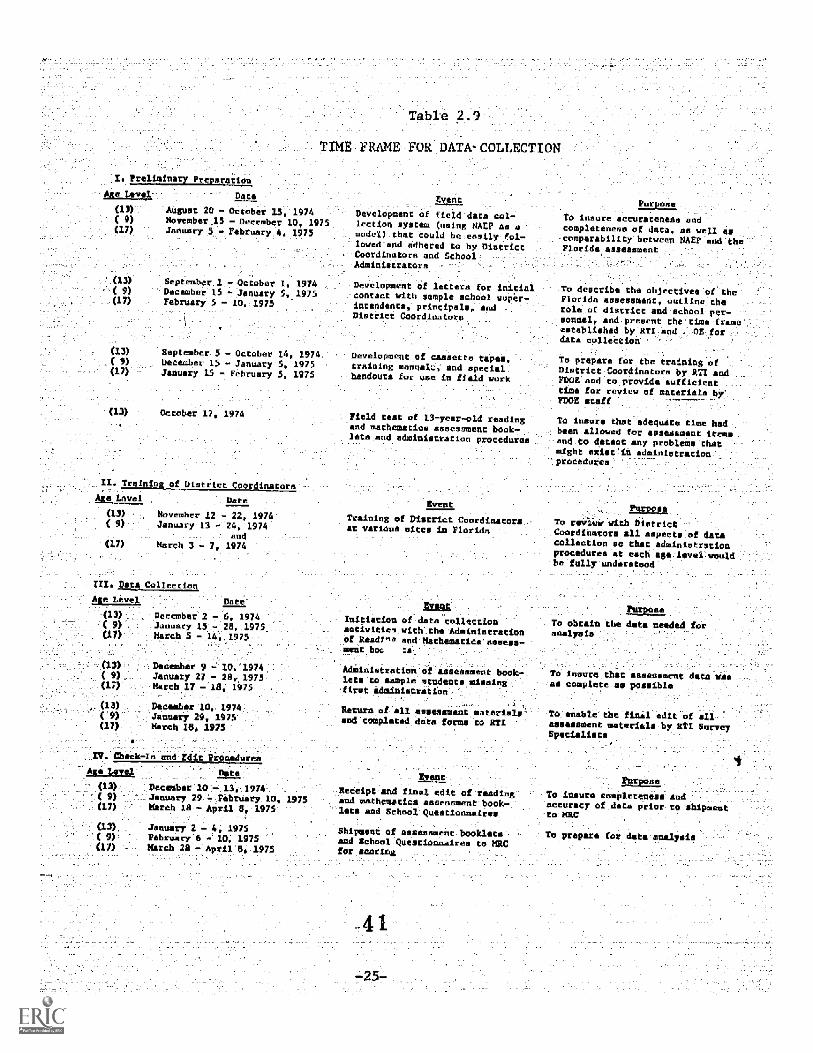
cedUres were identical for each age group. Table 2.9 presents an overview of
the time frame for these tasks and specifies within each task the dates and
purposes of each event.
Preliminary_Freparation
Between August 20, 1974, and October 17, 1974, Survey Specialists made
preparations for field data collection in the sample schools. After data
I. relisinary P_
-vi_
(13)
( 9)
Tabi 2.9
TIME FRAME FOR DATA- COLLECTION
r_ tami
SAVO
August 20 October 15, 19748oveaber_15 = December 10, 1975January = February 4, 1975
_ptember 1 - _October 1. 1914comber 15 7 January 5, 1915
(17) February:5 = 10,1975
(13)
,(-9) --(27)
September 5 = October 14, 1974December 1$ = January 5, 1975January 15 - February 5, 1975
Event
Devlopnent of field-data colection system (tieing NAEV As amodel) that Could be:easily fel=lowed and:idhered to by DistrictCoordinators and SchoolAdministrators
Development of letters for initialcontact with sample school super7intendents, prineipale. eedDistrict Coordinatora
Development of cassette tapes,training,manuaL,- and specialhandouts for um in field work
Purese
To insure accurateness andcompleteness of Jute, as well escoaparabtitry between MEP and theFlorIda asSennment
:To describe the objectives of theFlorida assessment. outline therele_of district and school per-sonnel, and present thetime frameestablished by NTT and . OS fordata collecelon
(13)Field test of 13=year=old reading:and mathematics amesement book-7lets and adminietration procedures
To prepare for the training of, :
District Coordinators by ATI +sadYDDE and to Provide sufficienttime for review of meteriala bynot mtaf
To insure that adequate time hadbeen allowed for asseement iteesand to detect any,problems thetmight Mist)-in administration7piocedures
II, !ininofDiEtctCoordiAee_Lovel Date
(13) November 12 - 22, 1974( 9) January 13 = 24.:1974
and(17) March 3 - 7, 1974
Eveut
Training of District Coordinaat various sites in Florida
PU
To revIrv with DistrictCoordinators all espects Of datacellection:so that administrationrocedures at each ageclevel:wouldbe fully underetoed
(13)c 9),(17)
, (13)( 9)(17) _
IV
Date
December 2 - 6. 1974Jaouary 15 - 28,,1975_March 5 - 14, 1975
December 9 - 10.!1974January 27 7 28r 1975March 17 = 1.1L- 1975
December 10, 1974January 29, 1975Marcia 18, 1975-
:Event
Daittatim of:datMeollectienactivities:with._tha'Admieiatrationif ReaciPle and Mathematice'asseee-sent bet-
-Administration of aaeeuascmc book-,let* to sample students missingfitet_idministritiOn
turn of:ell merement materis _
completed dite,forms to RTI
(13)( 9)
(17)
Data,
December 10:= 13.-1974January 29 =,FebrUary 10March 18,- April 8. 1975
January 2 - 4, 1975February_6 = 10,197March 28 April:8, 1975
Purport,.
To obtain the data seeded teranallets
To immure that assesmentcomplete as possible
data was
To enable tbe finsl edit of allassessment materials by WEI SurveySpecialists
Event-
8edeipt end final edit of resdieg-75 and asthmatics mem:anent book=
let and School Questionnairis:
Shipment:of sessessent:bookleteand School questionnaires to MRCfor wiring
4 1
-25-
rtMkizet
To insure ceepleteness andaccuracy of data prior: to shipsentto DU
. To prepal_ for data a
collection activities had been planned and schedules developed, SHOD mailed_ _
letters of introduction to district superintendents, District .Coordinators and
school principals of._sample schools These letters described the role of the
school and its personnel in the assessment and requested a listing of all stu-
dents eligible for the assessment in each sample school be compiled and returned
to RTI. Upon receipt of these lists, RT1 Sampling Statisticians selected the
student sample and provided SHOD with computerized listing forma_of the sample
students by sample school.'
Next in the schedule of activities was the deveropment of two manuals, one
use by RTI Survey Specialists in training District Coordinators and another
use by District Coordinators in training School Administrators These
manuals were designed to familiarize District Coordinators and School Adminis-
trators with proper administrative procedures related to activities prior to,
during, and after assessment booklet administration fest all three age levels.2
(InstructiOns specific to ,each age group supplemented,afe general instructions.
As mentioned-previously,- the majority of these procedures -were identical to-
those used by NAEP; however, others were devised specifically for the Florida
assessment.
Prior to the training of District Coordinators and School Administrators,
RT1 Survey Specialists cenducted a trial_administration of 137year7old assess-;
-Imentbooklets and:audio tapes in a Durham juniorhigh:school-toverify
that administtation procedures-were adequate_and to detect any major problems
that might exist.- Based upon the successfulresults of:this administration he
.:FDOB-approved the initiation of assessment activities:within the schools.
C. Training of District Coordinators
During November, 1974, RTI Survey Specialists with the help of FDOE person-
nel: conducted a series of training sessions for District Coordinators. The
purpose of the training was to provide District Coordinators with an overview
of assessment proceedings and a thorough understanding of data collection pro-
cedures. The District Coordinators were responsible for training persons se-_ -lected as School Administrators in sample schools. At these sessions, District
Coordinators were provided with two types of materials:
manuals for training School Administrators
4 2
-26-
reading and mathematics assessment booklets, paced cassette tapes,
pencils, and other materials needed by School Administrators to conduct
the assessment at the 13-year-old level.
Procedures to be used in training School Administrators contacting
schools and disbursing and collecting assessment materials were discussed indetail. Both the District Coordinator's Manual and the School Administrator's
Manual were reviewed with emphasis being placed on the following:
School Questionnaire: The School Aftinistrators were to be encouraged
to ask for the School Questionnaires and check for completeness prior
to leaving the schools.
Student Identification: The correct procedure for matching assessment-booklet ID numbers with student names and ID numbers on the Student
Listing Forms was demonstrated. The necessity of determining and re-cording reasons for non-participation was pointed out. District Coor-
dinators were reminded to have the list of names detached from the
mputer forms and delivered to the principal before.leaving the schoolto insure student anonymity.
Assessment Booklet Administration District Coord nators were instruc ed
in the proper techniques for introducing and distributing assessment
booklets and in methods of coping with any problems that should arise.
Proper use of cassette tapes with regard to the paced-tape administra-
tion was demonstrated. Rules were established concerning the extent to
which students could be assisted during the administration. Careful
monitoring was stressed to insure proper completion of booklets.
Editing Procedures: The necessity of an accurate preliminary edit of
ail assessment booklets and School Questionnairesiwas explained. Specif
requirements for assessment booklet edits indluded seaming each itemto check if a response was made, recording incomplete itam entries and
the reasons for incompletion on the booklet covers, and gridding data
he booklet covers from the computer listing forms.
Assessment Booklet Administration
RTI Survey Specialists did not participate in the actual asses
administration, but they did monitor the receipt of assessment materials by Dis-oordinat rs and School Administrators and the return of these materials
to RTI. A receipt return card system wasusedto make sure that the establ shed.
deadlines were met
Assessment sessions were conducted.by School Administrators.between.Novem-
ber 12, 1974 and-March 18 1975. Make-up sessions.were conducted for those
students missing the first assessment booklet administration. After the last
make-up session Srhool Administrators began the .check-in and edit of assessment
instruments.
E. -Check-4n-and'Edit-_Procedures
Oheck-4n instrdetions,were written and a system was devised:for School
Administrators to check-in, edit,,and accountJor eVery complete and incomplete
student booklet:and:School Questionnaire. Incorporated iiisthis system was a
methOdifor docuMenting:Troblems and reasons for student non-participation.
School:Administrators then sent all assessment booklets, questionnaires, tapes,
edit formsi and other materials to the District:Coordinators:vho were responsible:
for mailing them to RTI=._ At RTI survey elerks re-_-edited*ach editing proCedure',
made on assessment booklets and questionnaires by:the School Administrators'.
edit was also performed to verify Agreement between informatic&gridded in the. _
booklet covers and that on the Student listing forms. If data were found to be
missing or inaccurate (e.g., improperly gridded booklet covers) RTI staff-
contacted FDOE staff who ebtained the correct:information from the schools. As
the editing was completed for each school, a check-in sheet was entered inthe:
editor's notebook, and the booklets were shipped to MRC for scoring.
F. j'articipation Data
The original sample contained a total of::282 schools'.for all threeage
:.groups. Twenty-three of these schools (8;2%) were found to have no_eligible
students In the age group that these sehools were seleeted-,torepresent,:.and_One
sampleschool (0.4%) refused to partieipate Thea6dessmert' booklets and StUdent
Questionnaires were administered in the remaining 258 schools (91.5% of the
-Trot the7258 schools, 5227 students-were selected to participate in both
the'reading and-mathematics assessmepts --_Thetotaljnimbers who partitipated
were 4458:(85.3%) f or read*ng and 4440 (84.9%) fot Mathematies. .1Themost,e0tmon_,
eason6-fer non-participation _in both assessments were absenteeism and withdrawal
4 4
or transfer. Of the 769 reading nonparticipa (100%), 395 students (5
were absent; 21 students _(2.7%) reftsed_to participate in the atsessment; 36'
udents(4.-7%) were ineligible due=to their-dates of birth;,-226:students (29.4%)
had withdrawn-or transferred; 22 students (2.9%) had conflicting activities; 22
students (2,9%) Were non-readers; and 47-students (6.1X) 4id not particiOate for-
otherreasons Of the 786 mathematic! nonparticipants (100%)- 393 students
:(50.0%) were absent; 23 studenta-(2.9%) refUsed;-36 Students (4.6%) were ineligiTbledue to their dates of birth; 228 atndents(29.0%) had-withdrawn or-traneferred;22 students (2.8%) were 7°n-readers; and:61 students (778%)-did not:participate
for,other reasons.
Table:2.10 presents the participation date for sample schools by age group
and for sethple students by:age group and subject ar a.
SUMHAAY OF DATA A_
The major purpose of his report is to describe the rending and mathematics
performance of Florida 9-, 13-, and 17-year-old students. National Assessmentreading and methematies items selected for their relevance toFlorida's educaonal objectiveS, were:administered to probabilitysampl f -Florida students_
-at each of the three age leyela,-utilizing procedures:to assure basic compare-jality with NAEF reaults.
This rep-art points out differences in readingend mathematics performance,
between Florida's students, the nation's students,-and the Scititheestia=studeritsi:
it also points out differences in performance between Subgroups of FlOrida
students:and corresponding subgroups _of the nation's students,7categoriped by -
and size-awl-type of commtinity.,
addition, the appendices of this report present the results for the differtneek
-between these same groups when the distribUtidne-of'some otherrelevant varia-_
:blea-are statistically adjusted so that their distributions are the same for:thegroups. These adjusted, or balanced, results are presented to 'assist in explainirig
theldifferences_that are observed, ,This repert also presents:reading and mathe.--
sex, race, leyel_of parental education,
..matics performance differences between Florida students,' categorized by,sex,= _ _
race, level of parental educatiOn, size and:type of,Community, reading meter alsavailable in the home, and Spanish as a native language.
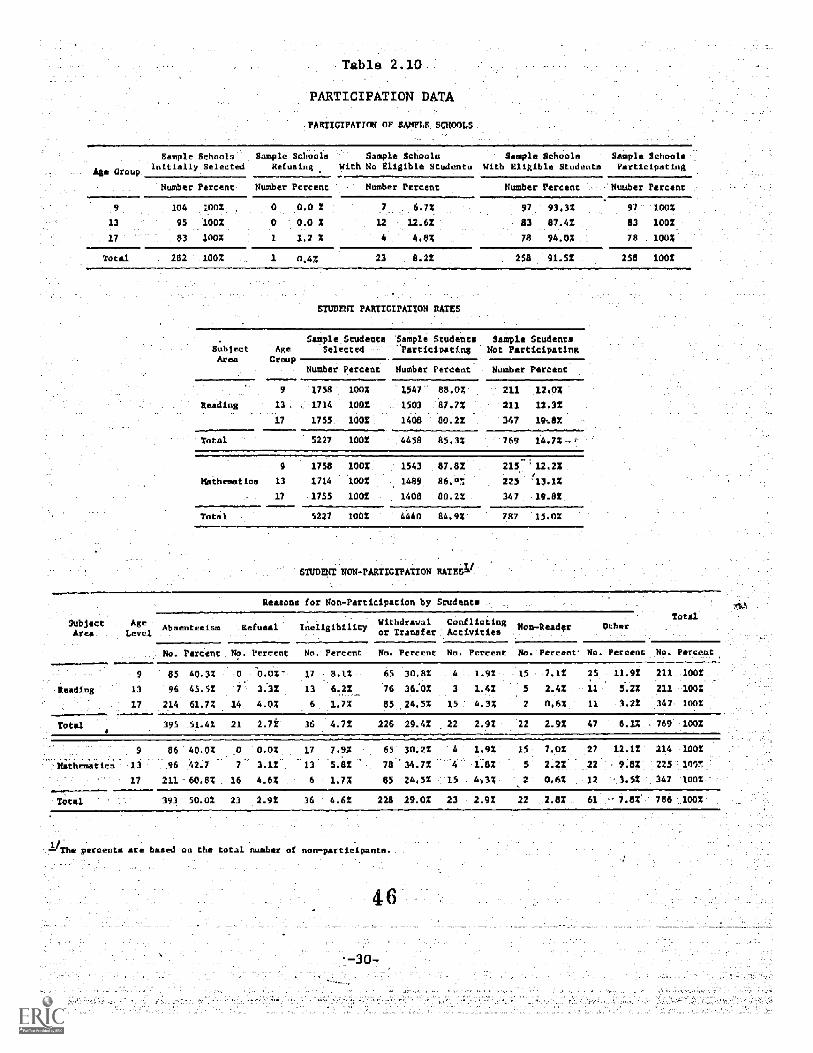
Table 2.10
PARTICIPATION DATA
:PARTICIPATION OF SAME, S040014
Semple Schools Sample Schools : Sample Schools Sample Schools - Sample Schools
Age CroupInitially Selected Refueling With No Eligible Students With Eligible Student Participating
Number Percent Number Percent Number Percent Number Percent Percent- .
104 1002 0.0 2 7 6.7% 97 93.32
13 95 1002 0 0.0 X 12 12.61 87.42:
17 83_ 100% 4 4.82 78 94.02
Total 252 1001 1 0.42 23 8.22 258 91.5%
STUDENT PARTICIPATION RATES
SubjectArea
AgeGroup
Sample_StudenteSelected
-Sample StudentsParticipating
Sample StudentsNot Participating
Number Percent Number Percent" Number Percent':
1758 1002 -1547 88.02 .-: 211 12.02
n 1714 1002 1503 87.72 211 12.3%
17 :1755 1001 1408 80.22 347 1942
Total 5227 100Z- :4458 85.32 ' 769 14.72-i-
2758 1002 1543 215 12.21
Mathematics 13 1714 1002 8a.9/ 225
17 1755 1002 1408 80.22 347 19.82
Total 5227 1002 4440 84.92 787 OZ
-PARTICIPATION RATES1/ =
97 1002
83 1002
78 100%
258 1002
Reasona for Non-Participation by Student's-
SubjectAres
A"Level
-Absenteeism -Refusal Ineligibilityithdraval. Conflictin
or Transfer: Activitiesn-Reader
No. Percent No. Percent No. Percent Nes Percent No. Percent No. Percent*
40.31 0 0.02- 17 8.12 65 30.82 4 1.92 15 7.12
n 13 96 45.52 7 3.32 13 6.22,
76 36.02 3 1.42 2.42
17 214 61.72 14 4.02 6 1.72 85 24.5% 15 4.32 0.62
Total 395 51.42 21 2.72 36 4.72 226 29.42 22 2.92 22 2.92
86 40.02 0 0.02 17 7.9% 6 30.21 4 1.9 5 7,02
+teatic a 96 42.7 7 3.12 5.8% 78 34.72 -4 2.22
17 211 60.82 16 4.62 1.72 85 24.32 -15 , ' 2 0.62
Total 393 50.02 23 2.92 36 4.62 228 29.02 23 2.91 22 2.82
:--Tte percents are based o he total number of nonparticipan
4 6
-30-
Total
No. Percent No.
25 11.92 211 1002
11: 5.22 211 1002,
11 3.21 347, 1002
47 6. 769 1002
27 12.12 214 -1002
22 9.82-_ ":225 100!
12 3.52 347_ 1002 --
61 7.82 786 1002
Thedifferences presented in this report are-those which-are sta istically
significant at the .05vlevel. 'This:means-that-.-a sample difference of thie
magnitude can be expected tooccur in repeated samplings only five tiies in a
hundred if the actual difference is zero.,- While these resUlts'very likely
reflect actual performance differences between groups, they provideno informa-
tion about the causes of these differences For example, it may be that stu-,
dents who live-in large communities perform'above-the:atateperfOrmanceievel,
but this does not necessarily mean that living in large communities causes
higher performance. The reader is further cautioned not to'equate'statistital
-,significanceand practical importance. Just'as educatorsand the layiniblic'
must establish acceptable levels ofi:performance for_the state as a,whole they
must also determine which'of these statistically significant differences,have-
educational or social:significance. :el-critical-problems are identified,
'further research and thought will be eeeded to eXplore causalityand to:deter7
mine policies and patterns of_resource allocation necessary to resolve these
problems.
The FDOE has taken initial steps to help insure that the assessment results:
and reports provide information which=can be iaterpreted and utilized by Florida
:educators and the lay public. Interpretive:writers, who arn-bothskilled in the,-,
reading and mathematics subject_areas and attuned,to the objectivennnd-proce
dures of-.Floridi education, will interpret,the assessment*results presented in'
this report. This report'and the interpretivereport will be available,for
further analysig and interpretation by those interested it:determining needs%'-
A-Improving:instruction in'.-readiug-and mathematics.
47
The Relationship Between Reporting,Variables and the Performance
of 9- 137; and 17?lear-Olda:in Readin-'and MatheMatics
NTRODUCTION
enrassessment dataon student read ng end'alathematies.performance-yere
collected in Florida, supplemental-information about sample students and the
schools they attended was also obtained. Each participating:sample -tudent
-completed a questionnaire concerning his seX, the educatienal levels of his
parents,'and the availability of various reading:materials in the home In
addition, echool officials obtained race and native language data for each
student. In each participating sample school, the principal complete&a ques-
tionnaire providing information on the sizeand type -f community in which
the -sample school was located.
This information was used to form the six reporting variables by which
results are presented for the within FlorIda analysis of reading and mathe-
atics performance da a: Sex, Race, Size and Type of Community, Parents'
Education, Reading Materials in Home, and Spanish as a Native Language. For
the purpose of reporting results, these variables were classified into sub-
categories which are called reporting groups. For instance, Sex is a report-
ing variable which is divided into two reporting groups, males and females.
For the Florida National Assessment Replication, Sex, Race, Size and Type of
Community, and Parents' Education were selected and defined according to Na-
tional Assessment specifications so that Florida results could be compared
h national results. National Assessment did not report Reading Materials
in the Home or Spanish as a Native Language; therefore, these reporting vari-
ables were defined according to FDOE specifications. Appendix A-1 of this
report contains the definitions of all reporting variables and reporting
groups used in the presentation of the within Florida results.
This chapter compares reading and mathematics performance between stu-
dents classified by reporting groups and students in-the state as a whole.
Tha.results-are--discussed.in terms- of statistically-_ignificant group effects-
-occurring-in itemAggregates (clusters _f-items) that have been_defined for'
-eachAubject.areajateach of the-three age -levels./ A group effect:was-cal-
culated for-each reporting 'group- hy subtracting. .the average-Cluster percent
.Correct of the state from that.of the.reporting.group. An effect, or.differ7
ence, was-labeleklstatistically significant.;(at:the .05..Jevel of conffdence)-
if -it .WasAt.-least twice as large as its associated!Standard---eiror*.,. In-the.---
tables for this chapter,2/--statistical significance-1s denoted by an--aateriSk:
to-the right of the effect,-or*fference..- Thus- a-negative.groupreffect
wjth an aSteriskindicaii6-6a.-ihe performance of.students'in'the partfcular
_reporting group:was-significantly. below the Florida average,cluster percent.
correct,-7 while-a positive group effect with an asterisk iindicates.-that the
performance-of-students.in the-particular reporting group was significantly
above the Florida-performance level.-
Some-rather-large- effects are- sometimes not statistically significant,
while_some rather:amall effects are in_some -instances statistically signifi-
cant.-- This-is due to the-fact that statistical signi icance is'determined
-_,by -the ratio oUths.effect.to:its-standard error. -In:general, ftems thatAre-
based npon.large samples.have smaller standard errors.. _These-item s andard-. .
errors are used to-calculate standard errors for-the-Average percents of-ftems..
answered correctly. If a standard error associated with
large, even a large effect may not be statistically sign ficant. On the oth _
hand, if a standard error of an effect is very small a small ef ect may be
statistically signi icant.
an effect is very
listing'of the items contained in.eachireading--cluater:can be fonnd for:.each age level in:Appendiees D-4,:and F-4. Ailisting of.the Items classi
each-.mathematies cluater canhe found for each age level in Appendices:C-4, G-4., Clusters for each:subject area'were defined on thej)asisofthe National Assessment reading themes and mathematics content areas, Thereading themes and Content-areas are listed in Chapter 2 of this report., -
27The reading cluster results in these tables are from data in detached
ancLF74. The-Mathematics cluster results in these tables _
are from data in:detadhed Appendices C-4, E4, and G-4.
-7 Throughout:the chapter, the-Jollowing terms are used interchangeably foraverage cluster:state percent correct:: state average percent correct,1 stateperformance.level, and performance of students in the State.
General cautions to be exercised in the interpretation of results have_ .
been previously mentioned in the data analysis section of Chapter 2; however,
it is essential that reader be aware of cautions specifically related to
the results presented tn.this chapter. Item clusters containing less than
three items do not usually provide a sufficient measure of performance for_
that Cluster; therefore, statistical significance on a reporting group for
such a cluster may be misleading and merits cautious interpretation.21 Stu-
dent performance on-the item clusters presented in this chapter should not
be compared across age levels. Although the majority of the item clusters
exist for the same reading themes and mathematics content areas at each age
leveL the items contained in these aggregates are not generally the same
across age levels. Chapter 4 will discuss differences in reporting group
performance across age levels onitem clusters composed of the came items.
In sections II through VII of this chapter, the relationsh ps between
each reporting variable and the performance of Florida students on item clus-
ters in reading and mathematics at all three age levels are discussed. Sec-
tion VIII presents a summary of these results across reporting variables.
THE RELATIONSHIP BETWEEN SEX AND THE .PERYOLMANCE OF
_3, AND 17.-YEAT.OLDS IN READING AND MATHEMATICS
The variable Sex has two reporting groups males and-_females.: The nec-
essary:information was provided by the student and verified by the School
AdminiStrators.
The Relatiai
in Reading
-=-Table 3..1 presents the group effects (difference ) by age level for the
Sex reporting groups in the subject area'of reading.
Between Sex and the Pe:
In the subsequent sections,
In the tables in this chapier,_the numbe of -items for each read ng thand mathematics content arealx provided.
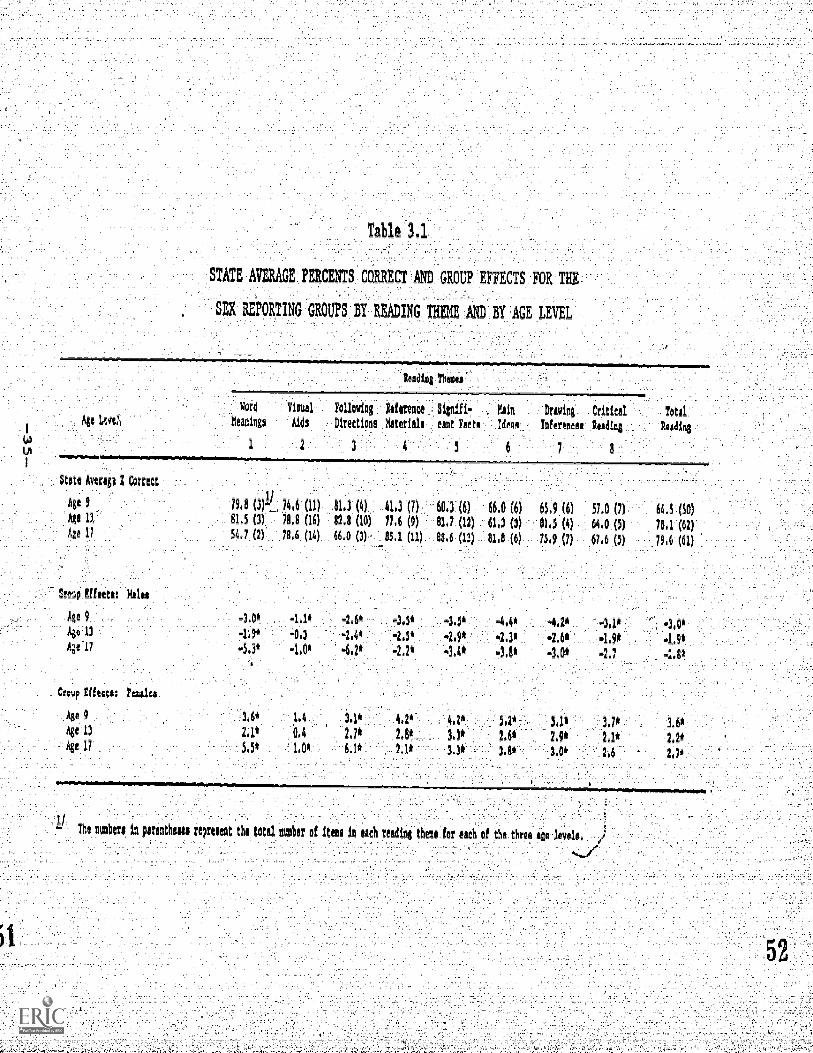
Table 3.1
TATE AVERAGE PERCENTS CORRECT AND GROUP EFFECTS FOR THI
SEX REPORTING GROUPS BY READING THEE ANT BY
1.1E1E,
Age L.,,ve.
Vord
, Meanings
1
Aida
leadiebemee
Mittel Memo S6gnifi7 mein Drawing, . Critical 20te1
:drat' Inferencee leading 1141014lirections &Wale cant'Fects
Rate Averts
Age 9
Age 1).
ke 11
ps.g (3)-1 pcg (11) 81.3 (4) 41.3 (7) 60.3 (6) 66.0 (6) 65.9 (6) 51.0 (7) 64.5 (30)81.5 (3) 78,8 (16) 82.8 (10) 77.6 (9) 81.7 (12) 61,3 (3) 81.5 (4) 64.0 (5) 79.1 (62)
54.7 (7) 78,6 (14) 66.0 (3) 85.1 (11) 89.6 (11) 81,8 (6) 75.9 (7) 67.6 (5) 79.6 (61)
Effectt: Males
Aga 9
Aae 11
Aze 17
3.6* 1.4
2.1' 0,4
5.5' 1.0*
-2.6* -4.2*
-2.4 -2,5" -2.9* =2.6* .1,9* .t.ge
-6.2' -2,2' -3.4* =3.5* -3.0* EL) -1.8*
3.1* 4.2" 4.2' 5.2" 5.1' 3.7* 3.6*
2.7* 2.81 3.5' 2.6' 2.9* 2,1* 2,2'
6.1' 2.1' 3.3* 3.8" 3.0* 2.6 2.7'
ii
.'1The outliers in menthols represent tho Mal number of Items In each reading thezi for each of the three ago Isola.
tudent performance on the eight reading themes will be discussed by age
level and within each age level by males and females.
1. The Relationshi Between Sex and the Performance of 9-Year--Olds
in Reading
udents performed significantly-below _he state
performance levels on ev ry reading theme and on total reading. Nine-
year-old female students significantly outperformed-students in the
state on total reading and on all themes except Theme 2 (asual Aids).
Nine-year-old male-
The Relationship Between:Sex and the;Performance of 13-Year-Olds-
in-Reading
On total reading and -oh every theme e cept Theme:Visuai
13-year-old male students scored significantly below students -Inthei,:--
state-_while 137yearold female students scored significantly above stu-
dents in the:atate. The differences in theiseven themes, although statis-
-ically:significant, Were generally notvery large in magnitude for either
reporting group.
The Relationshve Between Sex and the Performance of 17-YearOlds
in Reading
On total reading and on every theme.except Theme 8_(Critical Read-
ing), 17-year-old male students performed significantly below state per-
formance levels, while 17-year-old female students performed significantly
:above state performance levels. The differences-within each of the eight
themea,for.males and-lemalea were almost identical in Magnitude...,
Sex and Readin Performance
The'relationship betweenSex and the reading performance-of 9-,
and 17-year-.Olds Was qUite similar for each of_the reporting groupa.
'Atross'all three age levels in total reading, male studentelperformed-
signific,tlyibelow-the state performancejevel-,- and female 'students
performed significantly above the -state performance: level;
WeltelationshiP Between Sex and the Performance o_ 9-, 13-,,armk
17-Year-Olds, ir Nathemat
-Table 3.2 presents the-group effects (differences) by age level for the
Sex reporting groups in the subject area of mathematics. In the subsequent
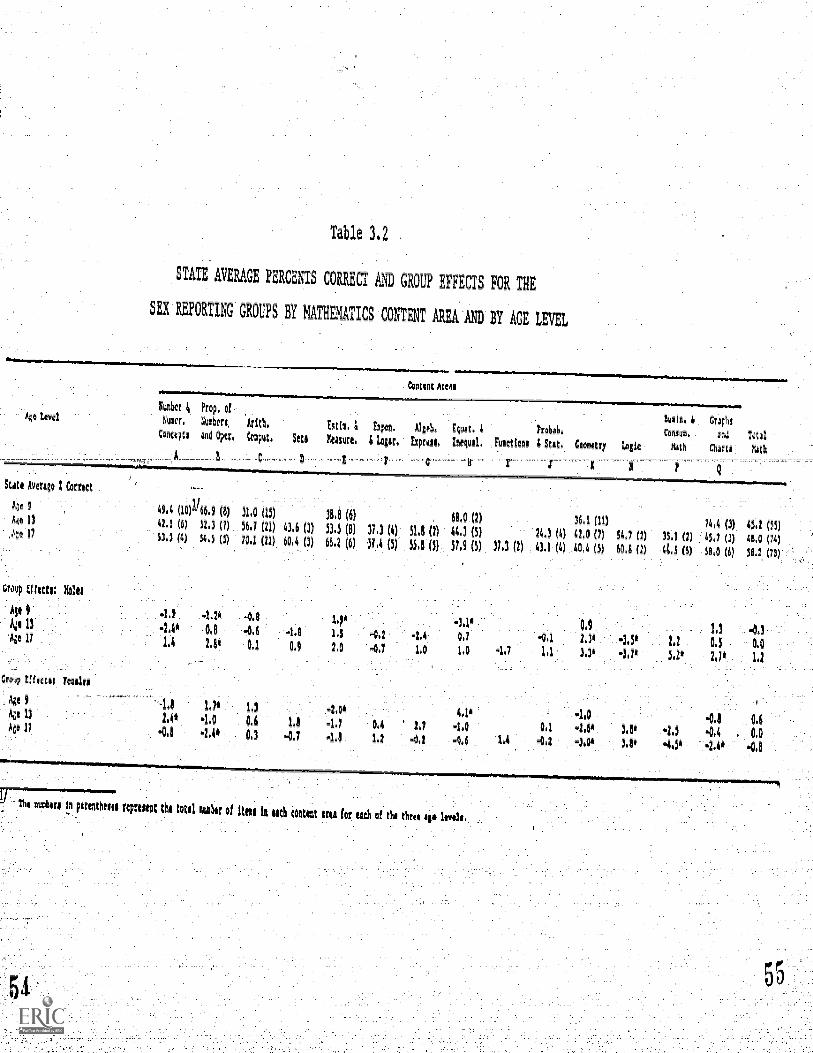
Table 3.2
STATE AVERAGE PERCENTS CORRECT AND GROUT EFFECTS FOR THE
SEX REPORTING GROUPS BY MATHEMATICS CONTENT AREA AND BY ACE LEVEL
Ste* Avow I
47,r
144o 13
17
rut
Group EMU!: lio161
Ale 9
1,48 13
Aze 17
40.* E1ftem Tttu
4e 0itzt
Age 11
806of fi flop, ofNoel., ;Nom. him
Coropti and Om, Cox.
--
2,40
.0,8
Soto
D
Nit 4 Eapen. Alpb, tot. 4 7rOott.Mame. & Lolor. hprell! Intql1111. runctIOni I Rot. Cowry Icgie
hthl. CiatIllCanso. 2rid Nut
Kith Clam Xsth
66.9
52,3
340
(8).
(1)
(5)
31.0
56,1
l0,2
(15)
(21) 43,6 (3)
(21). 6fm (3)53,
66.
(0(8)
(6)
37.3
37.4
(4)
(5)
1,8
65,8
(1)
(5)
48.0 (I)
44.3 (5)52.5 (5) 37, (2)
24.3
43.1
(4)
(4)
36,1
42,0
40.4
(I1)(7)
(5)
54.7 (2)
60.8 (I) 4
74.4
45.7
54,0
(3)
(3)
(6)
65.2
48,0
581 3
4.14 4.8 lite 3.14 0.9 1,3 4.308 -0.6 4.8 1.5 4,2 -2,4 0,7 4.1 2.34 -3,54 22 0.5 MO2.84 01 0.9 2.0 4.7 1.0 1,0 -1 LI 3.30 4.74 5.2° 1.2
.,17* '"- li.4010 ...1.0
. 4.8 : 0.64.0 0.6 1,8 .1,7 0. 2.7 -1.0 MI .2,P. 3.84 ...2,5 4.4 MO.2.4* 0.3 -0.7 .4.8 12 .0,2.. 4.2 3,0k 3.8* 4.34 8
OThri In pomthoolo reptininnal. fotol, ni o1 1toi in nth maim am for loth of t throl qi 1r4.14.
sections, student performance on the relevant mathematics content areas will
be discussed by age level and within each age level by males and females.
1. The Relationshi Between Sex and the Performance of 9-Year-01ds_in
Xathematics
Nine-year-old male and female students performed near state perform-
ance levels en the seven content areas assessed and on total mathematics;
however, significant differences did occur in three of the seven content
areas for both males and females. Male students scored significantly be-
low the state average percents correct on the same two content areas (Pro-1
perties of Numbers aad Equations)- on which female students performed
--aignifitattIy-abOVe-. On --the other content-drea--(EstiMatiermale-students-
performed significantly above the state performance level while female
students performed below.
2. The Relationship Between Sex and the Performance of 13-Year-Olde:
"in Mathematics
At the 13-yeat-old level the results for males and females were simi-
lar to those observed at the 9-year7old level. Beth 13-year7old male and
female students performed near state performance levels, although Signif-
icant differences did occur in three of the 13 content Areas for both-male
and female students. Male students performed significantly below the state
average percents correct on the two content areas (Number Concepts and2 ---
Logic) on which female students performed significantly above. On the
other content area (Geometry), male students scored significantly above
the state performance level and female students scored below.
3. The_Relationshi Between_Sex and the Performance of.17-Year Olds
'in Mathethatics
The performance pattern at the 17-yearold level was consistent with
that at the 9- and 13-year-old levels. Both males and,females performed
near state performance levels. Differences which occurred in five content
Note that Content _-ea H (Equa: ons ) centains only _ o items at the- 9-year-old level.
2, Note that Content Area N (Log conta ns only two i-ms at the 13-year-old level.
-38-
areas were significant for both groups of students and had similar magni-
tudes. Male students performed sigrtificaritly above the state performance
levels on four of these content areas (Properties of Numbers, Geometry,
Consumer Math, and Graphs) and below on one (Logic).-1/ Female students
performed significantly below the state per ormance levels on the same
four content areas and above on the other.
4. Summar Sex and Mathematics Performance
in general, male and female students at each age level performed
near performance levels for all students in the state; however, at each
age level significant differences Occurred in A few content areas across
the two reporting groups._. _
III. THE RELATIONSHIP BETWEEN RAGi AND THE PERFORMANCE OF
9-, 13-, AND 17-YEAR-OLDS IN READING AND MATHEMATICS
The information for the two reporting groups of the variable Race-Black
and non-black--was provided for each sample stddent by school officials.
TeRelati4p Between Race and the Performance o_ _ - and
17-Year-Olds in= Readin-
Table 3.3 presents the group ef eets (differences) by age level for :the
Race reporting groups in the subject area of reading. In the subsequent sec-
tions, student performance on the eight reading themes will be discussed by
:age level and within each age level by Black and non-black.
1. The Relationsh Between Race and the Performance of 9-Year-0 ds
in Reading
A strong relationship existed between Race and the reading perforM7
ance of 9-year-olds. Black students performed significantiy below the
state average percents correct on the:eight reading thethes and on total
reading. Non-black students performed significantly above the state aver-
age percents correct on these same clusters
Nate that Content Area N .ogic) Contains only twoold .
57
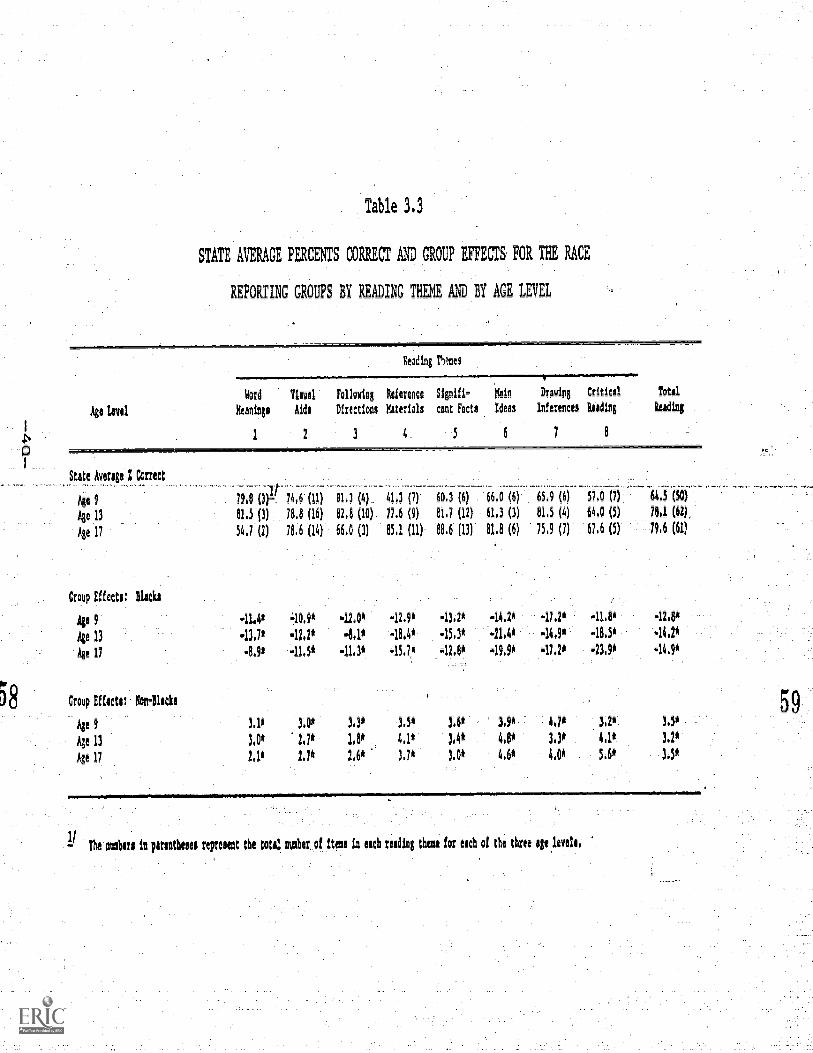
Table 3.3
STATE AVERAGE PERCENTS CORRECT AND GROUP EFFECTS FOR THE RACE
REPORTING GROUPS BY RIADING THEME AND BY AGE LEVEL
Rod ing NH§
Word 91aua1 following Reference Signifi- tfaia Diving critical Total
Aga tail Keaningo Aida DirectIone &tends ant Fact* Mu Inferences Reedits biding
1 2 3 4 . 5 6 7
State Ames Caren
he 9
Ase 11
he 17
Croup Effects: Ude
79,8 (3)- 74,6 (11) 81.3 (4) 41.3 (7) 50,3 (6) 56.0 (6) 65,9 (6) 57,0 (7) 643 (50)
81,5 (3) 78,8 (16) 82,8 (10), 77,6 (9) 81,7 (12) 61,3 (3) 81,5 (4) 644 (5) 70,1 (62),
54,7 (1) 78.6 (14) 66.0 (3) 85.1 (11) 68.6 (13) 81.8 (6) 75,9 (7) 67.6 (5) 79.6 (61)
AP 941.4* 10,9* -12,0* -12,9* -13.2* -14.2* -17.1* 41.8* 42.8*
Age 13 .13.7* .12.1* .8.10 -18.41 45.3* -21,0 -14.9* -18,5* -14,21
he 17 -9.9* -11.5* -11,3* -15,7* -12.8' 49,9* .17.2* .23.9* 44.9*
Croup Effects: flodllacks
4e 9. 3.1 3.0* 3.3* 3.8* 3.6* IP 4,10 3,2e 3.5*
Age 13 3.0* 1.7* 1.8* 4,1* 3.4* 4.8* 3.3* 4.1* 3,2*
Age 17 2.11 2.7* 2.6* 3.7* 3,0* 4.6* 4.0* 5.6* 3,5*
1/- The ohm Si madam repreleet the total amber of !tau la each reading that for ach of the three 0 levels.
The Relationshi. Be ween Race and the lie _ormance of 13Year-Olds
in Reading
There WRS also a strong relationship between Race and the reading
performance of 13-year-olds. As in the case of 9-year-old performance,
Black students performed significantly below and non-black students sig-
nificantly above the performance level of 13-year-olds in the state OA
the eight reading themes and on total reading.
3. The Relationshi _Between Race_and the Performance_of_17-Year7Olds
in Read inz.
The performance pattern which emerged in the Race results at the 17-
-year-old level-was-consis enr-with-that-Ohich emerged:in-the-Race-results
at both the 9- and 13-year-old levels: 17-year-old Black students scored
significantly below and 177year7old non7black students scored significantly
above the state average percents correct on all reading themes and on total
reading. Both negative and positive differences tended to become larger in
magnitude in the progression from low to high order reading skills. The
negative difference in the high order skill Critical Reading (Theme 8) was
substantially larger in maguitude,than any of the other differences from
the state average for 17-year-old Black students.
4. Suthmary and Re ad ing Performance
The performance of each age group was similar across the two reporting
groups of the variable Race. Nine-, thirteen-, and seventeen-year-old
students classified AS Black scored significantly and substantially below
the state average percents correct on the eight themes and on total reading,
while those classified as non-black_scored significantly above the state
average percenta correcton these same aggregates.
The Relationshi Between Race and the Performance of 9- 13- and
17-Year-Olds in Mathematics
Table 3.4 presents the group effects (differences) by age level for the
Race reporting groups in the subject area of mathematics. In the subsequent
sections student performance on relevant mathematics content areas will be dis-
cussed by age level and within each age level by Black and non-iblack.
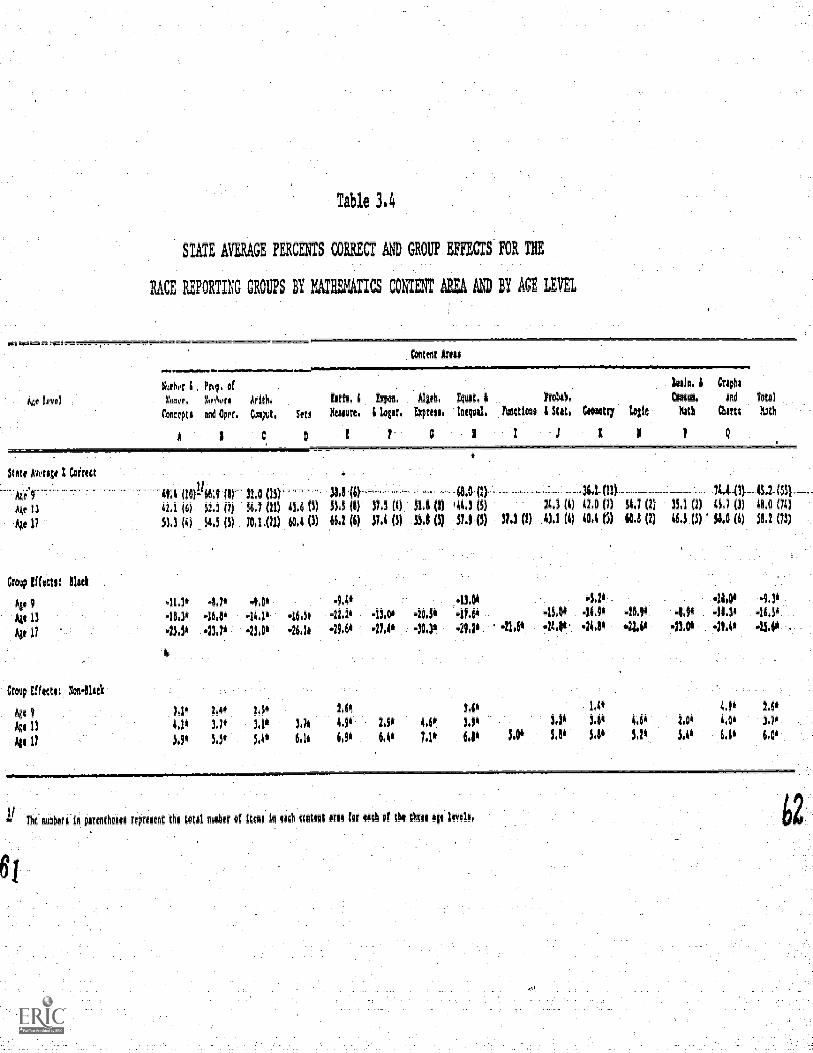
Table 3.4
STATE AVEIAGE PERCENTS CORRECT AND GROUP EFFECTS FOR THE
RACE REPORTING GROUPS BY MATHEVITICS CONTENT ARE& AND BY AGE LEVEL
V
Wen Artie
MIAMIL.h4.0f
Mmd. MmNott
rtmetgi. 0040m.
A
state Paso Direct
kith.CAM.
!uf.4 xpin1 Mob, Wt. I 110W CUMMute. A140. tepee% luiquil ,Attelene SIC Imetry Wei Nth
I ?
Mph;end Ints1
ChM& Nth
dAe 13
AAe 17
Crp /1.0cret Bluk
414 9
Miii
414 17
:Croup /Mete
Azt 9 .
.. Ago 13
1.14 17
493116)-(6)..
53,3.(4)
41.I,-19,34
-13,3,
LPCIA
).
66:9'01Y-'31.0.51.3471 36,7121)
54,3.(3) 30,1 (2i)
47* -CO,-pa+
-13.7' 43.01
L4'
3.7* 3,12
5,4+
43,4 (1)
60,4 (3)
46.54
44.1+
3.24
644
53.5 (9)
46.1 (6)
-5.41
42.2+
-29.6'
2,P4.9+
6.9,
374 (1): 51.9 (2)37.4 (5) DJ (5)
-13.0 40.54
-17,10 -30.5"
2.50 4.46
LP 7,16
'44.3 (5)
. 313.(5)
43.06
47.6,-29.2,
3.1,
3.9,
6.4,
37J (I)
1#64.
3.0,
24.3 (1) 42.0 (7) 54.1 (2)
.43.1 (4) ALI (5) 40,8 (2)
.
.15.66 . 44.9, 40.96..24.1,
3.3 3.P 4.64
3.4, 3.20
35.1 (1 )
46,9.0)
49, .
43.06
1.0,
5.4,
45.1 (3).
31.0 (4)
.1110
41.3,49.4*
4.9+
4,0*
LI,
410 (A)
51,2,(3)
44,5,....
1.5,
3,70
6.0,
TAIG116...-
- The 4444f$ 14 frentheill WtOt4t tht tAtA1 Ante At it p ii 06 gam iril for 06.42 114,thrii.4p 1m%
1. The Relationshi. Between Race_and The Pe- 9-Year-Olds
in_Mathematies
At the 9-year-old level a strong relationship existed between Race
and mathematics'performance. Black students scored significantly lower
than students in the state on all seven of the content areas assessed
and on total mathematics. A markedly large difference in magnitude oc-
curred in Content Area Q (Graphs). Non-black students performed signif-
icantly above the state average percents correct on all content areas
and on total mathematics.
2. The Relationshi- Betweel _Race and the Performance of 13-Year7Olds
CS
As indicated by the reThtive magn tudes of the differences on total
mathematics, the relationship between Race and mathematics performance
at age 13 tended to be stronger than at age 9. Black 13-year-old stu-
dents performed significantly and substantially below the state average
percents correct on all 13 of the content areas assessed and on total
mathematics. Thirteen-year-old non-black students significantly outper-
formed students in the state on all of these same item clusters.
3. The Relationshi etween Race and the Performance of 17-Yea
in Mathematics
The relationship between Race and mathematics performance appeared
to be even stronger at the 17-year-old level than at the 13-year-old
level. On all 14 content areas assessed and on total mathematics, the
differences not only were significantly below the state performance
levels for 17-year-old Black students and significantly above for 17-
year-old non-black students, but also, as signified in total mathemat
were larger in magnitude than those at the 13-year-old level.
Olds
4. Su Race and Mathematics Performance
The relationship between Race and mathematics performance was
strong at all age levels and appeared to increase in strength with__-
increasing .age. BlaCk students at eacb agFievel perfermed signifi-
cantly and substantially belOW tuden the state on all content
6
areas assessed and on total mathematics, while non-black students at each
age level performed significantly above students in the state on all con-
tent areas assessed and on total mathematics.
IV. THE RELATIONSHIP BETWEEN SIZE AND TYPE OF COHNUNITY
AND THE PEUORMANCE OF 9-, 13-, AND 17-YEAR-OLDS
-IN READING AND MATHEMATICS
The reporting group of the Size and Type of Community variable for each
9-, 13-, and 17-year-old was determined using the principal's report of the
percentages of enrolled students living in areas with certain population sizes
and-the percentages.of enrolled-students-having-parenta in-certain-occupa-
tional categoriea. These two percentages were combined for each school through
the use of a computerized pooling technique to create categories comparable
to those reported by National Assessment.. On the basis of this pooling, each
sample school was classified into one of three reporting groups-large city,
urban fringe and medium-city, or rural. Then each sample student attending
the school was assigned that classification. A general description of each
reporting group fol1ows:-1/
1) Large city refers to a city area with a population of 200,000 or
more, with a high proportion of adults not regularly employed or
on welfare, and with a low proportion of adulta employed in pro-
fessional or managerial positions.
Urban fringe and medium city refers to a hin-city or near-city
area with a population of 25,000 or more, with a high proportion
of adults employed in professional and managerial positions, and
with a low proportion of adults employed in factories and in agri-
culture
Rural refers to a rural area with a populat on if less than 25,000,
with a high proportion of adUlts employed in factories and in egri-
culture, and with a low proportion of adults employed in professional
-and managerial positibns.
The definitipns for the three reporting groups aretailed definitions p esented in Appendix A-1.
6 4
of the moreAe-
The Ilelationshipfletween Size and _!_m_a_Lsp_m_li_Eql
of 9- 13- and 17-Year-01ds in Readin
Table 3.5 presents the group effects by age level for the Size and
Type of Cammunity reporting groups in the subject area of reading. In the
subsequent sections the student performance on the eight reading themes
will be discussed by age level and within each level by large city, urban
fringe and medium city, and rural.
1. IheRelatimshi_and the Per-
ormance of 9-Year-Olds in Reading_
-year-olds attending large city schools performed significantly
below the state performance levels on total reading as well as on five of
the eight reading themes (Visual Aids, Reference Materials, Significant
Facts, Main Ideas, and Critical Reading). Those students attending urban
fringe and medium city schools performed significantly above state perform-
ance levels on five reading themes (Visual Aids, Following Directions,
Main Ideas, Drawing Inferences, and Critical Rehding) and on total read-
ing. Nine-year-olds attending rural schools performed near state perform-
ance levels on total reading and all reading themes.
2. The Relationship Between Size and Type of Community and the Per-.formance of 13-Year-Olds in Readin
The relationship between Size and Type of Community and 13-year-old
reading performance was quite similar to that at the 9-year-old level.
Thirteen-year-olds attending large city schools performed significantly'
below the state performance levels on total reading and on all o f the
reading themes except Theme 7 (Drawing Inferences).
Those students attending urban fringe and medium city schools per-
formed significantly above students in the state on total reading as
well as on all of the reading themes except Theme 1 (Word Meanings).
In general, the positive differences for this group of students were
smaller in magnitude than the negative differences for the large city
group. Those students attending rural schools performed near state
averages, performing significantly below the state performance level
only on Theme 8 (Critical Reading).
6 5
-45--
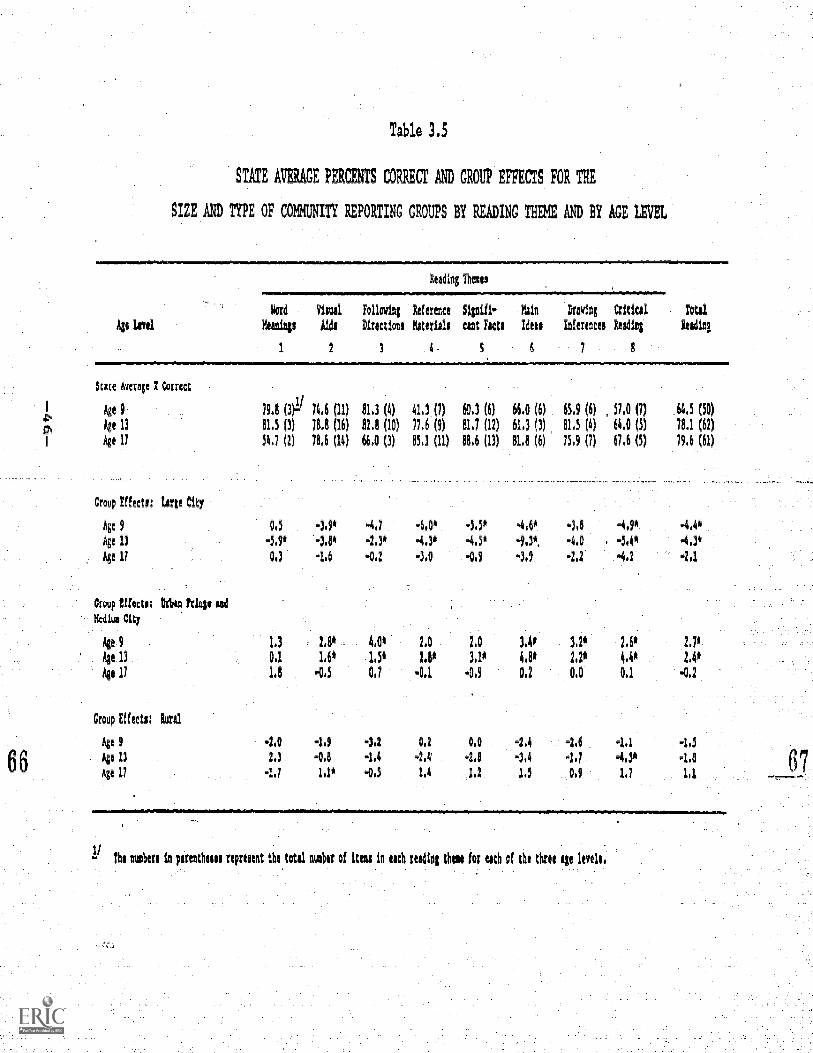
Table 3.5
STATE AVERAGE PERCENTS COURT AND GROUP EFFECTS FOR THE
S ZE AND TYPE OF COMUNITY REPORTING GROUPS BY READING THEME AND BY AGE LEVEL
kge keel
Reading Them
1
91Au Al
&inFollowing Meitner! Sigoifi- Kiln Droving
Inferencee lading WingDiretiiens Korn cat Iwo Idets
2 ) 4- 5 6 7 8
State Average I Correct
Age 9
Alt 13
Age 17
79.1
11.5
54.7
-11(3)
(3)
(2)
75.6
711.1
78.5
(11)
(16)
(14)
81.3 (4)
ILI (10)
66,0 (3)
41,3
77.6
85.1
(1)
(9)
(11)
60.3
11.7
18,6
(6)
(12)
(13)
66,0
61.3
81,8
(6)
(3)
(6)
65,9
11,5
75,9
(6)
(4)
(7)
, 57.0
64.0
57.5
(1)
(5)
(5)
64,5
78.1
79.6
(50)
(62)
(51)
66
Group Effecta: Inge City
Age 9 0,5 -3.9' -4,7 . -6,0' . -5.5' -44" . .-3.8 -4.4'
Age 13 5.9* '-1.1' -2.3* -4.30 -4,50 4.3*, -4.0 *5,4* -4,3*
AAe 17 0,3 41,6 412 -3,0 -0.9 -3,9 -2.2 .041. -2,1
Croup Mast kW Magi led
Nies City
Age.9 1.3 2.8* CO* LO LO 3.4' 31* 2,60 2.70
Age.13 01 14' 1.51 2A* 31* 481 21' 4.4' 2.4*
Ale 17 1.5 oa =oil 4.9 0.2 10 11 4.2
Creep Effeeic Rural
Aie 9 -2.0 -1,9 -3.2 0.2 0.0 -2.4 -2.6 -1.1 -14
Age 13 2.3 -0.1 -1.4 -2.4 -2.1 -3.4 -1.7 .4.3' -1.8
Age 17 -1.7 1.1* -0.5 1.4 1.2 1.5 0.9 1,7 1.1
The numbere in perentbesse present he totil War of iti in Itch es41111 Om for Aid of tbe three A.@
67
formanceof 17-Year-Olds in Readin
Seventeen-year-old Students performed-twar state performance levels
for each:of the three.teporting_groupsNo_significant differences-occumin any:theme for studentsattending large city or urban fringe and medium
citYschools;-however, one difference_significantly above the state per-
formance level-did occur in Theme.2 (Visual Aids) far students attending
ruraLachools
An evidenced in total reading,-_the performance pattern was the_
same atboth the 9- and 13-year-old.levels: students attending large
schools performed significantly below the state average percents.=_
correct;_thase attending urban ftingeand medium city schools performed
significantly above the state average-percentscorrect; and those
attending rural schools performed at a level similar to the state
aVeragd percents Correct. Seventeen-year.;olds-in each of the three
community categories performedat ajevel-similar tothe state averagepercent cort-ct._
The Relationshi n Size and Communit and_the Per ormance
d 174ear-Oldsin_Mathematics
Table 3.613resents_the groupfeffects=jdifferences byage level-'forthe Size_and Type ofCommunity reporting groups in thesubject area of_
mathematics. In the subsequent sections student performance on:the relevant,
mathematics content areas will-be discussed by.age level and within each
age level by_large city, urban4ringe and medium city, and rural.- - _
I. The Relationshi Betweemmand the_Per-_,
-ance of :9-Year-Olds in Mathematica
= Nineryear7old students attending-large-city schools performed
significantlY:below the state_performance levela_pn_two of_i_the_seven:
content areas assessed (Properties of-jiumbers and Geometry) and an_
total mathematics. The tesults for-97year,.-old students attending.-utban fringe and-medinti city schools and for7those-attending rural
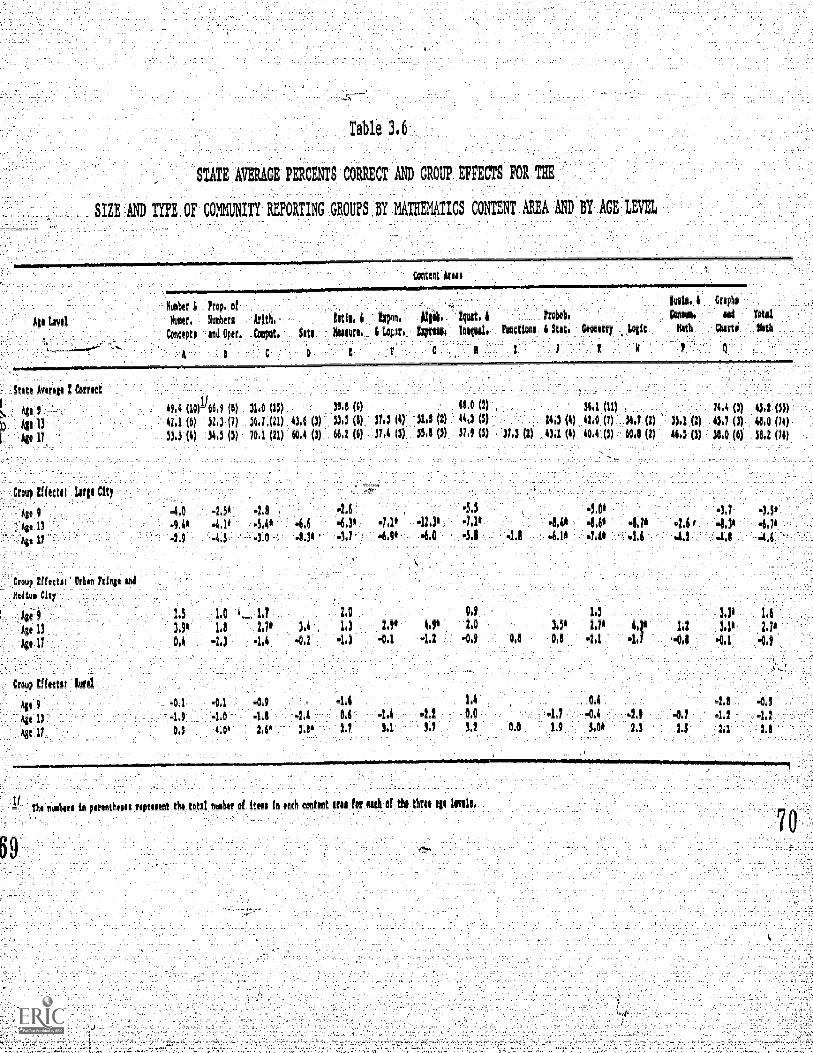
STATE AVERAGE PERCENTS CORRECT AND GROUP EFFECTS FOR THE
, SIZE AND TYPE OF COMMUNITY REPORTING GROUPS BY MATHEMATICS CONTENT AREA AND BY AGE LEVEL
Ago Loyd
Stito Avirogo I Corrort
IN Ago -
3) Ago 13
I Ago 17,
Hobo' k ?rap. of
Am. Numbers Arith.
Contepto ond Oper. _Coopot,
A 9
Corea evil
lotto, 4 !spun, NIA. !quit. 4 oigh,
Soto Noisoro. 6 1.4Jr. Imam loolus1, roctiono 6 Sta.
1
Coto4tr7 Logic
X N
Cropho
sot Tote
Chuts Itoth
49.4 (10)1 66.9 (9) 31.0 (15) 38.8 (6) 18.0 (1) 31.1 (11) 14.4 (3) 45.2 (55)
47.1 (6) 32.3 (7) 56.1.(21) 43.6 (3) 53.3 (8) 32.3 (4) 31,8 (2) 44.3 (3) 24.3 (4) *2.0 (2) 54.2 (2) 1/.1 (2) 45.1 (3) 48.0 (14)
33.3 (4) 54.5 (5) 10,1 (11) 60.4 (3) 66.2 (6) 513 15) 53,8 (3) 31.9 (5) , 31,3 (2) 43,1 (A) 40.4 (5) 60.8 (2) 46.5 (5) 38,0 (6) 58.2 (18)
croup Merril Lugo City
-1.5° -7.8 , -1.6 -5.5 -3,00 -3.1 -3.5*
-9.4 -4.1" -5,4* -6.6 4.30 -7,1* -17.3* -7.1* -8. 4 -8.6 -8,10 -2.6 I -8.31 4.7*4.9 45 30 9.34 -3,7 4 ,90 4.0 -5.8 -1.8 4.1 -1.40 4,6 4.2 -4,3 -4.6
Croup Mediu Olio Tripp And?din City
4e.9Agt 13
Ago 11
Croup Motto brd
Ago 9
Age 13
Age 11
1.5 1.0 t_ 1,7 2.0 0.3 , 1.5
1.9* 1.0 2,70 3,4 , 1.1 7.9* 43* 1,0 3.5* 2.74
0.4 -1.3 4.4 -0,1 -1.3 -0.1 -1.2 -0.0 0.8 0,9 .2.1
-0.1 4,14.9 -1.0 -1.1 -2,4
0,9 4.0* 2,6 lei
1.4
0.6 -1.4 -2.7 0.0
3.1 3.1 3.7 3.2
, 0.4
-1.7 -0,6
040 1.9 3,00
LP 1.6
1.2 3.10 2.70
.-0.9 4.1 -0.9
-2.6
.2.9 -0.7
1.3 345 2.1
thforr amen rh* rotsl holir of ittos In nth content uoi for th of tho thrio lgo *oh,
69
schcols were bas
students in.the state.
attending rural schools scored closer to the state average percent
correct than did students attending urban fringe and medium city
schools Those students in the urban fringe and,medium city schools_ .
did perform sigr4licantly above the state in Content Area Q (Graphs
2. The Re1ats!i
mance of 13-Year-Olds in 4athematics
Thirteen-year-old students a
significantly below the state per
tending large city.achools
ormance levels on total ma hematics
and on all ofthe'-13 content area 'iasSessed:except two (Sets_ancLCon-
sumer Math) 11 ThOse:stndents attending urbanfringe and medium city
school'aperformed significantly abeve:the stateperfermance levels
-On total mathematics and -on eight content areas (NumberConcepta; Co--
putation,, Exponents and Logarithms', Algebra, ProbabilityGeometry,-Logic, and:Graphs), :Those students:attending ruralSobeols performed
near state performante levela On total mathematics and 'on all aOntent2,,-
The Relationshi BetweeniSize and Ty2e :of Community nd the Per-,
:17-Year-OldsinMathematic_
:SeVetteen-year-old students classified in each of the community
groups-performed much like studentain the state;:however. significant
differences diclOccur in Several centent-areas'for_two of the reportinggroups. Seventeen7year-old students attending large city schoole,%-
scored significantly belmd the state average percents correct on four_of the lticontent areas adaesSed-(Sets-,- Exponents_and Logarithms-Prob-_ __ability, and Geometry), whereas those attending rural schools: scbred
-significantly-above,thestatoaverage percents correct on four content
areaS_(Propertiesof Numbers, Computation,-Sets, ancLGeometry). Stu-_
-dents-attending urban. fridge arid mediuM city schools performed near
state performance levels on total-mathematics and oa all content
Note that Content Area C (Algebra)only two items at the 13-year-old level.
-49-
71
ze And --of Coimnunit and-Mathematics Performance: -
thirteen-,z7and seventeen-year-old-students attending rural-
schoolsperformed near-stateperfermance levels. Students attending large
city sdhools performed7significantly beim the state average at-the 9-
year-oldlevel,. significantly and substantially below the state average :
'-at the 13-year-old level-,I,and!near the state average at the 17-year-old
level. The result_ for97,-and 177year-old:students attending urban fringe:.
schbolS were censistent withthese for StUdentvin the state; however,
the results for 13-year-old:students in this same-classification were Big-
hificantly.above those-foretUdents in the state-.
LANIONSHIP BETWEEN PARENTS' EDUCATION AND THE
PERFORMANCE OF 9-, 13-i AN7.D"17 -YEAR-OLDS IN-
READING:AND MATHEMATICS,
Parents'i:EdUcatiorirrefers to the highes :level of:education obtained by
either parent. Students reported both their father's and their mother's eduCa-
tional level. This information was used to classify the students into one
the following fourreporting groups: _lese;:than high school graduate,high
school graduate, post high school, and unknown
of
Only-the results fin' students classified,in the less than high school grad--
uate,,highschool graduate,-. and post'high sehool_-reporting groups Will be pre-.
-ente&and_diScussed in thiS seetion. The:Unknown-reporting group included-, .
students who_did not knot.: either paren educationallevel or who failed to
provide any ef,the requested informationabout parental educational levels. The_
resultsilor these students are presented in Appendices B C; D, E, F,-and G.
The Relationshi Between Parents Educe
13- and 17-Year-OldslitEg
Table-3.7-presents-the-group-effects-(differences)-by-age-level-for-the
Parents Education reporting groups in-the subject area of reading. In the
_subsequent sections, student performance on_ the.eight reading themes will be
he Pe-if-mance
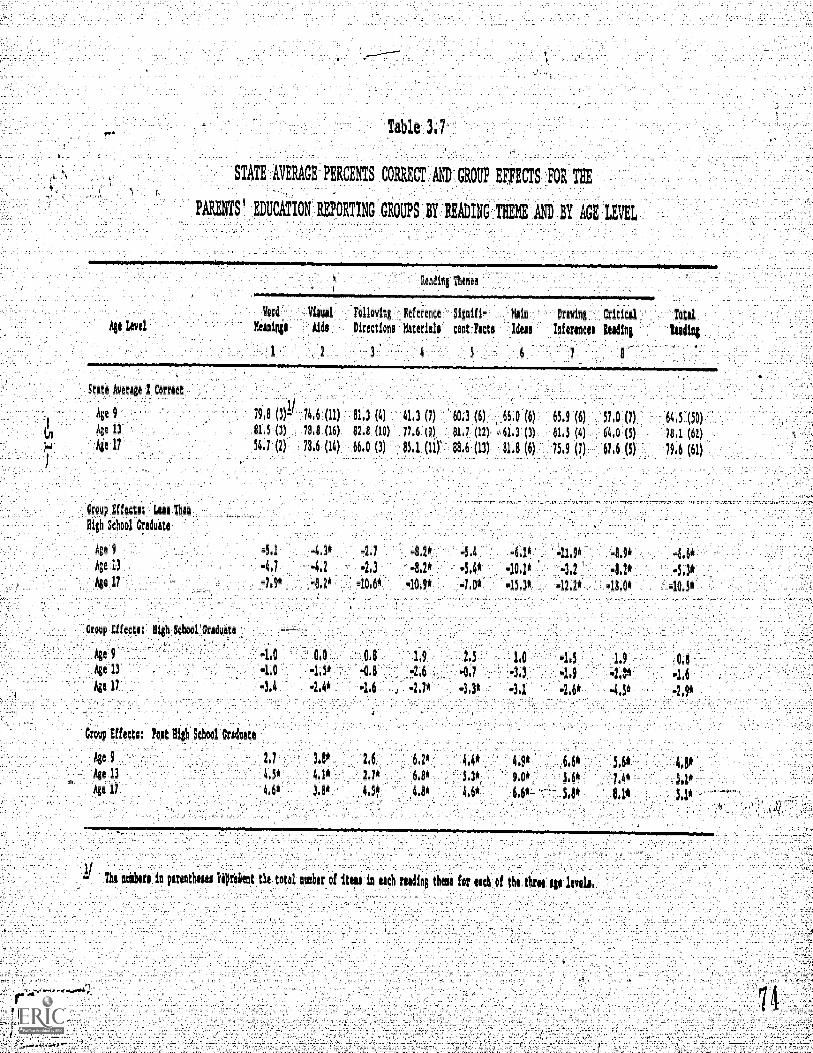
''t
Table 3.7'
STATE AVERAGE PERCENTS CORRECT AND GROUP EFfECTS FOR TEE
PARENTS' EDUCATION REPORTING GROUPS BY READING THEE AND BY AGE LEVEL
Sending Menet
Nor4 Vienil
Ali Level Reining, Aide
1 2
Polloving -Reference
Directions merles
3 4
Signifl-
cantlacts
5
Idea
6
Droring Critics'
Interims Reading
7 8
Total
leading
State Average I Correct
Age 9 79,8 (3)11,- 74,6 (11) 81'.3 (4) 41.3 (7) 60.1 (6) 66.0 (6) 65.9 (6) '57.0 (7) 64,5 (50)
Age 11, $1.$ (3) 78,8 (16) 82.8 (10) 17.6 (9) 81.7 (12) ,11.31(3) 41,5 (4) , 64,0(5) 18.1 (62)
Age 17 54,7 (2) 19.6 (14) 66.0 (3) 85.1 my 88.6 (13) 81.5 (6) 75.9 (7) 67.6.(5) 79.6 (61)
Gropp fffectl: 14111 Than
High School Gradpete
Age 9 4.1 4.3* -2,7 .8,2* -5,4 -6.1* -11.90 .8.9* -6.6*
Age 13 -kJ -4.2 -2,3 -8.2* -5.4* -10.1* -812* -5.3*
Age 17 -7.9* -8.2* .10,6* -10.9* -7.0* -15.3* -12.2* -18.0* -10,5*
Group Effects: High 8choolAtthate
,
Age 9' . -1,0 0.0
Agel3 -1.0 , -1.5*
o.o
41.8
1,9
-2,6
2.5
-0.7
1.0
-3.3
-1.5
-1.9
1.9
.2,,S*
0.8
.1.6
IV 17 -3.4 -2.4* -1.6 ., -2,7* -3.1* -3.1 -2,6* -4.5* -2.9*
Croup Effect,: Post Ufgh School Criduete
2.7 3.8* L6 64* 44* 4,9* 6.6* 5.6* 4.8*
Ale 33 4,5* 4.1*.
2.7* 6.8* 5.3* 9.00 5.6* 7.4* 5.1*_
Age 17 4.6* 3.8* 4,5* 4.8* 4.6' 6,6* 0,105,1*
1/
Ths mak, in menthes*, liPreient the total Heber of Um in each reeding these for etch of the three ige levels.
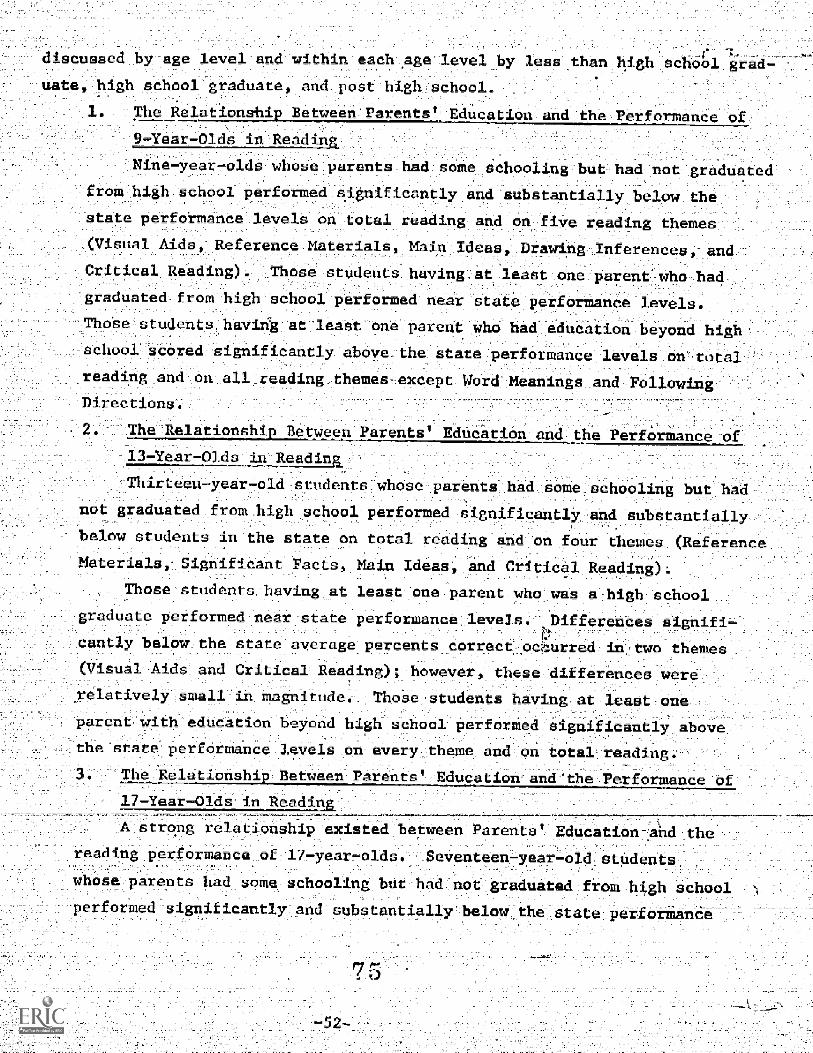
e level_and-within eachage level by less:thanschool graduate -and post high school.
discussed by-auate, -hi h
1. 1 The Relations-hi Between P
9-Year-Olds in ReadingNine-year-olds whose parents had some schooling but had not graduated
=-;gh school grad7
rents'. Education a d the Performance o
cm high school performed significantly and substantially below the
state performance levels on total reading and on five readin themes
(Visual Aids, Reference Materials, Main Ideas, Drawing Inferences, andCritical Reading). Those students having at least one parent who badgraduated from high school performed near state performance levels
a students having at least one parent who had education beyond bi bachool scored significantly above the' state performance levels on totalreading and on all reading themes except Word Meanings and FollowingDirections.
The-Relationship Between Parents' Education and the P13-Year-CteadinThirteen-year-old students whose parents had some schooling but had
not graduated from high school performed significantly, and substantially.
below students in the state on total reading and on four themes (ReferenceMaterials Significant Facts Ideas, and Critical Readin
Those students having at least one parent who was a high schoolgraduate performed near state performance levels. Differences aignifi-
.
cantly below the state average percents correct oe-4urred in_ two themes(Visual Aids and Critical Reading); however, these differences wererelatively small in magnitude... Those students having at least oneparent with education beyond high school performed significantly abovethe state performance levels on every theme and on total reading.3. The Relationship Between Parent_ Education and 'the Performance
7-Year-Olds
A strong relationship existed between Parents' Education-and the
reading performance of 17-year-olds. Seventeen-year-old students
whose parents had some schooling but had not graduated from hi h schoolperformed -signifi antly-and substantially below the stat performance
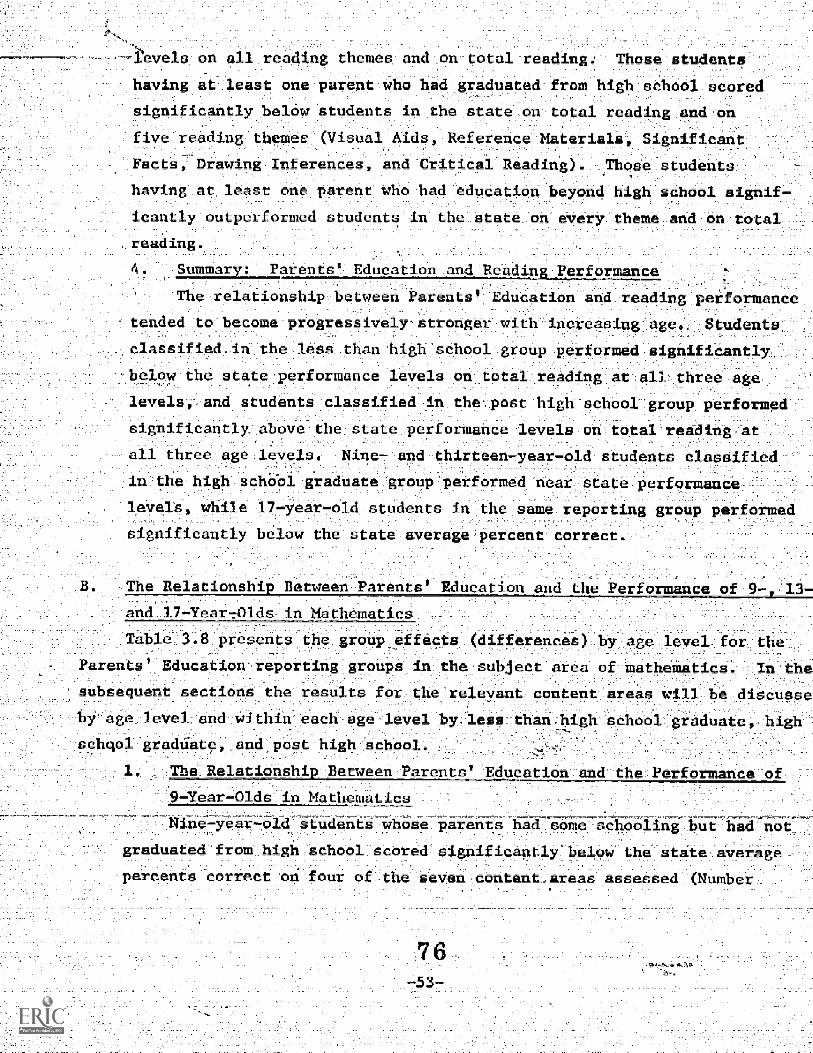
on all reading hemet and._on-total reading Those students'
having.at leatt.ene parent_who...had graduatedifrom high schoolecored-
significantly .below students. in ..the_stateon-total.readingand oa-.
five reading:themet (Visual Aids--Referencellsterials- Significant
:-.-.Factsrawing-Inferences,- anritical Reading) _7howstudents
having.at least-one...parent Whohad-:edpeation beyond hi h'school"signi
lcantly outper,
reading.
StilliMsX. Parents' Education and:Reading Performante
Therelationship between Parents :Edutation and;:reading performance_
ded:to-become-progressivelystrongetwith increasing-age-, Students-
classified-in the-lesS than high: schoolgroup:performed significantly
..belowthe state-performance levels ontotal readin :at all three age
levels, And students classified in the:post:high school group performed
significantly above the state perfortance levels on total reading..:at
all three age-levels. Nine- and thirteen-year-old students claseified
in the high schobl graduate group-performed near_state performance
levels, while 17-year701&-students in-the same reporting:group performed
rmed students in the state-on every theme and on total
significantly-below the state aver _ge percent correct.
-The Belationshi- Between Paren ''Education and
and177Year7Olds in Mathematics
he Per ce
Table 3.8 presents the group_e'fects (differences ) by age level for the
Parents Edueation-reporting groUps in the subject area of mathematics., Inithe
sUbSequent sections the results for the relevant content areas will be discusse-
by age_level an&within each age level by less-than:high school graduate, high=
sdhciol gradtiate,rand post-high sehopl-.
-1. The Relationsh Between Parents Education and the Performance -of
9-Year-Olds-;in Mathemati_
Nine-year-old stu ents wos_eparents ha soe schooling butAlad-notd m,
gracluatedfrom high schooliscOredsignificantly below the state,:average- _
.
-percents correct -on four of the seven content_sreas assessed (Number
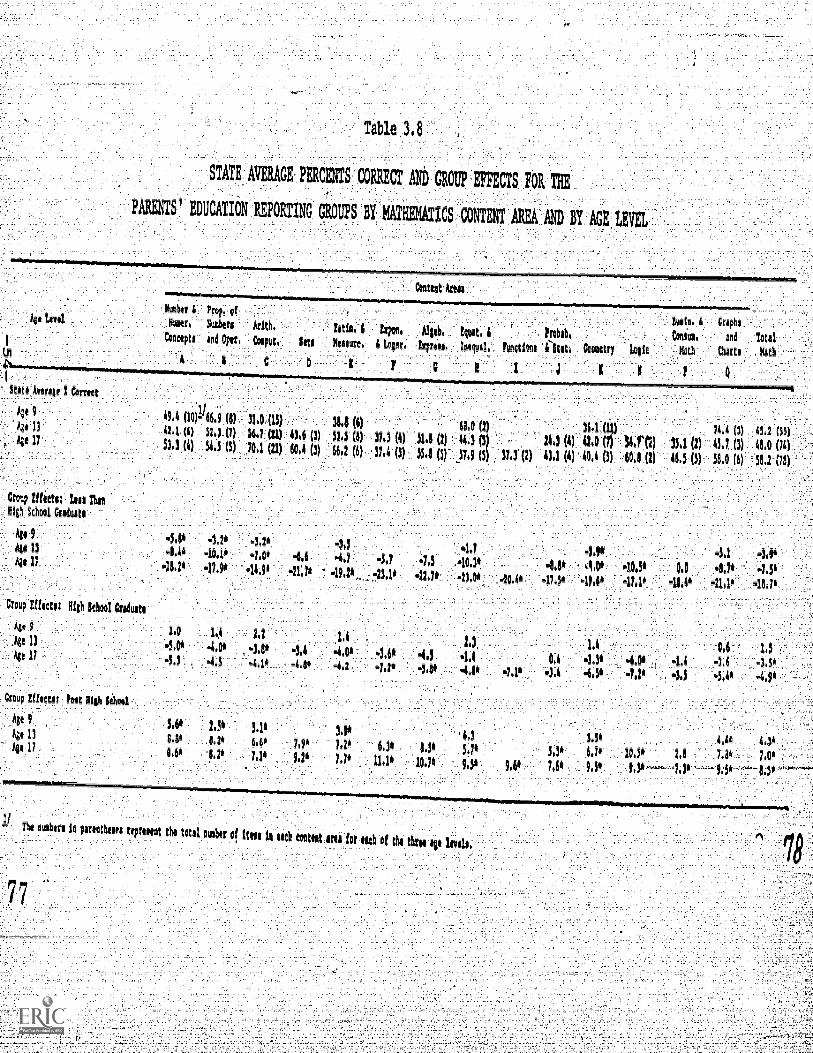
Stitt Averstr 1 Carnet
Age 13
Om !Hutu Loot mi, 50001 Croduite
Table 3.8
STATE OWE PERCENTS CORRECT AND GROUP EFFECTS FOR THE
PARENTS' EDUCATION REPORTING GROUPS BY 11ATBIMATICS CONTENT AREA AND BY AGE LEVEL-
Nmnor i Prop, of
Ikater. Numbers
Concept§ end Oper,
It
Contta 'Atm
bate. & Ctaphebrim, i te?Ofii Alseb. !quit. I Ceram (.711 Totalkonipth§c.. Igo Mcsinre. Lopr, 1.xpreoe. 114(01. Itnictioni Ceoletry Logic Math Charts . Kith
?robot).
C . D 1 1 C 8 1
49.4 (10)146,9 (8) 31.0 (15) 9.0 (6) 61.0 (2) (11)423(6) 52.3 (1)36.7 al (3) 134 (8) 374 (4) 31.1 (2) 44.3 (3) 24.3 (4) OA (1) 9I./(7)53.3 (4) 54.5 (5) 70.1 (21) 60.4 (3) 64.2 (6) 57. (3) 55.1 (5) 57,9 (5) 37,3 (2) 41.1 (4) 40.4 (5) 60.8 (2)
Ago 9-5.8' -3.20 -3,21 -3,5 4,7 4.90
4141 114.40 -1040 -7.06 -6,1 4.7 -3.7 43 .40.5' 4,8* ,0* .10.3*
Ago 17'11.24 -17.9' '11.1' -214° -19.2" -23.1' -11,10 -15.0' 40.46 -173a 01,JA .11.1'
Crot; Effecti! High Moo! Croduito
4s, 51.0 1.4 2,2
1.42.1. 1.4Mt 11 4.0* 4.0* -3.8* -3.4 400 -3,4* 43 .1,4
0.4 -1.5A -6,00Ap 11
4.3 4.3 -4.1' -4.80 -4.2 .7.1* -5.8* 4.1" -7,1' 4,4 -LS* -7,2"
Cm* Clients loot itsh 4401
Age 9
Ago 13
4* 17
3.1* 139 5.11
Li' 1. 2" 6.60
1.60 1.11 7.10
1/ Int nuabou iouproot tho tot01 ow
77
3,01
7.9' 7.21 6.34 1.519.1' 7.7' 1146 10.76
74.4 (3) 45.2 (55)
334 (2) 43.7 (1) 41.0 (71)
46.5 (5) 11.0 (4) 51.2 (71)
-5.1 4.94
0,0 4.2' 4.5'
41.4* -11.1' -18.71
0.6 1.5
4.4 -1.6 -3.51
.1.5 4.4' 49"
'4.3 5.51 4.41 4.36
5.1' 3.36 6.76 10,50 1.8 7.a, 7.0'9.9 9.61 7.61 931 9.11- 731 9.56
of ittAl ill 010 wontoto for:1400f tho thus Alt lash.
Concepts- Properties of NuMbers, Computation,
total mathematics Those students having At
graduated from high sehool-performed near the
tudents having at:least one perent,who had education beyond
-nd.Geometry) and on.
one parent who had
ate Averages 'Those
school significantly surpassed students in the state on totel)mathe-
Matics'and-on all OOntentrareas exceptthe'one dealing.with'ecinations.-
thePeThe Relationship Between Parents
of 13-Year-Olds in Mathematics
Thirteen-year-olds whose parents had some schooling-but had not
graduated, from high school performed signifiCantly.and substantially
below students in the state on eight of the.13 content areas_assessed
(Number:Concepts, Properties of Numbers, .Computationv Equations,1
Probability, Geometry,-Logic, and Graphs)-- and on total mathematics.. .
Those students having at least one parent who had graduated from high
Education and
school performed significantly below the state performanc
seven content areas (Number Concepts, Properties of Numbers,
ion, Estimation Exponents and Logarithms etry, and Logic)
on total mathematics. Those students having at least one parent
had education beyond high school significantly and substantially
performed students n the state on total,mathematics and on
.,cOntent area except Consumer Mathematics.
3. The Relationshi Between Parents' EducatIon and the Yerformance
-of:17-Year-_lds in Mathematic;
There:was'a'strong relationshiphetween Parents Education and
the performance of:a7-year-olds-in mathematics. Severiteenyearo1U-
students whose'parents had some schdoling:but had not graduatedfrom
high schOol'performed-- gnificantly_arid substantially beloW the-state
:performance levels on every Content area and on total mathematics.
-.The differences were markedly larger in magnitude than thoke'-nbserved
at: the-9.and:1-year-.01.4evela., Thosestudents who had:at least one
____---Jparentwhojhad:graduated from high-school-aedied-below-the-atate-avera e----
Note that Content Area Logic) contains onlyyear-old level.
percents orrett OA total mathematice and on nine of the 14 con ent
areasassessed (Computation,Sets, Exponents and Logarithms Algebra,
Fenctions; Geometry, Logic and Graphs). Those students-Equations
hiving at least one parent who had education beyond high
icantly and substantially outperformed students in. thekstate on all
14 content areas and on total mathematics. The positive -differenc
were large in magnitude but not as large as.the negative differences
observed for students in the less than high school_group;
4. -Summar : Parents Education-and Mathematics Performance
school s
As age level.increasedthe relationship between Parents Educe-
tion and mathematics performance became.stronger. As evidenced'in
total mathematics, at all.threi age levels students whose parents had
some schooling but had not graduated from high school performed signif-
icantly below the state performance level, while students.having at-
least one parent who had educetion'beyond high school performed aignif-
candy -above. The mathematics performance deficit for. 17-year-old
students in the less than high schOol graduate group was markedly
larger than that for 9- and 13-year7pld students in this reporting
group. Thirteen7 and seventeen-year-old students having at least one
-parent who had graduated from high school' also performed significantly
below_the state performance levels,.. while 9-year-old students in this
group performed near the state performance leveL.
VI. THE RELAT1
ERFORMANCE OF 9-,
IP BETWEEN READING BATERIAIS IN HOME AND THE'
ARD 17-YEAR-OLDS IN READING AND MATHEMATICS
Reading Materials in Home refers to the availability Of different types
of reading materials found in the homes of 9-, 13-, and 17-year-old students.
Each sample student was asked about the availability of newspapers, magazines,
books, and encyclopedias. The procedure for determining the reporting groups
:Content,Area-I (Functions ) and-Content Area.N.-(Logie_. contain-at-the.177year7old;level;
was_based on the t talnumber of these,fonr types Of reading materials
:available to the student in the home. The categories used in reporting the
_results. forthis Variable are:. jimitedavailability (none or-one. of-the.
our types), nedium availability (two or three of the four types) and
wide-range availability (all four types).
The Relatjonshj Tetween Readin eterial- in Rom
f - and-l7.-Year7OldsAn _eadin
and the -Performance
TOle 3.9 4eresentsthe::group-effects(differences) by age level fur the,
ReadingMaterialsAn'._Home reporting groups in the subject atea_of reiJing. .1n_
the:subsequent sections student performance on the eight reading themes will. _
_bp-diseussed by age level and within eack_age level_by limited availability,
medium availability, and widerange availability.
1. -.The Relationship BetWeen Readin _Materials in_ Home and:theyer-, ..
formance of 9-Year-Olds in_Reading_
Nine-year-old students having reading materials of limited availe-
biliy in the home performed significantly below students in the state-_
on every reading theme and on total reading. Nine-year-oid'students
having reading materials of medium availability in the home per ormed
near_periormance'levels for'all students in the:_state.--Nine-year-old
s vide-at-a- haVitig -riad teria16-67f
scored significantly above the state ayerage'percentd correct on-total
reading ancLon: five of the eight themes'Oisuel-Alds,-_ Following Drec-_ - _
tions Reference Materials, Significnt Pacts-and Critical Reading).
2. 'The Relationshi Between Readin:Matarial5 in Home and the Per-
13-YearOld0:in-ReadingL-
There Was a=-strong_relationship between _ in- Materials in Home-
and-13year-old reading performance. Thirteen-year-olds having reading-
materials of limited availability in the-home scored significantly'and:'
substantially:below the state performance levelsTon-every-teadin
theme and on total reading. The negative differences were large in
tude and as evidenced in total reading tended to be larger
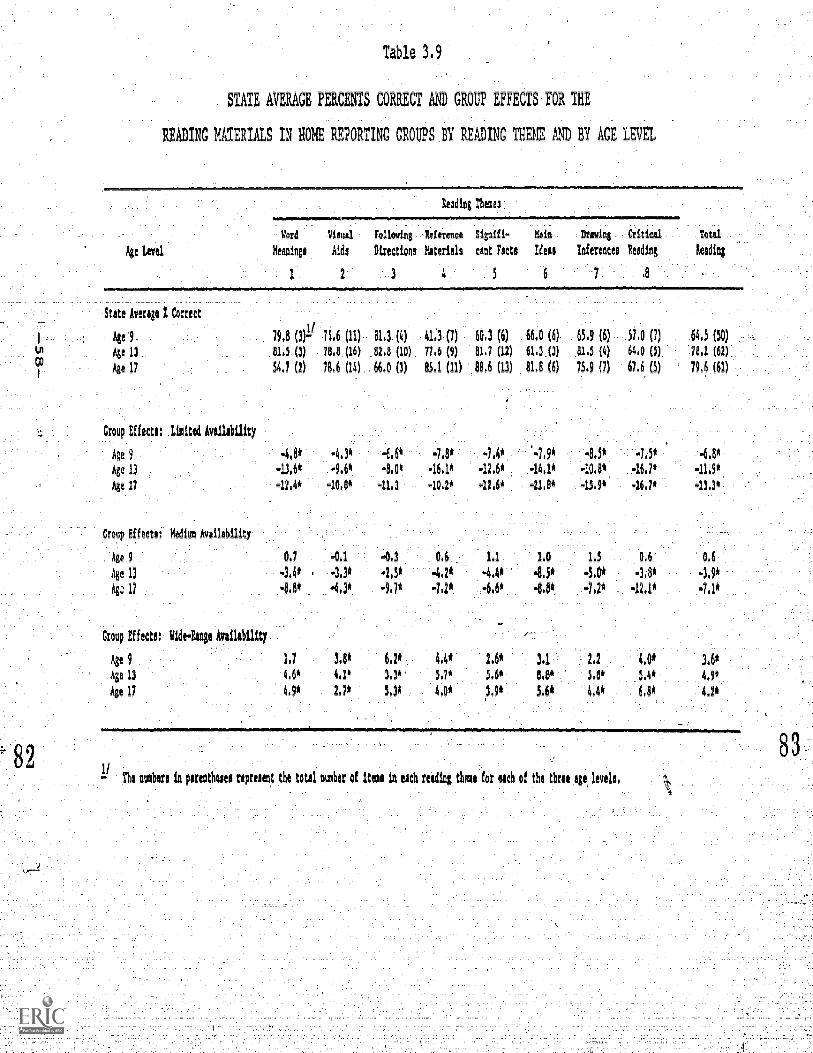
Table 3.9
STATE AVERAGE PERCENTS CORRECT AND GROUP EFFECTS FOR THE
READING MATERIALS IN HONE REPORTING GROUPS BY READING THEME AND BY AGE LEVEL
Age Level
=
leading IWO
word Vieual Foaming Reference Signif1- Main Raving_ Critical
Meanings Aide %rename Wedeln cant Facts Ideas Infernal habit
1 3 4 5 6 7 1
Totta
Beading
State Average 2 Correct
Ate'9
Age 13 .
Age 17
Croup Effette: :Limited Avallsiility
Age 9
Agg 13
Agt 17
Group Effect': Medic: ty
Age 9
Age 13
Ag: 17
Croup Effecte: Vidshnge Avallibiliti
Age 9
Age 13
Age 17
79.8 (1).1/- 71.6 (11) 81.3 (4) 41,3 (7) 60.3 (6) 66.0 (6) 65. (6) 57.0 (7) 64.5 (50)
01.5 .(3) 78,8 (16) 828 (10) 77.6 (9) 817.(12) 61.3 (3) 01, (4) 64.0 (5) 70.1 (62)
54.7 (2) 70.6 (14) 66,0 (3) 85.1 (11) 08.6 (11) 01,0 (6) 75. (7) 67.6 (3) 79,6 (61)
74;0* =4.3* =7,8* =7,4* '47,90 =0,5* =74*
-13.6* .9.6* =8.0* -16.1* -12.6*, 441* -10.0* , 46.70 -11,9*
=12;4* =10.0* =11.3 -10.2* =12.6* =21.0* -15.9* -16d*
0.7 41 43 0.6 1 1,0 1.5 0.6 0,6'
-4.2* -4,4* .8,9* 5.0* .33*
-8.0* 4.3* .7* -7.2* -6.60 4.80 -7,2* -12.1* -7.1*
1.7 3.8* 6.2* 4.4* 2.6 3.1 2,2 4.0* 3.6*
4.6* 4.1* 1.3* 5.7* 5.6* 8,81 5.8* 3.4* 4.90
4,9* 2.70 5.3* 4.0* 3.9* 16* 4.4* 6,8* 4.2*
- nalbere in parentheiel repteient the total number of Items in each real' rbeme for eeeb of the rbree age feeds,
than the corresponding differences at the 9-year-old level. Those
students having reading materials of medium availability in the home
also performed significantly below the state average percents correct
on all reading themes and on total reading; however, the performance
deficits were much smaller than those for students having reading
materials of limited availability in the home. Those studentp having
reading materials of wide-range availability in the home scoted signif-
icantly above students in the state on all themes and on total reading.
3. :The Relationshi: Between:Reading Materials in Home and_the Per-i
formance of 17-Year-Olda injlead n
At the 17-year-old level the performance pattern was similar to
that at the 13-year-old level.- The 17-year-old students having read-
ing materials of limited availability in the home performed signifi-
cantly below the state performance levels on total reading and on
every theme except Theme 3 (Following Directions). Those students
having reading materials of mediuM availability in the home scored
significantly below students in the state on every theme and on total
reading. Those students having reading materials ef,widerrange avail-
ability in the homesignificantly outperformed students in the state
on eVery reading theme and on total reading.
4. Stimm_gi,L.Readleand.ReadizPerfo_Mav rmance
A strong relationship existed between. Reading Materials in Home
and reading petformance at_the 13- and:17-year-old levels and a rela-
tionship existed at the 9-year-old:leval. :Students-classified:in the
limited availability group araach agalevel perfor2d-:significantly
below thestate-performance levels on total reading.-_ ..kt the 9-year7
tild level students clasaified in the medium availability greup'per-
'formed much like studehts in the-state on total readingwhile at the'_ _ _ _
13- and 17-year-04:levels:students classified in this group perforMed
significantly belowthe state performance levels:on total'reading.:
Reading performance for students classified in the:widerange avail- '
-;-abilit7 group:was similaradross the three ae groups; ai each of the
three age levels students classified in this reporting group performed
significantly above the state performance levels on total reading.
The Relationshi=-
. Between Readin aterials in Home and the Performance
9- and'17-Year-Olds in Mathematics
Table 3.10 presents the group effects (differences) by age level
the Reading Materials in Home reporting groups in the subject area of
mathematics. In the subsequent sections student performance on the relevant
trzhematics content areas will be discussed by age level and within each
age level by limited availability, medium availability, and wide-range
availability.
1. The Relationship Between Reading Materials in Home and the Per-
ormance of 9-Year-Olds in Mathematics
Nine-year-old students having reading materials of limited avail-
ability in the home performed significantly below students in the
state on total mathematics and on all of content areas assessed excep
Equations. Those students having reading materials of medium availa-
bility in the home performed near the performance levels for all stu-
dents in the state Those students having materials of wide-range
availability in the home significantly outperformed students in the
state on every content area and on total mathematics.
2. The Relationshi Between Readin Materials in Ho e and the Per-
formance of 13-Year-Olds in Mathematics
At the 13-year-old level Reading Materials in Home was strongly
related to mathematics performance. Thirteen-year-old students having
reading materials of limited availability in'the home scored signif-
icantly and substantially below students in the state on all 13 con-
tent areas assessed and on total mathematics. A markedly large dif-,
ference occurred in Content Area G (Algebra)- however, it should be
noted that tais content area contained only two items at the 13-year--
old level.
Those students having reading materials of medium availability in
the home scored significantly below the state average percents correct
'
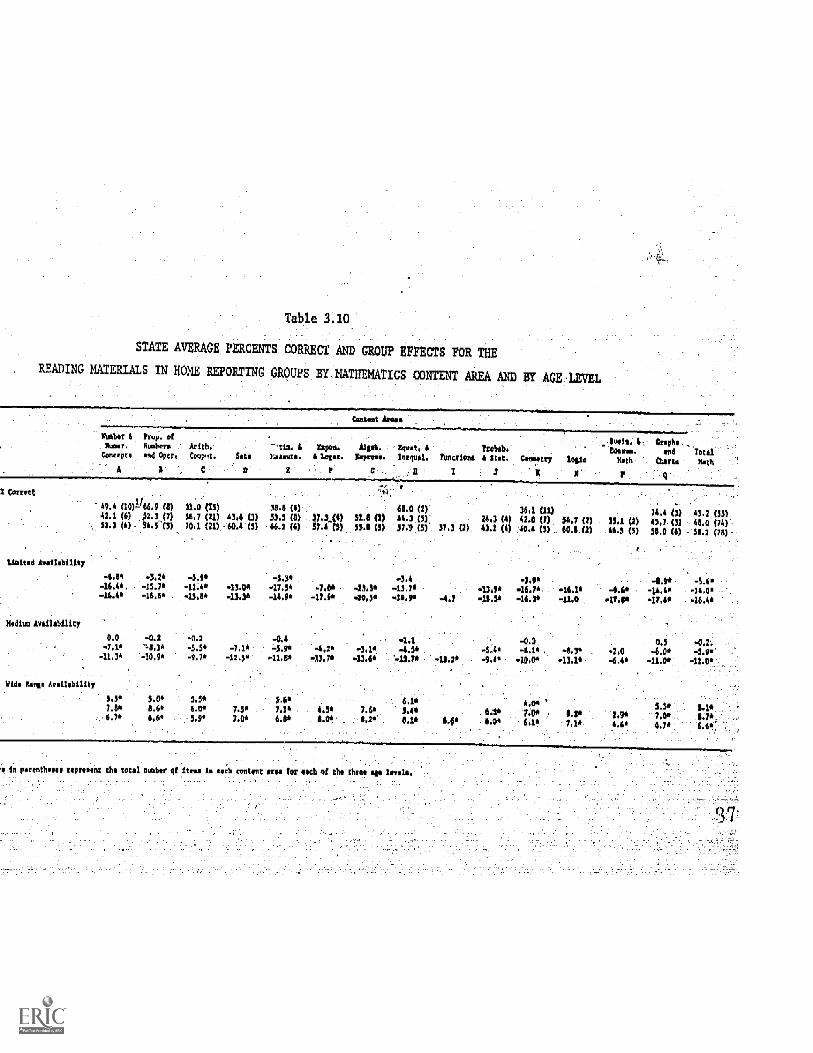
Table 3.1O_
STATE AVERAGE PERCENTS CORRECT AND mu? EFFECTS _
READING MATERIALS IN HOME REPORTING pRoups BY MATHEMATICS CONTENT AREA AID AG
ftabar 4
Concopt4
hop. ofkoboro kith.sod Oper. Co9plit. Dom*.
Matte. &
Inagoal. 70a
it440.4 Rot. Catootty
to010. 4,- croft&
OSUMI* tod TotalMath Chills Math
(10)-11
66.9 (a)2. (6) 82.3 (7)
(4) 34.5 (3)
31.0 (D)56.7 (a)70.1 (21)
43.6
60.4
33.8 (4)
33.3 (8)
66.2 (6)
37
37.6
31.1 (7)
MI (5)
68.0 (1)
44.3 (5)
37.9 (5) 37 324.3
43.1
(4) 42.
(4) 40.4
$4.2 (2)
60.6 (2)
3 45.2 (15)
46.0 (74);
58.2 (78)
Liottod Aosaatilitm
4.84 4.24 =3.9* 41.94, -I.=14.44, -13.7* 1.4* 43.06 47.3* 43.76 .111.7*, 411.14 of -*IAA°44.4* .14.64 43.64 .13.34 =14.94 7 .14.1* .0.10 .47.60 --16.4i
110d Av*i1*btlfiy
0.0 .0.2 .0.2 o0.4
,41.14 -5.5* 4.14 -5.9* 4.16 4.14 ,-10.94 -9.74 4244 .11.84 53 7 .114* 45 -7 4 .40.0* 1
VOds onin A a 61.11'_
5.3*754
5.0*
8.445.5*
6.0* 7405.44
. 7.1* - 4 5.164.7* '6.44 -5.94 7.0* 6.84 4.26
7.14
0 104440th oon, n,pf,onni tho toiol nusb,r of Sisti lo 04c9 contint are& tor oath of Ohs tht
on total mathemat cs and on every content Area except Content Area P
(Consumer Mathematics). Although these students performed belów the
state performarwe levels, the mathematics performance deficits were
not as great as those for students having materials of limited avail-
abi ity in the home. Those students having readAng materials of wide-
ran e availability in the home significantly outperformed students in
the state on every content area and on total mathematics.
3. The Relationsh Between Read erials' in Home and the Fe -
formance of-17-Year-Olds in Mathematics
A strong relationship was also exhibited between-Reading Materials
in Home and mathematics performance At the 17-year-old level.: Seventeen-
'year-old students having materials of limited availability in.the home
performed significantly and substantially below the state performance
' levels or total mathematics:and on ever content area except Content
AreAs I and N (Functions and Logic, each of which contained only two
items).
Those students having materials of medium availability in the
home performed significantly and substantially below the state perfo
ance levels on all 14 content ar as aasessed And on total mathematic
in general, the differences were smaller in magnitude than those on
corresponding content areas for tudents in the limited availability
grotip. Those students having ma erials of wide-rangeavailabilityin
'the home perforMa&aignificantlY above the state-performance levels on
all content areas and on tot,t1 mathematics.
4. §tirmar: Reading_ Materials An Home and _athemat
A strong relationship ex sted between R-eading Material
and mathematics performance at all three age levels. In general, stu
dents having materials of limited-availability in the home performed
'below the state performance,levels on-,total matheurtaties; however, the
greatest performance deficita_occurred at the 13-and 17-year-old
levels. Students haVing materials of medium availability in the home
performed much like students in the state on total mathematics-.atthe
9-year-old level and performed below the state average percents cor-
rect on total mathematiS at the 13- and 17-year-old levels with the
greatest performance deficit occurring at the 17-year-old level. At
all three age levels those students:laving materials of wide-range
availability performed significantly above the state performance
levels on total mathematics.
VII. THE RELATIONSHIP B TWEEN SPANISH AS A NATIVE LANGUAGE AND
THE PERFORMANCE OF 9- 13-, AND 17-YEAR-OLDS IN READING AND MATHEMATICS
gtudenta At each age level were asked whether or-not they :had,learned
to speak Spanish before they had learned to speak English. The results
were grouped in terms of two response categories: "yea", those students
who said they learned Spanish first,- and "no", those who said they did not
learn Spanish first.
The Relationshi Between Span aa a Na-ive Lan ua- Performan
of 9- 13- and 17-Year-Olds in Reading.
Table 3.11 presents the group effects ( cea) by age level
the Spanish as a Native Language
reading. In the subsequent sect
reeding themes will be discussed
the:two response categories.
1. The Relatiensh
reporting groups in the subject-area
ons student performance on the eight_ .
level and within each age levelby age
Between S anish as Na
o -ance:of'97YearOlds in Read n
ve Lan
by
Nine-year-old students who responded "yes" scered signifidently
below the-atate performande.levels:on'total reading and eilfive Of :the
eight readingHtheMes (Visual Aida, Reference Materials, Significant
Facts, Main Ideas, and Drawing Inferences), Those -students-Aqho re-
sponded "no" scored significantly above the state performance levels-
on these same themes with the exception of Reference'Materiais.
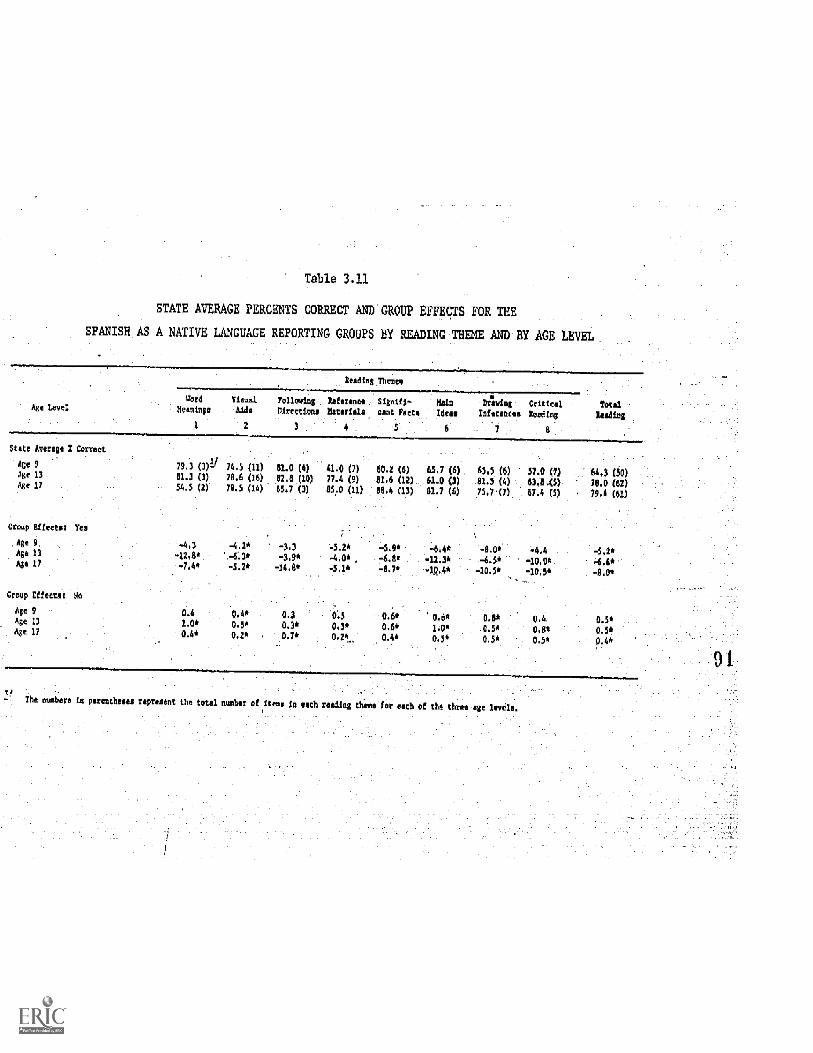
Table 3.11
STATE MIRAGE PERCENTS CORRECT AND GROUP EFFECTS FOR TEE
SPANISH AS A NATIVE LANGUAGE REPORTING GROUPS BY READING THEME AND BY ACE LEVEL
Reading These*
Word ViAuel Follosing 4Meanings Aids Direction a la
3
_a
Main Driving Criflcil TotalYitti Ideas Inferences booing leading
5 6 7 8
Stag Average % Correct
Age 9
Age 13
Age 17
Croup Effects: Tea
AgeS4Age 17
Croup Ef
Age 9
Age 13
Age 17
79.3 )- 74. 0 (7) 450.2 (6 ) 65.7 (6 ) 65.5 (6) 57.0 (2) M.3 (50)81.3 ) 78. 6 0) 77.4 (9) 81.6 (1 61.0 (3) 81.5 (4) 634()) 78.0 2)54.5 (2) 78.5 (14 ) 65.7 85.0 (11) 61.7 (6) 75.7 (7) 67.4 (5) 79.4 (6
-4.3 2 .33 '4.2* -5.9* -8.0* 4.44 .39* .4,0* -. : 4.3" 12. -4.5" -10:0" 4.6*-7.4* -5.1* , -14.8* -5.1* 4.7* 40.4* -10.5* -10:5* -8.02
0.4 0.4* 0.3 0.5 0.6* 0.6* 0.8* 0.6. 0.3*1.0* 0.3* 0.3* 0.6* 1.0" 0.5* 0.8* 0.5*0.4* 0.2" . 0.7* 0.2e..
9'4* 0.5" 0.5* 0.5*' 0.4*
91
The eumbers in menthes** spr.ient Lie total number ofti in each reading hems for riCb of the threiu
2. The Relationshi. Between S.anish as Native Lanuae and the
P rformance of l3-Year:-Olds'1n Readin
Thirteen-year-old students who responded:flyes" scored signifi-
cantly below the state performance levels on the eight reading themes
and oh total reading. Those ttudents who responded "no" scored sig-
nificantly above the state performance levels on every theme and on
total reading.
3. The Relationsh' Between
Performance'
e and
7-Year-Oldh eadin
At the l7-year-oldrleyel, there:was a strong_relationship between-- Spanish as a Native Language and reading,performance. Seventeen7year-
old students who responded "yes" scOred significantly and substantially
below the state performance levels on every reading theme and on total
reading.: Those:students who responded "no" performed tignificantly
above the state performance levels on every theme-and oh-total reading.-
4.
The .performance pattern on total reading Was,sithilar across all
threesage levels. At each age level, students who learned Spanish
first ("yes") performed significantly below the state performance levels,-
while those- who did not learn Spanish first ) performed signifi-
cantly above the state performance-levels.
The Relationshi
_
Between S anish Native Lan
Table 3.12 presents the:group effects
e and the Per rman e
differences) by age level for
the Spanish as a Native Language,reporting groups in the subject area of
mathematics. In the subsequent sections studcht performance on the rele-
vant mathematics content areas will be discussed by age level and within
each Age level by the two response categories.
The Relationshi Between S anish as a Native Lan ua e and the
-Performance of 9-Year-Olds in Mathematics-
-Iline-Year-old students wh-o responded- -s" performed signifi-
cantly below the state performance levels on three of the seven content
5-
9 2
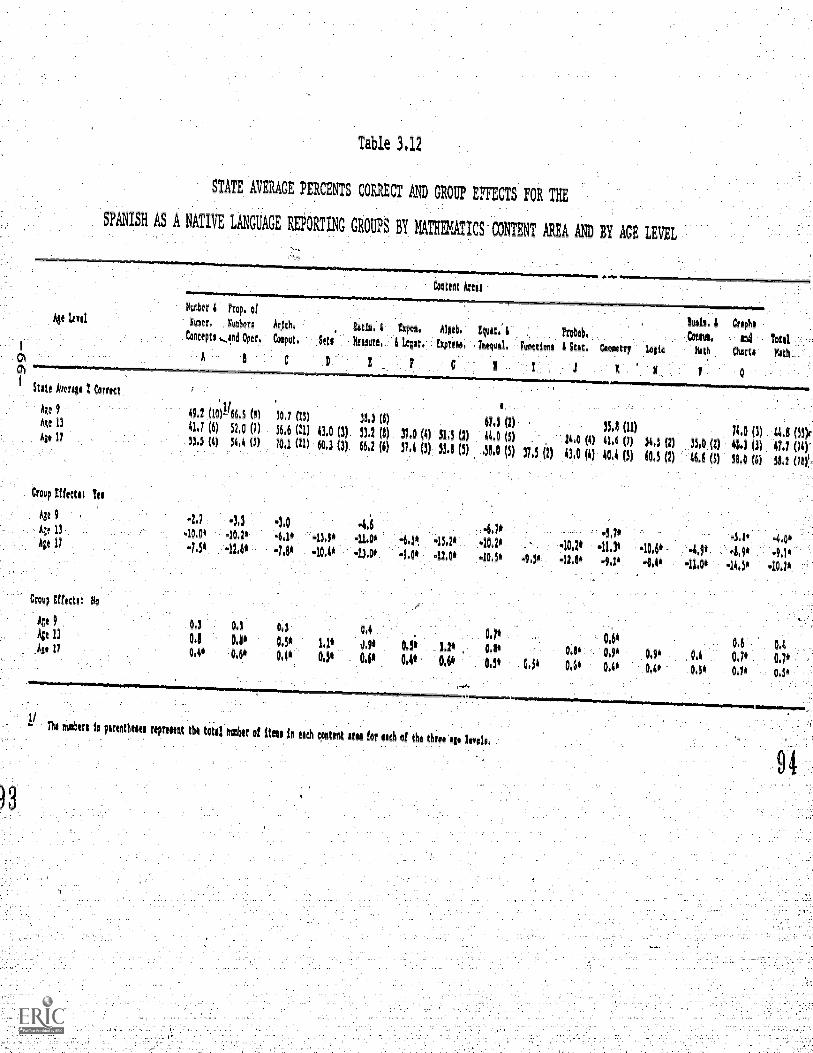
Table 3.12
STATE AVERAGE PERCENTSCORRECT AND GROUP EFFECTS FOR THE
SPANISH AS A NATIVE LANGUAGEREPORTING GROUPS BY MATHEMATICS CONTENT AREA AND BY AGE LEVEL
Ate log
Sege keep
Au 9
ne 13
it, 17
Creep MIMI ii
13e 9
Atf 13
Agt
Coup Effect. 80
As. 9
Age 13
he 17
Rif-1W I ?rep. ef
liner, RoweUncial ,--e!id OprA I49,2 (1011 6,5 (91
41,7 (6) 57.0 (7)35,5 (4) 56.4 (5)
-2.7 4 3.10.01 40,21
4.51 42,4*
0.3 0,3
0,1 0,01
0,0 0.41
Arjth.
Capyi,
10,1 (111
06.6 (11)
70,1 (11)
.2,0
4,1*-1.6*
0,3
0.30
0 40
lere
43.0 (3)
60.3 (3)
43,91-10O*
1,1*
0,0*
teas, ;Mutt.
31,5 (6)
33.2 (0)
66,2 (6)
4,641.01
.n.00
C.4
4.91
0,11
fxpit ,
6 Legat
37,0 to37.4 (3)
4.51.01
,
0.31
0.0
met Attu
po
51.3 (2)
35.0 (5)
.15,2*
42,01
1.2* ,
0,61
Erg.1Mql Vonttiin
hobo,4 Out.
J
1/letal1140huh Ch4ru
0
87,) (1)
44.0 (3)
58.0 (3)
.4,11401140,51
0,7*
0.51
0.5*
37,3 (2 )
,31
0,51
33,8 (11)
24.0 (4) 11.1 (7)
43.0 (A) OA (3)
.5,71.10,2* 41,3*-11,81 4,11
0.6*
0.81 0,91
0.0 0,11
34I1 (2)
04 (1)
-10,04.4*
0,91
0.41
3540 (2)
16.1 (5)
4.91
41.0*
0.1
0,31
71.D (3)
434 (3)
31.0 (4)
4,4,91
-14.31
0.6
0.71
0.11
4,0 (5311
1.1 (11)
8,2 (7d=
.9 I40.7*
0.1
0.71
0,31
Tha tkoblu 11 truthull teritunt the totil trillket et ftti 4n tech tagnt
wgieng~.
neb et 'be Otte '10.1oebei
areas assessed (Equations, Geometry, and ,Graphs) 1/and on total mathe-
matics. Those students who respended "no" were near the state average
percent correct on total mathematics, but they did perform significant
:Above the state on two content areas Equations and Geometry).
2. The Rela '-nshi Be--een S anish as a Native Lan ua and the
Performance of 13-Ycar-Olds "n Mathematics
The results for Spanish-as a Native-Language4at the 13-year-old
level exhibited a strong relationship to mathematics performance.
Thirteen-year-old'studentawho responded "yes" performed significantly
and substantially 'below the state performance level on all 13 content
areas assessed and:on total mathematips.- Those who responded 'Ino"
performed significantly above the state performance levels on total
mathematics and on all content areas except Number Concepts and Consumer
Mathematics.11
3. The Relationshan_eaeandthePerformance of 17-Year-Olds in Mathematics
The mathematics performance of 17-year-elde resembled that _
yeartelda'for the tWo response categoriea. Seventeen-,year-old studentswho responded "yes" perfermed significantly and substantially below
,
students in the state on All of the fourteen content areas'asseased
and on total mathematics These students who responded "no" performedsignificantly above the state performance level on all conten
and on total mathematics.
4. Summary: anish a
At the 13-
a Nativ -e rid, a he
areas
ics,Pe _o ncand 17-year old levels, A Atron relationship existed
between Spanish as a Native Language and mathematica performance.
Students who learned Spanish first ("yes') performed significantly and
substantially below the state-performance levels-on all content areasassessed and on total mathematics. 4tudents who did not learn Spanish
1 Note that tonten Area _ (Equatio at he,ns) contains only9-year-old level.
-- e that Conten AreaG (Algebra) nd nten Area N Lo ic ainonly two items at the_13-year-old level
-67-
9 5
first ") performed significantly above the state performance
levels on mos':; of the content areas asWessed and on total mathematics.
Nine-year-old students responded "yes" also performed significantiy
below the state average percent correct on total mathematics;
however, the perforMance deficit was much smaller than those at
ages 13 and 17.
VIII. SUMMARY
Reading and mathematics results for the report.ng groups within the
six reporting variables were generally consistent with findings- of other.
educational studies relating student performance to similar characteristics.-
-In reading, females performed significantly above state performance levels
.at all three ages (9, 13, and 17) while males performed significantly below._-
state performance levels. 'In mathematics, neither males nor females performed
significantly-different than the performance.levels for all students in the
state
The resultslor the other five variables were mere:consistent
across subject areas. At all three age levels, Black-students in- Florida
scored significantly and substantially below state performance levels in
both reading and mathematics while non-black students scored significantly
above .state performance levels.
Students attending schools in large cities scored sign-ficantly
below state perforMance levels in both reading- and urthematics at ages 9
and 13. Students attending.schools in urban fringes and medium cities
performed significantly above the state average in reading at age 9, and-
they performed eignificantly- above state averages in both reading and
mathematics -at age 13. Students attending schools in rural areas did
not perform significantly different than the stateaverage at any age
level. .
Students from homes in wh_ch neither parent graduated from high
school performed significantlY below etate levels in reading and mathematics
threc,agee; whereas, students from_ homes in.which.at least one
parent.has-attained education beyond high school graduation performed
9 6
significantly above ate levels in readi and mathematics at all three
ages. Students from homes in which..at least one parent graduated from
high school but _neither parent went beyond high school scored significantly
below state performance levelt-in mathematics at age 13 and significantly
below state performance levels in.reeding dnd mathematica at age-17.-
When there was a limited-availability of reading materials in the
homestudents at all three nges -performed signifii.antly below state
performance levels in-reading and mathematics; and when there was a
wide-range availability, students at all three age levels scored signi-
ficantly above state averages_ in both _subject areas.- Students from
those homes in which there was a medium avail bility performed signifi
-candy below state averages in both- subjeCt areas at ages 13-and 17.
Students :,,--learned. to speak Spanish as a uative -language perform d
significantly below state performance levels in reading and.mathematics
at all thre* ages. Students who did not learn-to speak Spanish before
learning to speak English scored significantly above state perfermance-
levels in reading at all three ages, and-they scored significantly above
state performance levels in mthematics at ages 13 and
9 7
Chapter 4
Overlapathema tics
INTRODUCTION
The analysis presented in this chapter is.concerned with comparing the
performance of 9-, 13-, and 17-year-olds on clusters composed of the same
items administered at more than one age. The data whichare included in
Tables 4.1 through 4-10 will_be described in terns of their educational and
developmental significance, since the primary goal of this analysis- is to-
provide educationally and psychologically meaningful data-about changes in-
performance .from the elementary through the high school levels. Hence,
those findings that-appear to be redundant or that-provide little direct
information about hmportant performance differences will be summarized
briefly and/or included in the appendix sections-of- this report Overlap_
comparisons were made hetween the following age groups: (1) 9-, 13-, and
17-year7oldS; (2) 97 and.13-year-olds; (3) 9-.and- 17-year-olds; and (4) 13--
and 17-year-olds. The reason for making four different age group com-
parisons was that different clusters of identical assessment itemswere
used .for each of- these age groups. However, only the. data .for the 9-, 13-,
and 17-year-old, and 9- and 13-year-old comparisons will be described_ in
this chapter because: (1) tha greatest developmental changes occurred
between ages 9 and 13 years; and (2) these comparisons are similar to the
performance results.that occurred among the other age groups
II. OVERLAP COMPARISONS IN READLNC _
The data in. Table 4.1 show_the average percentage of the lg identical
reading items administered at all 3-age-levels- which were answered-cor-
rectly by the-different reporting groups. The data in Table 4.1 also show
the performance differences between ages 9 and 13.and between.ages 13 and
17. These results are similar to other overlap comparisons which ware made-
-707
9 8
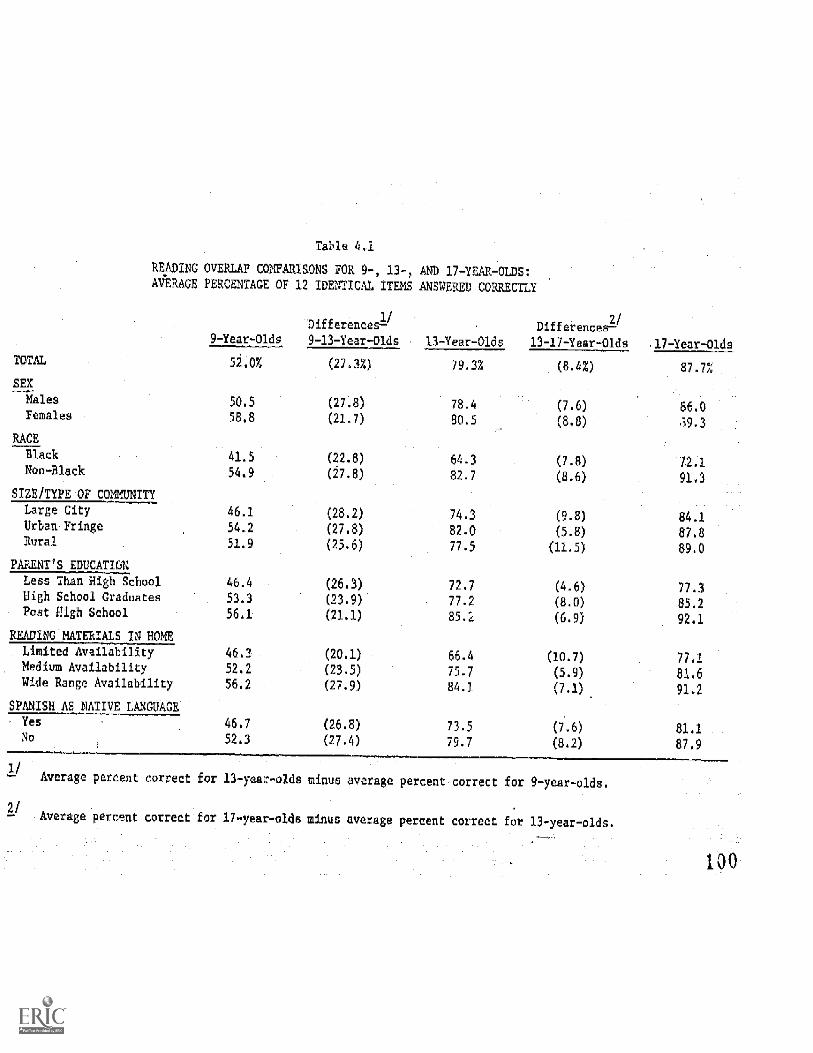
Table 4.1
READING
AVERAGEOVERLAP COMPARISONS FOR 9-, 1 AND 17-YEAR- LDS:
PERCENTAGE OF 12 IDENTICAL ITEMS ANSWERED CORRECTLY'
Differences1//
- Differences=2
9-Year7Olds 9-13-Year-Olds 1 -Year-Olds 13-17-Year-Olds 17-Year-Olds
TOTAL 52.0% (27.3%) 79.3% (8.4%) 87.7%
SEX
Males 50.5 (27.8) 78.4 (7.6) 86.0Females 58.8 (21.7) 80.5 (8.8) .39.3
RACE
Black 41.5 (22.8) 64.3 (7.8) 72.1Non-Black 54.9 (27.8) 82.7 (8.6) 91.3
SIZE/TYPE OF C
Large City 46,1 (28.2) 74.3 (9.8) 84.1Urban Fringe 54.2 (27.8) 82.0 (5.8) 87.8Rural 51.9 (25.6) 77.5 (11.5) 89.0
PARENT'S EDUCATION
Less Than High School 46.4 (26.3) 72.7 (4.6) 77.2High School Graduates 53.3 (23.9) 77.2 (8.0) 85.2Post High School 56.1 (21.1) 85.2 (6.9) 92.1
READING MATERIALS IN HOME
Limited Availability 46.2 (20.1) 66.4 (10.7) 77.1Medium Availability 52.2 (23.5) 75.7 (5.9) 81.6Wide Range Availability 56.2 (27.9) 84.1 (7.1) 91.2
SPANISH AS NATIVE LANGUAGE
Yes 46.7 (26.8) 73.5 (7.6) 81.1No 52.3 (27.4) 79.7 (8.2) 87.9
1/- Average percent correct for 13-year-olds minus average percent correc 9-year-olds.
2/Average percent correct for 17-year-olds m_ us average percent correct for 13-year-olds.
100
in this study for the 9- and 13-year-olds, 9- and 17-year olds, and 13- and
17-year-olds (see Appendix A-4 for these comparisons). It is clear from
this table that the largest changes in performance occurred between ages 9
and 13 and that certain differences between reporting groups appeared which
are generally found in stud-ies making similar comparisons of reading perform-
ance. At each age level the performance differences within sex, race, size
and type of community, parents' education, reading materials in home, and
Spanish as a native language were consistent with the results in Chapter 3.
It appears that the most educationally important findings are concerned
with the Black versus non-black and Spanish as a Native Language comparisons
because these results provide educators with information about the specific
reading and mathematics deficiencies that were found among these groups. The
Black versus non-black results which are presented in Table 4.1 show that the
percentage differences between these groups increased from ages 9 to 17.
The comparisons (in Table 4.1) between children who learned to speak
Spanish as a native language and those who did not show that, although the
former group is consistently lower in performance than the latter group at
all three age levels, relatively small differences exist between these
groups in terms of their average percentage of items answered correctly,
and these differences do not Increase significantly with age. The actual
percentage differences for 9-, 13-, and 17-year-olds were 5.6%, 6.2%, and
6.8X. In contrast, the Black and non-black differences for these age
levels were 13.4%, 18.4%, and 19.2%.
In order to further specify the Black and non-black percentageAiffer-
.ences, comparisons were made between these groups according to the various
reading themes. However, these comparisons are-only-discussed for the 9-
and. 13-year-old overlap data because thiS represents the period during
which the greatest developmental changes occurred in reading performance.
In addition, the-rankings of the themes (in terms of the average percentage-
of items-ans ered correctly) are similar for the 9-, 13-, and 17-year-old
overlaP.comparisons, and far the 13- and 17-year-old overlap compariSons.
Table 4.2 presents the results-of these comparisons, and Table 4.3 shows
the magnitude-of.the Black and non-black differences between the themes.
-72-
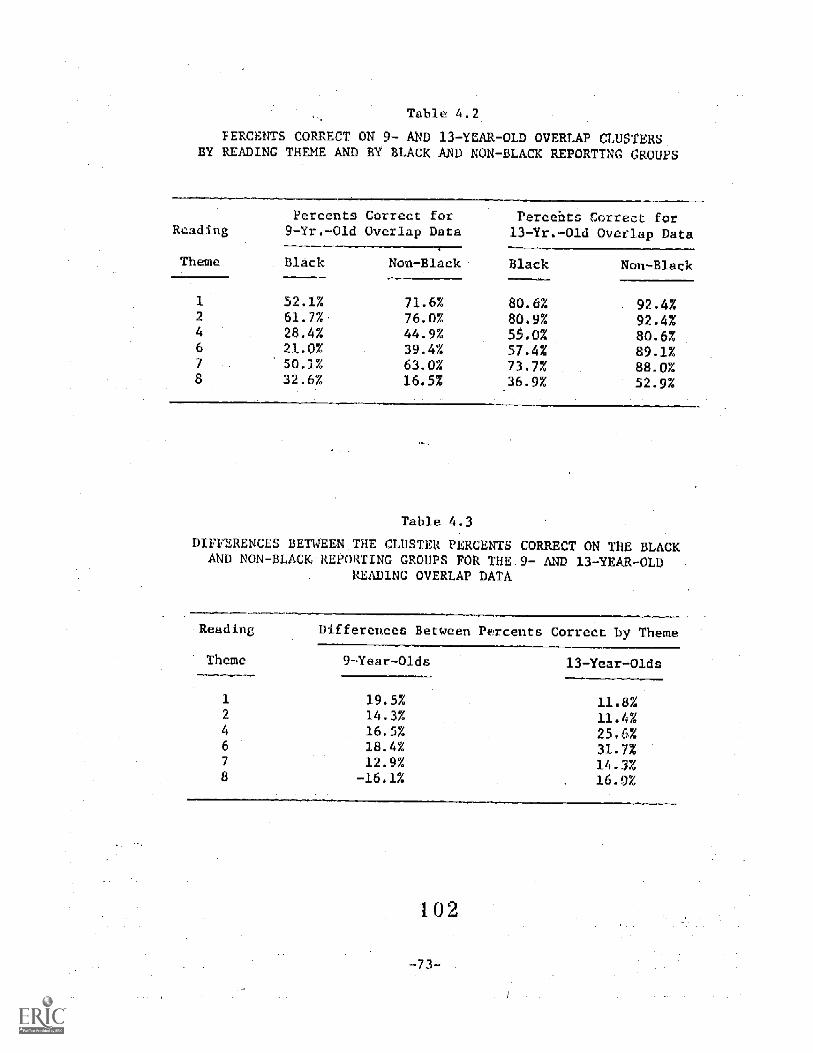
Table 4.2
PERCENTS CORRECT ON 9- AND 13-YEAR-OLD OVERLAP CLUSTERSBY READING THEME AND BY BLACK AND NON-BLACK REPORTING GROUPS
Percents Correct forReading 9-Yr.-Old Overlap Data
Theme Black Non-Black
Percehts Correct for13-Yr.-Old Overlap Data
Black Non-Black
52.1% 71.6% 80.6% 92.4%2 61.7% 76.0% 80.9% 92.4%4 28.4% 44.9% 55.0% 80.6%6 21.0% 39.4% 57.4% 89.1%7 50.1% 63.0% 737%
. 88.0%8 32.6% 16.5% 36.9% 52.9%
Table 4.3
DIFFERENCES BETWEEN THE CLUSTER PERCENTS CORRECT ON THE BLACKAND NON-BLACK:REPORTING GROUPS FOR THE 9- AND 13-YEAR-OLD
READING OVERLAP DATA
Reading
Theme
Differences Between Percents Correct by Theme
9-Year-Olds 137Year-Olds
1 19.5% 11.8%2 14.3% 11.4 16.5% 25.6%
18.4% 31,7%7 12.9% 14.%8 -16.1% 16.0%
102
-73-
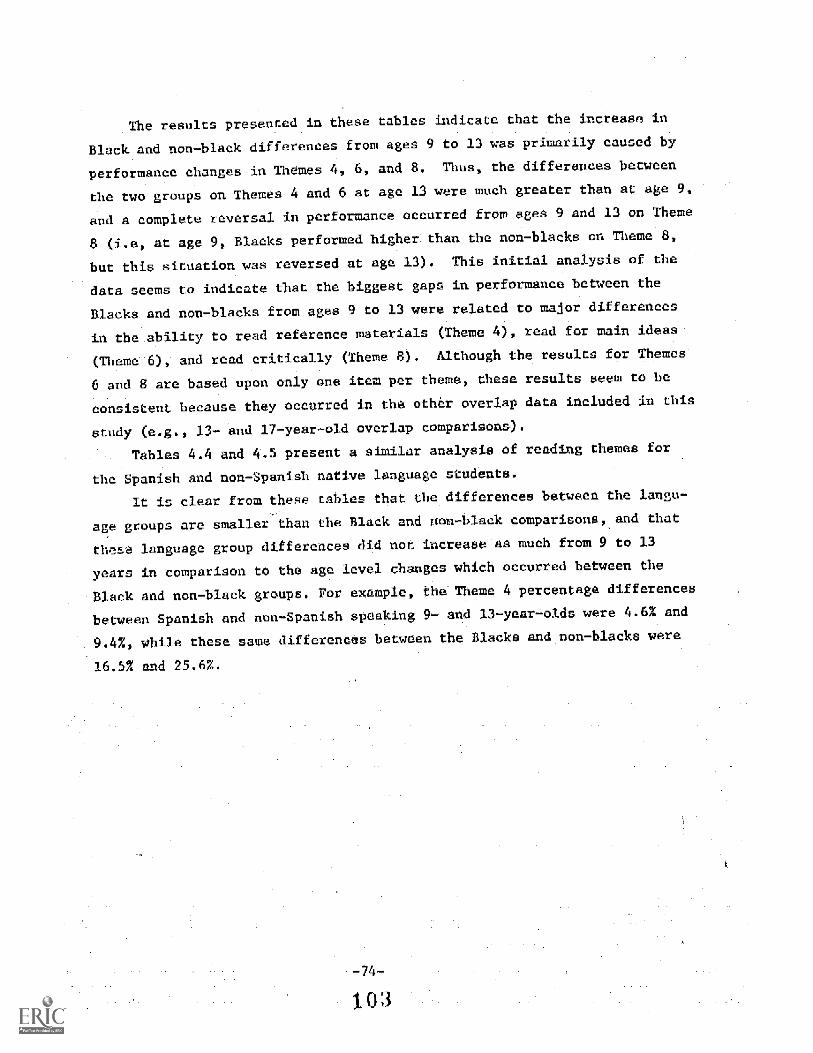
The results presented in these tables indicate that the increase in
Black and non-black differences from ages 9 to 13 was primarily caused by
performance changes in Themes 4, 6, and 8. Thus, the differences between
the two groups on Themes 4 and 6 at age 13 were much greater than at age 9,
and a complete reversal in performance occurred from ages 9 and 13 on Theme
8 (i.e, at age 9, Blacks performed higher than the non-blacks on Theme 8,
but this situation was reversed at age 13). This initial analysis of the
data seems to indicate that the biggest gaps in performance between the
Blacks and non-blacks from ages 9 to 13 were related to major differences
in the ability to read reference materials (Theme 4), read for main ideas
(Theme 6), and read critically (Theme 8). Although the results for Themes
6 and 8 are based upon only one item per theme, these results seem to be
consistent because they occurred in the other overlap data included in this
study (e.g., 13- and 17-year-old overlap comparisons).
Tables 4.4 and 4.5 present a similar analysis of reading t e
the Spanish and non-Spanish native language students
It is clear from these tables that the differences between the langu-
age groups are smaller than the Black and non-black comparisons, and that
theta language group differences did not increase as much from 9 to 13
years in comparison to the age level changes which occurred between the
Black and non-black groups. For example, the Theme 4 percentage differences
between Spanish and non-Spanish speaking 9- and 13-year-o1ds were 4.6% and
9.4%, while these same differences between the Blacks and non-blacks were
16.52 and 25.6%.
-74-
103
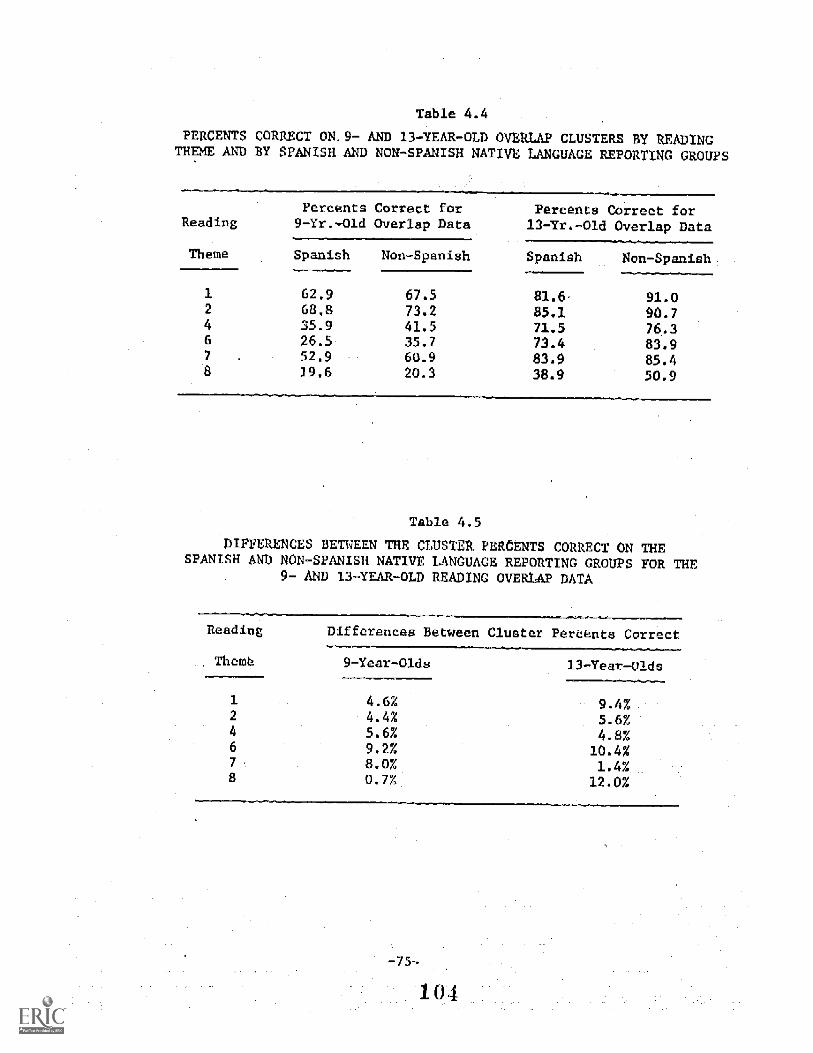
Table 4.4
PERCENTS CORRECT ON.9- AND 13-YEAR-OLD OVERLAP CLUSTERS By READINGTHEME AND BY SPi_VNISH AND NON-SPANISH NATIVE LANGUAGE REPORTING GROUPS
Reading
Theme
Percents Correct for Percents Correct for9-Yr.-Old Overlap Data 13-Yr.-Old Overlap Data
Spanish Non-Spanish Spanish Non-Sp_
1 62.9 67.5 81.6- 91.02 68.8 73.2 85.1 90.74 35.9. 41.5 71.5 76.36 26.5- 35.7 73.4 83.97 52.9 60.9 83.9 85.4
19.6 20.3 38.9 50.9
Table 4.5
DIFFERENCES BETNEEN THE CLUSTER PERCENTS CORRECT ON THESPANISH AND NON-SPANISH NATIVE LANGUAGE REPORTING GROUPS FOR THE
9- AND 13-YEAR-OLD READING OVERIAY DATA
Read Differences Between Cluster Pereents Correct
Theme 9-Year-Olds 13-Year-Ol4s
4.6% 9.4%2 4.4% 5.6%4 5.6% -4.8%6 9.2% 10.4%7 8.0% 1.4%.8 0.7%. 12.0%.
-75-
COARISONS IN MATHEMATICS
The data in Table 4.6 show the average percentage of the 8 identical
mathematics items administered at all 3 age levels, which were answered
correctly by the different reporting groups. The data in Table 4.6 also
show the performance differences between ages 9 and 13 and between ages 13
and 17. As with reading, these results are similar to other overlap compar-
isons which were made in this Study for the 9- and 13-year-olds, 9- and 17-
year-olds, and 13- and 17-year-olds (see Appendix A-4 for these comparitons).
The results in Table 4.6 for mathematics are similar to those presented
in Table 4.1 for reading. Hence, the largest gains in performance occurred
between ages 9 and 13, and at each age level the performance differences
within sex, race, size and type of community, parents' education, reading
materials in home, and Spanish as a native language were consistent with
the results for total reading and total mathematics in Chapter 3.
Again, the Black versus non-black differences increased--from 9.0% at
age 9 to 20.6% at age 17. The size and rate of these increases were greater
for the mathematics items than for the reading items (see Table 4.1), and
these differences between the results suggest that the Black children have
relatively more deficiencies in mathematics than in reading. However, the
Spanish versus non-Spanish language group comparisons for the mathematics
results were similar to those for the reading results; i.e. , the mathematics
differences between these two groups at ages 9 13, and 17 were relatively
small.
An analysis of the mathematics results by objectives is presented in
Table 4.7 for the Black and non-black comparisons, and Table 4.8 shows the
differences for these groups on each objective, using 9- and 13-year-old
overlap data. The reason for reporting the mathematics overlap results by
objectives rather than by content areas is because the former categories
are more similar to the reading themes; i.e., both objectives and themes
represent behavioral indicators of mathematics and reading performance.--1/
1/ Objective 1, recall or recognition of definitions, facts, and ymbols;
Objective 2, perform mathematical manipulations; Objective 3, understand
mathematical concepts and processes; Objective 4, solving mathematical
problems.
105-76-
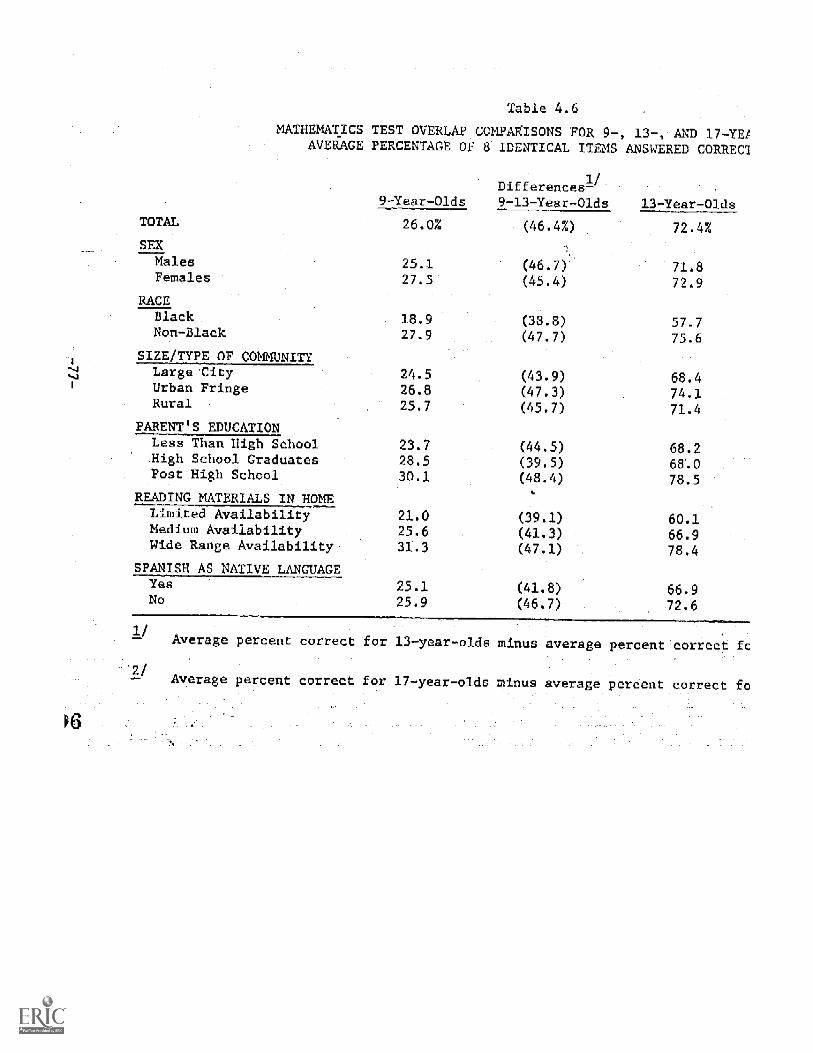
Table 4.6
THEMATICSAVERAGE
TOTAL
SEX
TEST OVERLAP COMPARISONS FOR 9-, 13-, AND 17-YE1PERCENTAGE OF 8 IDENTICAL ITEMS ANSWERED CORREC1
1/Differences
9-YearOlds 9-13-Year-Olds 137Year-Olds
26.0%
25.127.5-
(46.4%)
(46.7)-
(45.4)
72.4%
71.872.9.
MalesFemales
RACEBlack
. 18.9 (38.8) 57.7Non-Black 27.9 (47.-7) 75.6
SIZE/TYPE OF COMMUNITYLarge:City . 24.5 (43.9) -68.4Urban Fringe 26.8 (47.3)- 74.1 .
Rural 25.7 (45.7) 71.4
'S EDUCATION
23.7 (44.5) 68.2ss Than High SchoolHigh School Graduates 28.5 (39.-5) 68.0Post High School 30.1 (48.4) 78.5
READING_MATERIALS IN_HOMELimited.Availability 21.0 (39. ) 60.1Medium Availability
. 25.6 (41. ) 66.9Wide Range Availability 31-.3 (47. ) 78.4
SPANISH AS-NATIVE LANGUAGEYes 25.1 (41.8) 66.9
. No 25.9 (46.7).:
P6
Average percent correct for 13-year-olds minus average percent c
Avera e percent correct fo- 17-year-Olds minus average perc nt correct lc
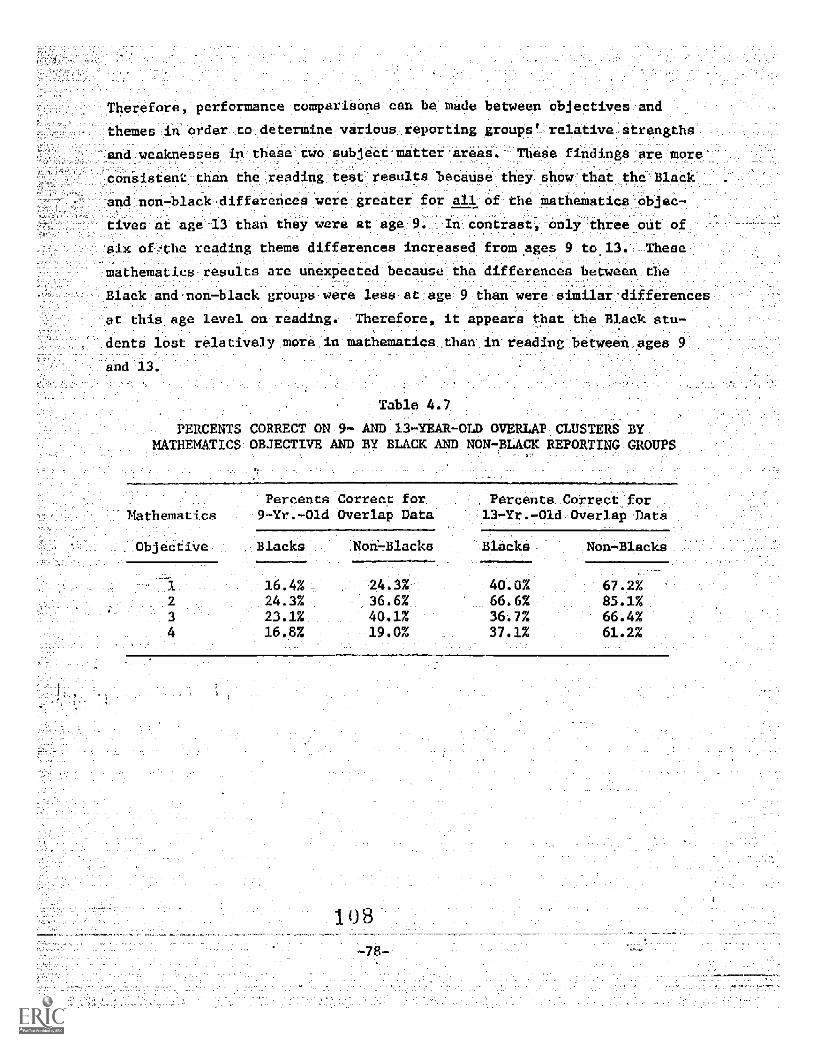
Therefore, performance compariaons:can be made=between objectives and
themes ie'order_to determine various:reporting groups' relative strengths-
and weaknesses kethese two subject matter=areas. These-findings are more:_
consistent:than the reading test resu1ta because_they show that the Black
and non-black differences were greater for ell of the matheMatics objec--
tives at age-13 than-they were at age 9. Incontrast,-only three outiof
six ofthe reading theme differences increased from ages 9 to 13. _These
mathematics results are unexpecte&because the differences between the
Black and non-black gtoupsfwere_less at age 9 than were similar-differences
at thisage leVel onl.reading.: Therefore, it aPpears that the_;Black-stu-
dents lost relatively_more:in mathematics than in-reading:.betweenages
and 1_
= Table 4.7
PERCENTS CORRECT ON AND 13rYEAR-OLD OVERLAP-_CLUBTEES BYMATHEMATICS OBJEQTIVE AND By BLACK AND:NON-BLACK REPORTING:GROUPS
Percents Corree_ for Percents Correct forlathematics 9-Yr.-Old Overlap Data 13-Yr.-Old Overlap Data
bjective Blacks Non-Blacks Blacks Non-Blacks
16.4% 40.0% 67.%%2 24.3% 66.6%--- 85.1%
23.1% -- 40.1% ,36.1% 60.4%16.8% -19.0% 37.1% 61.2%
-78-

Table 4.8
DIFFERENCES BETWEEN THE CLUSTER PERCENTS CORRECT ON THEBLACK AND NON-BLACK REPORTING GROUPS FOR THE 9- AND 13-YEAR-OLD
MATHEMATICS OVERLAP DATA
Mathematics Differences Between Percents Correct by Objective
Objective 9-Year-Olds 3-Year-Olds
...
.7.97.: 27.2%-2 -- 12.3%- 18.6%3. --17.0%.- -29.7%
.
.4-1 2.2% -_ 24.5%-:
The results by mathematics objectives for the Spanish native language com-
parisons are presented in Tables 4.9 and 4.10. The 9-year-old mathematics results
are similar to the reading results for this age level because the group differences
were relatively small in both instances. But the 13-year-old results are differen
because the language group gap was wider for the mathematics objectives_than for
the reading themes. Hence, the average difference between these groups on the
mathematics objectives was 12.0%, and it was 7.2%_on the reading themes.
Table 4.9
PERCENTS CORRECT ON 9- AND 3-YEAR-OLD OVERLAP CLUSTERS BY MATHEMATICSOBJECTIVE AND BY SPANISH AND NON-SPANISH NATIVE LANGUAGE REPORTING GROUPS
Percents Correct for Percents:CorrectjorMathematics Ovetlap Data 137Yr.701d OverlaPJ)ate,
Objective Spanish Non-Spanish _Spani h Non-Spanish
20.5% 22.6%30.9% 33.8% 76.6%28.1%. 36.7% 43.9%
.81.9%-61.5%. .
13.9%. 18.8% 57-.3%
-79-
109
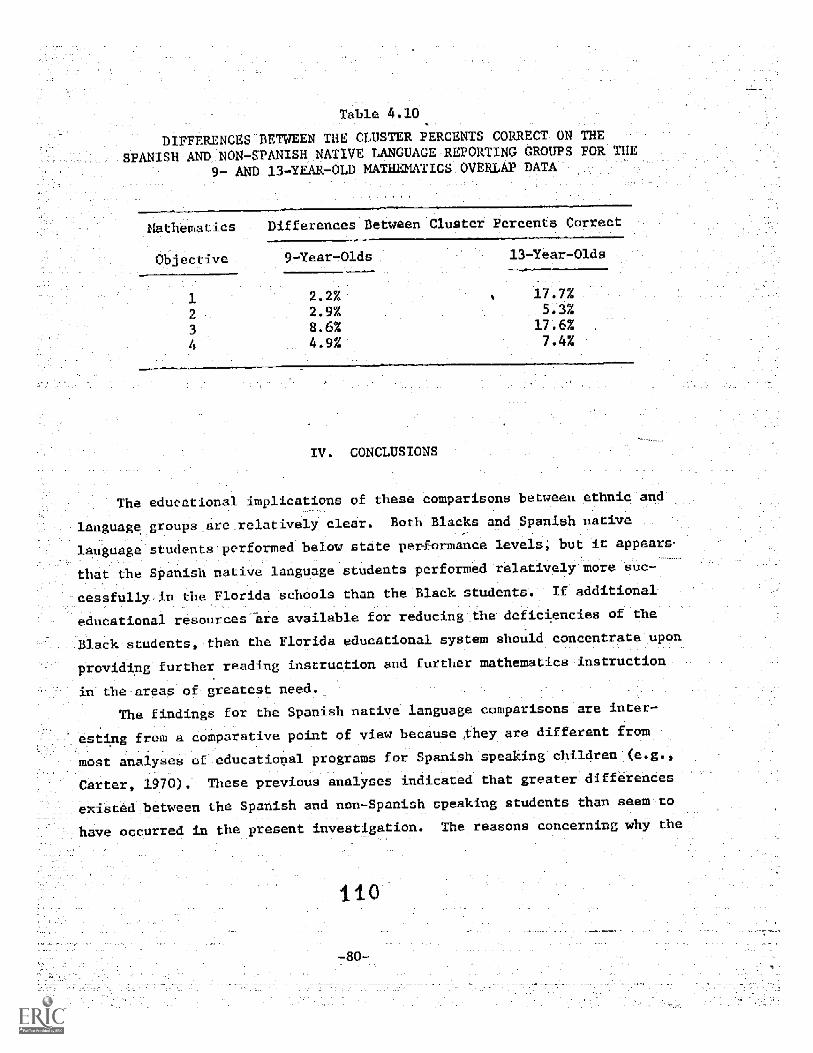
Table 4.10
DIFFERENCES BETWEEN THE CLUSTER PERCENTS CORRECT ON TTE
SPANISH AND NON-SPANISH NATIVE LANGUAGE REPORTING GROUPS FOR THE
9- AND 13-YEAlt-OLD MATHEMATICS OVERLAP DATA
Mathematics Differences Between Cluster Percents Correct
Objective 9-Year-Olds 13-Year-Olds
1 2.2%- 17.7%.
2- - 2.9% 5...3%
3- 8.6% 17.6%
4.9% . 7.4%
IV. CONCLUSIONS
The educational implications of these comparisons between ethnic and
language groups are_relatively clear. Both Blacks and Spanish native-
language studentsperformed below state performance levels; but it appears-
that the Spanish native language students performed relatively more auc-
cessfully-in the Florida -schools than the Black students. If additional
edudational resources are available for reducingthe deficiencies of the
:Black:students, then the Florida educational system should concentrate upon
,providing further reading instruction and further mathematics instruction
in- the areas of g eatest need.
The findings for the Spanish native language comparisons are inter-
esting from a comparative point of view because they are different from
most analyses of eduoational programs for Spanish speaking children (e.g.,
Carter, 1970). These previous analyses indicated that greater differenOes
exiatedbetween the Spanish and non-Spanish speaking students than secmto
have occurred in the present investigation. The reasons concerning why the
Spanish speaking children lost more ground in mathema ics at age 13 than
reading are presently unclear. It is possible that these children may::
attempt to solve mathematics problems in _their native4anguage, thuscreating
s language barrier to solving these problems,when they.are presented in.:,
appears that studies of the children's problem solving behavior,
might be conducted in order to determine what:remedial steps are necessary
in order to reduce these deficiencies in mathematics performance.-
Chapter 5
Versus National Assessmen Com arleons
INTRODUCTION
CSE-r1P2LASSus,This chapter contras s the reading and mathematics performance of
Florida 9-, 13-, and 17-year-old students with the performance of students
the 'Nation and the Southeast Region of the U.S.11 on items from the
National Assessment of Educational Progress (NAEP). At each age-level
groups of Florida students are also compared to the corresponding groups2
following comparisons:of students assessed in NAEP, yielding t
Comparisons by Sex
Florida males versus U .5 males
b. Florida females versus U.S. females
Co parisons.by Race
Florida necks versus U.S. Blacka
Florida non-blacks versus U.S. non-hlacks
Comparisons by Level of Parents
Florida less-than hi h school
-hig1L2211(22) _graduate, For thi
graduated from high school.
Florida h h sohool raduate versus U.S. hi-1_32,01.arp.For this group at least one parent has:graduated fram-
:high school, but neither parent has any formal education
after high school.
versus U.S. less than
s group neither parent has
The states of NAEP's Southeast Region are:the same as those_used by
theOffice of Businese Economics, Department ef Commerce; Arkansas, Florida,
Virginia.-West Virginia Alabama, Georgia, Kentudky, Louisiana, Mississippi,
North Carolina, South Carolina, and Tennessee.
2/ More detailed definitions of the repo
Appendix A-1.
-oups Are presented in
Florida post high school versus U.S. post high school
For this group at least one parent has some forMal education
beyond high school, which may include business, professional,
or vocational training as well as college or university
education.
Comparisons by Size and Type.of Community
Florida large_city versus U.S. large ci y'
Florida urban fringe_ and medium city versus U.S.
and_medium city
Florida rural versus U.S
These comparisons are made in order to determine the extent of differ-
&Ices in performance between groups of Flor_da students and corresponding
groups of students in the Nation in reading and mathematics. Although this
analysis cannot determine the_causes of such performance differences, _t
can point to specific groups of students at each ago level whose performance
differs significantly in comparison to corresponding national groups; and
it can point to-s!)ecific areas of reading and ulthematics where statistically
ignificant performance differences exist between Florida students and those
the Nation and the Southeast.
Interpreting_the Reading and Mathematics Results
The tables in this chapter show the differences bet een Florida students
and the Nation's students, between Florida students and students in the South-
east, and betWaen groups of Florida students and corresponding groups of
students in the Nation, across all reading items and ail mathematics Ile= .at
each age level.- These differences, or group effects, were calculated by sub-.
tracting the average perdent of items answered correctly by the National group
from that of the corresponding Florida group. An-effect (or difference) was
labeled statistically significant (at the .05 level of confidence) if it was at
113
arge as:its associated standard'error-. In the tables.-
this-chapter otatistical.significance is-denoted hy.an asteriak to...
h ight of the effect. Thus, a negative group effect with an asterisk
indicates that Florida students in a particular group performed significantly
below students in the corresponding National group, while a positive
grou0-effect with,an asterisk indicates:that students-in a-Florida
significantly outperformed their-National. peers.
ome rather-large effects.-are sometimes not statisticallY sighi-
ficant,.while some rather--small effects-are in some instances statistically
-significant.. .This.is,due to the.faet that_statistical-aignificance ie..-
-determined,bythe ratio of the effect to ita standard-error.: In-general,-
items-that'are.of medium diffieultyand based-upon-small. samples have.-
-large standard errors,'while extremely- hard-or.extremely-easy Items
are based upon large samples have smaller standard errors
standard errors are used to ealculate standard errors for the average'
percents items answered correetly. If a standard error_ assodiated
h an effect is very large, even a largeeffect may not be statistically
icant. On the other hand,- if a standard error of an effect-is
very small, a small effect may be statistically significant.:
The tables in'Appendix A-5-present differences between Florida
-students and the Nation's students and:between Florida students and_ _
Southeast students for each reading-theme-and-each mathematics content
area. ,The differences and statistical significances in the-tables In
Appendix A-5 were calculated as they were for the tables in this chapter.
The National .ssessment multiple matrix sample design provided forthe administration of some items to the same students during NAEP adminis-tration, while other items were administered to different students fromothttr independent probability samples. Data were not available tromNAEP to precisely compute standard errors for the average percents ofitems enswered correctly, taking into account all covariance comPonentsassociated with the NAEP matrix sample design. RT1 calculated.thestatiStical significance assuming minimal effects of covariance andestimated the statistical significance assuming large covariance effects.Those differences which exhibited statistical :-_gnificance assumingminimal effects of covariance on NA.E. items but which did not exhibitstatistical significance assuming large effects of covariance on NAEPitems are footnoted in the tables.
The reader should be cautious in interpreting the-results. -The NAEF
ding, performance data were collected:in 1970-71,,and the-NAEP mathe-.
matics performance data were collected in 1972-73; both-the reading and
mathematics performance data for Florida were collected in 1974-75.--- It
is possible that the timsfactor has affected the results in some unknown
way; for:example, if National reeding performance has decreased since
1970-71, Florida would be doing relatively better than these reading resul_
suggest. NAEP has not yet reported results on second cycles inireading :
_
or Mathematics; therefore, it is not possible to precisely determine the
effects of time on reading_or mathematics performance.11
Both NAEP and Florida report reeults for 9-, and
and the grade distributions of these ptudents vary for the
Florida samples. These varying grade distributions affept
17-yeareolds,
National and
assessment
results1 as evidenced in assessment studies conducted for the Nation and
other states; at all three age levels students who are in higher grades
perform substantially better than those who are in lower grades. Table
5.1 shows the approximate percentages of 13-, and 17,-year-o1ds in
the various grades for the National Assessment and for the Florida
replication In:general, Florida students at each age level have had a -
little more schooling than stpdents across,the Nation, with this differ-
ence in the amount of schooling decreasing as age increases.
11 NAEP has reported preliminary results for a small subset of 1970-7reading exercises measuring functional literacy skills at the 17-year-old age level. On these 64 items, which were administered during NAEP's1973-74 assessment, the' average percent correct did increase by abouttwo percent. Since these items were a special subset of items whichmeasure functional literacy and which are generally easier than theentire set of reading items, and since National Assessment has not yetreported standard errors and statistical significance for the comparisons,it is not possible to precisely determine the effects of time on 17-year-old reading performance. The results of this study are availablein Right to Read: Functional Literac - Basic Readin Performance--Technical Summary,-The National Assessment of Educational Progress,Denver, Colorado, 1975.
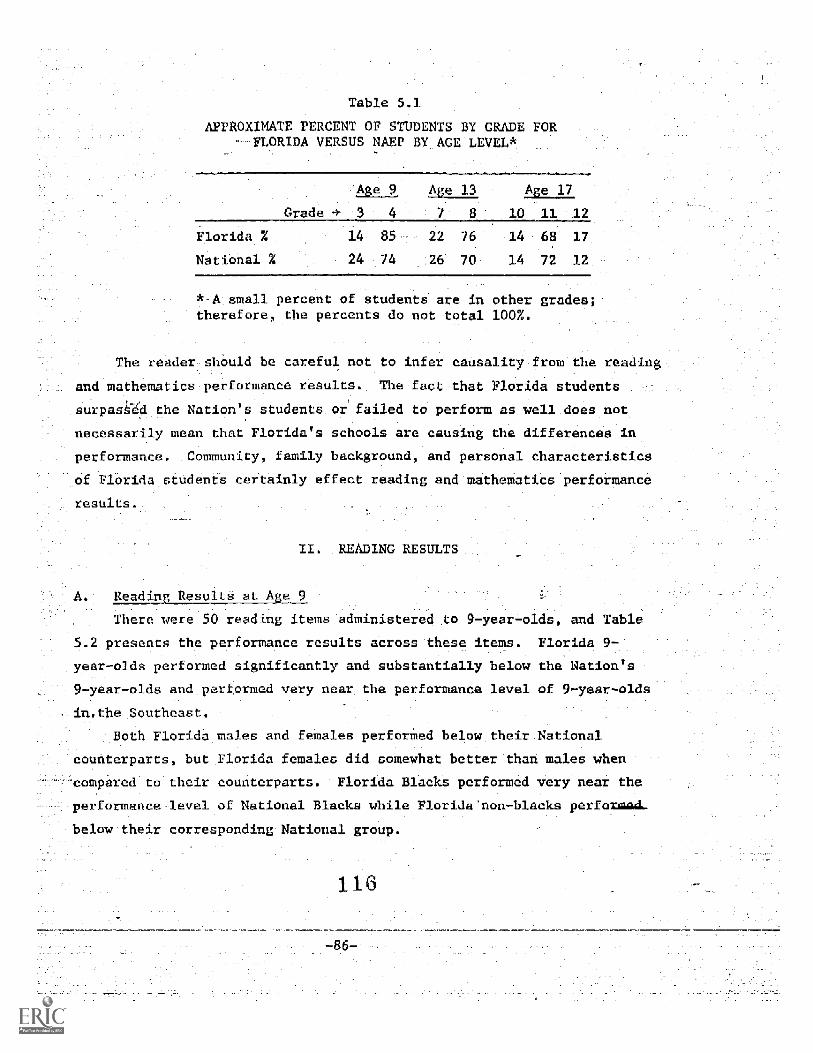
Table 5.1
APPROXIMATE PERCENT OF STUDENTS BY GRADE FOR--FLORIDA VERSUS NAEP BY AGE LEVEL*
Age 9 Agf_11 Age 17
4 7 8 10 11 12
Florida % 14 85 22 76 14
National % 24 74 26 70 14
*-A-.small percent of students' are-in other grades?therefore, the percents do:not to al 100%.
The reader should be careful not to infer causality from the reading
and mathematics performance results. The fact that Florida students
surpaseA the Nation's students or failed to perform as well does not
necessarily mean that Florida's schools are causing the differences in
performance. Community, family background, and personal characteristics
of Florida students certainly effect reading and mathematics performance
results.
II. READING RESULTS
1.1tTlja
There were 50 reading items administered to 9-year-olds, and Table
.5.2 presents the performance results across these items. Florida 9-
year-olds performed significantly and subst ntially below the Nation s
9-year-olds and performed very near the per ormance level of 9-year-olds
,in.the Southeast.
:.Both Florida males and females perforated belowtheirNational
counterparts, but Florida females did somewhat better thah males when
-compared to their counterparts. Florida Blacks performed very near tbe
performance-level of National Blacks while Florida'non-blacks performad.
below their corresponding National group.
116
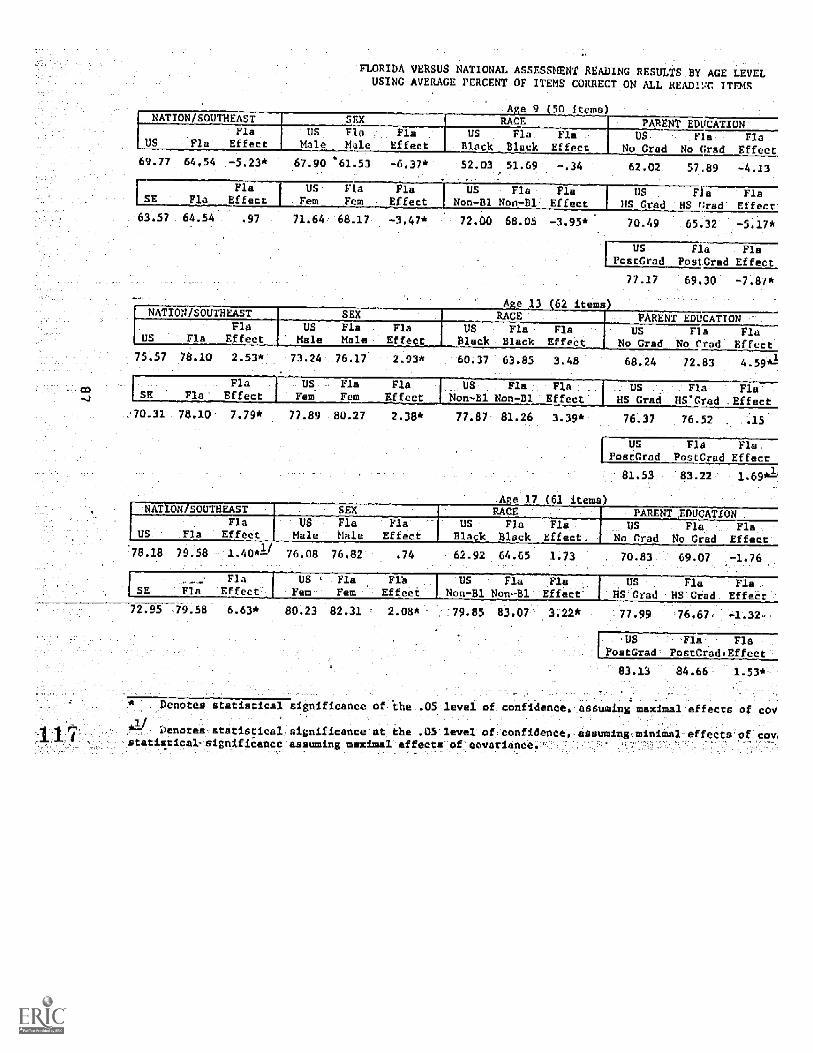
FLORIDA VERSUS NATIONAL ASSESSMENT READING RESU1TS BY AGE LEVELUSING AVERAGE PERCENT OF ITEMS CORRECT ON AIL READING ITEMS
_i_tema)NATION/SOUTHEAST _SEX RACE PARENT EDUCATI N
FlaUS _Fla Effec
S
eFlaMile
FlaEffect
US
BlackFla
BlackFla
-_Effect
US Fla Fla-
Grad No Grad :Effect69.77 64.54 -5.23* 67.90 61.53 -6.37* 52.03:: 51.69
FlaSE Fla_ Eff cc
US- Fla PieEffect Non-Ell Non-131
63.57 64.54 .97 71.64 68.17 -3.47*
_ a
Effect_
72.00 68.05 -3.95*
A e 13
62.-02 57.89 -4.13
US Fla FlaHS Grad HS Grad Effect
70.49 65.32 -5.37*
62 items)
US Fla, FlaPcstGrad PostCrad Effect
77.17 69.30 -7.87*
NATION1SOUTREAST SEXFla US Fla Fla
Fla Effect Male Male Effect
78.10 2.53* 73.24 76.17 2.93*75.57
SE Fla= Effect
=70.31 78.10 7.79*
a tiarn Effect
77.89 -80.27 2.38*
RACE .
US Fla FlaBlack' lack Effect
60.37 63.85
PARENT EDUCAT ON:-US Fla
_: Grad No Grad E
a
77.87 81.26 3.39*
NATIO STFla
Effccc78.18 79.58
A e 17 .(61 item
68.24 72.83
. USS Grad HS
4.59*-
F a_ad ,Effect
76.37 76.52 .15
US Fla Fla:_PostGrad PostGrad_Effect
53 83,22 1.69*1'
ARENT EDUCATIONUS aale Male E__
76.08 76.82 .74
Fla :Flact Black Black Ef
-- 62.92. -64.65 1.7
Pie , FlaNo _ ad No Grad 'Effect
70.83 69.07 -1.76
Fla US PieSE Fla Effect Fern Fem
72.95 79.58 6.63* 80.23 82.31 ---,
-1
Deno e cal significance o_
Fla US Fla Flafact Non-ill Non-ill Effect
2.08* :79. 5 83.07 3;22*
.05 level confidence,
i'enotes statiatical significance at the .05-levelHof confidencestical- assuming maximal-effects-of-covariance.'
_ -. _
US Fla FlaHS Grad_ HS Grad Effect
77.99 76.67, -1.32-
US El.a FlaPostGrad'_PastGrad.Effect
84.66- 1.53*--:
7 -
ing maximal effects
ing-rniniwal-
COV
teima.of parent education- levels, both the "high school graduate"
group. and the "post high school graduate-. groUp performed 81gnifintly
and SubstantiallT.below corresponding National group-s.: and
"type of-community groups performed well'helow their- National. counterparts.
--Appendix-A-1 materials.show that.Florida.studente performed signifi--..
cantly below the Nation en- all:eight reading-themes except. Themes 2 and_5
Visual Aids-and Significant Facts).- -Compared to students-in-the Southeast,
Florida. .9-year-olds performed significantly better sniTheme '2 (Visual Aids)
-.anclsignificantly worse.on.TheMe 4 (Reference MAterials).
Reading-llesults:at-Age-13
There were 62 ieading items administered to 13-year-olds, and Table
5.2 presents the performance resu ts across these items. Florida 13-
:yearroldsperformed significantly above the Nation's 13-year-olds, _and
they performed significantly and substantially above the Southeast.
Both Florida males and females performed above their National
Counterparts, Florida non-blacks performed above non-blacks in the:
Nation; whila-Florida Blacks did riot perform significantly:different
than National Blacks.
In terms of parent education levels, both the "less than high
school graduate" group and the "post high school graduate" group performed
somewhat above the corresponding National groups. In the size and type
of community classifications, only students in the Florida "urban fringe
and medium city" group performed significantly differnt than their
National counterparts, performing above the National group.
Appendix A-1 materials show that Florida students performed signifi-
antly above die Nation on Reading Themes 2, 3, and 7 (Visual Aids, Follow-
ing Directions, and Drawing Inferences). Compared to students in the
Southeast, Florida 13-year-olds performed significantly and substantially
better on all reading themes except Theme 1 (Word Meanings).
Reading Results at Age 17
There were 61 reading items administered to 17-year-olds, and Table 5.2
presents the performance results across these items. Fl ride 17-year-olds
77-
performed sign_ficantly above-theiNation's 17-year-olds
and substantially above 17-year-olds in the Southeas
Florida females did relatively betterTthan males:
a d signif cantly
the 17-year-o d
comparisons as they performed significantly better than females in the
Nation while Florida males performed near the average lor the Nation's
males. Florida Blacks performed near the performance level Of:National
Blacks while Florida non-blacks performed significantly better than
their National peers.
In terms of parent education levels the "post high school graduate"
group performed significantly above their National peers, while the
other two groups did not perform different than their corresponding
National groups. Among the size and type of community groups the Florida
rural group performed significantly above National rural students and
the other two groups performed near the performance levels of the corre-.
sponding National groups.
Appendix A-1 materials show that Florida 17-year-olds performed
gnificantly above the Nation on Reading Themes 2 and 3 (Visual Aids
and Following Directions). Compa ed to the Southeast, Florida students
performed significantly better on all themes except Theme 1 (Word Meanings).
III. MATHEMATICS RESULTS
Results at ARtA
There were 55 math items admin stered to 9-year-olds, and Table 5.3
presents the performance results across these items Florida 9-year-
olds performed significantly below the Nation's 9-year-olds, and they
performed significantly above their Counterparts in the Southeast
Both Florida males and females performed significantly below their
National counterparts. Florida Blacks performed near the average for Nati nal
Blacks while Florida non-blacks performed significantly below their
National peers.
In terms of parent education levels, all three reporting groups
performed significantly below corresponding National groups with the
120
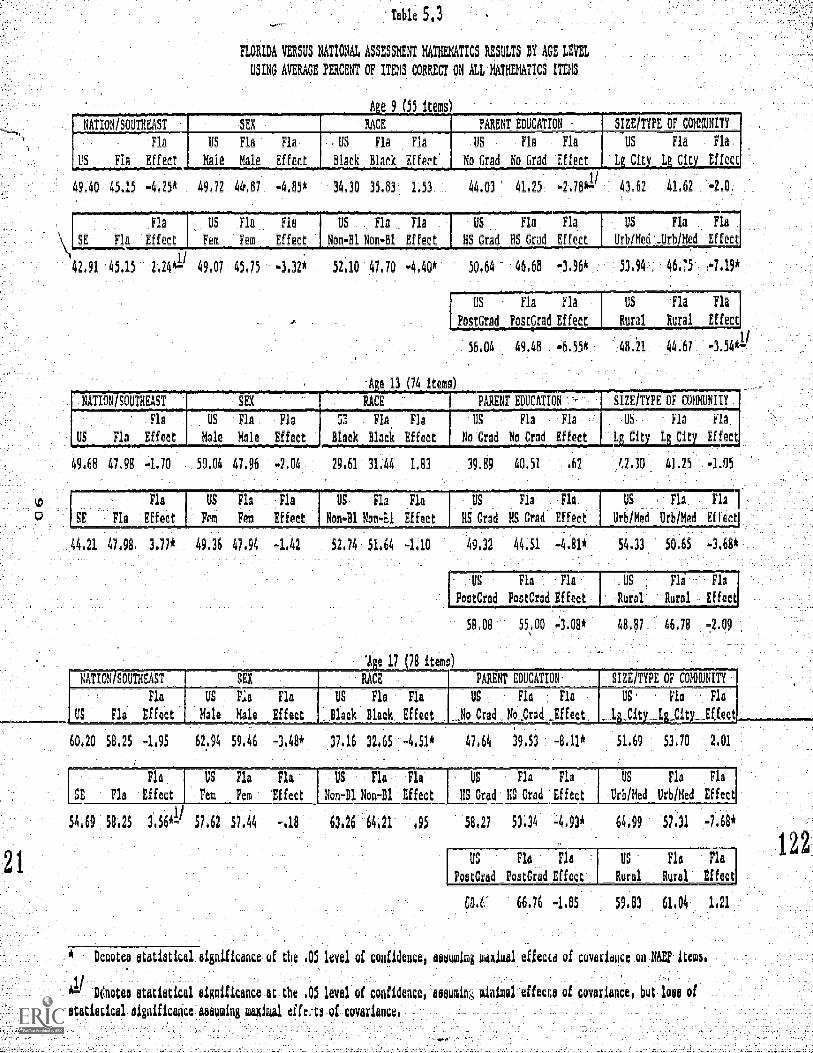
Table 5,3
FLORIDA VERSUS NATIONAL ASSESSMENT MATHEMATICS RESULTS BY AGE LEVEL
USING AVERAGE PERCENT OF ITEMS CORRECT ON ALL MATHEMATICS ITEMS.
A e 9 55 items
NATION/SOUTHEAST SEX RACE PARENTIDUCATION I E/TYPE OF COMNUNITY
F14
US Fin E fect
US Fin Fla
Male Male E f ct
US Fla Fla
Black Black Effect'
: US Fla Fla
No N4 No Grad ±Effect
US Fla Fla .
g City_ Lg City Effect
49.40 45,1 4,25* 49,72 0,07 -4,55* 34.30 35.53 1.53 44.03 41,25: -2.-
Fln US FI4 Fl US Fla Fla US Fla Fla US Fla FIT]
SE Fla Effect Fem Fem Effect $04-81 Non-Bl Effect HS Grad= HS Grad Effect Urb/Med:,Mrb/Med Effect
42 91 45.15 2i24*= 49.07 45.75 -3.32* 52.10 47.70 -4.40* 50.64 46,65 =3.96* r 53.94 40 *
US Fla Fla
ostCrad PostGrad Effect
US 314 T14
Rural Rural Effect
56.04 49.45 4.55* 45.21 44.67 -3.54*11
A e 13 (74 items)
NATION1SOUTHEAST s RACE PARENT E UCATIO Sl2E/TYPE OF COMMUNITY
Fla
US Fin _Effect
US Fla . Fla
Male Mal.e Eff.ect_
2 F a Fla
_Blacic Blaci Effect
-US Fla Fla
No Grad No Gr d Effect
US Fla .Fla
Lg City Lg City Effect
49. 8 47.98 -1.70 50.04 47.96 -2.04 29.61 31.44 1.83 39.89 40.51 .62 ',2.30 41.25
Fla US Fin la US Fla Fid US
E Fla Effect Fem Fem Effect_ Non.Bl Nan.E1 Effect H
Fls Fla
d HS Grad Effect'
-135
US ,Fla Fla 1
Urb/Med Urb/Med Effect
44..21 47.90, 3.77* 49.36 47.94 -1.42 52.74 51.64 -1.40 49 32 44.51 -4.81* 54.33 _50.65 -3.68* :
I
Fla F_ US Fla Fla
Foatcrod_ FostGrad Effect Rural: Rural Effect
-US ,i58,08 55,.00 .3:08* 48.87 i 46.78 -.2.09
NATI MOUTHEAST RACE PARENT EDUCATION SIZE/TYPE OF COMMUNITY
Fla
US Fla Effect
US Fla Fla
Male Male Effect
US Fla Fin
Jlack Black Effect_
US Fla FI4
'o Crad No Grad Effect
US' Fla '.' Fla
Lg City..lig,City Effect
21
4.95 62.94 59,46 -3.45*. 37.16 32.65 ...4.51.* 47.64 39.53 =5.11* 51,69
Fla US Fin FA. : US Fla .Fla US Fla F a US . Fla Fla
SE_ ._Fla Effect Fem Fern lffect Non-51 Non-Bi Effect HS Gr_d: HS Grad -Effect Urb/Med Urb/Med Effect
54,69 58..25 3.56*- 57 62 57.44 -.18 63.26 64.21 .95 58.27 53.34 -4.93* 64.99 57.31 -7.68*
US Fla Fla
FoatGrad PostGrsd Effect
-1/i= Unetes statistical significance at the .05 level of confiden
'Oat ideal gignificance:aasuming maximal effe,tsi)lcovarianc6
ceatea nini
-1.85
UT Fla Fla
Rural Rural Effect
59.83 61,04 1,21
ce of.the .05 level of confidonce aeaUmimg maximal effecta of covarince on NAEP. items
iesumin6 minimal'effecce of covariance but 140 of
"post high school" group performing substantially below their National:
peers Florida's "large city" students performed near the performance level
of their National peers; Florida "rurar-students performed significantly
below the torresponding size and type of community group nationally; and
the Florida "urban fringe and medium city" group performed significantly
and substantially below the corresponding National group.
Appendix A-1 materials show that Florida 9-year-olds performed
significantly below the Nation in all.seVen Mathematics Content Areas
measured with the exception of Content Area H (Equations ). Compared
to students in the Southeast, Florida 9-year-olds performed better on
Content Areas H, K, and Q (Equations, Geometry, and Graphs).
B. Mathematics Results_ at Age 13
There were 74 math items administered to 13-year-olds, and Table
5.3 presents the performance results across these items. Florida 13-
year-olds performed similar to their National peers, and they performed
significantly above their counterparts in the Southeast.
Florida males and females did not perform- significantly different.
In terms- of parent education levels, the Florida "less than high school
_.graduate" group performed near the average for their National counterparts
while students from the "high school graduate" and the "post high idhool
graduate" groups performed significantly below corresponding National
groups.
-In-the.size and type of community categories, the Florida "urban
fringe and medium city" group performed significantly below-their National
counterparts while the other groupa did not perform significantly different
.than corresponding National groups.
Appendix A-1 materials show that Florida 13-year-olda pc_ ormed
ignificantly below the Nation on Mathematics Content.Areas B, E, and .K
(Properties of Numbers, Estimation, and Geometry) whilenot performing
Note that Content Area H (Equations ) contains only two items at the9-°year-old level.
-91-
123

significantly different than the Nation on e other 10 content areas
measured at_age 13. Compared to students in the Southeast, Florida 13-
year-olds performed significantly better on Mathematics Content Areas A,
C, D, F, G, H, J, and Q (Number Concepts, Computation, Sets, Exponent
and Logarithms -Algebra, Equations, Probability, and_Geometry).1
C. Mathematics Results a Ae 17
There were 78 math items administe ed to 17-year-olds and Table
presents the performance results across these items. Florida 17-year-
olds did not perform significantly different than their National peers,
but they did perform significantly above their Southeastern counterparts.
Florida males performed significantly below National males, while
Florida females performed very near the performance level of females in
the Nation. Florida Blacks performed significantly be1oW National
Blacks, while non-blacks in Florida did not perform significantly d f erent
than their National counterparts.
In terms of parent education levels, students in Florida's "less
than high schoel graduate" group performed significantly and substantially
below their National peers; students-in Florida's "-nth hi31:graduaf-d"
group performed 0.gnifieantly below their National counterparts; and
students in the "post high school" group performed near the average of
students in tbe corresponding National group. Students in the "urban
fringe and medium city" group performed cignificantly and substantially
below their National peers, while students in other size and type of
community groups did not perform significantly different than students
in their corresponding National groups.
. Appendix materials show that Florida 17-year-olds performed
significantly below the Nation in Mathematics Content Areas A, B, and K.
(Number Concepts-, Properties of Numbers, and Geometry) while not performing
significantly different than the Nation on the other 11 content areas
1 Note that Content Area G (Algebr,.) contains only two items at the
13-year-old level.
124
measured at age 17. Compared to the Southeast, Florida students performed
significantly better on Content Areas E, G, H, I, N, and Q (Estimation,
Algebra, Equations, Functions Logic, and Graphs).1 /
IV. SUMMARY OF FLORIDA VERSUS NAEP CONPARISONS
A. SuMmary of Reading Compsrisons
Compared to the Nation, Florida students performed significantly
below their National-peers at'Age 9 but significantly above them at ages
13 and 17. Compared to students in the Southeast, Florida students
performed similar to them at age 9 but significantly and substantially
above them at ages 13 and 17.
Compared to their National peers, Florida males performed significantly
and substantially below them at age 9 significantly above them at age
13, and very much like them at age 17. Florida fema es performed significantly
below their National counterparts at age 9, and significantly above them
t ages 13 and 37. Florida Blacks did not perform significantly different
than National Blacks at any age level, while Florida non-blacks performed
significantly_below_students_ia_the_corresponding_National_gronp_at_age
9-but significantly above them at ages 13 and 17. In terms of both
parental education level and size and type of community, relative performance
of the reporting groups was very inconsistent across age levels.
In terms of reading content, Florida students surpassed their
National and Southeastern counterparts most consistently in Reading
Themes 2 and 3 (Visual Aids and Following D rections).
B.' SUmmaa_21_ Mathematics Comparisona
Compared to the Nation, Florida students p_ med significantly
below their National peers at age 9 and similar t_ their National peers
at ages 13 and 17. Florida students at all three age levels performed
significantly aboVe their counterparts in the Southeast.
Note that Content Areas I (Functions) and N (Log contain only twoitems at the 17-year-old level.
125
Compared to their National counterparts, Florida males performed
significantly below them at ages 9 and 17, and the performance levels
did not differ significantly at age 13. Florida females performed
significantly below their National peers at age 9, and the performance
levels did not differ significantly at ages 13 and 17. Florida Blacks
did not perform significantly different than National Blacks at ages 9
and 13, but they did perform significantly below National Blacks at age
17. Florida non-blacks performed significantly below their National
counterparts at age 9, but they did not perform significantly different
than National non-blacks at ages 13 and 17.
In terms of parental education classifications, the "high school
graduate" group performed significantly below their National peers at
every age level, while the performance of the other two groups was more
inconsistent. Within the size and type of community classifications,
Florida's "urban fringe and medium city" students consistently performed
well below their National peers.
In terms of mathematics content, Florida students appeared to have
the most consiotent trouble with Ma1PPmatics Content Areas B and K
Properties of Numbers and GeometrY).
Append ix 1
Description of Reporting VarIables and Re ortin Grou s
952 7
1:_!3c21..p_tion of IRp-styariablfs 4nd_ Report4ng Group
1. Sex
a. Data Source: Student Questionnaire Item No. 1.
b. Two Reporting Groups:
1) Male
2) Female
Race
a. Data Source: Response Code on Reading Assessment Booklet Cover.
b. Two Reporting Groups:
1) Black
2) Non7black
a. Description: Size and Type of Communi y refers to the size and
type of community in which the student attends school. Each:
student's classification was determined using the principal's
report of the percentages of enrolled students living in areas
with certain population sizes and the percentages of enrolled
students having parents in certain occupational categories.
Data Source: School Questionnaire Items No. 2 and No.
1/Three Reporting Groups:
1
1) Large City--This group represents students attending schools
in a city area with a populatfon of 200,000 or more, with a
high proportion of adults not regularly employed or on
welfare, and with a low proportion of adults employed in
professional or managerial positions.
1/The definitions for the three reporting groups are overviews of the
more detailed definitions which are available from the Florida Departmentof Education.
128
Urban Fringe and Medium City--This group represents students
attending schools in a within-city or near-city area with
a population of 25,000 or more, with a high proportion of
adults employed in professional and managerial positions,
and with a low proportion of adults employed in factories
and in agriculture.
3) Rural--This group represents students attending schools in
a rural area with a population of less'than 25,000, with a
high proportion of adults employed in factories-and in Agri-
culture, and with a low proportion of adults employed in
professional and managerial positions.-
4 Parents' _Education
a. Description: 'Parents' Education refers to the highest educational
level attained by either parent.
Data source: Student Questionnaire Items No. 6 -nd No. 7.
Four Reporting Groups:
1) Less than High School--This grouP rep;resents students who e
parents did not complete the eigth grade, students whose
parents-completed-the eigth--rade-but-did-not-go to-high
school, and students whose parents-went to high school
hut did not graduate.
High School Graduate-This group represents students having
at least one parent who had graduated from high school
Post High SchoolThis group represents students having at
least one parent who had some education after'graduation
from high school.
4) Unknown-- This groUp represents students who did not respond
to or who responded "I don't know" to either of the two
Student Questionnaire items.
-Reading Materials in Home
a. Description: Reading Materiale in Home refers to the availability
of four different types of reading materials found in the student's
home: newspapera, magazines, hooka and encyclopedia.
129
-97-
b. Data Source: Student Questionnaire Items No. 2, No 3, No. 4
and No. 5.
c. Three Reporting Groups:
1) Limited Availability--This group represents students having
none or one of the four types of reading materials available
in the home.
Medium AvailabilityThis group represents students having
two or three of the four types of reading materials available
in the home.
Wide-Range AvailabilityThis group represents students having
all four types of reading materials available in the home.
Spanish'as a Native Language
a. Description: Spanish as a Native Language refers to whether or
not the student learned to speak Spanish before he/she learned
to_speak English. School Administrators asked each student the
question "What is your native language?"
b. Data Source: Response Code on Reading Assessmant Dooklot Cover.
c. Two Reporting Groups:
1) YesThis group represents those students who learned to
speak Spanish first, and includes those students who were
in the English as a Second Language Program.
2 No--This group represents those students who did not learn
to speak Spanish first.
130
-9 8-
Appendix 2
udent and Schwa uestionnaires
99
131
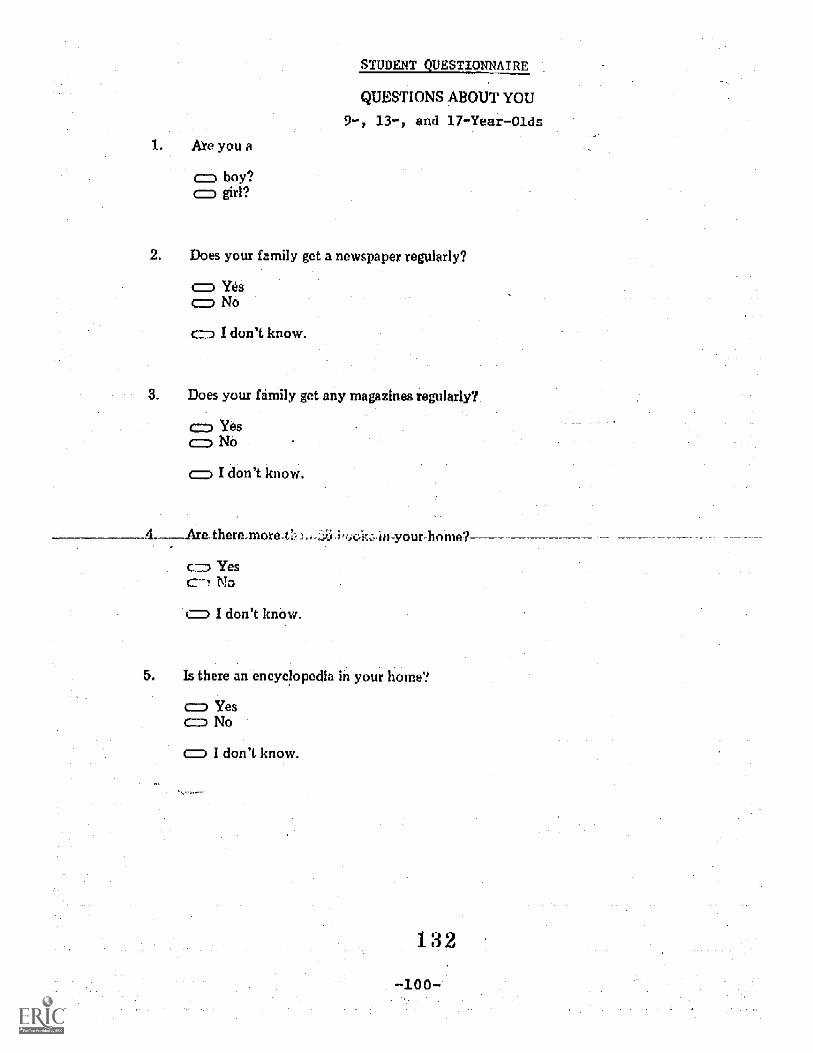
STUDENT QUESTIONNAIRE
QUESTIONS ABOUT YOU
9-, 13-, and 17-Year-OidsAre you a
t= boy?c=;) girl?
2. Does your family get a newspaper regularly?
(=i Yeac= NO
1=) I don't know.
3. Does your fami y get any magazines regularly?
YesNo
t:=) I don't know.
4 Are there_mor
1:= YesNo
i= I don't know.
)-your-hn
5. Is there an-encyclopedia in your ho -e?
= Yest= No
= I don't know.
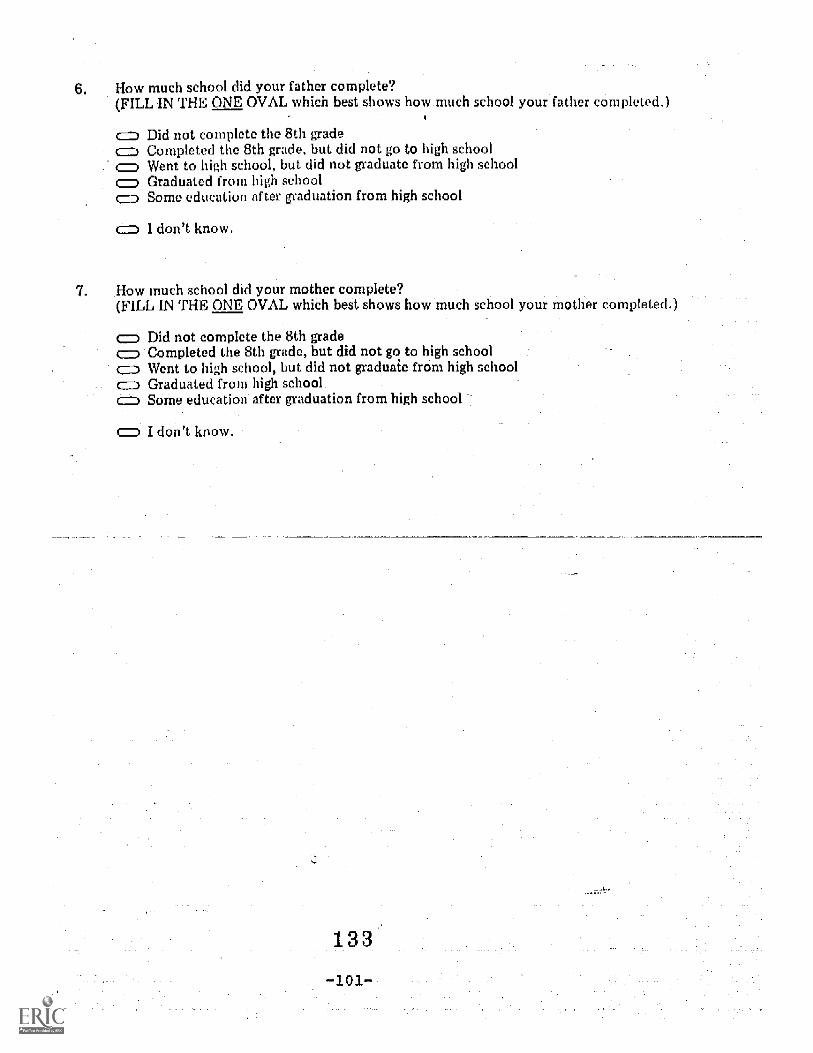
How much school did your father complete?(FILL IN THE ONE OVAL which best shows how much school your father completed.)
Did not complete the 8th gradec=1 Completed the 8th grade, but did not go to high school
Went to high school, but did not graduate from high school(=, Graduated from high school
Some education after graduation from high school
I don't know.
7. How much school did your mother complete?(FILL IN THE ONE OVAL which best shows how much school your mother comple d.)
(=) Did not complete the 8th grade() Completed the 8th grade, but did not go to high school
Went to high school, but did not graduate from high schoolc= Graduated froin high schoolc=1 Some education after graduation from high school
I don't know.
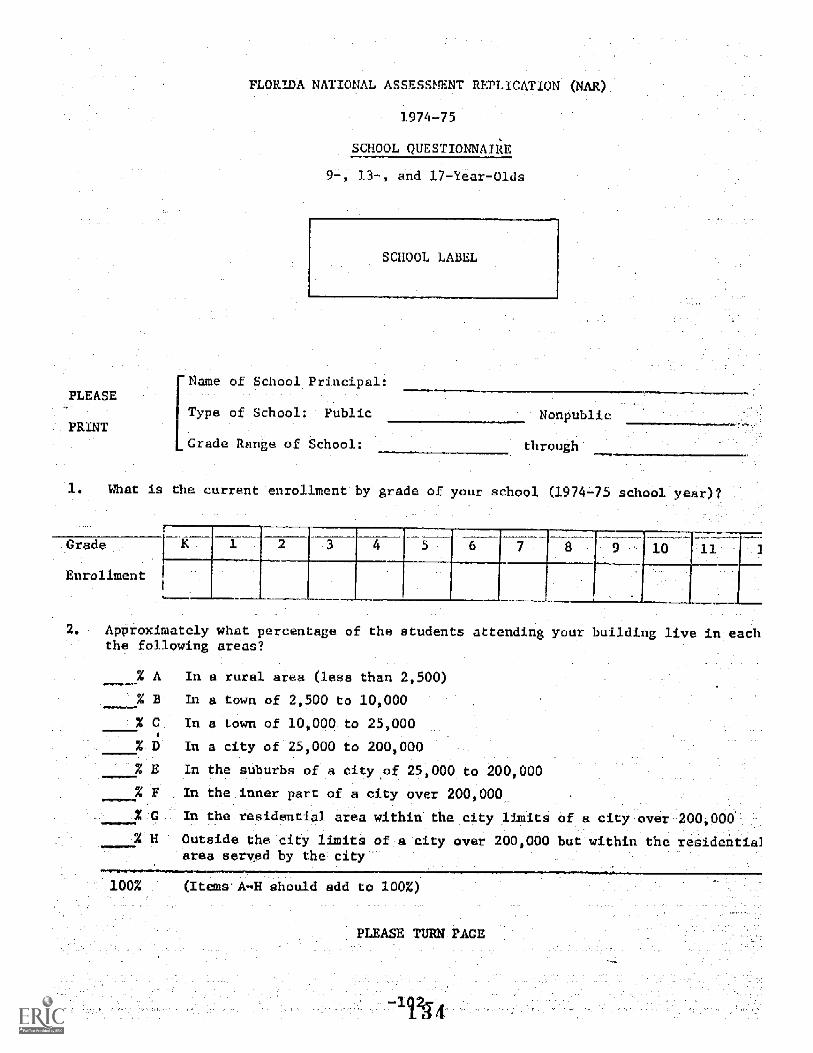
PLEASE
FLORIDA NATIONAL ASSESSMENT RE 'CATION M
1974-75
SCHOOL QUESTIONNAliE
13- and 17-Year-blds
S 100L LABEL
Name of School Principal:
[
Type 'chool: Public
Grade Ra ge of School:
Nonpubl
through
What is the currentlenrollment by grade of your school (197475 school year)?
Grade
Enrollment
K 1 2 3 4 5 6 7 8 9 10 11
-___-
ApOroximately what percentage of the students attending your building 1 \re in eachthe following areas?
% A In a rural area (less than 2,500)
_% B In a town of 2,500 to:10,000
% c In a town of 10,000 to 25,000
% 0 In a city -of 25,000 to 200,000'
E In the suburbs of a city of 25,000 to 200,000
% F In the inner part of a city over 200,000_,
p In the residential area within the city _limits of a city over 200,000
% H Outside the city limits of a city over 200,000 but within the residentia]area served by thecity

Approximately what percentage of the students attending your building arechildren of
% A Profesioriai or managerial personnel
% B Sales, clerical, technical or skilled workers
% C Factory or other blue collar workers
D Farm workers
% E Not regularly employe
% F On welfare
100% (Itema A7F should add to 100%)
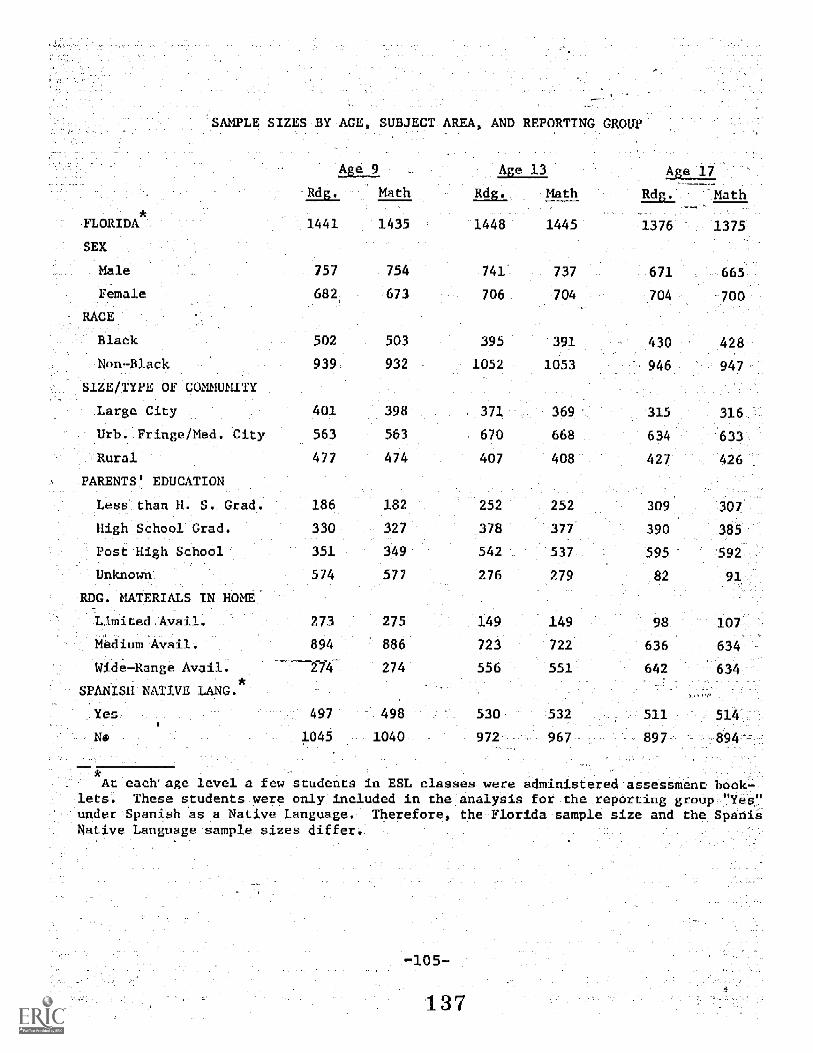
SIZES BY AGE, SUBJECT ARE 'PORTING GROUP
FLORIDA
SEX
Male
Female
RACE
Black
Non-Black
SIZE/TYPE OF COMMUNITY
Large City
Urb. Fringe/Med. C _y
'Rural
PARENTS' EDUCATION
Less than H. S. Gra
High School Grad.
Post High School
Unknown
Age9 Age 1317_
Rdg, Math YtA8._ .Math -EAL._ -Math
1441
757
682,
502
939
401
563
477
RDG. MATERIALS
186
330
351
574
LAmited Avail. 273
MediumAvail. 894
Wide-Range Avei -7114-
SPANISH NATIVE LANG.
497
1045
1435 1448
754 741
673 706
503 395
932 1052
398 371
563 670
474 407
182 252
327 378
349 542
577 276
275 149
886 723
274 556
498 530
1040 972-
1445 1376
737 671
704 704
391 430
1053 946
369- 315
668 634
408 427
252 309
377 390
537 595
279 82
1375
665
700
428
316
-633
426
307
.385 .
592
91.
532 511 514
967 897
At each'age level a few students in ESL classes were administered assessment hook-:lets. These students were only:included in the analysis forAhereparting groupj-Yel7under'SpaniSh as a Native Language. Therefore, the Florida sample size and the SpanilNatiVe Language sample sizes differ-.
Appendix.
Readin and Maihematics Over,lap_Cmparisona
-_9- and 13-Year-Olds and 17-Year-Olda- and
'9- and 177Year-Olds
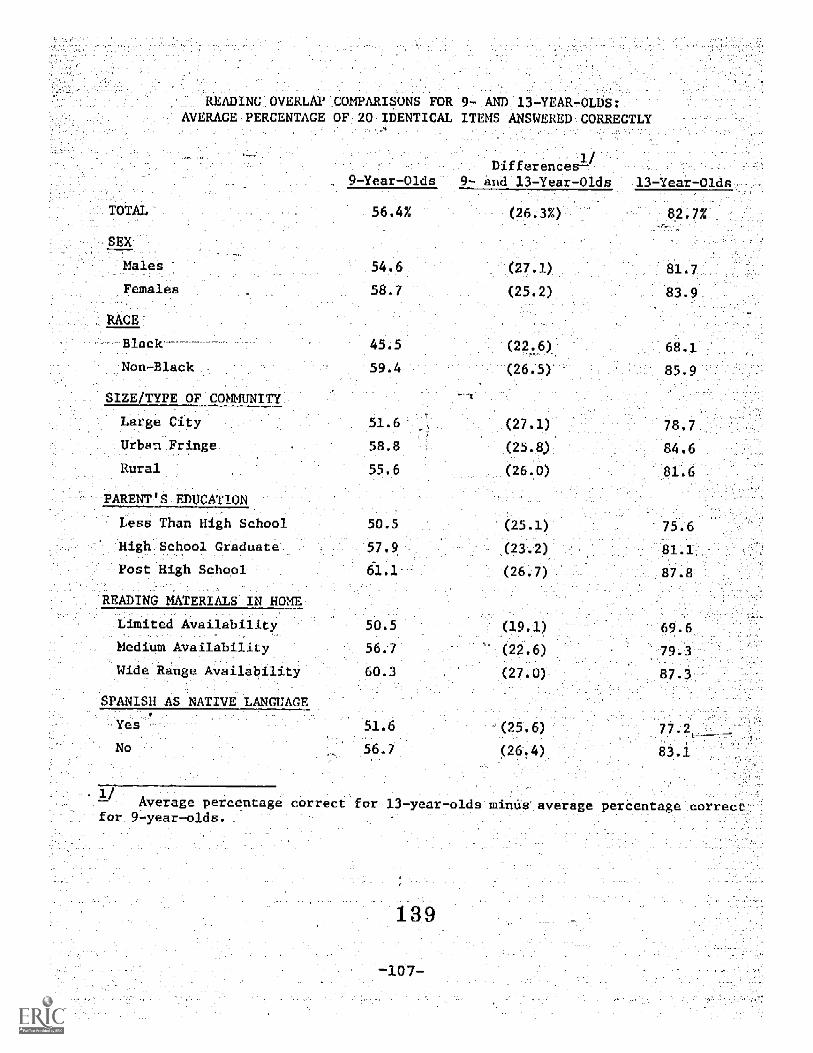
READ NG OVERLAP COMPARISONS FOR 9- AND 13-YEAlt-OLDS:AVERAGE PERCENTAGE OF 20 IDENTICAL ITEMS ANSWERED CORRECTLY
9-Year-Olds
1/Di ferences-
and 13-Year-Olds
TOTAL 56.4% :(28.'3%)' 82.7%
SEX
Males 54.6 (27.1) 81.7
Females 58.7 (25.2 ) 83.9
RACE-
-Black 45 5 (22.6 ) 68 1
Non-Black 59.4 (26.5 ) 85.9
SIZE/TYPE OF_COMMUNITY
Large City 51.6 (27.1) 78.7
Urban Fringe 58.8 (25.8) 64.6Rural 55.6 (26.,0) 81.6
PARENT'S EDUCATION
Less Than High School -50"5 (25.1) 75.6
High School Graduate (23.2) 1.1
Post High School (26.7) 87.8
READING MATERIALS IN HOME
Limited Availability -50.5 (19.1) 69-"6
Medium Availability 56 -7-- (22._6)
Wide Range Availability (27;0) 87.3
SPANISH AS NATIVE LANGUAGE
Yes 51.6 '(25.6)
No 56.7 (26.4) 83.1
Average percentage c rrec 13-year-olds -inus average perCentage correct9-year-olds.
139
-107-
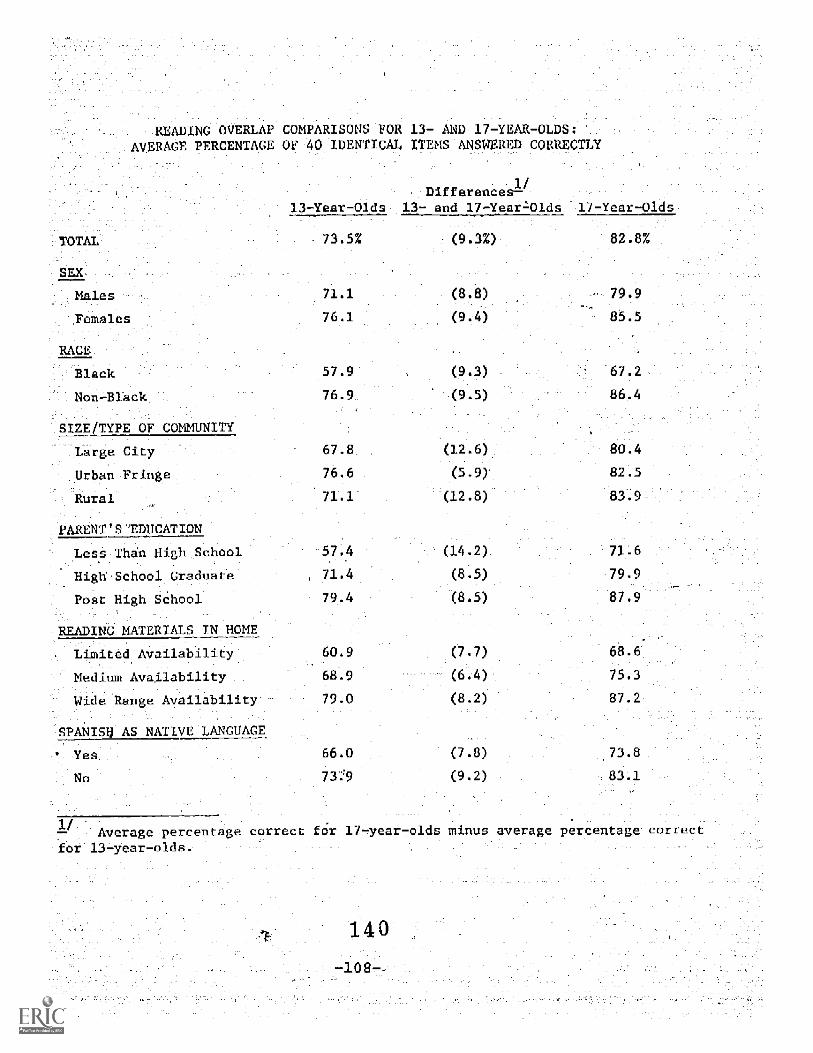
READING OVERLAP COMPARISONS FOR 13- AND 17-YEAR-OLDS:AVERAGE PERCENTAGE OF 40 IDENTICAL ITEMS ANSWERED CORRECTLY
TOTAL
SEX-
Males
Females
RACE
'Slack
Non7Black
-1/Differences
137-Year-01dsi 7 and 17-Year7'01ds 1 _-Year-Olds
73.5%
71.1
76.1
57.9
76.9
SIZE/TYPE OF COMMUNITY
large City 67.8
Urban Fringe 76.6
Rural 71.1
..PARENT'S'EDUCATION
_Lese:Than High-.SCh001
-High,Scbool. Graduate
PP-St High Sehool
READING MATERIALS IN HOME
Limited:AVailability
MediUm-AVSilability
Wide RangeAvailability-T
SPANISU AS NATIVF LANGUAGE
Nes
Np
1/- Average percentage correct3Year-olds,
57.4
71.4
79.4
60.9
68.9
79.0
66.0
7329
(9.3%)
(8.8)
(9.4)
(9.3)
(9.5)
(12.6)
(5.9)
(12.8)
(14.2)
(8.5)
(8.5)
(7.7)
(6.4)
(8.2)
(7.6)
(9.2)
73.8-
83 1
.17-year7olds minus average percen age cor-ect
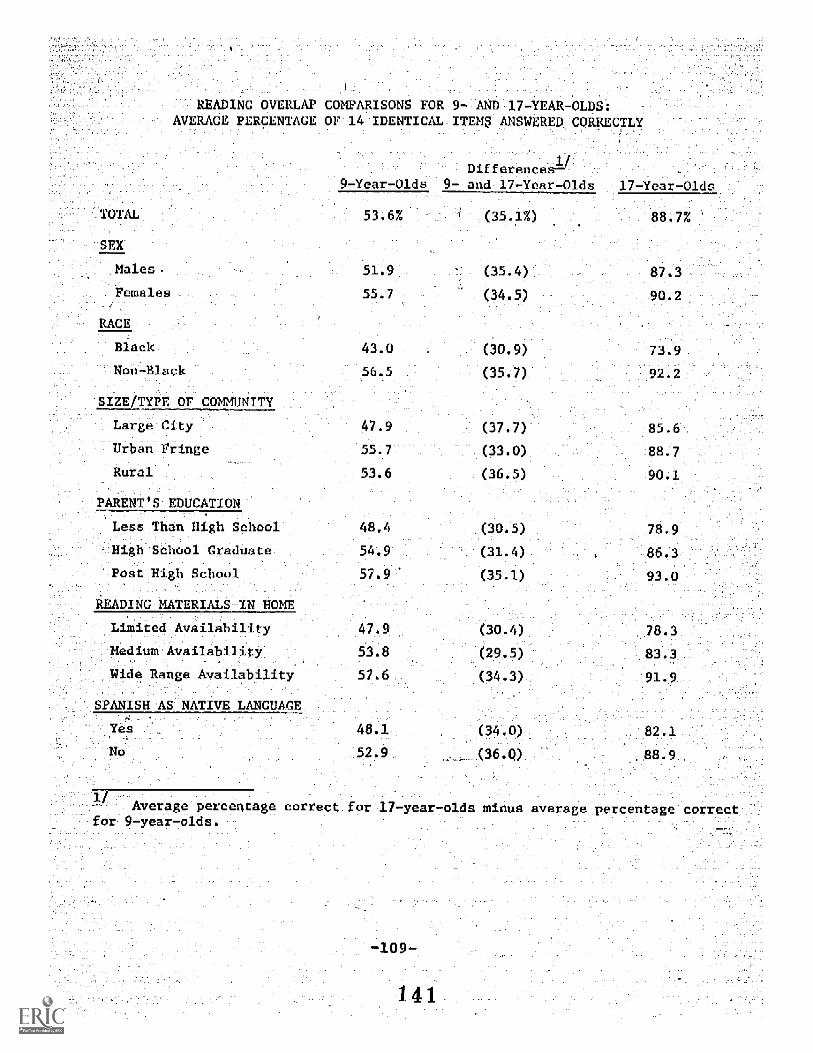
AD1NG OVERLAP COMPARISONS FOR 9- AND 177YEAR-OLDS:AVERAGE PERCENTAGE OF 14 IDENTICAL ITEMS ANSWERED CORRECTLY
9-Year-Olds
1/:Differences--
- and 177YearOlds -Year-Olds
TOTAL 53.6% (35.1%) 88.7%
SEX
(35.4) --87.3
FeMales- 55-7--, 4 5) 90.2
RACE:
Black 43.0 30.9) ,- 9.
--Non-Black 5.65 (35.1), 92
'SIZE/TYPE OF-_COMMUNITY'
. Large-City-- 47.9 -(37.7)-
Urban.--Fringe 33.0) :88.7 :
.
(36.5) -90-1
PARENT'S EDUCATION
Less Than High School 48.4 (30.5) 78 9
High School Graduate 54-.9 (31.4) 86.3
Post High School 57.9: (35.1) 93.0
ADING MATERIALS IN HOME
Limited Availability 47.9 (30.4) 78.3
Medium Availability 53.8 (29.5) 83.
Wide Range Availability 57.6 (34.3 ) 91.9
SPANISH AS NATIVE LANGUAGE
Yes 48.1 4.0 82.1
No 52 9 6.0)
Average-percentage correct9-year-olda.
7-year-olds minus average percenta e c_ rect.
-109-
141
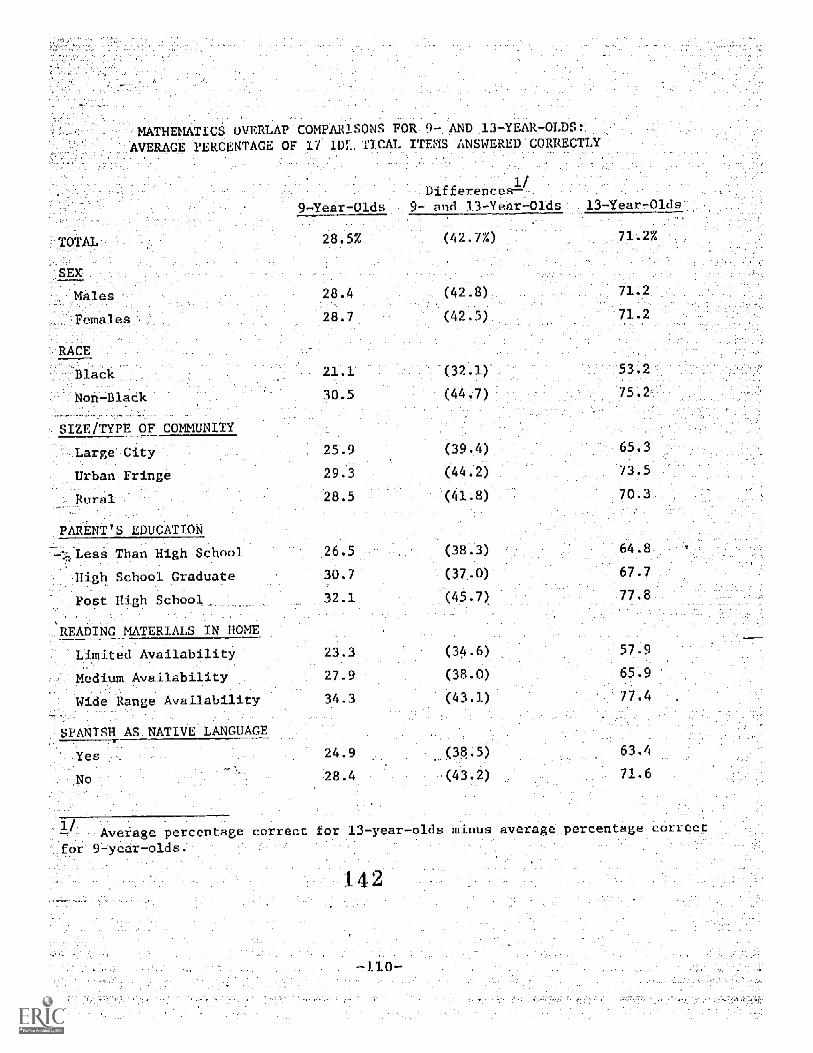
-TOTAL
SEX
Males
Females
MATHEMATICS OVERLAP COMPARISONS FOR 9- AND 13-YEAR-OLDS:
AVERAGE PERCENTAGE OF 17 IDF IICAL ITEns ANSWERED CORRECTLY
1Differences---
_97Yeat-Olds 9- and 13-Year-Olds 13-Year7Olds-:
18.5% (42.7%) .71.2%
18 4-
28.7. 425)
RACE-Black 21.1 (32.1 ) 53.2
Non-Black 30.5 (44 7 75.2-
IZE/TYPE OF CO4UNITY
Large City 25.9 (39 4)
Urban Fringe 29.3 (44.2)
28.5 (41.Rural
._TARENT."._S_ EDUCATION
26.5
30.7
32.1
(38.3)
(37.0
(45.7)
64.8
67.7
77.8
Than. High-School
;11igh'.Schpol prad6ate
IN TERIALS IN HOME
mited Availability 23.3 (34.6) 57.9
dium Availability 27.9 (38.0) 65.9
Wide Range Availability 34.3 (43.1) 77.4
SPANISH AS NATIVE LANGUAGE
18.4 (43.2)
_Average.pereentage cotfor-9-year-olds.
ect for 13-year- lds minus average percen age correct
-110-
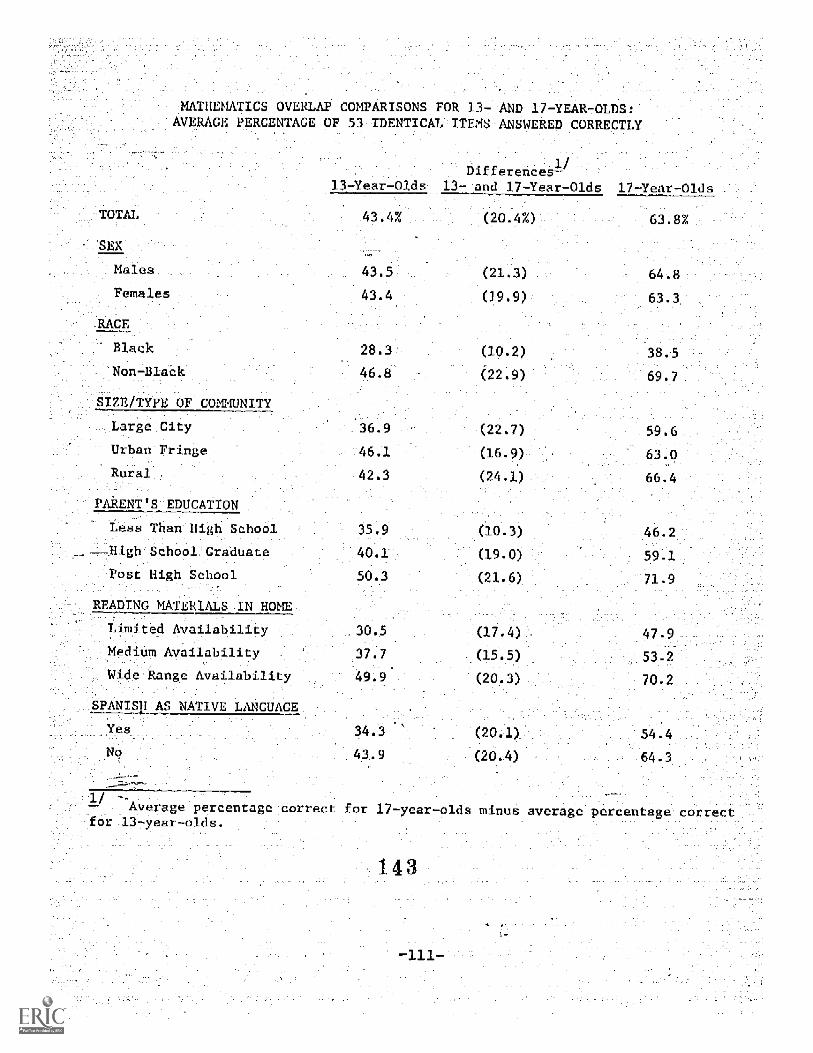
MATHEMATICS OVERLAP COMPARISONS FOR 13- AND 17-YEAR-OLDSAVERAGE PERCENTAGE OF 53 IDENTICAL ITEMS ANSWERED CORRECTLY
TOTAL
SEX
13-Year-OldsDifferences--
1/
-end 17,Year-Olds 17-Year-Olds _
43.4% (20.4%) 63.8%
les 43 5 (21.3) 64.8
Females 43.4 (19.9) 63.3
.RACE
Black 28.3' (19.2) 38.5
Non-Black 46.8 (22.9) 69.7
SIZE/TYPE OF COMMUNITY
36.9 (22.7) 59.6arge City
Urban Fringe 46.1 (16.9) 63.0
ural 42.3 (24.1) 66.4
PARENT S EDUCATION
35.9 (10.3) 4"ess Than High School
--High School Graduate 40.1 (19.0) 59.1
Post High School 50 3 (21.6) 71.9
READING MATERIALS IN HONE
Limited Availability 30 5 (17.4) 47.9
edium Availability 37.7 (15.5 ) 53.2
Wide Range Availability 49.9 (20.3 ) 70.2
SPANIS1 AS NATIVE LANGUAGE
Yes 34.3 20.1) 54.4
No 43.9 20 4) 64.3
Average perdentagereorrect for 17year-olds minus average perce tage correct r-or ,13year-olds.
143
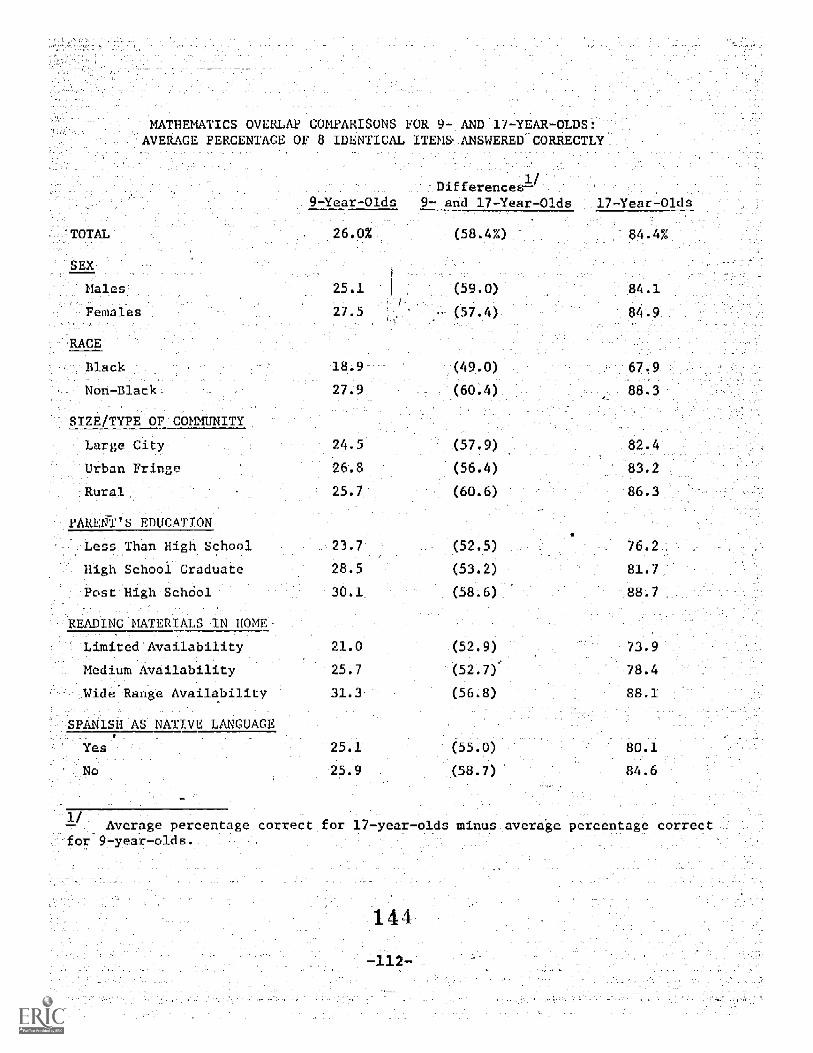
MATHEMATICS OVERLAP COMPARISONS FOR:9- AND 17-YEAR-OLDS:'AVERAGE PERCENTAGE OF 8 IDENTICAL ITEMS. ANSWERED CORRECTLY_
-TOTAL
SEX
97Yenr-01ds
1/-Differences-9= and 17YearOlds 17Year-Olds
26.07. (58.4%) 84.4%
Males 25.1 (590) 84.1
Females 27.5 (57.4) 84.9
RACE
Black 18 9 (49.0) 67,9
Non-Black 27.9 (60.4)
-ZE/TYPE OF COMMUNITY
Large City (57.9) 2.4
Urban Fringe 26.8 (56.4) 83 2
Rural 25.7' (60.6) 86.3
PARENT'S EDUCATION
Less Than High School 23.7 (52.5) 76.2
High School Graduate 28.5 (53.2): 81.7
Post High Scheol 30.1 (58-6 88.7
READING MATERIALS IN HOME-
*mited'_Availability . - 21 0 ._(52.9) :73,9
-.Medium:Availability :-25.7 --(52.7).-- ---78.4 .
.-._Wide'Range Availability 31.1 --' (568) 88.1_
AS NATIVE LANGUAGE.SIOISH
--Yes -- -25.1- .-- (55.-0). 80.1_
No 25.9 (58.7) 84.6
Average percentage correct for 17-year-olds minus average percentage correcMrearolds.
144
-112-
Appendix
notida Versus National_and Southeast _Readin Resuits
by Theme and Mathematics Resulti by Content Ar
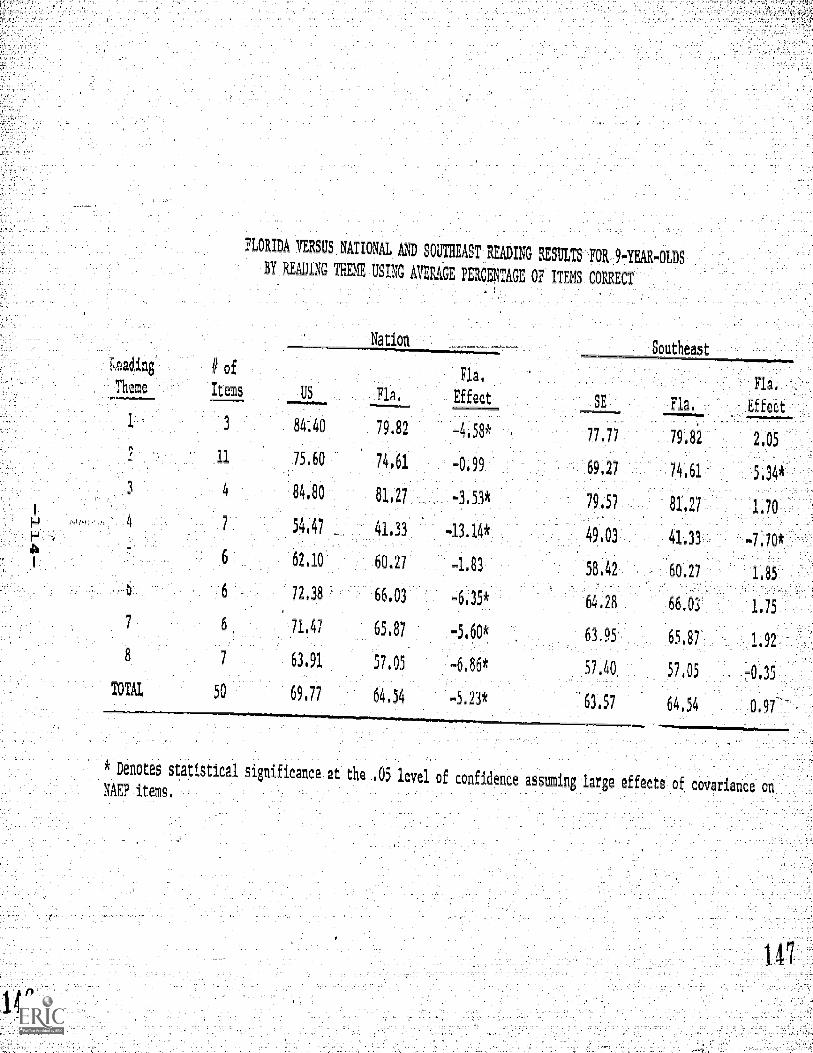
FLORIDA VERSUS1ATIONALAND-SOUTRFASTiEADIN nSDLTS-'..,'FOR17YRAR-OLDSH
.-BY,READING TEEMEIBINGAVERAGE .PERCENTAgE OF ITEMS.CORRECT
Se.lading
Theme
of
Items
Nation
US Fla.
Fla,
Effect
1 3 84.40 79.82 -4.58*
11 75.60 74.61 -0.99
4 84 80 81.27 -3.53*
54.47 41.33 43.14*
ith
62 10 60.27 -1.83
6 72.38 66.03 -6.35*
6 71.47 65.87 =5.60*
8 7 63.91 57.05 6
TOTAL 50 69.77 64.54 -5.23*
Southeast
SE Fla.
Fla.
Effect
77 77 79.82 2.05
69.27 4 61 5.34*
79 57 81.27 1.70
49.03 41.33 -7.70*
58.42 60.27 1.85
64.28 66.031.7563 95 65.87 1.92
57.40 57 05 41.35
63 57 64.54 0.97
* Denotes statistical si ifica at .05 level of confidence a uming large effects ofNAEP items,
146
variance on
117
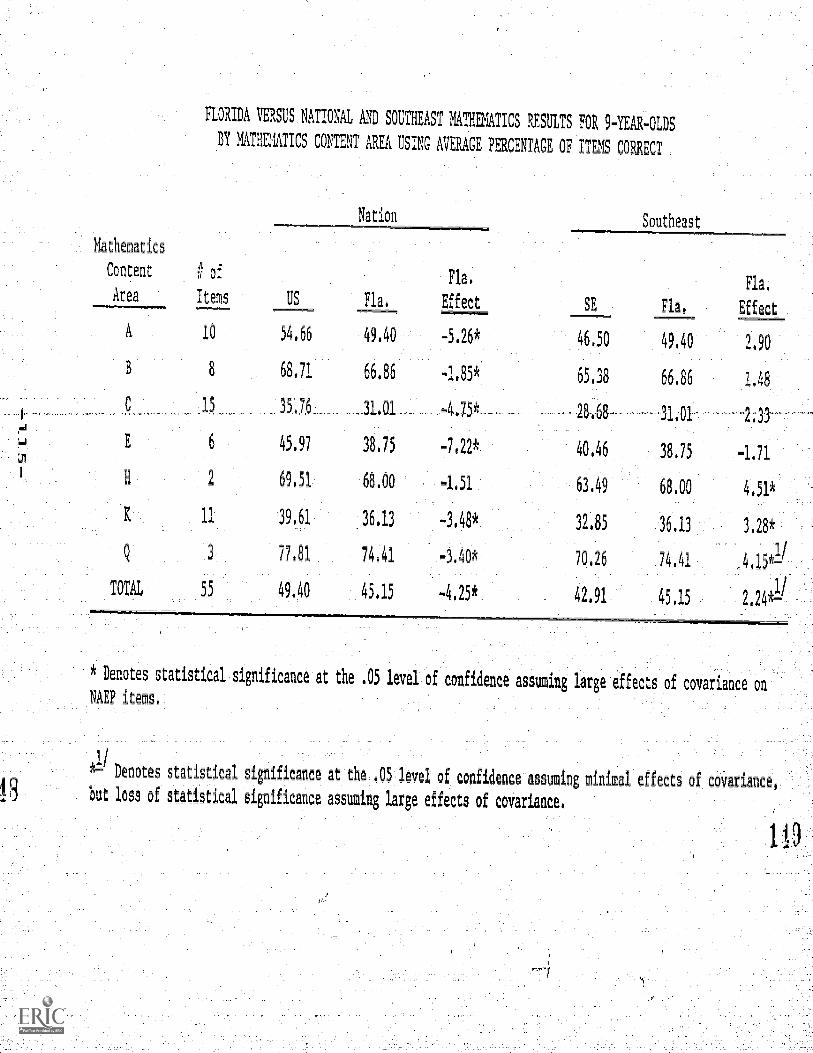
FLORIDA VERSUS NATIONAL AND SOtTHEAST MATHEMATICS RESULTS FOR 9-YEAR-OLDS
BY MATIVATICS CONTENT AREA USING AVERAGE PERCENTAGE OF ITEMS CORRECT
Nation
Mathematics
Content !! ofFla. Fla.
Area Items US Fla. Effect SE Fla. Effect
A 10 54.66 49.40 -5.26* 46.50 49.40 2.90
B 8 68.71 66.86 -1.85* 65.38 66.86 1.48
C 15 35,76 31 01 _ -4,75* 1 31.01 2.3
E 6 45.97 38 75 -7.22* 40.46 38.75 -1.71
li 2 69.51 68.00 -1.51 63.49 68.00 4.51*
K 11 39.61 36.13 -3.48* 32.85 36.13 3,28*
Q3 77.81 74.41 -3.40* 70.26 74.41 4.15*2I
TOTAL 55 49.40 45.15 -4.25* 42 91 45.15
Southeast
* Denotes statistical.significancelt.th
NAEP items.
f confidence assunig large effects of c variance on
Denotes statistical significance at the .05 level of confidence assuming minimal effects of covariant ,
but loss of statistical significance assuming large effects of covariance.
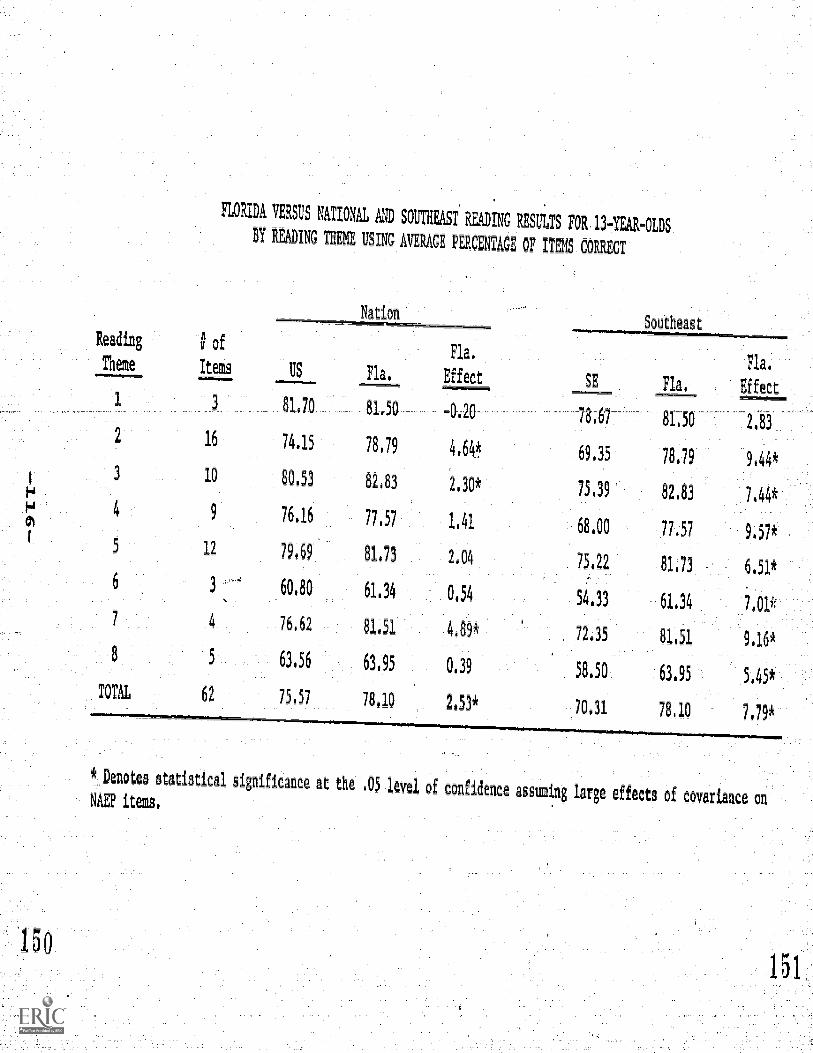
Reading
Theme
FLORIDA VERSUS RikTIONALAhT SOUTHEAET READING RESULTS FOR 13-YEAR-OLDS
BY READING THEME USING AVERAGE PERCENTAGE OF ITEMS COIRECT
# of
Items
3
16
10
9
12
3
4
5
US
Nati n
Fla.
Fla.
Effect_ SE
Southea t
Fla.
81.70 81.50 -0.20 78.67 81.50
74.15 78.79 4.64* 69.35 78.79
80.53 82.83 2.30* 75.39 82.83
76.16 77.57 1.41 68.00 77.57
79.69 61.73 2.04 75 22 81.73
60.80 61.34 0.54 54.33 61.34
76.62 81.51 4.69* 72.35 81.51
63.56 63 95 0.39 58.50 63.95
Fla.
Effec
2:83
9.44*
7.44*
9 57*
6 51*
7.01*
9.16*
5.45*
62 75.57 78.10 2.53* 70.31 78,10 7.79*
* Denotes statisticalsignificance at the .05 level of confidence assing iare effects of covartance onNAEP items.
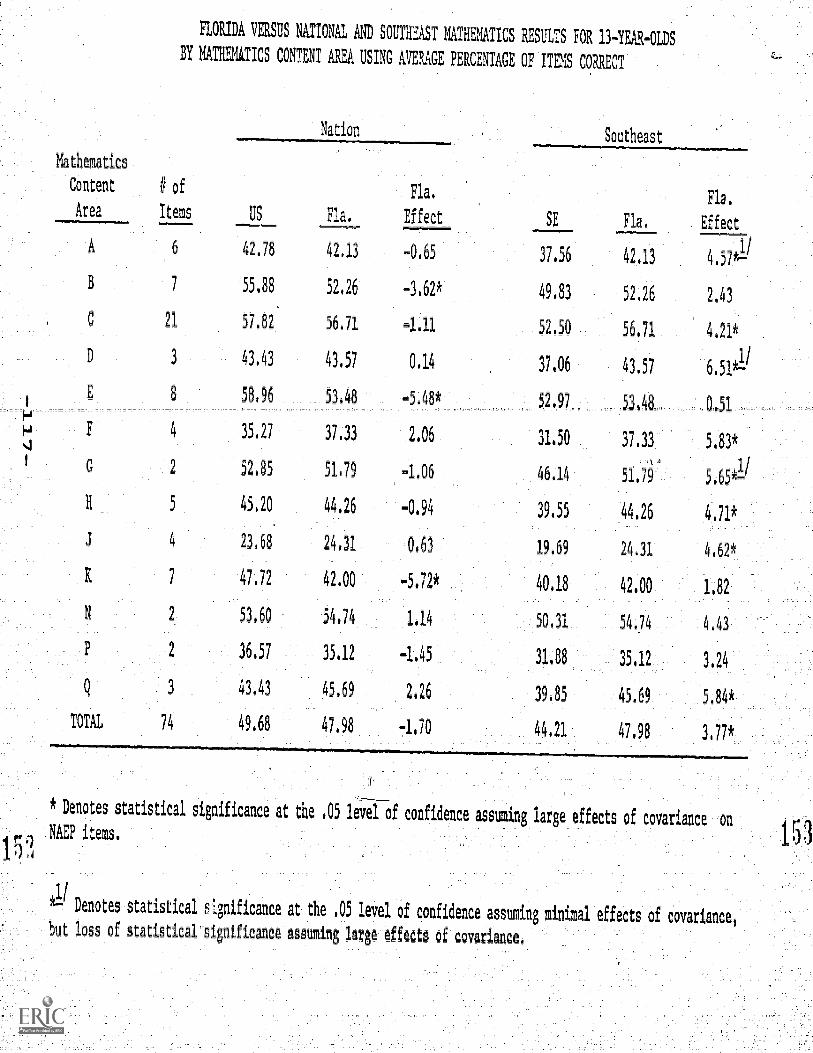
FLORIDA VERSUS NATIONAL AND SOUTHEAST MATHEMATICS RESULTS FOR 13-1EAR-OLDS
BY MATIOATICS CONTENT AREA USING AVERAGE PERCENTAGE OF ITEMS CORRICT
Ilathematics
Content # of
Area Items
A
B
6
7
21
3
a
4
2
5
4
7
Nation
US Fla.
Fla.
Effect SE_42.78 42113 -0.65 37.56
55.88 52.26 -3.62* 49.83
57.62 56.71 -1.11 52.50
43.43 43.57 0 14 37.06
58.96 53.48 -5.48* 52.97
35.27 37.33 2.06 31.50
52.85 51.79 4.06 46.14
45,20 44.26 -0.94 39.55
23.68 24.31 0.63 19.69
47.72 42.00 5.72* 40.18
53.60 54.74 1 14 50 31
36.57 35.12 4.45 31.88
43 43 45.69 2.26 39.85
Southeast
TOTAL 74 49.68 47.98 -1.70 44 21
Fla,
F1a, Effect
42.13 4.57*Ii
52.26 2.43
56.71 4.21*
43157 6.51*11
53.48 0.51
37,33 5 83*
51.79 5.65*11
t.
44 26 4.71*
24.31 4,62*
42.00 1 82
54.74
35,2
45.69 5.84*
* Denotes statistical significance at the .05 level of confidence as uming large effects of c variance o
NAEP items.
1/
Denotes statistical 5-1gn1ficanc at the .05 level of confidence assuming minimal effects of covariance,
but loss of statistical"significanceassuming large effects of covariance.
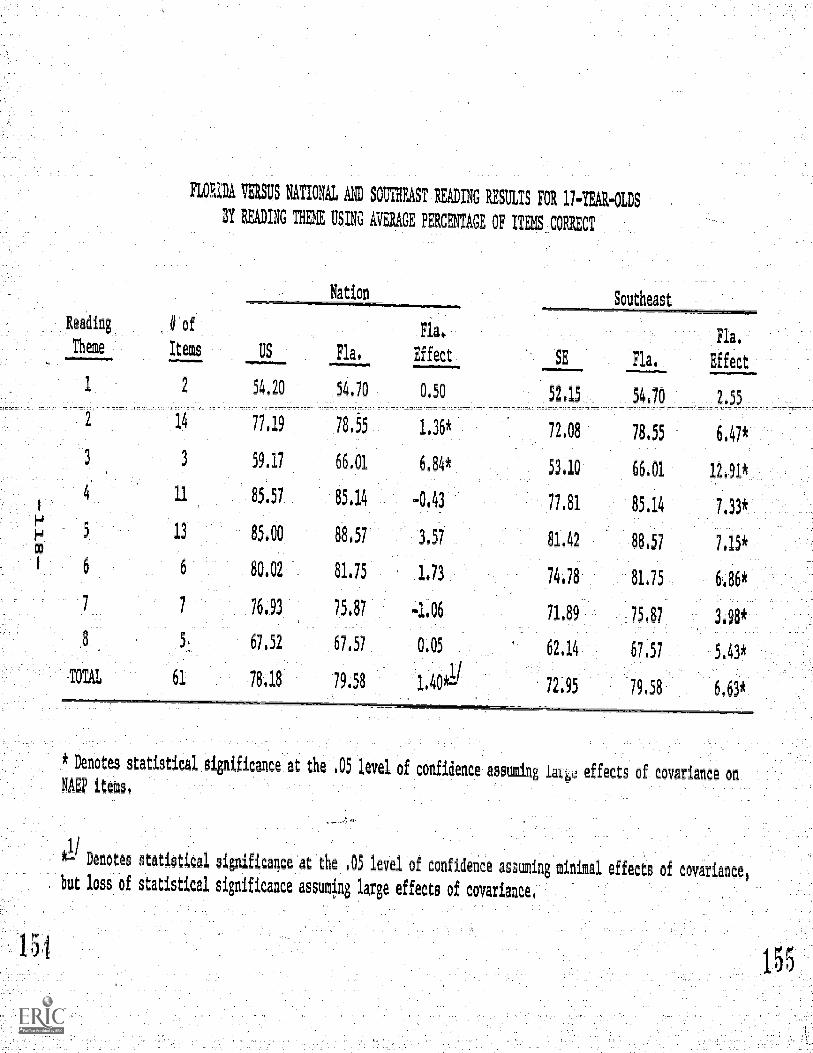
FLORIDA VERSUS NATIONAL AN1 SOUTHEAST READING RESULTS FOR 174EAR-0LDS
BY READING THEE USING AVERAGE PERCENTAGE OF ITEMS CORRECT
Reading # of
Theme Items
2
Nation
54.20
77.19
59.17
11 85.57
13 85.00
6 80.02
7 76.93
5, 67 52
TOTAL 61 78.18
Fla.
54.70
78.55
66.01
85.14
88.57
81.75
75.87
67.57
79.58
Fla.
Effect
0.50
1.36*
6.84*
-0.43
3.57
1.73
-1.06
Southeast
SE Fla.
52.15 54.70
72.08
53.10
77.81
81.42
74.78
71.89
62.14
72.95
Fla.
Effect
2.55
78.55 6.47*
66.01 12.91
85.14 7.33*
88.57 7.15*
81.75 6.86*
3'98*
5.43*
75 87
67.57
79.58 6.63*
* Denotes statistical signilicance at the'.05 level of confidence assu1ug iat effects of covariance on.
NASH:tem,
1/
k- Denotes statistical significance at the .05 level of confidence assuming minimal effects of covariance,, but loss of statistical significance assuming large effects of covariance.
1;
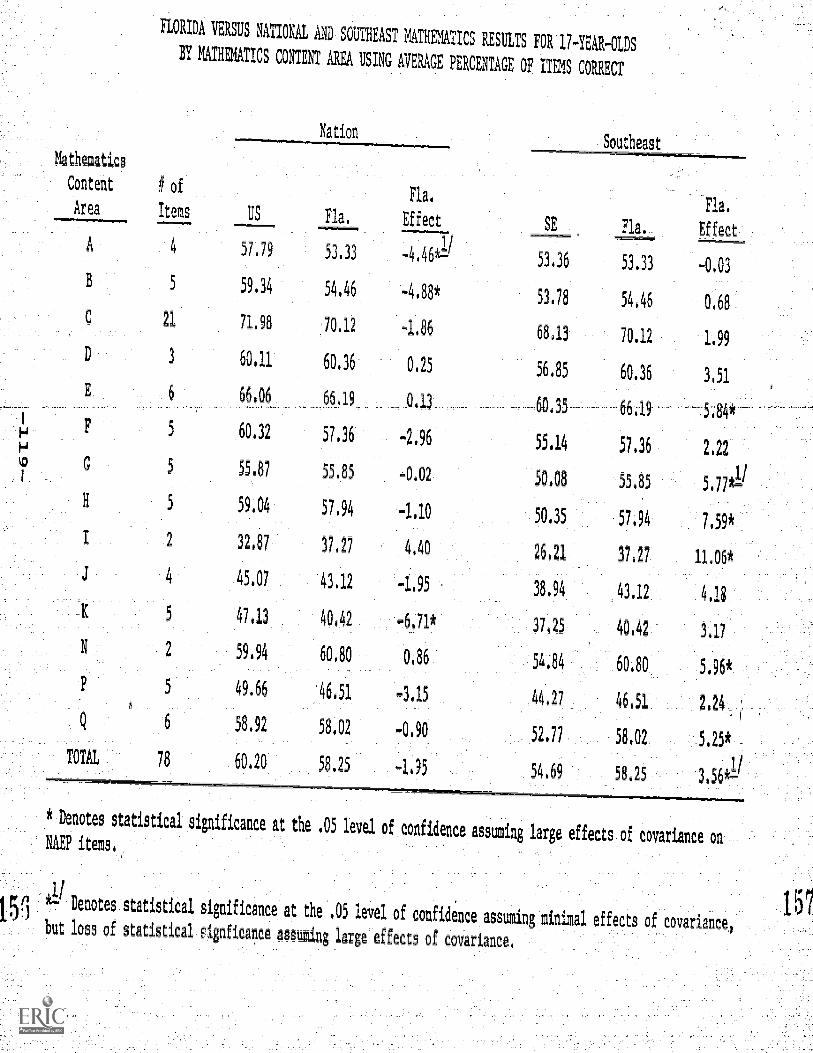
FLORIDA VERSUS NATIMAL AND SOUTHEAST MATHEMATICS RESULTS FOR 17-YEAR-OLDSBY MATHEMATICS CONTENT AREA USING AVERAGE PERCENTAGE OF ITEMS CORRECT
NationSouthea t
Mathematics
Content # ofFla.
_Area Items _US Fla._ Effect
1/A 4 57...79 53.33 4,46*-
59.34 54.46 -4.88
21 71.98 70,12 4.86
3 60.11 60436 0425
E. 6 66.06 66.19 0.13
5 60432 57.36
5 55 87 55.85 -0.02
5 59.04 57.94 -1.10
2 32.87 37.27 4440
4 45.07 43.12 -1.95
5 47 13 40.42
2 59.94 60.80 0.86
5 49.66 46.51 3.15
6 58.92 58.02 -0.90
78 60.20 58.25
SE Fla..
53.36 53 33
53.78 54,46
68.13 70.12
56.85 60.36
--60.35 66.19
55.14 57.36
50.08 55.85
50.35 57 94
26.21 37.27
38.94 43412
37.25 40.42
54.84 60.80
Fla.
Effect
-0.03
0.68
1.99
3,51
-5.S4
2.22
5.77*1!
7 59*
11.06*
4
3 17
5 96*
44.27 46 51 2.24
52.71 58,02 5.25*
54.69 58.25 3 56*.11
* Denotes statisticalsignificance at the .05 level of onfidence assuming large effects -f covariance on
MEP items.
159a/
4 ffDenotes statist.cal signi.icance at the .05 level of pon.iance
assuming minimal effects of covariance,but loss of statisticalrignficance assuming large effects of covariance.