Embed Size (px)
Citation preview

THE JOURNAL OF FINANCE • VOL. LXI, NO. 6 • DECEMBER 2006
Does the Contribution of Corporate CashHoldings and Dividends to Firm Value Depend
on Governance? A Cross-country Analysis
LEE PINKOWITZ, RENE STULZ, and ROHAN WILLIAMSON∗
ABSTRACT
Agency theories predict that the value of corporate cash holdings is less in countries
with poor investor protection because of the greater ability of controlling shareholders
to extract private benefits from cash holdings in such countries. Using various spec-
ifications of the valuation regressions of Fama and French (1998), we find that the
relation between cash holdings and firm value is much weaker in countries with poor
investor protection than in other countries. In further support of the importance of
agency theories, the relation between dividends and firm value is weaker in countries
with stronger investor protection.
ACCORDING TO AGENCY THEORIES, THOSE who control firms do so to further theirown interests. When corporate governance works well, those in control of a cor-poration, whom we refer to as controlling shareholders, find it more beneficialto increase shareholder wealth than to expropriate minority shareholders. Incontrast, with poor corporate governance, controlling shareholders can derivesubstantial private benefits from control at the expense of minority sharehold-ers (see, for instance, Dyck and Zingales (2004) and Nenova (2003)).
As Myers and Rajan (1998) argue, liquid assets can be turned into privatebenefits at lower cost than other assets. Liquid assets therefore represent apromising opportunity to investigate the implications of agency theories. Ac-cording to these theories, we would expect controlling shareholders to overin-vest in liquid assets. Existing empirical evidence by Dittmar, Mahrt-Smith, andServaes (2003) and Kalcheva and Lins (2004) is consistent with this prediction.
∗Lee Pinkowitz and Rohan Williamson are associated with Georgetown University and Rene
Stulz with The Ohio State University, ECGI, and NBER. Pinkowitz and Williamson thank the
Capital Markets Research Center at Georgetown University and the Steers Faculty Research Fel-
lowship through the McDonough School of Business for financial support. Rene Stulz is grateful
for the hospitality of the Kellogg Graduate School of Management at Northwestern University and
the George G. Stigler Center for the Study of the Economy and State at the University of Chicago,
where some of this research was conducted. We thank Kathryn-Ann Bloomfield, Michael Chiang,
Mark Ervin, Jennifer Rooke, and especially Aaron Kravitz and Regina Lawrence, for their help with
the data collection. We are grateful to Heitor Almeida, Harry DeAngelo, Linda DeAngelo, Doug Di-
amond, Ole-Kristian Hope, Oguzhan Ozbas, Jan Mahrt-Smith, Henri Servaes, Rob Stambaugh,
Mike Weisbach, Luigi Zingales, an anonymous referee, and seminar participants at American
University, Georgetown University, MIT, University of Chicago, University of Northern Illinois,
University of Southern California, and University of Toronto for useful comments.
2725

2726 The Journal of Finance
However, because countries in which the appropriation of private benefits iseasier are also typically riskier (see Acemoglu et al. (2003)), firms in thesecountries may hold more cash simply because they require a larger buffer toprotect themselves against adverse shocks.
If controlling shareholders maximize firm value and hold more liquid assetsin countries in which the appropriation of private benefits is easier becausesuch countries are riskier, then minority shareholders should not value liquidassets in these countries less than they do in countries in which appropriationof private benefits is more difficult. Conversely, if controlling shareholders pur-sue their interests partly at the expense of minority investors, agency theoriespredict that liquid assets should be worth less to minority investors in coun-tries in which the appropriation of private benefits is easier since some of theseassets are used to finance controlling shareholders’ private benefits.
Empirical research shows that corporate governance is poorer and, in turn,the appropriation of private benefits by controlling shareholders is easier, incountries with poor investor protection (see La Porta et al., hereafter LLSV,(2000a) for a review). In this paper, we investigate whether the value of liquidassets is lower for minority shareholders in countries where investor protec-tion is poorer. Investor protection has two components, namely, a legal rightscomponent, whereby investors are granted legal rights, and an enforcementcomponent, whereby the quality of a country’s institutions determines the ex-tent to which these rights are respected and enforced. We investigate these twocomponents separately. Using a sample that spans 35 countries and 11 years,we find that in countries with high investor protection, a dollar of liquid assets isworth roughly a dollar to minority investors. In contrast, in countries with poorinvestor protection, a dollar of liquid assets is worth much less. For instance, inone specification of our tests, we estimate that a dollar of liquid assets is worth$0.91 in countries with above-median investor protection while it is worth only$0.33 in other countries. The difference between the two estimates is highlysignificant.
To conduct our investigation, we classify countries according to the medianof various indices of investor protection. This procedure allows us to comparethe relation between firm value and liquid assets in countries with either highor low investor protection. We then estimate how the relation between firmvalue and firm characteristics depends on investor protection using variousspecifications of the Fama–French (1998) model. Our results are not sensitiveto the specification we use. We also undertake a number of robustness teststhat provide additional evidence in support of the hypothesis that liquid assetsare valued less in countries with poor investor protection.
Private benefits should create a wedge between the value of a dollar insidethe firm and the value of a dollar paid out. No private benefits can be consumedfrom dollars paid out, while dollars kept in the firm enable those who controlthe corporation to consume more private benefits. It follows that, if investorsdiscount the value of cash holdings because they expect the cash to be partlyconsumed as private benefits, they should value dividends in that country ata premium compared to a country where private benefits are less important.

Contribution of Corporate Cash Holdings and Dividends 2727
As long as dividends are sticky, high current levels of dividends predict highfuture levels of dividends, and hence lower consumption of private benefits.
We investigate how investors’ valuation of dividends across the world is re-lated to investor protection and find strong support for our hypothesis. With arepresentative specification, we find that a dividend payment rate correspond-ing to 1% of a firm’s assets increases firm value by 9.80% in countries where theminority shareholder index from LLSV (1998) is below the median, but only by4.07% in the other countries. Again, the difference between the two estimatesis significant at conventional levels.
Our results contribute to several strands of the finance literature. First, agrowing literature investigates the relation between firm value and investorprotection. In particular, authors show that the incentive effects of ownershipof cash flow rights are stronger in countries with poorer investor protection,while the existence of a wedge between ownership of cash flow rights and con-trol rights has more of an impact on firms in countries with poor investor pro-tection (see, for instance, Claessens et al. (2002), LLSV (2002), Lins (2003)).This literature also shows that firms that choose to use the capital markets ofcountries with better investor protection are valued more highly and that theassociated valuation premiums are inversely related to investor protection inthe firm’s country (Doidge, Karolyi, and Stulz (2004)). Finally, some authorsfind that firm value is negatively related to proxies for investor protection (see,for instance, Durnev and Kim (2005)). Our contribution to this literature is toidentify a discount for liquid asset holdings in countries with poor investor pro-tection. In particular, we show that a source of value loss in these countries isthat outside shareholders do not receive the full value of liquid assets ownedby the firm.
Second, our paper contributes to the free cash flow literature that builds onJensen (1986). Jensen (1986) identifies agency costs of free cash flow. Dittmaret al. (2003) show that firms in countries with low investor protection holdmore cash than do firms in other countries, Kalcheva and Lins (2004) showthat firms hold more liquid assets when there is more of a discrepancy betweena controlling shareholder’s holdings of cash flow rights versus voting rights, andDittmar and Mahrt-Smith (2005) provide evidence that liquid asset holdings inU.S. firms are valued more in firms with a low value of the Gompers, Ishii, andMetrick (2003) index, which has low values for firms with fewer anti-takeoverprotections. These results are consistent with the hypothesis that it is less costlyfor the controlling shareholders to consume the private benefits attached to cashholdings and, therefore, they value cash holdings more, when investors are lesswell protected. In the presence of agency costs of free cash flow, cash holdingsshould be discounted since they are partly spent to increase the welfare of thosewho control the firm rather than to maximize the wealth of all investors. Ourpaper documents that this discounting takes place in countries in which weexpect agency costs to be particularly significant.
Finally, our paper also contributes to the literature on tunneling (see, forinstance, Johnson et al. (2000)). This literature establishes that those who con-trol firms in countries with poor investor protection can expropriate outside

2728 The Journal of Finance
investors by taking actions that remove valuable assets from the firm. Tun-neling is more likely in countries with poor investor protection. We show thatoutside investors discount firm assets in countries with poor investor protectionto reflect their expectations that they will not receive the full benefit of theseassets.
It is important to note that our study faces many of the limitations inherentto cross-country studies. We also believe that our use of a sample that coversa longer period of time than is typical in the cross-country literature is helpfulbecause it allows us to estimate change regressions. Nevertheless, the limitednumber of independent observations makes it harder to distinguish amongpossible explanations for our results. Thus, while the results are consistent withthe hypotheses we test, we cannot completely exclude alternate explanations,such as the explanation that the accounting numbers of countries with poorerinvestor protection are not as reliable as the accounting numbers in countrieswith better investor protection.
The paper proceeds as follows. In Section I, we present in more detail themotivation for the two hypotheses we test in this paper. In Section II, we in-troduce the approach we use to test our hypotheses. We describe our data inSection III. In Section IV, we report the results of our tests of the two hypothe-ses. In Section V, we examine other possible explanations of our results andprovide robustness tests. We conclude in Section VI.
I. The Value of Liquid Asset Holdings and Dividends in the Presenceof Agency Costs
Internationally, firms are typically controlled by large shareholders who canimpose their will on management (see La Porta, Lopez-de-Silanes, and Shleifer(1999)). The controlling shareholder manages the firm to maximize his wel-fare. When his interests are perfectly aligned with those of outside investors,the outside investors benefit from the fact that the controlling shareholder max-imizes his welfare since by doing so he also maximizes their wealth. However,when the interests of the controlling shareholder and outside investors are notperfectly aligned, that is, when agency problems exist, at times the controllingshareholder will increase his welfare at the expense of outside investors. Thebenefits that the controlling shareholder extracts from the firm at the expenseof other investors are generally referred to as the private benefits of control.The extent to which a firm’s controlling shareholder can extract private ben-efits from his position depends on how well the interests of outside investorsare protected in the firm’s country. Moreover, as the controlling shareholderextracts more private benefits, the outside investors’ assessment of firm valuefalls. Thus, everything else equal, given that the consumption of private bene-fits is inversely related to investor protection, firm value is lower in countriesin which investor protection is weaker.
In a world of perfect financial markets and no contracting costs, firms investin all positive net present value projects available to them and pay out thefunds that they cannot invest in such projects to shareholders. Of course, funds
Contribution of Corporate Cash Holdings and Dividends 2729
paid out to shareholders are funds that controlling shareholders cannot use tofurther their own interests. For instance, they could otherwise use these fundsto increase the empire they control, to make the firm safer so that they aremore likely to remain in control, or to increase their personal wealth throughtunneling. Controlling shareholders should therefore prefer to keep funds inliquid assets because liquid assets have a private benefit option attached tothem that other assets do not have to the same extent. Specifically, liquid assetscan immediately be invested in projects that benefit controlling shareholderspersonally. As Myers and Rajan (1998) point out, it is also easier to make cashdisappear than to make a plant disappear.
Note that we do not expect that controlling shareholders transform a firm’sliquid assets into private benefits in such a way that the firm is always starvedfor cash. Rather, consistent with Dittmar et al. (2003) and Kalcheva and Lins(2004), controlling shareholders value investing the firm’s assets in cash be-cause doing so provides them with flexibility: The cash is there to be siphonedout of the firm or to be invested in projects that provide more private benefits.To elaborate, if the cash is held by the firm, it serves as a buffer if adverseshocks occur and hence makes it more likely that controlling shareholders willretain control. However, at times controlling shareholders will take advantageof the firm’s cash to extract private benefits; for instance, because they feel thattheir control is threatened or because they simply want to cash out. Thus, onaverage, the firm will hold more cash than it should, but at times, cash hold-ings will be reduced close to the amount required for the firm to operate. Wetherefore expect that the firm’s existing cash holdings are highly vulnerable tobeing used for the future consumption of private benefits. If that is the case,then a firm’s cash should be valued at a discount because outside investors ownonly part of the firm’s cash—the rest is owned by the controlling shareholdersin the form of future private benefits. Hence, our first hypothesis is:
HYPOTHESIS 1: Cash is valued at a discount in countries with weak investorprotection.
While controlling shareholders benefit from siphoning cash after shares havebeen sold to minority investors, controlling shareholders gain from finding waysto commit to pay out all excess cash they accumulate before selling shares forthe first time. If full commitment were possible when shares are sold to in-vestors for the first time, we would find no evidence in support of our hypothe-sis. However, it is not clear how firms could fully commit themselves to such apayout policy. First, firms would have to find a way to specify how excess cashis determined. Second, in countries in which the legal system functions poorlyand the government is corrupt, controlling shareholders can simply renege onsuch a commitment. Third, such a commitment would drastically decrease thediscretion of controlling shareholders, discretion that can be extremely valu-able at times to take actions that increase firm value. Fourth, countries withpoor investor protection typically also have a low level of financial development,which makes it expensive for firms to raise capital, and consequently, any me-chanical rule about how much cash a firm can keep would force firms to go to

2730 The Journal of Finance
the capital markets frequently and hence incur heavy costs of accessing thesemarkets.
As LLSV (2000b) show, firms experience more pressure to pay dividends incountries with poor investor protection because firm resources are more likelyto be consumed as private benefits. Ignoring taxes, shareholders gain whena firm in a country with poor investor protection pays out liquid assets thatcannot be invested profitably inside the firm at a rate higher than the rateshareholders could earn on the cash outside the firm since part of it will beconsumed by the controlling shareholder. Taxation can complicate this reason-ing since, if dividends are tax disadvantaged, the value of dividends for minor-ity shareholders is reduced. However, if investor protection is sufficiently weak,the fact that private benefits cannot be taken out of dividends will more thanoffset the tax disadvantage of dividends. This discussion motivates our secondhypothesis:
HYPOTHESIS 2: Dividends contribute more to firm value in countries withweaker investor protection.
II. Test Design
To investigate whether liquid assets are valued more in countries with betterinvestor protection and whether dividends are valued less, we need a regressionmodel that relates firm value to firm characteristics. Fama and French (1998)develop a valuation regression that performs well when subjected to a batteryof tests. While this valuation regression is ad hoc in that it does not specifya functional form resulting directly from a theoretical model, it is well suitedfor our purpose because it explains well cross-section variation in firm values.1
Their basic regression specification is as follows:
Vi,t = α + β1 Ei,t + β2dEi,t + β3dEi,t+1 + β4dAi,t + β5dAi,t+1 + β6RDi,t
+ β7dRDi,t + β8dRDi,t+1 + β9 Ii,t + β10dIi,t + β11dIi,t+1 + β12Di,t
+ β13dDi,t + β14dDi,t+1 + β15d Vi,t+1 + εi,t , (1)
where Xt is the level of variable X in year t divided by the level of assets in yeart; dXt is the change in the level of X from year t − 1 to year t, Xt − Xt−1, dividedby assets in year t; dXt+1 is the change in the level of X from year t to yeart+1, Xt+1 − Xt, divided by assets in year t; V is the market value of the firmcalculated at fiscal year end as the sum of the market value of equity, the bookvalue of short-term debt, and the book value of long-term debt; E is earningsbefore extraordinary items plus interest, deferred tax credits, and investmenttax credits; A is total assets; RD is research and development (R&D) expense;
1 There is a growing literature that examines the value of cash. In addition to the papers men-
tioned in the introduction, Pinkowitz and Williamson (2005) use the Fama and French (1998) model
to analyze the determinants of the value of cash for U.S. firms, and Faulkender and Wang (2005)
propose an alternative approach that uses stock returns instead of stock prices.

Contribution of Corporate Cash Holdings and Dividends 2731
I is interest expense; and D is dividends defined as common dividends paid.When R&D is missing, we set it equal to zero.
A straightforward way to estimate the relation between market value andcash holdings in Fama and French’s model is simply to split the change inassets into its cash and noncash components:
Vi,t = α + β1 Ei,t + β2dEi,t + β3dEi,t+1 + β4dNAi,t + β5dNAi,t+1 + β6RDi,t
+ β7dRDi,t + β8dRDi,t+1 + β9 Ii,t + β10dIi,t + β11dIi,t+1 + β12Di,t
+ β13dDi,t + β14dDi,t+1 + β15d Vi,t+1 + β16d Li,t + β17d Li,t+1 + εi,t , (2)
where NA is net assets defined as total assets minus liquid assets and L corre-sponds to liquid asset holdings. With this modification, we expect the change inliquid asset holdings to contribute less to firm value in countries with poor in-stitutions, so that β16 should be lower in such countries. Note that the equationalso has the change in cash in the next period. In the Fama and French model,next-period variables are introduced to absorb changes in expectations. In con-trast, the contemporaneous change in cash we focus on corresponds directly toan increase in cash that contributes to the firm’s assets in place. We would beconcerned if, somehow, next period’s change in cash contributed more to firmvalue in countries with poorer investor protection, since in that case one mightargue that focusing on this period’s change in cash overstates the impact ofinvestor protection on the value of cash. However, this is never the case. Toestimate how investor protection is related to the coefficient on changes in cashholdings, we allow the coefficients to vary depending on investor protection.Rather than having a continuous measure of investor protection, we split thesample of countries in half each year and use a dummy variable that equalsone in countries with above-median investor protection. We then interact thisdummy variable with the independent variables and the constant. The test ofHypothesis 1 is therefore that β16 is lower for countries with weaker investorprotection, and the test of Hypothesis 2 is that coefficient β12 is larger for coun-tries with weaker investor protection.
III. Data
For the tests we describe in the previous section, we require firm-level data aswell as data on investor protection. In this section, we discuss the motivationand properties of the data we use. The Appendix reports the sources for thedata.
The firm-level data come from Thomson Financial’s Worldscope database.There are several problems in using Worldscope data. First, the data are notcomprehensive, as they have a bias toward large firms. Second, the data sufferfrom backfilling. However, we limit though not eliminate the backfilling biasbecause we have additional information on the firms reported by Worldscope invarious years for our sample. Third, the data involve different countries, andthe accounting conventions used in producing the data are not the same; there

2732 The Journal of Finance
is no clear way to make the data more comparable across countries beyond whatWorldscope already does.
We estimate our regressions using data from 1983 through 1998. However,we report results for the shorter period of 1988 to 1998. The reason for ignoringthe first 5 years is that the proportion of emerging countries covered increasessharply in the late 1980s, as does the number of firms covered. Thus, if we startin 1983 the composition of countries with poor investor protection switchesabruptly in the late 1980s, whereas if we start in 1988, there is little change inthe composition of the countries with poor investor rights. We therefore believethat our results for the period 1988 to 1998 are more reliable, but the resultsfor the longer period are consistent with these results.2
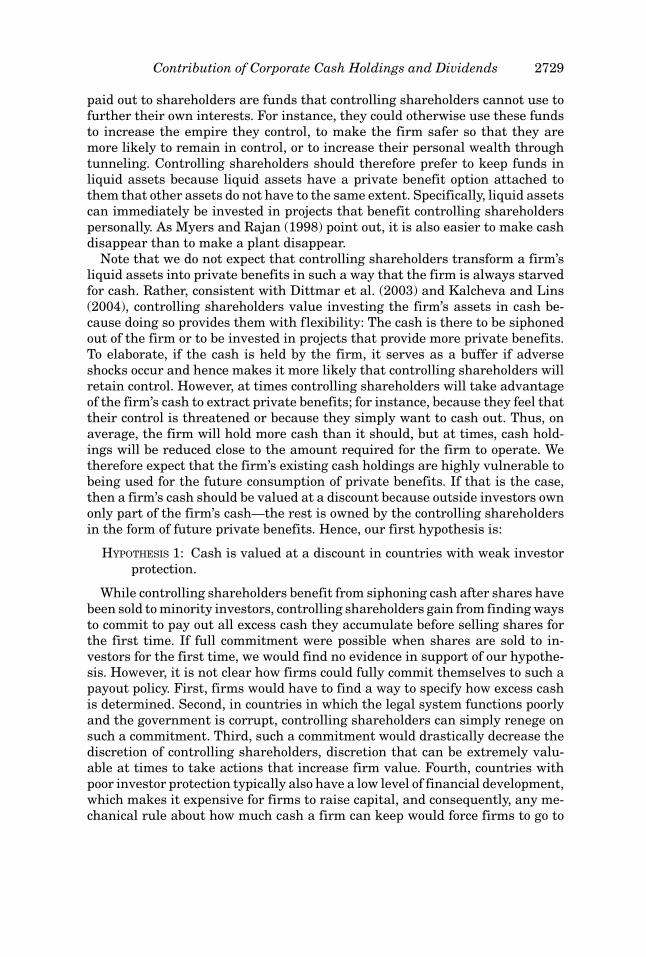
Table I reports information on the dependent variable of our regressions,that is, the market value of the firm divided by the book value of assets, aswell as the two main variables of interest, namely, cash normalized by bookvalue of assets, and dividends normalized by book value of assets. The tablealso provides information on the number of firms available in our sample.3 Aswe would expect, there is substantial variation in cash and dividends acrosscountries.
We measure the rights granted to minority shareholders with the anti-director rights index of LLSV (1998).4 This index takes values from zero tosix, where countries with a value of six are those with the best protection of mi-nority shareholder rights. We use a number of different indices to measurethe quality of institutions that support the rights of investors. If the judi-ciary in a country works poorly or corruption is rampant, it will be difficultfor investors to make use of their formal rights. We therefore use an index forthe rule of law and an index for corruption. We obtain indices from the In-ternational Country Risk Guide. Data from this guide are available monthlyfor the 1990s. The corruption index assesses the risk of corruption of highgovernment officials, while the rule of law index assesses the law and ordertradition in a country. We also use the expropriation index used by LLSV(1998). The expropriation index measures the threat of outright confiscationor “forced nationalization.” All these indices are normalized so that they takevalues from 1 through 10, with 10 corresponding to the highest level of investorprotection.
2 Another reason that our results for the period 1988–1998 are more reliable is that valuation
is likely to be more consistent across countries because of reductions in barriers to international
investment (see Stulz (2005)).3 The number of U.S. firms drops off sharply starting in 1998 because the CD version of World-
scope we use limited its coverage to roughly the 500 largest U.S. firms starting in 1998.4 LLSV (1998) state that “the index is formed by adding 1 when (1) the country allows sharehold-
ers to mail their proxy vote to the firm, (2) shareholders are not required to deposit their shares
prior to the general shareholders’ meeting, (3) cumulative voting or proportional representation of
minorities in the board of directors is allowed, (4) an oppressed minorities mechanism is in place,
(5) the minimum percentage of share capital that entitles a shareholder to call for an extraordinary
shareholders’ meeting is less than or equal to 10% (the sample median), or (6) shareholders have
preemptive rights that can be waived only by shareholders’ vote.” (p. 1123).
Contribution of Corporate Cash Holdings and Dividends 2733
Table IWorldscope Sample
Data are from 1988 to 1998 for all countries except India, Philippines, and Turkey, for which data
begin in 1989, and Peru, for which data begin in 1992. Market to book is market value of equity
plus book value of debt divided by the book value of assets. Dividends are common dividends and
cash is cash plus marketable securities. All variables are divided by book value of assets. Each year,
the median value of each variable for each country is calculated. The reported statistic is the mean
of these time-series medians. The statistics relating to number of firms detail the distribution of
firms in each country across years.
Mean No. Median No. Min No. Max No.
Market of Firms of Firms of Firms of Firms
Country to Book Dividends Cash Per Year Per Year Per Year Per Year
Argentina 0.769 0.013 0.065 14.2 18 1 30
Australia 1.013 0.023 0.044 137.8 141 95 161
Austria 0.758 0.009 0.066 34.3 36 26 42
Belgium 0.809 0.013 0.089 57.6 57 51 65
Brazil 0.586 0.006 0.047 46.1 54 4 89
Canada 0.967 0.007 0.026 292.8 307 244 330
Chile 1.125 0.045 0.046 32.7 33 12 57
Denmark 0.889 0.009 0.138 88.6 99 46 104
Finland 0.817 0.009 0.080 58.8 58 33 73
France 0.711 0.008 0.085 309.8 319 208 354
Germany 0.822 0.011 0.056 272.1 271 180 323
Greece 1.164 0.026 0.037 40.4 40 9 79
Hong Kong 0.834 0.029 0.102 100.1 78 32 238
India 1.301 0.014 0.025 57.3 11 2 232
Ireland 0.947 0.014 0.094 37.0 39 27 42
Italy 0.655 0.010 0.089 104.8 105 55 127
Japan 1.014 0.005 0.160 1442.7 1,641 180 2,030
Korea (South) 0.783 0.004 0.064 101.3 86 13 197
Malaysia 1.344 0.014 0.055 140.3 149 39 263
Mexico 0.972 0.007 0.057 33.1 30 10 51
Netherlands 0.813 0.014 0.048 113.6 120 81 126
New Zealand 0.969 0.024 0.015 25.4 22 14 39
Norway 0.897 0.006 0.119 64.8 66 47 80
Peru 1.046 0.011 0.048 10.6 11 1 18
Philippines 1.290 0.003 0.076 22.0 22 2 49
Portugal 0.763 0.009 0.025 25.9 24 11 38
Singapore 1.013 0.013 0.138 75.9 73 26 140
South Africa 0.893 0.025 0.056 102.6 102 82 126
Spain 0.808 0.014 0.039 77.8 83 47 96
Sweden 0.861 0.013 0.092 89.6 100 53 111
Switzerland 0.821 0.011 0.108 88.5 81 67 108
Thailand 1.174 0.021 0.026 86.5 92 1 171
Turkey 1.389 0.042 0.094 13.2 15 2 22
United Kingdom 0.997 0.024 0.062 962.4 1,027 632 1,080
United States 1.151 0.008 0.044 1,751.2 1,974 326 2,256
We also use two broader proxies for the protection of investor rights. First,we use a country’s political risk index from the International Country RiskGuide. A country’s political risk level consists of 12 components that comprisethe overall political risk assessment of a country. The corruption and the law

2734 The Journal of Finance
and order indices are two of the components of that index. Second, we use anindex of political discretion, the Polcon V index (see Henisz (2000)). This index isavailable annually for our sample countries. The index is a continuous variableranging from zero, indicating a dictatorship, to one, indicating democracy, andrepresents the degree to which checks and balances are present in a country’spolitical system. The expectation is that investors are better protected whenthere are more checks and balances.
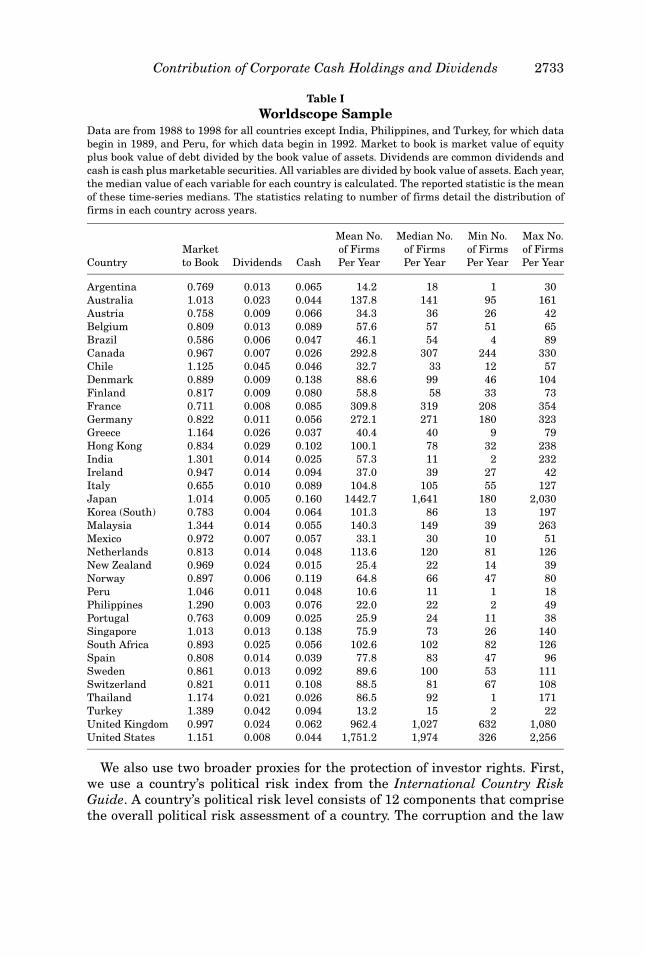
It is well known that measures of the enforcement of investor rights tendto be highly correlated with measures of economic development. This is alsothe case in our data set. For instance, the corruption index has a correlationof 0.76 with GDP per capita in our data set. We therefore want to investigatewhether our measures of the enforcement of investor rights proxy for measuresof economic development. Stock market turnover, stock market capitalizationnormalized by GDP, and total domestic credit outstanding (excluding govern-ment debt) normalized by GDP are common proxies for financial development.We therefore use each of these here. We use GDP per capita as our measure ofeconomic development.
Table II reports the means of both our investor protection indices and ourdevelopment measures. Western European countries, the United States, andCanada have high values for the indices of rights enforcement, but the Eu-ropean countries vary greatly in the values for the anti-director index. Thecountries with poor indices of rights enforcement are generally located in Asiaand South America. Switzerland has the highest average GDP per capita overthe sample period and India has the lowest. Though the financial developmentmeasures we use are standard in the literature, they lead to cross-country rank-ings that are not convincing. Germany has the highest ratio of stock marketturnover, while Chile has the lowest. We also use the ratio of bond and stockmarket capitalization to GDP. This ratio is highest for Malaysia and lowest forArgentina. The United States ranks only as high as the third most financiallydeveloped country using this measure.
IV. The Market Value of Cash Holdings
To test our two hypotheses, we start by estimating the regression model givenby equation (2). To control for heteroskedasticity, we deflate all variables bytotal assets. We follow Fama and French (1998) and estimate equation (2) usingFama–MacBeth (1973) regressions. To reduce the effect of outliers, we trim oursample at the 1% level by dropping 0.5% in each tail of each variable. FollowingFama and French (1998), we trim based on the full sample so that while we trim1% of the observations for each of 18 different variables, we lose only 8.6% of thetotal observations. Our final sample contains 75,887 firm years representing12,339 unique firms.
Table III shows estimates of a regression that allows for different interceptsand slopes for countries with better investor protection. We use two indices ofinvestor protection. The first index is the corruption index from the Interna-tional Country Risk Guide. The second index is the anti-director rights indexfrom LLSV (1998).
Contribution of Corporate Cash Holdings and Dividends 2735
Tab
leII
Mea
ns
ofC
oun
try-
Lev
elV
aria
ble
sA
cros
sY
ears
ICR
GP,
the
overa
llp
oli
tica
lri
skm
ea
sure
,Cor
rupt
ion
,th
ele
velofgovern
men
tco
rru
pti
on
,an
dL
aw/
Ord
er,t
he
law
-an
d-o
rder
tra
dit
ion
inea
chco
un
try,
all
com
efr
om
the
Inte
rnat
ion
alC
oun
try
Ris
kG
uid
e(I
CR
G).
We
ob
tain
Pol
con
,th
eP
olc
on
Vm
ea
sure
of
govern
men
tce
ntr
ali
zati
on
,fr
om
Hen
isz
(20
00
)
an
db
oth
Exp
risk
,th
eri
skofou
trig
ht
con
fisc
ati
on
,a
nd
An
tid
irr,
an
ind
ex
mea
sure
ofth
ep
rote
ctio
nofsh
are
hold
er
righ
ts,fr
om
LL
SV
(19
98
).F
rom
the
Worl
dD
evelo
pm
en
tIn
dic
ato
rsw
ed
eri
ve
Sca
p,st
ock
ma
rket
cap
ita
liza
tion
toG
DP,
an
dS
turn
,sto
ckm
ark
et
turn
over
defi
ned
as
an
nu
al
tota
ld
oll
ar
am
ou
nt
tra
ded
div
ided
by
stock
ma
rket
cap
ita
liza
tion
.B
on
dm
ark
et
cap
ita
liza
tion
toG
DP
(Bca
p)is
from
the
Ba
nk
for
Inte
rna
tion
al
Sett
lem
en
ts.
Tca
pis
the
sum
of
bon
dm
ark
et
cap
ita
liza
tion
an
dst
ock
ma
rket
cap
ita
liza
tion
toG
DP.A
llva
ria
ble
sa
refr
om
19
88
to1
99
8exce
pt
for
Bca
pa
nd
Tca
p,w
hic
hst
art
in1
98
9.
Cou
ntr
yIC
RG
PC
orr
up
tion
Law
/Ord
er
Polc
on
Exp
risk
An
tid
irr
Sca
pS
turn
GD
PB
cap
Tca
p
Arg
en
tin
a7
3.5
14
.73
7.6
00
.70
5.9
14
.00
0.1
20
.35
7,1
71
0.0
20
.14
Au
stra
lia
81
.05
8.3
31
0.0
00
.87
9.2
74
.00
0.6
00
.41
20
,02
80
.15
0.7
6
Au
stri
a8
5.8
88
.11
10
.00
0.7
49
.69
2.0
00
.13
0.6
02
8,4
89
0.3
10
.45
Belg
ium
79
.41
7.7
09
.70
0.8
99
.63
0.0
00
.45
0.1
62
6,5
59
0.5
40
.99
Bra
zil
66
.57
5.6
05
.42
0.7
47
.62
3.0
00
.19
0.4
64
,28
10
.12
0.3
7
Ca
na
da
82
.96
10
.00
10
.00
0.8
69
.67
5.0
00
.61
0.4
61
9,4
30
0.1
10
.74
Ch
ile
73
.12
5.5
77
.65
0.7
17
.50
5.0
00
.79
0.0
94
,08
30
.14
0.9
8
Den
ma
rk8
5.1
61
0.0
01
0.0
00
.77
9.6
72
.00
0.3
60
.42
33
,39
41
.02
1.3
9
Fin
lan
d8
5.6
11
0.0
01
0.0
00
.77
9.6
73
.00
0.3
90
.34
25
,92
60
.34
0.7
3
Fra
nce
79
.77
8.2
79
.17
0.7
49
.65
3.0
00
.36
0.5
52
6,4
40
0.5
0.8
7
Germ
an
y8
2.1
99
.05
9.7
80
.84
9.9
01
.00
0.2
71
.37
29
,40
20
.49
0.7
6
Gre
ece
73
.83
8.3
38
.62
0.7
17
.12
2.0
00
.20
0.3
51
1,2
17
0.0
30
.24
Hon
gK
on
g7
2.4
47
.82
6.8
48
.29
5.0
01
.97
0.5
12
0,9
19
0.0
72
.11
Ind
ia6
3.0
34
.96
6.5
60
.74
7.7
55
.00
0.2
70
.39
36
00
.01
0.2
7
Irela
nd
80
.79
7.9
18
.81
0.7
69
.67
4.0
00
.22
0.6
21
7,1
69
0.0
40
.27
Ita
ly7
4.8
56
.16
8.7
60
.77
9.3
51
.00
0.2
00
.45
18
,67
00
.31
0.5
1
Ja
pa
n8
2.3
78
.16
9.4
60
.76
9.6
74
.00
0.8
40
.43
41
,21
80
.44
1.2
3
(con
tin
ued
)

2736 The Journal of Finance
Tab
leII
—C
onti
nu
ed
Cou
ntr
yIC
RG
PC
orr
up
tion
Law
/Ord
er
Polc
on
Exp
risk
An
tid
irr
Sca
pS
turn
GD
PB
cap
Tca
p
Kore
a(S
ou
th)
75
.01
7.2
37
.23
0.7
08
.31
2.0
00
.37
1.2
49
,53
10
.35
0.7
2
Ma
laysi
a7
4.1
36
.62
7.4
00
.74
7.9
54
.00
1.7
60
.42
3,7
82
0.2
92
.16
Mexic
o6
9.3
84
.76
4.9
20
.33
7.2
91
.00
0.2
80
.40
3,2
69
0.0
10
.31
Neth
erl
an
ds
86
.04
10
.00
10
.00
0.7
59
.98
2.0
00
.76
0.5
62
6,1
51
0.2
41
.03
New
Zea
lan
d8
3.4
89
.49
9.9
30
.74
9.6
94
.00
0.4
30
.28
15
,71
10
.00
0.4
4
Norw
ay
84
.55
9.5
81
0.0
00
.77
9.8
84
.00
0.2
70
.54
31
,95
70
.23
0.5
1
Peru
54
.49
5.0
04
.62
0.3
95
.54
3.0
00
.19
0.3
22
,18
10
.02
0.2
3
Ph
ilip
pin
es
65
.10
5.0
26
.27
0.6
65
.22
3.0
00
.53
0.3
01
,08
70
.00
0.5
3
Port
uga
l7
7.6
98
.16
8.8
20
.75
8.9
03
.00
0.2
10
.38
10
,50
90
.12
0.3
4
Sin
ga
pore
82
.07
6.7
29
.38
0.6
89
.30
4.0
01
.37
0.4
72
0,9
09
0.1
41
.56
Sou
thA
fric
a6
6.3
08
.17
4.3
60
.51
6.8
85
.00
1.4
10
.11
3,9
68
0.1
51
.56
Sp
ain
73
.70
7.2
18
.59
0.7
59
.52
4.0
00
.34
0.7
01
4,6
04
0.1
50
.49
Sw
ed
en
83
.66
10
.00
10
.00
0.7
69
.40
3.0
00
.68
0.4
52
7,0
47
0.5
51
.24
Sw
itze
rla
nd
88
.51
9.5
91
0.0
00
.84
9.9
82
.00
1.2
60
.77
44
,32
90
.53
0.8
4
Th
ail
an
d6
8.8
74
.70
8.2
40
.73
7.4
22
.00
0.5
00
.79
2,4
06
0.0
80
.61
Tu
rkey
57
.94
5.0
56
.62
0.7
27
.00
2.0
00
.15
1.0
22
,78
30
.01
0.1
6
Un
ited
Kin
gd
om
80
.36
8.3
19
.13
0.7
49
.71
5.0
01
.17
0.5
11
8,7
21
0.1
81
.37
Un
ited
Sta
tes
79
.62
8.2
61
0.0
00
.85
9.9
85
.00
0.8
70
.74
27
,16
10
.82
1.7
2

Contribution of Corporate Cash Holdings and Dividends 2737
Table III
The Change in Value of Cash and Investor ProtectionWe estimate regressions using the method of Fama and MacBeth (1973). Each regression in-cludes 11 cross-sections. Regressions are estimated independently for each subsample allowingcoefficients on control variables to vary across subsamples. Xt is the level of variable X in yeart divided by the level of assets in year t. dXt is the change in the level of X from year t−1 toyear t divided by total assets in year t((Xt − Xt−1)/At). dXt+1 is the change in the level of X fromyear t+1 to year t divided by assets in year t((Xt+1 − Xt)/At). A is the book value of assets. V isthe market value of the equity plus the book value of debt. E is earnings defined as earningsbefore extraordinary items plus interest plus deferred tax credits plus investment tax credits.NA is net assets, which is defined as total assets minus cash. RD is research and developmentexpense. When R&D is missing, it is set to zero. I is interest expense. D is common dividends. Lis liquid assets, defined as cash and cash equivalents. Standard errors are in parentheses. Theestimated regression is
Vi,t = α + β1 Ei,t + β2dEi,t + β3dEi,t+1 + β4dNAi,t + β5dNAi,t+1 + β6RDi,t
+ β7dRDi,t + β8dRDi,t+1 + β9 Ii,t + β10dIi,t + β11dIi,t+1 + β12 Di,t
+ β13dDi,t + β14dDi,t+1 + β15dVi,t+1 + β16dLi,t + β17dLi,t+1 + εi,t .
High Low p-value Poor Good p-value
Corruption Corruption of Difference Anti-director Anti-director of Difference
Intercept 0.75 0.79 0.3498 0.60 0.83 0.0000
(0.036) (0.048) (0.013) (0.051)
Et 3.49 2.97 0.3403 2.37 3.02 0.1337
(0.437) (0.222) (0.349) (0.177)
dEt −0.71 −0.28 0.1109 −0.77 −0.27 0.0069
(0.320) (0.110) (0.204) (0.116)
dEt+1 0.99 1.64 0.2756 0.44 1.50 0.0003
(0.505) (0.172) (0.284) (0.160)
dNAt 0.21 0.54 0.0085 0.16 0.50 0.0006
(0.065) (0.100) (0.091) (0.090)
dNAt+1 0.15 0.24 0.3624 0.04 0.13 0.3778
(0.063) (0.056) (0.078) (0.048)
RDt −3.47 4.84 0.0000 0.40 5.16 0.0000
(1.404) (0.786) (0.595) (0.884)
dRDt 11.02 4.57 0.1421 4.25 4.78 0.7738
(4.381) (1.256) (1.780) (1.369)
dRDt+1 6.14 8.94 0.4902 4.33 9.36 0.0212
(3.566) (1.201) (1.778) (1.305)
It −4.18 −2.40 0.0001 −0.40 −2.89 0.0003
(0.933) (0.972) (0.393) (0.943)
dIt 1.66 −0.78 0.0047 0.47 −0.48 0.1908
(0.547) (0.888) (0.899) (0.540)
dIt+1 −1.44 −3.70 0.0330 −0.90 −2.26 0.0730
(0.697) (0.530) (0.549) (0.423)
Dt 6.56 4.03 0.0014 9.80 4.07 0.0258
(0.441) (1.091) (1.659) (1.236)
dDt −2.66 0.90 0.0774 −2.76 0.40 0.0353
(1.687) (0.552) (1.394) (0.443)
dDt+1 2.05 1.82 0.8218 4.03 −0.52 0.0136
(0.914) (0.686) (1.568) (1.015)
dVt+1 −0.11 0.06 0.1638 0.06 0.03 0.8185
(0.093) (0.048) (0.120) (0.041)
dLt 0.33 0.91 0.0094 0.29 0.95 0.0318
(0.163) (0.186) (0.202) (0.194)
dLt+1 0.23 0.69 0.0008 0.25 0.45 0.3662
(0.107) (0.121) (0.159) (0.136)

2738 The Journal of Finance
When we use the corruption index, countries with better investor protectionare countries where the corruption index is above its median value. We findthat, as predicted, cash contributes significantly more to firm value in coun-tries with better investor protection. Given our regression, we can evaluate theimpact of a change in cash holdings keeping every other variable in the regres-sion unchanged. Consequently, we can evaluate the impact of an increase incash that brings about an increase in total assets by the same amount ratherthan an exchange of fixed assets for cash. A one-dollar increase in cash holdingsis associated with an increase in firm value of $0.33 in countries with high cor-ruption and an increase of $0.91 in countries with low corruption. We find thata one-dollar increase in noncash assets is associated with an increase in firmvalue of $0.21 in countries with high corruption, but with an increase of $0.54 incountries with low corruption. The regression is consistent with a greater dis-count for cash than for fixed assets in countries with poor institutions. We findthat a dollar of cash contributes $0.58 less to firm value in countries with poorinstitutions, while a dollar of physical assets contributes $0.33 less. The regres-sion provides no evidence that earnings are valued more in countries with lowcorruption or that firms have higher values in countries with low corruptionirrespective of firm characteristics.
The second regression reported in Table III uses the anti-director index in-stead of the corruption index. This regression provides similar results in thatthere is a stronger relation between changes in cash and firm value for coun-tries with better institutions. We find that an additional dollar of cash built upover the most recent year is associated with a change in firm value of $0.29 incountries with a low anti-director index and a change of $0.95 in countries witha high value of the index. Again, increases in other assets are discounted lessin countries with poor investor protection than are increases in cash. How-ever, in contrast to the regression that uses the corruption index, firms incountries with a high anti-director index are valued more irrespective of firmcharacteristics.
In sum, the two regressions reproduced in Table III provide strong supportfor Hypothesis 1. We now turn to Hypothesis 2. If cash is worth less in coun-tries with high corruption, we would expect payouts to be worth more. In theregression that uses the corruption index as the index of investor protection, wefind that the coefficient on the dividend payout is 6.56 in countries with highcorruption and 4.03 in countries with low corruption. The difference betweenthe two coefficients is significant at better than the 1% level.5 In the regressionwith the anti-director index, the coefficient on the dividend payout is 9.80 forcountries with a low value of the index and 4.07 in countries with a high value
5 The joint tests of significance for the FM regressions are done using a stacked regression
framework. We interact the dummy variable for investor protection with a constant and every
independent variable and estimate that equation with the FM technique. Hence, the statistical
significance reported is a t-test of whether the mean of the differences in the coefficients is zero
rather than a test of whether the difference of the means is zero. This is more appropriate since it
directly compares the coefficients by year and uses the standard error of those differences to derive
statistical significance.

Contribution of Corporate Cash Holdings and Dividends 2739
of the index. The difference has a p-value of 0.026. Both regressions supportHypothesis 2.
A concern with the regressions shown in Table III is that the increase in cashmay change expectations about future growth as well. In principle, this shouldnot be an issue since the Fama–French model includes lead variables to pickup expectations. However, one way to investigate this is to replace the lead andlag of cash changes with the level of cash, as follows:
Vi,t = α + β1Ei,t + β2dEi,t + β3dEi,t+1 + β4dNAi,t + β5dNAi,t+1 + β6RDi,t
+ β7dRDi,t + β8dRDi,t+1 + β9 Ii,t + β10dIi,t + β11dIi,t+1 + β12Di,t
+ β13dDi,t + β14dDi,t+1 + β15dVi,t+1 + β16Li,t + εi,t . (3)
With this equation, the coefficient on cash holdings measures the sensitivity offirm value to a one-dollar increase in cash holdings. Provided that the impactof a change in cash holdings on future cash flows is captured by the variablesin the Fama–French model that capture expectations, the coefficient on cashholdings is an estimate of the market value of a dollar of cash.
The equations we estimate are similar to those estimated by Pinkowitz andWilliamson (2005) for the United States, except that we allow the intercept andslopes to differ for countries with better institutions. In Table IV, we reportestimates of the regression reported in equation (3) when investor protectionis measured by corruption and by the anti-director index. In both cases, thereis a significantly stronger (weaker) relation between firm value and cash (div-idends) for countries with better investor protection than for other countries.Thus, this regression specification also supports our two hypotheses.
We estimate regressions using each of our investor protection indices inTable V. For brevity and ease of presentation, we only report the coefficientsthat are of direct interest.6 Also, to facilitate comparison, we reproduce againthe coefficients for the regressions of Tables III and IV. With our sample, weare able to estimate 11 cross-section regressions for all the investor protectionproxies as well as GDP per capita. Due to data limitations, we have only 10cross-sections to test for the relation between the value of cash and bond mar-ket capitalization or total capital market capitalization. In Panel A, we reportthe coefficients on changes in cash for the specification of Table III in the firsttwo columns, and the coefficients on the level of cash for the specification ofTable IV in the third and fourth columns.
First, for all our measures of investor protection, the coefficient on the changein cash is indistinguishable from one for countries with high investor protectionand is significantly lower than one for the other countries. However, the differ-ence between the two coefficients is significant only for the corruption indexand the anti-director index. In contrast, when we use the level of cash, all thedifferences are significant.
We mention earlier that the indices of the enforcement of investor rightsare highly correlated with economic development. We therefore investigate the
6 Full results of the estimation are available upon request from the authors.

2740 The Journal of Finance
Table IVThe Value of Cash and Investor Protection
We estimate regressions using the method of Fama and MacBeth (1973). Each regression includes 11
cross-sections. Regressions are estimated independently for each subsample, allowing coefficients on
control variables to vary across subsamples. Xt is the level of variable X in year t divided by the level
of assets in year t. dXt is the change in the level of X from year t−1 to year t divided by total assets in
year t ((Xt − Xt−1)/At). A is the book value of assets. dXt+1 is the change in the level of X from year t to
year t+1 divided by assets in year t ((Xt+1 − Xt)/At). V is the market value of the equity plus the book
value of debt. E is earnings defined as earnings before extraordinary items plus interest plus deferred
tax credits plus investment tax credits. NA is net assets, which is defined as total assets minus cash.
RD is research and development expense. When R&D is missing, it is set to zero. I is interest expense.
D is common dividends. L is liquid assets, defined as cash and cash equivalents. Standard errors are
in parentheses. The estimated regression is
Vi,t = α + β1 Ei,t + β2dEi,t + β3dEi,t+1 + β4dNAi,t + β5dNAi,t+1 + β6RDi,t
+ β7dRDi,t + β8dRDi,t+1 + β9 Ii,t + β10dIi,t + β11dIi,t+1 + β12 Di,t
+ β13dDi,t + β14dDi,t+1 + β15dVi,t+1 + β16 Li,t + εi,t .
High Low p-value of Low High p-value of
Corruption Corruption Difference Anti-director Anti-director Difference
Intercept 0.76 0.57 0.0000 0.56 0.63 0.0152
(0.037) (0.036) (0.017) (0.031)
Et 3.58 3.02 0.3316 2.25 3.04 0.0718
(0.457) (0.223) (0.371) (0.170)
dEt −0.68 −0.21 0.0750 −0.66 −0.21 0.0300
(0.309) (0.121) (0.207) (0.129)
dEt+1 1.04 1.80 0.2215 0.47 1.60 0.0004
(0.527) (0.171) (0.325) (0.155)
dNAt 0.18 0.66 0.0000 0.19 0.61 0.0000
(0.057) (0.088) (0.095) (0.085)
dNAt+1 0.15 0.19 0.7074 0.03 0.11 0.3900
(0.065) (0.054) (0.078) (0.044)
RDt −3.43 4.35 0.0000 0.23 4.66 0.0000
(1.394) (0.777) (0.586) (0.901)
dRDt 11.35 4.17 0.1042 4.42 4.43 0.9972
(4.432) (1.230) (1.844) (1.355)
dRDt+1 6.22 8.35 0.6027 4.34 8.69 0.0435
(3.569) (1.231) (1.770) (1.313)
It −4.42 1.06 0.0000 0.12 −0.07 0.6466
(0.980) (0.927) (0.431) (0.659)
dIt 1.95 −1.60 0.0001 0.16 −1.17 0.0560
(0.566) (0.874) (0.901) (0.597)
dIt+1 −1.46 −2.22 0.4627 −0.83 −1.71 0.1919
(0.781) (0.471) (0.559) (0.395)
Dt 6.38 4.58 0.0126 9.87 4.60 0.0311
(0.455) (0.954) (1.658) (1.085)
dDt −2.59 0.15 0.1700 −2.83 −0.17 0.0483
(1.730) (0.538) (1.335) (0.444)
dDt+1 2.25 1.74 0.6331 4.16 −0.22 0.0138
(0.916) (0.763) (1.567) (0.924)
dVt+1 −0.10 0.08 0.1151 0.07 0.05 0.8566
(0.093) (0.043) (0.116) (0.040)
Lt −0.03 1.24 0.0000 0.39 1.17 0.0000
(0.069) (0.100) (0.048) (0.123)

Contribution of Corporate Cash Holdings and Dividends 2741
Table VThe Value of Cash, Institutional Quality, and Investor Protection
We estimate regressions using the method of Fama and MacBeth (1973). The definitions of the variables
in the regressions are given in Tables III and IV. Each regression includes 11 cross-sections except the
regressions classifying countries using bond and total market capitalizations, which have 10. Separate
regressions are run independently for each subsample, thus, the intercept and all the slopes are allowed
to vary across the subsamples. Countries with a high level of investor protection are countries with an
index of investor protection above the country median and those with a low level of protection have index
below the country median. Standard errors are in parentheses. ∗, ∗∗, ∗∗∗ indicates significant difference
between the high and low coefficient at the 10%, 5%, and 1% significance levels, respectively.
Change in Cash Regressions
Vi,t = α + β1 Ei,t + β2dEi,t + β3dEi,t+1 + β4dNAi,t + β5dNAi,t+1 + β6RDi,t
+ β7dRDi,t + β8dRDi,t+1 + β9 Ii,t + β10dIi,t + β11dIi,t+1 + β12 Di,t
+ β13dDi,t + β14dDi,t+1 + β15dVi,t+1 + β16dLi,t + β17dLi,t+1 + εi,t
Level of Cash Regressions
Vi,t = α + β1 Ei,t + β2dEi,t + β3dEi,t+1 + β4dNAi,t + β5dNAi,t+1 + β6RDi,t
+ β7dRDi,t + β8dRDi,t+1 + β9 Ii,t + β10dIi,t + β11dIi,t+1 + β12 Di,t
+ β13dDi,t + β14dDi,t+1 + β15dVi,t+1 + β16 Li,t + εi,t
Panel A: Cash Holdings
Change in Cash Regressions Level of Cash Regressions
Institution Quality High (β16) Low (β16) High (β16) Low (β16)
Corruption 0.91∗∗∗ 0.33 1.24∗∗∗ −0.03
(0.186) (0.163) (0.100) (0.069)
Polcon 0.97 0.63 1.18∗∗∗ 0.78
(0.234) (0.152) (0.129) (0.065)
ICRGP 0.90 0.45 1.19∗∗∗ 0.18
(0.199) (0.189) (0.102) (0.081)
Rule of law 0.91 0.44 1.20∗∗∗ 0.26
(0.193) (0.200) (0.100) (0.091)
Expropriation 0.90 0.39 1.17∗∗∗ 0.54
(0.203) (0.158) (0.103) (0.102)
Anti-director rights 0.95∗∗ 0.29 1.17∗∗∗ 0.39
(0.194) (0.202) (0.123) (0.048)
Financial Development High (β16) Low (β16) High (β16) Low (β16)
Stock market turnover 1.00∗∗∗ 0.45 1.30∗∗∗ 0.73
(0.207) (0.134) (0.132) (0.084)
Stock market 0.95∗∗∗ 0.27 1.22∗∗∗ 0.21
capitalization to GDP (0.188) (0.139) (0.106) (0.065)
Bond market 0.91 0.92 1.13 1.01
capitalization to GDP (0.181) (0.288) (0.129) (0.154)
Total market 0.91 0.92 1.16∗∗ 0.71
capitalization to GDP (0.184) (0.252) (0.114) (0.137)
Economic development High (β16) Low (β16) High (β16) Low (β16)
GDP per capita 0.87 0.43 1.15∗∗∗ 0.53
(0.193) (0.212) (0.103) (0.116)
(continued)

2742 The Journal of Finance
Table V—Continued
Panel B: Dividends
Change in Cash Regressions Level of Cash Regressions
Institution Quality High (β12) Low (β12) High (β12) Low (β12)
Corruption 4.03∗∗∗ 6.56 4.58∗∗ 6.38
(1.091) (0.441) (0.954) (0.455)
Polcon 4.52∗∗∗ 7.87 5.15∗∗ 7.70
(0.998) (1.558) (0.836) (1.560)
ICRGP 4.26 6.25 4.81 6.02
(1.119) (0.295) (0.948) (0.259)
Rule of law 4.26 6.36 4.81 6.13
(1.117) (0.339) (0.948) (0.308)
Expropriation 4.15∗ 6.43 4.68 6.40
(1.152) (0.452) (0.972) (0.465)
Anti-director rights 4.07∗∗ 9.80 4.59∗∗ 9.87
(1.236) (1.659) (1.085) (1.658)
Financial Development High (β12) Low (β12) High (β12) Low (β12)
Stock market turnover 3.87∗∗∗ 7.16 4.09∗∗∗ 7.49
(1.101) (0.789) (0.882) (0.846)
Stock market 4.10∗∗∗ 10.31 4.56∗∗∗ 10.16
Capitalization to GDP (1.165) (1.334) (1.028) (1.334)
Bond market 5.67 5.93 6.26 5.49
Capitalization to GDP (1.074) (0.901) (0.927) (0.886)
Total market 5.13 6.12 5.56 5.72
Capitalization to GDP (1.053) (0.919) (0.917) (0.928)
Economic development High (β12) Low (β12) High (β12) Low (β12)
GDP per capita 4.52 5.85 4.92 5.69
(1.112) (0.439) (0.960) (0.397)
relation between the value of cash holdings and measures of economic andfinancial development. We use four variables as proxies for the degree of finan-cial development: stock market turnover, stock market capitalization, corporatebond market capitalization, and total market (stock plus bond) capitalization.For normalization purposes, all of the variables except turnover are deflated bythe annual GDP of the country. We use annual GDP per capita as our measure ofeconomic development. We find that cash holdings are valued more in countrieswith higher financial development and higher economic development.
The result that cash is worth more in countries with a higher level of financialand economic development raises the concern that the higher value of cash incountries with better investor protection is due to development rather thaninvestor protection. A priori, this seems implausible. If cash is worth littlewhen managers maximize firm value, they would want to decrease their cashholdings either by investing the funds or by paying them out. Consequently,we believe that cash is worth less in countries with a low level of developmentprecisely because these countries have poor investor protection. We explore thisissue more in the next section.

Contribution of Corporate Cash Holdings and Dividends 2743
In Panel B, we report results on the value of dividends. For all of our indices,dividends are worth more in countries with poorer investor protection, there-fore supporting Hypothesis 2. The difference in coefficients is significant for allindices except the rule of law index and the political risk index when we usethe change in cash regressions. In addition, the difference is not significant forthe expropriation index when we use the cash level regressions. The differencein coefficients is significant for only two of the four measures of financial devel-opment and is not significant for the measure of economic development. Thus,the concern we have that the valuation differences for cash might be due to dif-ferences in economic and financial development does not seem to be pertinentfor the valuation of dividends.
V. Alternative Explanations
We investigate two sets of alternative explanations for our results. First, weassume that the coefficient on cash is significantly higher in high investor pro-tection countries and the coefficient on dividends is significantly lower in thesecountries, and consider other possible interpretations for the results. Second,we address the possibility that the significance of our results is misstated.
A. Alternative Interpretations of the Coefficients
A legitimate concern about our results is that the low coefficients on cashholdings and high coefficients on dividends for countries with poor institutionscould be explained in other ways than through the impact of poor investor pro-tection on agency costs. We investigate four possible explanations using subsetsof firms. It is important to reiterate that, while such an approach is instruc-tive, it is also limited by the fact that the number of firms and the number ofcountries differ across subsets. Countries with poor economic development andpoor investor protection typically have few firms. There are also few countrieswith poor economic development but high investor protection.
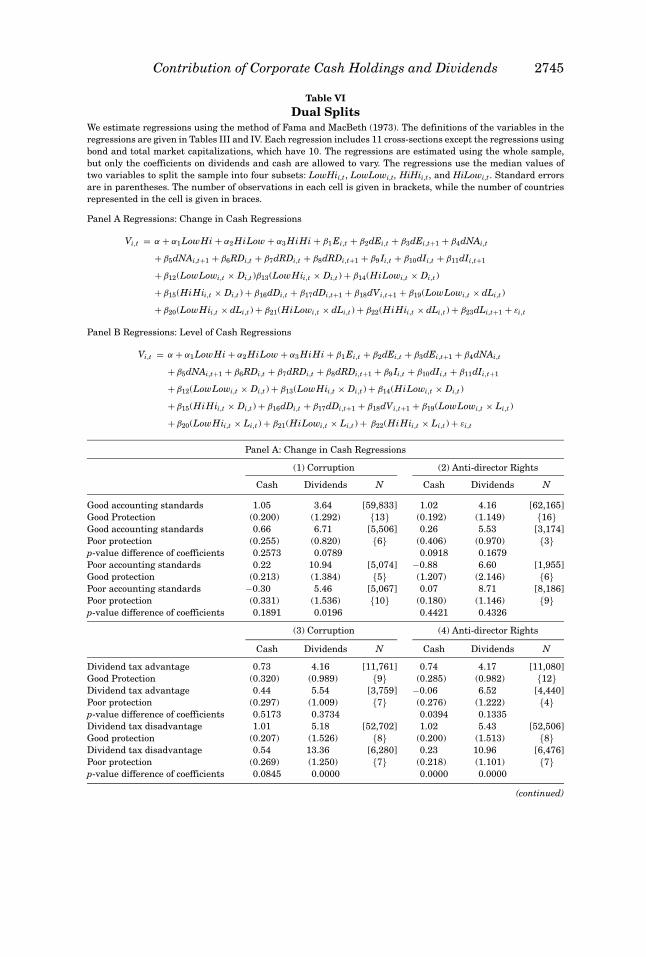
First, a possible alternative explanation for our results for cash holdings issimply that investors believe that accounting statements misrepresent cashholdings more in countries with poor investor protection than in countries withgood investor protection. To the extent that firms represent cash holdings to behigher than they actually are, this suggests that the slope coefficient on cashshould be lower in countries where misrepresentation is higher. However, inthat case, if we had the correct amount of cash, the slope coefficient might notbe different from what it is for countries with no misrepresentation. We use theaccounting index of LLSV (1998) to investigate whether lack of transparencyalone could explain our cash result. In other words, we verify whether cash isvalued as much in high corruption countries with an above-median value ofthe accounting index as it is in low corruption countries with an above-medianvalue of the accounting index. This way of dividing the sample gives us fourgroups of firms. Since we therefore have four slope coefficients on cash holdings,

2744 The Journal of Finance
we only allow the intercept and the coefficients on cash holdings and dividendsto differ. The results are shown in regression (1) of Table VI, Panel A whenwe use the change in cash and in regression (1) of Panel B when we use thelevel of cash. Note that an above-median accounting index is not sufficient forthe slopes on the change in cash or the level of cash to be close to one. Thedifferences in slopes across subgroups are significant when we use the level ofcash, but not when we use changes in cash. The difficulty with this experimentis that there are few firms that belong to countries with an above-median valueof the accounting index and a below-median value of the corruption index inregression (2). Similar results hold when we use the anti-director index ratherthan corruption. We reproduce results for dividends for completeness. Amongcountries with good accounting standards, the coefficient on dividends is higherin countries with poorer investor protection, but the difference is significantonly for the corruption index. When we turn to countries with poor accountingstandards, we obtain the puzzling result that dividends contribute less to firmvalue in countries with a low corruption index than in countries with a highercorruption index.
Second, there could be a negative correlation between the extent to whichdividends are tax disadvantaged and investor protection. It is therefore pos-sible that cash could be worth less in countries with poor investor protectionbecause it would be more heavily taxed when paid out to shareholders. If thiswere the case, however, the coefficient on dividends would be extremely puz-zling. Nevertheless, we investigate this possibility. There is a weak negativerelation between the dividend preference measure of LLSV (2000b) and theinvestor protection indices. To account for differences in the tax treatment ofdividends, we split the sample of countries into four groups based on dividendtax treatment and the corruption index. Regression (3) of Table VI, Panels Aand B shows that the coefficient on cash is higher in countries with less cor-ruption compared to countries with more corruption irrespective of whether welook at countries with a tax advantage or a tax disadvantage for dividends (butthe difference is not significant for the countries with a dividend tax advantagewith the change in cash regressions). We proceed in the same way using theanti-director index instead of the corruption index. The results are reproducedin regression (4). Again, the result that cash has a higher coefficient in coun-tries with better minority shareholder protection holds when the comparisonis made across countries in which dividends have a similar tax status. Turningto dividends, we find that they contribute more to firm value in countries withpoor investor protection after controlling for the tax treatment of dividends (butsignificantly so only for countries in which dividends are tax disadvantaged inthe change in cash regressions).7
7 It is not clear how to interpret the result that the coefficient on dividends is higher in countries
with a tax disadvantage for dividends. One possibility is that a tax disadvantage for dividends
implicitly subsidizes the consumption of private benefits, making dividends more valuable for
minority shareholders at the margin.
Contribution of Corporate Cash Holdings and Dividends 2745
Table VI
Dual SplitsWe estimate regressions using the method of Fama and MacBeth (1973). The definitions of the variables in the
regressions are given in Tables III and IV. Each regression includes 11 cross-sections except the regressions using
bond and total market capitalizations, which have 10. The regressions are estimated using the whole sample,
but only the coefficients on dividends and cash are allowed to vary. The regressions use the median values of
two variables to split the sample into four subsets: LowHii,t, LowLowi,t, HiHii,t, and HiLowi,t. Standard errors
are in parentheses. The number of observations in each cell is given in brackets, while the number of countries
represented in the cell is given in braces.
Panel A Regressions: Change in Cash Regressions
Vi,t = α + α1 LowHi + α2 HiLow + α3 HiHi + β1 Ei,t + β2dEi,t + β3dEi,t+1 + β4dNAi,t
+ β5dNAi,t+1 + β6RDi,t + β7dRDi,t + β8dRDi,t+1 + β9 Ii,t + β10dIi,t + β11dIi,t+1
+ β12(LowLowi,t × Di,t )β13(LowHii,t × Di,t ) + β14(HiLowi,t × Di,t )
+ β15(HiHii,t × Di,t ) + β16dDi,t + β17dDi,t+1 + β18dVi,t+1 + β19(LowLowi,t × dLi,t )
+ β20(LowHii,t × dLi,t ) + β21(HiLowi,t × dLi,t ) + β22(HiHii,t × dLi,t ) + β23dLi,t+1 + εi,t
Panel B Regressions: Level of Cash Regressions
Vi,t = α + α1 LowHi + α2 HiLow + α3 HiHi + β1 Ei,t + β2dEi,t + β3dEi,t+1 + β4dNAi,t
+ β5dNAi,t+1 + β6RDi,t + β7dRDi,t + β8dRDi,t+1 + β9 Ii,t + β10dIi,t + β11dIi,t+1
+ β12(LowLowi,t × Di,t ) + β13(LowHii,t × Di,t ) + β14(HiLowi,t × Di,t )
+ β15(HiHii,t × Di,t ) + β16dDi,t + β17dDi,t+1 + β18dVi,t+1 + β19(LowLowi,t × Li,t )
+ β20(LowHii,t × Li,t ) + β21(HiLowi,t × Li,t ) + β22(HiHii,t × Li,t ) + εi,t
Panel A: Change in Cash Regressions
(1) Corruption (2) Anti-director Rights
Cash Dividends N Cash Dividends N
Good accounting standards
Good Protection
1.05 3.64 [59,833] 1.02 4.16 [62,165]
(0.200) (1.292) {13} (0.192) (1.149) {16}Good accounting standards
Poor protection
0.66 6.71 [5,506] 0.26 5.53 [3,174]
(0.255) (0.820) {6} (0.406) (0.970) {3}p-value difference of coefficients 0.2573 0.0789 0.0918 0.1679
Poor accounting standards
Good protection
0.22 10.94 [5,074] −0.88 6.60 [1,955]
(0.213) (1.384) {5} (1.207) (2.146) {6}Poor accounting standards
Poor protection
−0.30 5.46 [5,067] 0.07 8.71 [8,186]
(0.331) (1.536) {10} (0.180) (1.146) {9}p-value difference of coefficients 0.1891 0.0196 0.4421 0.4326
(3) Corruption (4) Anti-director Rights
Cash Dividends N Cash Dividends N
Dividend tax advantage
Good Protection
0.73 4.16 [11,761] 0.74 4.17 [11,080]
(0.320) (0.989) {9} (0.285) (0.982) {12}Dividend tax advantage
Poor protection
0.44 5.54 [3,759] −0.06 6.52 [4,440]
(0.297) (1.009) {7} (0.276) (1.222) {4}p-value difference of coefficients 0.5173 0.3734 0.0394 0.1335
Dividend tax disadvantage
Good protection
1.01 5.18 [52,702] 1.02 5.43 [52,506]
(0.207) (1.526) {8} (0.200) (1.513) {8}Dividend tax disadvantage
Poor protection
0.54 13.36 [6,280] 0.23 10.96 [6,476]
(0.269) (1.250) {7} (0.218) (1.101) {7}p-value difference of coefficients 0.0845 0.0000 0.0000 0.0000
(continued)

2746 The Journal of Finance
Table VI—Continued
(5) Corruption (6) Anti-director Rights
Cash Dividends N Cash Dividends N
Low leverage
Good protection
1.27 5.11 [34,187] 1.23 5.18 [33,822]
(0.266) (1.016) {varies} (0.263) (1.088) {varies}Low leverage
Poor protection
0.31 7.34 [5,092] 0.29 9.51 [5,457]
(0.255) (0.873) {varies} (0.302) (1.032) {varies}p-value difference of coefficients 0.0005 0.0026 0.0061 0.0095
High leverage
Good protection
0.30 1.68 [30,720] 0.30 1.38 [30,705]
(0.117) (1.679) {varies} (0.108) (1.530) {varies}High leverage
Poor protection
0.26 4.17 [5,888] −0.04 6.06 [5,903]
(0.381) (1.273) {varies} (0.203) (1.099) {varies}p-value difference of coefficients 0.9085 0.2339 0.1022 0.0405
(7) Corruption (8) Anti-director Rights
Cash Dividends N Cash Dividends N
Low GDP per capita
Good protection
0.09 5.89 [2,137] 0.34 5.64 [6,283]
(0.415) (1.412) {4} (0.351) (1.240) {11/12}Low GDP per capita
Poor protection
0.30 5.24 [7,399] 0.06 3.83 [3,253]
(0.410) (1.144) {13} (0.500) (1.260) {5/6}p-value difference of coefficients 0.7435 0.5210 0.6859 0.1365
High GDP per capita
Good Protection
1.02 4.21 [62,774] 1.04 3.98 [58,244]
(0.198) (1.231) {14} (0.195) (1.155) {11/12}High GDP per capita
Poor protection
0.32 7.72 [3581] 0.23 10.58 [8,107]
(0.142) (1.173) {4} (0.174) (0.704) {6/7}p-value difference of coefficients 0.0000 0.0590 0.0000 0.0000
Panel B: Level of Cash Regressions
(1) Corruption (2) Anti-director Rights
Cash Dividends N Cash Dividends N
Good accounting standards
Good protection
1.24 4.21 [59,833] 1.19 4.64 [62,165]
(0.100) (1.121) {13} (0.116) (0.998) {16}Good accounting standards
Poor protection
0.35 6.96 [5,506] 0.37 5.77 [3,174]
(0.136) (0.881) {6} (0.261) (0.984) {3}p-value difference of coefficients 0.0000 0.1126 0.0167 0.3419
Poor accounting standards
Good protection
0.50 11.20 [5,074] −0.57 7.11 [1,955]
(0.135) (1.423) {5} (0.666) (2.302) {6}Poor accounting standards
Poor protection
−0.19 6.13 [5,067] 0.28 9.27 [8,186]
(0.078) (1.522) {10} (0.101) (1.203) {9}p-value difference of coefficients 0.0000 0.0343 0.2428 0.4620
(3) Corruption (4) Anti-director Rights
Cash Dividends N Cash Dividends N
Dividend tax advantage
Good protection
1.07 4.23 [11,761] 1.10 4.15 [11,080]
(0.140) (0.922) {9} (0.137) (0.920) {12}Dividend tax advantage
Poor protection
0.41 5.55 [3,759] −0.20 7.22 [4,440]
(0.111) (1.098) {7} (0.188) (1.376) {4}p-value difference of coefficients 0.0000 0.3935 0.0000 0.0576
Dividend tax disadvantage
Good protection
1.16 5.81 [52,702] 1.16 6.09 [52,506]
(0.123) (1.326) {8} (0.132) (1.321) {8}Dividend tax disadvantage
Poor protection
0.07 14.63 [6,280] 0.50 11.72 [6,476]
(0.157) (1.225) {7} (0.113) (1.093) {7}p-value difference of coefficients 0.0000 0.0000 0.0000 0.0000
(continued)

Contribution of Corporate Cash Holdings and Dividends 2747
Table VI—Continued
(5) Corruption (6) Anti-director Rights
Cash Dividends N Cash Dividends N
Low leverage
Good protection
1.31 5.35 [34,187] 1.27 5.44 [33,822]
(0.098) (0.911) {varies} (0.115) (1.143) {varies}Low leverage
Poor protection
0.27 7.51 [5,092] 0.51 9.50 [5,457]
(0.123) (0.824) {varies} (0.115) (1.143) {varies}p-value difference of coefficients 0.0000 0.0044 0.0000 0.0192
High leverage
Good protection
0.81 2.82 [30,720] 0.79 2.49 [30,705]
(0.160) (1.400) {varies} (0.173) (1.253) {varies}High leverage
Poor protection
0.04 4.62 [5,888] 0.02 6.73 [5,903]
(0.116) (1.372) {varies} (0.111) (1.120) {varies}p-value difference of coefficients 0.0000 0.3710 0.0001 0.0417
(7) Corruption (8) Anti-director Rights
Cash Dividends N Cash Dividends N
Low GDP per capita
Good protection
0.39 6.52 [2,137] 0.93 5.84 [6,283]
(0.266) (1.411) {4} (0.183) (1.306) {11/12}Low GDP per capita
Poor protection
0.63 5.72 [7,399] −0.03 4.55 [3,253]
(0.158) (1.147) {13} (0.483) (1.187) {5/6}p-value difference of coefficients 0.4438 0.4783 0.0529 0.2916
High GDP per capita
Good protection
1.18 4.80 [62,774] 1.18 4.51 [58,244]
(0.100) (1.026) {14} (0.114) (0.980) {11/12}High GDP per capita
Poor protection
0.05 8.33 [3,581] 0.24 11.20 [8,107]
(0.115) (1.151) {4} (0.067) (0.848) {6/7}p-value difference of coefficients 0.0000 0.0416 0.0000 0.0000
The third possible explanation we investigate is that there might be a pos-itive relation between cash holdings and the value of debt for highly leveredfirms. In this case, an increase in cash would not benefit shareholders as muchfor highly levered firms as for less levered firms. However, because we do notuse the market value of debt, the relation between cash holdings and firm valuewould be attenuated. If a firm in our sample is more likely to have low leveragein a country with better investor protection, this could explain our result. Inregressions (5) and (6), we proceed as we did for regressions (1) and (2) butinstead of splitting the sample according to accounting quality, we split it ac-cording to leverage. We define leverage as short-term debt plus long-term debtdivided by total assets. We find that with low leverage, firms in countries withlow corruption have a much higher coefficient on cash holdings than do firmswith low leverage in countries with high corruption. For firms with high lever-age, the coefficient is significantly higher in countries with low corruption inthe regression that uses the level of cash but not in the one that uses the changein cash. When we use the anti-director index, we get nearly identical results,except that almost all differences are significant. The results for dividends areequally supportive of our hypothesis.
The fourth possible explanation we consider is that our results may sim-ply reflect differences in economic development. We therefore split the sam-ple into high and low GDP per capita countries as well as high corruptionand low corruption countries. Regression (7) shows that the difference in the

2748 The Journal of Finance
relation between value and cash holdings appears to hold only in highly de-veloped economies. In low GDP per capita countries, there is no differencein the value of cash holdings based on corruption. However, as regression (8)shows, when we divide the sample according to the anti-director index insteadof corruption, we see that cash is more highly valued in countries with goodinvestor protection regardless of the degree of economic development when weuse the level of cash. For dividends, however, there are no significant differ-ences for low GDP countries, but there are significant differences for high GDPcountries.
The regression results in Table VI generally support our hypotheses. How-ever, it is also clear that the evidence is stronger for the anti-director indexthan it is for corruption. This result does not appear to be due to the obviouslimitation of the exercise we conduct in Table VI, which is that countries withpoor investor protection have fewer firms and thus some of the subsets weinvestigate have fewer firm-years compared to others.
B. Robustness of the Results
While we have already examined the robustness of our results in a numberof ways, we discuss statistical issues in this subsection. As Fama and French(1998) point out, there are many good reasons to use the Fama and MacBeth(1973) approach to estimate regressions such as ours. This approach addressesthe pervasive problem that there are clusters of observations within cross-sections and across time. However, one can also take clustering into account byestimating a pooled time-series cross-section regression and allowing for clus-tering. Such an approach requires assumptions about the variance–covariancematrix of the error terms. Here, we reestimate the regressions of Tables III andIV using three different assumptions about the variance–covariance matrix.First, we allow for serial correlation with one lag in the error terms using theNewey–West (1987) correction. Second, we allow for clustering by country andyear, where the error terms for firms in the same country but different years areassumed to be independent. Finally, we allow for clustering within a countryacross all years.
We do not reproduce the coefficient estimates and their standard errors ina table. Because we pool all observations instead of using the Fama–MacBethapproach, the coefficient estimates change slightly, but these changes have nobearing on our conclusions. When it comes to our various assumptions aboutthe variance–covariance matrix of the residuals, we find that more differencesare significant when we only correct for serial correlation in the residuals. Itis clearly important to correct for clustering by country. Further, clustering byboth year and country leads to more differences being significant than thosereported with our Fama–MacBeth estimates for the regressions with changesin cash. For instance, the difference between the coefficients when we use thePolcon V index is not significant with the Fama–MacBeth regressions but issignificant with country clustering. Finally, when we use country clustering

Contribution of Corporate Cash Holdings and Dividends 2749
across time, some differences that are significant using the Fama–MacBethregressions lose significance. For changes in cash, the differences using the cor-ruption index, bond market capitalization, and GDP per capita are no longersignificant. When we use the level of cash, all differences that are significantusing the Fama–MacBeth regressions are significant under all our assump-tions about the variance–covariance matrix of residuals. Turning to dividends,the difference in coefficients loses significance when we cluster by countriesand time for the corruption index, the expropriation index, and bond marketcapitalization.
The pooled regressions that allow for clustering within countries across timesubject our hypotheses to a test that is a bit extreme since we have few indepen-dent clusters compared to the numbers of coefficients we estimate. Neverthe-less, with these regressions all of our results using the anti-director index hold.A sensible approach is to reestimate the regressions but force all coefficientsto be the same across high and low investor protection countries except forthe coefficients on cash and dividends. This approach increases the ratio of thenumber of independent clusters to the number of estimated coefficients. Usingthis approach, more differences are significant than using the Fama–MacBethregressions when we allow for clustering within countries across time.
A concern with respect to the Fama and MacBeth (1973) regressions thatFama and French (1998) raise is that the coefficients in the cross-section re-gressions may be serially correlated. If that is the case, our estimates of thesignificance of the average coefficients would be overstated. We investigate theserial correlation of the coefficients on the change in cash and dividends ofTable III and on the level of cash and dividends of Table IV. Up to lag five,we find no significant serial correlation. Our approach has power in that wefind, for instance, that the coefficient on R&D has significant serial correlationat lag one. Nonetheless, for completeness, we recompute the Fama–MacBethstandard errors assuming that there is serial correlation, up to lag three, inthe time series of coefficients.8 With this assumption, our standard errors arevirtually identical to the ones reported in the tables that correspond to theFama–MacBeth regressions. We therefore conclude that our significance lev-els are unlikely to be overstated because of serial correlation in the coefficientestimates in the cross-section.
VI. Conclusion
In this paper, we examine how the ease with which controlling shareholderscan extract private benefits from the firms they control affects firm valuationacross 35 countries over 11 years. We test two hypotheses. The first hypoth-esis is that minority shareholders value cash holdings less in countries withweaker investor protection than in other countries. The second hypothesis is
8 To operationalize this, we take the time series of coefficients and estimate a regression of those
coefficients on a constant allowing for Newey–West (1987) standard errors.

2750 The Journal of Finance
that minority shareholders value dividends more in countries with worse in-vestor protection than in other countries. Both hypotheses follow from agencytheories that state that controlling shareholders will extract more private ben-efits from the firm they control if investor protection is weak. We investigateboth hypotheses using various specifications of Fama and French’s (1998) valua-tion regressions. Since our evidence is strongly supportive of these hypotheses,it implies that differences in the intensity of agency problems across coun-tries play an important role in differences in the valuations of firms acrosscountries.
AppendixVariable, Definitions, and Sources
Variable Definition Source
Inflation Consumer price index World Bank’s World Development
Indicators
Stock market
capitalization
Total stock market value
normalized by GDP
World Bank’s World Development
Indicators
Stock market volatility Standard deviation of prior 60
months of country stock market
index
Datastream
Stock market turnover Total stock value traded divided
by stock market capitalization
normalized by GDP
World Bank’s World Development
Indicators
Bond market
capitalization to GDP
Total debt outstanding, excluding
government debt normalized by
GDP
Bank for International
Settlements
Log (GDP per capita) Log of country gross domestic
product
World Bank’s World Development
Indicators
ICRGP Measure of political stability
based on a specific list of
country risk factors
International Country Risk Guide
Polcon Measure of political concentration
of power within a country
Polcon V from Henisz (2000)
Corruption Assessment of corruption within a
country that threatens
development
International Country Risk Guide
Law and order Assessment of the strength and
impartiality of the legal system
and observance of the law
International Country Risk Guide
Anti-director index Index that measures the degree to
which shareholder rights are
protected
LLSV (1998)
Expropriation risk Threat of outright confiscation or
forced nationalization
LLSV (1998)
Civil law Measure of legal tradition in a
country
LLSV (1998)

Contribution of Corporate Cash Holdings and Dividends 2751
REFERENCESAcemoglu, Daron, Simon Johnson, James A. Robinson, and Yunyong Thaicharoen, 2003, Institu-
tional causes, macroeconomic symptoms: Volatility, crises, and growth, Journal of MonetaryEconomics 50, 49–123.
Claessens, Stijn, Simeon Djankov, Joseph P. H. Fan, and Larry H. P. Lang, 2002, Disentangling the
incentives and entrenchment effects of large shareholdings, Journal of Finance 57, 2741–2771.
Dittmar, Amy, and Jan Mahrt-Smith, 2005, Corporate governance and the value of cash holdings,
Working paper, University of Michigan.
Dittmar, Amy, Jan Mahrt-Smith, and Henri Servaes, 2003, International corporate governance
and corporate cash holdings, Journal of Financial and Quantitative Analysis 38, 111–133.
Doidge, Craig, G. Andrew Karolyi, and Rene M. Stulz, 2004, Why are foreign firms listed in the
U.S. worth more?, Journal of Financial Economics 71, 205–238.
Durnev, Art, and E. Han Kim, 2005, To steal or not to steal: Firm attributes, legal environment,
and valuation, Journal of Finance 60, 1461–1493.
Dyck, Alexander, and Luigi Zingales, 2004, Private benefits of control: An international comparison,
Journal of Finance 59, 537–600.
Fama, Eugene F., and Kenneth R. French, 1998, Taxes, financing decisions, and firm value, Journalof Finance 53, 819–843.
Fama, Eugene F., and James D. MacBeth, 1973, Risk, return, and equilibrium: Empirical tests,
Journal of Political Economy 81, 607–636.
Faulkender, Michael W., and Rong Wang, 2006, Corporate financial policy and the value of cash,
Journal of Finance 61,1957–1990.
Gompers, Paul A., Joy Ishii, and Andrew Metrick, 2003, Corporate governance and equity prices,
Quarterly Journal of Economic 118, 107–155.
Henisz, Witold J., 2000, The institutional environment for economic growth, Economics and Politics12, 1–31.
Jensen, Michael C., 1986, Agency costs of free cash flow, corporate finance and takeovers, AmericanEconomic Review 76, 323–339.
Johnson, Simon, Rafael La Porta, Florencio Lopez-de-Silanes, and Andrei Shleifer, 2000, Tunneling,
American Economic Review 90, 22–27.
Kalcheva, Ivalina and Karl V. Lins, 2004, International evidence on cash holdings and expected
managerial agency problems, Unpublished working paper, University of Utah, Salt Lake City,
Utah.
La Porta, Rafael, Florencio Lopez-de-Silanes, and Andrei Shleifer, 1999, Corporate ownership
around the world, Journal of Finance 54, 471–517.
La Porta, Rafael, Florencio Lopez-de-Silanes, Andrei Shleifer, and Robert Vishny, 1998, Law and
finance, Journal of Political Economy 106, 1113–1155.
La Porta, Rafael, Florencio Lopez-de-Silanes, Andrei Shleifer, and Robert Vishny, 2000a, Investor
protection and corporate governance, Journal of Financial Economics 58, 3–27.
La Porta, Rafael, Florencio, Lopez-De-Silanes, Andrei Shleifer, and Robert Vishny, 2000b, Agency
problems and dividend policies around the world, Journal of Finance 55, 1–33.
La Porta, Rafael, Florencio Lopez-de-Silanes, Andrei Shleifer, and Robert Vishny, 2002, Investor
protection and corporate valuation, Journal of Finance 57, 1147–1170.
Lins, Karl V., 2003, Equity ownership and firm value in emerging markets, Journal of Financialand Quantitative Analysis 38, 185–212.
Myers, Stewart C., and Raghuram G. Rajan, 1998, The paradox of liquidity, Quarterly Journal ofEconomics 108, 733–771.
Nenova, Tatiana, 2003, The value of corporate voting rights and control: A cross-country analysis,
Journal of Financial Economics 68, 325–351.
Newey, Whitney, and Kenneth West, 1987, A simple positive semi-definite, heteroscedasticity and
autocorrelation consistent covariance matrix, Econometrica 55, 703–708.
Pinkowitz, Lee, and Rohan Williamson, 2005, What is a dollar worth? The market value of cash
holdings, Working paper, Georgetown University.
Stulz, Rene M., 2005, The limits of financial globalization, Journal of Finance 60, 1595–1638.