Embed Size (px)
Citation preview
NBER WORKING PAPER SERIES
DO FIRMS IN COUNTRIES WITH POOR PROTECTIONOF INVESTOR RIGHTS HOLD MORE CASH?
Lee PinkowitzRene M. Stulz
Rohan Williamson
Working Paper 10188http://www.nber.org/papers/w10188
NATIONAL BUREAU OF ECONOMIC RESEARCH1050 Massachusetts Avenue
Cambridge, MA 02138December 2003
René Stulz is grateful for the hospitality of the Kellogg School at Northwestern University and of the StiglerCenter at the University of Chicago, where some of this research was conducted. We thank Kathryn-AnnBloomfield, Michael Chiang, Mark Ervin, Jennifer Rooke, and especially Aaron Kravitz, for their help withthe data collection. We are grateful to Ole-Kristian Hope, Jan Mahrt-Smith, and seminar participants at theUniversity of Toronto for useful comments. The views expressed herein are those of the authors and notnecessarily those of the National Bureau of Economic Research.
©2003 by Lee Pinkowitz, Rene M. Stulz, and Rohan Williamson. All rights reserved. Short sections of text,not to exceed two paragraphs, may be quoted without explicit permission provided that full credit, including© notice, is given to the source.

Do Firms in Countries with Poor Protection of Investor Rights Hold More Cash?Lee Pinkowitz, Rene M. Stulz, and Rohan WilliamsonNBER Working Paper No. 10188December 2003JEL No. G15, G31, G32
ABSTRACT
Managers make different decisions in countries with poor protection of investor rights and poor
financial development. One possible explanation is that shareholder-wealth maximizing managers
face different tradeoffs in such countries (the tradeoff theory). Alternatively, firms in such countries
are less likely to be managed for the benefit of shareholders because the poor protection of investor
rights makes it easier for management and controlling shareholders to appropriate corporate
resources for their own benefit (the agency costs theory). Holdings of liquid assets by firms across
countries are consistent with Keynes' transaction and precautionary demand for money theories.
Firms in countries with greater GDP per capita hold more cash as predicted. Controlling for
economic development, firms in countries with more risk and with poor protection of investor rights
hold more cash. The tradeoff theory and the agency costs theory can both explain holdings of liquid
assets across countries. However, the fact that a dollar of cash is worth less than $0.65 to the
minority shareholders of firms in such countries but worth approximately $1 in countries with good
protection of investor rights and high financial development is only consistent with the agency costs
theory.
Lee PinkowitzGeorgetown [email protected]
Rene M. StulzFisher College of BusinessOhio State University806A Fisher Hall2100 Neil AvenueColumbus, OH 43210-1144and [email protected]
Rohan WilliamsonGeorgetown University
2
1. Introduction
Recent work shows that countries where institutions that protect investor rights are weak
perform poorly along a number of dimensions. In particular, these countries have lower growth,
less well-developed financial markets, and more macroeconomic volatility.1 To measure the
quality of institutions, authors have used, for instance, indices of the risk of expropriation, the
level of corruption, and the rule of law. Since poor institutions could result from poor economic
performance rather than cause it, authors have also used the origin of a country’s legal system (La
Porta, Lopez-de-Silanes, Shleifer, and Vishny, LLSV1, 1998), the nature of the activities of its
colonizers (Acemoglu, Johnson, and Robinson, 2001), and its culture (Stulz and Williamson,
2003) as instruments for the quality of institutions.
For the quality of institutions to matter for economic performance, it has to affect the
actions of firms and individuals. Recent papers examine how dividend, investment, asset
composition, and capital structure policies are related to the quality of institutions.2 In this paper,
we focus more directly on why firm policies depend on the quality of institutions. The quality of
institutions can affect firm policies for two different reasons. First, a country’s protection of
investor rights may influence the relative prices or tradeoffs managers face when making
decisions, so that actions that maximize shareholder wealth in countries where investor rights are
well protected may not be optimal in other countries. We call this explanation the tradeoff theory.
Second, poor protection of investor rights makes it more difficult for non-controlling investors to
receive a return from their investment because agency conflicts are harder to govern. We call this
explanation the agency costs theory. With this theory, managers make different decisions in
countries where investor rights are poorly protected because they face fewer constraints in
1 See Levine (1997), La Porta, Lopez-de-Silanes, Shleifer, and Vishny (2000), and Easterly (2001) for reviews of the evidence. 2 See, for instance, La Porta, Lopez-de-Silanes, Shleifer, and Vishny (2000) for dividends, Claessens and Laeven (2003) for the allocation of assets within the firm, Love (2000) for investment, Demirgüc-Kunt and Maksimovic (1998) for external finance, and Booth, Aivazian, Demirgüc-Kunt, and Maksimovic (2001) for capital structure.

3
pursuing policies that do not maximize shareholder wealth. In this paper, we study the relative
importance of the tradeoff and agency costs theories for why firms act differently in countries
with poor protection of investor rights.
Using a sample that spans 35 countries and twelve years, we find that firms in countries with
poorer institutions hold more liquid assets (which we also call cash) than they would if they were
located in the U.S. The effect is economically important. For instance, in a cross-country
regression that controls for GDP per capita, financial development, stock return volatility, and
inflation, a firm in a country with the worst institutions has from 5% to 25% more liquid asset
holdings in proportion to total assets than a U.S. firm depending on the index of institution
quality used.
We focus our analysis on cash holdings by firms because, since Keynes (1934), there has
been little controversy in the literature about the determinants of cash holdings when agency costs
are unimportant. Keynes (1934) explains that firms can hold cash to reduce transaction costs (the
transaction motive) and to provide a buffer to absorb adverse shocks (the precautionary motive).
The transaction motive predicts that cash holdings are positively related to economic
development. With the transaction motive, firms hold cash to economize on the costs of
transacting. The transaction motive is a “shoe leather” theory of money demand: it is cheaper to
hold cash than to send somebody to the bank. As a result, cash holdings increase with the cost of
labor. The tradeoff theory therefore predicts a positive relation between cash holdings and
economic development. We find that inferences about the relation between cash holdings and
investor protection depend crucially on controlling for economic development. Without
controlling for economic development, investor protection proxies for economic development in
regressions and there is a negative relation between cash holdings and investor protection.
Opler et al. (1999) provide evidence on the importance of the precautionary motive for cash
holdings in the U.S. The precautionary motive could explain why firms in countries with poorer
4
institutions hold more liquid assets. First, Acemoglu, Johnson, Robinson, and Thaicharoen (2003)
show that countries with poorer institutions are less stable. In such countries, firms are more
likely to face disruptions that require the use of liquid assets. Some of these business interruptions
might result from breakdowns in law and order, others might be due to political interferences, and
some might just be attempts to shake down firms. Regardless of the source of these business
interruptions, firms have to hold more liquid assets than in more stable countries with better
institutions. Second, countries with poor institutions are less financially developed. Substitutes for
liquid asset holdings are more costly in such countries, or may not even be available. For instance,
firms that have easy access to external capital markets should not have to hold as much of a
buffer stock of liquid assets, but access to external capital markets is limited and expensive in
countries with low financial development. Therefore, the tradeoff theory predicts that firms hold
more cash in countries with poorer institutions keeping economic development constant and that
firms hold less cash in countries with lower economic development keeping the quality of
institutions constant.
In the U.S., an explanation advanced for high cash holdings, the free cash flow explanation of
Jensen (1986) is that management would rather hold cash than pay dividends to shareholders.
Dittmar, Mahrt-Smith, and Servaes (DMS, 2003) test the free cash flow hypothesis across a
number of countries for two years and show that liquid asset holdings are higher in countries with
a lower value of the anti-director rights index constructed by Lopez-de-Silanes, La Porta, Shleifer,
and Vishny (LLSV1, 1998). The anti-director rights index measures the legal rights of minority
shareholders and has a higher value if laws protect minority shareholders better. They interpret
this result as supportive of the free cash flow explanation for high cash holdings outside the U.S.
Assuredly, there are firms where their explanation applies, but it cannot be the whole story for
three reasons. First, firms in countries with poor institutions hold more cash with the tradeoff
model, so that greater cash holdings in these countries can be explained without recourse to

5
agency costs. Second, their specifications do not control for differences in economic development
across countries. In contrast to other measures of investor protection, the anti-director rights index
is negatively correlated with economic development in our sample so that the tradeoff theory
predicts that cash holdings are negatively correlated with the anti-director rights index when one
does not control for economic development. Hence, the DMS result could be fully consistent with
the tradeoff model. Third, since non-U.S. firms tend to be controlled by large shareholders,
managers in these firms can be monitored closely by the large shareholders, so that the large
shareholders must want their firms to have high holdings of liquid assets. The large shareholders
would rather keep cash within the firm than give it to minority shareholders. However, they can
also siphon cash from the firm in the form of private benefits, a practice called tunneling (see
Johnson, La Porta, Lopez-de-Silanes, Shleifer, 2000). If the controlling shareholder can easily
extract private benefits from control, we would not expect the free cash flow agency theory to
apply.
The existing literature typically models private benefits in one-period models (see, for
instance, La Porta, Lopez-de-Silanes, Shleifer, and Vishny (LLSV2), 2002, and Shleifer and
Wolfenzon, 2003). Such an approach assumes that extraction of private benefits takes place with
equal intensity in every period. Though this simplification is often useful, it makes it impossible
to analyze the timing of tunneling. Through aggressive extraction of private benefits now, the
controlling shareholder may reduce the value of future private benefits. Consequently, the
controlling shareholder may choose to refrain from consuming private benefits when he benefits
more from investing resources in the firm to increase his future private benefits. Yet, if the
controlling shareholder has two ways of investing firm funds that have similar expected gross
returns, he will prefer the investment that makes it possible for him to eventually consume more
private benefits, so that investments that make extraction of private benefits easier will be
advantaged. Investment in liquid assets is preferred by controlling shareholders because, as Myers

6
and Rajan (1998) point out, liquid assets can more easily be used than fixed assets to enrich the
large shareholder at the expense of other investors in the corporation. Johnson, La Porta, Lopez-
de-Silanes, and Shleifer (2000) provide one example of tunneling in Belgium where the
controlling shareholder simply took a substantial sum from the firm’s accounts, i.e., the firm’s
liquid assets. The court did not force him to give the money back after he was sued by the
minority shareholders. Fixed assets can be traced - a plant cannot disappear, but cash can. We
construct a model where we show that, when the quality of institutions is low, the controlling
shareholder will choose to hold more assets that can be more easily expropriated.
The tradeoff theory and the agency costs theory both can predict that firms hold more cash in
countries with poor institutions. We devise a straightforward test to discriminate between these
hypotheses. Using a modification of the valuation model put forward in Fama and French (1998),
we estimate how much cash holdings contribute to firm value in countries with institutional
quality above and below the median. If firms in countries with poorer institutions hold more
liquid assets because they can more easily be expropriated by controlling shareholders, it should
be that liquid asset holdings do not contribute as much to firm value as they do in countries with
better institutions. In other words, in a country where each dollar of cash belongs to shareholders
regardless of whether they are controlling shareholders or not, a dollar of cash should contribute
approximately a dollar of firm value. However, if part of a dollar of cash will eventually be
expropriated by controlling shareholders, a dollar of cash should be worth less than a dollar to
minority shareholders. Strikingly, while a dollar of cash is worth roughly a dollar of firm value in
the U.S., in countries with poor institutions, a dollar of cash is consistently estimated to be worth
less than 65 cents. We therefore conclude that the larger holdings of liquid assets in countries
with poorer institutions are not the result of decisions made by controlling shareholders to
maximize firm value.

7
The paper proceeds as follows. In Section 2, we model the cash holding decision for the
controlling shareholder and derive our predictions that liquid asset holdings are inversely related
to the quality of institutions and to the level of financial development of a country, but positively
related to the country’s level of economic development. Additionally, our model suggests that the
value of cash holdings to minority shareholders in a country is inversely related to that country’s
degree of investor protection. In Section 3, we discuss how we construct our sample and measure
liquid asset holdings compared to liquid asset holdings of firms in the U.S. In Section 4, we show
that liquid asset holdings fall as institutions become better. In Section 5, we find that the value of
liquid assets for minority shareholders is positively related to the quality of institutions. We
conclude in Section 6.
2. Liquid asset holdings and the quality of institutions
In this section, we derive predictions for cash holdings when controlling shareholders or
managers can divert corporate resources for their private benefit. The predictions of the tradeoff
theory are a special case of this model. Since in the international context, large firms are typically
controlled by large shareholders who can impose their will on management (see La Porta, Lopez-
de-Silanes, and Shleifer, 1999), we call the agent who controls the firm the controlling
shareholder for simplicity. The model draws on the insight of Myers and Rajan (1998) that it is
easier for managers and controlling shareholders to extract private benefits from cash than from
plant and equipment. The Myers and Rajan (1998) model builds on Hart and Moore (1994),
where firms cannot raise capital against all of a project’s cash flows because they cannot enter
enforceable contracts to pledge all the cash flows to capital providers. We do not use the Hart and
Moore (1994) model here, but as shown by Almeida, Campello, and Weisbach (2003), that model
provides a motivation for firms to hold liquid assets that is related to Keynes’ precautionary
demand for money. Rather, we follow the approach of LLSV2 to model private benefits. With

8
1C QK Lβ β−=
that approach, the large shareholder can extract private benefits, but extraction of private benefits
imposes a deadweight cost on the firm. This cost is due to the fact that the extraction of private
benefits has to be disguised, but more so in countries with better institutions.
In this model, the firm’s cash flow C depends on physical capital K and liquid assets L.
Liquid assets are required for production. This captures the transaction and precautionary motives
for holding cash. The production function is a Cobb-Douglas production function:
(1)
We are only concerned about how firms allocate capital between K and L. To examine this
issue, we assume that the firm has a given amount of capital, A, cannot raise additional capital,
and does not have other productive uses for capital. With this setup, the opportunity cost of
capital is equal to zero once raised by the firm. This setup makes it possible to distinguish sharply
between financing issues and asset allocation issues. As emphasized by Claessens and Laeven
(2003), the literature has focused much more on financing issues than asset allocation issues. Our
paper focuses on the latter issues.
The controlling shareholder has cash flow rights α, so that he receives a fraction α of the
distributions made to shareholders. Let f be the fraction of cash flow appropriated by the
controlling shareholder at the expense of the other shareholders. The deadweight cost to the firm
of having cash flow diverted by the controlling shareholder is a quadratic function of the amount
diverted, 0.5b(fC)2. The parameter b measures the quality of institutions. A higher value for b
means that cash flow diversion is more expensive. The cash flow received by the controlling
shareholder is (f + α [1 – f – 0.5bf2])C and the minority shareholders receive (1 – α)(1 – f –
0.5bf2)C.

9
In LLSV2, the cash flow is a liquidating cash flow. We assume that instead the firm has
assets at date 1 in addition to its operating cash flow. The controlling shareholder can divert some
of these assets for his own use as the firm is liquidated. A natural extension of this model would
be to have more than one period, so that the controlling shareholder could decide each period how
much he expropriates from current cash flow and decide how much of the liquid assets to
expropriate. To emphasize the distinction between cash and other assets, we assume that the
controlling shareholder can divert liquid assets but not physical capital. When the firm is
liquidated, the physical capital is sold for K and the controlling shareholder receives a fraction α
of K. To keep the notation simple, we assume that the cost of diverting liquid assets is the same
as the cost of diverting cash flow. The controlling shareholder diverts a fraction γ of the liquid
assets at a cost to the firm of 0.5bγ2L paid out of the firm’s liquid assets. Consequently, the
controlling shareholder receives (γ + α [1 – γ – 0.5bγ2])L from the firm’s liquid assets and the
minority shareholders receive (1 – α)(1 – γ – 0.5bγ2)L.
With our notation, the proceeds to the large shareholder, P, at date 2 are:
2 2( 0.5 ) ( 0.5 )P f f bf C b L Kα α α γ α αγ α γ α= + − − + + − − + (2)
The controlling shareholder chooses f, γ, and L to maximize P subject to the constraints that f
and γ cannot be negative and cannot exceed 1, that L cannot be negative, and that K = A – L. The
first-order conditions for an interior solution for L are:

10
2 1 1
2
(1 ) 0
(1 ) 0
( 0.5 ) ( ) (1 )( )
( 0.5 ) 0
P bf CfP b L
P f f bf Q A L L A L LL
b
β β β β
α α
α α γγ
α α α β β
γ α αγ α γ α
− − −
∂ = − − =∂∂ = − − =∂∂ = + − − − − + − − ∂+ + − − − =
1fbαγ
α−= =
(3a)
(3b)
(3c)
Solving for f and γ using (3a) and (3b), we obtain:
(4)
As in LLSV2, the rate of diversion falls as the quality of institutions increases and decreases
as ownership increases.
We cannot solve explicitly for L, but we can obtain comparative statics for L. First, we want
to know how an increase in the quality of institutions, i.e., a decrease in corruption, affects L:
]))(1()([ where
//)1]()1(5.0[
11
222
ββββ ββ
ααα
−−− −−+−−=∂∂
++−=
LLALLAQYLY
bYdbdL
(5)
The denominator of equation (5) has the same sign as the second derivative of the large
shareholder’s proceeds with respect to liquid assets, which is negative because P is a concave
function of L. With our assumptions, it therefore follows that:
Proposition 1: Cash holdings are negatively related to the quality of institutions.

11
Note that the derivation of Proposition 1 is based on the positive relation between the extraction
of private benefits and the quality of institutions. The introduction provides a second reason for
why cash holdings are negatively related to the quality of institutions. That reason is not modeled
here. With Keynes’ precautionary demand for money, money demand increases with uncertainty
and there is more uncertainty in countries where the quality of institutions is lower. Hence,
Proposition 1 holds even in the absence of agency costs, so that it cannot be used to distinguish
between the tradeoff theory and the agency costs theory.
In this model, there is an advantage to liquid asset holdings for the controlling investor, which
is that he gets more out of $1 of cash than he gets out of $1 of physical capital when the firm
liquidates. This tilts the firm’s assets towards more cash than in the first best solution. However,
as the cost of diverting cash for his personal benefit increases because of better institutions, i.e.,
as b increases, the large shareholder finds it less advantageous to divert cash and consequently the
cash holdings fall.
In the literature on money demand by firms, a higher level of “monetary technology” implies
lower holdings of cash (see Mulligan, 1997). By having access to a wide choice of financial
instruments and to the ability to trade securities at lower cost, a firm can economize on cash. In
our model, we can take into account the level of “monetary technology” available in a country by
replacing cash holdings in the production function by f(L, q), where q is a productivity index for
cash, so that f(L, q) increases with q. An increase in q means that a smaller amount of cash leads
to the same cash flow as before. We equate an increase in q to an increase in financial
development. For simplicity, we assume that f(L, q) = L + q. The derivative of liquid asset
holdings with respect to q is negative:
Proposition 2: Cash holdings are negatively related to financial development.

12
There is an extremely large literature on the demand for money. In that literature, cash
substitutes for labor, so that when labor becomes more expensive, cash holdings increase. For
instance, Mulligan (1997) finds for the U.S. that the elasticity of money demand with respect to a
proxy for the cost of labor is about 0.6. The opportunity cost of labor increases with economic
development since human capital increases with economic development. This implies that cash
becomes more valuable as economic development increases:
Proposition 3: Liquid asset holdings are positively related to economic development.
Propositions 2 and 3 hold irrespective of whether the actions of firms are explained by the
tradeoff theory or the agency costs theory.
Investors assign a value to the cash holdings of the firm and the issues that impact the level of
corporate cash holdings should also affect the valuation of the marginal liquid asset held by the
firm. Therefore, we also want to know how the value of the firm is related to liquid asset holdings.
We normalize values so that they are in current dollars. The value of the firm’s shares is:
2 21 10.5 0.5V A C b C b L
b bα α
α α− − = + − −
(6)
With this valuation formula, the value of the firm is equal to the sum of its assets and its cash
flows minus a discount for cash flow and a discount for cash. The discount for cash flow and for
cash is due to the fact that they are subject to diversion activities from the large shareholder and
that these diversion activities have a deadweight cost. The discount is inversely related to the
quality of institutions. It follows from this that:
13
Proposition 4: When the controlling shareholder makes firm decisions to maximize his
welfare, the value of a dollar of liquid assets held by the firm falls for minority shareholders as
the quality of institutions falls. Otherwise, there is no discount for cash.
The reason the discount for cash increases as the quality of institutions worsens is that more
cash is diverted by the controlling shareholder. With the tradeoff theory, the firm is managed to
maximize its value, so that no diversion takes place and there are no discounts. Proposition 4
therefore makes it possible to distinguish between the tradeoff and the agency costs theory.
In formulating the tradeoff theory of cash holdings, we have ignored the role of corruption. If
corruption is high, one might be tempted to conclude that firms have to hold cash so that they can
“grease the wheels of commerce” to use the felicitous expression of Kaufman and Wei (1999).
For instance, in a high corruption environment, firms face the need to pay off functionaries and
need to have liquid assets available. This possible explanation for higher cash holdings in
countries with poorer institutions implies that cash holdings are efficient. Though cash is used to
pay off functionaries, doing so makes the firm more profitable and it is therefore optimal for
firms to hold more cash. Consequently, a dollar of cash should be worth at least a dollar to
shareholders.
3. Data
The firm level data come from Worldscope and span the years 1988-1999.
Because financial firms hold liquid assets for different reasons than other firms, we exclude firms
in SIC codes starting with 6. The country level data come from various sources and represent
measures of institutional quality, financial development, and economic development of the
country. We start from the countries used in LLSV1, but our data requirements force us to limit
the study to 35 countries from 1988 through 1999. Though much of the existing research

14
investigates the relation between firm policies and the quality of institutions for a one-year cross-
section, investigating the relation between firm policies and institution quality over multiple years
makes it less likely that the estimated relation is spurious.
To examine institutional quality, we use data from LLSV1 that measures corruption, respect
for the rule of law, expropriation risk, protection of minority shareholders (the anti-director rights
index), and the origin of the legal system. The corruption, rule of law, and expropriation indices
are produced by the country-risk rating agency International Country Risk (ICR). Corruption is
an assessment of the risk of corruption of high government officials, while rule of law is an
assessment of the law and order tradition in a country. Expropriation risk is the threat of outright
confiscation or “forced nationalization.” All ICR indices used by LLSV1 are averages from 1982
through 1995 and are scaled so that their values go from one through ten, with one representing
the worst possible enforcement and ten the highest. The anti-director rights index is built by
LLSV1. The index sums up dummy variables that take value one if a right protecting minority
shareholders is mandated in a country. There are five such rights, so that the highest value of the
index is five.
Though the LLSV1 indicators of the quality of institutions have been widely used in the
literature, these indicators are averages measured at one point in time. Over a period of 12 years,
the quality of institutions can change across countries and these changes can affect firm policies.
We therefore also use indicators of the quality of institutions that change over time. The
International Country Risk Guide data on the country’s political risk level (ICRGP index) is
available monthly for our sample period. The political risk level is made up of twelve components
that comprise the overall political risk assessment of a country. We use the index for political risk
as well as the components of that index measuring corruption and the rule of law. Our indices are
created annually by taking the average of all the months in a given year. Finally, we use an index
which measures political constraints to assess the probability of corruption or extreme policy

15
change in a country. The PolconV Index is developed in Henisz (2000) and is available annually
for our countries. The index is a continuous variable ranging from zero, indicating a dictatorship,
to one, indicating democracy, and represents the degree to which checks and balances are present
in a country’s political system. For our purpose, the variable examines institution quality in the
sense that the more centralized the government, the higher the opportunity for corruption (see
Shleifer and Vishny, 1993). As with the LLSV1 variables, the ICRGP and PolconV indexes are
constructed so that a higher index level corresponds to better institutions. The corruption and rule
of law indices from ICRGP are normalized so that they are computed on a scale from 1 to 10 as in
LLSV1.
Data on GDP and inflation are taken from the World Bank World Development Indicators
(WDI) database. As a proxy for uncertainty at the country level, we use stock market volatility.
We expect the precautionary motive to be more important for countries with greater uncertainty.
We calculate a measure of overall stock market volatility using the standard deviation of the prior
60 months of returns of the country index. Market index return data come from Datastream.
We also examine several measures of financial development within a country. From the WDI
database, we have data on stock market turnover and stock market capitalization. Stock market
turnover is the ratio of the total shares traded to the stock market capitalization. It is a proxy for
stock market liquidity. Stock market capitalization is normalized by GDP and is a measure of the
size of equity markets in an economy. The description and justification of the use of these
variables are developed in Beck et al. (1999). The Bank for International Settlements (BIS)
Quarterly Review provides total domestic debt outstanding (excluding government) normalized
by the country’s GDP, which we use as a proxy for the level of development of a country’s debt
market.
If a firm is controlled by large shareholders, these shareholders may want the firm to hold
more liquid assets to reduce the risk of their investment. In other words, the firm may end up

16
over-emphasizing the precautionary motive for cash. In our country regressions, we use a
measure of ownership concentration by using the closely held shares percentage taken from the
Worldscope database. Closely-held shares correspond to shares held by insiders. Insiders are
considered to be officers, directors, and their immediate families, shares held in trusts, shares held
by another corporation (except shares held in a fiduciary capacity by financial institutions), shares
held by pension benefit plans, and shares held by individuals who hold 5% or more of the
outstanding shares. For Japanese firms, closely held shares represent the holdings of the ten
largest shareholders. For each country, we use a value-weighted average of inside ownership
across firms (see Dalquist, Pinkowitz, Williamson, and Stulz, 2003)).
In an attempt to benchmark cash holdings controlling for the variation across countries, we
calculate excess cash for each firm each year by comparing the amount of cash the firm holds to
the amount it would be expected to hold if it were incorporated in the U.S. (see Pinkowitz and
Williamson, 2001). This approach is similar to the approach pioneered by Rajan and Zingales
(1998) at the industry level. DMS also use this approach for some of their regressions. Every year,
regressions are run on the full panel of U.S. Compustat industrial firms to compute the
coefficients in a model to determine cash holdings. Cash is defined as cash on hand plus
marketable securities.3 The model is the same as in Opler et al. (1999) except that the regulation
dummy and industry volatility variables are omitted. Further, while Opler et al. (1999) use
market-to-book as a proxy for growth opportunities, we use sales growth. The reason for this
choice is that market-to-book is negatively correlated with investor protection, so that when using
a sample of firms from different countries, market-to-book becomes an inappropriate proxy for
growth opportunities. The model is:
Cashi = αi + β1Sizei + β2Sales growthi + β3NWCi + β4Capexi + β5Leveragei + β6RDi +
3 The marketable securities are defined as temporary investments in securities that can be readily converted into cash. This definition does not include cross-holdings.

17
β7Cash Flowi + β8Divi + εi for each year t (7)
where Cash is the natural log of (cash/assets), Size is the natural log of real assets (deflated by the
CPI), Sales growth is the past year’s sales growth, NWC is (current assets – current liabilities –
cash)/assets, Capex is capital expenditures/assets, Leverage is (short-term debt + long-term
debt)/assets, RD is (research and development expense/sales), Cash Flow is (EBIT – interest
expense – taxes – dividends)/assets, and Div is a dummy variable which equals one if the firm
paid a dividend in that year and zero otherwise. When R&D is missing, it is set to zero. Negative
dividends are set to zero. Firm years with negative sales or assets are eliminated.
The above regression is estimated each year from 1988 to 1999 and the coefficients are used
to determine predicted levels of cash as if the firm were a U.S. firm. Excess cash holdings are
determined by subtracting the exponentiated predicted value from the actual level of cash/assets
(i.e. excess cash/assets = cash/assets – exp(predicted log cash/assets)). Table 1 shows the
distribution of firm years from each country for which we can calculate excess cash holdings. In
order for a country year to be included in our sample, countries are required to have at least five
firms for which we can obtain excess cash data.
4. The cross-country determinants of liquid asset holdings
From Section 2, we expect that liquid asset holdings are positively correlated with economic
development and uncertainty, and negatively correlated with expected inflation, financial
development, and the quality of institutions. To test these hypotheses, we compute the difference
between a firm’s liquid asset holdings and its benchmark holdings and call that difference the
firm’s excess cash for simplicity. This allows us to compare cash holdings relative to what they
would be if the quality of institutions, financial development, and economic development were all
high. We then estimate regressions where the dependent variable is excess cash and the
independent variables are country characteristics.

18
As shown in Table 1, there is wide variation in the number of firms in our sample across
countries. If we regress excess cash on country characteristics using all firms in our sample, our
results would be driven by the few countries that have most of the firms. To avoid this, we
estimate the relation between excess cash and country characteristics using one observation per
country per year. We choose the representative level of excess cash for a country year as being
equal to the amount held by the firm with the median amount of excess cash from all firms in that
country for that year. With this approach, no country dominates the results and our results do not
have a misleading statistical significance driven by countries with large numbers of firms.
Summary statistics for our full panel of data are shown in Table 2.
The average level of excess cash across countries varies from -1% in Peru and New Zealand
to 14% in Japan. The average of excess cash is positive for all countries but two. Excess cash is
positive for 366 country years out of 401. The median excess cash is positive for all countries but
two and the average of country medians is positive. There are also differences in the quality of
institutions measured by corruption, political concentration, political risk, rule of law, and risk of
expropriation. Western European countries, the U.S., and Canada have the highest quality of
institutions with perfect or close to perfect scores in the various measures. For our measures of
the quality of institutions, the countries with poorer institutions are generally located in Asia and
South America. The variation in financial development is a function of the measure used.
Measured by activity proxied by turnover, South Korea has the highest activity while Chile is the
most inactive. We will also use the ratio of bond and stock market capitalization to GDP. This
ratio is highest for Hong Kong and lowest for Mexico. Switzerland has the highest GDP per
capita and India has the lowest.
Our dataset is such that we could estimate the relation between excess cash and country
characteristics using pooled time-series regressions. The problem with this approach is that it
would overstate the significance of the estimates, since the observations in one year are unlikely

19
to be independent of the observations in a contiguous year. Fama and French (1998) recommend
the methodology of Fama-McBeth (1973) to address this issue. In contrast to the earlier research
investigating implications of the quality of institutions, we can implement this method because
we have 12 years of data available. Hence, the regression coefficients in Table 3 represent the
time-series average of the annual regression coefficients. The t-statistics are computed using the
standard error of the time-series of regression coefficients. We also estimate, but do not report,
pooled time-series regressions using the full panel. Our conclusions are not sensitive to the
regression technique used.
Propositions 1-3 from our model indicate that excess cash in a country should fall with the
quality of institutions and the degree of financial development, and increase with economic
development. Table 3 tests these three hypotheses using Fama-MacBeth regressions of excess
cash on indices of the quality of institutions, a proxy for financial development, and an index of
economic development, GDP per capita. The measures of the quality of institutions are the
indices of political risk constructed by ICRG, political constraints, corruption, rule of law,
expropriation risk, and anti-director rights. Four of these indices (the country rating, the index of
political constraint, the corruption index, the index for the rule of law) change over time, but the
other two (expropriation risk and anti-director rights) do not. We use stock market turnover to
GDP as the measure of financial development in Panels A and B and capital market capitalization
to GDP in Panels C and D. The natural logarithm of GDP per capita is used as the proxy for
economic development. Additionally, we use inflation as a proxy for the cost of holding liquid
assets and we use volatility of the stock market as a proxy for uncertainty.
Turnover, used as a proxy for financial development, has a significant negative coefficient in
all regressions in Panels A and B. This result is consistent with Proposition 2. However, in
Panels C and D, we use the combined capitalization of the bond and stock markets divided by
GDP as a proxy for financial development instead. The coefficient on that variable is always

20
significantly positive, which is inconsistent with Proposition 2. These results have one of two
interpretations. It could be that stock market activity measures financial development better than
stock market capitalization. Alternatively, it could be that there is no reliable relation between
financial development and cash holdings. Earlier studies which find a significant coefficient on
turnover but not on stock market capitalization (see, for instance, Demirgüc-Kunt and
Maksimovic, 1998) lean towards the former view. The log of GDP per capita is used as a proxy
for economic development. The coefficient on this variable is always positive as predicted by
Proposition 3. The coefficient on inflation is negative but not always significant. The coefficient
on stock market volatility is positive and always significant. Proposition 1 states that cash
holdings should be lower in countries with institutions of higher quality. Since all of the indices
we use are constructed so that a higher number means better institutions, we expect a negative
sign on the variables. Panel A reports the coefficients on those measures of the quality of
institutions for which we have yearly data. In each case, the coefficient on the index of the quality
of institutions is negative and significant as predicted.
The model in Section 2 focuses on the extraction of private benefits by large shareholders
and views holding liquid assets as facilitating the extraction of private benefits. The evidence is
consistent with the model, but an alternative explanation should be examined. It is well-known
that ownership is more concentrated in countries with poorer institutions. If ownership is more
concentrated, controlling shareholders have to bear more diversifiable risk. They might therefore
want the firm to hold more cash as a way of reducing the firm’s risk. In this case, greater liquid
asset holdings would still be a benefit to the controlling shareholder, but a benefit of a different
sort since no tunneling would take place. We examine this possibility by estimating equation (6)
which includes the measure of ownership concentration in the firm’s country discussed earlier.
Though the coefficient on ownership concentration is positive as predicted, it is not significant.
The result suggests that controlling shareholders prefer cash holdings because it allows them to
21
expropriate wealth from minority shareholders rather than because it reduces the risk of the firm.
A more direct test of this would be to use ownership at the firm level. Requiring reliable
ownership information would reduce our sample substantially. Kalcheva and Lins (2003) find
that there is a positive relation between cash holdings and control rights held by the large
shareholder, suggesting that a more direct investigation of the risk aversion hypothesis is
warranted.4
Panel B of Table 3 uses averages over the sample period of the measures for the quality of
institutions. The literature averages the institution quality indices, perhaps because of a belief that
yearly measures are noisy. We find that the coefficients are more significant when we use
averages and that the regressions have slightly higher explanatory power. However, the
inferences do not change. Regression (5) uses the anti-director index of LLSV1. The anti-director
index has a negative coefficient, but it is not significant. This finding is not consistent with DMS.
The coefficient on the anti-director rights index is quite sensitive to the control variables. It
becomes significantly negative if we use total market capitalization as our proxy for financial
development and also if we do not include GDP per capita as an explanatory variable. In general,
if we do not include GDP per capita, our institution quality variables switch signs, so that
countries with better institutions have more cash. This is because countries with better institutions
have higher GDP per capita. However, with the anti-director index, this does not happen because
the index is negatively correlated with GDP per capita. Hence, the omitted variable bias makes
the coefficient more significant in this case, so that when we do not control for GDP per capita
and use a pooled regression, we obtain the same result as DMS. Regression (6) uses the
expropriation risk index of LLSV1. As expected it has a significant negative coefficient. Finally,
regression (7) in Panel B shows that firms in countries with a civil law legal system hold more
4 The paper by Kalcheva and Lins (2003) is contemporaneous to this paper. They investigate the relation between cash, firm value, and ownership for 1996. They use the anti-director index as their measure of shareholder protection. In their paper, using this index has no impact on the adjusted R-square.

22
liquid assets. Overall, the regressions support the idea that in countries with institutions of poorer
quality, firms hold greater levels of cash. The results in Panels A and B of Table 3 seem to
provide strong support for Proposition 1.
We investigate the robustness of the results using other measures of the quality of institutions
and of financial development. In regressions not reported in a table, we find that other country
indices, other measures of political constraint, and creditor rights all have coefficients consistent
with the regressions reported in Table 3. We then examine further the robustness of the result for
financial development. We use other proxies for financial development, such as stock market
capitalization to GDP, bond market capitalization to GDP, and total stock value traded to GDP.
We find that the coefficient on financial market development is often significantly positive with
the other measures. In Panels C and D of Table 3, we report regressions similar to those of
Panels A and B, but use the sum of the capitalization of the stock market and the bond market
normalized by GDP as our proxy for financial development. This measure is available only from
1989 through 1999. The coefficient on this proxy for financial development is always
significantly positive, which is inconsistent with the tradeoff theory. However, the coefficients on
the institution quality measures are always significantly negative regardless of which financial
development variable we use. The bottom line of the investigation is that the relation between the
quality of institutions and liquid asset holdings is robust, in that it does not depend on which
proxy we use for financial development or whether we even use a proxy.
We examine whether the variation across years of the financial development proxies is
responsible for the lack of reliability of our inferences about financial development, but that is not
the case. The same conclusions hold if we use the level of financial development at one point in
time. Finally, we add to regression (8) a quality of institutions variable to examine the effect of
simultaneously controlling for ownership structure. When we do that, the quality of institutions
variable still has a negative and significant coefficient irrespective of which variable we use. We
23
also estimate a regression where we use all the proxies for the quality of institutions. With this
regression, it is not surprising that some of the measures of the quality of institutions are
insignificant since they are all highly correlated. The indices of corruption and law and order have
negative significant coefficients. In virtually all the regressions we estimate, GDP per capita and
stock market volatility have significant positive coefficients, while inflation has negative
coefficients. The conclusion from all these alternate regressions is that the relation between
measures of the quality of institutions and liquid asset holdings is extremely robust.
5. The market value of cash holdings
In the previous section, we find strong support for Propositions 1 and 3 of our model, but no
reliable support for Proposition 2. These results are consistent with the tradeoff theory as well as
with the agency costs theory. We therefore have to investigate Proposition 4 which has sharply
different predictions depending on which one of these two theories applies. Proposition 4 predicts
that, in the presence of agency costs, cash will be worth less to minority investors when the
quality of institutions is lower because they expect more of the cash to be expropriated by
controlling shareholders. In contrast, if the tradeoff theory holds, investors should value liquid
asset holdings at roughly a dollar since if they were worth less the firm could pay out the cash it
holds. Data for our firm level analysis come from the Worldscope Database. There are obvious
reasons to be cautious in interpreting the results of the regressions since we are estimating a
regression using data from different countries with different accounting conventions. There is no
clear way to make the data across countries more comparable beyond what Worldscope already
does.
To estimate the value of cash, it is necessary to have a regression model for the value of the
firm and then to be able to separate cash in that regression model so that its contribution to firm
value can be examined directly. Fama and French (1998) develop a valuation regression that
24
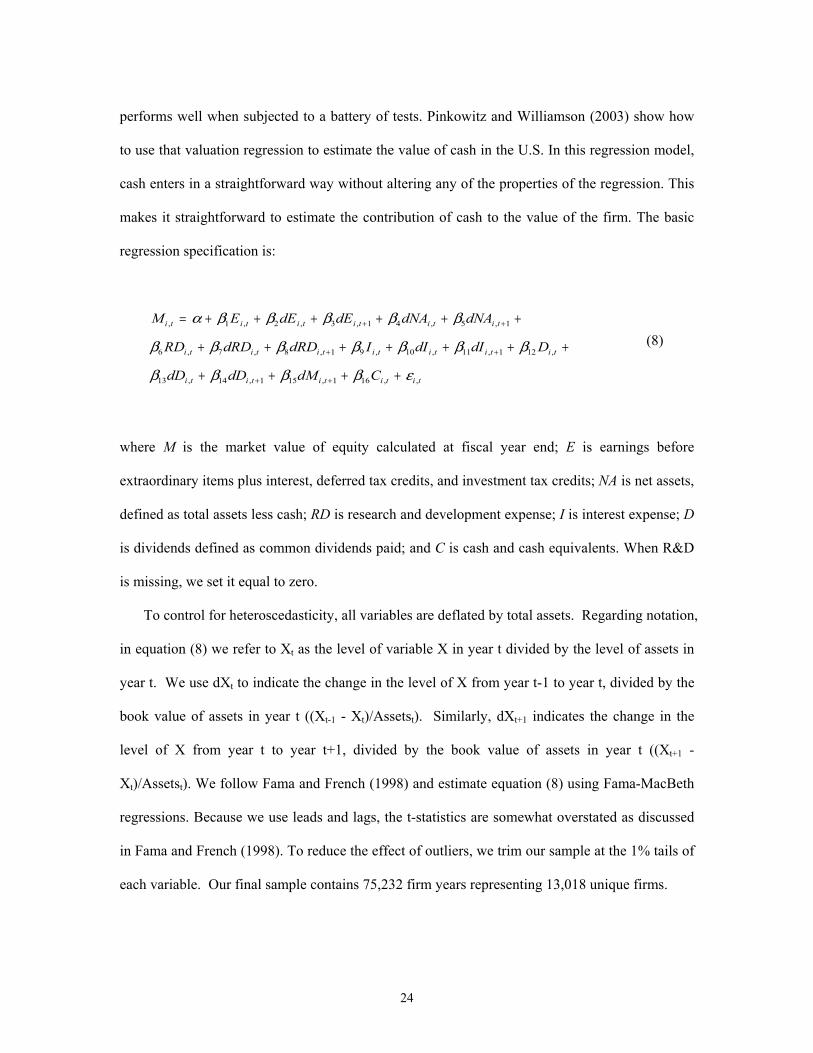
performs well when subjected to a battery of tests. Pinkowitz and Williamson (2003) show how
to use that valuation regression to estimate the value of cash in the U.S. In this regression model,
cash enters in a straightforward way without altering any of the properties of the regression. This
makes it straightforward to estimate the contribution of cash to the value of the firm. The basic
regression specification is:
M E dE dE dNA dNA
RD dRD dRD I dI dI D
dD dD dM C
i t i t i t i t i t i t
i t i t i t i t i t i t i t
i t i t i t i t i t
, , , , , ,
, , , , , , ,
, , , , ,
= + + + + + +
+ + + + + + +
+ + + +
+ +
+ +
+ +
α β β β β β
β β β β β β β
β β β β ε
1 2 3 1 4 5 1
6 7 8 1 9 10 11 1 12
13 14 1 15 1 16
(8)
where M is the market value of equity calculated at fiscal year end; E is earnings before
extraordinary items plus interest, deferred tax credits, and investment tax credits; NA is net assets,
defined as total assets less cash; RD is research and development expense; I is interest expense; D
is dividends defined as common dividends paid; and C is cash and cash equivalents. When R&D
is missing, we set it equal to zero.
To control for heteroscedasticity, all variables are deflated by total assets. Regarding notation,
in equation (8) we refer to Xt as the level of variable X in year t divided by the level of assets in
year t. We use dXt to indicate the change in the level of X from year t-1 to year t, divided by the
book value of assets in year t ((Xt-1 - Xt)/Assetst). Similarly, dXt+1 indicates the change in the
level of X from year t to year t+1, divided by the book value of assets in year t ((Xt+1 -
Xt)/Assetst). We follow Fama and French (1998) and estimate equation (8) using Fama-MacBeth
regressions. Because we use leads and lags, the t-statistics are somewhat overstated as discussed
in Fama and French (1998). To reduce the effect of outliers, we trim our sample at the 1% tails of
each variable. Our final sample contains 75,232 firm years representing 13,018 unique firms.
25
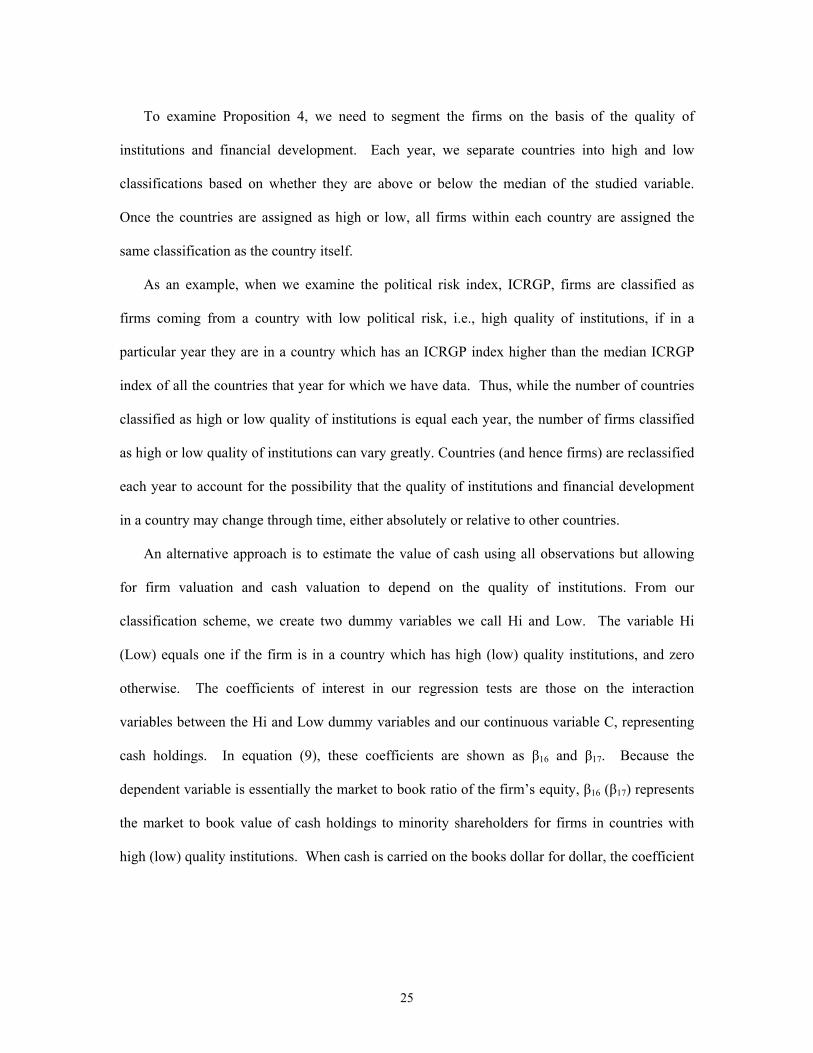
To examine Proposition 4, we need to segment the firms on the basis of the quality of
institutions and financial development. Each year, we separate countries into high and low
classifications based on whether they are above or below the median of the studied variable.
Once the countries are assigned as high or low, all firms within each country are assigned the
same classification as the country itself.
As an example, when we examine the political risk index, ICRGP, firms are classified as
firms coming from a country with low political risk, i.e., high quality of institutions, if in a
particular year they are in a country which has an ICRGP index higher than the median ICRGP
index of all the countries that year for which we have data. Thus, while the number of countries
classified as high or low quality of institutions is equal each year, the number of firms classified
as high or low quality of institutions can vary greatly. Countries (and hence firms) are reclassified
each year to account for the possibility that the quality of institutions and financial development
in a country may change through time, either absolutely or relative to other countries.
An alternative approach is to estimate the value of cash using all observations but allowing
for firm valuation and cash valuation to depend on the quality of institutions. From our
classification scheme, we create two dummy variables we call Hi and Low. The variable Hi
(Low) equals one if the firm is in a country which has high (low) quality institutions, and zero
otherwise. The coefficients of interest in our regression tests are those on the interaction
variables between the Hi and Low dummy variables and our continuous variable C, representing
cash holdings. In equation (9), these coefficients are shown as β16 and β17. Because the
dependent variable is essentially the market to book ratio of the firm’s equity, β16 (β17) represents
the market to book value of cash holdings to minority shareholders for firms in countries with
high (low) quality institutions. When cash is carried on the books dollar for dollar, the coefficient

26
represents the market value of the marginal dollar of cash holdings for the firm.5 To account for
the fact that market to book values are likely to be affected directly by institution quality, the
regression also includes separate intercepts for high and low quality countries:
( ) ( )
M Hi E dE dE dNA dNA
RD dRD dRD I dI dI D
dD dD dM Hi C Low C
i t i t i t i t i t i t
i t i t i t i t i t i t i t
i t i t i t i t i t i t i t
, , , , , ,
, , , , , , ,
, , , , , , ,
= + + + + + + +
+ + + + + + +
+ + + × + ×
+ +
+ +
+ +
α α β β β β β
β β β β β β β
β β β β β
1 1 2 3 1 4 5 1
6 7 8 1 9 10 11 1 12
13 14 1 15 1 16 17 + εi t,
(9)
Because we estimate the regression using firms in both high and low ranked countries
simultaneously, we refer to these tests as the joint regressions.
Table 4 reports the separate regressions using ICRGP. The third column reports the p-value
for the difference in the coefficients of the two separate regressions. Remember that a high value
for the ICRGP index means low political risk. The coefficient on cash is 1.04 for high ICRGP
index countries and 0.58 for the other countries. Both coefficients are significant and are
significantly different from each other at better than the 5% level. When we investigate the other
coefficients, we find that the coefficient differences that are significant indicate that determinants
of value have more of an impact on value in countries with better institutions. This is consistent
with LLSV2. In particular, there is evidence in the regression that shareholders benefit more from
earnings, tangible investment, and R&D investment in countries with better institutions.
We estimate joint and separate regressions using each of our institution quality variables. For
brevity and ease of presentation, in Table 5 we only report the coefficients and standard errors on
cash holdings.6 With our methodology and sample, we are able to estimate 11 cross-sectional
regressions for all the quality of institutions proxies as well as GDP per capita. Due to data
5 In a number of countries, liquid assets are carried at lower of market or cost. In these countries, the coefficient on cash holdings has an upward bias. 6 Full results of the estimation are available upon request from the authors.

27
limitations, we have only 10 cross-sections to test for the relation between the value of cash and
bond market capitalization or total capital market capitalization.
The first six regressions examine the impact of the quality of institutions on the value of cash
holdings. Countries with poorer quality institutions have a lower market value of cash, which is
consistent with the agency costs theory. The results are quite robust and consistent across each of
the different proxies for the quality of institutions. In countries with institutions of high quality,
the estimates show that a marginal dollar of cash is valued from $1.07 to $1.18 with a standard
error of around seven to nine cents. Hence, it appears that in countries where the risk of
expropriation from controlling shareholders is low, minority shareholders price cash holdings at
their face value. However, the results for countries with higher risk of expropriation indicate a
substantial discount placed on the value of liquid assets. The estimates range from $0.23 to $0.65
depending on the proxy used, with standard errors around eight to sixteen cents. In all six
specifications, the value assigned to cash holdings between high and low quality of institutions
countries is significantly different at the 1% level. Minority investors value cash holdings less in
countries where the incidence of corruption and/or the probability of expropriation are higher.
The impact of the quality of institutions on the intercept of the joint regressions is almost never
significant, but it is positive and significant for the anti-director index.
We saw that cash holdings are related to economic and financial development. In equation (6),
after controlling for cash flow, there is no relation between the discount for cash and either
economic or financial development. However, the quality of institutions is positively correlated
with financial development and economic development. Because of this correlation, we would
expect cash to be worth more in countries with higher financial and economic development.
Alternatively, however, it could be that firms in countries with lower financial and economic
development are somehow constrained in their cash holdings, so that they hold less cash than
would be optimal for them. If that were the case, cash should be more valuable in countries where

28
such constraints are important, which would presumably be the countries with low financial and
economic development. We therefore consider how the value of cash is correlated with financial
and economic development.
We use four variables as proxies for the degree of financial development: stock market
turnover, stock market capitalization, corporate bond market capitalization, and total market
(stock plus bond) capitalization. For normalization purposes, all of the variables are deflated by
the annual GDP of the country. We find that in countries where stock markets are active, cash is
valued at $1.25 with a standard error of $0.13. However, in countries with low market turnover,
the estimate is only $0.62 and the difference between the two coefficients is significant at the one
percent level. We also examine three variables which look at the size of the capital markets
within a country. In countries with greater stock market capitalization, cash appears to be worth
above face value; however, in countries with smaller capitalized equity markets, cash is valued at
a deep discount. Our estimate indicates that the marginal dollar of liquid assets is valued at only
$0.17. The difference between the two is highly significant. When we measure financial
development by the size of the corporate bond market, we find no statistical difference among
high and low development countries. Even in economic terms, the difference appears to be small.
In countries with developed bond markets the value of a dollar is $1.09 while the estimate for
lesser developed countries is $0.62. One possibility for the discrepancy between the results
segmenting firms by bond market capitalization rather than stock market capitalization is the
difference in data availability. As mentioned previously, we only have bond capitalizations for
10 years as opposed to 11 years for stock capitalizations. To determine whether this discrepancy
is affecting the results, for those 10 years, we examine a measure of total market capitalization
which is defined as the sum of the stock and bond capitalizations normalized by GDP. The
results are similar to those for bond capitalization alone. Cash holdings are more valuable in
countries with better developed capital markets. In addition, we reexamine stock capitalization

29
using only 10 cross-sections and find that our estimates are very similar to those obtained using
the full sample. Overall, it appears that cash holdings are more valuable in countries with a
greater degree of financial development. The fact that we do not find a difference when financial
development is measured using bond market capitalization suggests that there may be some key
difference between equity and debt capital markets. The last row of Table 5 shows that cash
holdings are valued at face value in highly developed countries but are worth only $0.56 in lesser
developed ones. It follows from this that cash is valued less in countries with poor financial and
economic development. Most likely, this is because in these countries cash is more likely to be
expropriated from minority shareholders. There is no evidence that firms are constrained from
having too little cash in these countries.
While the joint regressions allow us to use all the data and thus provide for more efficient
estimates, the efficiency comes at a price. Implicitly, the joint regressions constrain all of the
coefficients on the control variables to be equal for both high and low ranked countries. The
separate regressions do not impose this constraint. We reproduce estimates of the cash
coefficients for the separate regressions in the third and fourth columns of Table 5. 7 The
estimates of the value assigned to a marginal dollar of cash are surprisingly similar across the
methods. The estimates for firms from high institution quality or high development countries are
basically identical to those estimated in the joint regressions. For the firms from low institution
quality countries, the separate regression coefficients tend to be even lower than their jointly
estimated counterparts. This same result obtains in the GDP regression, but not in the financial
development regressions where bond market capitalization and total capitalization are not
significantly different.
We investigated an alternative specification of the regressions reported in Tables 4 and 5. In
that specification, we used the original equation estimated by Fama and French (1998), but
7 For brevity we report only the coefficients on the cash variable (β16), but the full results of the estimation are available upon request from the authors.

30
divided the change of net assets into a cash component and a non-cash component. We find
results consistent with the regressions reproduced here, namely a change in cash is worth less in
countries with poor investor protection.
In summary, the results in this section show that minority investors assign a lower value to
cash held by firms in countries with poorer quality institutions, those with less developed equity
markets, and countries with lesser economic development. The results persist in different
estimation specifications as well as across a robust set of proxies for institutional quality. Overall,
the results are consistent with the hypothesis that minority investors put a lower value on cash
when he/she feels there may be a high probability of being expropriated.
6. Conclusion
In this paper, we examine two theories of the determinants of liquid asset holdings of firms
across countries. One theory, the tradeoff theory, assumes that managers maximize firm value.
The other theory, the agency theory, assumes that large shareholders in countries with poor
investor protection have incentives to make decisions that enable them to appropriate more
private benefits from control. Because it is easier to expropriate cash than fixed assets, firms in
countries with poor investor protection are predicted to hold more cash with that theory. We find
that the empirical evidence on the determinants of liquid asset holdings is largely consistent with
both theories. We then turn to an examination of the relation between the liquid assets held by a
firm and the value of that firm. The liquid assets held by firms in countries with poor institutions
contribute substantially less to the value of minority shares than the liquid assets held by firms in
countries with better institutions. This evidence shows that agency costs play an important role in
how minority investors value cash held by corporations.

31
References
Acemoglu, D., S. Johnson, and J. A. Robinson, 2001, The colonial origins of comparative
development: An empirical investigation, American Economic Review 91, 1369-1401.
Acemoglu, D., S. Johnson, J. A. Robinson, and Y. Thaicharoen, 2003, Institutional causes,
macroeconomic symptoms: Volatility, crises, and growth, Journal of Monetary Economics.
Almeida, H., M. Campello, and M. Weisbach, 2003, The cash flow sensitivity of cash, Journal of
Finance, forthcoming.
Beck, T., Demirgüç-Kunt A., Levine, R., 1999, A new database on financial development and
structure, working paper, University of Minnesota, Minneapolis.
Booth, L., V. Aivazian, A. Demirgüc-Kunt, and V. Maksimovic, 2001, Capital structures in
developing countries, Journal of Finance, 87-129.
Claessens, S., and Laeven, L., 2003, Financial development, property rights, and growth, Journal
of Finance, forthcoming.
Dalquist, M., L Pinkowitz, R. M. Stulz, and R. Williamson, 2003, Corporate governance and the
home bias, Journal of Financial and Quantitative Analysis, 87 – 110.
Demirgüc-Kunt, A. and V. Maksimovic, 1998, Law, Finance, and Firm Growth, Journal of
Finance, Vol. 53, pp. 2107-2137.
Dittmar, A., Mahrt-Smith, J., and H. Servaes, 2003, International Corporate Governance and
Corporate Cash Holdings, Journal of Financial and Quantitative Analysis, Vol 38.
Easterly, W., 2001, The elusive quest for growth: Economists’ adventures and misadventures in
the tropics, MIT Press, Cambridge, MA.
Fama, E. F. and K. R. French, 1998, Taxes, financing decisions, and firm value, Journal of
Finance 53, 819-843.
Fama, E. F., and J. D. MacBeth, 1973, Risk, return, and equilibrium: Empirical tests, Journal of
Political Economy 81, 607-636.

32
Jensen, M., 1986, Agency Costs of Free Cash Flow, Corporate Finance and Takeovers, American
Economic Review, Vol. 76, pp. 323-339.
Hart, O., and J. Moore, 1994, A theory of debt based on the inalienability of human capital,
Quarterly Journal of Economics 109, 841-879.
Henisz, W. J., 2000, The institutional environment for economic growth, Economics and Politics
12, 1-31.
Johnson, S., R. La Porta, F. Lopez-de-Silanes, and A. Shleifer, 2000, Tunneling, American
Economic Review 90, 22-27.
Kalcheva, I, and K. Lins, 2003, International evidence on cash holdings and expected managerial
agency problems, unpublished working paper, University of Utah, Salt Lake City, Utah.
Kaufman, D., and S.-J. Wei, 1999, Does corruption grease the wheels of commerce?, unpublished
working paper, World Bank, Washington, D.C.
Keynes, J.M., 1934, The General Theory of Employment, Interest and Money, in the 1973 edition
of the Collected Writings of John Maynard Keynes, Vol. 7. edited by Donald Moggridge,
London: Macmillan for the Royal Economic Society.
La Porta, R., F. Lopez-de-Silanes, and A. Shleifer, 1999, Corporate ownership around the world,
Journal of Finance 54, 471-517.
La Porta, R., F. Lopez-de-Silanes, A. Shleifer, and R. Vishny, 1998, Law and finance, Journal of
Political Economy 106, 1113-1155.
La Porta, R., F. Lopez-de-Silanes, A. Shleifer, and R. Vishny, 2000, Investor protection and
corporate governance, Journal of Financial Economics 58, 3-27.
La Porta, R., F. Lopez-de-Silanes, A. Shleifer, and R. Vishny, 2002, Investor protection and
corporate valuation, Journal of Finance 57, 1147-1170.
Levine, R., 1997, Financial development and economic growth: View and agenda, Journal of
Economic Literature 35, 688-726.
Love, I., 2000, Financial development and financing constraints: International evidence from the
structural investment model, working paper, World Bank, Washington, DC.

33
Mulligan, C.B., 1997, Scale economies, the value of time, and the demand for money:
Longitudinal evidence from firms, Journal of Political Economy 105, 1061-1079.
Myers, S. C., and R. G. Rajan, 1998, The paradox of liquidity, Quarterly Journal of Economics
108, 733-771.
Opler, T., L. Pinkowitz, R. Stulz, and R. Williamson, 1999, The determinants and implications of
corporate cash holdings, Journal of Financial Economics 52, 3-46.
Pinkowitz, L., and R. Williamson, 2001, Bank power and cash holdings: Evidence from Japan,
Review of Financial Studies 14, 1059-1082.
Pinkowitz, L. and R. Williamson, 2003, What is a dollar worth? The market value of cash
holdings, Working paper, Georgetown University.
Rajan, R. G., and L. Zingales, 1998, Financial dependence and growth, American Economic
Review 88, 559-586.
Shleifer, A., Vishny, R. W., 1993, Corruption, Quarterly Journal of Economics 108, 599-618.
Shleifer, A., and D. Wolfenzon, 2003, Investor protection and equity markets, Journal of
Financial Economics 66, 3-27.
Stulz, R. M. and R. Williamson, 2003, Culture, openness and finance, Journal of Financial
Economics, forthcoming.

Table 1 Worldscope Sample Firm years are based on number of firms for which excess cash can be computed.
Country Years Mean Firms
per year Median Firms
per year Minimum
Firms per year Maximum
Firms per year Argentina 1988-1999 22.33 26 5 38 Australia 1988-1999 174.25 178 123 206 Austria 1988-1999 52.08 53 30 65 Belgium 1988-1999 68.833 71.5 51 72 Brazil 1988-1999 69.83 76.5 13 119 Canada 1988-1999 393.00 402.5 332 428 Chile 1988-1999 44.75 47 20 71 Denmark 1988-1999 112.00 123.5 52 132 Finland 1988-1999 96.25 96.25 75 109 France 1988-1999 406.25 419.5 308 476 Germany 1988-1999 401.08 416 295 442 Greece 1993-1998 8.67 9.5 5 11 Hong Kong 1988-1999 129.25 95.5 49 274 India 1990-1999 155.38 166 16 296 Ireland 1988-1999 43.50 46 27 49 Italy 1988-1999 137.00 137.5 65 162 Japan 1988-1999 646.58 453.5 105 1232 Korea (South) 1988-1999 139.67 105.5 29 245 Malaysia 1988-1999 174.67 176 53 314 Mexico 1988-1999 48.92 53.5 23 70 Netherlands 1988-1999 159.75 165.5 122 184 New Zealand 1988-1999 32.67 30 20 46 Norway 1988-1999 90.58 91 73 101 Peru 1992-1998 18.71 19 6 27 Philippines 1988-1999 33.64 34 6 65 Portugal 1988-1999 28.50 28 9 52 Singapore 1988-1999 99.33 92.5 37 171 South Africa 1988-1999 124.75 135.5 96 146 Spain 1988-1999 97.33 108.5 54 116 Sweden 1988-1999 142.75 151.5 101 159 Switzerland 1988-1999 117.25 127.5 75 139 Thailand 1990-1999 128.82 172 5 211 Turkey 1990-1999 22.30 22 11 36 United Kingdom 1988-1999 1177.50 1220 849 1339 United States 1988-1999 2264.92 2507.5 386 2879

Tab
le 2
Mea
ns o
f var
iabl
es w
ithin
a c
ount
ry a
cros
s yea
rs.
Whe
re e
xcas
h is
exc
ess
cash
to a
sset
s, IC
RG
P is
the
over
all p
oliti
cal r
isk
mea
sure
take
n fr
om th
e In
tern
atio
nal C
ount
ry R
isk
Gui
de (
ICR
G),
corr
uptio
n is
the
leve
l of g
over
nmen
t cor
rupt
ion
take
n fr
om IC
RG
, law
/ord
er is
the
law
and
ord
er tr
aditi
on in
eac
h co
untry
take
n fo
rm th
e IC
RG
, an
d po
lcon
is a
mea
sure
of g
over
nmen
t cen
traliz
atio
n ta
ken
from
Hen
isz
(200
0).
From
the
Wor
ld D
evel
opm
ent I
ndic
ator
com
es s
cap
whi
ch is
the
stoc
k m
arke
t cap
italiz
atio
n to
GD
P an
d st
urn
whi
ch is
the
stoc
k m
arke
t tur
nove
r to
GD
P. L
a Po
rta, L
opez
de
Salin
as, S
hlei
fer,
and
Vis
hny
(199
8) is
th
e so
urce
of e
xpri
sk w
hich
is th
e ris
k of
out
right
con
fisca
tion
and
antid
ir w
hich
is a
n in
dex
mea
sure
of t
he p
rote
ctio
n of
sha
reho
lder
righ
ts.
Bon
d m
arke
t cap
italiz
atio
n (b
cap)
com
es fr
om th
e B
ank
for I
nter
natio
nal S
ettle
men
ts a
nd tc
ap is
the
sum
of b
ond
mar
ket c
apita
lizat
ion
and
stoc
k m
arke
t ca
pita
lizat
ion.

36
C
ount
ry
exca
sh
icrg
p co
rrup
tion
law
/ord
erpo
lcon
scap
st
urn
sval
ex
pris
kan
tidirr
gdp
bcap
Tc
ap
Arg
entin
a 0.
03
69.6
5 5.
32
6.78
0.
59
0.13
0.
33
0.04
5.
91
4.00
7,
246
0.02
0.
16
Aus
tralia
0.
02
81.3
4 8.
33
10.0
0 0.
87
0.63
0.
40
0.24
9.
27
4.00
20
,330
0.
17
0.81
A
ustri
a 0.
04
85.8
8 7.
99
10.0
0 0.
74
0.13
0.
58
0.07
9.
69
2.00
28
,771
0.
31
0.45
B
elgi
um
0.06
79
.34
7.42
9.
56
0.89
0.
47
0.17
0.
09
9.63
0.
00
26,8
20
0.53
1.
01
Bra
zil
0.01
66
.63
6.32
5.
47
0.76
0.
21
0.47
0.
12
7.62
3.
00
4,29
7 0.
12
0.39
C
anad
a 0.
00
83.3
3 10
.00
10.0
0 0.
86
0.67
0.
46
0.31
9.
67
5.00
19
,624
0.
12
0.81
C
hile
0.
01
70.1
0 5.
30
7.47
0.
64
0.81
0.
10
0.08
7.
50
5.00
4,
172
0.14
1.
00
Den
mar
k 0.
11
85.6
7 10
.00
10.0
0 0.
77
0.38
0.
44
0.16
9.
67
2.00
33
,740
1.
01
1.41
Fi
nlan
d 0.
05
96.2
5 10
.00
10.0
0 0.
77
0.59
0.
35
0.20
9.
67
3.00
26
,295
0.
33
0.94
Fr
ance
0.
06
79.7
3 8.
00
9.02
0.
74
0.42
0.
56
0.20
9.
65
3.00
26
,657
0.
48
0.92
G
erm
any
0.02
82
.77
8.92
9.
77
0.84
0.
30
1.34
0.
35
9.90
1.
00
29,5
94
0.50
0.
81
Gre
ece
0.04
75
.43
8.33
8.
89
0.74
0.
26
0.50
0.
13
7.12
2.
00
11,4
54
0.02
0.
28
Hon
g K
ong
0.08
68
.89
7.58
8.
24
. 2.
12
0.51
1.
03
8.29
5.
00
21,0
23
0.08
2.
28
Indi
a 0.
00
59.7
1 4.
79
6.35
0.
71
0.33
0.
36
0.11
7.
75
5.00
38
7 0.
02
0.34
Ir
elan
d 0.
06
81.5
2 7.
48
8.88
0.
76
0.26
0.
67
0.33
9.
67
4.00
17
,834
0.
07
0.31
Ita
ly
0.05
75
.31
6.03
8.
95
0.77
0.
24
0.48
0.
13
9.35
1.
00
18,8
06
0.30
0.
55
Japa
n 0.
14
82.3
9 7.
45
9.38
0.
76
0.85
0.
43
0.39
9.
67
4.00
41
,437
0.
45
1.25
K
orea
(Sou
th)
0.05
72
.13
6.28
6.
35
0.65
0.
40
1.43
0.
55
8.31
2.
00
9,74
6 0.
36
0.77
M
alay
sia
0.03
70
.77
6.49
6.
68
0.73
1.
77
0.42
0.
85
7.95
4.
00
3,84
5 0.
54
2.17
M
exic
o 0.
03
69.1
9 4.
71
4.78
0.
32
0.28
0.
39
0.10
7.
29
1.00
3,
299
0.01
0.
12
Net
herla
nds
0.02
86
.76
10.0
0 10
.00
0.75
0.
84
0.63
0.
60
9.98
2.
00
26,4
83
0.25
1.
13
New
Zea
land
-0
.01
83.6
5 9.
51
9.95
0.
74
0.44
0.
29
0.13
9.
69
4.00
15
,836
0.
00
0.45
N
orw
ay
0.10
84
.71
9.51
10
.00
0.77
0.
28
0.57
0.
16
9.88
4.
00
32,4
07
0.23
0.
52
Peru
-0
.01
53.4
6 5.
00
4.48
0.
40
0.19
0.
32
0.06
5.
54
3.00
2,
181
0.02
0.
23
Phili
ppin
es
0.05
57
.62
4.68
5.
75
0.50
0.
53
0.32
0.
15
5.22
3.
00
1,09
2 0.
00
0.53
Po
rtuga
l 0.
01
78.5
4 8.
21
8.67
0.
74
0.24
0.
40
0.11
8.
90
3.00
10
,667
0.
13
0.38
Si
ngap
ore
0.11
81
.02
6.81
9.
13
0.68
1.
46
0.49
0.
68
9.30
4.
00
21,3
42
0.14
1.
64
Sout
h A
fric
a 0.
03
66.0
8 7.
87
4.22
0.
51
1.46
0.
13
0.19
6.
88
5.00
3,
964
0.14
1.
61
Spai
n 0.
01
73.9
0 7.
24
8.21
0.
75
0.37
0.
79
0.36
9.
52
4.00
14
,814
0.
15
0.53
Sw
eden
0.
06
84.2
6 10
.00
10.0
0 0.
76
0.75
0.
47
0.38
9.
40
3.00
27
,307
0.
54
1.31
Sw
itzer
land
0.
09
88.6
4 9.
51
10.0
0 0.
84
1.37
0.
77
1.21
9.
98
2.00
44
,437
0.
52
1.95
Th
aila
nd
0.01
65
.24
4.76
7.
79
0.69
0.
53
0.80
0.
36
7.42
2.
00
2,50
1 0.
08
0.61
Tu
rkey
0.
06
55.5
6 4.
68
6.08
0.
68
0.20
1.
10
0.20
7.
00
2.00
2,
838
0.00
0.
21
Uni
ted
Kin
gdom
0.
03
81.3
6 8.
32
9.21
0.
74
1.24
0.
51
0.52
9.
71
5.00
18
,920
0.
19
1.46
U
nite
d St
ates
0.
02
81.1
0 7.
91
10.0
0 0.
85
0.95
0.
78
0.76
9.
98
5.00
27
,487
0.
83
1.82

Table 3 Regressions of excess cash holdings
Regressions are run using the method of Fama and MacBeth (1973) where cross-sectional regressions are run each year and the time series of coefficients are used to make inferences. N is the number of cross-sectional regressions and the adjusted R2 is the mean of the adjusted R2s of the cross-section regressions. Values in parentheses are t-values.
Panel A. Institution quality variables measured annually from 1988 through 1999.
(1) (2) (3) (4) (5) (6)
Intercept -0.206 (-6.70)
-0.207 (-7.32)
-0.217 (-6.79)
-0.224 (-7.94)
-0.275 (-7.73)
-0.213 (-5.95)
Inflation -0.026 (-0.90)
-0.038 (-1.40)
-0.119 (-1.48)
-0.030 (-0.99)
-0.078 (-1.62)
-0.014 (-0.45)
Stock market volatility
0.569 (4.75)
0.527 (4.15)
0.550 (6.06)
0.474 (3.85)
0.607 (6.36)
0.514 (3.73)
Stock market turnover to GDP
-0.011 (-3.82)
-0.010 (-3.50)
-0.011 (-3.67)
-0.016 (-2.95)
-0.013 (-3.00)
-0.008 (-2.16)
Log (GDP per capita)
0.023 (8.72)
0.035 (7.31)
0.030 (7.52)
0.032 (10.89)
0.038 (7.83)
0.023 (6.87)
ICRGP -0.001 (-2.75)
Polcon -0.068 (-2.51)
Corruption -0.007 (-4.31)
Law and Order -0.009 (-5.34)
Closely Held Ownership
0.025 (1.55)
Adjusted R2 0.2189 0.2528 0.2475 0.2575 0.2717 0.2059
N 12 12 12 12 12 12

38
Panel B. Institution quality variables averaged over 1988-1999.
(1) (2) (3) (4) (5) (6) (7) (8)
Intercept -0.158 (-4.55)
-0.155 (-2.73)
-0.216 (-7.13)
-0.269 (-6.17)
-0.206 (-6.31)
-0.206 (-13.73)
-0.196 (-6.79)
-0.212 (-5.56)
Inflation -0.069 (-1.70)
-0.142 (-1.39)
-0.026 (-0.89)
-0.108(-1.78)
-0.031 (-0.99)
-0.130 (-1.59)
-0.036 (-1.08)
-0.020 (-0.70)
Stock market volatility
0.516 (4.40)
0.491 (3.09)
0.439 (3.28)
0.615 (5.46)
0.571 (4.62)
0.589 (9.18)
0.580 (4.67)
0.502 (3.50)
Stock market turnover to GDP
-0.014 (-5.16)
-0.011 (-4.05)
-0.033 (-3.78)
-0.014 (-6.47)
-0.012 (-3.53)
-0.009 (-4.52)
-0.012 (-4.13)
-0.009 (-2.98)
Log (GDP per capita)
0.036 (12.40)
0.030 (4.05)
0.032 (12.23)
0.042 (6.82)
0.023 (8.59)
0.048 (4.64)
0.021 (8.06)
0.029 (6.85)
ICRGP -0.002 (-4.11)
Polcon -0.144 (-2.62)
Corruption -0.009 (-5.28)
Law and Order -0.013 (-5.00)
Anti-Director Index -0.001 (-0.14)
Expropriation Risk -0.026 (-2.37)
Civil Law 0.011 (2.67)
Closely Held Ownership 0.029
(2.11)
Adjusted R2 0.2314 0.2786 0.2525 0.2835 0.1889 0.3204 0.2140 0.2025
N 12 12 12 12 12 12 12 12

39
Panel C. Institution quality variables measured annually from 1989 through 1999. (1) (2) (3) (4) (5) (6)
Intercept -0.197 (-7.10)
-0.188 (-8.02)
-0.212 (-7.41)
-0.209 (-8.07)
-0.233 (-10.48)
-0.1989 (-6.93)
Inflation -0.008 (-0.31)
-0.017 (-0.73)
-0.051 (-0.95)
-0.007 (-0.26)
-0.029 (-0.91)
-0.001 (-0.03)
Stock market volatility
0.624 (6.46)
0.581 (4.85)
0.639 (7.21)
0.514 (4.94)
0.653 (6.67)
0.593 (5.59)
(Stock+Bond) Market Cap to GDP
0.023 (3.92)
0.021 (4.05)
0.023 (4.70)
0.024 (4.12)
0.019 (3.99)
0.023 (4.20)
Log (GDP per capita) 0.019 (7.15)
0.026 (9.08)
0.025 (11.36)
0.026 (13.12)
0.028 (12.26)
0.019 (6.90)
ICRGP -0.001 (-2.18)
Polcon -0.056 (-3.07)
Corruption -0.007 (-4.98)
Law and Order -0.006 (-5.70)
Closely Held Ownership
0.005 (0.50)
Adjusted R2 0.3091 0.3343 0.3235 0.3354 0.3267 0.2986
N 11 11 11 11 11 11

40
Panel D. Institution quality variables averaged over the sample period of 1989-1999 with financial development proxied by market capitalization over GDP.
(1) (2) (3) (4) (5) (6) (7) (8)
Intercept -0.172 (-4.90)
-0.174 (-3.03)
-0.203 (-7.20)
-0.227 (-7.39)
-0.179 (-5.82)
-0.207 (-11.24)
-0.180 (-6.70)
-0.195 (-6.80)
Inflation -0.026 (-0.80)
-0.084 (-0.98)
-0.010 (-0.36)
-0.042 (-1.10)
-0.009 (-0.35)
-0.062 (-1.06)
-0.035 (-099)
-0.005 (-0.18)
Stock market volatility
0.592 (5.21)
0.598 (3.86)
0.488 (4.23)
0.649 (5.89)
0.605 (6.06)
0.640 (9.56)
0.669 (6.49)
0.604 (5.78)
(Stock+Bond) Market Cap to GDP
0.021 (3.86)
0.022 (4.73)
0.023 (4.34)
0.019 (3.99)
0.026 (3.74)
0.016 (5.75)
0.032 (3.67)
0.023 (4.08)
Log (GDP per capita)
0.026 (10.62)
0.027 (10.61)
0.026 (14.42)
0.030 (10.58)
0.018 (6.33)
0.039 (4.55)
0.015 (4.32)
0.019 (5.84)
IGCRP -0.001 (-2.29)
Polcon -0.121 (-2.68)
Corruption -0.08 (-5.56)
Law and Order -0.008 (-8.15)
Anti-director Rights -0.003 (-2.99)
Expropriation Risk -0.020 (-2.00)
Civil Law 0.023 (3.41)
Closely Held Ownership 0.004
(0.61)
Adjusted R2 0.3091 0.3614 0.3404 0.3349 0.2981 0.3666 0.3696 0.2925
N 11 11 11 11 11 11 11 11

41
Table 4. The value of cash and political risk. Regressions are estimated using the method of Fama and MacBeth (1973). Regressions are estimated independently for each subsample and allow coefficients on control variables to vary across subsamples. X t is the level of variable X in year t divided by the level of assets in year t. dX t is the change in the level of X from year t-1 to year t divided by total assets in year t ((X t-1 - X t)/A t). dXt+1 is the change in the level of X from year t+1 to year t divided by assets in year t ((X t+1 - X t)/A t). M is the market value of equity. E is earnings defined as earnings before extraordinary items + interest + deferred tax credits + investment tax credits. NA is net assets, which is defined as total assets - cash. RD is research and development expense. When R&D is missing, it is set to zero. I is interest expense. D is common dividends. C is cash and cash equivalents. The ICRGP index is high for countries with low political risk. The estimated regression is:
M E dE dE dNA dNA
RD dRD dRD I dI dI D
dD dD dM C
i t i t i t i t i t i t
i t i t i t i t i t i t i t
i t i t i t i t i t
, , , , , ,
, , , , , , ,
, , , , ,
= + + + + + +
+ + + + + + +
+ + + +
+ +
+ +
+ +
α β β β β β
β β β β β β β
β β β β ε
1 2 3 1 4 5 1
6 7 8 1 9 10 11 1 12
13 14 1 15 1 16

42
High ICRGP index Low ICRGP index
Difference between high and low ICRGP index
(p-value)
Intercept 0.461 (9.10)
0.464 (8.64) 0.963
E t 3.516
(13.03) 3.722 (9.56) 0.723
dE t -0.475 (-2.94)
-0.498 (-2.54) 0.904
dE t+1 1.820 (8.51)
1.199 (5.70) 0.021
dNA t 0.530 (4.79)
0.230 (2.43) 0.053
dNA t+1 0.295 (5.18)
0.233 (2.96) 0.353
RD t 3.579 (4.52)
-0.162 (-0.11) 0.045
dRD t 5.676 (2.87)
3.482 (0.76) 0.600
dRD t+1 10.628 (6.20)
6.646 (3.60) 0.039
I t -8.620 (-9.96)
-6.835 (-5.73) 0.151
dI t 0.152 (0.17)
1.173 (0.89) 0.469
dI t+1 -5.847 (-6.59)
-2.068 (-3.58) 0.005
D t 5.286 (4.57)
5.596 (6.16) 0.804
dD t 0.518 (0.73)
-0.751 (-1.13) 0.115
dD t+1 2.200 (1.88)
2.569 (2.56) 0.799
dM t+1 0.093 (1.75)
-0.102 (-1.50) 0.004
C t 1.042
(10.57) 0.577 (3.61) 0.036

43
Table 5. The value of cash and investor protection. Regressions are run using the method of Fama and MacBeth (1973) where cross-sectional
regressions are run each year and the time series of coefficients are used to make inferences. Each regression includes 12 cross-sections except for the bond market capitalization regression where we have 11 cross-sections. Joint regressions are estimated using the whole sample and have the same coefficients on control variables. Separate regressions are run independently for each subsample and allow coefficients on control variables to vary across subsamples. X t is the level of variable X in year t divided by the level of assets in year t. dX t is the change in the level of X from year t-1 to year t divided by total assets in year t ((X t-1 - X t)/A t). dXt+1 is the change in the level of X from year t+1 to year t divided by assets in year t ((X t+1 - X t)/A t). M is the market value of equity. E is earnings defined as earnings before extraordinary items + interest + deferred tax credits + investment tax credits. NA is net assets, which is defined as total assets - cash. RD is research and development expense. When R&D is missing, it is set to zero. I is interest expense. D is common dividends. C is cash and cash equivalents. The ICRGP index is high for countries with low political risk. The standard errors are in parentheses. *, **, *** indicate significant difference between the high and low coefficient at the 10, 5, and 1 percent significance levels.
Joint Regressions
( ) ( )
M Hi E dE dE dNA dNA
RD dRD dRD I dI dI D
dD dD dM Hi C Low C
i t i t i t i t i t i t
i t i t i t i t i t i t i t
i t i t i t i t i t i t i t
, , , , , ,
, , , , , , ,
, , , , , , ,
= + + + + + + +
+ + + + + + +
+ + + × + ×
+ +
+ +
+ +
α α β β β β β
β β β β β β β
β β β β β
1 1 2 3 1 4 5 1
6 7 8 1 9 10 11 1 12
13 14 1 15 1 16 17 + εi t,
Separate Regressions M E dE dE dNA dNA
RD dRD dRD I dI dI D
dD dD dM C
i t i t i t i t i t i t
i t i t i t i t i t i t i t
i t i t i t i t i t
, , , , , ,
, , , , , , ,
, , , , ,
= + + + + + +
+ + + + + + +
+ + + +
+ +
+ +
+ +
α β β β β β
β β β β β β β
β β β β ε
1 2 3 1 4 5 1
6 7 8 1 9 10 11 1 12
13 14 1 15 1 16

44
Joint Regressions Separate Regressions
Institution Quality High Institution Quality (β16)
Low Institution Quality (β17)
High Institution Quality (β16)
Low Institution Quality (β16)
Corruption 1.07*** (0.072)
0.30 (0.138)
1.08*** (0.080)
0.02 (0.174)
Polcon 1.13*** (0.094)
0.65 (0.117)
1.10*** (0.098)
0.69 (0.099)
ICRGP 1.08*** (0.093)
0.59 (0.156)
1.04*** (0.098)
0.58 (0.159)
Rule of law 1.08*** (0.070)
0.47 (0.120)
1.05*** (0.084)
0.50 (0.119)
Expropriation 1.07*** (0.076)
0.49 (0.093)
1.05*** (0.092)
0.48 (0.075)
Anti-director rights 1.18*** (0.078)
0.23 (0.080)
1.10*** (0.090)
0.28 (0.075)
Financial Development High Development (β16)
Low Development (β17)
High Development (β16)
Low Development (β16)
Stock market turnover to GDP
1.25*** (0.131)
0.62 (0.082)
1.19*** (0.138)
0.67 (0.072)
Stock Market Capitalization to GDP
1.15*** (0.080)
0.17 (0.100)
1.08*** (0.090)
0.29 (0.096)
Bond Market Capitalization to GDP
1.09*** (0.126)
0.62 (0.120)
1.04 (0.134)
0.77 (0.100)
Total Market Capitalization to GDP
1.04*** (0.092)
0.76 (0.145)
1.02 (0.100)
0.86 (0.140)
Economic Development High Development (β16)
Low Development (β17)
High Development (β16)
Low Development (β16)
GDP per capita 1.08*** (0.110)
0.56 (0.132)
1.04*** (0.123)
0.59 (0.101)