Embed Size (px)
Citation preview
8/4/2019 DP115_v1.0
http://slidepdf.com/reader/full/dp115v10 1/12
R e t a i l o p p o r t u n it ie s in
Ea s t In d ia
January 7, 2011
www.pwc.com

8/4/2019 DP115_v1.0
http://slidepdf.com/reader/full/dp115v10 2/12
January 7, 20112PwC
A g e n d a
India’s retail sector—Snapshot
Selected observations
East India – Snapshot
East India’s retail market
8/4/2019 DP115_v1.0
http://slidepdf.com/reader/full/dp115v10 3/12
January 7, 20113PwC
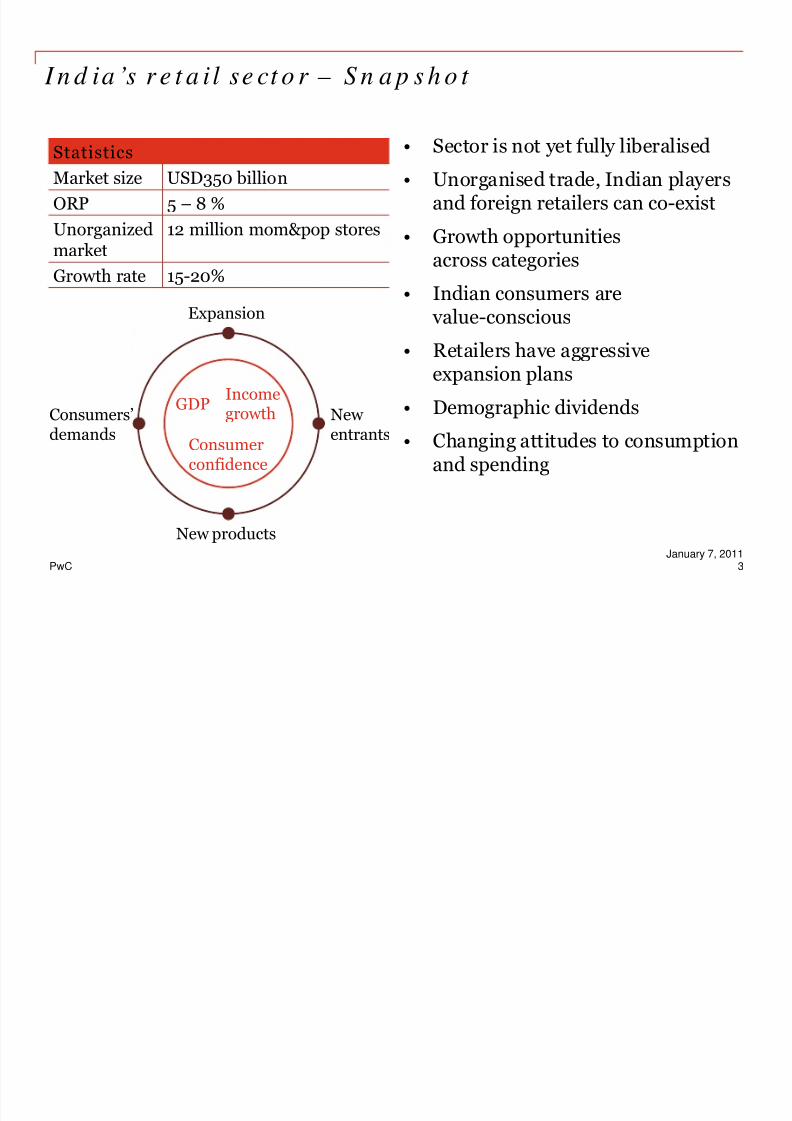
I n d ia ’s r e t a il se ct o r – S n a p s h o t
• Sector is not yet fully liberalised
• Unorganised trade, Indian playersand foreign retailers can co-exist
• Growth opportunitiesacross categories
• Indian consumers are value-conscious
• Retailers have aggressiveexpansion plans
• Demographic dividends• Changing attitudes to consumption
and spending
Statistics
Market size USD350 billion
ORP 5 – 8 %
Unorganizedmarket
12 million mom&pop stores
Growth rate 15-20%
GDPIncome
growth
Consumerconfidence
Expansion
New entrants
Consumers’demands
New products
8/4/2019 DP115_v1.0
http://slidepdf.com/reader/full/dp115v10 4/12
January 7, 20114PwC
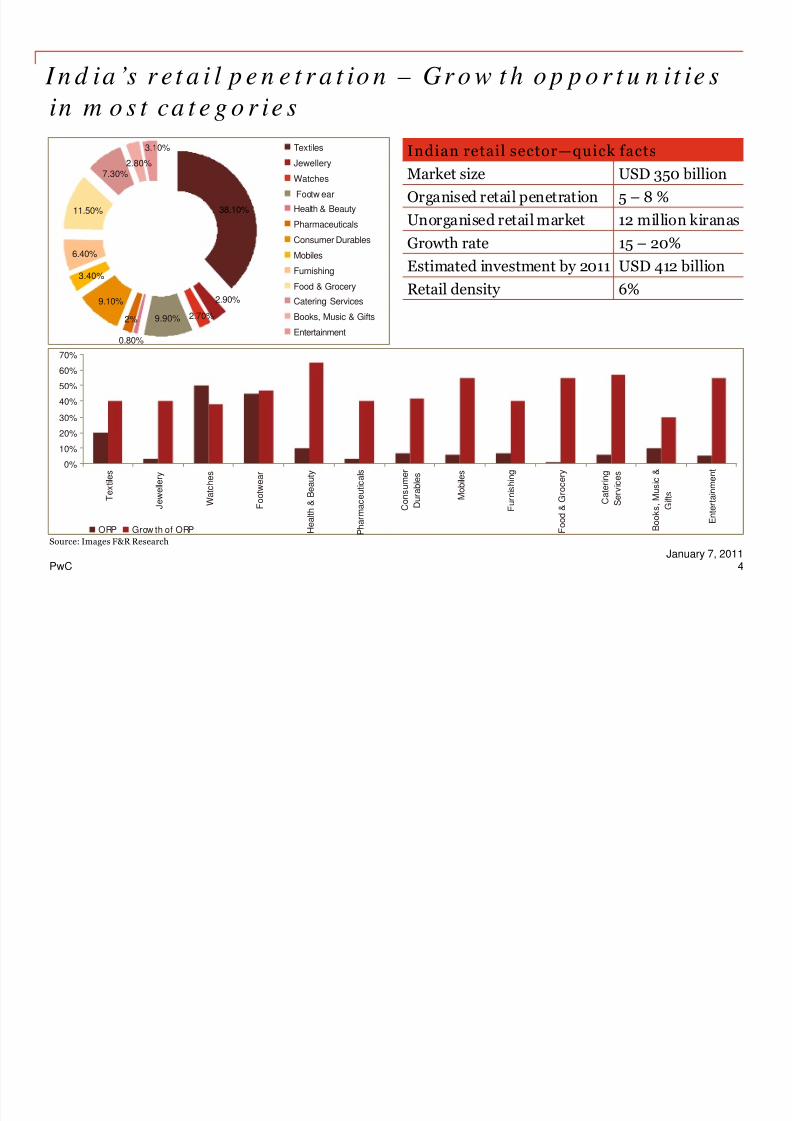
I n d ia ’s r et a i l p e n e t r a t io n – Gr o w t h o p p o r t u n it ie s
in m o s t ca t e g o r ie s
Indian retail sector—quick facts
Market size USD 350 billion
Organised retail penetration 5 – 8 %
Unorganised retail market 12 million kiranas
Growth rate 15 – 20%
Estimated investment by 2011 USD 412 billion
Retail density 6%
9.90%
9.10%
3.40%
6.40%
11.50%
7.30%2.80%
38.10%
2.90%
2.70%
0.80%
2%
3.10% Textiles
Jewellery
Watches
Footw ear
Health & Beauty
Pharmaceuticals
Consumer Durables
Mobiles
Furnishing
Food & Grocery
Catering Services
Books, Music & Gifts
Entertainment
0%
10%
20%
30%
40%
50%
60%
70%
T e x t i l e s
J e w e l l e r y
W a t c h e s
F o o t w e a r
H e a l t h & B e a u t y
P h a r m a c e u t i c a l s
C o n s u m e r
D u r a b l e s
M o b i l e s
F u r n i s h i n g
F o o d & G r o c e r y
C a t e r i n g
S e r v i c e s
B o o k s ,
M u s i c &
G i f t s
E n t e r t a i n m e n t
ORP Grow th of ORP
Source: Images F&R Research
8/4/2019 DP115_v1.0
http://slidepdf.com/reader/full/dp115v10 5/12
January 7, 20115PwC
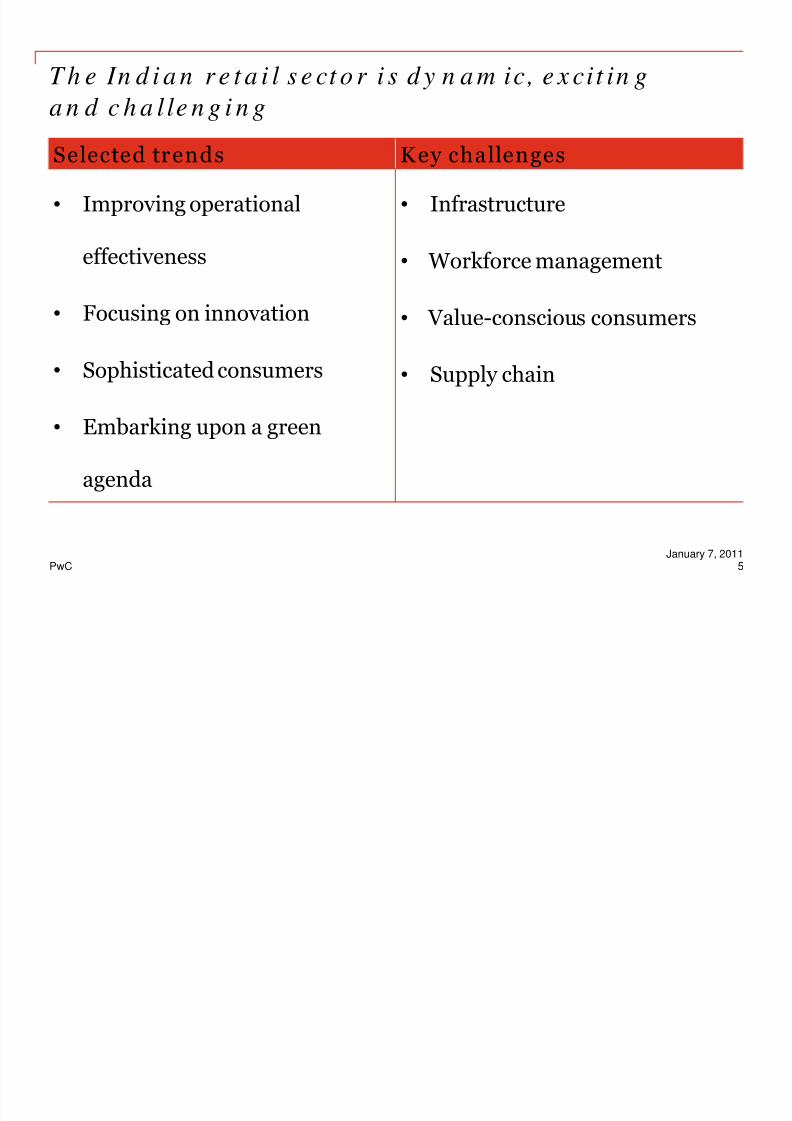
T h e In d i a n r e t a i l s e ct o r i s d y n a m ic, e x cit in g
a n d c h a l le n g i n g
Selected trends Key challenges
• Improving operational
effectiveness
• Focusing on innovation
• Sophisticated consumers
• Embarking upon a green
agenda
• Infrastructure
• Workforce management
• Value-conscious consumers
• Supply chain

8/4/2019 DP115_v1.0
http://slidepdf.com/reader/full/dp115v10 6/12
January 7, 20118PwC
N e t w o r k r e d e sig n t o r e a p b e n e f it s o f Go o d s a n d
S e rv ic es Ta x ( GS T)
The GST regime is scheduled to beimplemented in April 2010 (although itmight be delayed). With the simplificationof the indirect tax structure, there is anopportunity to realign supply chainmanagement purely on business needs.
Selected benefits that retailers canavail include
• In the GST regime the tax paid by thelogistics company can be offset later onin the chain, reducing the cost of outsourcing and providing an impetus
to thirdparty logistics players.• Tax efficiency considerations will not
overwhelm other factors in warehouselocation decisions. This will allow rationalisation of the locations toimprove supply service levels tothe stores.
Supply chain costs
C u s t o m
e r s e r v i c e
High
Low
High
Low
T
Current cost/serviceperformance curve incurrent fiscal regime
T
Cost/serviceperformance curvein Post GST regime
Supply chain exchangecurve (Illustrative)
currentperformance
Better service,same cost
Better service, better cost
Better service,lower cost
8/4/2019 DP115_v1.0
http://slidepdf.com/reader/full/dp115v10 7/12
January 7, 20119PwC
U se of a d v a n ce IT s y s t em s a n d t o o ls
The use of advance IT systems and tools in Indian retail sector is still limited,a more enhanced utilisation of these IT tools can help in achieving significant benefits such as:
• Integration of various partners within the supply chain
• Information sharing among different partners in real time
• Effective monitoring and reporting through BI (Business Intelligence) tools
• IT Planning tools to improve effectiveness of supply chain planning
• Specific advance systems such as warehouse management or transportmanagement systems to improve supply chain efficiencies
8/4/2019 DP115_v1.0
http://slidepdf.com/reader/full/dp115v10 8/12
January 7, 201110PwC
Pr iv a t e la b e l p r o d u ct s – A m a jo r g r o w t h d r iv e r
for r e ta i lers
While low-price private labels exist, retailers are changing their focus from “aprice game” to one that involves developing a portfolio of brands with distinctpositioning for each brand. Retail chains are trying to understand unfulfilleddemands existing in Indian market through need-gap analysis and areincorporating demographic and psychographic indicators.
India’s major retailers expect to embark upon the following strategies for theirprivate label products
• Increase the range of offerings
• Derive an increased share of revenue from the sales of products
• Embark upon promotional offers and sales
• Increase the visibility of products in store outlets
• Offer selected products through other retailers’ outlets
8/4/2019 DP115_v1.0
http://slidepdf.com/reader/full/dp115v10 9/12
January 7, 201111PwC
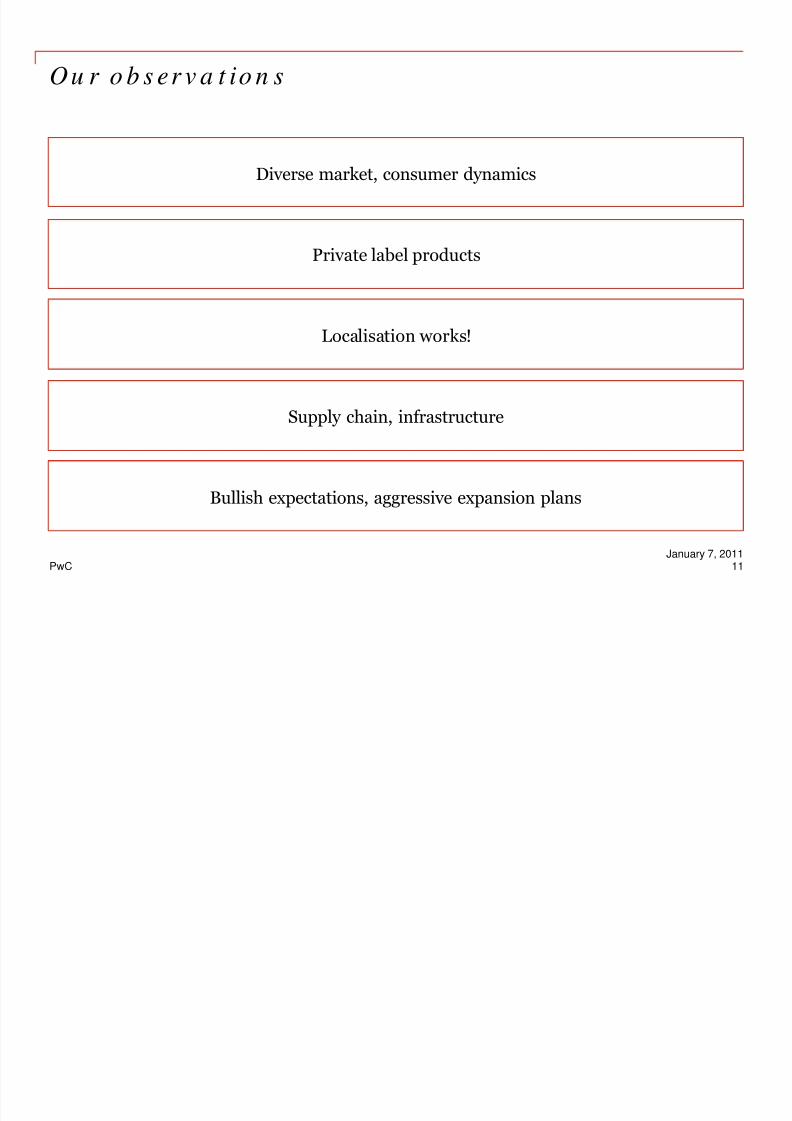
Ou r o b s er v a t io n s
Diverse market, consumer dynamics
Private label products
Supply chain, infrastructure
Bullish expectations, aggressive expansion plans
Localisation works!
8/4/2019 DP115_v1.0
http://slidepdf.com/reader/full/dp115v10 10/12
January 7, 201112PwC
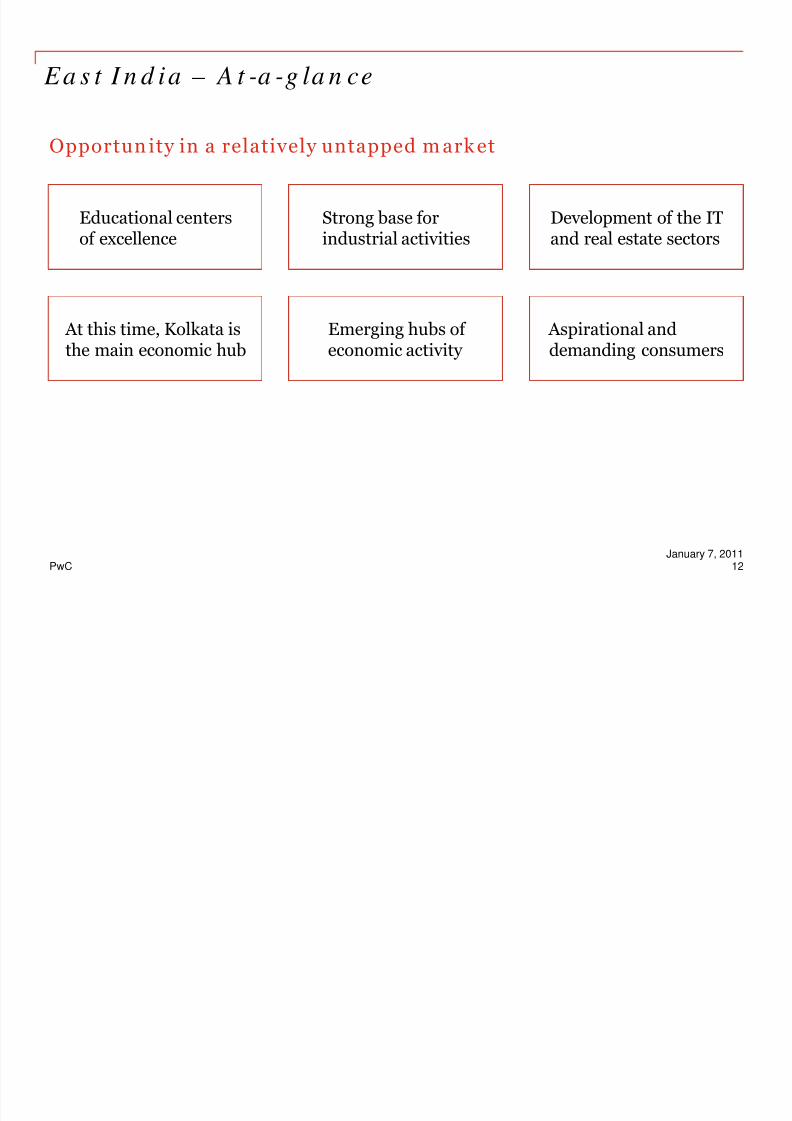
Ea s t I n d ia – A t -a -g la n ce
Opportun ity in a relatively untapped m ark et
Educational centersof excellence
Strong base forindustrial activities
Development of the ITand real estate sectors
At this time, Kolkata isthe main economic hub
Emerging hubs of economic activity
Aspirational anddemanding consumers

8/4/2019 DP115_v1.0
http://slidepdf.com/reader/full/dp115v10 11/12
January 7, 201113PwC
E a s t I n d ia ’s r e t a il m a rk e t
Untapped retail mar ket
Aspirational consumer s
Better retail real estate ren tals
Franchising oppor tunities
Expansion plans
En t e r ing Eas t
I n d ia ena ble s
re ta i le r s to—
Drive sales
Grow theirpan-Indiafootprint
Serve new consumers
8/4/2019 DP115_v1.0
http://slidepdf.com/reader/full/dp115v10 12/12
T h a n k y o u
d e b d a s . s e n @i n .p w c .c o m
This publication has been prepared for general guidance on matters of interest only, and does notconstitute professional advice. You should not act upon the information contained in this publicationwithout obtaining specific professional advice. No representation or warranty (express or implied) isgiven as to the accuracy or completeness of the information contained in this publication, and, to theextent permitted by law, PwC, its members, employees and agents do not accept or assume any liability,responsibility or duty of care for any consequences of you or anyone else acting, or refraining to act, inreliance on the information contained in this publication or for any decision based on it.
© 2011 PricewaterhouseCoopers Private Limited. All rights reserved. In this document, “PwC” refers to
PricewaterhouseCoopers Private Limited (a limited liability company in India), which is a member firmof PricewaterhouseCoopers International Limited, each member firm of which is a separate legal entity.


