Embed Size (px)
Citation preview

Dr. Martin T. AuerMichigan Tech
Department of Civil & Environmental Engineering
SurfaceWater Supply
Taking it for granted …Part I

Taking it for granted …Part II

Water Supply &The Hydrologic Cycle
Units = 1012 m3 per year
1 “1012 m3 per year” = 1 Lake Superior per year
… water. We got it.

Drinking Water Sources
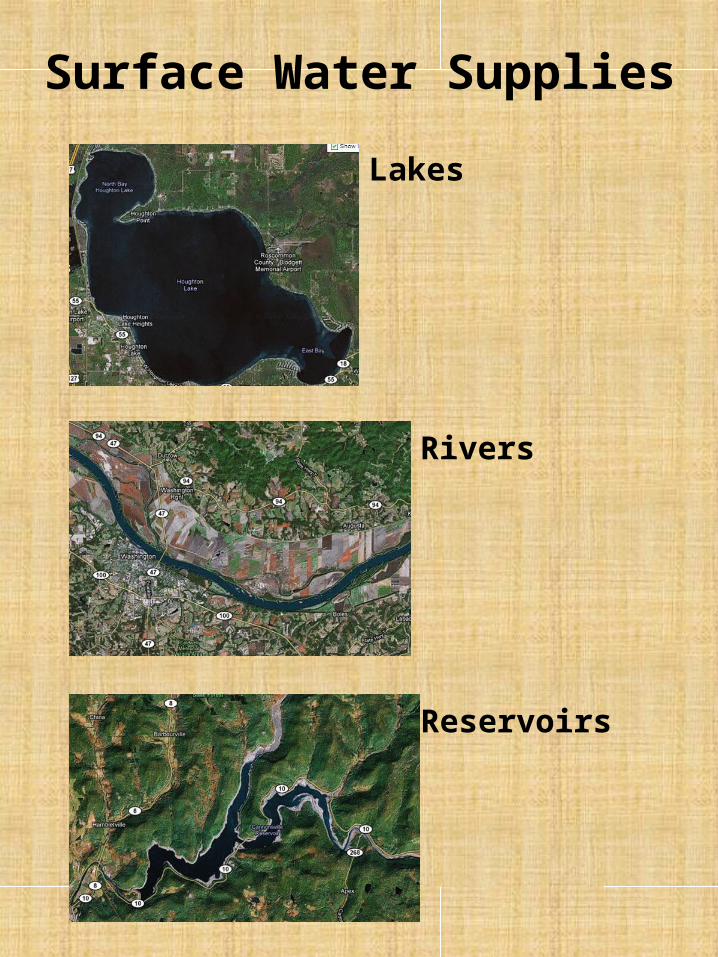
Approximately two-thirds of the population of the U.S. receives its supply from surface waters. However, the number of communities supplied by groundwater is four times that supplied by surface water. This is because large cities are typically supplied by surface waters and smaller communities use groundwater.

Kankakee River Basin

The Hydrograph
Dis
char
ge
Time
DirectRunoffHydrograph
BaseFlow

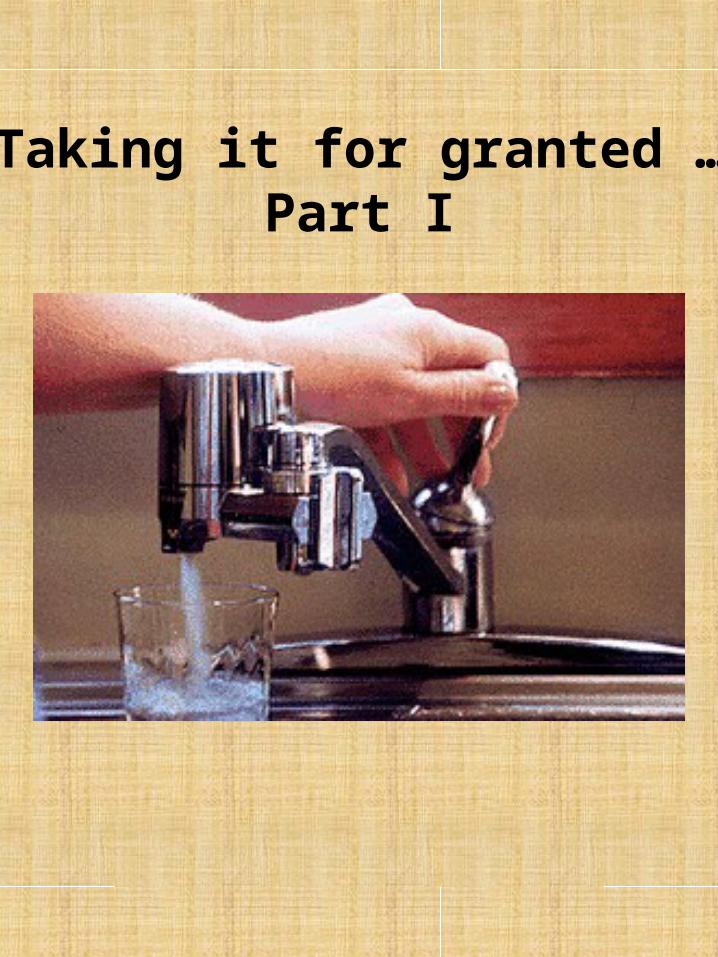
Surface Water Supplies
Lakes
Rivers
Reservoirs

… now you see it … now you don’t
Supply This!


Reservoir Designby the Rippl Method
1976Flow Demand DS SDS
Month (cfs) (cfs) (ft3) (ft3)
J 69 60 2.52E+07 0.0F 128 60 1.65E+08 0.0M 117 60 1.53E+08 0.0A 134 60 1.92E+08 0.0M 120 60 1.61E+08 0.0J 66 60 1.58E+07 0.0J 39 60 -5.60E+07 -5.60E+07A 36 60 -6.43E+07 -1.20E+08S 114 60 1.40E+08 1.97E+07O 283 60 5.97E+08 0.0N 152 60 2.38E+08 0.0D 131 60 1.90E+08 0.0
annual requirement = 1.2x108 ft3
in out
dS= Q -Q
dt

Reservoir Designby the Rippl Method
0.0E+00
5.0E+07
1.0E+08
1.5E+08
2.0E+08
2.5E+08
3.0E+08
3.5E+08
4.0E+08
An
nu
al R
eq
uir
em
en
t (c
ub
ic f
ee
t)
0.0E+00
1.0E+08
2.0E+08
3.0E+08
4.0E+08
0.0 0.1 0.2 0.3 0.4 0.5 0.6 0.7 0.8 0.9 1.0
Re
se
rvo
ir V
olu
me
(c
ub
ic f
ee
t)
Probability of Meeting Annual Requirement

Water Use Restrictions