Embed Size (px)
Citation preview
Drägerwerk AG & Co. KGaACapital Markets PresentationApril, 2018
Interim financial reports as well as preliminaries are not audited.
Disclaimer
This presentation contains forward-looking statements regarding the future development of the Dräger Group. These forward-looking statements are based on the current expectations, presumptions, and forecasts of the Executive Board as well as the information available to it to date, and have been made to the best of its knowledge and belief. No guarantee or liability for the occurrence of the future developments and results specified can be assumed in respect of such forward-looking statements. Rather, the future developments and results are dependent on a number of factors; they entail risks and uncertainties beyond our control and are based on assumptions which could prove to be incorrect. Notwithstanding any legal requirements to adjust forecasts, we assume no obligation to update the forward-looking statements contained in this presentation.
This presentation does not constitute an offer of securities for sale or a solicitation of an offer to purchase any securities. No money, securities or other consideration is being solicited by this presentation.
2
Outlook
DrägerThe Company
Financials
3
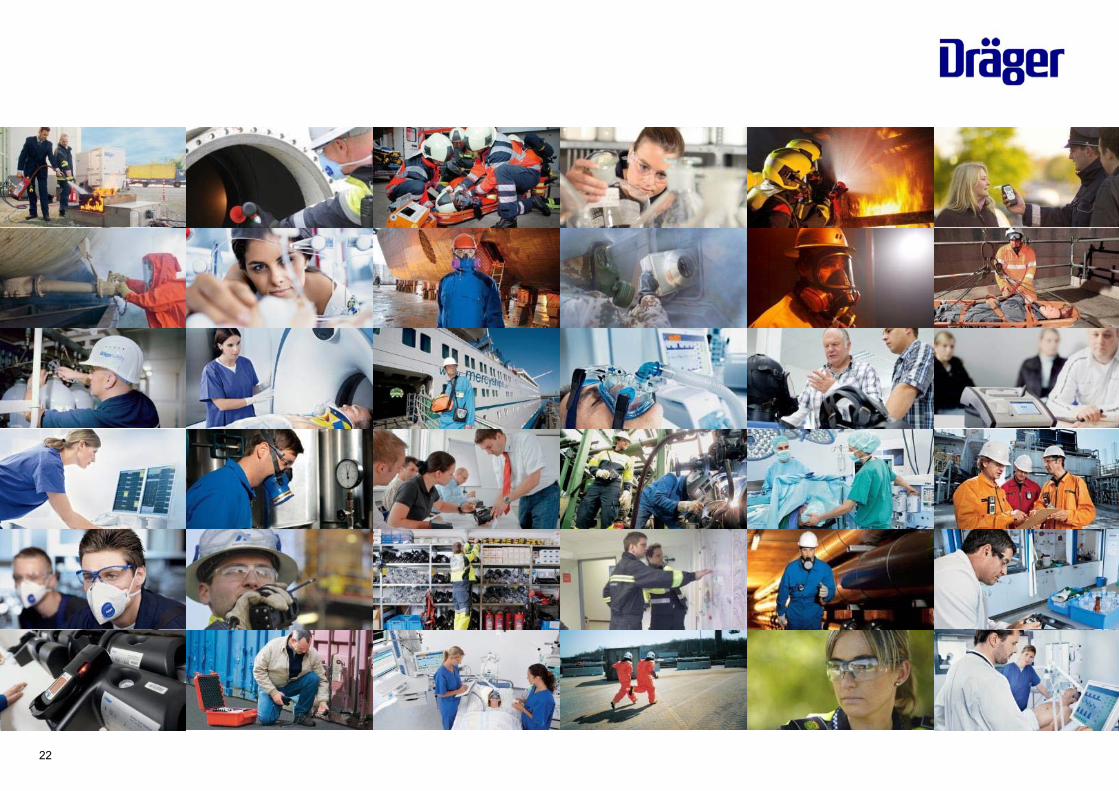
protectDräger products
supportsave
lives,
and
.
4
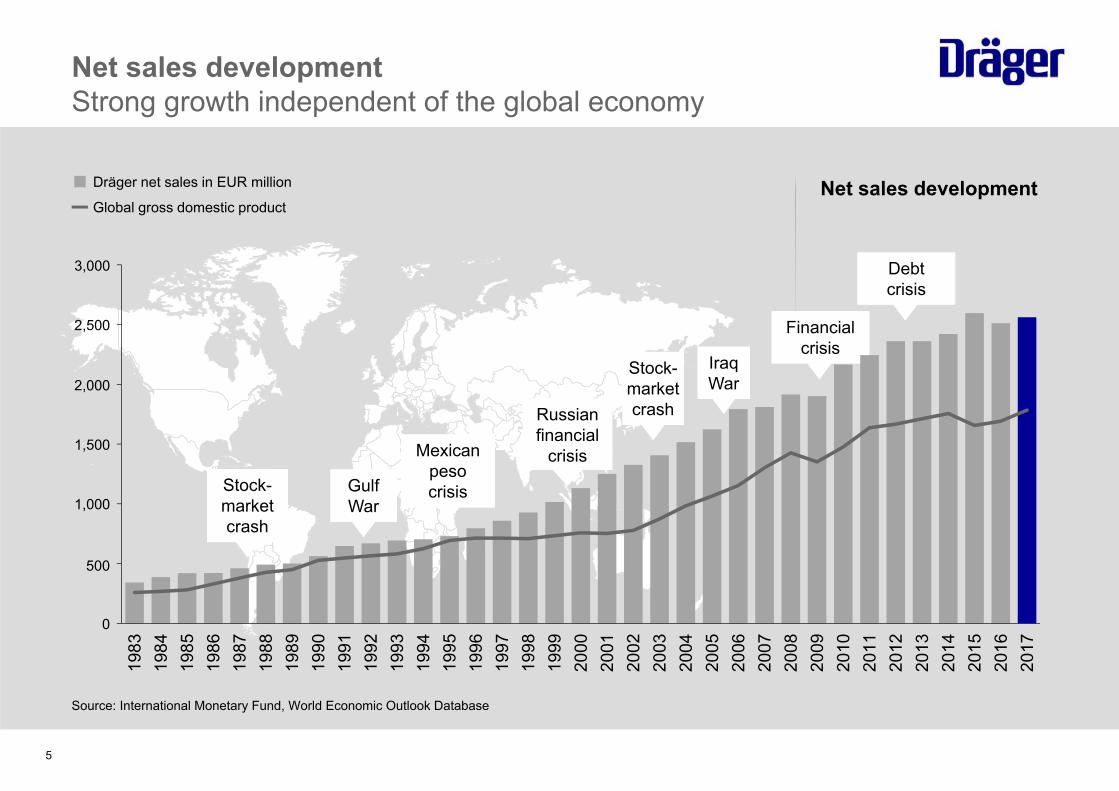
Net sales developmentStrong growth independent of the global economy
Source: International Monetary Fund, World Economic Outlook Database
Net sales developmentDräger net sales in EUR million
Global gross domestic product
Stock-market crash
Stock-market crash
Stock-market crash
GulfWarGulfWarGulfWar
Mexican pesocrisis
Mexican pesocrisis
Mexican pesocrisis
Russianfinancial
crisis
Russianfinancial
crisis
Russianfinancial
crisis
Stock-marketcrash
Stock-marketcrash
Stock-marketcrash
IraqWarIraqWarIraqWar
Financialcrisis
Financialcrisis
Financialcrisis
5
DebtcrisisDebtcrisisDebtcrisis
2,500
2,000
1,500
1,000
500
0
3,000
1983
1984
1985
1986
1987
1988
1989
1990
1991
1992
1993
1994
1995
1996
1997
1998
1999
2000
2001
2002
2003
2004
2005
2006
2007
2008
2009
2010
2011
2012
2013
2014
2015
2016
2017
6
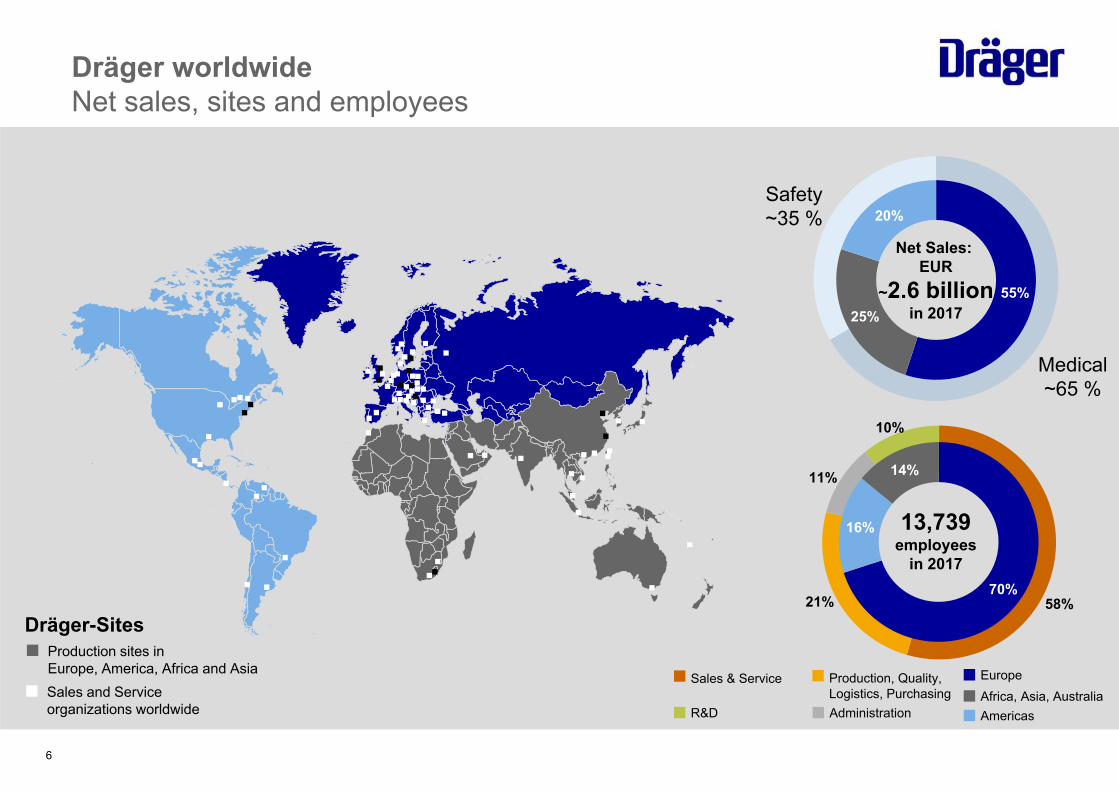
55%25%
20%
Africa, Asia, AustraliaEurope
Americas
Net Sales: EUR
~2.6 billionin 2017
70%
16%
14%
13,739employees
in 2017
Dräger-Sites21%
11%
10%
58%
Sales & Service Production, Quality,Logistics, Purchasing
R&D Administration
Production sites inEurope, America, Africa and AsiaSales and Service organizations worldwide
Safety~35 %
Medical~65 %
Dräger worldwideNet sales, sites and employees
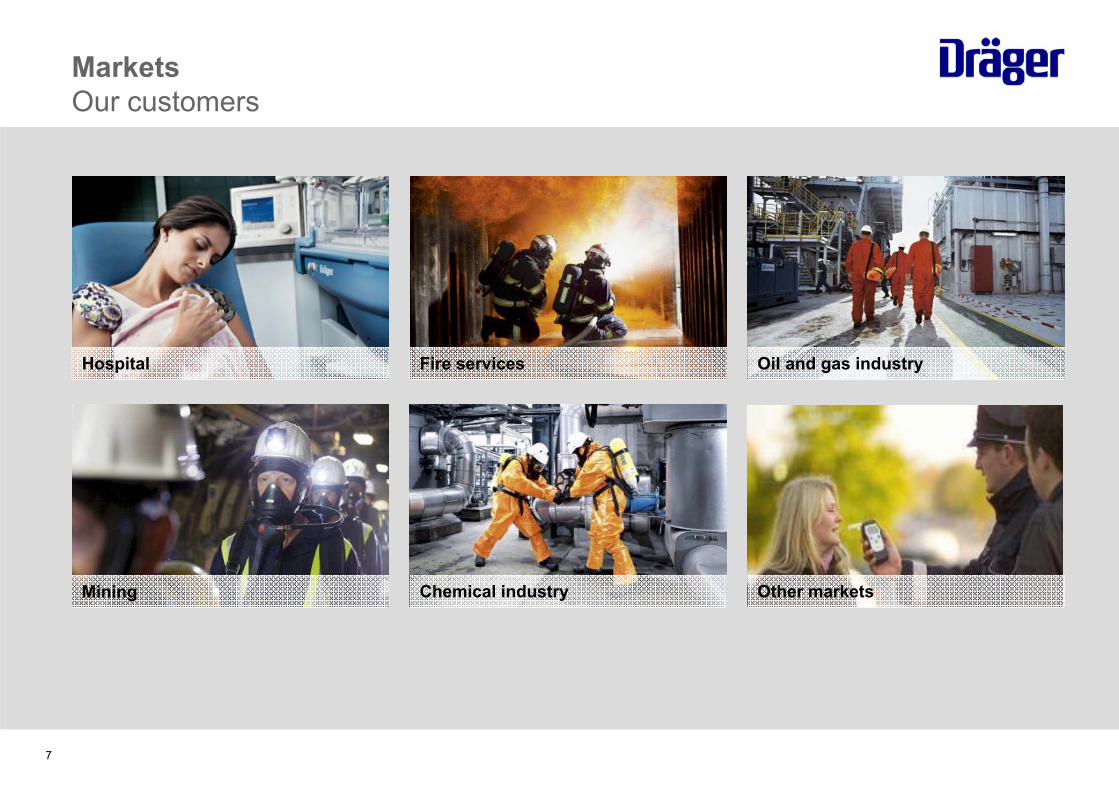
MarketsOur customers
Fire services Oil and gas industry
Mining Chemical industry
Hospital
7
Other markets
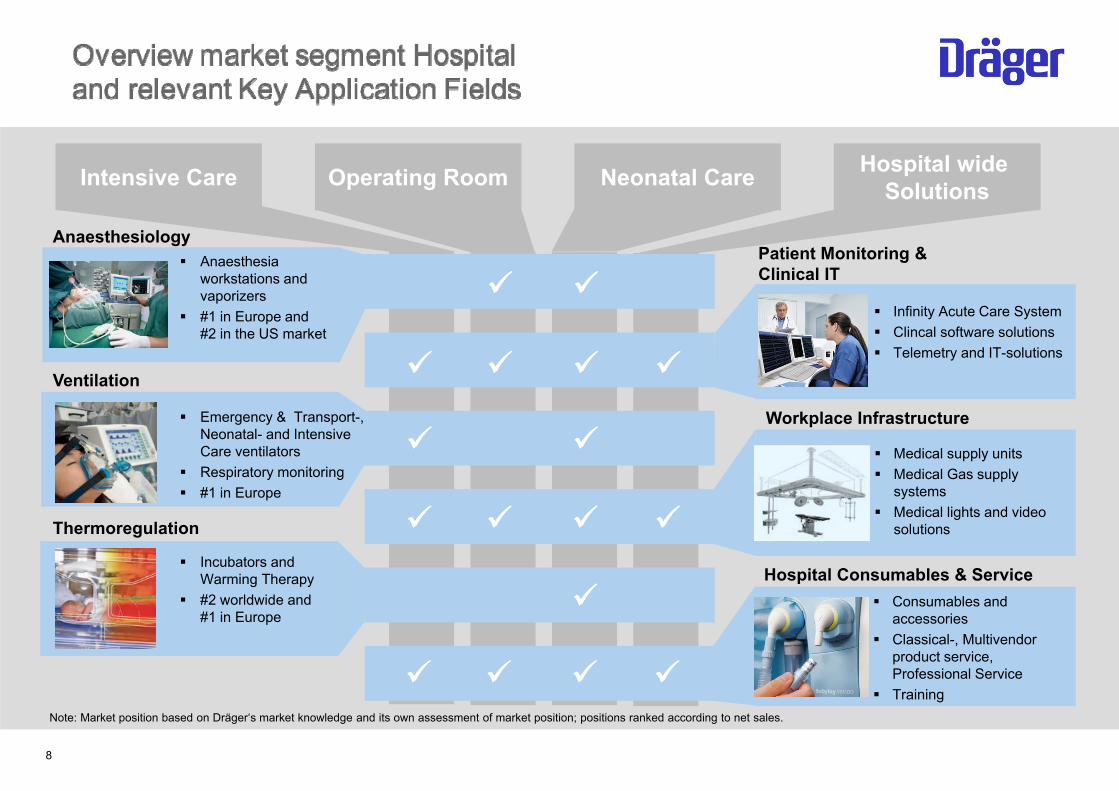
8
Infinity Acute Care System Clincal software solutions Telemetry and IT-solutions
Medical supply units Medical Gas supply
systems Medical lights and video
solutions
Consumables and accessories
Classical-, Multivendor product service, Professional Service
Training
Anaesthesiology
Ventilation
Thermoregulation
Patient Monitoring & Clinical IT
Workplace Infrastructure
Hospital Consumables & Service
Intensive Care Operating Room Neonatal Care Hospital wideSolutions
Note: Market position based on Dräger‘s market knowledge and its own assessment of market position; positions ranked according to net sales.
Anaesthesia workstations and vaporizers
#1 in Europe and #2 in the US market
Emergency & Transport-, Neonatal- and Intensive Care ventilators
Respiratory monitoring #1 in Europe
Incubators and Warming Therapy
#2 worldwide and #1 in Europe
9
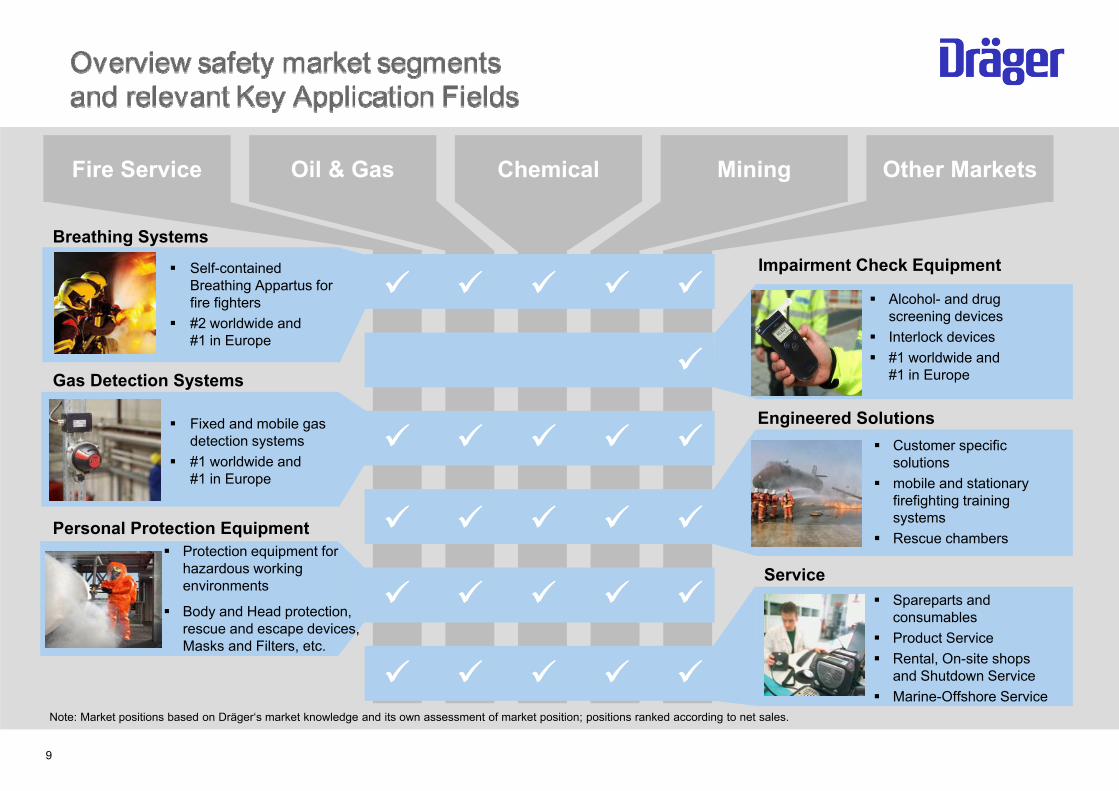
Breathing Systems
Gas Detection Systems
Personal Protection Equipment
Impairment Check Equipment
Engineered Solutions
Service
Fixed and mobile gas detection systems
#1 worldwide and #1 in Europe
Alcohol- and drugscreening devices
Interlock devices #1 worldwide and
#1 in Europe
Protection equipment for hazardous working environments
Body and Head protection, rescue and escape devices, Masks and Filters, etc.
Self-containedBreathing Appartus forfire fighters
#2 worldwide and #1 in Europe
Customer specific solutions
mobile and stationary firefighting training systems
Rescue chambers
Spareparts and consumables
Product Service Rental, On-site shops
and Shutdown Service Marine-Offshore Service
Note: Market positions based on Dräger‘s market knowledge and its own assessment of market position; positions ranked according to net sales.
Fire Service
Oil & Gas Chemical Mining Other Markets
10
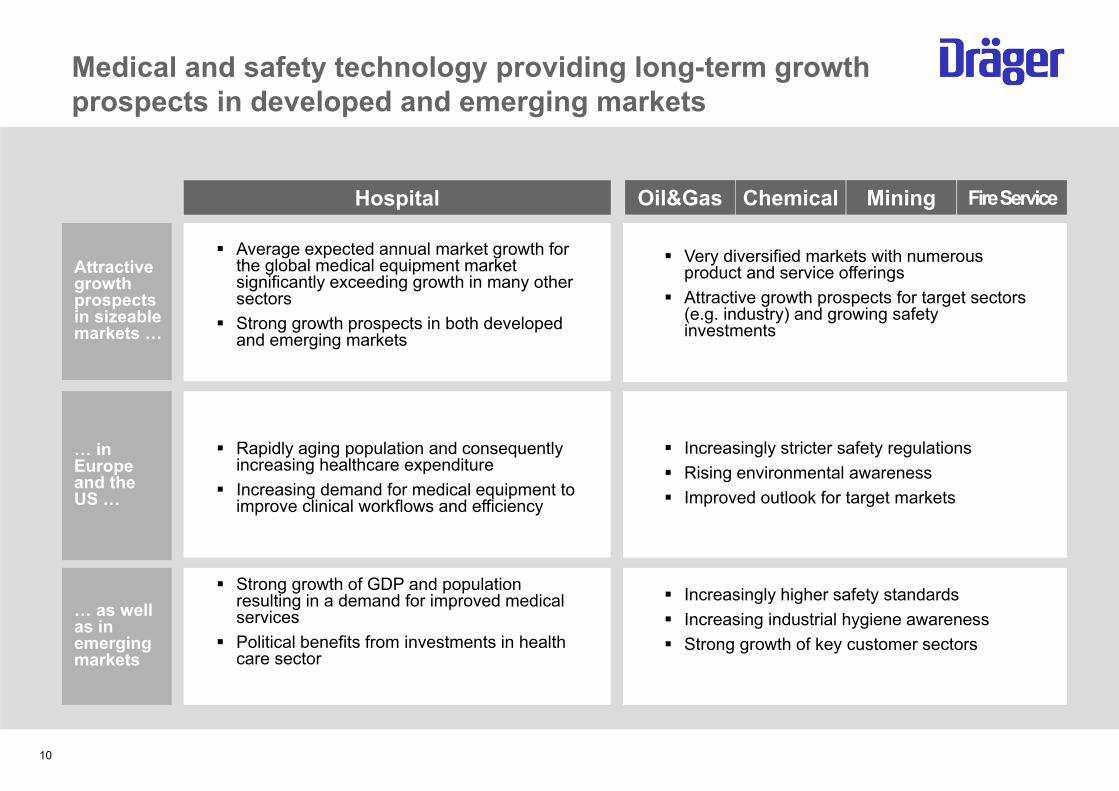
Medical and safety technology providing long-term growth prospects in developed and emerging markets
Hospital
Attractive growth prospects in sizeable markets …
… in Europe and the US …
… as well as in emerging markets
Oil&Gas Chemical Mining FireService
Average expected annual market growth for the global medical equipment market significantly exceeding growth in many other sectors
Strong growth prospects in both developed and emerging markets
Very diversified markets with numerous product and service offerings
Attractive growth prospects for target sectors (e.g. industry) and growing safety investments
Rapidly aging population and consequently increasing healthcare expenditure
Increasing demand for medical equipment to improve clinical workflows and efficiency
Increasingly stricter safety regulations Rising environmental awareness Improved outlook for target markets
Strong growth of GDP and population resulting in a demand for improved medical services
Political benefits from investments in health care sector
Increasingly higher safety standards Increasing industrial hygiene awareness Strong growth of key customer sectors
11
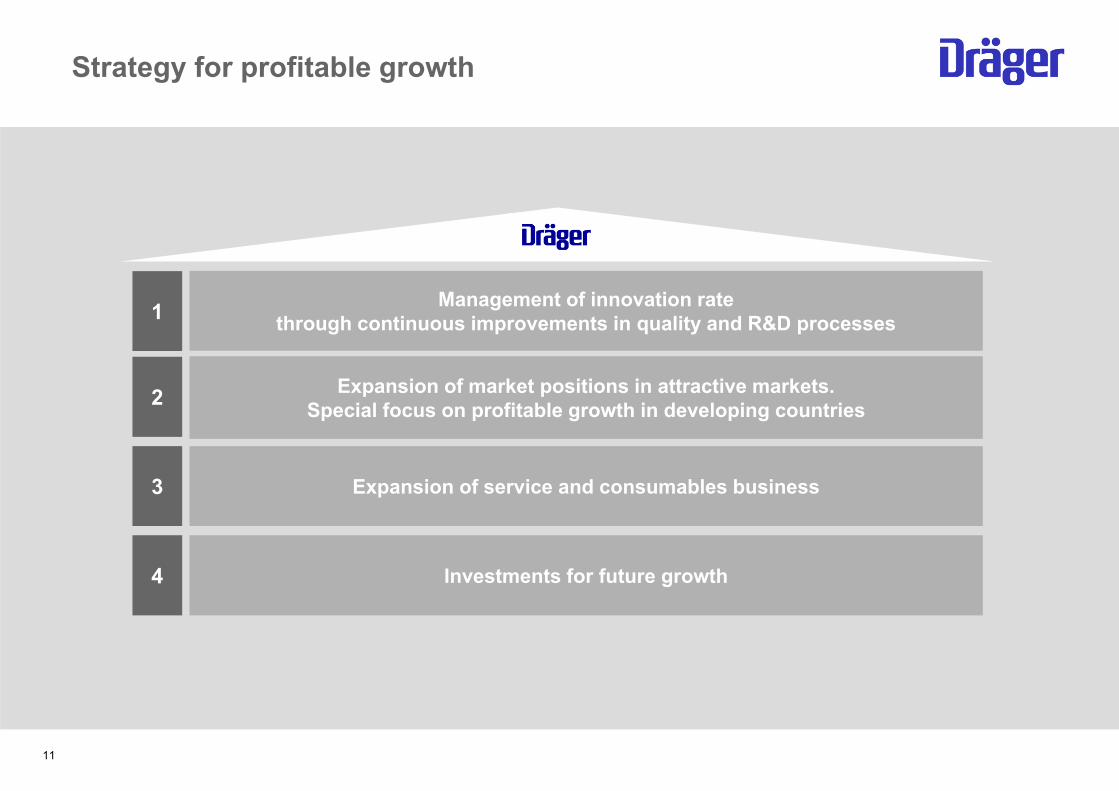
Management of innovation rate through continuous improvements in quality and R&D processes
Expansion of market positions in attractive markets. Special focus on profitable growth in developing countries
Expansion of service and consumables business
Investments for future growth
1
2
3
4
Strategy for profitable growth
12
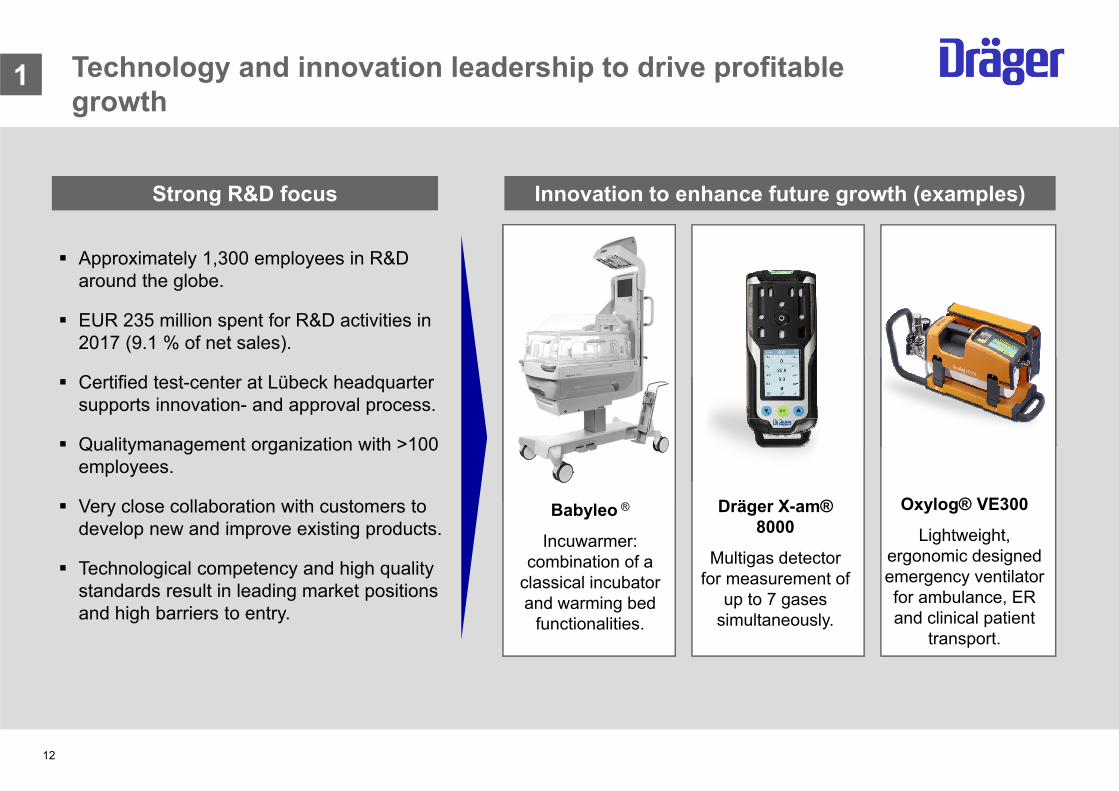
1
Strong R&D focus Innovation to enhance future growth (examples)
Approximately 1,300 employees in R&D around the globe.
EUR 235 million spent for R&D activities in 2017 (9.1 % of net sales).
Certified test-center at Lübeck headquartersupports innovation- and approval process.
Qualitymanagement organization with >100 employees.
Very close collaboration with customers to develop new and improve existing products.
Technological competency and high quality standards result in leading market positions and high barriers to entry.
Technology and innovation leadership to drive profitable growth
Babyleo ®
Incuwarmer: combination of a
classical incubator and warming bed
functionalities.
Oxylog® VE300
Lightweight, ergonomic designed emergency ventilator for ambulance, ER and clinical patient
transport.
Dräger X-am® 8000
Multigas detector for measurement of
up to 7 gases simultaneously.
13
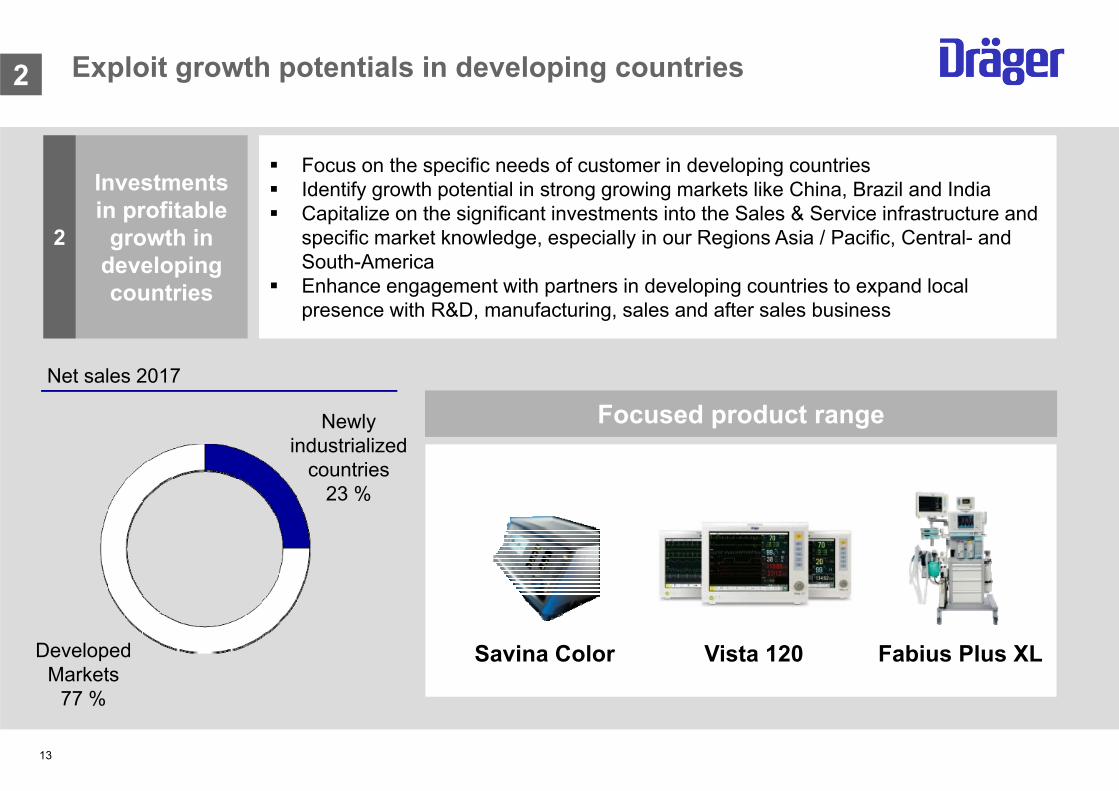
Investments in profitable
growth in developing countries
2
Focus on the specific needs of customer in developing countries Identify growth potential in strong growing markets like China, Brazil and India Capitalize on the significant investments into the Sales & Service infrastructure and
specific market knowledge, especially in our Regions Asia / Pacific, Central- and South-America
Enhance engagement with partners in developing countries to expand local presence with R&D, manufacturing, sales and after sales business
2
Net sales 2017
Developed Markets
77 %
Newly industrialized
countries23 %
Focused product range
Exploit growth potentials in developing countries
Fabius Plus XLVista 120Savina Color
14
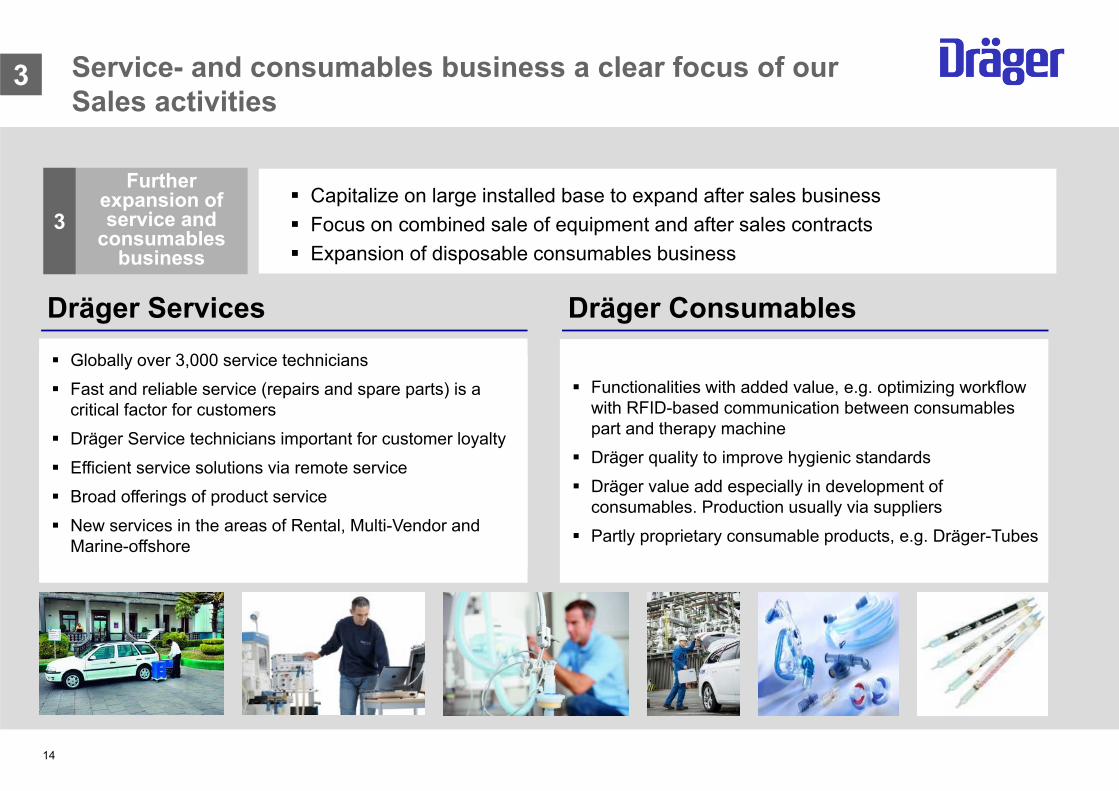
Further expansion of service and
consumables business
3
Service- and consumables business a clear focus of our Sales activities
3
Dräger Services Dräger Consumables
Functionalities with added value, e.g. optimizing workflow with RFID-based communication between consumables part and therapy machine
Dräger quality to improve hygienic standards Dräger value add especially in development of
consumables. Production usually via suppliers Partly proprietary consumable products, e.g. Dräger-Tubes
Globally over 3,000 service technicians Fast and reliable service (repairs and spare parts) is a
critical factor for customers Dräger Service technicians important for customer loyalty Efficient service solutions via remote service Broad offerings of product service New services in the areas of Rental, Multi-Vendor and
Marine-offshore
Capitalize on large installed base to expand after sales business Focus on combined sale of equipment and after sales contracts Expansion of disposable consumables business
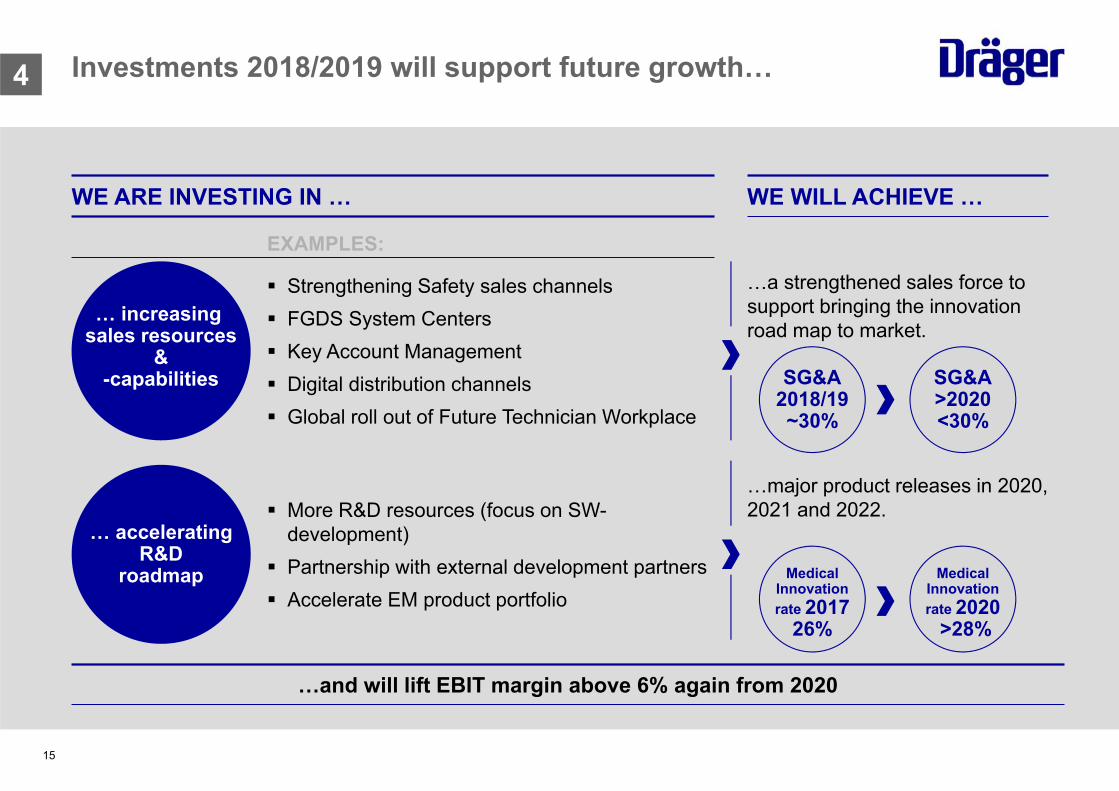
Investments 2018/2019 will support future growth…
15
WE ARE INVESTING IN … WE WILL ACHIEVE …
… increasing sales resources
&-capabilities
… acceleratingR&D
roadmap
Strengthening Safety sales channels FGDS System Centers Key Account Management Digital distribution channels Global roll out of Future Technician Workplace
More R&D resources (focus on SW-development)
Partnership with external development partners Accelerate EM product portfolio
EXAMPLES:
…a strengthened sales force to support bringing the innovation road map to market.
…major product releases in 2020, 2021 and 2022.
SG&A2018/19~30%
SG&A>2020<30%
MedicalInnovationrate 2017
26%
MedicalInnovationrate 2020
>28%
…and will lift EBIT margin above 6% again from 2020
4
Financials
16
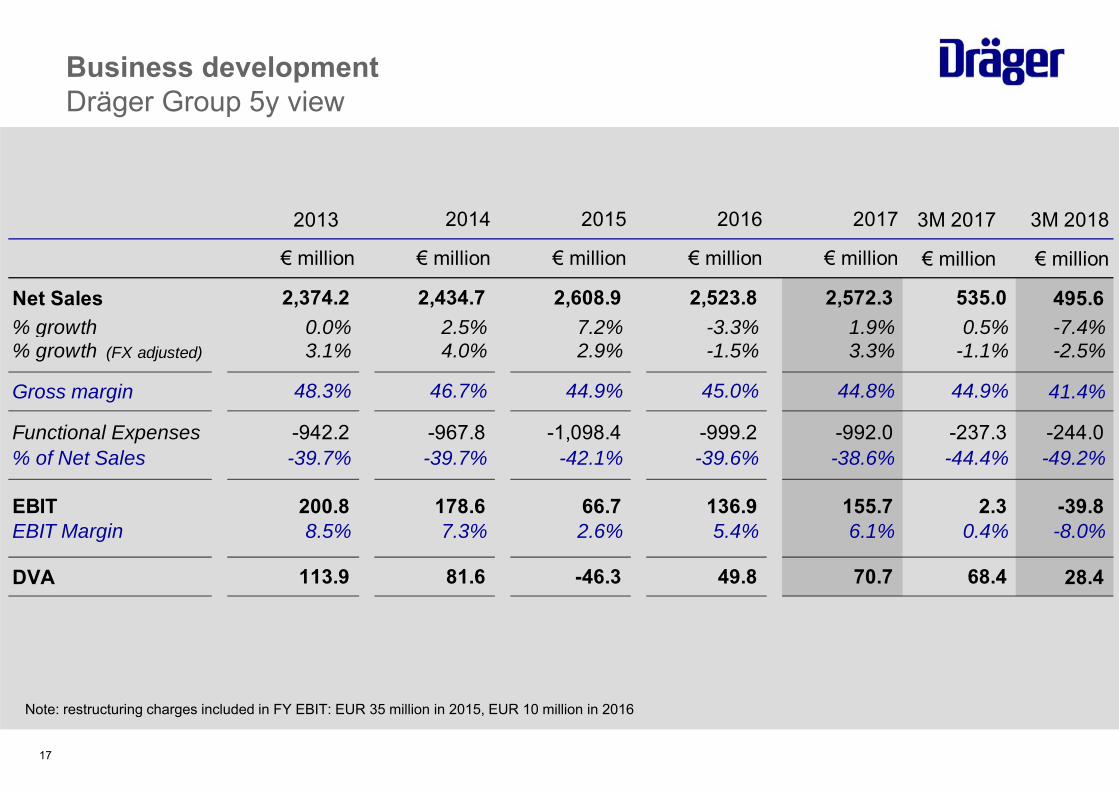
Business developmentDräger Group 5y view
17
Note: restructuring charges included in FY EBIT: EUR 35 million in 2015, EUR 10 million in 2016
2013 3M 2017 3M 2018
€ million € million
Net Sales 495.6 % growth -7.4%% growth (FX adjusted) -2.5%
Gross margin 41.4%
Functional Expenses -244.0 % of Net Sales -49.2%
EBIT -39.8 EBIT Margin -8.0%
DVA 28.4
0.4%
68.4
535.0 0.5%
-1.1%
44.9%
-237.3 -44.4%
2.3
-999.2 -39.6%
136.9 5.4%
2014
€ million
2,434.7 2.5%
2016
€ million
2,523.8 -3.3%-1.5%
45.0%
4.0%
46.7% 44.9%
66.7 2.6%
49.8 81.6
-967.8
7.3%
-46.3
-1,098.4 -42.1%
178.6
-39.7%
2,374.2 0.0%3.1%
48.3%
200.8 8.5%
113.9
-942.2 -39.7%
€ million
2015
€ million
2,608.9 7.2%2.9%
2017
€ million
2,572.3 1.9%3.3%
44.8%
-992.0 -38.6%
155.7 6.1%
70.7
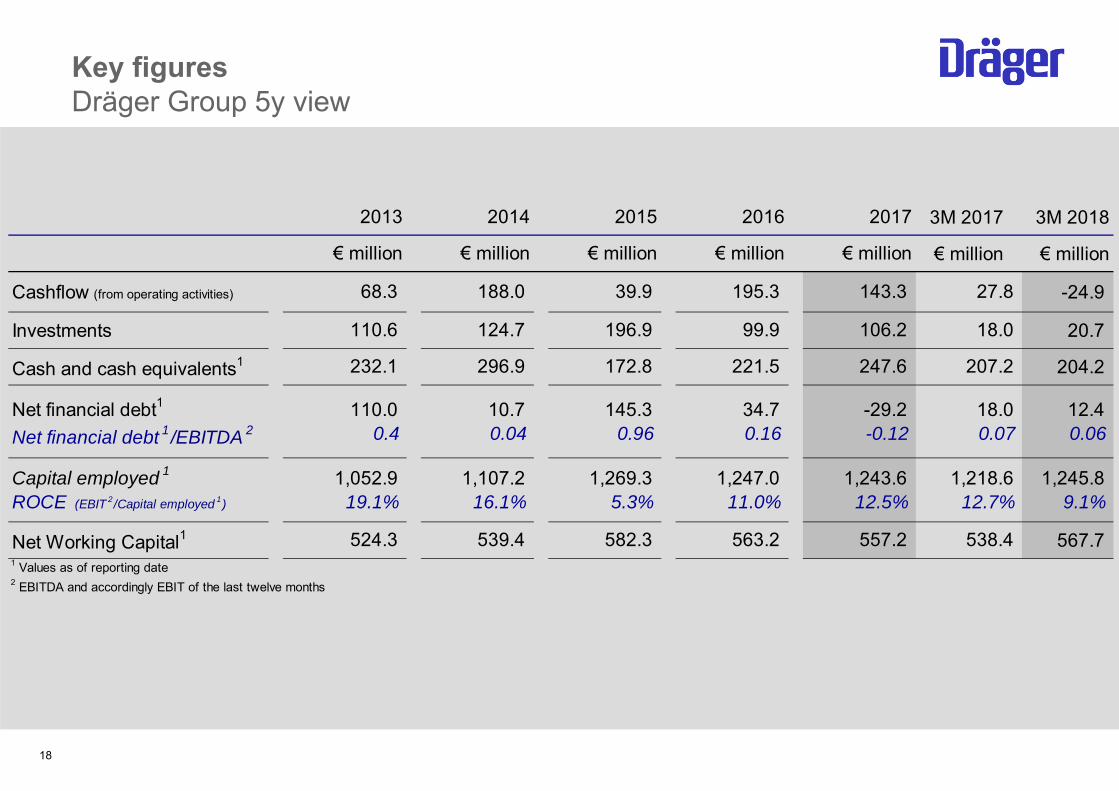
Key figuresDräger Group 5y view
18
3M 2017 3M 2018
€ million € million
Cashflow (from operating activities) -24.9
Investments 20.7
Cash and cash equivalents1 204.2
Net financial debt1 12.4 Net financial debt 1/EBITDA 2 0.06
Capital employed 1 1,245.8 ROCE (EBIT 2/Capital employed 1) 9.1%
Net Working Capital1 567.7 1 Values as of reporting date2 EBITDA and accordingly EBIT of the last twelve months
27.8
18.0
207.2
18.0 0.07
1,218.6 12.7%
538.4
34.7 0.16
1,247.0 11.0%
563.2
2014
€ million
195.3
99.9
221.5
2016
1,269.3 5.3%
582.3
296.9
10.7
539.4
2015
€ million€ million
188.0
124.7
110.0 0.4
1,052.9 19.1%
524.3
2013
€ million
68.3 39.9
196.9
172.8
145.3 0.96
110.6
232.1
0.04
1,107.2 16.1%
2017
€ million
143.3
106.2
247.6
-29.2 -0.12
1,243.6 12.5%
557.2
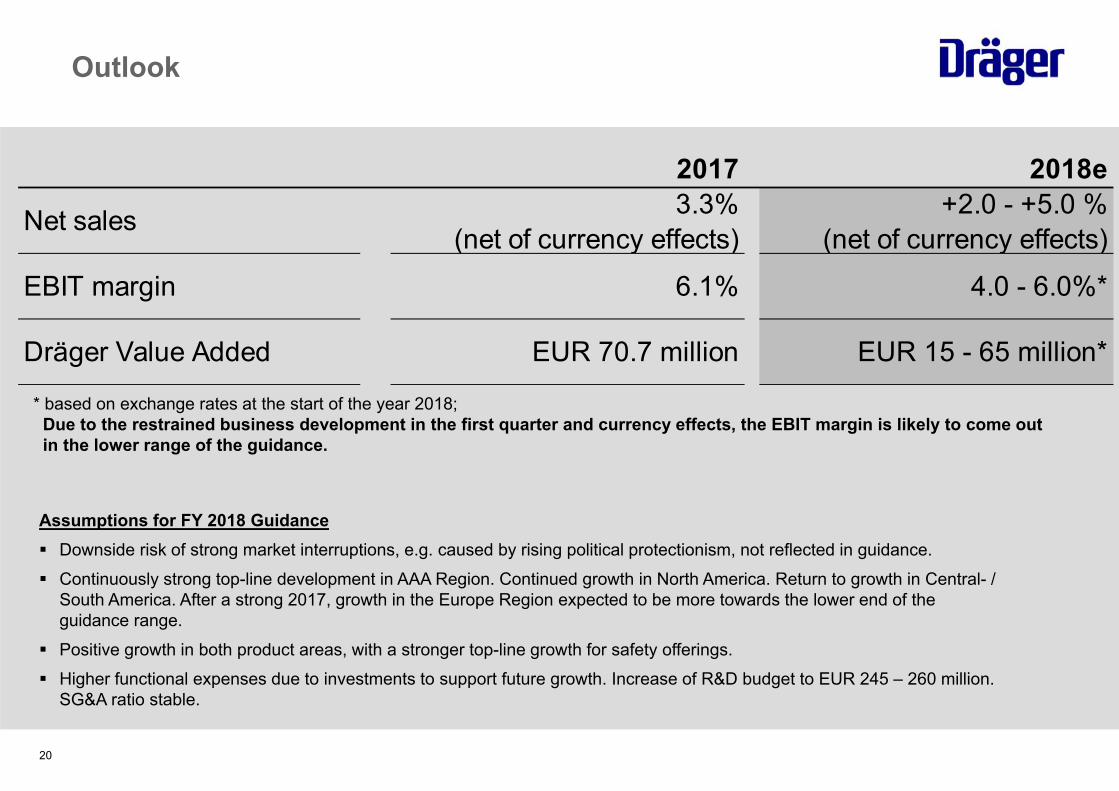
Outlook
19
20
Outlook
* based on exchange rates at the start of the year 2018; Due to the restrained business development in the first quarter and currency effects, the EBIT margin is likely to come out in the lower range of the guidance.
Assumptions for FY 2018 Guidance Downside risk of strong market interruptions, e.g. caused by rising political protectionism, not reflected in guidance. Continuously strong top-line development in AAA Region. Continued growth in North America. Return to growth in Central- /
South America. After a strong 2017, growth in the Europe Region expected to be more towards the lower end of the guidance range.
Positive growth in both product areas, with a stronger top-line growth for safety offerings. Higher functional expenses due to investments to support future growth. Increase of R&D budget to EUR 245 – 260 million.
SG&A ratio stable.
2017 2018e
Net sales 3.3%(net of currency effects)
+2.0 - +5.0 %(net of currency effects)
EBIT margin 6.1% 4.0 - 6.0%*
Dräger Value Added EUR 70.7 million EUR 15 - 65 million*
Guiding philosophyWhat we stand for
21
22
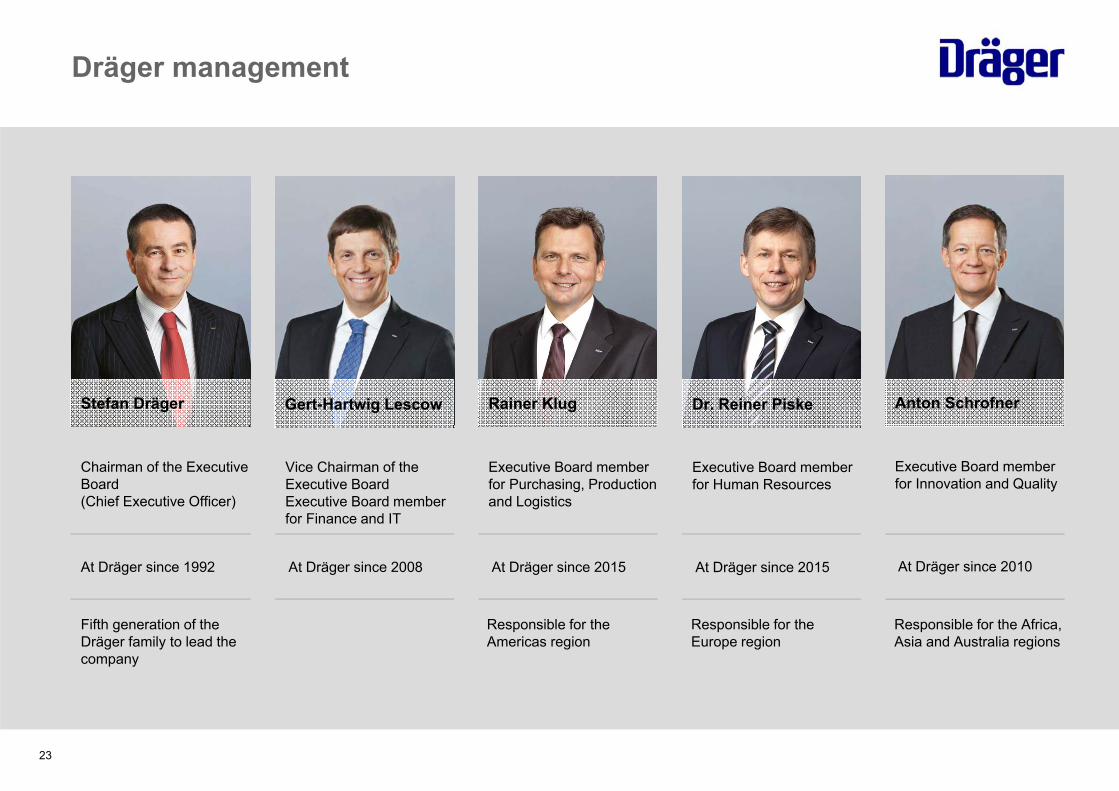
Dräger management
Fifth generation of the Dräger family to lead the company
Chairman of the Executive Board (Chief Executive Officer)
At Dräger since 1992
Stefan Dräger
Vice Chairman of the Executive BoardExecutive Board member for Finance and IT
At Dräger since 2008
Gert-Hartwig Lescow
Executive Board member for Purchasing, Production and Logistics
At Dräger since 2015
Rainer Klug Dr. Reiner Piske
Executive Board member for Human Resources
At Dräger since 2015
Executive Board member for Innovation and Quality
At Dräger since 2010
Anton Schrofner
Responsible for the Americas region
Responsible for the Europe region
Responsible for the Africa, Asia and Australia regions
23
24
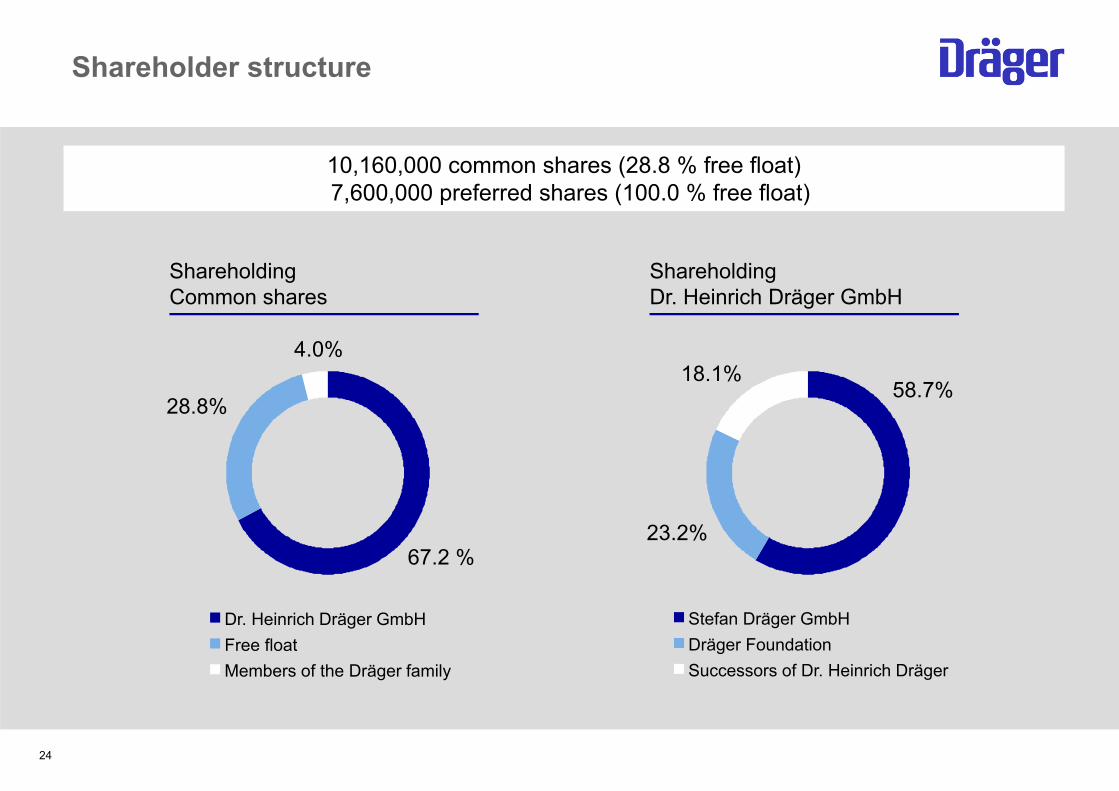
Shareholder structure
ShareholdingCommon shares
67.2 %
28.8%
4.0%
Dr. Heinrich Dräger GmbHFree floatMembers of the Dräger family
10,160,000 common shares (28.8 % free float)7,600,000 preferred shares (100.0 % free float)
ShareholdingDr. Heinrich Dräger GmbH
Stefan Dräger GmbHDräger FoundationSuccessors of Dr. Heinrich Dräger
58.7%
23.2%
18.1%
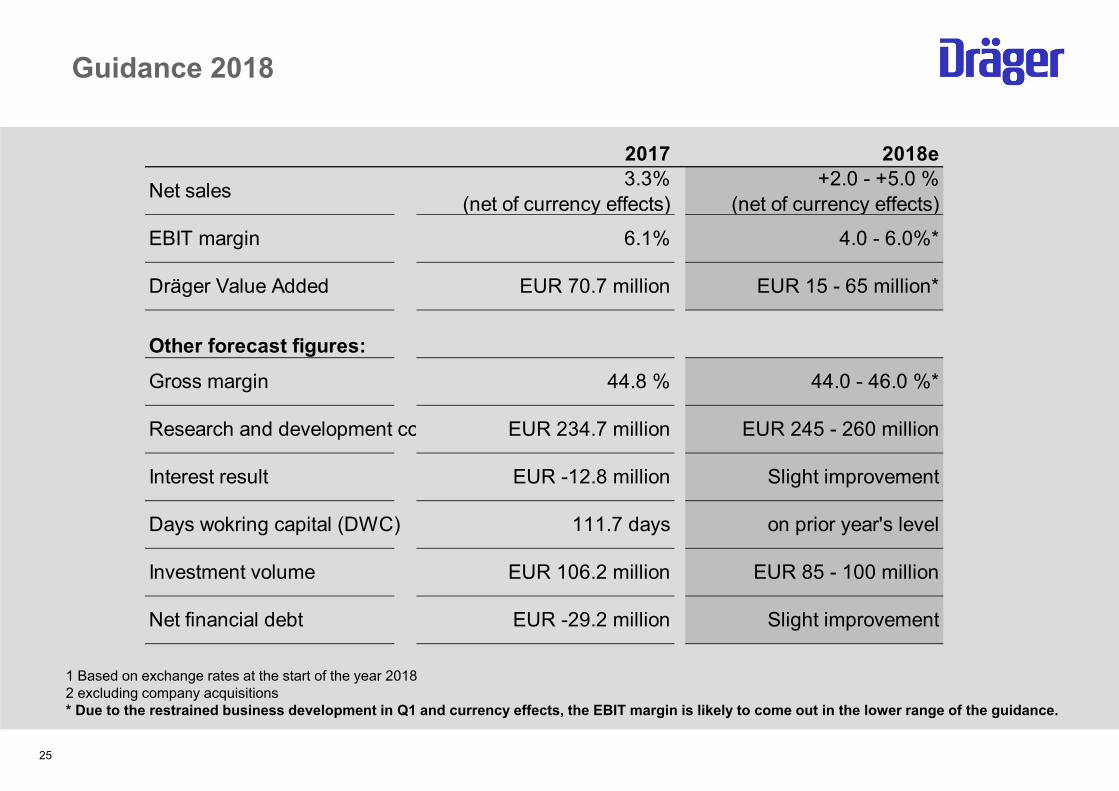
Guidance 2018
25
2017 2018e
Net sales 3.3%(net of currency effects)
+2.0 - +5.0 %(net of currency effects)
EBIT margin 6.1% 4.0 - 6.0%*
Dräger Value Added EUR 70.7 million EUR 15 - 65 million*
Other forecast figures:Gross margin 44.8 % 44.0 - 46.0 %*
Research and development co EUR 234.7 million EUR 245 - 260 million
Interest result EUR -12.8 million Slight improvement
Days wokring capital (DWC) 111.7 days on prior year's level
Investment volume EUR 106.2 million EUR 85 - 100 million
Net financial debt EUR -29.2 million Slight improvement
1 Based on exchange rates at the start of the year 20182 excluding company acquisitions* Due to the restrained business development in Q1 and currency effects, the EBIT margin is likely to come out in the lower range of the guidance.
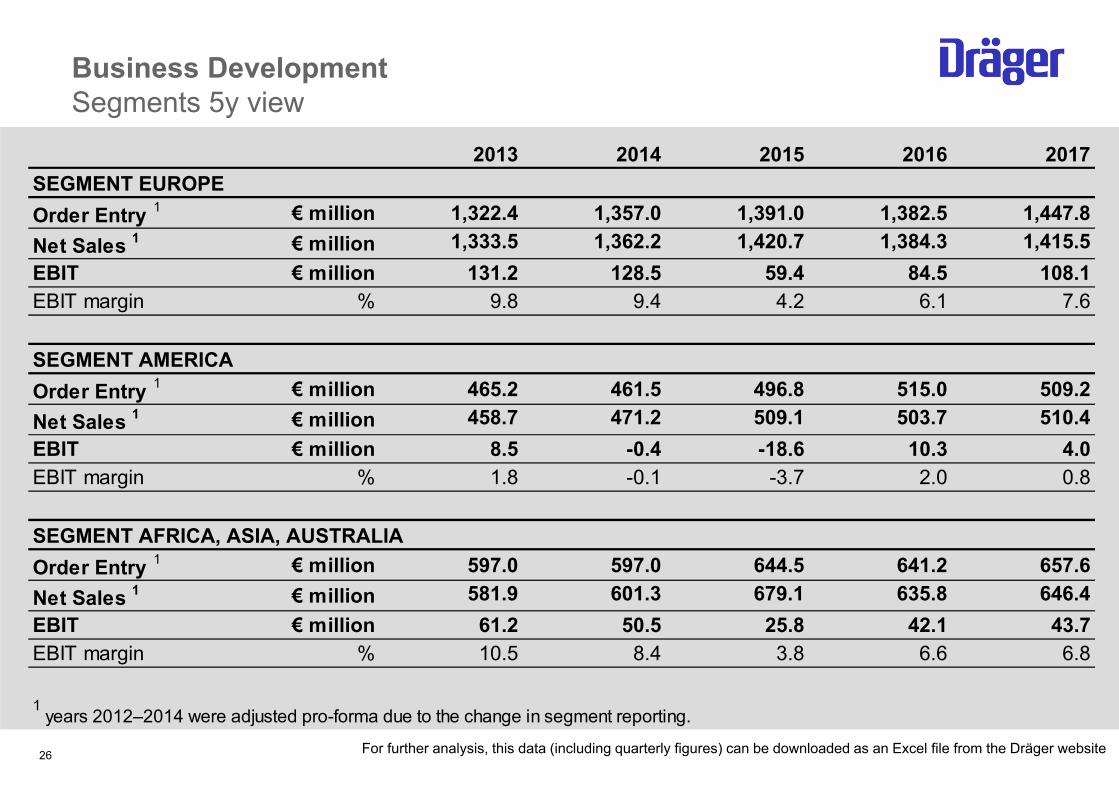
2013 2014 2015 2016 2017SEGMENT EUROPEOrder Entry 1 € million 1,322.4 1,357.0 1,391.0 1,382.5 1,447.8Net Sales 1 € million 1,333.5 1,362.2 1,420.7 1,384.3 1,415.5EBIT € million 131.2 128.5 59.4 84.5 108.1EBIT margin % 9.8 9.4 4.2 6.1 7.6
SEGMENT AMERICAOrder Entry 1 € million 465.2 461.5 496.8 515.0 509.2Net Sales 1 € million 458.7 471.2 509.1 503.7 510.4EBIT € million 8.5 -0.4 -18.6 10.3 4.0EBIT margin % 1.8 -0.1 -3.7 2.0 0.8
SEGMENT AFRICA, ASIA, AUSTRALIAOrder Entry 1 € million 597.0 597.0 644.5 641.2 657.6Net Sales 1 € million 581.9 601.3 679.1 635.8 646.4EBIT € million 61.2 50.5 25.8 42.1 43.7EBIT margin % 10.5 8.4 3.8 6.6 6.8
1 years 2012–2014 were adjusted pro-forma due to the change in segment reporting.
Business Development Segments 5y view
26 For further analysis, this data (including quarterly figures) can be downloaded as an Excel file from the Dräger website
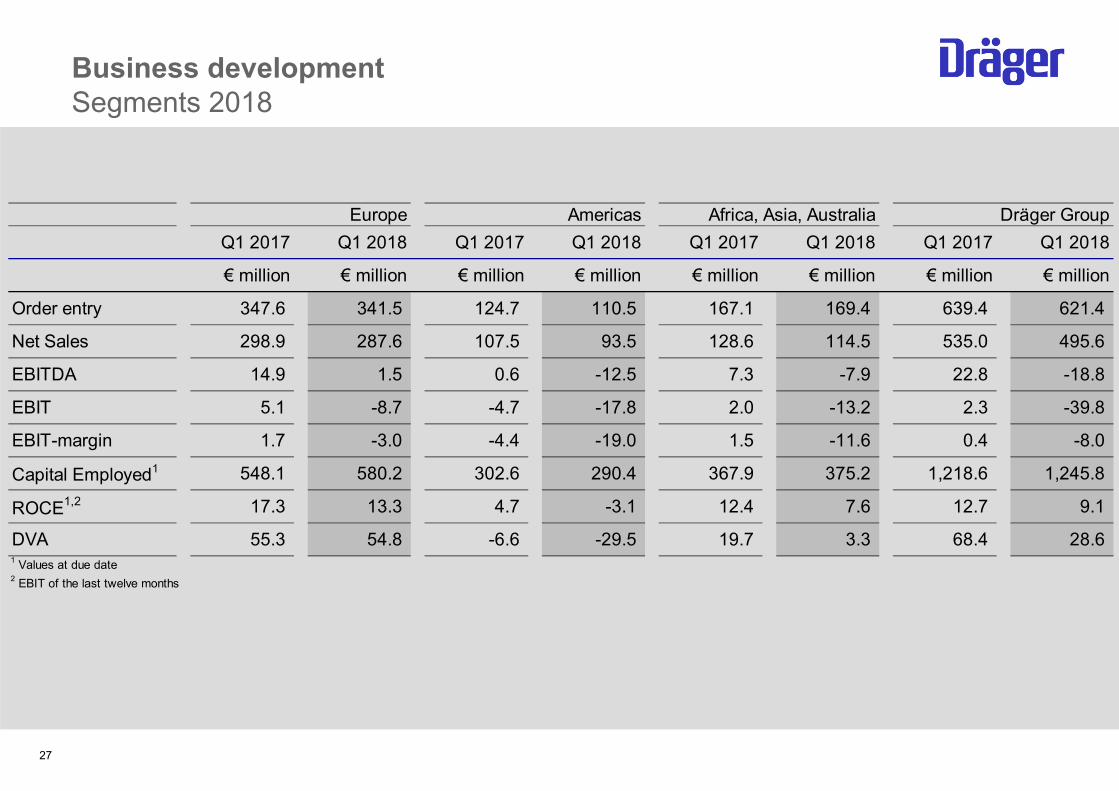
Business developmentSegments 2018
27
Europe Americas Africa, Asia, Australia Dräger GroupQ1 2017 Q1 2018 Q1 2017 Q1 2018 Q1 2017 Q1 2018 Q1 2017 Q1 2018
€ million € million € million € million € million € million € million € million
Order entry 347.6 341.5 124.7 110.5 167.1 169.4 639.4 621.4
Net Sales 298.9 287.6 107.5 93.5 128.6 114.5 535.0 495.6
EBITDA 14.9 1.5 0.6 -12.5 7.3 -7.9 22.8 -18.8
EBIT 5.1 -8.7 -4.7 -17.8 2.0 -13.2 2.3 -39.8
EBIT-margin 1.7 -3.0 -4.4 -19.0 1.5 -11.6 0.4 -8.0
Capital Employed1 548.1 580.2 302.6 290.4 367.9 375.2 1,218.6 1,245.8
ROCE1,2 17.3 13.3 4.7 -3.1 12.4 7.6 12.7 9.1
DVA 55.3 54.8 -6.6 -29.5 19.7 3.3 68.4 28.6 1 Values at due date2 EBIT of the last twelve months
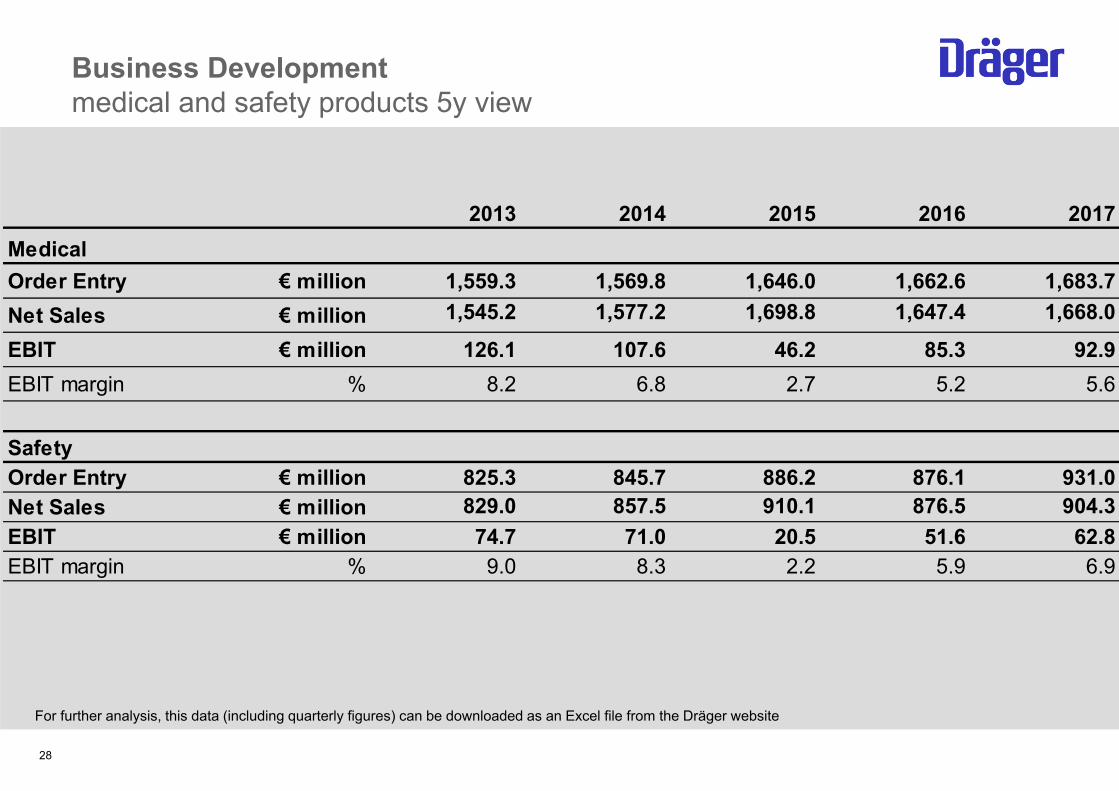
Business Development medical and safety products 5y view
28
For further analysis, this data (including quarterly figures) can be downloaded as an Excel file from the Dräger website
2013 2014 2015 2016 2017MedicalOrder Entry € million 1,559.3 1,569.8 1,646.0 1,662.6 1,683.7Net Sales € million 1,545.2 1,577.2 1,698.8 1,647.4 1,668.0EBIT € million 126.1 107.6 46.2 85.3 92.9EBIT margin % 8.2 6.8 2.7 5.2 5.6
SafetyOrder Entry € million 825.3 845.7 886.2 876.1 931.0Net Sales € million 829.0 857.5 910.1 876.5 904.3EBIT € million 74.7 71.0 20.5 51.6 62.8EBIT margin % 9.0 8.3 2.2 5.9 6.9
Business developmentMedical products 2018
29
Q1 2017 Q1 2018€ million € million
Order entry 405.2 401.5 -0.9 4.9
Europe 197.9 196.4 -0.7 0.4
America 83.7 74.7 -10.8 2.2
Africa, Asia, Australia 123.6 130.4 5.5 13.9
Net Sales 336.4 309.9 -7.9 -2.8
Europe 174.7 167.2 -4.3 -3.3
America 68.9 62.1 -9.8 2.8
Africa, Asia, Australia 92.8 80.6 -13.1 -6.1
EBIT -7.1 -36.7 > -100
EBIT-margin -2.1 -11.8
Change%
Change% (FX adj.)
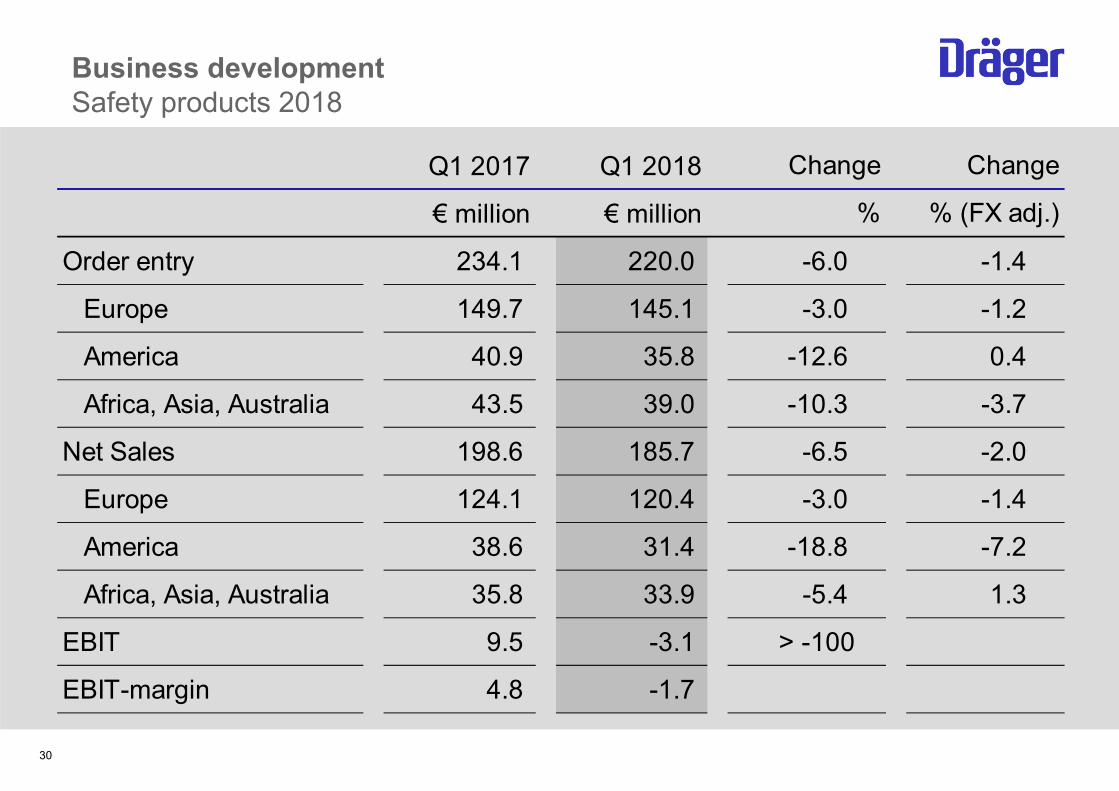
Business developmentSafety products 2018
30
Q1 2017 Q1 2018
€ million € million
Order entry 234.1 220.0 -6.0 -1.4
Europe 149.7 145.1 -3.0 -1.2
America 40.9 35.8 -12.6 0.4
Africa, Asia, Australia 43.5 39.0 -10.3 -3.7
Net Sales 198.6 185.7 -6.5 -2.0
Europe 124.1 120.4 -3.0 -1.4
America 38.6 31.4 -18.8 -7.2
Africa, Asia, Australia 35.8 33.9 -5.4 1.3
EBIT 9.5 -3.1 > -100
EBIT-margin 4.8 -1.7
Change Change
% % (FX adj.)
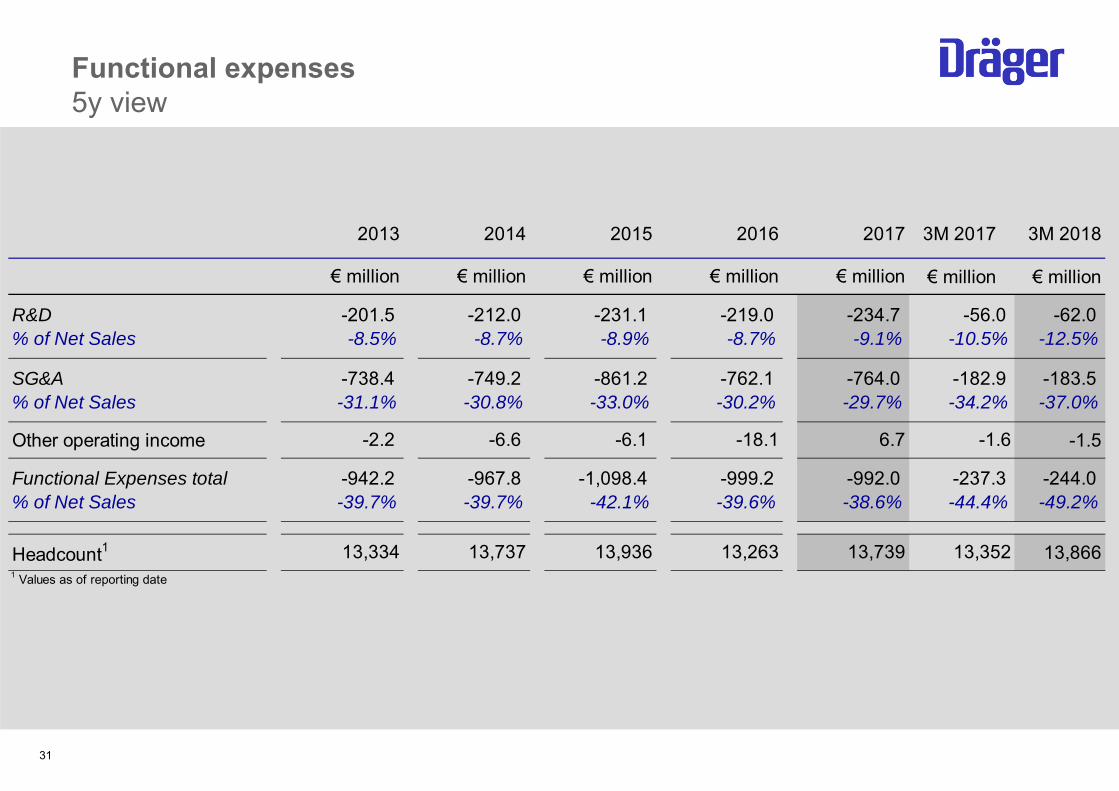
Functional expenses5y view
31
3M 2017 3M 2018
€ million € million
R&D -62.0 % of Net Sales -12.5%
SG&A -183.5 % of Net Sales -37.0%
Other operating income -1.5
Functional Expenses total -244.0 % of Net Sales -49.2%
Headcount1 13,8661 Values as of reporting date
13,352
-56.0 -10.5%
-182.9 -34.2%
-1.6
-237.3 -44.4%
2016
€ million
-219.0 -8.7%
-212.0
-30.8%
-967.8 -39.7%
€ million
2014
-8.7%
-749.2
€ million
-201.5 -8.5%
-738.4 -31.1%
-942.2
2013
-231.1 -8.9%
2015
€ million
-39.6%
-2.2 -6.6 -6.1 -18.1
-999.2
13,334 13,737 13,936 13,263
-861.2 -33.0%
-1,098.4 -42.1%
-762.1 -30.2%
-39.7%
2017
€ million
-234.7 -9.1%
-764.0 -29.7%
6.7
-992.0 -38.6%
13,739
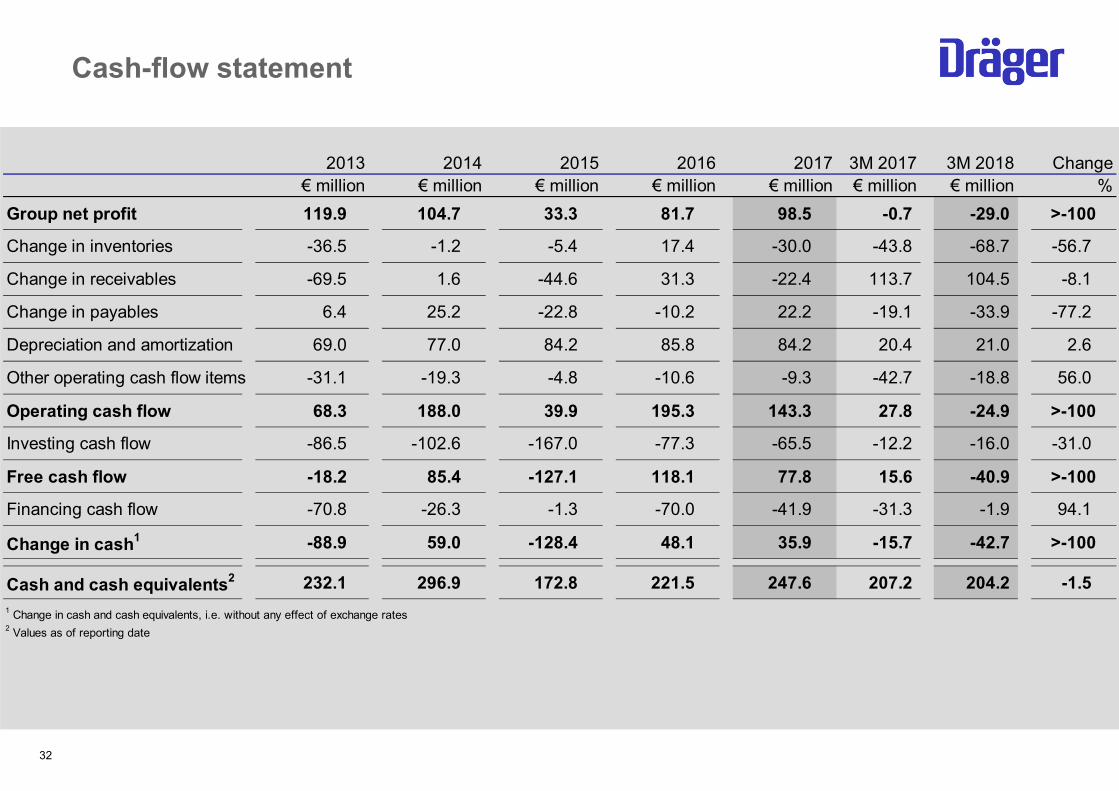
Cash-flow statement
32
3M 2017 3M 2018€ million € million
Group net profit 119.9 104.7 33.3 81.7 98.5 -0.7 -29.0 >-100
Change in inventories -36.5 -1.2 -5.4 17.4 -30.0 -43.8 -68.7 -56.7
Change in receivables -69.5 1.6 -44.6 31.3 -22.4 113.7 104.5 -8.1
Change in payables 6.4 25.2 -22.8 -10.2 22.2 -19.1 -33.9 -77.2
Depreciation and amortization 69.0 77.0 84.2 85.8 84.2 20.4 21.0 2.6
Other operating cash flow items -31.1 -19.3 -4.8 -10.6 -9.3 -42.7 -18.8 56.0
Operating cash flow 68.3 188.0 39.9 195.3 143.3 27.8 -24.9 >-100
Investing cash flow -86.5 -102.6 -167.0 -77.3 -65.5 -12.2 -16.0 -31.0
Free cash flow -18.2 85.4 -127.1 118.1 77.8 15.6 -40.9 >-100
Financing cash flow -70.8 -26.3 -1.3 -70.0 -41.9 -31.3 -1.9 94.1
Change in cash1 -88.9 59.0 -128.4 48.1 35.9 -15.7 -42.7 >-100
Cash and cash equivalents2 232.1 296.9 172.8 221.5 247.6 207.2 204.2 -1.5 1 Change in cash and cash equivalents, i.e. without any effect of exchange rates2 Values as of reporting date
Change%€ million€ million€ million € million
20152013 2014 2016 2017€ million
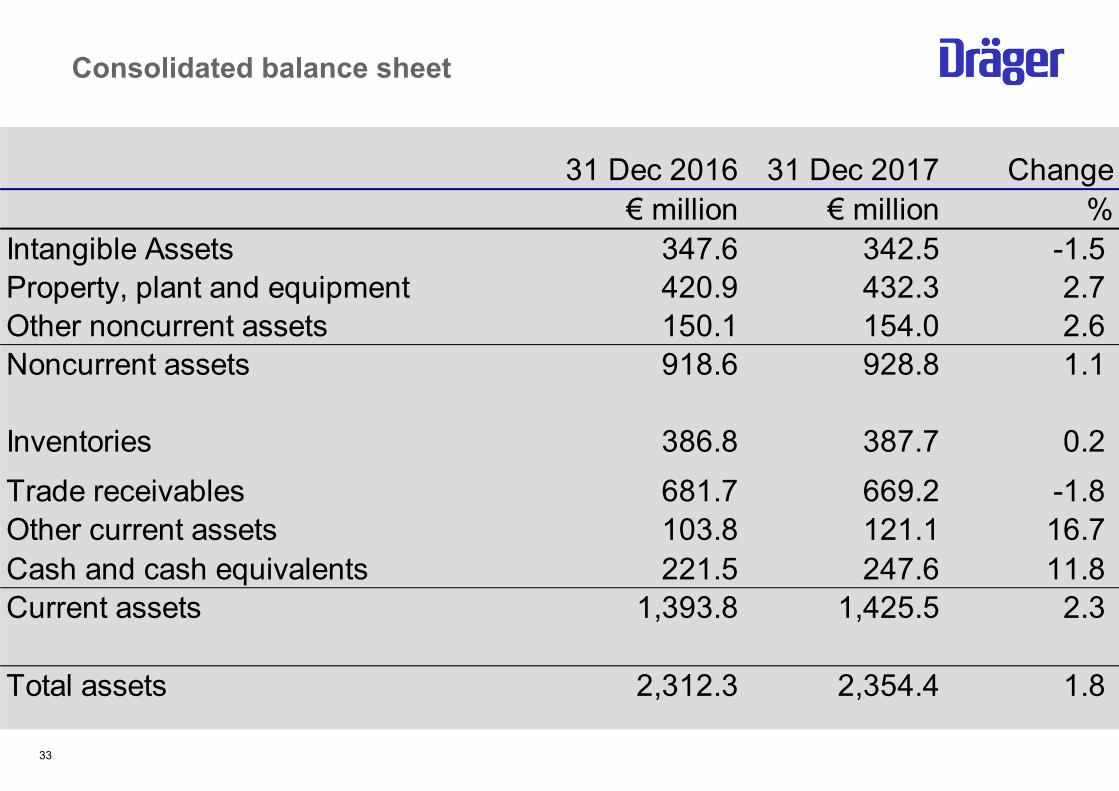
Consolidated balance sheet
33
31 Dec 2016 31 Dec 2017 Change€ million € million %
Intangible Assets 347.6 342.5 -1.5 Property, plant and equipment 420.9 432.3 2.7 Other noncurrent assets 150.1 154.0 2.6 Noncurrent assets 918.6 928.8 1.1
Inventories 386.8 387.7 0.2 Trade receivables 681.7 669.2 -1.8 Other current assets 103.8 121.1 16.7 Cash and cash equivalents 221.5 247.6 11.8 Current assets 1,393.8 1,425.5 2.3
Total assets 2,312.3 2,354.4 1.8
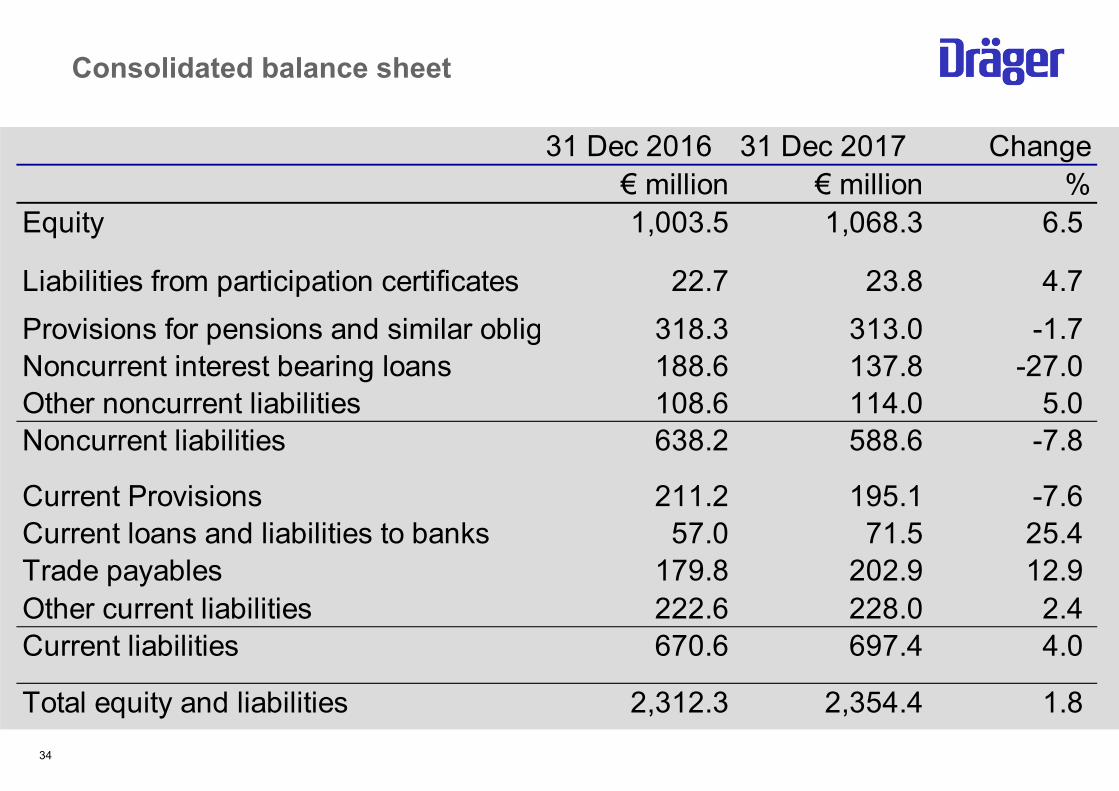
Consolidated balance sheet
34
31 Dec 2016 31 Dec 2017 Change€ million € million %
Equity 1,003.5 1,068.3 6.5
Liabilities from participation certificates 22.7 23.8 4.7 Provisions for pensions and similar oblig 318.3 313.0 -1.7 Noncurrent interest bearing loans 188.6 137.8 -27.0 Other noncurrent liabilities 108.6 114.0 5.0 Noncurrent liabilities 638.2 588.6 -7.8
Current Provisions 211.2 195.1 -7.6 Current loans and liabilities to banks 57.0 71.5 25.4 Trade payables 179.8 202.9 12.9 Other current liabilities 222.6 228.0 2.4 Current liabilities 670.6 697.4 4.0
Total equity and liabilities 2,312.3 2,354.4 1.8
35
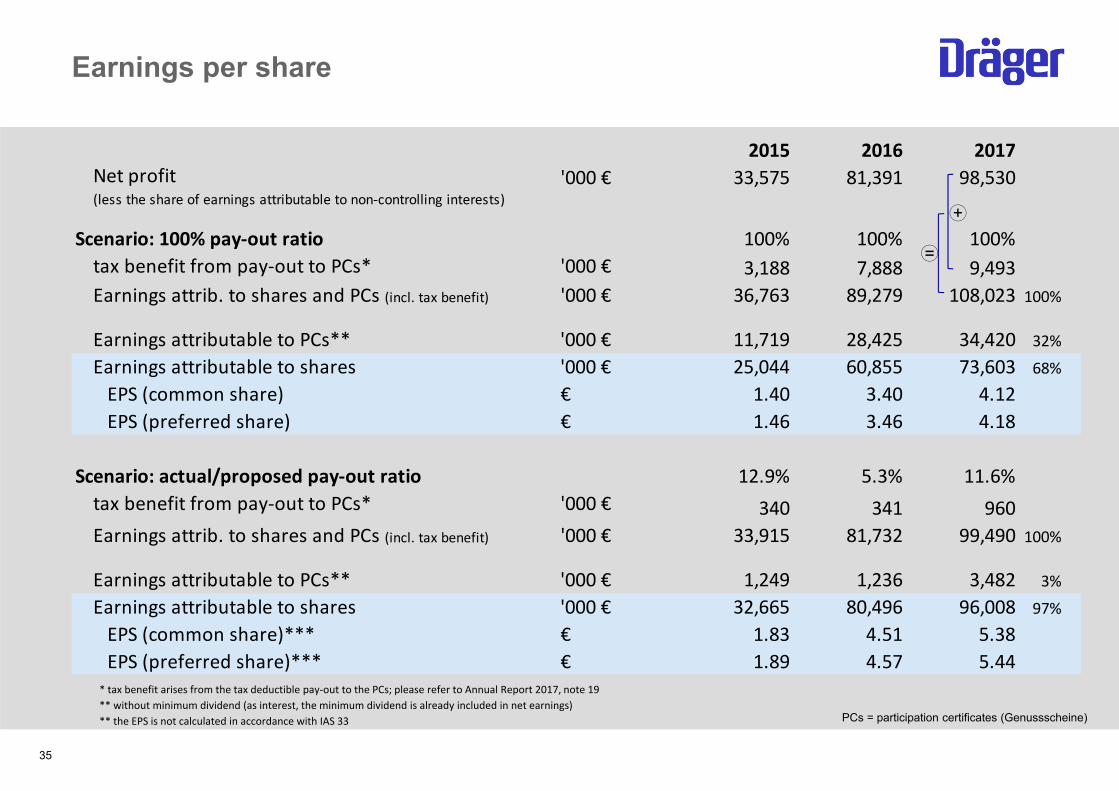
Earnings per share
+
=
* tax benefit arises from the tax deductible pay‐out to the PCs; please refer to Annual Report 2017, note 19** without minimum dividend (as interest, the minimum dividend is already included in net earnings)** the EPS is not calculated in accordance with IAS 33
2015 2016 2017Net profit (less the share of earnings attributable to non‐controlling interests)
'000 € 33,575 81,391 98,530
Scenario: 100% pay‐out ratio 100% 100% 100%tax benefit from pay‐out to PCs* '000 € 3,188 7,888 9,493Earnings attrib. to shares and PCs (incl. tax benefit) '000 € 36,763 89,279 108,023 100%
Earnings attributable to PCs** '000 € 11,719 28,425 34,420 32%
Earnings attributable to shares '000 € 25,044 60,855 73,603 68%
EPS (common share) € 1.40 3.40 4.12 EPS (preferred share) € 1.46 3.46 4.18
Scenario: actual/proposed pay‐out ratio 12.9% 5.3% 11.6%tax benefit from pay‐out to PCs* '000 € 340 341 960Earnings attrib. to shares and PCs (incl. tax benefit) '000 € 33,915 81,732 99,490 100%
Earnings attributable to PCs** '000 € 1,249 1,236 3,482 3%
Earnings attributable to shares '000 € 32,665 80,496 96,008 97%
EPS (common share)*** € 1.83 4.51 5.38 EPS (preferred share)*** € 1.89 4.57 5.44
PCs = participation certificates (Genussscheine)
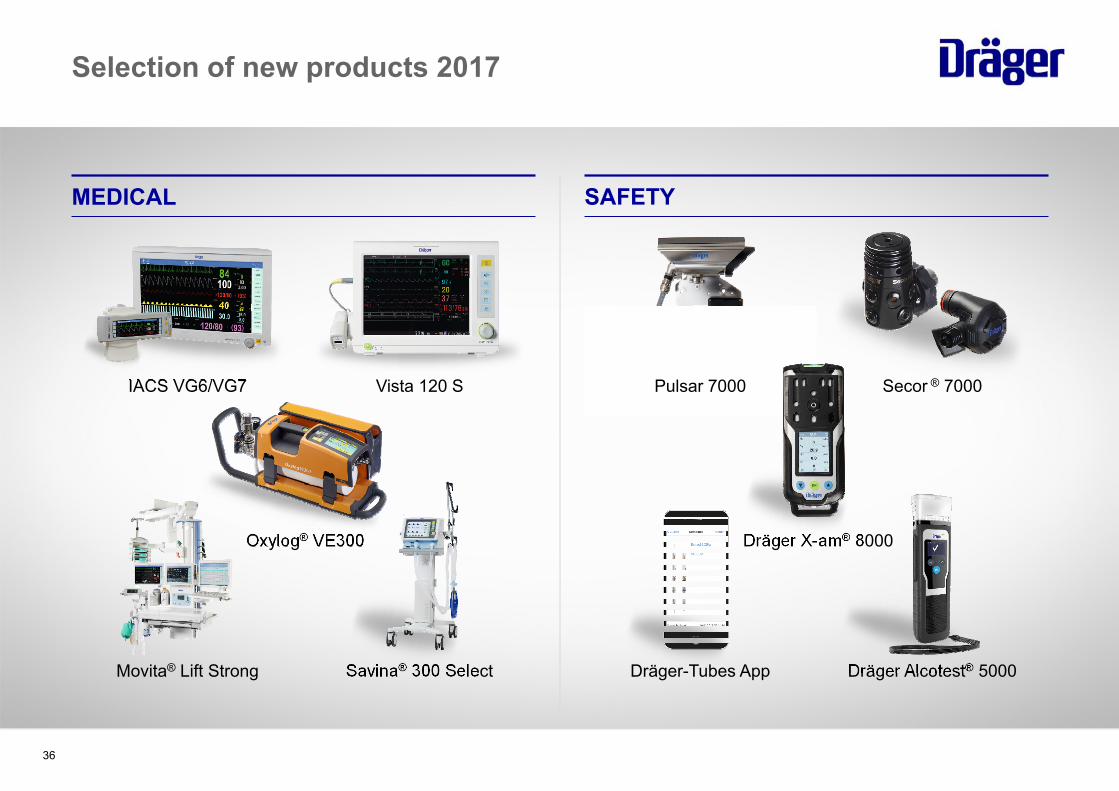
Selection of new products 2017
MEDICAL SAFETY
IACS VG6/VG7 Vista 120 S
Movita® Lift Strong Savina® 300 Select
Secor ® 7000
Dräger-Tubes App Dräger Alcotest® 5000
Pulsar 7000
36
Oxylog® VE300 Dräger X-am® 8000
37
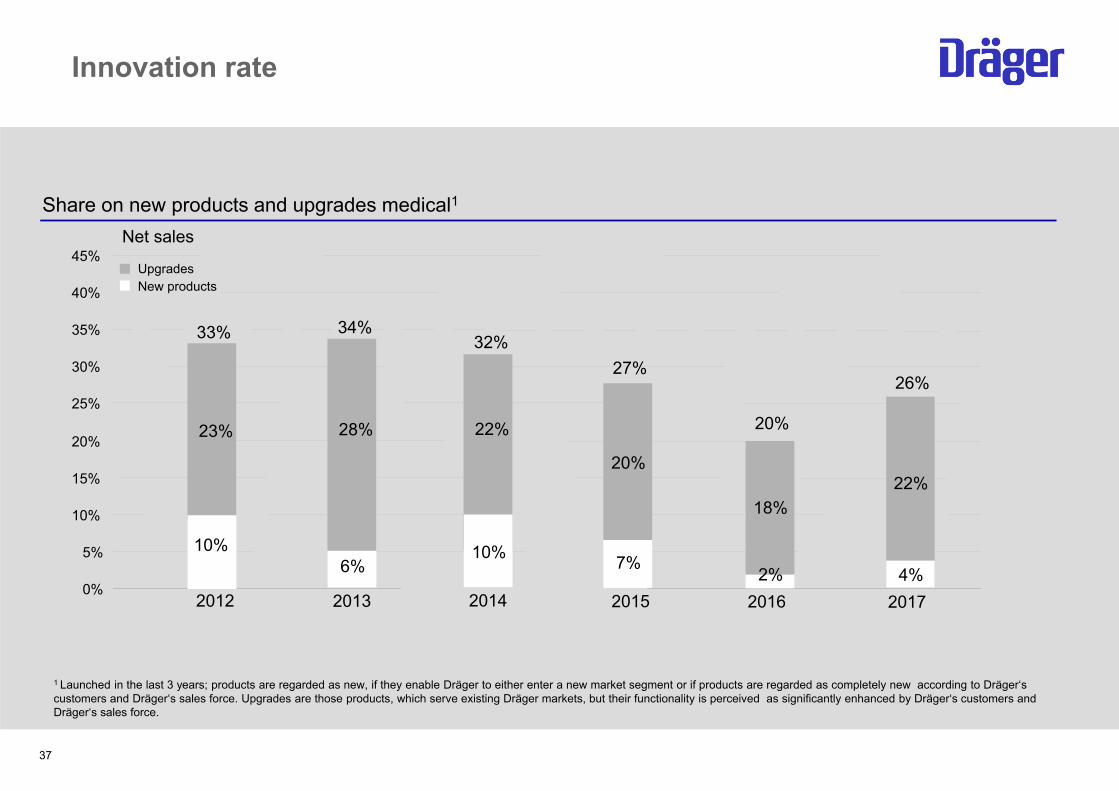
Innovation rate
Share on new products and upgrades medical1
1 Launched in the last 3 years; products are regarded as new, if they enable Dräger to either enter a new market segment or if products are regarded as completely new according to Dräger‘s customers and Dräger‘s sales force. Upgrades are those products, which serve existing Dräger markets, but their functionality is perceived as significantly enhanced by Dräger‘s customers and Dräger‘s sales force.
New productsUpgrades
Net sales
0%
5%
10%
15%
20%
25%
30%
35%
40%
45%
20%
23%
7%
20152012
10%
27%
33%
28%
2013
6%
34%
22%
2014
10%
32%
18%
2%2016
20%
22%
4%2017
26%
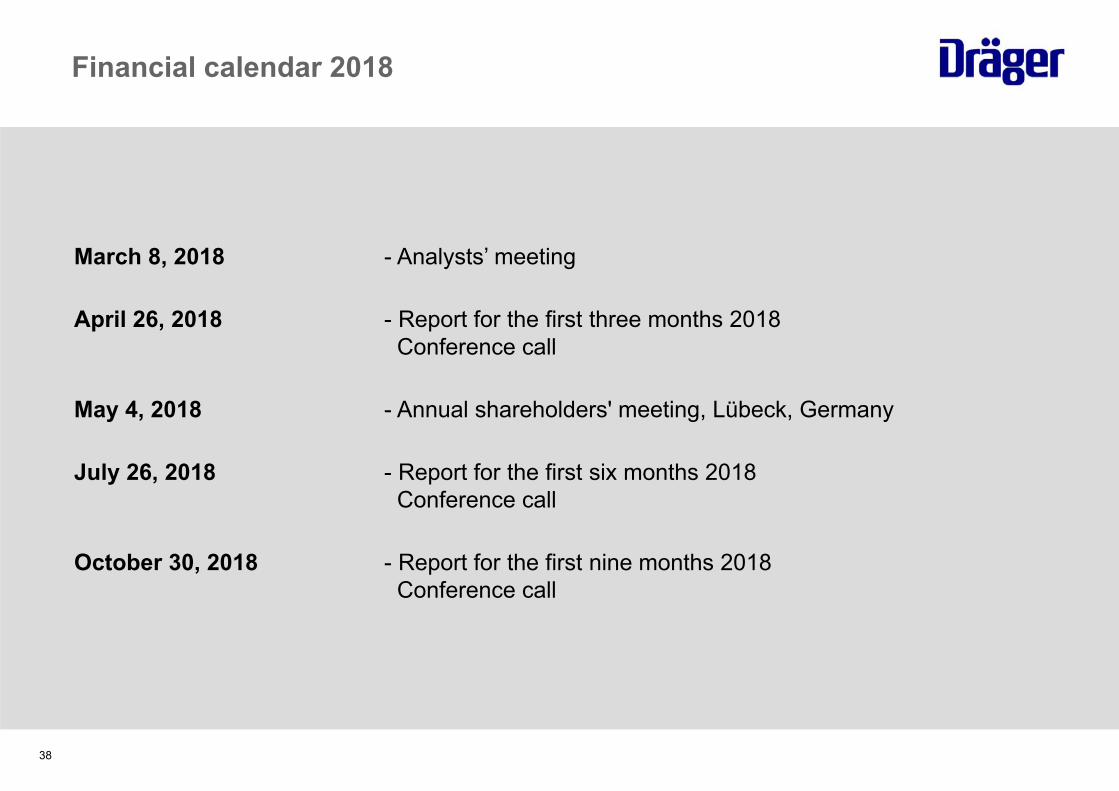
March 8, 2018 - Analysts’ meeting
April 26, 2018 - Report for the first three months 2018 Conference call
May 4, 2018 - Annual shareholders' meeting, Lübeck, Germany
July 26, 2018 - Report for the first six months 2018 Conference call
October 30, 2018 - Report for the first nine months 2018 Conference call
Financial calendar 2018
38
39
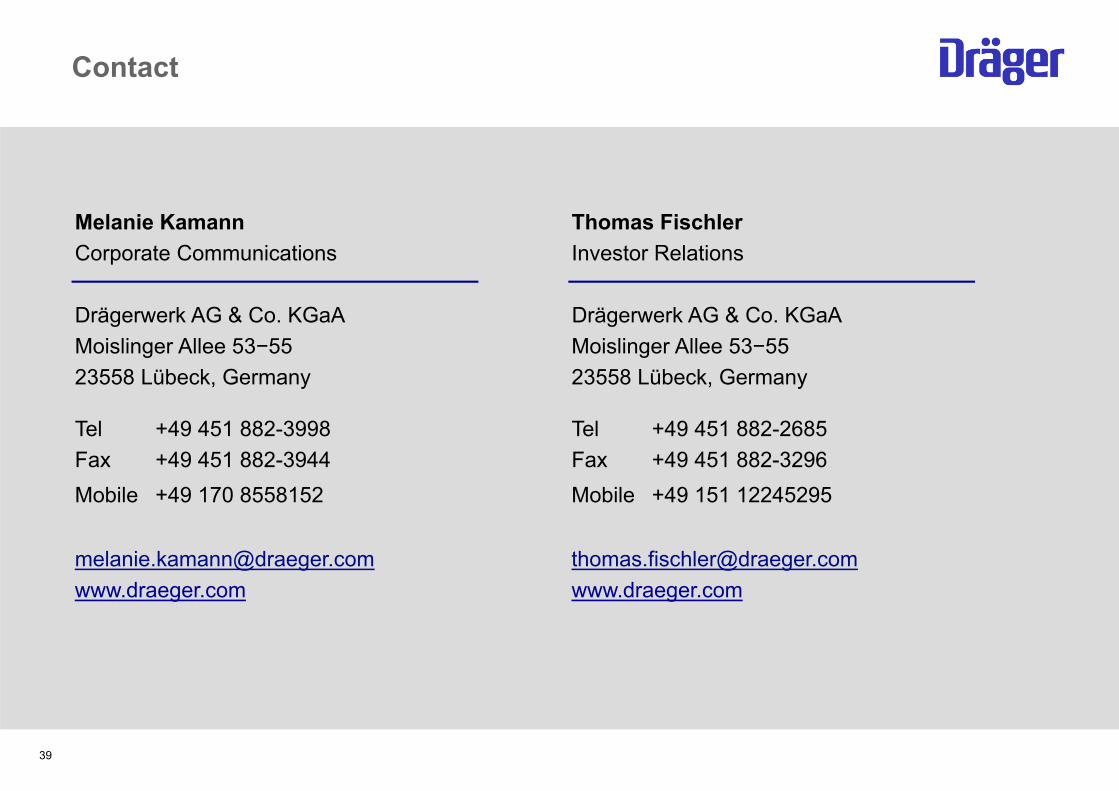
Melanie Kamann Thomas FischlerCorporate Communications Investor Relations
Drägerwerk AG & Co. KGaA Drägerwerk AG & Co. KGaAMoislinger Allee 53−55 Moislinger Allee 53−5523558 Lübeck, Germany 23558 Lübeck, Germany
Tel +49 451 882-3998 Tel +49 451 882-2685 Fax +49 451 882-3944 Fax +49 451 882-3296Mobile +49 170 8558152 Mobile +49 151 12245295
[email protected] [email protected] www.draeger.com
Contact