Embed Size (px)
Citation preview

rpsgroup.com
DRAFT CARLOW COUNTY RENEWABLE ENERGY STRATEGY
MDR1669 DRAFT CARLOW COUNTY
RENEWABLE ENERGY STRATEGY
A03 July 2021

REPORT
MDR1669 | DRAFT CARLOW COUNTY RENEWABLE ENERGY STRATEGY | A03 | July 2021 rpsgroup.com Page i
Document status
Version Purpose of document Authored by Reviewed by Approved by Review date
A03 Renewable Energy Strategy CD IP CB 08.07.2021
Approval for issue
CB 08/07/2021
© Copyright RPS Group Limited. All rights reserved.
The report has been prepared for the exclusive use of our client and unless otherwise agreed in writing by RPS Group Limited no other party may use, make use of, or rely on the contents of this report.
The report has been compiled using the resources agreed with the client and in accordance with the scope of work agreed with the client. No liability is accepted by RPS Group Limited for any use of this report, other than the purpose for which it was prepared.
RPS Group Limited accepts no responsibility for any documents or information supplied to RPS Group Limited by others and no legal liability arising from the use by others of opinions or data contained in this report. It is expressly stated that no independent verification of any documents or information supplied by others has been made.
RPS Group Limited has used reasonable skill, care and diligence in compiling this report and no warranty is provided as to the report’s accuracy.
No part of this report may be copied or reproduced, by any means, without the written permission of RPS Group Limited.
Prepared by: Prepared for:
RPS Carlow County Council

REPORT
MDR1669 | DRAFT CARLOW COUNTY RENEWABLE ENERGY STRATEGY | A03 | July 2021 rpsgroup.com Page ii
Contents 1 INTRODUCTION ...................................................................................................................................... 1
1.1 What is Renewable Energy? .......................................................................................................... 1 1.2 Why Prepare a Renewable Energy Strategy? ............................................................................... 1 1.3 Vision for Renewable Energy ......................................................................................................... 2 1.4 Existing Energy Profile ................................................................................................................... 2 1.5 Energy Consumption by Mode ....................................................................................................... 4 1.6 Methodology for Local Authority Renewable Energy Strategies.................................................... 6 1.7 Structure of this document ............................................................................................................. 6
2 LEGISLATIVE AND POLICY CONTEXT ................................................................................................ 7 2.1 International Context ...................................................................................................................... 7 2.2 European Context .......................................................................................................................... 8 2.3 National Context ............................................................................................................................. 9
2.3.1 Climate Regulation ........................................................................................................... 9 2.3.2 Policy, Plans & Programmes .......................................................................................... 10 2.3.3 Further Policies and Targets ........................................................................................... 11 2.3.4 Specific targets for Renewable Energy in Electricity, Heat and Transport ..................... 11 2.3.5 Financial Support ............................................................................................................ 12 2.3.6 Guidance in relation to Wind Energy .............................................................................. 13
2.4 Regional & Local Context ............................................................................................................. 14
3 CONSTRAINTS AND FACILITATORS ................................................................................................. 16 3.1 National Electricity Grid ................................................................................................................ 16 3.2 Gas Infrastructure ........................................................................................................................ 19 3.3 Waste ........................................................................................................................................... 21 3.4 Transport ...................................................................................................................................... 21 3.5 Energy Storage ............................................................................................................................ 22
3.5.1 Battery Storage ............................................................................................................... 22 3.5.2 Thermal Storage ............................................................................................................. 23
3.6 Environmental Considerations ..................................................................................................... 23 3.6.1 Biodiversity ...................................................................................................................... 23 3.6.2 Noise ............................................................................................................................... 23 3.6.3 Landscape and Visual .................................................................................................... 24 3.6.4 Built Heritage .................................................................................................................. 24 3.6.5 Air Quality and Climate ................................................................................................... 24
4 ECONOMIC BENEFITS OF RENEWABLE ENERGY .......................................................................... 27 4.1 Introduction .................................................................................................................................. 27 4.2 National Context ........................................................................................................................... 27
5 ENERGY EFFICIENCY AND CONSERVATION ................................................................................... 29 5.1 National Context ........................................................................................................................... 30
5.1.1 SEAI Programmes .......................................................................................................... 30 5.2 County Context ............................................................................................................................ 33
5.2.1 Policies and Objectives ................................................................................................... 33
6 OVERVIEW OF RENEWABLE ENERGY TYPES ................................................................................. 34 6.1 Wind Energy ................................................................................................................................. 34
6.1.1 Introduction ..................................................................................................................... 34 6.1.2 Overview ......................................................................................................................... 34 6.1.3 Current, Planned, and Contracted Developments .......................................................... 35 6.1.4 Key Success and Failure Factors ................................................................................... 37 6.1.5 Potential Resource ......................................................................................................... 37 6.1.6 Policy and Objectives ..................................................................................................... 42

REPORT
MDR1669 | DRAFT CARLOW COUNTY RENEWABLE ENERGY STRATEGY | A03 | July 2021 rpsgroup.com Page iii
6.2 Solar Energy ................................................................................................................................ 43 6.2.1 Introduction ..................................................................................................................... 43 6.2.2 Overview ......................................................................................................................... 43 6.2.3 Solar Photovoltaic ........................................................................................................... 43 6.2.4 Current, Planned, and Contracted Developments .......................................................... 43 6.2.5 Key Success and Failure Factors ................................................................................... 45 6.2.6 Potential Resource ......................................................................................................... 45 6.2.7 Policy and Objectives ..................................................................................................... 46
6.3 Bioenergy ..................................................................................................................................... 48 6.3.1 Introduction ..................................................................................................................... 48 6.3.2 Overview ......................................................................................................................... 48 6.3.3 Feedstock Sources ......................................................................................................... 48 6.3.4 Conversion Technologies ............................................................................................... 49 6.3.5 Current, Planned & Contracted Developments .............................................................. 50 6.3.6 Key Success and Failure Factors ................................................................................... 51 6.3.7 Potential Resource ......................................................................................................... 51 6.3.8 Policy and Objectives ..................................................................................................... 53
6.4 Micro Hydroelectric Power ........................................................................................................... 54 6.4.1 Overview ......................................................................................................................... 54 6.4.2 Current, Planned & Contracted Developments .............................................................. 54 6.4.3 Key Success and Failure Factors ................................................................................... 54 6.4.4 Potential Resource ......................................................................................................... 54 6.4.5 Potential Resource ......................................................................................................... 56
6.5 Micro Energy Generation and Community Energy ...................................................................... 57 6.5.1 Introduction ..................................................................................................................... 57 6.5.2 Overview ......................................................................................................................... 57 6.5.3 Micro-hydroelectric ......................................................................................................... 62 6.5.4 Existing Initiatives ........................................................................................................... 62 6.5.5 Key Success and Failure Factors ................................................................................... 62 6.5.6 Potential Opportunities ................................................................................................... 63 6.5.7 Micro-hydroelectric ......................................................................................................... 64 6.5.8 Policy and Objectives ..................................................................................................... 64
6.6 Renewable Transport ................................................................................................................... 65 6.6.1 Overview ......................................................................................................................... 65 6.6.2 Existing initiatives ........................................................................................................... 65 6.6.3 Potential Opportunities ................................................................................................... 66 6.6.4 Key Success and Failure Factors ................................................................................... 67 6.6.5 Policy and Objectives ..................................................................................................... 67
6.7 Renewable Heat ........................................................................................................................... 68 6.7.1 Overview ......................................................................................................................... 68 6.7.2 Existing initiatives ........................................................................................................... 68 6.7.3 Potential Opportunities ................................................................................................... 69 6.7.4 Key Success and Failure Factors ................................................................................... 70 6.7.5 Policy and Objectives ..................................................................................................... 70
7 SUMMARY OF RENEWABLE ENERGY STRATEGY .......................................................................... 71 7.1 Overall Targets ............................................................................................................................. 71 7.2 Roles and Responsibilities ........................................................................................................... 72
7.2.1 Role of Carlow County Council ....................................................................................... 72 7.2.2 Role of 3 Counties Energy Agency ................................................................................. 72 7.2.3 Role of Community Sector .............................................................................................. 73 7.2.4 Role of Householders ..................................................................................................... 73 7.2.5 Role of Business and Industry ........................................................................................ 73 7.2.6 Role of the Agricultural Sector ........................................................................................ 73

REPORT
MDR1669 | DRAFT CARLOW COUNTY RENEWABLE ENERGY STRATEGY | A03 | July 2021 rpsgroup.com Page iv
Tables
Table 1-1 Summary of Carlow and National final energy consumption by sector.............................................. 3 Table 1-2: Carlow and National Energy consumption per person ...................................................................... 3 Table 1-3: Breakdown of energy use by mode ................................................................................................... 4 Table 2-1: National Renewable Energy Targets .............................................................................................. 12 Table 3-1: Current, planned and contracted battery storage developments .................................................... 23 Table 3-2: Designated sites in Carlow .............................................................................................................. 23 Table 3-3: Principle Landcape Character Areas in Carlow .............................................................................. 24 Table 4-1: Direct and Indirect Job Creation from Renewable Energy in Ireland 2018 ..................................... 28 Table 4-2: Direct and Indirect Job Creation from Renewable Energy Worldwide 2018 ................................... 28 Table 5-1: Energy Efficiency & Conservation Objectives and Polices ............................................................. 33 Table 6-1: Current, planned and contracted wind farm developments in Carlow ............................................ 35 Table 6-2: Estimated available capacity for onshore wind energy in Carlow ................................................... 37 Table 6-3: Summary of Principal Landscape Character Areas in Carlow ........................................................ 39 Table 6-4 Utility Scale Wind Resource Summary in Carlow (to 2030) ............................................................. 42 Table 6-5: Wind Energy Objectives and Polices .............................................................................................. 42 Table 6-6 Permitted and Contracted Solar Farm Developments in Carlow ..................................................... 45 Table 6-7: Potential solar capacity available .................................................................................................... 46 Table 6-8: Utility solar resource summary in Carlow (to 2030) ........................................................................ 46 Table 6-9: Solar Energy Objectives and Polices .............................................................................................. 46 Table 6-10: Current Bioenergy Developments in Carlow ................................................................................. 50 Table 6-11: Suitability for Miscanthus, Oilseed Rape, Canary Grass and Willow in Co Carlow ...................... 51 Table 6-12: Bioenergy Objectives and Polices ................................................................................................. 53 Table 6-13 Current hydro developments in Carlow .......................................................................................... 54 Table 6-14: Potential Locations for Micro-Hydropower Generation in Carlow ................................................. 56 Table 6-15 Micro-Hydro Objectives and Policies ............................................................................................. 56 Table 6-16: Microgeneration and Community Energy Objectives and Polices ................................................ 64 Table 6-17: Location of charging points in Carlow ........................................................................................... 65 Table 6-18: Renewable Transport Objectives and Polices .............................................................................. 67 Table 6-19: Heat Demand for Carlow ............................................................................................................... 68 Table 6-20: Suitability criteria for District Heating ............................................................................................ 69 Table 6-21: Renewable Heat Objectives and Polices ...................................................................................... 70 Table 7-1: Anticipated National Renewable Energy Targets for 2030 ............................................................. 71 Table 7-2: Summary of Targets and Delivery Actions for Carlow .................................................................... 71
Figures Figure 1-1: Carlow Energy Consumption by Sector ........................................................................................... 3 Figure 1-2: National Energy Consumption by Sector ......................................................................................... 4 Figure 1-3: Energy Use by Mode in Carlow........................................................................................................ 5 Figure 1-4: National Energy Use by Mode ......................................................................................................... 5 Figure 3-1 Key Infrastructure and Material Assets ........................................................................................... 17 Figure 3-2 Gas and Electricity Networks .......................................................................................................... 18 Figure 3-3: CNG Refuelling Stations and CNG injection facilities in Ireland .................................................... 20 Figure 3-4 Designated Nature Sites ................................................................................................................. 25 Figure 3-5 Landscape Character Areas, Views and Scenic Routes ................................................................ 26 Figure 6-1: Graphical representation of ‘sieve analysis’ approach .................................................................. 34 Figure 6-2 Carlow Wind Resources .................................................................................................................. 36 Figure 6-3 Wind Opportunities and Constraints (draft National Guidelines) .................................................... 38 Figure 6-4 Wind Opportunities and Constraints (Local Land Use Policy) ........................................................ 41 Figure 6-5 Solar Granted Planning Applications and ESB network ................................................................. 44 Figure 6-6 Solar Opportunities and Constraints ............................................................................................... 47

REPORT
MDR1669 | DRAFT CARLOW COUNTY RENEWABLE ENERGY STRATEGY | A03 | July 2021 rpsgroup.com Page v
Figure 6-7 Biomass Potential in Carlow (Estimated) ........................................................................................ 52 Figure 6-8 Current and Potential Hydropower sites in Carlow ......................................................................... 55 Figure 6-9 Geothermal Heatmaps .................................................................................................................... 60 Figure 6-10 Geothermal - Open Loop Larger Commercial & Industrial Suitability ........................................... 61
Appendices Review of Regional/ County Level Plans, Programmes and Policies

REPORT
MDR1669 | DRAFT CARLOW COUNTY RENEWABLE ENERGY STRATEGY | A03 | July 2021 rpsgroup.com Page 1
1 INTRODUCTION The demand for energy at a global, national and local level is constantly increasing. There is a challenge to not only meet and manage this growing demand, but to do so in a secure, sustainable and efficient manner. It is widely acknowledged that, due to global warming and resource depletion, this cannot be achieved through the use of conventional fossil fuels alone, such as coal, oil and gas. In light of this, emphasis is being placed on energy conservation, energy efficiency and the development of alternative sources of energy, namely renewable energy.
Renewable energy developments can bring economic, social and environmental benefits, such as job creation, decreased import dependency and reduced greenhouse gas emissions. However, there are also challenges associated, such as landscape and visual impacts, the availability of supporting infrastructure and competition for land-use. As a result, it is vital that clear policies and objectives are in place for renewable energy developments to ensure that they are suitably located, economical and sustainable.
1.1 What is Renewable Energy? Renewable energy (RE) is that which is derived from natural resources that are not depleted when used. Renewable sources of energy are alternatives to fossil fuels. Where sufficient quantities of these resources exist, technologies can be employed for their exploitation, producing electricity, heat, or transport fuel. The processes in which these resources are converted to usable forms of energy do not release harmful pollutants or greenhouse gases, such as carbon dioxide (CO2).
Carlow has an abundance of natural resources that can be harnessed in a sustainable manner, without negatively impacting the environment. The potential within the county for a range of renewable energy technologies has been assessed, including:
• Wind energy;
• Solar energy;
• Bioenergy (biomass, biogas, biofuel);
• Geothermal energy;
• Hydropower;
• Waste-to-energy.
The potential for each renewable energy type in Carlow is dependent on the abundance of the natural resource available, along with the environmental and infrastructural constraints and facilitators. The scale of developments can range from micro to large-scale, providing energy for a single dwelling, a commercial property or being exported to the electricity grid for distribution. Renewable energy development decreases reliance on fossil fuels and imports, reducing greenhouse gas emissions and improving security of supply.
Carbon neutrality in the concept of achieving net zero CO2 emissions by balancing carbon emissions of a system with carbon removal or carbon offsetting measures to mitigate any effects on the climate.
1.2 Why Prepare a Renewable Energy Strategy? A Renewable Energy Strategy (RES) for Carlow is vital to enable the county to fully harness its natural resources in a way that is both economical and sustainable. The overall aim is to provide a sustainable spatial development strategy for Carlow with clear guidance on the future use of land, a framework for future investment in physical, social infrastructure, tourism and the economy and strategies to protect the diversity of the natural and cultural landscape in urban and rural environments. When integrated into the County Development Plan (CDP) 2022-2028, the RES allows renewable energy to be considered in land-use planning.
A RES provides a comprehensive assessment of the area to identify the most suitable locations for developments, considering the natural resource, the environmental considerations and the impact on local communities and quality of life. The strategy is tailored to the specific objectives of the county, developed to achieve the overall strategic aims and vision.
REPORT
MDR1669 | DRAFT CARLOW COUNTY RENEWABLE ENERGY STRATEGY | A03 | July 2021 rpsgroup.com Page 2
A RES contains clear planning policies that can be applied to development proposals to ensure they are in line with the objectives of the county. The clear policies, combined with the information regarding available resources and spatial evaluation of suitable locations, provides a robust policy position for the county in relation to renewable energy. The strategy is also beneficial to other stakeholders, such as residents and businesses, as it provides concise information on the potential for renewable energy in the county.
Ireland is currently working towards both national and EU renewable energy and efficiency targets. A RES will allow Carlow to maximise its contribution to achieving these targets through optimum use of resources.
1.3 Vision for Renewable Energy
1.4 Existing Energy Profile The existing energy profile of Carlow compared to the national baseline is outlined in Table 1-1 and Figure 1-1. This is based on calculations from the 3CEA and Sustainable Energy Authority of Ireland (SEAI). Carlow’s energy consumption in 2019 was 151 Ktoe1 or 1.76 GWh2. This accounts for 1.2% of national energy consumption if compared to the most recent national energy consumption data available in Ireland in 2019. In 2019, Carlow’s population accounted for 1.2% of the total population, meaning Carlow’s average energy consumption per head of population is marginally higher than the national average of 2.5 toe. calculated as 2.6 toe (Table 1-2).
Transport is the largest consumer of energy in Carlow and nationally. The transport sector accounts for 35% of Carlow’s total final energy consumption. Consumption by sector is lower than the national average. Despite private car consumption being 1.2% higher than the national average, the percentage of energy consumed by transport in Carlow is lower than the national average due to the fact that energy for aviation and navigation was not considered to be consumed in Carlow. Use of rail transport in Carlow is limited, with the Dublin to Waterford InterCity line passing through Carlow, and also Muine Bheag. Industry and Commercial/Public Services consume 27% and 13% of energy respectively in Carlow. Nationally, industry and services consume 19% and 14%, this is reflective of a significant industrial base in Carlow.
The residential sector is the third largest consumer of energy in Carlow, making up 24% of the total energy consumption. Average energy consumption by dwelling in Carlow is 6% higher than the national average as dwellings in Carlow are older, are less well insulated, are reliant on oil as a fuel source and have lower BER ratings. This explains the larger percentage of energy consumed by the residential sector in Carlow compared to 23% consumed by the sector nationally.
The agriculture sector in Carlow consumes 2% of energy, similar to the 2% consumed by this sector nationally. This is due to Carlow’s rural landscape and the high proportion of land devoted to agriculture.
1 Kilotonne of oil equivalent (ktoe), and tonne of oil equivalent (toe). Eurostat defines ktoe as: “A normalized unit of energy. By convention it is equivalent to the approximate amount of energy that can be extracted from one tonne of crude oil. It is a standardized unit, assigned a net calorific value of 41 868 kilojoules/kg and may be used to compare the energy from different sources.” https://ec.europa.eu/eurostat/statistics-explained/index.php/Glossary:Tonnes_of_oil_equivalent_%28toe%29
2 Gigawatt Hour (GWh). Eurostat defines GWh as: “A unit of energy representing one billion (1 000 000 000) watt hours and is equivalent to one million kilowatt hours. Gigawatt hours are often used as a measure of the output of large electricity power stations. A kilowatt hour is equivalent to a steady power of one kilowatt running for one hour and is equivalent to 3.6 million joules or 3.6 megajoules.” https://ec.europa.eu/eurostat/statistics-explained/index.php?title=Glossary:GWh
To encourage and support the transition of Carlow to a sustainable county through community engagement, energy efficiency and the sustainable development of renewable energy, whilst providing environmental and economic benefit at a local and national level in accordance with all relevant planning and environmental considerations.

REPORT
MDR1669 | DRAFT CARLOW COUNTY RENEWABLE ENERGY STRATEGY | A03 | July 2021 rpsgroup.com Page 3
Table 1-1 Summary of Carlow and National final energy consumption by sector
Sector Carlow energy
consumption 2019 Carlow sector as % of Total
National energy consumption 2019
National Sector % of
Total
Carlow % of national, by
sector
ktoe GWh % ktoe GWh % %
Residential 36 0.4 24 2,886 33.6 23 1.2
Transport 53 0.6 35 5,228 60.8 42 1.0
Industry 40 0.5 27 2,295 26.7 19 1.7
Commercial/Public Services
20 0.2 13 1,760 20.4 14 1.1
Agriculture 3 0.04 2 246 2.9 2 1.2
Total 151 1.76 12,414 144 100 1.2 Source: 3CEA & SEAI
Table 1-2: Carlow and National Energy consumption per person
Energy Consumption (2019) ktoe/person
National average energy consumption per person 2019 2.5
Carlow average energy consumption per person 2019 2.6
Ratio Carlow to National average energy consumption per person 1.02 Source: 3CEA & SEAI
Source: 3CEA & SEAI
Figure 1-1: Carlow Energy Consumption by Sector
24%
35%
27%
13%2%
Carlow energy consumption 2019, % by sector
Residential Transport Industry Commercial/ Public Services Agriculture

REPORT
MDR1669 | DRAFT CARLOW COUNTY RENEWABLE ENERGY STRATEGY | A03 | July 2021 rpsgroup.com Page 4
Source: 3CEA & SEAI
Figure 1-2: National Energy Consumption by Sector
1.5 Energy Consumption by Mode Table 1-3 and Figure 1-3 shows that heating accounts for the largest consumption of energy by mode in Carlow. Around 42% of energy is used in heating applications, the majority of which is in the residential sector. This is significantly higher than the national average and due to the reliance on oil as a fuel source and lower BER ratings. Around 36% of energy is used in transport applications, which is lower than the national average. This is due to the fact that energy for aviation and navigation was not considered to be consumed in Carlow. Carlow has an urban and rural population with approximately 65 people per kilometre. The rural population of Carlow is therefore highly dependent on private vehicle travel. Approximately 21% of energy is used in electrical applications in Carlow, which is marginally higher than the national figure. These differences are explained by the industrial and commercial employment in Carlow in comparison to the national average.
Table 1-3: Breakdown of energy use by mode
Sector Energy ktoe Carlow % (2019) National % (2019)
Heating 64 42 38 Electricity 32 21 20 Transport 55 36 42
Total 151 100 100
23%
42%
19%
14%2%
National energy consumption 2019, % by sector
Residential Transport Industry Commercial/ Public Services Agriculture

REPORT
MDR1669 | DRAFT CARLOW COUNTY RENEWABLE ENERGY STRATEGY | A03 | July 2021 rpsgroup.com Page 5
Source: 3CEA & SEAI
Figure 1-3: Energy Use by Mode in Carlow
Figure 1-4: National Energy Use by Mode
42%
21%
36%
Carlow Energy Use by Mode 2019
Heating Electricity Transport

REPORT
MDR1669 | DRAFT CARLOW COUNTY RENEWABLE ENERGY STRATEGY | A03 | July 2021 rpsgroup.com Page 6
1.6 Methodology for Local Authority Renewable Energy Strategies A key guidance document, which has informed the development of this RES, is the SEAI’s Methodology for Local Authority Renewable Energy Strategies [LARES] 2013. This is a comprehensive document designed to provide local authorities with guidance, templates, and reference points for the preparation of a LARES and to facilitate a consistent approach for these strategies across Ireland. This approach is based upon a four-step process, as follows:
1. Policy Context – A review of the local, regional, national and European policy context to ensure that a concrete set of assumptions is developed for the strategy and to ensure the validity of the strategy in the context of local, national and European obligations.
2. Identify and Assess the Renewable Energy Resources and Potential – An assessment of the RE resources and potential in the local authority area, which includes the above policy review, an examination of current, consented, and planned RE projects, and a review of available information on the RE resource in the local authority area so that the RE resources availability can be spatially mapped and quantified.
3. Constraints and Facilitators Review – Consideration of the infrastructural constraints, environmental considerations and any limiting or restrictive factors that may need to be considered. The outcome of undertaking this review is to determine what renewable resources are viable for future development.
4. Development of Renewable Energy Policy and Implementation - To develop RE policy and provide detail on its implementation. This will be informed by the information obtained from the previous steps and culminates in the production of the LARES document.
1.7 Structure of this document The remainder of the document is set out below:
• Section 2: Legislative and Policy Context
• Section 3: Overview of Renewable Energy
• Section 4: Constraints and Facilitators
• Section 5: Economic Benefits of Renewable Energy
• Section 6: Energy Efficiency and Conservation
• Section 7: Summary of Renewable Energy Strategy
REPORT
MDR1669 | DRAFT CARLOW COUNTY RENEWABLE ENERGY STRATEGY | A03 | July 2021 rpsgroup.com Page 7
2 LEGISLATIVE AND POLICY CONTEXT 2.1 International Context The Kyoto Protocol was a landmark international agreement to which 192 countries including Ireland agreed to limit worldwide greenhouse gas emissions. The protocol was adopted and ratified in 1997 under the United Nation Framework Convention on Climate Change (UNFCCC). Building on this, the United Nations Climate Change Conference of the parties (COP) serves as the formal meeting of the UNFCCC. The 12th December 2015, at COP21 in Paris, marked the date that a legally binding global agreement on climate change was agreed under the Paris Agreement. On this day, all governments agreed to a long-term goal of keeping the increase in global average temperature to well below 2°C above pre-industrial levels, and to aim to limit the temperate increase to 1.5°C. The Paris Agreement does not set a date for a peak in emissions, nor for the achievement of carbon neutrality. These targets are binding at global level but there is nothing binding for countries involved and countries can use ‘sinks’ such as forests to achieve these targets. The key points from COP21 include:
• Aim to peak in emissions as soon as possible and a long-term global goal for net zero emissions in the second half of the century. Countries can use ‘sinks’ such as forests to do this.
• Introduction of a review mechanism to take stock of country efforts every five years. Each pledge must be ‘a progression’ and ‘as ambitious as possible’.
• Introduction of a mechanism to recognise and address the financial losses vulnerable countries face from climate change.
• Legal obligation on developed countries to continue to provide climate finance to help developing countries adapt to climate change and transition to clean energy.
• A “facilitative, non-intransitive and non-punitive” system of review will track countries progress.
• Establishment of a “global goal” on adaptation of “enhancing adaptive capacity, strengthening resilience, and reducing vulnerability to climate change.
Additionally, inter alia, the Paris Agreement aims to increase the ability of countries to deal with the impacts of climate change and provides for an enhanced transparency framework for action and support. At the most recent COP, COP24 in Katowice, countries agreed on most of the elements of the ‘rulebook’ for implementing the Paris Agreement into practice, which includes how countries will measure and report on emission reductions efforts according to internationally agreed standards. In 2020, countries had to show how they have met targets and new, stricter targets have been set. Overall, the renewable energy supply is 12% of gross final consumption. Ireland has an EU binding target of 16% by 2020.
Another landmark agreement adopted in 2015 is the United Nations 2030 Agenda for Sustainable Development. A blueprint for sustainable development for the future, has at its core, 17 Sustainable Development Goals (SDG). These recognise that ending poverty and other deprivations must go together with strategies that improve health and education, reduce inequality, and spur economic growth – all while tackling climate change and working to preserve oceans and forests3. Along with SDGs, there are targets and indicators. The Division for Sustainable Development Goals (DSDG) evaluates the systemwide implementation of the 2030 agenda. Ireland is a member of the United Nations and must display commitment to implement the global goals.
The Department of Environment, Climate Action & Communications were assigned responsibility for preparing the SDG National Implementation Plan and the Voluntary National Review. The Plan was published in 2018 and as part of the implementation strategy Carlow County Council was appointed SDG Champion for the period 2019 -2020. Due to COVID 19, this period has been extended until Q2 2021.
3 https://sdgs.un.org/goals [accessed 12/02/2021]

REPORT
MDR1669 | DRAFT CARLOW COUNTY RENEWABLE ENERGY STRATEGY | A03 | July 2021 rpsgroup.com Page 8
2.2 European Context The EU Climate and Energy Package 2020 resulted in a set of binding legislation which aims to ensure the EU meets its ambitious climate and energy targets for 2020 which include the following key objectives:
• A 20% reduction in EU greenhouse gas emissions from 1990 levels.
• Raising the share of EU energy consumption produced from renewable resources to 20%; and
• A 20% improvement in the EU's energy efficiency.
In September 2020, the European Commission proposed an increase in the 2030 targets for emission reductions from 40% to at least 55% compared to 1990 levels.
The 2020 EU Effort Sharing target commits Ireland to reducing emissions from those sectors that are not covered by the EU’s Emissions Trading Scheme (ETS) (e.g. agriculture, transport, residential, non-energy intensive industry, commercial services, and waste) to 20% below 2005 levels.
Directive 2009/28/EC on the promotion of the use of energy from renewable sources (the “RES” Directive) established the basis for the achievement of the EU’s 20% renewable energy target. Each Member State is set a binding renewable energy target, which will contribute to the achievement of the overall EU goal.
Beyond 2020, the EU has set further targets through policies as part of the 2030 Climate and Energy Framework which were agreed by EU leaders in July 2018. In September 2020, the European Commission proposed an increase in the 2030 targets for greenhouse gas emission reductions from 40% to at least 55% compared to 1990 levels. These targets seek a greater contribution from renewable energy under key policy pillars covering renewable energy, energy efficiency and emissions trading. Under the revised ETS Directive (EU) 2018/410, which will apply from 2021-2030, the target for Ireland has been set at a 30% reduction in ETS sector emissions on 2005 levels by 2030. The revised Renewable Energy Directive (EU) 2018/2001 (recast), sets a target of at least 32% for renewable energy by 2030, at EU-wide level, with a review clause for 2023 to examine the potential for an upward revision of the EU level target, while the revised Energy Efficiency Directive (EU) 2018/20024 also sets a target of at least 32.5% for energy efficiency EU-wide.
The EU Governance of the Energy Union and Climate Action Regulation (EU) 2018/19995 sets the overall framework for the achievement of the EU climate and energy 2030 targets. This regulation also requires Member States to develop a National Energy and Climate Plans (NECP). Ireland’s draft NECP was submitted to the European Commission in December 2018. The aim of the NECPs is to provide an
4 Directive (EU) 2018/2002 of the European Parliament and of the Council of 11 December 2018 amending Directive 2012/27/EU on energy efficiency
5 Regulation (EU) 2018/1999 of the European Parliament and of the Council on the Governance of the Energy Union and Climate Action, amending Regulations (EC) No 663/2009 and (EC) No 715/2009 of the European Parliament and of the Council, Directives 94/22/EC, 98/70/EC, 2009/31/EC, 2009/73/EC, 2010/31/EU, 2012/27/EU and 2013/30/EU of the European Parliament and of the Council, Council Directives 2009/119/EC and (EU) 2015/652 and repealing Regulation (EU) No 525/2013 of the European Parliament and of the Council.

REPORT
MDR1669 | DRAFT CARLOW COUNTY RENEWABLE ENERGY STRATEGY | A03 | July 2021 rpsgroup.com Page 9
integrated policy framework for the period up to 2030 to ensure regulatory certainty and a coordinated approach among Member States. In March 2019, the Joint Oireachtas Committee on Climate Change recommended a more ambitious target be set for RES-E than was proposed in the first draft NECP – from 55% to 70% RES-E by 2030.6
The Commission has further developed long term goals through the Roadmap for moving to a competitive low carbon economy in 2050 which states the EU's goal of reducing greenhouse gas emissions by 80-95% below 1990 levels by 2050.
2.3 National Context This section outlines the relevant policy, plans and programmes in relation to climate change and renewable energy in Ireland. This list is not exhaustive and further information in relation to regional and county level plans, programmes and policies is provided in Appendix A.
2.3.1 Climate Regulation
The Climate Action and Low Carbon Development Act (2015) is an Act to provide for the approval of plans by the Government in relation to climate change for the purpose of pursuing the transition to a low carbon, climate resilient and environmentally sustainable economy; to establish a body to be known in the Irish language as An Chomhairle Chomhairleach um Athrú Aeráide or, in the English language, as the Climate Change Advisory Council. The Climate Action and Low Carbon Development (Amendment) Bill 2021 will support the country’s transition to achieve a climate neutral economy by 2050. It sets out legally binding, clear targets and commitments to meet the national, EU and international climate goals and obligations. Key elements contained within the Bill, include:
• Places on a statutory basis a 'national climate objective', which commits to pursue and achieve no later than 2050.
• Embeds the process of carbon budgeting into law.
• Actions for each sector will be detailed in the Climate Action Plan, updated annually.
• A National Long Term Climate Action Strategy will be prepared every five years.
• Government Ministers will be responsible for achieving the legally-binding targets for their own sectoral area with each Minister accounting for their performance towards sectoral targets and actions before an Oireachtas Committee each year.
• Strengthens the role of the Climate Change Advisory Council, tasking it with proposing carbon budgets to the Minister.
• Provides that the first two five-year carbon budgets proposed by the Climate Change Advisory Council should equate to a total reduction of 51% emissions over the period to 2030, in line with the Programme for Government commitment.
• Expands the Climate Change Advisory Council from eleven to fourteen members, and provides that future appointments to the Council provide for a greater range of relevant expertise and gender balanced.
• Introduces a requirement for each local authority to prepare a Climate Action Plan, which will include both mitigation and adaptation measures and be updated every five years. Local authority Development Plans will also align with their Climate Action Plan.
• Public Bodies will be obliged to perform their functions in a manner consistent with national climate plans and strategies, and furthering the achievement of the national climate objective.
Furthermore, the revised Climate Bill is to ban oil and gas extraction. This will end the prospecting of fossil fuel and the future development of oil and gas fields in Ireland. A separate ban is proposed on the
6 Houses of the Oireachtas (March 2019) Report of the Joint Committee on Climate Action. Climate Change: A Cross-Party Consensus for Action.

REPORT
MDR1669 | DRAFT CARLOW COUNTY RENEWABLE ENERGY STRATEGY | A03 | July 2021 rpsgroup.com Page 10
processing of imported fracked gas in liquefied natural gas (LNG) terminals is to come under separate legislation.
2.3.2 Policy, Plans & Programmes
Project Ireland 2040 – National Planning Framework (NPF) and the National Development Plan (NDP) are at the top of the spatial planning hierarchy in Ireland and are the Government’s high-level plan for the future development of Ireland, with a particular focus on strategic growth and infrastructure; together they make up “Project Ireland 2040”. Number eight of the ten National Strategic Outcomes (NSO’s) is to facilitate a Transition to a Low Carbon and Climate Resilient Society. The capital investment priorities arising from this strategy represent a major change in Ireland’s delivery of climate-action objectives to achieve sufficient reductions in carbon emissions during the period to 2030. Investment priorities include:
• Upgrading of 45,000 homes a year from 2021;
• An additional 3,000-4,500 MW of renewable energy;
• Full rollout of the Renewable Heat Support Scheme;
• Transition to low-emission (including electric) buses for the urban bus fleet; and
• A target of 500,000 electric cars by 2030.
The RES will need to be cognisant of these targets set out under Project Ireland 2040. In particular, decarbonising the various sectors i.e. electrification of transport, can only be achieved if there is a proportional increase in electricity generated from renewable sources to offset increased demands on the sector. This will include new offshore wind farms but also increased penetration of onshore wind and solar energy.
Ireland’s Climate Action Plan (DCCAE, 2019) outlines the current challenges across key sectors including electricity, transport, built Environment, industry and agriculture and outlines a co-ordinated approach towards ambitious decarbonisation targets. The objective of the Plan is to enable Ireland to meet its EU targets to reduce its carbon emissions by 30 percent between 2021 and 2030 and lay the foundations for achieving net zero carbon emissions by 2050. The Plan sets out 180 actions that need to be taken and extends to all sectors of the economy. These targets are to be underpinned by governance arrangements including carbon-proofing our policies, establishment of carbon budgets, a strengthened Climate Change Advisory Council and greater accountability to the Oireachtas. The First Progress Report indicates that good progress is being made towards implementing actions and achieving progress, with delivery of 85% (149) of the actions due for delivery in Quarter 2 and 3 of 2019.7
Alongside this, there is investment strategy, Investing in the Transition to a Low-Carbon and Climate-Resilient Society 2018-2027 (June 2018), outlining the Government’s commitment to achieving a low carbon and climate resilient future by 2050. To achieve this, actions must be undertaken to reduce GHG emissions, and resilience entails reducing vulnerability to climate change impacts which are happening now, and what might occur in the future. Project Ireland has committed to an investment of €22 billion towards climate action over the coming decade, with the National Development Plan allocating a further €8.6 billion for investments in sustainable mobility.
In 2018, the Government published the statutory National Adaptation Framework (NAF) which sets out the national strategy to reduce the vulnerability of the country to the negative effects of climate change and to avail of positive impacts. Under the Framework, Government Departments are required to prepare Sectoral Adaptation Plans for key sectors. Local Authorities will also be preparing Adaptation Strategies and the Framework provides a basis for local authorities and key sectors to assess their key climate risks and vulnerabilities while enabling climate resilience actions to be mainstreamed into all local, regional, and national policymaking. The Climate Change Adaptation Plan for the Electricity and Gas Networks Sector was published by DCCAE in February 2018. It is a high-level plan which outlines the initial research and analysis on the likely effects of climate change on these sectors and sets out possible actions to develop resilience.
7 DCCAE. Climate Action Plan: https://www.dccae.gov.ie/en-ie/climate-action/topics/climate-action-plan/Pages/climate-action.aspx

REPORT
MDR1669 | DRAFT CARLOW COUNTY RENEWABLE ENERGY STRATEGY | A03 | July 2021 rpsgroup.com Page 11
2.3.3 Further Policies and Targets
The National Policy on Alternative Fuels Infrastructure for Transport 2017-2030 was published by DTTAS reiterating the cornerstones of Irish transport policy which includes key goals such as reducing reliance on fossil fuels and reducing transport emissions. Utilising alternative fuels is a key aspect of this and for contributing to decarbonisation of the electricity sector. It outlines the main fuel options that could provide alternatives to oil in transport namely: electricity, hydrogen, biofuels, and natural gas, in the forms of compressed natural gas (CNG), liquefied natural gas (LNG), and liquefied petroleum gas (LPG). Ireland set an initial target in 2008 of converting 10% of its passenger and light commercial vehicle stock to electric vehicles by 2020 (roughly equivalent to 230,000 vehicles).
As the uptake of EVs was lower than anticipated, this target was revised to 50,000 in Ireland’s third National Energy Efficiency Action Plan (NEEAP) published in 2014. The target for EV uptake was revised to 20,000 electric vehicles by 2020 by this framework, which is reflected in NEEAP 4. In line with the ambition of the NDP, the EV stock is projected to reach approximately 500,000 by 2030.8
The use and specification of biofuels in the transport sector is dictated by the Renewable Energy Directive (2009/28/EC) and the Fuel Quality Directive (2009/30/EC). Under Article 3(4) of the Renewable Energy Directive, Ireland is committed to ensuring that at least 10% of energy consumption in the transport sector is achieved from renewable sources by 2020.
In 2015, new rules came into force that amended the legislation on biofuels – specifically Directive 2009/29/EC and Directive 2009/30/EC – to reduce the risk of indirect land use change and to prepare the transition towards advanced biofuels. The amendment:
• Limits the share of biofuels from crops grown on agricultural land that can be counted towards the 2020 renewable energy targets to 7%.
• Proposes a specific sub-target of at least 0.5% for advanced biofuels in road and rail energy from 2021, rising to 3.6% in 2030.
• Requires that biofuels produced in new installations emit at least 60% fewer GHGs than fossil fuels.
• Introduces stronger incentives for the use of renewable electricity in transport.
2.3.4 Specific targets for Renewable Energy in Electricity, Heat and Transport
Article 4 of the 2009 RES Directive required Ireland to adopt a National Renewable Energy Action Plan (NREAP). Ireland’s plan was submitted to the Commission in 2010 and established that the 16% RES target in 2020 would be delivered by achieving three modal targets as follows:
• 40% renewable share of electricity use (RES-E);
• 12% share of renewable heat (RES-H); and
• 10% renewable share of transport energy (RES-T).
Progress to date in Ireland, renewable energy represented 12% of gross final consumption. The RES-E share in 2009 of 13.7% has risen to 36.5 % in 2019. This trend suggests a circa 3% increase per annum and continuing at pace. The RES-H share was 6.3% in 2019, compared to the 12% target, while the RES-T share was 8.9 % in 2019 compared to the 10% target. Transport has the largest share of energy consumption in Ireland but the smallest share of renewable energy. Based on these achievements to date, Ireland’s overall renewable energy contribution is estimated to be 12.7% to 14% for 2020. Table 2-1 shows the renewable energy targets by mode in Ireland.
Looking ahead to 2030, the proportion of energy from renewable sources will have to dramatically increase to meet EU targets. While the national target has not yet been finalised, Table 2.1 below present a possible set of targets across electricity, heat and transport sectors, following the ‘With Additional Measures’ projection set out in the National Energy and Climate Action Plan 2019.
8 https://www.seai.ie/publications/National-Energy-Projections-to-2030.pdf

REPORT
MDR1669 | DRAFT CARLOW COUNTY RENEWABLE ENERGY STRATEGY | A03 | July 2021 rpsgroup.com Page 12
Table 2-1: National Renewable Energy Targets
RES Target Ireland 2019 (%) Target 2020 (%) Target 2030 (%)9
Overall RES Target 12 16 34.1 RES-E 36.5 40 70 RES-H 6.3 12 24 RES-T 8.9 10 13.4
2.3.5 Financial Support
The Climate Action Fund was also launched in 2018, with €500 million supporting the delivery of projects necessary to achieve the low carbon, climate-resilient transition. Chapter 4 of the accompanying report concerns ‘decarbonising electricity’, which sets out the contribution of the NDP to Ireland’s decarbonisation objectives. The report sets out the key electricity sector investments applicable to Carlow as follows, with the corresponding measure from the National Mitigation Plan (NMP) in brackets:
• Decarbonising electricity generation through the Renewable Electricity Support Scheme [to support up to 4,500 megawatts of additional renewable electricity by 2030] (RE1, RE3, RE3, RE4);
• Roll-out of the National Smart Energy Metering programme (BE21);
• Ongoing reinforcement of existing power grid; and
• Use of energy research funding to accelerate diversification away from fossil fuels to green energy, including, wind, wave, solar, biomass, biofuels, biogas, and hydrogen (RE5).
The proposed new Renewable Electricity Support Scheme (RESS) will be a key deliverable on Ireland’s transition to its low carbon future. The RESS aims to provide support to renewable electricity projects in Ireland with a focus on cost-effectiveness, and targets the delivery of a broader range of policy objectives, including:
• An Enabling Framework for Community Participation through the provision of pathways and support for communities to participate in renewable energy projects;
• Increasing Technology Diversity by broadening the renewable electricity technology mix (the diversity of technologies);
• Delivering an ambitious renewable electricity policy to 2030; and
• Increasing energy security, energy sustainability and ensuring the cost effectiveness of energy policy.
RESS auctions are intended to be held at frequent intervals throughout the lifetime of the scheme. The scheme will provide for a renewable electricity (RES-E) ambition of up to a maximum of 55% by 2030, subject to determining the cost-effective level which are set out in the draft National Energy and Climate Plan (NECP) 2021-2030. RESS auctions will be designed in line with trajectory targets identified in Ireland's NECP. It aims to deliver 'shovel ready' projects and to assist in the early delivery of targets for Ireland’s trajectory to 2030.
The first RESS auction (RESS-1) took place as per the indicative timetable published by DCCAE initially in September 2019 and updated in April 2020.10 The provisional auction results of the RESS 1 auction have been released in August 2020. Of the eighty-two provisionally successful projects (63 solar and 19 wind), none are located in Carlow. Five solar energy and two onshore wind community projects have been successful in RESS-1. These projects are located across three provinces in counties Kilkenny, Galway, Mayo, Wexford, Clare, and Cork. The projects will be owned in the majority by communities and the revenues from operation will be cycled back into those communities.11
9 National Energy and Climate Plan 2021-2030 . Table 5. [Accessed 22/02/2021] 10 DCCAE Renewable Electricity Support Scheme (RESS): https://www.dccae.gov.ie/en-ie/energy/topics/Renewable-Energy/electricity/renewable-electricity-supports/ress/Pages/default.aspx
11 Eirgrid: RESS Provisional Auction Results https://www.eirgridgroup.com/site-files/library/EirGrid/RESS-1-Provisional-Auction-Results-(R1PAR).pdf
REPORT
MDR1669 | DRAFT CARLOW COUNTY RENEWABLE ENERGY STRATEGY | A03 | July 2021 rpsgroup.com Page 13
Similarly, for renewable heat, the government funds an initiative called the Support Scheme for Renewable Heat (SSRH)12 with the goal of increasing the share of renewable sources in the heat and thermal sector by:
• Bridging the gap between the installation and operating costs of renewable heating systems and the conventional fossil fuel alternatives; and
• Incentivising the development and supply of renewable heat.
The SSRH is open to commercial, industrial, agricultural, district heating, public sector and other non-domestic heat users not covered under the ETS. The scheme opened for applications relating to installation grants for air source heat pumps, ground source heat pumps and water source heat pumps in September 2018. The operational support component of the scheme, including support for biomass boiler/biomass HE CHP heating systems and biogas (anaerobic digestion) boiler/biogas HE CHP heating systems, opened in 2019, and is subject to receipt of state aid approval from the European Commission.13 The first SSRH project under this scheme was completed in January 2020.14
The National Home Retrofit Scheme is a Government grant scheme aimed to upgrade homes towards achieving the Government Climate Action Plan. The funding is designed to encourage groups of private households, registered Housing Associations and Local Authorities in the delivery of energy efficient upgrades and renewable energy usage, specifically in domestic buildings.15 3 Counties Energy Agency (3CEA) are facilitating and accepting applications from homeowners in Carlow.
2.3.6 Guidance in relation to Wind Energy
The Wind Energy Development Guidelines (WEDGs) of 2006, issued under Section 28 of the Planning and Development Act (PDA) 2000, as amended, set out advice to planning authorities on planning for wind energy through the development plan process and in determining applications for planning permission. They contain guidelines to ensure consistency of approach throughout the country in the identification of suitable locations for wind energy development. The Guidelines have undergone a detailed review to establish clearer guidance to facilitate the achievement of wider renewable energy targets while considering community, spatial planning, energy policy, environmental, technological and industry issues that need to be balanced and have now been issued for public consultation as the Draft Revised WEDGs in December 2019.
The Draft Wind Energy Development Guidelines (DCCAE, December 2019), issued under Section 28 of the Planning and Development Act 2000 (as amended) (PDA) set out advice to planning authorities on planning for wind energy through the development plan process and in assessing applications for planning permission. The guidelines ensure consistency of approach throughout the country in the identification of suitable locations for wind energy development. The 2019 draft guidelines have been published following a focused review to establish clearer guidance to facilitate the achievement of wider renewable energy targets, while also considering community, spatial planning, energy policy, environmental, technological and industry issues that all need to be balanced.
The draft 2019 guidelines focus on addressing several key considerations including: sound/ noise; visual amenity setback distances; shadow flicker; consultation obligations; community dividend; and grid connections. Planning authorities and An Bord Pleanála must have regard to these guidelines and are required to apply the specific planning policy requirements (SPPR’s) of the guidelines when carrying out their functions under section 28(1C) of the PDA. These guidelines are of direct relevance to the RES in terms of the key environmental aspects to be considered as part of wind energy development, such as noise and shadow flicker considerations, as well as setback distances. Among the key criteria set out in the December 2019 draft are:16
• New noise standards: The proposed new standards have been brought up to date in line with the 2018 World Health Organization (WHO) Environmental Noise Guidelines for the European Region, including a maximum noise level of 43 dB(A).17 A robust new noise monitoring framework is also proposed.
12 SEAI: https://www.seai.ie/sustainable-solutions/support-scheme-renewable-/ 13 DCCAE (2018) Draft National Energy and Climate Plan. 14 https://www.biomassengineering.ie/2020/01/07/first-ssrh-project-completed/ 15 National Home Retrofit https://www.seai.ie/grants/national-home-retrofit/ 16 DCCAE (December 2019): https://www.dccae.gov.ie/en-ie/news-and-media/press-releases/Pages/Ministers-Murphy-and-Bruton-publish-draft-Wind-Energy-Development-Guidelines-for-public-consultation.aspx
17 A-weighted decibel, or dB(A). The EEA defines a decibel as: “A logarithmic scale used to denote the intensity, or pressure level, of a sound relative to the threshold of human hearing. A step of 10 dB is a 10-fold increase in intensity or sound energy and actually sounds

REPORT
MDR1669 | DRAFT CARLOW COUNTY RENEWABLE ENERGY STRATEGY | A03 | July 2021 rpsgroup.com Page 14
• Setback distances: This is required for the purposes of visual amenity and comprise a distance of four-times the tip height between a wind turbine and nearest point of the curtilage of any residential property in the vicinity of the proposed development, subject to a minimum mandatory setback distance of 500 metres. This setback distance must also comply with the proposed noise limits.
• Shadow flicker: Automatic control mechanisms for shadow flicker will be required during the operational phase of a wind energy development.
• Community engagement: Developers will be required to undertake mandatory and active consultation with the public and the local community at an early stage in project development. There is also a requirement for the preparation of a ’Community Report’ to be submitted as part of the planning application.
• Community dividend: Wind energy developers must provide an opportunity for the local community to receive social or economic benefit from the project (e.g. community investment, ownership etc.)
• Grid connections: Updated advice has been included concerning the requirements of EIA as they relate to wind energy development and associated grid connections, as informed by relevant case law.
2.4 Regional & Local Context A Regional Spatial and Economic Strategy (RSES) has been prepared by each of the three Regional Assemblies, namely the Eastern and Midland, the Northern and Western, and the Southern. One of the principle functions of the RSES’s is to practically support and advance the delivery of the national policy objectives contained in the NPF at the regional level, and to inform lower-level planning (such as County Development Plans). The three regional assemblies will bring forward the NPF in a manner which best reflects the challenges and opportunities of their respective regions. Carlow is part of the South-East Region and falls under the Southern Region (2020). It contains the following key relevant Regional Policy Objectives (RPOs):
• RPO 56 - Low Carbon Economy:
- The RSES recognises the urgency to transition to a low carbon future and it is therefore an objective to accelerate the transition towards low carbon economy and circular economy through mechanisms such as the Climate Action Competitive Fund.
- It is an objective to develop enterprises that create and employ green technologies.
- Local authorities should ensure that the development of green industry and technologies incorporates careful consideration of potential environmental impacts at project level including the capacity of receiving environment and existing infrastructure to serve new industries;
- Local authorities shall include objectives in statutory land use plans to promote energy conservation, energy efficiency and the use of renewable energy sources in existing buildings, including retro fitting of energy efficiency measures in the existing building stock, energy efficiency in traditional buildings and initiatives to achieve Nearly Zero-Energy Buildings (NZEB) standards in line with the Energy Performance of Buildings Directive (EPBD).
- It is an objective to support investments in energy efficiency of existing commercial and public building stock with a target of all public buildings and at least one-third of total commercial premises upgraded to BER Rating ‘B’. Local authorities shall report annually on energy usage in all public buildings and will achieve a target of 33% improvement in energy efficiency in all buildings in accordance with the National Energy Efficiency Action Plan (NEEAP).
• RPO 95: Support implementation of the National Renewable Energy Action Plan (NREAP), and the Offshore Renewable Energy Plan and the implementation of mitigation measures outlined in their respective SEA and AA and leverage the Region as a leader and innovator in sustainable renewable energy generation.
• RPO 96: Support the sustainable development, maintenance and upgrading of electricity and gas network grid infrastructure to integrate a renewable energy sources and ensure our national and
a little more than twice as loud.” https://www.eea.europa.eu/help/glossary/eea-glossary/decibel. The A-weighting corrects unweighted decibels for audio frequency and represents the relative loudness of sound in air as it is perceived by the human ear.

REPORT
MDR1669 | DRAFT CARLOW COUNTY RENEWABLE ENERGY STRATEGY | A03 | July 2021 rpsgroup.com Page 15
regional energy system remains safe, secure, and ready to meet increased demand as the regional economy grows.
• RPO 97: Support the sustainable technology upgrading and conversion of power stations in the Region to increase capacity for use of energy efficient and renewable energy sources.
• RPO 98: Support the development of a Regional Renewable Energy Strategy with relevant stakeholders.
• RPO 99: Support the sustainable development of renewable wind energy (on shore and offshore) at appropriate locations and related grid infrastructure in the Region in compliance with national Wind Energy Guidelines.
• RPO 100: Support the integration of indigenous renewable energy production and grid injection.
• RPO 101: Support continued innovation and research in the energy sector and to develop a role as an international hub for energy innovation.
The three Regional Waste Management Plans (RWMP) 2015-2021 (Eastern-Midlands; Connaught-Ulster; and Southern;) were published in 2015 to provide a framework for the prevention and management of wastes for the three defined regional areas. Carlow falls under the Southern RWMP which sets policies for waste management, including growth of the biological treatment sector as well as supporting the development of thermal recovery in the region.
Spatial and land use planning for Carlow has been guided by the current Carlow County Development Plan 2015-2021. This draft RES will form a subset of the next generation of development plan for the County, from 2022 to 2028. In preparing the draft RES, we have had regard to existing policy including the Strategic Goals (section 2.2) and other objectives in relation to energy, environment, and enterprise.
The Climate Adaption Strategy 2019 - 2024 guides the process of adaptation planning in Carlow County Council and is the first step in increasing knowledge and understanding of the changing climate, growing resilience, and enabling effective responses to the threats posed by climate change. It contains the following key relevant objectives:
• RM-14 To support the recording and monitoring of renewable energy potential in the county in partnership with other stakeholders including SEAI.
• RM-20 Identify sites for trialling renewable energy projects to reduce the need for “Grey adaptation” measures.
• RM-25 Develop research and funding opportunities for climate adaptation, renewable and energy efficiency projects.
• RM-31 Explore potential for renewable energy/ micro generation at council facilities. Including Powerstown Civic Amenity Site.

REPORT
MDR1669 | DRAFT CARLOW COUNTY RENEWABLE ENERGY STRATEGY | A03 | July 2021 rpsgroup.com Page 16
3 CONSTRAINTS AND FACILITATORS The availability of supporting infrastructure can facilitate or constrain renewable energy developments. The type, scale and location of installations will depend on the proximity to the required infrastructure and the available capacity. Key supports include the national electricity grid, gas infrastructure, water supply and wastewater facilities, transport, and energy storage. Where necessary, infrastructure may need to be upgraded or constructed, however, this increases the complexity, cost, and duration of projects.
There is existing infrastructure in Carlow that presents opportunities for future renewable energy developments, shown in Figure 3-1.
3.1 National Electricity Grid Renewable energy developments can be used for on-site generation or can export electricity to the National Grid, depending on their scale. The transmission system on the island, operated by EirGrid and the System Operator for Northern Ireland (SONI), transports electricity from generation stations to demand centres, using high-voltage lines at 110 kV, 220 kV and 400 kV in the Republic of Ireland and 110 kV and 275 kV in Northern Ireland. Electricity is transported to consumers through the distribution network, operated by ESB in the Republic of Ireland, and SONI in Northern Ireland.
The distribution system is operated by ESB Networks and operates with low voltage, 10 kV, 20 kV, 38 kV and 110 kV lines.18 The Available Capacity Heatmap developed by ESB (available online19) contains capacity information on all of the 3-phase Low Voltage (LV), Medium Voltage (MV) and High Voltage (HV) Distribution System Operators (DSO) substations. This information is indicative and does not preclude development where it indicates network capacity. The image below provides a snapshot of substation capacities on the ESB Networks website at the time of writing. The heatmap resource can be used by those examining grid capacity for renewable energy generation in a particular part of the county.
ESB Network Capacity Map19 (Demand Legend: BLACK:- Between 0 and 20kVA, AMBER:- Between 20 and 200kVA, GREEN:- Greater than 200kVA
18 https://www.esbnetworks.ie/who-we-are/our-networks [Accessed: 12/12/2020] 19 https://www.esbnetworks.ie/network-capacity-map [Accessed: 30/03/2021]

Nurney
Fennagh
Ticknock
Kildavin
Clonmore
Clonegall
Tinryland
Ballyellin
Ballinkillin
Old Leighlin
Saint Mullins
Ballinabrannagh
Glynn
Bilboa
Ballon
Borris
Tullow
Carlow
Rathtoe
Myshall
Ardattin
Palatine
Rathvilly
Bennekerry
Tinnahinch
Carrigduff
Muinebheag
Hacketstown
Leighlinbridge
N80
N81
N78
N80
N80
N80
N80
N80
N80
N30
N11
N11
N11
N11
N11
NOTE:
Drawn By:Checked By:
Scale:Approved By:
Date:IPIP
@ A4CB
Project No.
File Ref:Client
Title Issue DetailsProject
Key Infrastructure and Material Assets within County Carlow
Carlow Renewable Energy Strategy
MDR1669Arc0001A02
Legend!( County Town!( District Town!( Smaller Towns!( Villages
Overhead Line Network220kV110kV38kVCSO Settlement EnvelopeAnaerobic Digestion WWTP
") Wastewater Treatment Plant#* Licensed Industrial Emissions Facility#* Licensed Waste Facility#* Licensed IPC Facility
MotorwayNational Primary RoadNational Secondary RoadMainline Rail
Figure 3.11. This drawing is the property of RPS Group Ltd. It is a confidential document and must not be copied, used, or its contents divulged without prior written consent.2. Ordnance Survey Ireland Licence ©Copyright Government of Ireland.
West Pier Business Campus,Dun Laoghaire,Co Dublin, Ireland.
Tel: +353 (0) 1 488 2900Email: [email protected] Web Page: rpsgroup.com/ireland
MDR1669
1:240,000
30/03/2021
EN 0005021
±
ESB Disclaimer: This map indicates the approximate location of ESB Networks Transmission (400kV, 220kV, 110kV, 38kV) andDistribution (20kV, 10kV, 230V/400V) underground cables and overhead lines in the general area of the proposed works. ESBNetworks takes no responsibility for the accuracy or completeness of these maps. Low voltage (230V/400V) service cables (e.g.house services, factory/shop services, public lighting lamp services, etc) are not included but their presence should beanticipated. The depths of underground cables must never be assumed. Additional more detailed information is available for highvoltage Transmission underground cables (38kV, 110kV, 220kV, 400kV) - for cables in the greater Dublin area call 01 6042957and for all other areas call 1850 372 757. No work should be carried out in the vicinity of 38kV or higher voltage undergroundcables without prior consultation with ESB Networks.Before any mechanical excavation is undertaken, the actual location of all underground electricity cables must be established andverified on site, using: (a) Up-to-date map records; (b) Cable locator equipment operated in both power and radio modes; (c)Careful hand digging of trial holes using 'Safe Digging Practice'. Refer also to 'HSA Code of Practice for Avoiding Danger fromUnderground Services'. ESB takes no responsibility and shall bear no liability in relation to any damage, injury/death or loss ofsupply as a result of damage or interference with its networks. Data Sources: Carlow County Council; EPA;
TII; ESB; SEAI; OSi.

!
!
!
!
!
!
!
!
!
!
!
!
!(
!(
!(
!(
!(
!(
!(
!(
!(
!(
!(
!(
!(
!(
!(
!(
!(
!(
!(
!(
!( !(!(
!
!
!
!
!
Carlo w
T ullo w
Muin eb hea g
Carrigduff
T in n a hin c h
Ha c ketsto wn
Mysha ll
R a thvilly
Leighlin b ridge
Bo rris
Ba llo n
Pa latin e
R a thto e
Ben n ekerry
Ardattin
Bilb o a
Glyn n
Clo n m o re
T in ryla n d
Nurn ey
Ba llin a b ra n n a gh
Old Leighlin
Fen n a gh
Clo n ega llKilda vin
Ba llin killin
Ba llyellin
S a in t Mullin s
T ic kn o c k
Shillelagh
EPA, OS I
NOTE:
Drawn By:Checked By:
Scale:Approved By:
Date:IPIP
@ A4CB
Project No.
File Ref:Client
Title Issue DetailsProject
Figure 3.2 Carlow Renewable Energy Strategy
MDR 1669Arc0005A02
Legend!( Co un ty T o wn!( Distric t T o wn!( S m a ller T o wn s!( Villa ges
ESB Substations! 110kV! 220kV!( 38kV
ESB Overhead Line Network220kV110kV38kV
Gas Transmission NetworkHigh Pressure tra n sm issio n pipelin esMedium Pressure: Distrib utio n PipeLo w Pressure: Distrib utio n PipeCS O S ettlem en t En velo pe
1. T his dra win g is the pro perty o f R PS Gro up Ltd. It is a c o n fiden tia l do c um en t a n d m ust n o t b e c o pied, used, o r its c o n ten ts divulged witho ut prio r written c o n sen t.2. Ordn a n c e S urvey Irela n d Lic en c e ©Co pyright Go vern m en t o f Irela n d.
W est Pier Busin ess Ca m pus,Dun La o gha ire,Co Dub lin , Irela n d.T el: +353 (0) 1 488 2900Em a il: irela n d@rpsgro up.c o m W eb Pa ge: rpsgro up.c o m /irela n d
MDR 1669
1:240,000
30/03/2021
EN 0005021
±
Data Sources: Carlo w Co un ty Co un c il, ES B, GNI
Electricity and Gas Networks
ES B Da ta Disc la im erT his m ap in dic a tes the a ppro xim ate lo c a tio n o f ES B Netwo rks T ra n sm issio n(400kV, 220kV, 110kV, 38kV) a n d Distrib utio n (20kV, 10kV, 230V/400V)un dergro un d c a b les a n d o verhea d lin es in the gen era l a rea o f the pro po sedwo rks. ES B Netwo rks ta kes n o respo n sib ility fo r the a c c ura c y o r c o m pleten esso f these m aps. Lo w vo lta ge (230V/400V) servic e c a b les (e.g. ho use servic es,fa c to ry/sho p servic es, pub lic lightin g la m p servic es, etc) are n o t in c luded b uttheir presen c e sho uld b e a n tic ipated. T he depths o f un dergro un d c a b les m ustn ever b e a ssum ed. Additio n a l m o re deta iled in fo rm atio n is a va ila b le fo r highvo lta ge T ra n sm issio n un dergro un d c a b les (38kV, 110kV, 220kV, 400kV) - fo rc a b les in the greater Dub lin area c a ll 01 6042957 a n d fo r a ll o ther a reas c a ll1850 372 757. No wo rk sho uld b e c a rried o ut in the vic in ity o f 38kV o r highervo lta ge un dergro un d c a b les witho ut prio r c o n sultatio n with ES B Netwo rks.Befo re a n y m ec ha n ic a l exc a vatio n is un derta ken , the a c tua l lo c a tio n o f a llun dergro un d elec tric ity c a b les m ust b e esta b lished a n d verified o n site, usin g:(a) Up-to -da te m a p rec o rds; (b ) Ca b le lo c a to r equipm en t o perated in b o thpo wer a n d ra dio m o des; (c) Ca reful ha n d diggin g o f tria l ho les usin g 'S a feDiggin g Pra c tic e'. R efer a lso to 'HS A Co de o f Pra c tic e fo r Avo idin g Da n gerfro m Un dergro un d S ervic es'.ES B ta kes n o respo n sib ility a n d sha ll b ear n o lia b ility in relatio n to a n yda m a ge, in jury/death o r lo ss o f supply as a result o f da m a ge o r in terferen c e
GNI Da ta Disc la im erT he in fo rm atio n c o n ta in ed in this m a p c o n c ern in g the lo c a tio n a n d tec hn ic a ldesign a tio n o f the ga s distrib utio n a n d tra n sm issio n n etwo rk (the “In fo rm atio n ”)is pro vided ‘as is’ a n d n o represen ta tio n o r wa rra n ty o f a n y kin d, express o rim plied, is m a de in rela tio n to the In fo rm a tio n a n d a ll suc h represen ta tio n s o rwarra n ties, express o r im plied, in relatio n to the In fo rm atio n a re hereb yexc luded to the fullest exten t perm itted b y la w. No respo n sib ility, lia b ility o rduty o f c a re to yo u o r to a n y o ther perso n in respec t o f the In fo rm atio n isa c c epted, a n d a n y relia n c e yo u o r a n y o ther perso n pla c es o n the In fo rm atio nis therefo re strictly at yo ur o wn o r their o wn risk. In n o even t will lia b ility b ea c c epted fo r a n y lo ss o r da m a ge in c ludin g, witho ut lim itatio n , in direct o rc o n sequen tia l lo ss o r da m a ge, arisin g o ut o f o r in c o n n ec tio n with the use o fthe In fo rm atio n . In the even t tha t the In fo rm a tio n is pro vided b y yo u, in who leo r in part, to a third party fo r whatever reaso n yo u sha ll en sure that thisdisc la im er is in c luded with the In fo rm atio n a n d b ro ught to the a tten tio n o f thethird party. T he a c tua l po sitio n o f the ga s distrib utio n a n d tra n sm issio nn etwo rk m ust b e verified o n site b efo re a n y m ec ha n ic a l exc a vatin g ta kespla c e. If a n y m ec ha n ic a l exc a vatio n is pro po sed, hard c o py m a ps m ust b erequested fro m Bo rd Ga is Eirea n n . All wo rk in the vic in ity o f the gasdistrib utio n a n d tra n sm issio n n etwo rk m ust b e c o m pleted in a c c o rda n c e withthe c urren t editio n o f the Hea lth & S a fety Autho rity pub lic a tio n , ‘Co de o fPra c tic e Fo r Avo idin g Da n ger Fro m Un dergro un d S ervic es’ whic h is a va ila b lefro m the Hea lth a n d S a fety Autho rity (1890 28 93 89) o r c a n b e do wn lo a dedfree o f c harge at www.hsa.ie.
Castlecomer

REPORT
MDR1669 | DRAFT CARLOW COUNTY RENEWABLE ENERGY STRATEGY | A03 | July 2021 rpsgroup.com Page 19
3.2 Gas Infrastructure The natural gas network in Ireland provides much of the country with a cleaner, more sustainable alternative to coal, peat and oil for heat and power. Natural gas can assist in the connection of variable renewable generation to the grid, acting as a back-up fuel. Carlow is connected to the gas transmission network in Ireland. The gas transmission grid is identified in Figure 3-2.
Gas Networks Ireland (GNI) has a strategic plan to achieve 20% Renewable Gas on the network by 2030. 20 Renewable gas is a carbon-neutral source of energy, with zero emissions. To achieve this target, GNI are currently working to introduce renewable gas to Ireland through the construction of injection facilities along the existing network. The first injection facility in Cush, County Kildare, has the capacity to supply renewable gas to 11,000 homes.21 There is potential to produce renewable biogas within Carlow using on-site or off-site anaerobic digestion (AD) at farms or industrial facilities. The intention would be that the biogas would be purified to natural gas standard at the AD site and collection logistics would be in place to transport the renewable gas to Central Grid Injection (CGI) facilities along the network. An alternative use for the biogas is on-site heat and electricity generation using a Combined Heat and Power (CHP) plant. 22 The viability of these opportunities should be fully assessed when the exact injection, processing plant locations and collection logistics are known.
Compressed Natural Gas (CNG) is an initiative that is particularly suitable for use in commercial vehicles. It is a proven alternative to diesel or petrol and reduces costs and carbon emissions. The first publicly accessible Compressed Natural Gas (CNG) opened at a facility at Dublin Port. This is the first in a network of 150 filling station to be developed in Ireland. Figure 3-3 maps the CNG refuelling stations and renewable gas injection facilities in Ireland. There are currently no CNG refuelling stations or injection facilities in Carlow.
20 The Future of Renewable Gas in Ireland (gasnetworks.ie)
21 https://www.gasnetworks.ie/corporate/news/active-news-articles/naturgy-biomethane/ [Accessed 09/02/2021 22 https://www.gasnetworks.ie/corporate/company/our-commitment/environment/renewable-gas/ [Accessed: 12/12/2020

REPORT
MDR1669 | DRAFT CARLOW COUNTY RENEWABLE ENERGY STRATEGY | A03 | July 2021 rpsgroup.com Page 20
Source: Gas Networks
Figure 3-3: CNG Refuelling Stations and CNG injection facilities in Ireland23
23 https://www.gasnetworks.ie/business/natural-gas-in-transport/cng-refuelling-stations/ [Accessed 09/02/2021]

REPORT
MDR1669 | DRAFT CARLOW COUNTY RENEWABLE ENERGY STRATEGY | A03 | July 2021 rpsgroup.com Page 21
3.3 Waste Infrastructure supporting the management and disposal of waste is required for development. There are licensed waste facilities in Tullow, Co. Carlow24 and on Kilkenny Road, Carlow25. The facility in Tullow is the Haroldstown Transfer Station. It ceased all waste intake and closed to the public in 2009.
The facility on Kilkenny Road is the Powerstown Landfill and Recycling Centre. In 2018, the site reached capacity and ceased to operate as a landfill and has since been operating as a Civic Amenity Site accepting waste material, recyclables from the public and small businesses. The Powerstown Landfill and Recycling Centre is an Industrial Emissions Directive (IED) facility.
O’Toole Composting Facility provides a composting service for food and organic waste for various industry sectors, including: restaurants, food production companies and hotels. The company operates bulk food waste recycling at the composting facility at Ballintrane on the Wexford Road, Co. Carlow.
3.4 Transport Transport infrastructure is an important consideration for the development of renewable energy technologies. Access roads capable of accommodating heavy duty vehicles are required for the construction, operation, and decommissioning phases of developments.
The Carlow County Development Plan 2022-2028 identifies the M9 Motorway route that traverses through County Carlow as a strategic opportunity for the County. The N80, national Secondary Route, links Rosslare to the M9 midlands and is classified as a Euroroute E-01. This Euroroute has previously been identified as a priority in the South-East Regional Planning Guidelines and TII policy documents.26
Transport investment in the region aims to expand attractive public transport and other alternatives to car transport. A shift away from private car to greater use of active travel (walking and cycling) and public transport (e.g. bus)27. Carlow has a limited public transport network. Carlow town bus service will lead to more active transport in urban Carlow town. The north-west of the county contains a portion of the rail network with the Intercity rail line running through Carlow and Muine Bheag. The rest of the county is served by local buses. There are regional buses and private bus companies. Carlow may benefit from encouraging sustainable transport, including walking, cycling, emerging e-modes and public transport to accommodate
24 http://www.epa.ie/licences/lic_eDMS/090151b28047cbeb.pdf [Accessed: 09/12/2020] 25 http://www.epa.ie/licences/lic_eDMS/090151b280758219.pdf [Accessed: 09/12/2020] 26 National Planning Framework https://npf.ie/wp-content/uploads/2017/09/0391-Carlow-County-Council.compressed.pdf [Accessed 23/03/2021]
27 Sustainable-Tranport-on-National-Road-Schemes.pdf [Accessed: 05/04/2021]
Powerstown Landfill – Carlow County Council in partnership with 3CEA In accordance with the Carlow County Council Climate Change Adaptation Strategy 2019-2024 objective RM Including Powerstown Civic Amenity Site, Carlow County Council are investigating the potential to develop the capped Powerstown Landfill site to generate revenue streams through exporting electricity generated on site. Carlow County Council commissioned 3 Counties Energy Agency (3CEA) to investigate and report the feasibility of solar photovoltaics at the site, with integration to the national grid’s Enduring Grid Connection Policy ECP-2 and to complete a separate application to SEAI for grant assistance under SEAI’s Project Assistance Grant (PAG). The landfill site has been closed and capped since 2019 and has no post closure restrictions which makes it a plausible site for development. However, the feasibility of a large-scale solar PV development at the site is affected by the solar resource, available area for an array, electricity network connection point and government incentives.

REPORT
MDR1669 | DRAFT CARLOW COUNTY RENEWABLE ENERGY STRATEGY | A03 | July 2021 rpsgroup.com Page 22
the necessary switch from the private car. However, given the dispersed distribution of the population in Carlow, the provision of public transport outside of the larger urban centres in considered a significant challenge.
Under the Carbon Tax Fund 2020 and as part of a Barrow Valley Greenway Initiative, the Council received funding in 2020 to investigate the feasibility of developing a greenway in the County utilising the route of the disused Carlow to Wexford railway line. The old railway line runs south from Muine bheag to Borris, where it crosses the Borris Railway Viaduct and then continues south to Wexford. The development of such a greenway, if viable, would significantly boost the appeal of tourism in the County and provide possibilities for linkages with similar infrastructure in adjoining counties28.. The potential greenway would allow walkers and cyclists to make use of the County’s scenic areas. The greenway network would encourage walking and cycling and could have significant tourism potential for Carlow.
3.5 Energy Storage Heat and power demand vary constantly and must be matched with sufficient generation. While methods of conventional generation using fossil fuels can be scaled to match demand, renewable energy technologies typically have more variable outputs, dependent on the availability of resources. As more renewable energy is introduced to the network, grid stability becomes a challenge. If generation from renewables is low during a period of higher demand, fossil fuel plants must be scaled up to compensate. In contrast, during times of high renewable energy production, there may be insufficient demand to allow for full exploitation of the resource, leading to a wasted opportunity to generate more clean energy.
One solution to the challenges faced due to the variability of renewable energy is energy storage. This involves storing the excess energy produced during times of low demand to be used at a later stage when demand is higher. The electrical energy is typically converted to a more easily and economically stored form, such as potential or thermal energy, and converted back to electrical energy as required. Emphasis is being placed on the development of energy storage technologies, with some viable options available.
Energy storage projects have reached 2.1GW in Ireland in 2020. These facilities provide energy services to the national grid. Developing energy storage in Carlow would allow the county to maximise the potential of its natural resources.
3.5.1 Battery Storage
Battery storage has increased in Ireland in part by intermittent energy sources such as solar and wind. It involves converting the electrical energy to chemical energy. ESB offer an opportunity for large businesses to install battery storage on-site, a method of demand-side storage. This provides a back-up power supply and reduces costs by charging the battery during periods of low electricity prices. Batteries can also be employed on the generation side of the network, creating hybrid systems with renewable energy technologies to store excess generation.
The increased uptake of electric vehicles has sparked research into their potential as energy storage devices. By keeping the vehicle connected to the grid when not in use, the battery could be charged at times of low demand and could send electricity back to the grid when required to meet higher demands. However, the degradation of the battery with extra charging and discharging is a limitation.
3.5.1.1 Current, Planned, and Contracted Developments
There are no existing battery storage facilities in the county. There is one permitted battery storage facility that will help balance the energy supply for the benefit of the local region and economy. The battery storage facility is considered to be in support of national and regional renewable energy policy objectives. Table 3-2 outlines planned battery storage development in Carlow, and this is indicated on Figure 6-2.
28 Carlow County Council Development Plan 2022-2028

REPORT
MDR1669 | DRAFT CARLOW COUNTY RENEWABLE ENERGY STRATEGY | A03 | July 2021 rpsgroup.com Page 23
Table 3-1: Current, planned and contracted battery storage developments
Name Status Date of Connection Maximum Capacity (MW)
Kellistown East Battery Storage Facility
Permitted n/a 100
3.5.2 Thermal Storage
Electrical energy can also be converted to thermal energy for storage. For example, excess electricity can be used to freeze or chill water, which can be stored in a tank and later used to cool the building. Solar thermal technology can be combined with a storage tower or trough to store the heat collected until it is required.
3.6 Environmental Considerations
3.6.1 Biodiversity
The potential impact of proposed renewable energy developments on flora and fauna in the immediate and surrounding area must be assessed to ensure that there are no adverse effects on nature and wildlife. The designated areas for protection in Carlow have been listed in Table 3-3 and mapped.
There are three Special Areas of Conversation (SACs) in Carlow, there are no Special Protection Areas (SPAs) in the Carlow. Together SACs and SPAs make up the Natura 2000 network across the European Union, incorporating both terrestrial and marine areas (see Figure 3-4). The SACs are conservation areas protecting wildlife habitats and species outlined in the Habitats Directive. The SPAs are designated under the Birds Directive and protect migratory birds and threatened species.
In Ireland, the basic designation for wildlife is the Natural Heritage Area (NHA). These areas are important for habitats present or hold species of plants and animal whose habitats need protection, There are 630 proposed NHAs (pNHAs), which are published but have not been statutorily proposed or designated.29 There are nine pNHAs in Carlow.
Table 3-2: Designated sites in Carlow
Site Code Site Name
002162 River Barrow and River Nore SAC 000770 Blackstairs Mountains SAC and pNHA 000781 Slaney River Valley SAC and pNHA 000698 Barrow River Estuary pNHA 000788 Ardristan Fen pNHA 000792 Baggots Wood pNHA 000797 Ballymoon Esker pNHA 000806 Cloghristick Wood pNHA 000808 Johns Hill pNHA 000810 Oak Park pNHA
3.6.2 Noise
There is potential for noise impacts during the construction, operation, and decommissioning stages of renewable energy developments. Receptors in the surrounding area, particularly sensitive receptors such as schools and hospitals, should be identified and assessed for their susceptibility to environmental noise. Measures can then be put in place to prevent or reduce noise emissions and their impact on receptors.
29 NPWS Proposed Natural Heritage Areas

REPORT
MDR1669 | DRAFT CARLOW COUNTY RENEWABLE ENERGY STRATEGY | A03 | July 2021 rpsgroup.com Page 24
3.6.3 Landscape and Visual
Preservation of landscape character and visual amenity should be considered when planning renewable energy developments, as specified in the Planning and Development Act 2000. The Landscape Character Assessment for Carlow groups and maps the landscapes of the County into four major Landscape Character Areas (LCA), and includes detailed recommendations for their management, protection and conservation (see Table 3-3 and Figure 3-5). Table 3-3: Principle Landcape Character Areas in Carlow
Principle Landscape Character Areas
Blackstairs and Mount Leinster Uplands Central Lowlands
Killeshin Hills River Slaney – East Rolling Farmland
Throughout the county there are designated Areas of Outstanding Natural Beauty and Areas of High Visual Amenity. It is important for local communities, the wider society and for the tourism industry that Carlow preserves the character of the landscape and the available views. Proposed renewable energy developments should be assessed for their impact on sensitive landscapes and measures put in place to minimise the impact on visual amenities within the county.
3.6.4 Built Heritage
Renewable energy developments should avoid adversely impacting the cultural heritage in the county. The architectural and archaeological protected structures, sites and areas within Carlow have been identified and mapped. The National Monuments Act established a list of Recorded Monuments and Places (RMP) that are of historical and archaeological significance. These sites are scattered throughout the county, with higher concentrations in the larger urban areas. A number of buildings in Carlow are included in the Record of Protected Structures (RPS) as being of special interest for historical, artistic, or other cultural reasons. Buildings constructed after 1700 are included in the National Inventory of Architectural Heritage (NIAH). In all cases, consent must be obtained to carry out works on or near these sites and limitations may apply to the extent of retrofit possible for protected structures.
Development within townlands may be constrained by designated Architectural Conservation Areas (ACAs) and the Zone of Archaeological Potential surrounding recorded monuments. Where necessary, an Archaeological Assessment can be undertaken to determine the type and extent of impacts of a development on protected structures or monuments. The aim is to harness the renewable energy potential of the area while preserving the architectural and archaeological heritage.
3.6.5 Air Quality and Climate
Renewable energy provides a cleaner alternative to conventional generation in terms of reduced impact on air quality and climate. Although the renewable energy generation itself does not typically produce harmful emissions or CO2, there is potential for such during the operating life cycle of the development. The construction, operation and decommissioning stages must be considered when assessing the impact of the development on air quality and climate, with projects aiming to minimise the release of CO2. Elements such as vehicle emissions, material supply and reuse and disposal of waste offer opportunities for carbon savings to be made.

!
!
!
!
!
!
!
!
!
!
!
!
!(
!(
!(
!(
!(
!(
!(
!(
!(
!(
!(
!(
!(
!(
!(
!(
!(
Blackstairs Mountains SAC
Wicklow Mountains SAC
River Barrow And River Nore SAC
Slaney River Valley SAC
Holdenstown Bog SAC
Thomastown Quarry SAC
Blackstairs Mountains
Slaney River Valley
Barrow River Estuary
John's Hill
Ardristan Fen
Oakpark
Ballymoon Esker
Cloghristick Wood
Baggot's Wood
EPA, OSI
NOTE:
Drawn By:Checked By:
Scale:Approved By:
Date:IPIP
@ A4CB
Project No.
File Ref:Client
Title Issue DetailsProject
Designated Nature SitesCarlow Renewable Energy Strategy
MDR1669Arc0002A02
Legend!( County Town
!( District Town!( Smaller Towns!( Villages
Special Area of Conservation (SAC)
Proposed Natural Heritage Area (pNHA)
CSO Settlement Envelope
1. This drawing is the property of RPS Group Ltd. It is a confidential document and must not be copied, used, or its contents divulged without prior written consent.2. Ordnance Survey Ireland Licence ©Copyright Government of Ireland.
West Pier Business Campus,Dun Laoghaire,Co Dublin, Ireland.
Tel: +353 (0) 1 488 2900Email: [email protected] Web Page: rpsgroup.com/ireland
MDR1669
1:240,000
31/03/2021
EN 0005021
±
Data Sources: Carlow County Council; NPWS; EPA;
Figure 3.4

12
3
4
5 67
89 10
1112
13141516
17
18
1921
202223
2425
26
272830
29
31
32
33
3435 36
3738
3940
4142
43
44
45
46
47
4849
5051
55 5352
54
56
5758
59
6061
62
63
64
4
318
12
1721
22
1
9
19
6
2
20
57
14
24
11
15
8
25
13
10
16
23
EPA, OSI
NOTE:
Drawn By:Checked By:
Scale:Approved By:
Date:IPIP
@ A4CB
Project No.
File Ref:Client
Title Issue DetailsProject
Figure 3.5 Carlow Renewable Energy Strategy
MDR1669Arc0006A02
LegendView PointsScenic Routes
Principal Landscape Character AreasBlackstairs and Mount Leinster UplandsCentral LowlandsKilleshin HillsRiver Slaney - East Rolling Farmland
1. This drawing is the property of RPS Group Ltd. It is a confidential document and must not be copied, used, or its contents divulged without prior written consent.2. Ordnance Survey Ireland Licence ©Copyright Government of Ireland.
West Pier Business Campus,Dun Laoghaire,Co Dublin, Ireland.
Tel: +353 (0) 1 488 2900Email: [email protected] Web Page: rpsgroup.com/ireland
MDR1669
1:240,000
07/04/2021
EN 0005021
±
Data Sources: Carlow County Council
Landscape Character Areas, Views and Scenic Routes

REPORT
MDR1669 | DRAFT CARLOW COUNTY RENEWABLE ENERGY STRATEGY | A03 | July 2021 rpsgroup.com Page 27
4 ECONOMIC BENEFITS OF RENEWABLE ENERGY 4.1 Introduction The uptake of renewable energy technologies offers economic as well as environmental benefits for the local community and the wider area. Renewable energy adds to the indigenous energy supply in Ireland, improving trade balances and Gross Domestic Product (GDP) by reducing reliance on imports. The estimated amount of CO2 avoided through the use of renewable energy increased by 395% over the period 2005 – 2019, reaching 5,838 kt CO2 in 2019. Wind energy avoided majority of emissions, at 3,879 kt CO2 in 2019, followed by bioenergy at 1,394 kt CO2, hydro at 367 kt CO2, ambient heat at 146 kt CO2 and solar at 52 kt CO2.30 Renewable energy offers opportunities for both domestic and foreign direct investment in the country.
4.2 National Context One of the main economic benefits to the local community is job creation. Renewable energy developments can lead to increased employment on three levels: direct, indirect, and induced employment. Direct jobs are those involved in the manufacturing, construction, installation, operation, maintenance and decommissioning of the technologies, while indirect jobs are those associated with the supply chain. Although more difficult to quantify, renewable energy developments also create induced jobs in the wider economy as a result of increased consumption.
As of 2018 renewable energy is estimated to be responsible for 6,988 (combined direct and indirect) jobs in Ireland. On average, across all technologies, this equates to approximately 1.8 jobs created per megawatt (MW) of installed capacity. Wind energy accounted for 4,200 of those jobs, a share of approximately 60%. Solid biofuels resulted in the highest rate of employment per unit installed capacity, with 37.8 jobs created per megawatt output. This is due to the more labour-intensive nature of the sector and the required feedstock production. With solar photovoltaic (PV) expected to grow in Ireland, the current rate of 3.4 jobs created per megawatt of installed capacity presents an opportunity for substantial economic benefit. Consideration of induced employment would increase these rates further.
As illustrated in Table 4-1 most of the jobs created from renewable energy come from fuel supply, namely bioenergy feedstocks, manufacturing and installation.31 Solar PV has created the most employment worldwide to date, over 32% of the direct and indirect jobs from renewable energy. It has been reported that solar PV creates at least twice the number of jobs per unit electricity generated compared to coal or natural gas.31 The International Renewable Energy Agency (IRENA) reported that the shift towards renewable energy has resulted in job creation in the renewable sector that more than offsets the accompanying job loss in the fossil fuel industry.32
30 https://www.seai.ie/publications/Energy-in-Ireland-2020.pdf 31 IRENA Renewable Energy Benefits: Measuring the Economics (2016) 32 IRENA Renewable Energy Benefits: Understanding the Socio-Economics

REPORT
MDR1669 | DRAFT CARLOW COUNTY RENEWABLE ENERGY STRATEGY | A03 | July 2021 rpsgroup.com Page 28
Table 4-1: Direct and Indirect Job Creation from Renewable Energy in Ireland 2018
Technology Installed Capacity 2018 (MW)
Number of Jobs (Direct & Indirect)
Number of Jobs/ MW Installed
All Renewable Energy 3,890 6,988 1.8 All Wind Energy 3,518 4,200 1.2 All Bioenergy 106 2,100 19.8 Solid Biofuels 45 1,700 37.8 Biogas 62 300 4.9 Renewable Hydropower 237 200 0.8 Geothermal Energy – 188 – Renewable Municipal & Industrial Waste
39 100 2.6
Solar PV 29 100 3.5
Source: IRENA
Table 4-2: Direct and Indirect Job Creation from Renewable Energy Worldwide 2018
Technology Installed Capacity 2018 (MW)
Number of Jobs (Direct & Indirect)
Number of Jobs/ MW Installed
All Renewable Energy 2,350,755 10,343,200 4.4 All Wind Energy 563,726 1,148,161 2.0 All Biofuels 115,731 3,090,192 26.7 Solid Biofuels 95,687 779,502 8.1 Biogas 17,692 344,253 19.5 Renewable Hydropower 1,171,612 1,803,748 1.5 Geothermal Energy 13,329 93,297 7.0 Renewable Municipal & Industrial Waste 12,624 27,840 2.2
Solar PV 480,356 3,365,294 7.0
Source: IRENA
A typical 50 MW solar PV development is estimated to require 229,055 person-days from planning through to decommissioning. Aside from the manufacturing of the panels, 22% of the required person-days, the remaining work can be sourced within Ireland. Installation of the solar PV panels account for 17% of the direct employment required, while operation and maintenance make up 56%. A wind farm of the same capacity requires 144,420 person-days, with 30% for installation and 43% for operation and maintenance, which can be sourced internally.32 Other opportunities for local employment exist during planning, transport and decommissioning. Community benefit can be maximised through localisation of the value chain where possible, ensuring that a portion of the revenue flows to the host areas.
The bioeconomy is a multifaceted sector of many occupations which includes but not limited to agriculture, forestry, and fisheries, food and beverage manufacturing, as well as bioenergy.33 In 2020, Teagasc released a series of maps, communicating the bioeconomy in Ireland. The share of the workforce employed in the bioeconomy indicates Cavan as having the highest share (15.1%) of the labour force working in the bioeconomy. The share of the labour force working in Carlow is 7% – 9.9%.
33 https://www.teagasc.ie/news--events/news/2020/bioeconomy-through-maps.php
REPORT
MDR1669 | DRAFT CARLOW COUNTY RENEWABLE ENERGY STRATEGY | A03 | July 2021 rpsgroup.com Page 29
5 ENERGY EFFICIENCY AND CONSERVATION Renewable energy development will allow Carlow to generate cleaner, more sustainable energy, contributing to national and European targets. However, renewable energy alone cannot fully combat the issues of climate change and depleting fossil fuel supplies. Energy efficiency and conservation are of equal importance and are vital if Carlow is to achieve a carbon neutral future. Generating energy through renewable energy sources must be complimented by efforts to reduce energy demand and waste.
Energy efficiency involves using less energy to perform the same task. Although less energy is consumed, the same standard of product or service is achieved, thus it is the energy waste that is reduced. Ireland has a target of 20% energy savings through efficiency by 2030 and a more ambitious target of 33% in the public sector alone.34 35
Energy efficiency is typically improved through technology advancements and design improvements. It is then the responsibility of residents, business, and industries to invest in these technologies, which typically result in financial savings following an initial investment. The SEAI have identified measures that have the potential to provide energy efficiency savings of almost 25% of Ireland’s 2013 demand. Of these measures, both technical and behavioural, 75% will bring net financial savings in the long term.36 The remaining measures can be implemented with appropriate support and financial incentives. The sector with the greatest potential for energy efficiency savings is the residential buildings sector, followed by transport, commercial buildings, and industry.
The main opportunities in buildings are LED lighting, roof and solid wall insulation, efficient glazing, efficient appliances, and heating systems such as heat pumps or efficient boilers with heating controls. Industry can benefit in the long term from investing in the installation of Combined Heat and Power (CHP). Energy efficiency in the transport sector is driven by EU regulations and modal shifts.36
Energy conservation is behaviour that results in the use of less energy. Conservation is usually reliant on changes in human behaviour and increased awareness or smart monitoring and control technology. There are measures that can be taken to conserve energy whilst maintaining a satisfactory standard of living. For example, installing timers or smart heating controls, turning the temperature down by 1°C, switching off lights, appliances, and devices when not in use and maximising natural daylight. Once implemented, these measures can provide financial savings on the next energy bill, while also contributing to Carlow and Ireland’s targets. Although retrofit and energy efficient installations are vital if targets are to be achieved, it has been reported that to date, most of the savings have come from lower cost energy conservation measures.37
34 https://www.seai.ie/about/irelands-energy-targets/ [Accessed: 10/02/2021] 35 DCCAE National Energy Efficiency Action Plan for Ireland #4 2017-2020 36 https://www.seai.ie/resources/publications/Unlocking-the-Energy-Efficiency-Opportunity-Summary-for-Policymakers.pdf [Accessed 10/02/2021]
37 DC/CAE National Energy Efficiency Action Plan for Ireland #4 2017-2020

REPORT
MDR1669 | DRAFT CARLOW COUNTY RENEWABLE ENERGY STRATEGY | A03 | July 2021 rpsgroup.com Page 30
5.1 National Context The Department of Communications, Climate Action and Environment have published a National Energy Efficiency Action Plan (NEEAP) #4 2017-2020. This plan sets out Ireland’s progress to achieving our energy efficiency targets and details the measures that could be implemented to maximise savings. Achieving the 20% target would equate to 31,925 GWh of primary energy saved. The plan explores the residential, commercial, transport and public sector, detailing the strategies and policies in place to improve energy efficiency. Ireland has put in place an Energy Efficiency Obligation Scheme (EEOS) to deliver on these savings. Details on the EEOS are outlined in Section 0.
A Public Sector Energy Efficiency Strategy was published in 2017 detailing how the target of 33% energy efficiency savings could be met by 2020. Achieving this target would see the public sector save €246 million on energy spend and avoid 5.9 million tonnes of CO2 emissions between 2009 and 2020. The strategy highlights that most of the savings to date have been from behavioural changes, smarter energy use and some equipment upgrades. For the target to be met, progress must be made on a larger scale, such as the deep retrofit and renovation of buildings. The aim of the strategy is to promote greater effort in energy efficiency and energy management in the public sector, providing an example for other sectors to follow suit.
5.1.1 SEAI Programmes
The SEAI have programmes in place to support energy efficiency in homes, communities, and businesses. The Better Energy Homes Programme is designed to assist homeowners in reducing their energy consumption and achieving energy cost savings through financial incentives. Grants are available for
Tullow Area Office and Library, Co. Carlow – in partnership with 3CEA The heating and lighting at Tullow Area Office are a source of a large electricity demand. However, after successfully installing PV panels, the benefits and cost savings were clear. The 3 Counties Energy Agency (3CEA) through the Sustainable Energy Authority of Ireland’s Better Energy Communities (BEC) programme is helping by administering state-wide funding for energy efficiency and renewable energy projects.
As a result of ongoing projects like this, Carlow County Council has exceeded energy efficiency targets in Department group energy performance. The 2019 energy performance result is 31% more efficient than the baseline and on track for 2020 targets.

REPORT
MDR1669 | DRAFT CARLOW COUNTY RENEWABLE ENERGY STRATEGY | A03 | July 2021 rpsgroup.com Page 31
measures including attic and wall insulation, upgrading heating controls, solar thermal, heat pump systems and Building Energy Rating (BER). As of 2017, the scheme had supported over 457,000 individual energy efficiency measures by providing more than €200 million worth of grants for homeowners.37
For those in receipt of welfare payments, the SEAI offer a range of free energy efficiency upgrades for eligible homes. Rather than providing a cash grant, measures such as attic and wall insulation, draught proofing, lagging jackets and energy efficient lighting are provided free of charge. In 2017, the scheme had invested more than €175 million since its introduction, upgrading over 125,000 dwellings. The SEAI also offer a pilot programme with a Deep Retrofit Grant for older homes with a poor energy rating. These retrofit projects involve multiple energy efficiency upgrades amounting to over €30,000. Applications from homeowners for this programme are currently only accepted through an approved Service Provider38.
The SEAI Better Energy Communities Programme provides grant support for communities looking to achieve energy efficiency and reduce energy use by using a cross-sectoral approach throughout the community. The programme aims to combine buildings into one retrofit programme, making the process more efficient and cost effective. The project can involve residential housing, private and public sector non-residential buildings and commercial, voluntary and community organisations. SEAI estimate that a sum of €35 billion will be required over 35 years to make the existing housing stock low carbon by 204039. In 2020, the total grant funding offered is €18.7 million with a total of 25 projects. The combined energy credits saved amount to 181 Gwh. There is a limit of €1 million funding for each project, with a yearly budget of €28 million in total for 2021.40 As of 2016, the scheme has made significant investment I communities, upgrading more than over 15,000 homes and hundreds of community, private and public buildings, along with creating over 700 direct and indirect jobs around the country.35 Communities participating in this programme are encouraged to become a Sustainable Energy Community (SEC), a network supported by the SEAI that is focused on reducing energy consumption, improving energy efficiency and generating cleaner energy.
There are currently six SECs in Carlow namely, Leighlinbridge & Old Leighlinbridge SEC, Borris Community, Tullow & South Leinster Tennis & Sports Club, Ardattin Tidy Village, Borris and Carlow County SDG SEC.
Business Grants are also available from the SEAI, including Project Assistance Grants and the EXEED Certified Grant, which provide funding for businesses to implement measures to reduce energy use and improve efficiency.41 . The Accelerated Capital Allowance is a tax incentive encouraging energy saving technology. The Project Assistance Grant explores opportunities for reduction in energy use for companies that spend over €250,000 on energy bills. The SEAI have also collaborated with Teagasc to deliver a Dairy Farm Grant, allowing farmers to reduce costs and increase profitability through investing in energy efficient technology.
38 https://www.seai.ie/grants/home-energy-grants/deep-retrofit-grant/ [Accessed: 25/03/2021] 39 Deep Retrofit Scheme | Home Improvement Grants | SEAI [Accessed 25/03/2021] 40 https://www.seai.ie/grants/community-grants/ [Accessed: 25/03/2021] 41 https://www.seai.ie/grants/business-grants/ [Accessed: 25/03/2021]

REPORT
MDR1669 | DRAFT CARLOW COUNTY RENEWABLE ENERGY STRATEGY | A03 | July 2021 rpsgroup.com Page 32
Institute of Technology Carlow Climate action priorities are being factored into infrastructural planning for new buildings at Carlow IT. All new buildings will be required to comply fully with the most current version of Part L of the Building Regulations (2017 currently, known as the NZEB regulations) and all buildings will require an ‘’A’’ rated energy certificate. The buildings where possible will also be required to comply with a number of good practice sustainability requirements that go beyond the requirements of the Building Regulations. With regards to renewables in new buildings:
• A minimum of 20% of the buildings energy will be delivered by renewable means provided from onsite or nearby renewables (example heat pump and/or PV panels).
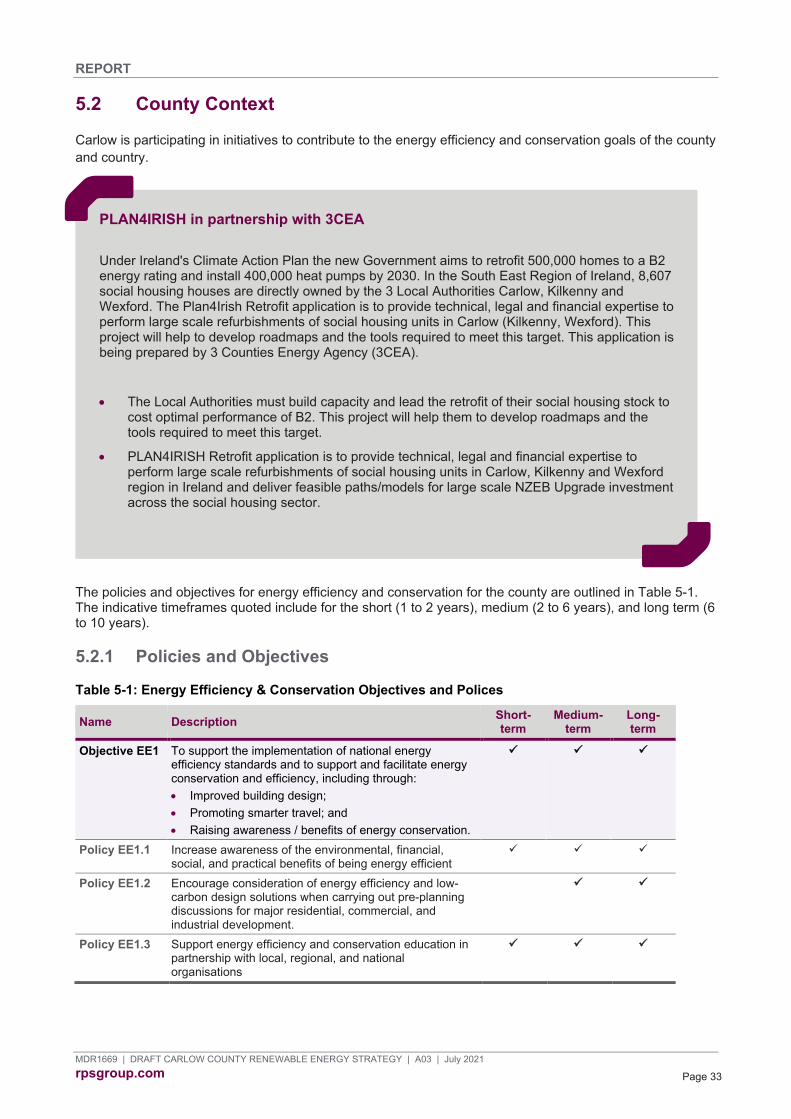
REPORT
MDR1669 | DRAFT CARLOW COUNTY RENEWABLE ENERGY STRATEGY | A03 | July 2021 rpsgroup.com Page 33
5.2 County Context
Carlow is participating in initiatives to contribute to the energy efficiency and conservation goals of the county and country.
The policies and objectives for energy efficiency and conservation for the county are outlined in Table 5-1. The indicative timeframes quoted include for the short (1 to 2 years), medium (2 to 6 years), and long term (6 to 10 years).
5.2.1 Policies and Objectives
Table 5-1: Energy Efficiency & Conservation Objectives and Polices
Name Description Short-term
Medium-term
Long-term
Objective EE1 To support the implementation of national energy efficiency standards and to support and facilitate energy conservation and efficiency, including through: • Improved building design; • Promoting smarter travel; and • Raising awareness / benefits of energy conservation.
Policy EE1.1 Increase awareness of the environmental, financial, social, and practical benefits of being energy efficient
Policy EE1.2 Encourage consideration of energy efficiency and low-carbon design solutions when carrying out pre-planning discussions for major residential, commercial, and industrial development.
Policy EE1.3 Support energy efficiency and conservation education in partnership with local, regional, and national organisations
PLAN4IRISH in partnership with 3CEA Under Ireland's Climate Action Plan the new Government aims to retrofit 500,000 homes to a B2 energy rating and install 400,000 heat pumps by 2030. In the South East Region of Ireland, 8,607 social housing houses are directly owned by the 3 Local Authorities Carlow, Kilkenny and Wexford. The Plan4Irish Retrofit application is to provide technical, legal and financial expertise to perform large scale refurbishments of social housing units in Carlow (Kilkenny, Wexford). This project will help to develop roadmaps and the tools required to meet this target. This application is being prepared by 3 Counties Energy Agency (3CEA).
• The Local Authorities must build capacity and lead the retrofit of their social housing stock to cost optimal performance of B2. This project will help them to develop roadmaps and the tools required to meet this target.
• PLAN4IRISH Retrofit application is to provide technical, legal and financial expertise to perform large scale refurbishments of social housing units in Carlow, Kilkenny and Wexford region in Ireland and deliver feasible paths/models for large scale NZEB Upgrade investment across the social housing sector.
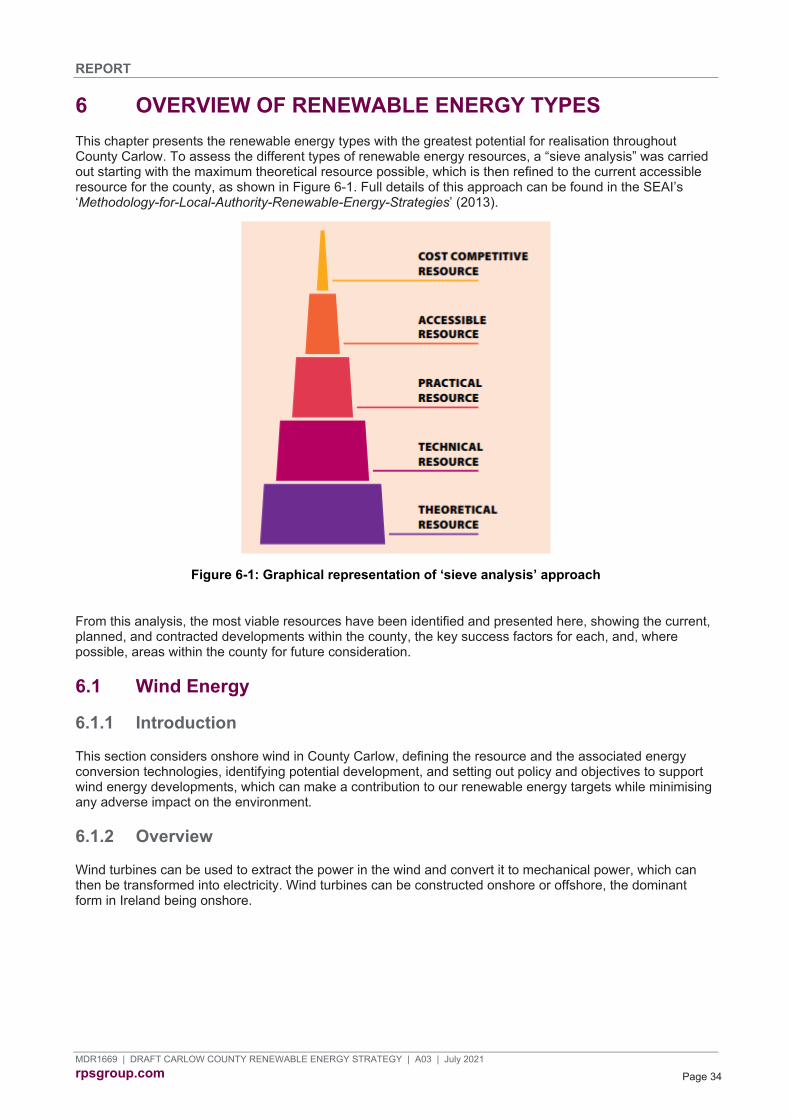
REPORT
MDR1669 | DRAFT CARLOW COUNTY RENEWABLE ENERGY STRATEGY | A03 | July 2021 rpsgroup.com Page 34
6 OVERVIEW OF RENEWABLE ENERGY TYPES This chapter presents the renewable energy types with the greatest potential for realisation throughout County Carlow. To assess the different types of renewable energy resources, a “sieve analysis” was carried out starting with the maximum theoretical resource possible, which is then refined to the current accessible resource for the county, as shown in Figure 6-1. Full details of this approach can be found in the SEAI’s ‘Methodology-for-Local-Authority-Renewable-Energy-Strategies’ (2013).
Figure 6-1: Graphical representation of ‘sieve analysis’ approach
From this analysis, the most viable resources have been identified and presented here, showing the current, planned, and contracted developments within the county, the key success factors for each, and, where possible, areas within the county for future consideration.
6.1 Wind Energy
6.1.1 Introduction
This section considers onshore wind in County Carlow, defining the resource and the associated energy conversion technologies, identifying potential development, and setting out policy and objectives to support wind energy developments, which can make a contribution to our renewable energy targets while minimising any adverse impact on the environment.
6.1.2 Overview
Wind turbines can be used to extract the power in the wind and convert it to mechanical power, which can then be transformed into electricity. Wind turbines can be constructed onshore or offshore, the dominant form in Ireland being onshore.
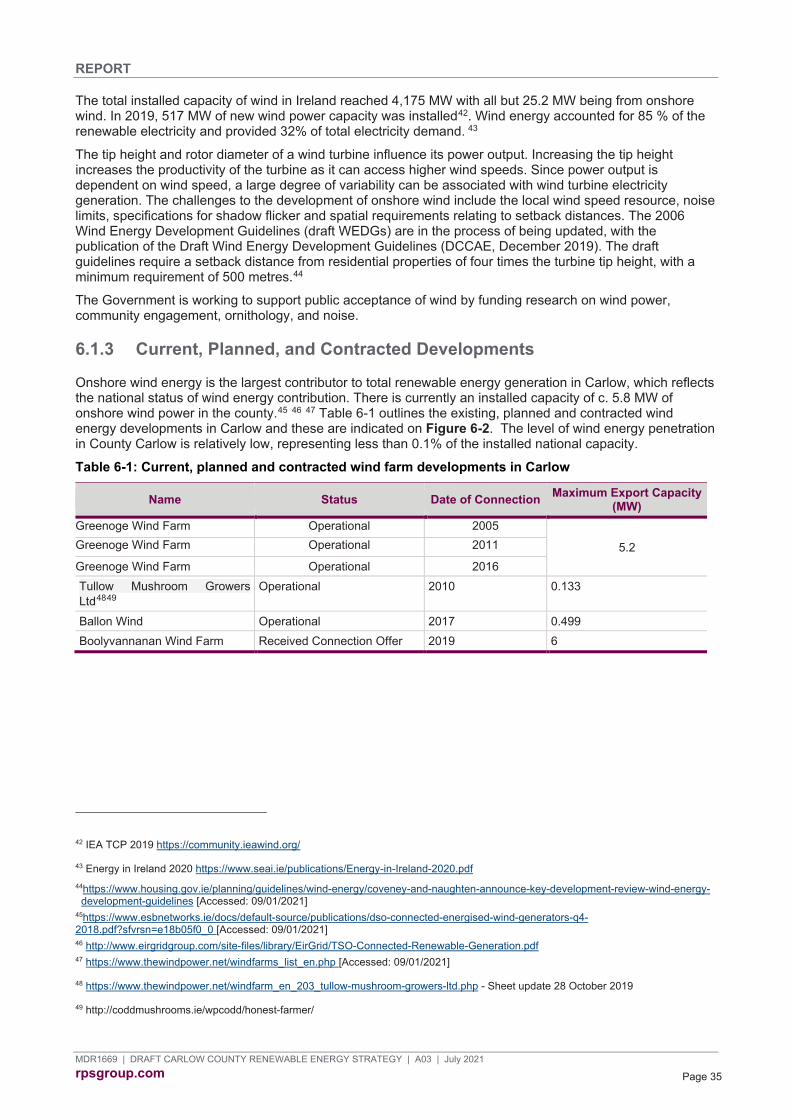
REPORT
MDR1669 | DRAFT CARLOW COUNTY RENEWABLE ENERGY STRATEGY | A03 | July 2021 rpsgroup.com Page 35
The total installed capacity of wind in Ireland reached 4,175 MW with all but 25.2 MW being from onshore wind. In 2019, 517 MW of new wind power capacity was installed42. Wind energy accounted for 85 % of the renewable electricity and provided 32% of total electricity demand. 43
The tip height and rotor diameter of a wind turbine influence its power output. Increasing the tip height increases the productivity of the turbine as it can access higher wind speeds. Since power output is dependent on wind speed, a large degree of variability can be associated with wind turbine electricity generation. The challenges to the development of onshore wind include the local wind speed resource, noise limits, specifications for shadow flicker and spatial requirements relating to setback distances. The 2006 Wind Energy Development Guidelines (draft WEDGs) are in the process of being updated, with the publication of the Draft Wind Energy Development Guidelines (DCCAE, December 2019). The draft guidelines require a setback distance from residential properties of four times the turbine tip height, with a minimum requirement of 500 metres.44
The Government is working to support public acceptance of wind by funding research on wind power, community engagement, ornithology, and noise.
6.1.3 Current, Planned, and Contracted Developments
Onshore wind energy is the largest contributor to total renewable energy generation in Carlow, which reflects the national status of wind energy contribution. There is currently an installed capacity of c. 5.8 MW of onshore wind power in the county.45 46 47 Table 6-1 outlines the existing, planned and contracted wind energy developments in Carlow and these are indicated on Figure 6-2. The level of wind energy penetration in County Carlow is relatively low, representing less than 0.1% of the installed national capacity.
Table 6-1: Current, planned and contracted wind farm developments in Carlow
Name Status Date of Connection Maximum Export Capacity (MW)
Greenoge Wind Farm Operational 2005
5.2 Greenoge Wind Farm Operational 2011
Greenoge Wind Farm Operational 2016 Tullow Mushroom Growers Ltd4849
Operational 2010 0.133
Ballon Wind Operational 2017 0.499 Boolyvannanan Wind Farm Received Connection Offer 2019 6
42 IEA TCP 2019 https://community.ieawind.org/
43 Energy in Ireland 2020 https://www.seai.ie/publications/Energy-in-Ireland-2020.pdf 44https://www.housing.gov.ie/planning/guidelines/wind-energy/coveney-and-naughten-announce-key-development-review-wind-energy-development-guidelines [Accessed: 09/01/2021]
45https://www.esbnetworks.ie/docs/default-source/publications/dso-connected-energised-wind-generators-q4-2018.pdf?sfvrsn=e18b05f0_0 [Accessed: 09/01/2021] 46 http://www.eirgridgroup.com/site-files/library/EirGrid/TSO-Connected-Renewable-Generation.pdf 47 https://www.thewindpower.net/windfarms_list_en.php [Accessed: 09/01/2021]
48 https://www.thewindpower.net/windfarm_en_203_tullow-mushroom-growers-ltd.php - Sheet update 28 October 2019
49 http://coddmushrooms.ie/wpcodd/honest-farmer/
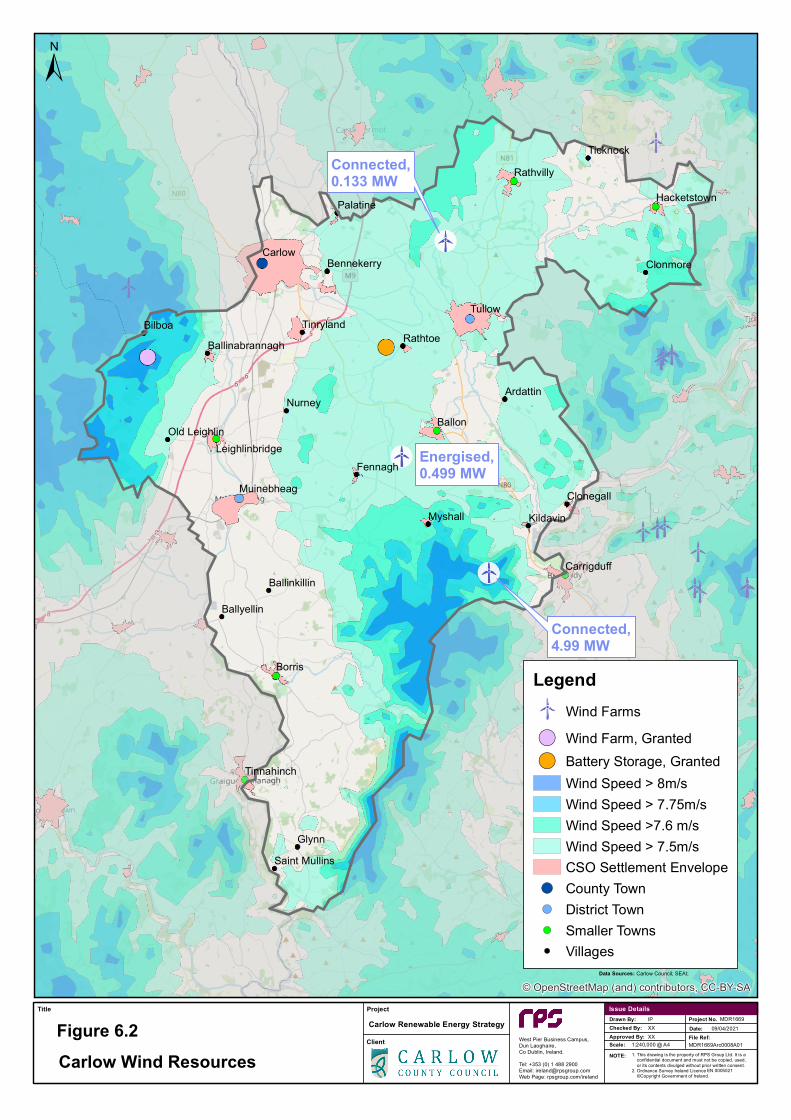
Carlow
Tullow
Muinebheag
Carrigduff
Tinnahinch
Hacketstown
Myshall
Rathvilly
Leighlinbridge
Borris
Ballon
Palatine
Rathtoe
Bennekerry
Ardattin
Bilboa
Glynn
Clonmore
Tinryland
Nurney
Ballinabrannagh
Old Leighlin
Fennagh
Clonegall
Kildavin
Ballinkillin
Ballyellin
Saint Mullins
Ticknock
© OpenStreetMap (and) contributors, CC-BY-SA
NOTE:
Drawn By:Checked By:
Scale:Approved By:
Date:IPXX
@ A4XX
Project No.
File Ref:Client
Title Issue DetailsProject
Figure 6.2 Carlow Renewable Energy Strategy
MDR1669Arc0008A01
LegendWind Farms
!( Wind Farm, Granted
!( Battery Storage, GrantedWind Speed > 8m/sWind Speed > 7.75m/sWind Speed >7.6 m/sWind Speed > 7.5m/sCSO Settlement Envelope
!( County Town!( District Town!( Smaller Towns!( Villages
1. This drawing is the property of RPS Group Ltd. It is a confidential document and must not be copied, used, or its contents divulged without prior written consent.2. Ordnance Survey Ireland Licence ©Copyright Government of Ireland.
West Pier Business Campus,Dun Laoghaire,Co Dublin, Ireland.
Tel: +353 (0) 1 488 2900Email: [email protected] Web Page: rpsgroup.com/ireland
MDR1669
1:240,000
09/04/2021
EN 0005021
±
Data Sources: Carlow Council; SEAI;
Carlow Wind Resources
Connected,0.133 MW
Energised,0.499 MW
Connected,4.99 MW

REPORT
MDR1669 | DRAFT CARLOW COUNTY RENEWABLE ENERGY STRATEGY | A03 | July 2021 rpsgroup.com Page 37
6.1.4 Key Success and Failure Factors
There are several factors contributing to the failure of past planning applications for wind farms in Carlow. Primarily, they have been rejected on the basis that they would interfere with the landscape and visual amenities.
6.1.5 Potential Resource
The approach to identifying the wind energy potential is summarised in below.
Technical Analysis and Mapping Exercise The calculation of available wind resource for Carlow has been undertaken having regard to the draft WEDGs 2019 and its specific planning policy requirements (SPPR’s). The analysis includes the following steps, illustrated by the mapping set out below.
• Wind Speed – using data presented in the SEAI Wind Energy Atlas, wind speed contours for the County have been plotted (see Figure 6-2).
• Environmental, Heritage and Amenity constraints - taking into account constraints posed by features such as European and Ramsar protected sites (also including waterbodies), settlements and existing infrastructure/ material assets, as discussed in Section 3, also taking into account natural physical attributes (such as groundwater vulnerability, geological heritage sites, soil drainage, landslide and flooding susceptibility)
• Available area > 5 km2 - taking into account the spatial requirements for large wind farm development • Separation distances from housing – taking into account the mandatory setback distance of 500m from
all sensitive receptors as per the draft 2019 WEDGs • This mapping exercise does not take into account landscape and visual capacity constraints
Figure 6-3 shows those areas in dark blue that are available >5km2, taking into account constraints posed by features described above. The turquoise areas represent the available areas for smaller wind farms where the minimum areal size of 5km2 is removed.
The technical mapping exercise in and of itself does not support nor preclude wind energy development. It is a tool which flags areas of having a higher or lower concentration/ distance from various sensitive receptors.
The total available capacity for onshore wind energy development for Carlow from these identified areas is therefore estimated and provided in Table 6-2. If only areas which have a viable wind speed greater than 7.6 m/s are considered (related to a typical turbine with a tip height of 175m), the maximum theoretical wind capacity potential for Carlow would be 1785.7 MW. Once constrained areas are excluded, the maximum wind energy output for the remaining area is estimated to lie between 158 – 183 MW (430 – 500 GWh). However, in practice the full theoretical capacity is never delivered. A rule of thumb previously employed is that 10% of theoretical capacity might eventually be delivered. If this is applied, the capacity that is available at an assumed delivery rate of 10% is 18.3 MW.50
Table 6-2: Estimated available capacity for onshore wind energy in Carlow
Scenario Area Available (km2)
Capacity Available (MW)
Assumed Capacity Factor for Tip Height
175m
Capacity Output Potential (GWh)
Capacity Available (MW) at
Assumed Delivery Rate of
10% Available Areas > 5 km2 within Co. Carlow
15.8 157.7 36.66% 430.4 15.8
Available Areas > 500m from housing in Co. Carlow
18.3 183.4 36.66% 500.5 18.3
50 Based on the following assumptions: Mandatory setback distance of 500m imposed on wind turbines from domestic dwellings; then All Risk areas Excluding SPA, SAC, RAMSAR, gives the available area. This is multiplied by a Wind Capacity Intensity (MW per km²) of 10%, giving the available capacity. The wind Capacity Intensity assumption of 10% was provided to RPS by the SEAI based on previous research and on industry reports set out in a previous study undertaken by RPS for the SEAI (RPS, 2015. Wind Turbine Noise Modelling). The 10% delivery rate is a figure based on the planning success rate of previous applications, also agreed with the SEAI as part of RPS’s Noise Modelling work.
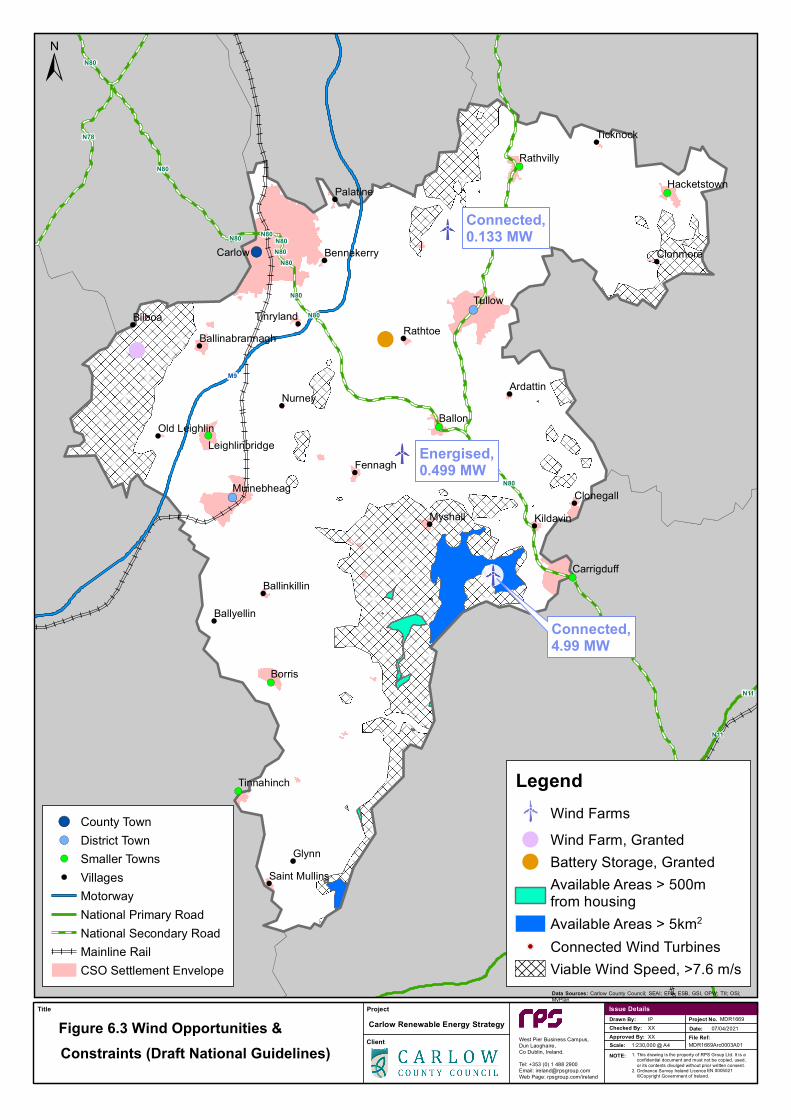
!
!
!
!
!
!
!
!
!
!
!
!
!(
!(
!(
!(
!(
!(
!(
!(
!(
!(
!(
!(
!(
!(
!(
!(
!(
M9
N11
N11
N11
N11
N11
N11N30
N80
N80N80N80 N80
N80
N80
N80
N80
N78
N81
N80
Carlow
Tullow
Muinebheag
Carrigduff
Tinnahinch
Hacketstown
Myshall
Rathvilly
Leighlinbridge
Borris
Ballon
Palatine
Rathtoe
Bennekerry
Ardattin
Bilboa
Glynn
Clonmore
Tinryland
Nurney
Ballinabrannagh
Old Leighlin
Fennagh
Clonegall
Kildavin
Ballinkillin
Ballyellin
Saint Mullins
Ticknock
NOTE:
Drawn By:Checked By:
Scale:Approved By:
Date:IPXX
@ A4XX
Project No.
File Ref:Client
Title Issue DetailsProject
Carlow Renewable Energy Strategy
MDR1669Arc0003A01
LegendWind Farms
! Wind Farm, Granted! Battery Storage, Granted
Available Areas > 500mfrom housingAvailable Areas > 5km2
! Connected Wind TurbinesViable Wind Speed, >7.6 m/s
1. This drawing is the property of RPS Group Ltd. It is aconfidential document and must not be copied, used, or its contents divulged without prior written consent.
2. Ordnance Survey Ireland Licence ©Copyright Government of Ireland.
West Pier Business Campus,Dun Laoghaire,Co Dublin, Ireland.
Tel: +353 (0) 1 488 2900Email: [email protected] Web Page: rpsgroup.com/ireland
MDR1669
1:230,000
07/04/2021
EN 0005021
±
Data Sources: Carlow County Council; SEAI; EPA. ESB, GSI, OPW; TII; OSi;MyPlan
Figure 6.3 Wind Opportunities & Constraints (Draft National Guidelines)
Connected,0.133 MW
Energised,0.499 MW
Connected,4.99 MW
!( County Town!( District Town!( Smaller Towns!( Villages
MotorwayNational Primary RoadNational Secondary RoadMainline RailCSO Settlement Envelope

REPORT
MDR1669 | DRAFT CARLOW COUNTY RENEWABLE ENERGY STRATEGY | A03 | July 2021 rpsgroup.com Page 39
6.1.5.1 Landscape and Visual Capacity
The Landscape Character Assessment for County Carlow was first produced in 2008, and then updated in 2015 as part of the County Development Plan review process. The revised (2015) document forms part of the Carlow County Development Plan 2016-2022.
As set out in Table 3-3 and Figure 3-5, the Landscape Character Assessment (LCA) for County Carlow identifies four principal landscape character areas for the County. Within the document, the characteristics of each of these landscape areas is set out. A further more refined identification of ’landscape types’ is also presented in the LCA. In Figure 4 of the 2015 document, a landscape sensitivity map is presented ranking these landscape areas on a scale of 1 (least sensitive) to 5 (most sensitive). Not surprisingly, the more elevated terrain in Carlow is considered more visually sensitive and tends to correspond with sensitivity rating ’5’ and ’4’. Designated ’Protected Views’ and ’Scenic Routes’ are also identified in the LCA (the original selection was updated with additional routes and views in 2015).
In relation to the potential capacity for different forms of development, the 2015 document briefly addresses potential for wind turbines in the context of the four principal landscape character areas (within pages 32-38). Table 6-3 below provides summary notes of the salient points.
Table 6-3: Summary of Principal Landscape Character Areas in Carlow Land Use Capacity Matrix Excerpts:
Mount Leinster - Blackstairs
Central lowlands
River Slaney - East Rolling Farmland
Killeshin Hills
Wind Farming Low
Moderate Moderate Moderate
Commentary within the text:
There is low capacity to absorb wind turbines, overhead cables and masts, particularly in the upland areas where they would detract from the scenery and visitors’ experience of ‘wilderness’. Possible exceptions to this may include limited plantation forestry and tourism-related activities, both passive and active. In both cases, applications for such development should be treated on their merits and mitigation measures may be required.
Whilst this area may be deemed to have a relatively high potential capacity to accommodate wind farming, it is acknowledged that the generally low-lying character of the area may reduce its suitability for wind turbines in terms of its wind resource.
Moderate to high potential capacity to accommodate coniferous plantations and extractive industry including wind turbines and biomass facilities, subject to siting conditions and appropriate mitigation measures. Moderate capacity to absorb extractive industry and wind farming
Subject to appropriate mitigation measures there may also be moderate scope to absorb extractive industry and wind farming. Overhead cables and masts would have to be selectively located, for example on farmed secondary ridges where the primary ridge would form the backdrop, or in the lowland farming area. Likewise wind turbines could be similarly sited subject to appropriate conditions relating to mitigation measures.
Implications for harnessing the wind energy resource in County Carlow When the LCA is considered alongside the wind resource opportunities and constraints (as mapped in Figure 6.3 above), a number of observations can be made.
• In the western area of the county, in the Killeshin Hills landscape character area, close to border with County Kilkenny, the wind speeds are favourable and there are no environmental designations that preclude wind farm construction. This landscape sensitivity in the area is ’5’, and ’moderate capacity’ for wind farms is indicated in the LCA (2015). However, the constraints mapping suggests that it may be difficult to meet separation distances between wind turbines and dwellings, due to the dispersed settlement pattern in the area.
• In the south-eastern area of the county, close to the border with County Wexford and County Wicklow, there is a sizeable upland area where the wind speeds are favourable and where constraints mapping suggests that adequate separation distances to dwellings would be available – see area in blue on

REPORT
MDR1669 | DRAFT CARLOW COUNTY RENEWABLE ENERGY STRATEGY | A03 | July 2021 rpsgroup.com Page 40
Figure 6-3 above. One wind farm is already operational in the general area. This area lies in the Mount Leinster – Blackstairs landscape character area. This landscape sensitivity in the area is ’5’, and ’low capacity’ for wind farms is indicated in the LCA (2015).
• A small area of the north eastern fringe of Carlow, adjacent to County Wicklow, also appears to havefavourable wind speeds. This forms part of the River Slaney – East Rolling Farmland. The landscapesensitivity in the area is ’4’, and ’moderate capacity’ for wind farms is indicated in the LCA (2015).However the constraints mapping suggests that it may be difficult to meet separation distances betweenwind turbines and dwellings, due to the dispersed settlement pattern in the area.
Potential for new wind farms is therefore affected by both technical factors (mainly achieving adequate separation distances and adequately sized land areas) and the need to protect landscape and visual amenity. Any proposals for new wind farms would need to include a more detailed site-specific assessment of both technical constraints and landscape/ visual amenity impacts, including potential to impact on the designated Protected Views and Scenic Routes in the County Development Plan.
6.1.5.2 Land Use Policy
The Landscape Character Assessment (LCA) for Carlow, groups and maps the landscapes of the County into four major Landscape Character Areas, and includes detailed recommendations for their management, protection, and conservation. The Landscape Character Areas were subject to a more detailed analysis to give recognition to specific landscape features through the further identification of Landscape Types. It is these specific features that often contain more significant and sensitive landscapes that are highly valued for scenery and amenity and include a large number of protected views, prospects and scenic routes. This includes the ‘Uplands’ Landscape Type of the LCA, where the elevated terrain is more visually sensitive and has the highest landscape sensitivity rating of 5, out of a rating scale of 1 to 5. Therefore, windfarm development in the more elevated ‘Uplands’ Landscape Type are designated ‘not normally be permissible’.
The land use policy is considered alongside the wind resource opportunities and constraints (see Figure 6-4). The following observations have been made:
• In the south-eastern area of the county, close to the border with County Wexford and County Wicklow, where the wind speeds are favourable and where constraints mapping suggests that adequate separation distances to dwellings would be available – see area in blue on Figure 6-3. The landscape type is ’Uplands’ , therefore potential for new wind farms is affected by the land use policy, which identifies that wind farms are not normally permissible in the ’Uplands’ Landscape Type of the Mount Leinster –Blackstairs Mountains LCA.
6.1.5.3 Extensions to existing wind farms
One way to further avail of the wind energy resource in the county is to extend existing wind farms by adding new turbines. A site by site analysis of potential for extensions has not been carried out for this RES.
6.1.5.4 Repowering existing wind farms
In addition to potential for new wind farms, Repowering is also a concept which will become more relevant as the national wind turbine fleet matures. Most wind turbines have an operational life of 20-25 years. Rather than decommissioning a wind farm in its entirety, repowering offers an opportunity to replace some or all turbines thereby extending the operating life of the wind farm. Repowering can result in a smaller number of higher-output turbines as the technology continues to advance. This potentially contributes to less environmental and economic impact, as improvements are made to an existing installation and are cheaper than new builds.51 Repowering is also a key strategy in the SEAI’s Wind Energy Roadmap 2011-2050 for driving onshore wind capacity growth from 2030 onwards.52
51 IWEA (October 2019). More Power to You: A Guide to Repowering in Ireland. https://www.iwea.com/images/files/repoweringes.pdf 52 SEAI Wind Energy Roadmap 2011-2050. https://www.seai.ie/publications/Wind_Energy_Roadmap_2011-2050.pdf

!
!
!
!
!
!
!
!
!
!
!
!
!(
!(
!(
!(
!(
!(
!(
!(
!(
!(
!(
!(
!(
!(
!(
!(
!(
M9
Carlow
Tullow
Muinebheag
Carrigduff
Tinnahinch
Hacketstown
Myshall
Rathvilly
Leighlinbridge
Borris
Ballon
Palatine
Rathtoe
Bennekerry
Ardattin
Bilboa
Glynn
Clonmore
Tinryland
Nurney
Ballinabrannagh
Old Leighlin
Fennagh
Clonegall
Kildavin
Ballinkillin
Ballyellin
Saint Mullins
Ticknock
NOTE:
Drawn By:Checked By:
Scale:Approved By:
Date:IPXX
@ A4XX
Project No.
File Ref:Client
Title Issue DetailsProjectFigure 6.4 Carlow Renewable Energy Strategy
MDR1669Arc0029A01
1. This drawing is the property of RPS Group Ltd. It is a confidential document and must not be copied, used, or its contents divulged without prior written consent.2. Ordnance Survey Ireland Licence ©Copyright Government of Ireland.
West Pier Business Campus,Dun Laoghaire,Co Dublin, Ireland.
Tel: +353 (0) 1 488 2900Email: [email protected] Web Page: rpsgroup.com/ireland
MDR1669
1:230,000
08/07/2021
EN 0005021
±
Data Sources: Carlow County Council; SEAI; TII; OSi;
Wind Opportunities & Constraints (Local Land Use Policy)
Connected,0.133 MW
Energised,0.499 MW
Connected,4.99 MW
!( County Town!( District Town!( Smaller Towns!( Villages
MotorwayNational Primary RoadNational Secondary RoadMainline Rail
LegendWind Farms
Viable Wind Speed >7.6 m/s
Landscape TypesBroad River Valley
Built Up Areas
Farmed Lowland
Farmed Ridges
Narrow River Valley
Rolling rough grazing
Uplands - Not Normally Permissible

REPORT
MDR1669 | DRAFT CARLOW COUNTY RENEWABLE ENERGY STRATEGY | A03 | July 2021 rpsgroup.com Page 42
There is less the 6MW of installed wind capacity in Carlow, in the 10-15-year age bracket. Therefore, repowering is unlikely to be a major means to deliver dramatic increases in renewable energy. Any proposal for repowering would need to be considered on its merits.
6.1.5.5 Potential Wind Resource Summary
Opportunites for new wind farms in lowland areas, extensions to existing wind farms and repowering of existing wind farms may be considered, but the environental constraints and visual and landscape sensitivity need to be carefully considered on a case by case basis. Table 6-4 includes a the utility scale wind resource summary for Carlow. Table 6-4 Utility Scale Wind Resource Summary in Carlow (to 2030)
Capacity (MW) Assumptions Installed Capacity 2020 6 N/A Potential from permitted sites, extensions and repowering
18 Permitted site 6MW, Extensions 6MW, Repowering 6MW
New Wind Farms 6 A small number of new wind farms is developed following County Carlow policies
Total 30 Overall working target 30MW by 2030
6.1.6 Policy and Objectives
Table 6-5 below outlines the objectives and supporting polices in relation to wind energy over the short (1 – 2 years), medium (2 – 6 years), and long term (6 – 10 years).
Table 6-5: Wind Energy Objectives and Polices
Name Description Short-term
Medium-term
Long-term
Objective W1 Increase the penetration of wind energy generation in County Carlow at appropriate location and scale.
Policy W1.1 Proposals for wind farm developments will be determined in accordance with National Wind Energy Development Guidelines and County Development Plan policy framework.
Policy W1.2 Support the re-powering of existing wind farms when they come to the end of their operational life, and extensions to existing wind farms, subject to assessment on a case by case basis.
Policy W1.3 Support community led wind energy developments or developments with innovative models for community ownership.

REPORT
MDR1669 | DRAFT CARLOW COUNTY RENEWABLE ENERGY STRATEGY | A03 | July 2021 rpsgroup.com Page 43
6.2 Solar Energy
6.2.1 Introduction
This section considers the solar energy resource in County Carlow, describing the resource and the associated energy conversion technologies, how it can be harnessed, and setting out policy and objectives to support solar energy developments, which can make a contribution to our renewable energy targets while minimising any adverse impact on the environment.
6.2.2 Overview
Solar energy technology harnesses the energy radiated from the sun that reaches the earth as visible light. This light can be categorised as direct and indirect depending on cloud cover and location. Solar energy can be used to produce electricity, heat, or hot water. There are two main categories of technologies that are suitable for installation in Ireland, solar thermal and solar photovoltaic (PV). In 2019 solar PV energy provided 0.07% of Ireland’s electricity generated, producing 21 GWh.53 In Ireland, solar thermal is generally considered to be suitable for smaller scale applications such as domestic hot water or to meet part of the demand in larger buildings.
6.2.3 Solar Photovoltaic
Solar photovoltaic (PV) technology exploits solar energy to produce electricity. This technology is typically deployed as panels made from a semiconductor, such as crystalline silicon, which absorb the light energy and produce electricity. The panels can work with both direct and indirect light, meaning that they will continue to generate electricity on overcast days. Solar PV panels can be rooftop-mounted for building applications or ground-mounted, such as those in solar farms.
Rooftop applications are typical in both domestic and non-domestic settings. The amount of electricity generated also depends on the solar resource, the location, orientation and tilt of the panels and the area covered. The maximum output will be achieved when facing due south, away from shading and at a tilt of 30°. A solar panel, on a clear, sunny day, will produce approximately 150 W per square metre. Strategically placed solar PV panels can provide over 40% of the electricity requirements of a typical domestic dwelling.54 There are also opportunities for the use of Building-integrated solar PV, where solar PV technology is built into materials such as roof tiles and windows.
Ground-mounted solar arrays, or solar farms, can deploy solar PV technology on a small, medium, or large scale. Solar PV panels are installed on rows of mounting systems, orientated and tilted to access the best resource possible. Each megawatt (MW) installed requires approximately 4 - 5 acres of land and 4,000 individual panels.54 Solar farms export the generated electricity to the grid and therefore the proximity to grid infrastructure must be considered. Other factors contributing to the suitability of a site include the solar resource, slope of the land, accessibility, and the potential for over shading.
Whereas very few solar farms have been constructed in Ireland to date, there has been significant planning activity, and permissions for ‘utility scale’ solar farms are in place throughout the country. A total of 63 solar energy projects have been approved under the RESS 1 Auction (See section 2.2 above) and therefore from 2021 onwards many installations will be constructed on agricultural land.
6.2.4 Current, Planned, and Contracted Developments
As of April 2020, no commercial scale solar projects are in operation within County Carlow. However, there are a number of solar developments that have been permitted with a total export capacity of c. 29.49 MW. The Maximum Export Capacity (MEC) and other details are provided in Table 6-6 below. Figure 6-5 shows the location of these applications, they are all within 1 km of existing MV infrastructure.
53 SEAI Energy in Ireland 2020 Report 54 https://www.seai.ie/resources/publications/FAQs_on_Solar_PV.pdf [Accessed: 02/02/2021 ]

!(
!(
!( !(!(
!
!
!
!
!
!
!
!
!
!
!
!
!
!
!
!
!
!(
!(
!(
!(
!(
!(
!(
!(
!(
!(
!(
!(
!(
!(
!(
!(
!(
!.
!.
!.
!.
!.
Carlow
Tullow
Muinebheag
Carrigduff
Tinnahinch
Hacketstown
Myshall
Rathvilly
Leighlinbridge
Borris
Ballon
Palatine
Rathtoe
Bennekerry
Ardattin
Bilboa
Glynn
Clonmore
Tinryland
Nurney
Ballinabrannagh
Old Leighlin
Fennagh
Clonegall
Kildavin
Ballinkillin
Ballyellin
Saint Mullins
Ticknock
1628926/09/2016
1632507/11/2016
1634223/11/2016
1634801/12/2016
194612/02/2019
© OpenStreetMap (and) contributors, CC-BY-SA
NOTE:
Drawn By:Checked By:
Scale:Approved By:
Date:IPIP
@ A4CB
Project No.
File Ref:Client
Title Issue DetailsProject
Carlow Renewable Energy Strategy
MDR1669Arc0009A02
Legend!. Solar Granted Applications
ESB Substations! 220kV! 110kV!( 38kV
ESB Overhead Line Network220kV110kV38kV0 - 2km from ESB Network
!( County Town!( District Town!( Smaller Towns!( Villages
1. This drawing is the property of RPS Group Ltd. It is aconfidential document and must not be copied, used,or its contents divulged without prior written consent.
2. Ordnance Survey Ireland Licence ©Copyright Government of Ireland.
West Pier Business Campus,Dun Laoghaire,Co Dublin, Ireland.
Tel: +353 (0) 1 488 2900Email: [email protected] Web Page: rpsgroup.com/ireland
MDR1669
1:240,000
07/04/2021
EN 0005021
±
Data Sources: Carlow County Council; ESB,National Planning Applications Database (DHLGH)
Figure 6.5Solar Granted Planning Applications with ESB Network
ESB Disclaimer: This map indicates the approximate location of ESB Networks Transmission (400kV, 220kV, 110kV, 38kV) andDistribution (20kV, 10kV, 230V/400V) underground cables and overhead lines in the general area of the proposed works. ESBNetworks takes no responsibility for the accuracy or completeness of these maps. Low voltage (230V/400V) service cables (e.g.house services, factory/shop services, public lighting lamp services, etc) are not included but their presence should beanticipated. The depths of underground cables must never be assumed. Additional more detailed information is available for highvoltage Transmission underground cables (38kV, 110kV, 220kV, 400kV) - for cables in the greater Dublin area call 01 6042957and for all other areas call 1850 372 757. No work should be carried out in the vicinity of 38kV or higher voltage undergroundcables without prior consultation with ESB Networks.Before any mechanical excavation is undertaken, the actual location of all underground electricity cables must be established andverified on site, using: (a) Up-to-date map records; (b) Cable locator equipment operated in both power and radio modes; (c)Careful hand digging of trial holes using 'Safe Digging Practice'. Refer also to 'HSA Code of Practice for Avoiding Danger fromUnderground Services'. ESB takes no responsibility and shall bear no liability in relation to any damage, injury/death or loss ofsupply as a result of damage or interference with its networks.
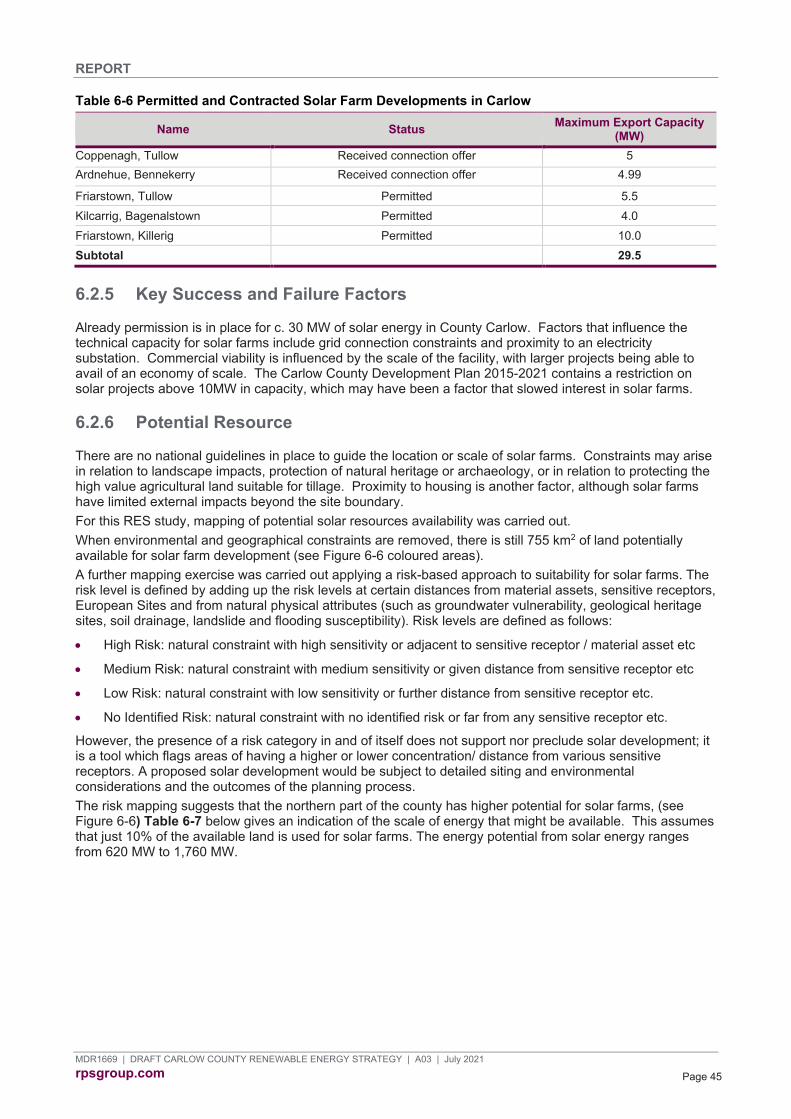
REPORT
MDR1669 | DRAFT CARLOW COUNTY RENEWABLE ENERGY STRATEGY | A03 | July 2021 rpsgroup.com Page 45
Table 6-6 Permitted and Contracted Solar Farm Developments in Carlow
Name Status Maximum Export Capacity (MW)
Coppenagh, Tullow Received connection offer 5 Ardnehue, Bennekerry Received connection offer 4.99
Friarstown, Tullow Permitted 5.5 Kilcarrig, Bagenalstown Permitted 4.0 Friarstown, Killerig Permitted 10.0 Subtotal 29.5
6.2.5 Key Success and Failure Factors
Already permission is in place for c. 30 MW of solar energy in County Carlow. Factors that influence the technical capacity for solar farms include grid connection constraints and proximity to an electricity substation. Commercial viability is influenced by the scale of the facility, with larger projects being able to avail of an economy of scale. The Carlow County Development Plan 2015-2021 contains a restriction on solar projects above 10MW in capacity, which may have been a factor that slowed interest in solar farms.
6.2.6 Potential Resource
There are no national guidelines in place to guide the location or scale of solar farms. Constraints may arise in relation to landscape impacts, protection of natural heritage or archaeology, or in relation to protecting the high value agricultural land suitable for tillage. Proximity to housing is another factor, although solar farms have limited external impacts beyond the site boundary. For this RES study, mapping of potential solar resources availability was carried out. When environmental and geographical constraints are removed, there is still 755 km2 of land potentially available for solar farm development (see Figure 6-6 coloured areas). A further mapping exercise was carried out applying a risk-based approach to suitability for solar farms. The risk level is defined by adding up the risk levels at certain distances from material assets, sensitive receptors, European Sites and from natural physical attributes (such as groundwater vulnerability, geological heritage sites, soil drainage, landslide and flooding susceptibility). Risk levels are defined as follows:
• High Risk: natural constraint with high sensitivity or adjacent to sensitive receptor / material asset etc
• Medium Risk: natural constraint with medium sensitivity or given distance from sensitive receptor etc
• Low Risk: natural constraint with low sensitivity or further distance from sensitive receptor etc.
• No Identified Risk: natural constraint with no identified risk or far from any sensitive receptor etc.
However, the presence of a risk category in and of itself does not support nor preclude solar development; it is a tool which flags areas of having a higher or lower concentration/ distance from various sensitive receptors. A proposed solar development would be subject to detailed siting and environmental considerations and the outcomes of the planning process. The risk mapping suggests that the northern part of the county has higher potential for solar farms, (see Figure 6-6) Table 6-7 below gives an indication of the scale of energy that might be available. This assumes that just 10% of the available land is used for solar farms. The energy potential from solar energy ranges from 620 MW to 1,760 MW.
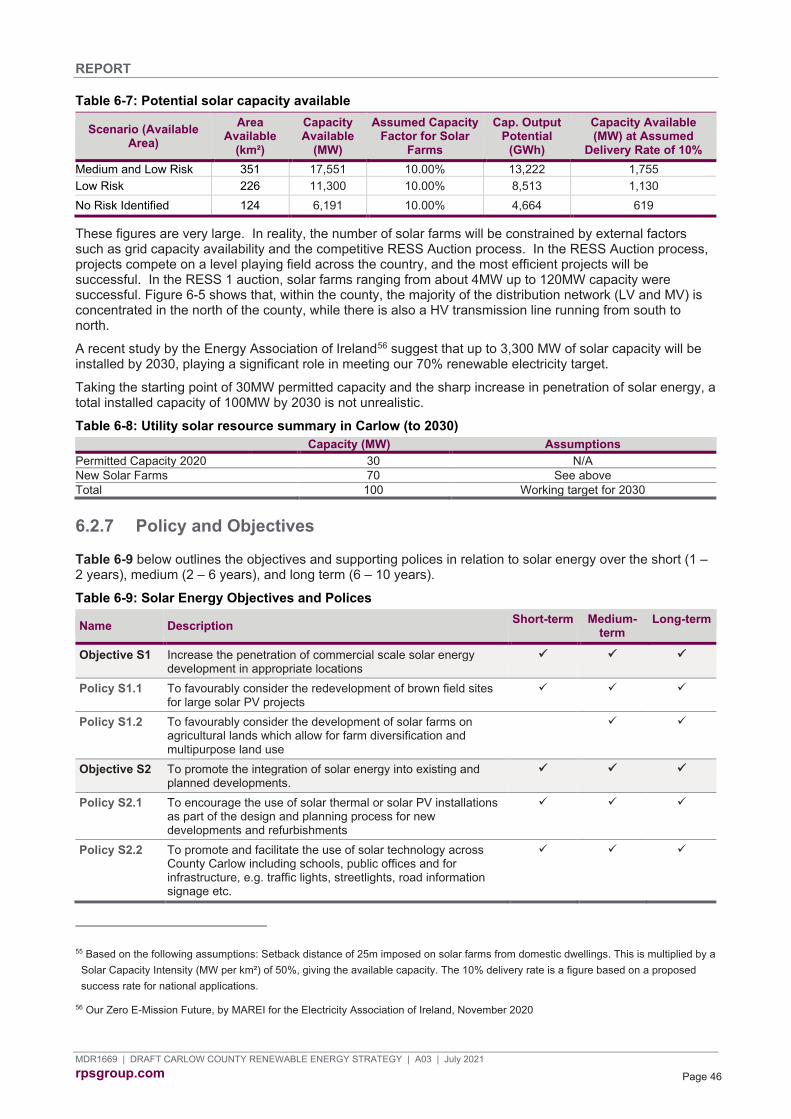
REPORT
MDR1669 | DRAFT CARLOW COUNTY RENEWABLE ENERGY STRATEGY | A03 | July 2021 rpsgroup.com Page 46
Table 6-7: Potential solar capacity available
Scenario (Available Area)
Area Available
(km²)
Capacity Available
(MW)
Assumed Capacity Factor for Solar
Farms
Cap. Output Potential
(GWh)
Capacity Available (MW) at Assumed
Delivery Rate of 10% Medium and Low Risk 351 17,551 10.00% 13,222 1,755 Low Risk 226 11,300 10.00% 8,513 1,130 No Risk Identified 124 6,191 10.00% 4,664 619
These figures are very large. In reality, the number of solar farms will be constrained by external factors such as grid capacity availability and the competitive RESS Auction process. In the RESS Auction process, projects compete on a level playing field across the country, and the most efficient projects will be successful. In the RESS 1 auction, solar farms ranging from about 4MW up to 120MW capacity were successful. Figure 6-5 shows that, within the county, the majority of the distribution network (LV and MV) is concentrated in the north of the county, while there is also a HV transmission line running from south to north.
A recent study by the Energy Association of Ireland56 suggest that up to 3,300 MW of solar capacity will be installed by 2030, playing a significant role in meeting our 70% renewable electricity target.
Taking the starting point of 30MW permitted capacity and the sharp increase in penetration of solar energy, a total installed capacity of 100MW by 2030 is not unrealistic.
Table 6-8: Utility solar resource summary in Carlow (to 2030) Capacity (MW) Assumptions
Permitted Capacity 2020 30 N/A New Solar Farms 70 See above Total 100 Working target for 2030
6.2.7 Policy and Objectives
Table 6-9 below outlines the objectives and supporting polices in relation to solar energy over the short (1 – 2 years), medium (2 – 6 years), and long term (6 – 10 years).
Table 6-9: Solar Energy Objectives and Polices
Name Description Short-term Medium-term
Long-term
Objective S1 Increase the penetration of commercial scale solar energy development in appropriate locations
Policy S1.1 To favourably consider the redevelopment of brown field sites for large solar PV projects
Policy S1.2 To favourably consider the development of solar farms on agricultural lands which allow for farm diversification and multipurpose land use
Objective S2 To promote the integration of solar energy into existing and planned developments.
Policy S2.1 To encourage the use of solar thermal or solar PV installations as part of the design and planning process for new developments and refurbishments
Policy S2.2 To promote and facilitate the use of solar technology across County Carlow including schools, public offices and for infrastructure, e.g. traffic lights, streetlights, road information signage etc.
55 Based on the following assumptions: Setback distance of 25m imposed on solar farms from domestic dwellings. This is multiplied by a Solar Capacity Intensity (MW per km²) of 50%, giving the available capacity. The 10% delivery rate is a figure based on a proposed success rate for national applications.
56 Our Zero E-Mission Future, by MAREI for the Electricity Association of Ireland, November 2020

!
!
!
!
!
!
!
!
!
!
!
!
!(
!(
!(
!(
!(
!(
!(
!(
!(
!(
!(
!(
!(
!(
!(
!(
!(
M9
N11N11
N11
N11
N11
N11
N30
N80
N80N80 N80
N80
N80
N80
N80
N78
N81
N80
Carlow
Tullow
Muinebheag
Carrigduff
Tinnahinch
Hacketstown
Myshall
Rathvilly
Leighlinbridge
Borris
Ballon
Palatine
Rathtoe
Bennekerry
Ardattin
Bilboa
Glynn
Clonmore
Tinryland
Nurney
Ballinabrannagh
Old Leighlin
Fennagh
Clonegall
Kildavin
Ballinkillin
Ballyellin
Saint Mullins
Ticknock
EPA, OSI
NOTE:
Drawn By:Checked By:
Scale:Approved By:
Date:IPIP
@ A4CB
Project No.
File Ref:Client
Title Issue DetailsProject
Carlow Renewable Energy Strategy
MDR1669Arc0018A02
LegendAvailable Areas withNo Risk IdentifiedAvailable Areas withLow RiskAvailable Areas withMedium RiskAvailable Areas withHigh RiskExcluded Areas
1. This drawing is the property of RPS Group Ltd. It is aconfidential document and must not be copied, used,or its contents divulged without prior written consent.
2. Ordnance Survey Ireland Licence ©Copyright Government of Ireland.
West Pier Business Campus,Dun Laoghaire,Co Dublin, Ireland.
Tel: +353 (0) 1 488 2900Email: [email protected] Web Page: rpsgroup.com/ireland
MDR1669
1:240,000
09/04/2021
EN 0005021
±
Data Sources: Carlow County Council; SEAI; EPA. ESB, GSI, OPW; TII; OSi; MyPlan.ie
Figure 6.6Solar Opportunity Areas
Legend!( County Town
!( District Town
!( Smaller Towns
!( Villages
Motorway
National Primary Road
National Secondary Road
Mainline Rail
CSO Settlement Envelope

REPORT
MDR1669 | DRAFT CARLOW COUNTY RENEWABLE ENERGY STRATEGY | A03 | July 2021 rpsgroup.com Page 48
6.3 Bioenergy
6.3.1 Introduction
This section considers the bioenergy resource in County Carlow, describing the resource and the associated energy conversion technologies, how it can be harnessed, and setting out policy and objectives to support bioenergy developments, which can make a contribution to our renewable energy targets while minimising any adverse impact on the environment.
6.3.2 Overview
Bioenergy is energy derived from biological sources, typically organic matter from plants and animals and their by-products. It can be categorised as biomass, biogas, and biofuels. Biomass refers to land and aquatic vegetation, organic waste, and photosynthetic organisms. Depending on the conversion technology employed, biomass can be converted directly to heat and electricity, or used to make biogas or biofuel. Solid biomass tends to be converted directly to heat and electricity by combustion, while wet biomass is digested to form biogas or fermented to produce biofuel. The main types of solid biomass used in Ireland for direct combustion are forest thinnings, sawmill residues, waste wood, willow, miscanthus, straw, residual municipal solid waste (MSW) and tallow. 57
Biomass is currently co-fired in one peat-fired power station in Edenderry, Co. Offaly. This is supported under REFIT 3, up to a level of 30% average co-firing and 125 MW in total. Some of the biomass being used is imported. 58 According to the SEAI, approximately 3.5% of the energy used in Ireland comes from Irish grown biomass, and by 2035 the bioenergy potential will be close to 30% of 2015 energy demand.59
Biogas, formed from biomass, can be combusted in boilers to produce heat, or in combined heat and power plants, typically gas engines, to provide both heat and electricity. Alternatively, the biogas can undergo further upgrading to remove the CO2, to produce an almost pure stream of biomethane. There are plans in place to allow for this biomethane to be injected into the natural gas network at appropriate points and transported to consumers. Refer to Section 0 for more information in relation to gas infrastructure in Carlow.
Biomass can also be used to produce biofuels, which serve as a renewable alternative to fossil fuels for transport. Biofuels produced from food crops, called first generation biofuels, are contentious as they compete with food production. Second generation biofuels do not use food crops as their feedstock. They use lignocellulosic biomass or woody crops, agricultural residues or waste, as well as dedicated non-food energy crops grown on marginal land unsuitable for crop production. Second generation biofuels are not produced commercially as of yet, however research is ongoing.60 61
6.3.3 Feedstock Sources
6.3.3.1 Forest Thinnings
Forest thinnings and residues are a source of biomass that can be used to produce heat, electricity and potentially, biofuels. This resource includes the thinnings from forest maintenance and residuals from harvesting. The wood, after a period of drying, can be used directly as logs in domestic boilers and stoves or
57 SEAI, Bioenergy Supply in Ireland 2015 - 2035 https://www.seai.ie/resources/publications/Bioenergy-Supply-in-Ireland-2015-2035.pdf [Accessed: 26/01/2021]
58 Department of Communications, Energy and Natural Resources, Ireland’s Transition to a Low Carbon Energy Future 2015-2030 https://www.dccae.gov.ie/documents/Energy%20White%20Paper%20-%20Dec%202015.pdf [Accessed: 08/02/2021]
59 https://www.seai.ie/sustainable-solutions/renewable-energy/bioenergy/ [Accessed: 26/01/2021] 60 SEAI, Bioenergy Supply in Ireland 2015 - 2035 https://www.seai.ie/resources/publications/Bioenergy-Supply-in-Ireland-2015-2035.pdf [Accessed: 26/01/2021]
61 IEA, Sustainable Production of Second -Generation Biofuels https://www.iea.org/publications/freepublications/publication/second_generation_biofuels.pdf [Accessed: 26/01/2021]

REPORT
MDR1669 | DRAFT CARLOW COUNTY RENEWABLE ENERGY STRATEGY | A03 | July 2021 rpsgroup.com Page 49
processed to form chips or pellets to be used in combustion power stations, combined heat, and power plants (CHP) or industrial boilers. This material is also a feedstock for the advancing production of second-generation biofuels. Forestry has the largest potential to expand at current market prices for energy. Carlow has a relatively low forest area (9.4%) cover, offering a lower potential for bioenergy from forest residue.62 In 2019, afforestation in Carlow was 22 ha, this amounts to just 0.62% of national afforestation in this period. Similar material can be obtained from sawmill residue or waste wood sources.
6.3.3.2 Energy Crops
Energy crops act as a bioenergy feedstock, including wheat and oilseed rape (OSR) which are used in biofuel production. Wheat can be used to produce bioethanol, while biodiesel can be formed from OSR. Both crops are currently grown in Ireland but are not used for domestic biofuel production as refineries must be quite large to achieve economies of scale and the availability of the resource is limited. Sugar beet and maize can both act as feedstock for biogas production, with sugar beet also being used to produce bioethanol.63 Ireland also has the potential to grow miscanthus and willow, forms of solid biomass for direct combustion. Crops are typically grown in Ireland for food, fodder, or exportation. The potential for expansion into the energy market faces the challenges of land-use competition, availability of land and profitability. Grass silage in Ireland offers a large resource for biogas production, albeit at a greater cost.64
6.3.3.3 Agricultural Waste and Residues
Agricultural waste and residues, such as straw, pig manure and cattle manure, can be used to produce biogas at little to no cost. Straw produced as a by-product in crop production can be combusted to produce electricity and heat and is a potential resource for second-generation biofuels. The slurry and manure from cattle and pigs can be used to produce biogas, which can then be combusted or further transformed into biomethane for gas network distribution.
6.3.3.4 Other By-Products and Residues
Other process by-products and residues that can act as a feedstock for bioenergy production include tallow, used cooking oil (UCO), food waste and residual municipal solid waste (MSW). Tallow, produced during meat processing, can be converted to biodiesel, or used as a heating fuel. Used cooking oil is currently collected from food services and industries and used in the production of biodiesel. Food waste has the potential to be used for biogas production and residual MSW can be burned in a waste-to-energy process to produce heat and electricity.
6.3.4 Conversion Technologies
6.3.4.1 Biomass Combustion and Combined Heat and Power
Direct combustion is the simplest method of bioenergy production. This is typical of solid biomass, which is converted to heat through combustion. Forest thinning’s, sawmill residues, waste wood, willow, miscanthus, straw, residual MSW and tallow are the main types of solid biomass used for direct combustion in Ireland.65 Combined heat and power (CHP) is the process by which electricity and heat can be produced from biomass.
62 Department of Agriculture, Food and the Marine, Ireland’s National Forest Inventory 2017 Main Findings https://www.agriculture.gov.ie/media/migration/forestry/forestservicegeneralinformation/MainFindings301018.pdf [Accessed: 21/01/2021]
63 https://www.seai.ie/resources/publications/Bioenergy-Supply-in-Ireland-2015-2035.pdf [Accessed: 21/01/2021] 64 SEAI, Assessment of Cost and Benefits of Biogas and Biomethane in Ireland https://www.seai.ie/resources/publications/Assessment-of-Cost-and-Benefits-of-Biogas-and-Biomethane-in-Ireland.pdf [Accessed: 21/01/2021]
65 SEAI, Bioenergy Supply in Ireland 2015 - 2035 https://www.seai.ie/resources/publications/Bioenergy-Supply-in-Ireland-2015-2035.pdf [Accessed: 21/01/2021]

REPORT
MDR1669 | DRAFT CARLOW COUNTY RENEWABLE ENERGY STRATEGY | A03 | July 2021 rpsgroup.com Page 50
6.3.4.2 Anaerobic Digestion
Anaerobic digestion (AD) is the process used to produce biogas. Grass silage, domestic and industrial food waste, and pig and cattle slurry provide the feedstock for the process. The biomass is broken down anaerobically in biodigester plants to produce the biogas. Biogas is composed primarily of methane (CH4) and carbon dioxide (CO2), and may have small amounts of hydrogen sulphide (H2S), moisture and siloxanes.
Micro-organisms break down the organic material in the absence of oxygen. The process is operated under controlled conditions in sealed tanks. In this anaerobic environment, biochemical reactions occur that convert organic polymers from the feedstock into methane rich biogas and nutrient rich digestate. Anaerobic digestion works best at temperatures of 30°C to 60°C and typically takes anything between 14 and 40 days to complete.66
The biogas produced can be combusted to create heat or used to generate electricity. The electricity can be used in the facility or be exported to the grid while the digestate can be pasteurised at high temperatures to remove pathogens, and then used as a fertilizer. Biogas can also be upgraded to biomethane by removing impurities such as CO2 and H2S.
The energy output from an anaerobic digestion plant greatly depends on the biomethane potential of the feedstock. High-energy feedstocks such as glucose or kitchen waste will have much higher energy yields than feedstocks such as grass cuttings. Those organic feedstocks with the highest biomethane potential contain 10 times more energy than the lowest biomethane potential feedstocks, such as sewage sludge.
Anaerobic digestion can be undertaken on a scale ranging from small farm-based AD plants to large industrial AD plants, with a range of technology from simple to very sophisticated and highly mechanised and automated systems. There is potential for the deployment of micro anaerobic-digestors in Carlow, due to the wastes produced by the agriculture and forestry sectors.
6.3.4.3 Gasification
Biomass can also undergo gasification, a process by which a mixture of carbon monoxide, carbon dioxide and hydrogen, called syngas, is produced. This syngas can then be used to generate electricity. The gasification process involves the incomplete combustion of solid biomass, such that the resulting gas still has combustion potential.
6.3.5 Current, Planned & Contracted Developments
Table 6-10 outlines the existing bioenergy developments in Carlow .
Table 6-10: Current Bioenergy Developments in Carlow67 Name Type MEC (MW)
Teagasc Oak Park Carlow Biomass (CHP Plant) 1 x 0.035 Biomass (Heat only) 1 x 0.1 Biomass (Heat only) 1 x 0.3
Woodside Garden Products Solid Biofuel Manufacturer Flynn’s Garage Limited Biomass (Heat only) 0.1
Tullow Mushroom Growers Ltd Biomass (Heat only) 0.928 Lismard Properties Ltd Biomass (Heat only) 0.72
Murray Timber Products Ltd. Biomass (CHP Plant) Carlow Precast Tanks Ltd. Biomass (Heat only) 0.1
Borris House Biomass (Heat only) 0.2
66 https://envirocare.org/anaerobic-digestion-process-from-waste-to-energy/ [Accessed: 16/02/2021
67 Irish Bioenergy 2017, Bioenergy Installations Map of Ireland in 2017.

REPORT
MDR1669 | DRAFT CARLOW COUNTY RENEWABLE ENERGY STRATEGY | A03 | July 2021 rpsgroup.com Page 51
6.3.6 Key Success and Failure Factors
The success of bioenergy projects is heavily dependent on the availability of the resources. Carlow’s large agricultural industry presents opportunities for the provision of straw and animal manure and silage. A common failure factor for bioenergy plans is competition for land use, particularly food crop production. There is reluctance to use edible plants or good quality arable land for energy crop production. Therefore, success is more likely when harnessing residue from existing industries, such as forest materials and animal by-products. The price of conventional fuels also plays an important role in the success or failure of bioenergy projects. The cost of feedstock production, transportation and processing must be compared to that of other energy sources to determine if it is economical. Also the effect of land use change on the land within Carlow and remote lands should be considered.
6.3.7 Potential Resource
According to the Agricultural Census 2010, the area and utilisation of agricultural land in Carlow is 73,525 hectares. This is 1.6 % of the total farmland in the state.
The SEAI have quantified the bioenergy potential in Carlow on a 50m by 50m grid for miscanthus, oilseed rape, reed canary grass and willow, the current maps are reproduced in Figure 6-7, however, it is understood that this data is being reviewed and will be updated in the near future. Each grid square has been assigned a category of bioenergy suitability (high, medium, low, unsuitable, unavailable). This suitability assessment undertaken by the SEAI has considered existing land use, existing agriculture and forestry, soils, topography, average annual and seasonal rainfall. Designated conservation areas, archaeological areas and residences have also been considered. It should be noted this data is provided by the SEAI as indicative suitability only, and there may be competing land uses which could affect the viability of bioenergy crop usage. Indicative potential area of each biocrop and energy production reported by SEAI is estimated from the maps in Table 6-11 below. Any planned or future developments in relation to use of crops for bioenergy would need to be assessed in detail on a project by project basis, and subject to feasibility/technical studies and appropriate environmental assessments in the first instance.
Table 6-11: Suitability for Miscanthus, Oilseed Rape, Canary Grass and Willow in Co Carlow Crop Type Area
(ha) Suitability tonne/ha
Toe/ tonne
Total Energy (toe)
Total Value (€)
Miscanthus High Suitability 14,237 16 0.33 75,172 14,806,628
Miscanthus Medium Suitability 10,855 12.5 0.33 44,778 8,819,951
Miscanthus Low Suitability 5,058 9 0.33 15,021 2,958,699
Miscanthus Total 30,150 134,971 Oilseed Rape High Suitability 32,611 6 0.59 115,444 55,765,337
Oilseed Rape Medium Suitability 18,036 4.5 0.59 47,885 23,131,110
Oilseed Rape Low Suitability 4,034 2 0.59 4,760 2,299,507
Oilseed Rape Total 54,681 168,090 Reed Canary Grass High Suitability 41,179 10 0.33 135,889 28,824,967 Reed Canary Grass Medium Suitability 13,629 6 0.33 26,986 5,724,246
Reed Canary Grass Low Suitability 1,695 2.5 0.33 1,399 296,670
Reed Canary Grass Total 56,503 164,273 Willow High Suitability 30,319 28 0.21 178,275 80,648,138
Willow Medium Suitability 13,210 24 0.21 66,577 30,117,987
Willow Low Suitability 2,183 20 0.21 9,168 4,147,301
Willow Total 45,711 254,019
Source: Estimated from Figure 6-6 which is derived from the SEAI Bioenergy System and Mapping Tool: https://www.seai.ie/technologies/seai-maps/bioenergy-map/

© OpenStreetMap (and) contributors,CC-BY-SA
NOTE:
Drawn By:Checked By:
Scale:Approved By:
Date:NAXX
@ A4XX
Project No.
File Ref:Client
Title Issue DetailsProject
Carlow Renewable Energy Strategy
MDR1669Arc0014A01
1. This drawing is the property of RPS Group Ltd. It is aconfidential document and must not be copied, used,or its contents divulged without prior written consent.
2. Ordnance Survey Ireland Licence ©Copyright Government of Ireland.
West Pier Business Campus,Dun Laoghaire,Co Dublin, Ireland.
Tel: +353 (0) 1 488 2900Email: [email protected] Web Page: rpsgroup.com/ireland
MDR1669
1:460,000
07/04/2021
EN 0005021
±
© OpenStreetMap (and) contributors,CC-BY-SA
© OpenStreetMap (and) contributors,CC-BY-SA
© OpenStreetMap (and) contributors,CC-BY-SA
Miscanthus Oil Seed
WillowReed Canary Grass
±
Data Sources: Carlow County Council;SEAI: https://maps.seai.ie/bioenergy/
Figure 6.7Mapped potential bioenergy resource suitability
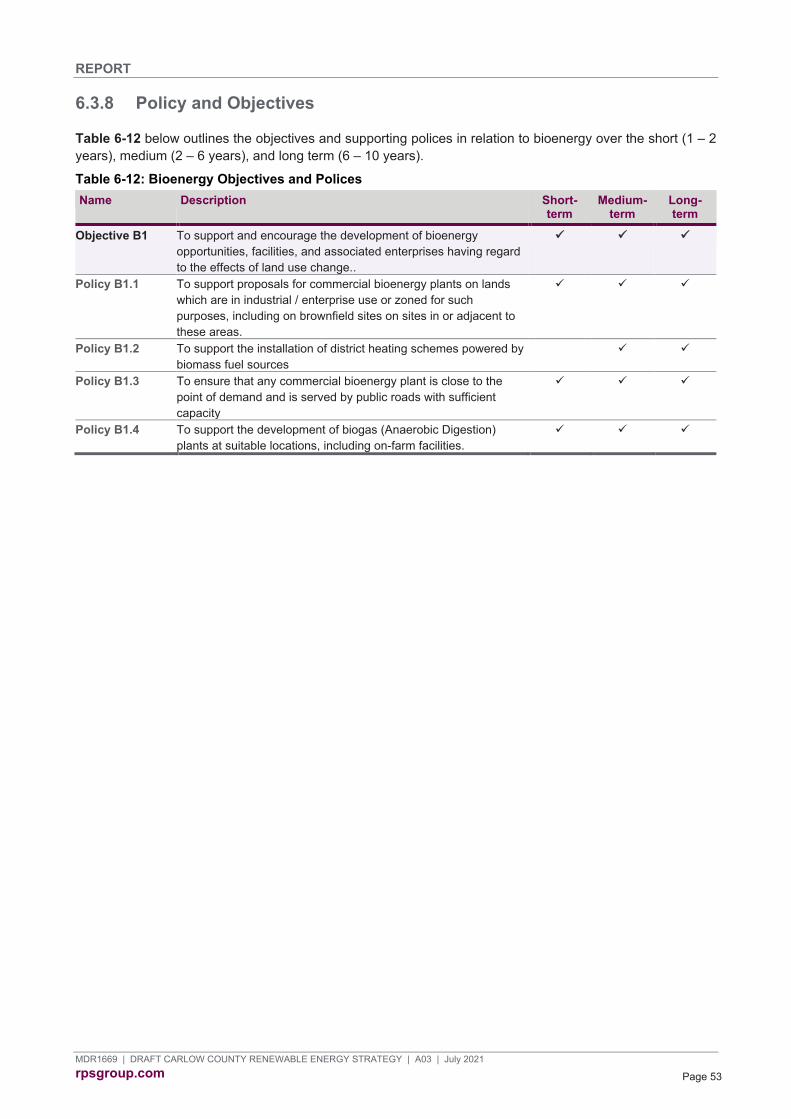
REPORT
MDR1669 | DRAFT CARLOW COUNTY RENEWABLE ENERGY STRATEGY | A03 | July 2021 rpsgroup.com Page 53
6.3.8 Policy and Objectives
Table 6-12 below outlines the objectives and supporting polices in relation to bioenergy over the short (1 – 2 years), medium (2 – 6 years), and long term (6 – 10 years).
Table 6-12: Bioenergy Objectives and Polices Name Description Short-
term Medium-
term Long-term
Objective B1 To support and encourage the development of bioenergy opportunities, facilities, and associated enterprises having regard to the effects of land use change..
Policy B1.1 To support proposals for commercial bioenergy plants on lands which are in industrial / enterprise use or zoned for such purposes, including on brownfield sites on sites in or adjacent to these areas.
Policy B1.2 To support the installation of district heating schemes powered by biomass fuel sources
Policy B1.3 To ensure that any commercial bioenergy plant is close to the point of demand and is served by public roads with sufficient capacity
Policy B1.4 To support the development of biogas (Anaerobic Digestion) plants at suitable locations, including on-farm facilities.

REPORT
MDR1669 | DRAFT CARLOW COUNTY RENEWABLE ENERGY STRATEGY | A03 | July 2021 rpsgroup.com Page 54
6.4 Micro Hydroelectric Power
6.4.1 Overview
Hydroelectric power is the generation of electricity through harnessing the energy in the flowing water of a stream or river. A turbine is used to convert the kinetic energy in falling water to mechanical energy, which is further converted to electrical energy by a generator. The amount of electricity produced depends on the amount of water, the flow, and how far the water falls to reach the turbine, the head. The greater the flow and the head, the more power produced. In 2017, hydropower accounted for 2.3% of Ireland’s electricity generation, producing 692 GWh.
Micro hydroelectric power refers to hydropower installations below 100 kW.68 Installations of this size are typically run-of-river systems, which exploit the natural flow and slope of a river or stream to generate electricity. A portion of the water is diverted to power the turbine before being returned unchanged further downstream. These systems typically operate without a water storage mechanism, such as a dam, therefore limiting their environmental impact. This leaves the electricity generation subject to seasonal variations as the flow changes and offers no opportunity for energy storage. Some installations may have a small water storage area, or pondage, to regulate the flow, while still being considered run-of-river due to their limited impact on the river.
6.4.2 Current, Planned & Contracted Developments
Currently there are 3 operational micro hydroelectric power sites existing in County Carlow, with a combined capacity of 0.23 MW.
Table 6-13 Current hydro developments in Carlow Site No. on SEAI Map River National Grid Reference Potential Inst. Cap.
(kW) Potential Annual Energy
(MWh)
28 Barrow S700 702 110 650 42 Barrow S703 620 101 340 67 Dinin S732 498 19 150
6.4.3 Key Success and Failure Factors
The key factor for success or failure of micro hydroelectric power is site selection. Site selection must consider the environmental impact, the resource availability, and the proximity to the required infrastructure.
In terms of the required resource, the availability and variability must be considered. Sufficient flow and head must be present in the water to generate electricity. Furthermore, where there is no water storage area, the variability of the water flow will determine whether it can be easily integrated into the grid.
One of the key failure factors for hydropower development plans is the environmental and landscape impact during construction and operation. Hydropower installations operate by disrupting the flow of the watercourse, which may impact on biodiversity in the area. The visual amenity of the area is also impacted during construction, and to a lesser extent during operation.
The transmission and distribution network, along with the road network, are important supporting infrastructure for hydropower construction and operation. Success will depend on the availability of these supports near the proposed site.
6.4.4 Potential Resource
Potential locations within Carlow were identified by the SEAI for micro hydroelectric power installations. There is theoretical potential for a total installed capacity of approximately 2 MW throughout the county, outlined in and Figure 6-8.
68 https://www.energy.gov/energysaver/buying-and-making-electricity/microhydropower-systems [Accessed: 19/03/2019]
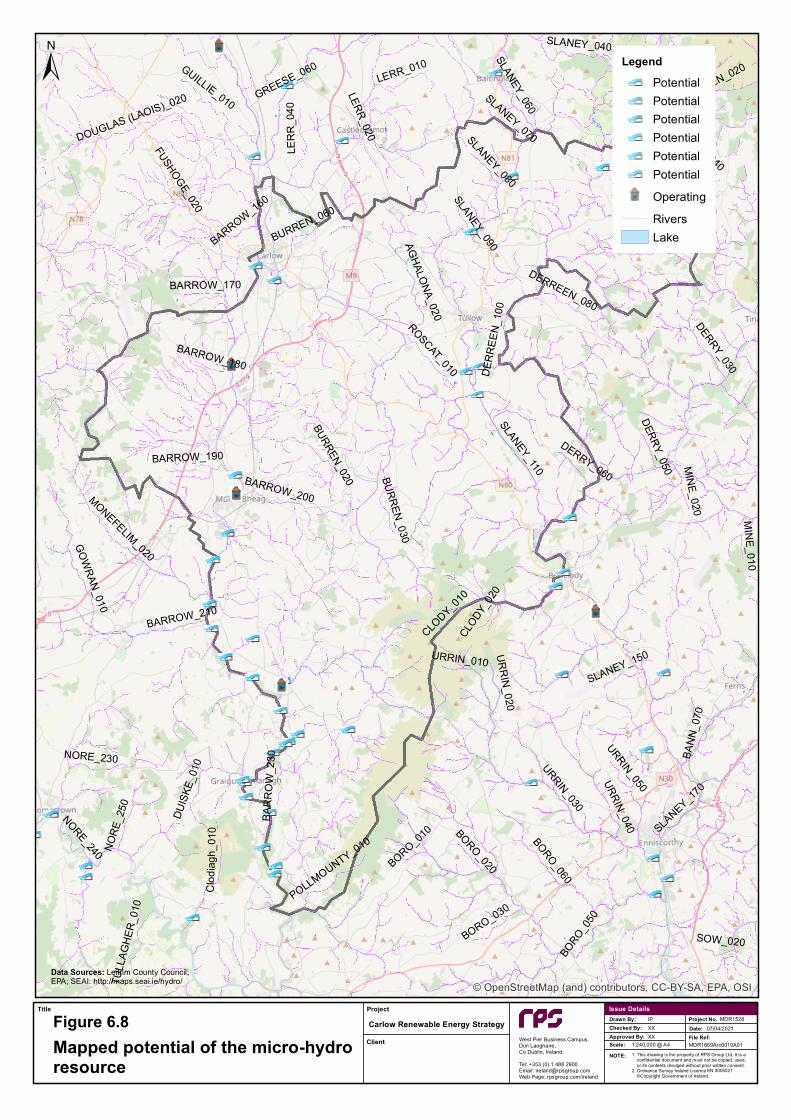
GUILLIE_010
URRIN_030
GREESE_060
SLANEY_040
GO
WRAN_010
BORO_060
NORE_230
BORO_0
50
URRIN_010
BURREN_060C
lodi
agh_
010
NORE_240
SLANEY_110
DERRY_030
FUSHOGE_020
SLANEY_090
DER
REE
N_1
00
ROSCAT_010
UR
RIN
_020
DUIS
KE_0
10
NO
RE_
250
AGHALO
NA_020
POLLMOUNTY_010
LER
R_0
40
BORO_030
BORO_020
BAN
N_0
70
SLANEY_070
BARROW_160
TULL
AGH
ER_0
10
BARROW_180
BORO_010
LERR_020BU
RR
EN_030
SOW_020
DERRY_060
BARROW_170
MIN
E_020
DERRY_050
LERR_010
BARROW_210
BAR
RO
W_2
30
SLANEY_080
SLANEY_150
BARROW_190BURREN_020
CLODY_0
10
DERREEN_080
URRIN_050
MONEFELIM_020
CLODY_
020
SLANEY_1
70
DOUGLAS (LAOIS)_020
BARROW_200
SLANEY_060
URRIN_040
MIN
E_010
DERREEN_060
DERREEN_020
DERREEN_040
© OpenStreetMap (and) contributors, CC-BY-SA, EPA, OSI
NOTE:
Drawn By:Checked By:
Scale:Approved By:
Date:IPXX
@ A4XX
Project No.
File Ref:Client
Title Issue DetailsProject
Carlow Renewable Energy Strategy
MDR1669Arc0010A01
Figure 6.8Mapped potential of the micro-hydro resource
1. This drawing is the property of RPS Group Ltd. It is aconfidential document and must not be copied, used,or its contents divulged without prior written consent.
2. Ordnance Survey Ireland Licence ©Copyright Government of Ireland.
West Pier Business Campus,Dun Laoghaire,Co Dublin, Ireland.
Tel: +353 (0) 1 488 2900Email: [email protected] Web Page: rpsgroup.com/ireland
MDR1528
1:240,000
07/04/2021
EN 0005021
±
Data Sources: Leitrim County Council;EPA; SEAI: http://maps.seai.ie/hydro/
LegendPotentialPotentialPotentialPotentialPotentialPotential
Operating
RiversLake

REPORT
MDR1669 | DRAFT CARLOW COUNTY RENEWABLE ENERGY STRATEGY | A03 | July 2021 rpsgroup.com Page 56
This resource was mapped by the SEAI from comprehensive information identified in the then Department of Energy’s 1985 report “Small Scale Hydro Electric Potential of Ireland.”69 As such, this map and the identified sites in Carlow outlined in Table 6-14 are indicative of micro-hydropower potential only. It is noted that some sites may also be located in or in proximity to European sites. As such, any proposal for hydro-power development would need to be subject to a feasibility or technical study, as well as detailed environmental assessment and subject to the outcomes of the planning process at the project level.
Table 6-14: Potential Locations for Micro-Hydropower Generation in Carlow Site No. on SEAI Map River National Grid Reference Potential Inst. Cap.
(kW) Potential Annual Energy
(MWh)
0 Barrow S715 765 114 780 13 Burren S727 756 54 279 40 Barrow S702 632 133 915 43 Barrow S697 595 97 669 52 Barrow S688 578 112 808 54 Barrow S686 550 205 1,414 55 Barrow S687 534 144 1,001 57 Barrow S713 528 28 164 62 Barrow S696 516 135 943 69 Barrow S731 482 126 899 70 Barrow Trib S742 467 37 168 71 Barrow Trib S736 462 40 183 75 Barrow S734 461 122 872 76 Barrow S708 436 88 621 77 Barrow S709 427 274 1,935 78 Barrow S724 417 181 1,291 81 Aughanaul S728 383 23 103 83 Aughanaul S727 378 81 328
SUBTOTAL 1,994 13,373
Source: SEAI Hydropower Potential Mapping: http://maps.seai.ie/hydro/
6.4.5 Potential Resource
Table 6-15 below outlines the objectives and supporting policies in micro-hydro energy.
Table 6-15 Micro-Hydro Objectives and Policies Name Description Short-
term Medium-
term Long-term
Objective H1 To support and encourage the development of micro-hydroelectric generation opportunities, where environmental and heritage resources are fully protected.
69 SEAI HydroMap: http://maps.seai.ie/hydro/

REPORT
MDR1669 | DRAFT CARLOW COUNTY RENEWABLE ENERGY STRATEGY | A03 | July 2021 rpsgroup.com Page 57
6.5 Micro Energy Generation and Community Energy
6.5.1 Introduction
Micro energy generation is the domestic and community use of small-scale solar PV and solar thermal, wind, Combined Heat and Power (CHP) and Ground Source Heat Pump (GSHP) technologies to generate heat and electric power in a domestic, commercial, or agricultural setting. Micro energy generation can be used to meet all the energy needs of a home, business, or community, or can be a supplement to grid connected energy. Micro generation allows homes, business, and communities to lower their carbon footprint and to reduce the cost of energy imported from the grid. Micro generation technologies can be combined to form a hybrid power solution that can offer superior performance and lower cost than a system based on one generator. Energy storage can be combined with micro generation technologies to allow for the supply of energy during periods of low generation.
6.5.2 Overview
6.5.2.1 Micro Wind
Wind energy micro generation involves the installation of small capacity wind turbines on the site of a domestic dwelling, commercial facility, or agricultural site for electricity production. A free-standing wind turbine with a total hub height limited to 10 m, a total structure height no greater than 13 m and a maximum rotor diameter of 6 m can usually be erected at a domestic dwelling without planning permission. Larger turbines, with a total structure height of 20 m and a maximum rotor diameter of 8 m usually constitute exempted development from planning requirements at industrial or agricultural properties. In all cases, there must be sufficient clearance and setback distances from roads, dwellings, and overhead lines.70.
6.5.2.2 Solar PV
Solar PV rooftop applications are typical in both domestic and non-domestic settings. The amount of electricity generated depends on the solar resource, the location, orientation and tilt of the panels and the area covered. The maximum output will be achieved when facing due south, away from shading and at a tilt of 30°. A typical 1 m2 silicon solar panel will generate ~150W of power on a clear sunny day. A home solar PV system sized at 20 sq. m (~3kW) and well located would generate around 2,600kWh of electricity a year.
6.5.2.3 Solar Thermal
Solar thermal technology can provide space and water heating in residential, commercial, or industrial applications. Solar collectors are installed to capture the energy from the sun and convert it to heat, which can then be stored in a hot water storage cylinder for future use. The solar collectors can take the form of flat panels or evacuated tubes and are typically installed on the roof of a building. Solar thermal technology is most employed in the residential sector in Ireland for water heating. In applications where the total collector area exceeds 50% of the total roof area, or 12 m2 in domestic applications and 50 m2 in non-domestic settings, planning is required. Where space is limited, evacuated tube collectors may be more suited, as they produce more hot water per square metre.71 Micro Combined Heat and Power (CHP) CHP is the generation of usable heat and electricity in a single process. It is also referred to as cogeneration. Electricity generation from fossil fuels and renewable sources such as biomass involves much of the input energy being lost as waste heat. This may be released to the atmosphere or river systems. CHP systems put this heat to useful purposes such as industrial processes or heating buildings. CHP has an overall efficiency of 80%, with electrical output accounting for 30% of the total output. Of the total output, 50% is in the form of heat, while 20% of energy is lost.72 Carlow has a large supply of biomass, which can be used in small scale
70 Planning and Development Regulations 2007 https://www.housing.gov.ie/sites/default/files/migrated-files/en/Legislation/DevelopmentandHousing/Planning/FileDownLoad%2C1486%2Cen.pdf [Accessed 06/02/2021]
71 SEAI, A Homeowner’s Guide to Solar Thermal for Hot Water https://www.seai.ie/resources/publications/Homeowners-Guide-To-Solar-Thermal.pdf [Accessed: 16/02/2021]
72 SEAI. Combined Heat and Power in Ireland. https://www.seai.ie/publications/CHP-Update-2020.pdf

REPORT
MDR1669 | DRAFT CARLOW COUNTY RENEWABLE ENERGY STRATEGY | A03 | July 2021 rpsgroup.com Page 58
CHP plants throughout the county. The European Union CHP Directive73 defines micro CHP as having an electrical capacity size range of <50 kWe (electrical Kilowatts).
In 2019 there were 97 micro CHP units in Ireland with an operating capacity of 0.7 MWe. This represented 30.4% of the total number of CHP units, and 0.7 % of the total operational capacity.72 The use of CHP in Ireland is relatively low compared to the rest of Europe. At a national scale, in 2019 CHP contributed to just 6.6 % of Ireland’s electricity compared with 7% in 2018, and 5.7 % of heat demand, and is typically used in the services sectors (such as leisure centres, hotels and industry).74 The SEAI reports that heat density in Ireland is generally low which creates challenges for developing large-scale district heating and cooling applications. However, the SEAI does note that Ireland should incentivise and prioritise building-scale CHP technologies.75
6.5.2.4 Ground Source Heat Pump (GSHP)
Ground-source heat pumps (GSHPs) exploit geothermal energy to provide space heating and cooling. Ground-source heat pumps utilise the low temperature geothermal resources closer to the surface, which act as a heat source during heating and a sink into which excess heat is released during cooling. Geothermal energy offers a reliable resource as the temperature of the earth below a certain depth, typically ten metres, is relatively stable. Ground-source heat pumps are potential replacements for conventional oil, coal or gas boilers and can be used in both domestic and non-domestic applications
The system typically consists of a collector loop, a heat pump, and a distribution system. Ground-source heat pumps require electricity during heating and cooling operations; however, the heat pump produces three to four units of heat for each unit of electricity consumed. GSHPs can be categorised based on their collector types; closed-loop systems and open-loop systems.
A closed-loop system consists of a closed loop of pipes buried in the ground, through which a heat transfer fluid circulates. The fluid extracts heat from, or releases heat to, the ground as required. The pipes can have a horizontal or vertical configuration, depending on the availability of land and cost requirements. A horizontal system is installed in a shallow trench, typically 1.5 m below the surface, while vertical systems access more stable temperatures between 6 m and 120 m through installing collectors in drilled boreholes or wells.76 The horizontal configuration requires a larger availability of land, however, the lack of drilling required makes it a lower cost installation. A closed loop system can also be installed in ponds or lakes.
An open-loop system extracts groundwater from a well or borehole through a vertical configuration and transfers it to a heat exchanger for energy extraction. The water is then re-injected to the source or
73 European Union, 2004. Directive 2004/8/EC on the promotion of cogeneration based on a useful heat demand in the internal energy market. Available at: http://eur-lex.europa.eu/legal-content/EN/TXT/PDF/?uri=CELEX:02004L0008-20090420&qid=1409052593848&from=EN 74 Gas Networks Ireland: https://www.irishchpconference.com/ 75 SEAI. Cost Benefit Analysis of the potential for High-Efficiency Cogeneration and Efficient District Heating & Cooling in Ireland. https://ec.europa.eu/energy/sites/ener/files/documents/20151221%20SEAI%20EED%20ART14%20-%20Final.pdf
76 Lucia, U., Simonetti, M., Chiesa, G. and Grisolia, G. (2017). Ground-source pump system for heating and cooling: Review and thermodynamic approach. Renewable and Sustainable Energy Reviews, Volume 70, p. 867-874. Available at: https://www-sciencedirectcom.ucd.idm.oclc.org/science/article/pii/S1364032116310504 [Accessed 06/02/2021].
Teagasc Oak Park, The biomass CHP plant at Teagasc Oak Park is an example of a small-scale plant in the county. The plant uses wood chips as a fuel. The wood chips are gasified (i.e. turned into a gas) in the first step in the process. The gas is then conducted into a gas boiler where it is burned to generate heat. Heat generated in the boiler is used to heat hot water, but the heat is also conducted via heat exchangers into an external combustion engine called a Stirling engine where the heat is used to turn the engine and generate electricity.

REPORT
MDR1669 | DRAFT CARLOW COUNTY RENEWABLE ENERGY STRATEGY | A03 | July 2021 rpsgroup.com Page 59
discharged elsewhere. The limitations of an open-loop system include the proximity to a groundwater source, the potential for water contamination and pipe corrosion.
The GSI Geothermal maps have been used to determine the most suitable type of ground source heat collector for use with heat pump technologies in County Carlow. The Geothermal Heatmap map (Figure 6-9) shows that there is a shallow geothermal solution for heating or cooling for every location in Carlow. The geothermal suitability maps assign a rating from Generally Unsuitable to Highly Suitable for each type of heat collector/cooling system. See Figure 6-10 for the Larger Commercial & Industrial Processes map.

© OpenStreetMap (and) contributors,CC-BY-SA
NOTE:
Drawn By:Checked By:
Scale:Approved By:
Date:NAXX
@ A4XX
Project No.
File Ref:Client
Title Issue DetailsProject
Carlow Renewable Energy Strategy
MDR1669Arc0015A01
1. This drawing is the property of RPS Group Ltd. It is aconfidential document and must not be copied, used,or its contents divulged without prior written consent.
2. Ordnance Survey Ireland Licence ©Copyright Government of Ireland.
West Pier Business Campus,Dun Laoghaire,Co Dublin, Ireland.
Tel: +353 (0) 1 488 2900Email: [email protected] Web Page: rpsgroup.com/ireland
MDR1669
1:460,000
07/04/2021
EN 0005021
±
© OpenStreetMap (and) contributors,CC-BY-SA
© OpenStreetMap (and) contributors,CC-BY-SA
© OpenStreetMap (and) contributors,CC-BY-SA
10m depth 1000m depth
5000m depth2500m depth
±
Data Sources: Carlow County Council;SEAI: https://gis.seai.ie/server/rest/services
Figure 6.9 Geothermal Maps
CalculatedTemperature
0 - 20
20 - 30
30 - 40
40 - 50
50 - 60
60 - 70
70 - 80
80 - 90
90 - 100
100+

Carlow
Tullow
Ballon
Muinebeag (Bagenalstown)
Borris
Rathvilly
Tinriland
Bunclody-Carrickduff
Graiguenamanagh-Tinnahinch
Leighlinbridge
Clonegal
Hacketstown
Kernanstown
Myshall
Palatine
Fennagh
Kildavin
Ballinabrannagh Rathtoe
© OpenStreetMap (and) contributors, CC-BY-SA, GSI
NOTE:
Drawn By:Checked By:
Scale:Approved By:
Date:NAIP
@ A4CB
Project No.
File Ref:Client
Title Issue DetailsProject
Carlow Renewable Energy Strategy
MDR1669Arc0016A01
LegendCSO Settlement Envelope
Boreholes 100m
Geological Faults
Open loop (Larger Commerical &Industrial Processes) suitability mapSuitability
Highly Suitable
Suitable
Probably Suitable (unless provedotherwise/site assessmentrequired)Possibly Unsuitable (siteassessment required)Generally Unsuitable (siteassessment required)Water
1. This drawing is the property of RPS Group Ltd. It is aconfidential document and must not be copied, used,or its contents divulged without prior written consent.
2. Ordnance Survey Ireland Licence ©Copyright Government of Ireland.
West Pier Business Campus,Dun Laoghaire,Co Dublin, Ireland.
Tel: +353 (0) 1 488 2900Email: [email protected] Web Page: rpsgroup.com/ireland
MDR1669
1:230,000
07/04/2021
EN 00050192021
±
Data Sources: Carlow County Council; SEAI; EPA; GSI.
Figure 6.10Geothermal Resource - Open Loop LargerCommercial & Industrial Suitability

REPORT
MDR1669 | DRAFT CARLOW COUNTY RENEWABLE ENERGY STRATEGY | A03 | July 2021 rpsgroup.com Page 62
6.5.3 Micro-hydroelectric
Micro-hydroelectric power is discussed in detail in Section 6.4 above.
6.5.4 Existing Initiatives
The SEAI77 offers homeowners a rebate of €900 for each kW of solar PV installed up to 2 kW to support the installation of Solar PV panels and battery energy storage systems. The support is extended to 4 kW if a battery storage system is also installed. The rebate is available to all owners of dwellings built and occupied before 2011. A solar water heating grant is available for up to €1200. A heat pump system grant of up to €3500 is available for a variety of heat pump systems.
The Electric Ireland Micro-Generation Pilot Scheme78 supports existing domestic customers in installing domestic micro-generators and offers an export payment rate of 9.0 cent per kWh. This scheme was closed to new customers in 2014. ESB Networks accepts new applications to connect micro-generators to the electricity network. Surplus electricity exported to the ESB Networks Low Voltage (LV) System is subject to a rated maximum output of 6 kW when the connection is single phase and 11 kW when the system is three-phase. When the generator and import/export meter have been installed, the customer must contact their electricity supplier regarding payment arrangements for any electricity exported to the grid. There is no charge to connect a micro-generator to the ESB network. There is a charge of €340 to install an import/export meter.
The Microgeneration Support Scheme Bill 201779 was presented to Dáil Éireann in December 2017 and is currently at Dáil Third Stage. It is an Act to "provide for the growth of electricity production from micro-generators through a supplier obligation to provide a tariff for electricity exported to the grid". It is also a key provision of the EU's clean energy package and, in particular, the recast renewable energy directive. If adopted, the bill would force energy suppliers, notably the ESB, to buy electricity produced by “microgenerators” including small communities, clubs and schools and would oblige suppliers to provide a “feed-in tariff’ to those who export electricity to the grid.
A new Microgeneration Support Scheme (MSS) is being designed to enable individuals, farmers, businesses and community groups to sell renewable electricity into the grid. The scheme design seeks to establish the ‘renewables self-consumer’ model of energy generation and consumption in Ireland to achieve 2030 targets for renewable energy.80
6.5.5 Key Success and Failure Factors
Micro generation and the introduction of new renewable technologies conflicts with the traditional use of coal and peat and this is a major behavioural change that needs to be tackled throughout Ireland. Education and awareness initiatives need to be improved to provide more information to the general public about micro-generation technologies and their benefits. Another key barrier that will need to be addressed is the perceived high initial cost of capital, high installation costs, long pay-back periods. However, the large proportion of agricultural land and one-off housing within the county means there is suitable space for small-scale wind turbines, ground and/or roof mounted solar PV panels or small-scale CHP plants.
There is also a well-established SEC network within Carlow. These SECs promote and raise awareness of micro generation technologies in Carlow. SECs can continue to develop as they learn from each other and network across other counties.
77 https://www.seai.ie/grants/home-energy-grants/solar-electricity-grant/ [Accessed 08/02/2021] 78 https://www.electricireland.ie/residential/help/micro-generation/electric-ireland-micro-generation-pilot-scheme 79 Microgeneration Support Scheme Bill 2017 https://www.oireachtas.ie/en/bills/bill/2017/155/ [Accessed 02/02/2021]
80 Microgeneration Support Scheme [Accessed 19/02/2021]

REPORT
MDR1669 | DRAFT CARLOW COUNTY RENEWABLE ENERGY STRATEGY | A03 | July 2021 rpsgroup.com Page 63
6.5.6 Potential Opportunities
6.5.6.1 Micro Wind
In general, there is a very good wind resource in Carlow. However, due to differences in local climate conditions, wind speeds and directions, along with ground conditions and obstructions, potential can vary from site to site. Sites must therefore be assessed individually for wind energy micro-generation suitability. Generally speaking, the ideal location is on top of a high tower on a south westerly facing hill with gently sloping sides surrounded by clear countryside which is free from obstructions such as trees, houses or other buildings. Here the wind flows relatively smoothly and steadily enabling it to drive wind turbines with greater efficiency. The Irish Wind Energy Association (IWEA) recommends carrying out a detailed assessment of the wind resource of a potential site, including erecting a wind monitoring mast at turbine height for at least 12 months. This will give more accurate information on the wind resource on the site in terms of both wind speed and direction, distribution and levels of turbulence and will indicate the varying level of annual energy production.
The SEAI Wind Map81 shows the wind speed at different heights across the country. The wind resource in Carlow is better in the west and south east of the county. The top of Boolyvannanan reaches wind speeds of 6.4 m/s at a height of 20 m. The highest wind speeds in the County are located at the top of Mount Leinster and the surrounds of Raheendarragh with wind speeds reaching of 10.4 m/s at a height of 20m. The output of a turbine is greatly affected by the wind speed as the power developed in wind is proportional to the speed of the wind cubed; a turbine at 20 m with a rotor diameter of 8 m, assuming a power coefficient of 35 %, will generate approximately 9 MW at a wind speed of 6 m/s and 73 MW at a wind speed of 12 m/s.
6.5.6.2 Solar PV
With the most common silicon solar panels typically 1 sq. m of panels will generate ~150W of power on a clear sunny day, enough to power a laptop computer. A home solar PV system sized at 20 m2 (~3kW) would generate around 2,600kWh of electricity a year if well-located, over 40% of the typical annual electricity demand of an Irish home.82 The suitability of a site for solar depends on the solar resource, slope of the land, accessibility and the potential for over shading.
The SEAI domestic solar PV electricity calculator estimates annual savings of €269/year and an estimated payback period of 9 years in Carlow.83
6.5.6.3 Solar Thermal
The level of heating provided by solar thermal collectors depends on the solar resource, the efficiency of the technology and the area covered by the solar collectors. The preferred location for solar collectors is on a south-facing roof with a tilt angle of 30° to 45°. Southeast and southwest facing installations are also viable, with only a 5% reduction in the output.84 In domestic applications, the systems can typically provide 50% to 60% of the annual hot water requirement. Water heating accounts for 19% of residential energy use nationally.85 A solar thermal collector system installed on a dwelling in Carlow has potential to reduce the energy consumption of that dwelling by 0.16 toe.
6.5.6.4 Micro Combined Heat and Power (CHP)
In 2015 the national operational capacity of biomass fired CHP plants was 5.4 MWe (Megawatt electrical), accounting for 1.7% of the total capacity. Nationally, hotels and leisure centres account for 41% of CHP units in the services sector and the hospital sub-sector accounts for 11%. These sub-sectors benefit from having close to relatively consistent demand for heat and electricity. Due to the dispersed rural population in Carlow, district heating is only potentially viable in towns such as Carlow, Tullow and Mhuine Bheag. Micro CHP
81 http://maps.seai.ie/wind/ 82 SEAI. Frequently Asked Questions on Solar Photovoltaics. Available at: https://www.seai.ie/resources/publications/FAQs_on_Solar_PV.pdf
83 https://www.seai.ie/tools/solar-electricity-calculator/ 84 SEAI, A Homeowner’s Guide to Solar Thermal for Hot Water https://www.seai.ie/resources/publications/Homeowners-Guide-To-Solar-Thermal.pdf [Accessed: 05/04/2021]
85 In domestic applications, the systems can typically provide 50% to 60% of the annual hot water requirement.

REPORT
MDR1669 | DRAFT CARLOW COUNTY RENEWABLE ENERGY STRATEGY | A03 | July 2021 rpsgroup.com Page 64
plants allow domestic users to generate their own electrical energy onsite using locally available woodchips. Heat generated can be used to heat the dwelling, displacing oil heating systems.
6.5.6.5 Ground Source Heat Pump (GSHP)
The SEAI Geothermal Mapping System86 has classified the area south and south west of Carlow as generally “suitable” for vertical closed loop GSHPs. The area of Carlow town and south of Carlow town are ‘generally unsuitable’ The majority of the remainder of the county is classified as “probably” or “possibly” suitable, with assessments specific to each site required.
6.5.7 Micro-hydroelectric
With the number of unexploited sites identified in Section 6.4 above, there is the possibility for a number of similar schemes throughout the county.
6.5.8 Policy and Objectives
Table 6-16 below outlines the objectives and supporting polices in relation to microgeneration and community energy over the short (1 – 2 years), medium (2 – 6 years), and long term (6 – 10 years).
Table 6-16: Microgeneration and Community Energy Objectives and Polices
Name Description Short Term
Medium Term
Long Term
Objective MG1 To facilitate micro-renewable energy installations Policy MG1.1 To encourage the retro fit of domestic and commercial
buildings with micro generation technologies and improve the environmental performance of buildings
Policy MG1.2 To actively promote the use of micro-renewable technologies throughout the County for all redevelopment / extension / expansion projects.
Policy MG1.3 To promote the uptake of incentives, schemes, grants and other available funding to improve energy efficiency.
86 http://maps.seai.ie/geothermal/

REPORT
MDR1669 | DRAFT CARLOW COUNTY RENEWABLE ENERGY STRATEGY | A03 | July 2021 rpsgroup.com Page 65
6.6 Renewable Transport
6.6.1 Overview
It is estimated that 53 ktoe of energy was consumed by transport in Carlow in 2019.This accounts for 35 % of total energy consumption.87 Carlow’s rural landscape, dispersed population and lack of public transport have led to high levels of private car ownership. According to the 2016 Census88 84 % of households in Carlow were in possession of one or more motor cars, compared to 82% nationally. It is estimated that private car energy consumption accounted for 43.5% of total energy consumed in the transport sector in Carlow in 2016, compared to 41% nationally. 89 A total of 285 million kilometres were driven by private cars in Carlow, accounting for 1.4% of the total kilometres driven nationally. Transport investment in the region and the Urban Regeneration Development Fund, as part of Project Ireland 2040, aims to expand attractive public transport and other alternatives to car transport. A shift away from private car to greater use of active travel (walking and cycling) and public transport (e.g. bus)90 is envisaged.
Ireland was obliged to achieve a minimum target of 10% renewable energy in the transport sector by 2020 under the EU Renewable Energy Directive 2009/28/EC.91 Ireland’s transport sector is currently dependent on imported oil. In 2019, renewable transport in Ireland stood at 8.9%, 99% of which came from bioenergy, including biodiesel and biomethane. The use of biofuels in transport has increased from 1 ktoe in 2005 to 188.1 ktoe in 2019. This is equivalent to 4.7% of overall national petrol and diesel consumption. Reducing reliance on traditional fossil fuels is of utmost importance for Carlow to meet the 10% RES-T target and to move towards carbon neutrality. This can be achieved through the adoption of electric vehicles and the use of alternative transport fuels, primarily biofuels. Biofuels for use public transport or ‘captive fleets’92 can have a significant impact on the reduction of GHG emissions.
6.6.2 Existing initiatives
On a national level, the National Renewable Energy Action Plan (NREAP)93 specifies a two-pronged strategy that combines increased use of biofuels with the accelerated development and use of electric vehicles (EVs) in Ireland. The national Biofuel Obligation Scheme 2010 obliges all road transport fuel suppliers to use biofuel in the fuel mix. The progressive increases in the obligation rate, currently set at 8.695%, with 11% proposed for 1 January 2020, has led to increased use of biofuels. 94 The scheme is considered the primary policy measure used to increase the share of renewables in the transport sector.
The Government has set a target of 950,000 EVS on the road by 2030. ESB is responsible for the rollout of EV charging points across the county. The e-cars Charge Point Map95 shows the locations of these charging points. Of a total of 1,100 public, standard, and fast charging points in the country, 19 charging points are currently located in Carlow; see Table 6-17.
Table 6-17: Location of charging points in Carlow Location Type Details
Four Lakes Retail Park, Dublin Road, Carlow Town
• CHAdeMO Socket 50kW • Combo CCS Socket 50kW • AC43 Socket 43 kW
• 1 x DC charge point, €0.305/kWh • 1 x DC charge point, €0.305/kWh • 1 x DC charge point, €0.305/kWh
87 Carlow Energy Model. 88https://www.cso.ie/px/pxeirestat/Database/eirestat/Summary%20Results%20Part%202/Summary%20Results%20Part%202_statbank.asp?SP=Summary Results Part 2&Planguage=0
89 https://www.seai.ie/resources/seai-statistics/key-statistics/transport/ 90 Sustainable-Tranport-on-National-Road-Schemes.pdf [Accessed: 05/04/2021] 91 https://www.seai.ie/resources/publications/Renewable-Energy-in-Ireland-2019-Infographic-.pdf 92 Captive fleets have centralised fuelling points and fuel purchasing options. 93 DCCAE. National Renewable Energy Action Plan 2018 94 Biofuels Obligation Scheme https://assets.gov.ie/27459/6b584c067783491d972c57c2b08bd63b.pdf 95 https://www.esb.ie/our-businesses/ecars/charge-point-map

REPORT
MDR1669 | DRAFT CARLOW COUNTY RENEWABLE ENERGY STRATEGY | A03 | July 2021 rpsgroup.com Page 66
Location Type Details Town Hall Car Park, Off Barrow Track, Carlow Town Type-2 AC Socket 22kW 2 x AC charge points, €0.268/kWh
Public Car Park, Kennedy Street, Carlow Town Type-2 AC Socket 22kW 2 x AC charge points, €0.268/kWh
Irish Rail, Railway Road, Carlow Town Type-2 AC Socket 22kW 2 x AC charge points, €0.268/kWh Hanover Bus Car Park, Barrack Street, Carlow Town, Carlow Type-2 AC Socket 22kW 2 x AC charge points, €0.268/kWh
Tesco Carlow, Fairgreen Shopping Centre Type-2 AC Socket 22kW 2 x AC charge points, €0.268/kWh
Inner Relief Road, Tullow Type-2 AC Socket 22kW 2 X AC charge points, €0.268/kWh Tesco Tullow, Abbey Street, Templeowen, Tullow Type-2 AC Socket 22kW 2 X AC charge points, €0.268/kWh
The Parade, Bagenalstown, Carlow Type-2 AC Socket 22kW 2 x AC charge points, €0.268/kWh
There are a number of other charging points located in towns in surrounding counties, namely; Athy, Bunclody Enniscorthy, New Ross.
The SEAI96 offers a number of benefits for EV customers, including a government incentive of up to €5,000 grant per vehicle and up to €5,000 Vehicle Registration Tax relief, €120 motor tax band for electric vehicles and a government grant of up to €600 towards home charging point. EVs are entitled to 50% saving on motorway tolls.
6.6.3 Potential Opportunities
In 2009 the government published Smarter Travel - A Sustainable Transport Future: A new Transport Policy for Ireland 2009- 2020.97 This document outlines number of energy efficiency and conservation measures that can be adopted in Carlow to reduce the transport energy use in the county. Such measures include the use and improvement of rural/urban public transport services, promotion and prioritisation of walking and cycling, promotion of car sharing, and reduction in overall travel demand.
Due to the high level of private car use, there is potential to reduce transport energy consumption in Carlow by switching from conventional internal combustion engine vehicles to electric vehicles. According to the ESB ecars Cost Calculator,98 switching to a Nissan Leaf from a petrol car equivalent saves €0.10 in fuel costs and 67 grams CO2 per kilometre driven. Switching to a Nissan Leaf from a diesel car equivalent saves €0.07 in fuel costs and 40 grams CO2 per kilometre driven. It is estimated that switching the entire private car fleet from petrol and diesel to electric vehicles can save approximately 11.5 ktoe of energy. This equates to 87% of the total private car energy use and 31% of the total transport energy use in 2019. 65% of the population in Carlow who travel to work or school have a travel time of less than half an hour. Applying the more realistic assumption that only the population that have a travel time of less than half an hour switch to electric vehicles, the total final energy consumption savings are estimated to be 7.5 ktoe.
In Carlow, 95% of dwellings are detached, semi-detached and terraced houses, making them suitable for EV ownership as the majority them would be capable of charging an EV from the house. However, more public charging points are required to allow for the widespread uptake of EVs. Nationally there is an average of one charge point for 4,000 people, while in Carlow there is one charge point for 3096 people.
Biofuel refineries must be quite large to achieve economies of scale, and so are rare in Ireland. Biofuels are produced from crops such as wheat and oil seed rape. The SEAI bioenergy map99 estimates the total potential energy content of oilseed rape to be 721 ktoe (see Table 6-10), if all land of high, medium and low suitability for the growth of oilseed rape were dedicated to the growth of the crop.
96 https://www.seai.ie/grants/electric-vehicle-grants/grant-amounts/ 97 http://www.smartertravel.ie/sites/default/files/uploads/2012_12_27_Smarter_Travel_english_PN_WEB%5B1%5D.pdf 98 https://www.esb.ie/our-businesses/ecars/ecars-cost-calculator 99 http://maps.seai.ie/bioenergy/

REPORT
MDR1669 | DRAFT CARLOW COUNTY RENEWABLE ENERGY STRATEGY | A03 | July 2021 rpsgroup.com Page 67
6.6.4 Key Success and Failure Factors
Success Factors:
• Large area of land suitable for growing biomass for biofuel production; and
• Large proportion of detached, semi-detached, and terraced housing are suitable for EV home charging.
Failure Factors:
• Rural, dispersed population has resulted in a poor public transport system and a heavy reliance on private cars; and
• Availability of charging points in public areas.
6.6.5 Policy and Objectives
Table 6-18 below outlines the objectives and supporting polices in relation to renewable transport over the short (1-2 years), medium (2-6 years), and long term (6 to 10 years).
Table 6-18: Renewable Transport Objectives and Polices
Name Description Short Term
Medium Term
Long Term
Objective T1 To promote renewable transport options in Carlow for both private cars and commercial vehicles.
Policy T1.1 To facilitate the installation of charging points for Electric Vehicles at suitable public locations
Policy T1.2 To develop renewable energy solutions for the vehicle fleet operated by Carlow County Council.
Policy T1.3 To encourage and support use of low carbon energy sources for public transport and other transport fleets.

REPORT
MDR1669 | DRAFT CARLOW COUNTY RENEWABLE ENERGY STRATEGY | A03 | July 2021 rpsgroup.com Page 68
6.7 Renewable Heat
6.7.1 Overview
64 ktoe of energy were consumed as heat energy in Carlow in 2019, accounting for 42% of total energy consumption in the county. The majority of this consumption took place in the residential sector, with the rest occurring in industry and services.100
Carlow’s thermal energy consumption is highly dependent on oil, with 50% of Carlow’s total energy consumption provided by oil, followed by electricity at 21%. The county benefits from the gas network (19%). Heat demand for Carlow based on SEAI mapping is provided in Table 6-19.
Table 6-19: Heat Demand for Carlow101
ED Name Heat
demand 2015
(MWh)
Water heat demand
2015 (kWh/m)
Road heat demand
2015 (kWh/m)
Building Demand (KWh)
Commercial Heat Demand 2015 (MWh)
Industrial Heat Demand 2015 (MWh)
Population
County 167,094 28,346 83,527 2,136 10,290 11,552 54,612 Carlow 99,872 67,700 114,386 8,001 15,122 6,026 18,128 Tullow 19,547 9,267 12,490 1,192 2,540 493 4,116
Muine Bheag 17,530 13,456 8,333 1,053 2927 1,489 3,421 Leighlinbridge 8,499 8,635 1,755 291 566 12 1,558
Graigue 6,331 3,863 6,961 582 472 50 1,272 Hacketstown 6,567 5,388 1,240 193 569 205 1,091
Ireland is obliged to achieve a minimum target of 12% of heat to come from renewable sources by 2020 under the EU Renewable Energy Directive 2009/28/EC.102 As of 2019, this figure stood at 6.3%. The renewable heat target is unlikely to be met by 2020. Ireland’s low share of renewable heat is a key reason for a failure to meet 2020 renewable energy targets. Nationally, renewable heat is dominated by biomass in industry. There has been an increase in the use of renewable heat in the residential sector with the uptake of air-source heat pumps. In 2019, the useful heat from CHP met 5.7% of Ireland’s total thermal energy demand.
6.7.2 Existing initiatives
The Support Scheme for Renewable Heat103 has been designed to replace fossil fuel heating systems with renewable energy technologies. The Scheme will contribute to meeting Ireland's 2020 renewable energy and emission reduction targets. It will focus on heat users in the Non-Emissions Trading (non-ETS) sector. This includes commercial, industrial, agricultural, district heating, public sector, and other non-domestic heat users. The Scheme is made up of two support mechanisms – an on-going operational support for biomass boiler and anaerobic digestion heating systems and an installation grant for electric heat pumps. The Scheme is now open for applications for heat pump installation grants.
The Afforestation Grant and Premium Scheme 2014 - 2020104 aims to increase the area under forest in Ireland to 18% of total land cover. In doing so, the scheme aims to contribute towards climate change mitigation and to produce biomass for energy production. Support will take the form of grants and annual premiums towards the costs of agricultural income foregone, establishment, and maintenance.
100 Carlow Energy Model 101 https://gis.seai.ie/heatdemand/ 102 https://www.seai.ie/resources/publications/Renewable-Energy-in-Ireland-2019-Infographic-.pdf 103 https://www.seai.ie/sustainable-solutions/support-scheme-renewable-/ 104 Department of Agriculture, Food, and the Marine. Afforestation Grant and Premium Scheme 2014 - 2020. Accessed at: https://www.agriculture.gov.ie/media/migration/forestry/grantandpremiumschemes/2015/AfforestationSchemeEd2190315.pdf

REPORT
MDR1669 | DRAFT CARLOW COUNTY RENEWABLE ENERGY STRATEGY | A03 | July 2021 rpsgroup.com Page 69
The Energy Efficiency Obligation Scheme (EEOS) places an obligation on energy suppliers and distributors to deliver energy savings. Energy suppliers have targets, credits are achieved through energy saving projects to make homes or businesses more energy efficient.105
High Efficiency CHP cogeneration plants are eligible for tax relief from carbon tax. Tax relief takes into the consideration the higher efficiency and reduction in emissions of the CHP plants.106
6.7.3 Potential Opportunities
Heat energy is difficult to transport over a significant distance in an efficient way. As a result, heat energy tends to be generated from a diverse range of technologies, using a diverse range of fuels, installed close to each individual demand site. Renewable heat technologies include solar thermal for water heating and heat pumps – both ground source and air-source - for space and water heating. The potential for the uptake of these technologies at a domestic or commercial scale in Carlow is discussed in Section 5.5. The use of small-scale CHP is also discussed in Section 5.5.
District Heating (DH) networks are thermal energy networks that distribute hot water or steam through insulated dual (supply and return) pipelines to serve commercial, residential, institutional, and industrial energy needs for space heating, hot water, space cooling and industrial purposes. DH systems allow heat energy as distinguished from fuel to be bought and sold as a commodity. Ireland has one of the lowest shares of DH in Europe at less than 1% of the heat market. DH systems that use sources such as biomass and waste heat from electricity production and industry are considered renewable heat systems. Once a DH system is established, it is possible to connect many sources of heat. High levels of recycled heat and renewable sources serve to lower the emissions from a DH system and the cost of heat to the end consumer. When CHP is added to the DH system there are significant improvements in energy conversion efficiency as low value heat resources, which would otherwise go to waste, are captured.
The Irish District Energy Association has developed an All Island Heat Atlas which explores the potential for District Heating. Potential for DH shown in Table 6-20 is based on Heat Demand Atlas mapping107
Table 6-20: Suitability criteria for District Heating
Suitability for District Heating Heat Density Locations within County Carlow
Very high DH suitability >300 TJ / km2
Feasible for DH 120 – 300 TJ / km2 Carlow Town, Muine Bheag
Feasible Subject to Policy / Regulation
50 – 120 TJ / km2 Carlow Town, Muine Bheag, Tullow, Ballon, Fennagh, Myshall
Future potential 20 – 50 TJ / km2 Carlow Town, Muine Bheag, Tullow, Ballon, Fennagh, Myshall, Borris
The economic feasibility of a DH system in a region depends on the heat density of the region, baseline heating costs and heat supply price. The majority of Carlow’s dwellings are dispersed in rural locations with low heat density, rendering them unsuitable for DH development.108. The largest heat demand in the county is Carlow Town. The next largest heat demand is in Tullow followed by Muine Bheag. Areas in these towns are ‘Suitable for District Heating’ with heat density areas of 120 -300TJ/km2. Based on the heat demand classification of the Heat Atlas, other areas of County Carlow are feasible subject to policy regulation and support. Development in DH technology could increase the feasibility of DH systems in other areas of Carlow.
Carlow’s large biomass resource is an excellent resource to provide low carbon, cost attractive fuel for a DH system. The biomass can be harvested close to the system, resulting in low transport costs. Large industries
105 https://www.seai.ie/business-and-public-sector/business-grants-and-supports/energy-efficiency-obligation-scheme/ 106 https://www.revenue.ie/en/companies-and-charities/excise-and-licences/energy-taxes/he-chp/index.aspx 107 https://euf.maps.arcgis.com/apps/webappviewer/index.html?id=101b7da79a7d4e09a92402bd4ce8384c

REPORT
MDR1669 | DRAFT CARLOW COUNTY RENEWABLE ENERGY STRATEGY | A03 | July 2021 rpsgroup.com Page 70
in Carlow, potentially have waste heat from industry that could be used in individual DH systems or incorporated into a larger DH system.
6.7.4 Key Success and Failure Factors
Public bodies are identified as key enablers of DH, particularly where larger scale co-ordination of projects is required among diverse stakeholders. The development of DH will require coordinated, local-level action to effectively plan for successful wide-spread DH implementation. Most barriers to development of DH are non-technical, as the technologies used are themselves not new or innovative. With the large domestic biomass resources in Carlow and suitability of the towns such as Carlow with relatively high heat densities, DH has the potential to integrate more renewables into the heating system and reduce Carlow’s dependency on oil. However, there are no guidelines, regulations, policies, frameworks, or standards for DH in Ireland. A national policy framework to encourage the development of DH is planned, as outlined in the national level energy white paper Ireland’s Transition to a Low-Carbon Energy Future, but since this paper was published, there has been no announcement on the timeline of this framework. Also, heat energy is required and created at an individual building level and is therefore fundamentally a local level issue. The role of local authorities is crucial in the development of DH. There is a need for integrated land-use, energy, and infrastructural planning in order to progress DH development, and the local authorities are ideally placed to oversee that this integration occurs. Most local authorities in cities with DH have used planning policy and local regulations to promote and develop DH. The local authorities in Ireland are not obliged from a national level to implement such energy plans and are not given the equivalent resources.
6.7.5 Policy and Objectives
Table 6-21 below outlines the objectives and supporting polices in relation to renewable heat over the short (1-2 years), medium (2-6 years), and long term (6 to 10 years).
Table 6-21: Renewable Heat Objectives and Polices
Name Description Short Term
Medium Term
Long Term
Objective H1 To reduce dependency on fossil fuels for domestic and commercial heating
Policy H1.1 To support and facilitate the installation DH technologies in new developments
Policy H1.2 To facilitate the development of CHP plants for DH in industrial zoned areas
Policy H1.3 To support the use of renewable heat in residential and commercial developments, such as heat pumps.
Policy H1.4 To encourage the use of renewable heat solutions as part of the design and planning process for new developments and refurbishments

REPORT
MDR1669 | DRAFT CARLOW COUNTY RENEWABLE ENERGY STRATEGY | A03 | July 2021 rpsgroup.com Page 71
7 SUMMARY OF RENEWABLE ENERGY STRATEGY 7.1 Overall Targets Carlow aims to improve its energy efficiency and to increase the overall share of renewable energy in electricity, transport and heat, playing its role in implementing Ireland’s Climate Action Plan. The emerging national renewable energy targets are included in Table 7-1, based on the National Energy and Climate Plan 2021-2030. These targets have yet to be fully confirmed by the Department of Environment, Climate, and Communications.
Table 7-1: Anticipated National Renewable Energy Targets for 2030 RES Target Target 2030 (%)109
Overall RES Target 34.1 RES-E 70 RES-H 24 RES-T 13.4
Embracing renewable energy will provide opportunities for employment and enterprise. A greater share of our expenditure on energy will be spent locally – for example installing and maintaining renewable energy systems, and growing energy crops. The energy transition also has the potential to improve quality of life by achieving better insulted homes, and quieter, cleaner modes of transport.
The following Table 7-2 summarises the renewable energy goals for 2030 and how these will be delivered.
Table 7-2: Summary of Targets and Delivery Actions for Carlow Sector Target to 2030 Delivery Actions
Energy Efficiency Improve energy efficiency by 50% by 2030 with a view to achieving carbon neutrality by 2050
Building awareness and motivating behavioural change. Engaging with SEAI and government programmes for energy efficiency. Investing in efficiency improvements such as insultation, lighting upgrades and low-energy appliances. Switching to low-carbon transport modes such as walking, cycling and public transport.
Climate Change Reduce CO2 equivalent emissions from public sector by 30%
Building awareness and motivating behavioural change across all sectors of society. Investing in efficiency improvements such as insultation, lighting upgrades and low-energy appliances Switching to low-carbon transport modes such as walking, cycling and public transport. Ambition to reduce
greenhouse gases by 7% per year to 2030, with a view to achieving carbon neutrality by 2050
Renewable Electricity
Install up to 130MW capacity
Enabling more wind farm development – up to 30 MW installed capacity (see Table 6-4). Enabling solar farm development – up to 100 MW installed capacity (see Table 6-8). Micro-generation including rooftop solar, wind, hydro-electric and bioenergy CHP.
109 National Energy and Climate Plan 2021-2030 . Table 5. [Accessed 22/02/2021]

REPORT
MDR1669 | DRAFT CARLOW COUNTY RENEWABLE ENERGY STRATEGY | A03 | July 2021 rpsgroup.com Page 72
Sector Target to 2030 Delivery Actions
Renewable Heat
Achieve 24% heat from renewable sources.
Commercial/Industrial sector: Greater use of bioenergy (biomass boilers, biogas and CHP), District Heating systems, and other low-carbon fuel sources. Greater use electrical heat pumps in place of fossil-fuel based systems. Household sector: Retrofitting of dwellings from oil/ coal/ peat to electrical heat pumps. Greater use of bioenergy (biomass) for domestic heating.
Renewable Transport
Achieve 13.4% of transport energy from renewable sources
Gradual switch from petrol and diesel cars to EVs Greater use of blended biofuels in petrol and diesel. For commercial vehicles and public transport: conversion to low-carbon alternative fuels (such as biodiesel, biogas, CNG, and hydrogen) Gradual switch to EVs where feasible (e.g. light commercial vehicles)
7.2 Roles and Responsibilities Implementing the Renewable Energy Strategy calls on all sectors of society in Carlow to make changes. A lot of work is needed in the next 10 years to move away from fossil-fuels and enable the renewable energy potential of the county to be achieved. The roles of various stakeholders are summarised below.
7.2.1 Role of Carlow County Council
• Provide leadership on energy efficiency and renewable energy.
• Continue to implement energy efficiency across County Council buildings and activities to reach new target of 50% energy efficiency improvements for the public sector by 2030.
• Develop a Decarbonisation Zone within County Carlow, as a living laboratory to demonstrate how carbon reduction can be achieved, including energy efficiency, renewable energy and sustainable transport systems.
• Support community energy initiatives throughout County Carlow.
• Use the planning system to encourage energy efficiency and use of renewable energy in new developments and refurbishments. Build energy sustainability into the planning of new residential and employment areas.
• Enable more public EV charging points to be developed at strategic locations in the County.
• Develop partnerships with business, industry and agriculture to enable innovation.
7.2.2 Role of 3 Counties Energy Agency
As the local energy agency for County Carlow, 3CEA is the engine room of energy innovation and good practice, it will play a central role in implementing the goals of this strategy.
• Provide leadership on energy efficiency and renewable energy.
• Assist community energy projects.
• Support energy innovation projects in the agriculture sector.
• Engage in research and dissemination of sustainable energy solutions.
• Develop partnerships with business, industry and agriculture to enable innovation.

REPORT
MDR1669 | DRAFT CARLOW COUNTY RENEWABLE ENERGY STRATEGY | A03 | July 2021 rpsgroup.com Page 73
7.2.3 Role of Community Sector
• Implement sustainable energy initiatives within their own communities, by building awareness of energy efficiency and developing projects that showcase good practice.
• Engage with SEAI Better Energy Community scheme.
• Engage with 3CEA, to inform and co-ordinate actions, and to avail of grant aid.
• Incorporate energy efficiency and renewable energy into community projects and facilities.
• Develop community owned and operated renewable energy projects such as solar farms and wind farms.
7.2.4 Role of Householders
• Implement energy efficiency measures such as home insultation and choosing energy efficient lighting and appliances.
• Make sustainable transport choices – walking, cycling, taking public transport, and car-sharing to reduce fossil-fuel based transport.
• Installing domestic renewable energy systems such as rooftop solar panels.
• Replace fossil-fuel boilers with renewable heat systems, such as electrical heat pumps.
• Make the switch to EVs instead of petrol or diesel cars.
• Use smart meters – a roll-out of which is underway across Ireland - to better manage household energy and enable revenue from micro-renewable generation.
7.2.5 Role of Business and Industry
• Engage with SEAI programmes in support of energy efficiency.
• Develop awareness and behavioural change to reduce energy consumption.
• Upgrade buildings and energy systems to achieve more efficiency and incorporate renewable energy.
• Develop partnerships to enable solutions like district heating to be achieved.
• Use investment in sustainable energy to reduce operational costs and drive efficiency.
• Support sustainable transport modes (walking, cycling, public transport) for staff, and EV charging.
7.2.6 Role of the Agricultural Sector
• Implement energy efficiency around the farmyard, for example by using low-energy lighting, appliances and equipment.
• Install rooftop solar PV systems on farm buildings to generate renewable electricity.
• Explore the potential to use biofuels or other renewable fuels in agricultural machinery.
• Explore the potential to generate biogas (biomethane) generation using agricultural slurry and residues, for use in transport, heating, or for injection into the natural gas grid.
• Consider growing bioenergy crops and using agricultural residues for bioenergy, as a source of heat or transport fuel, whilst minimising the impact on land use change.
• Explore bio-economy opportunities for farm residues.

Review of Regional/ County Level Plans, Programmes
and Policies
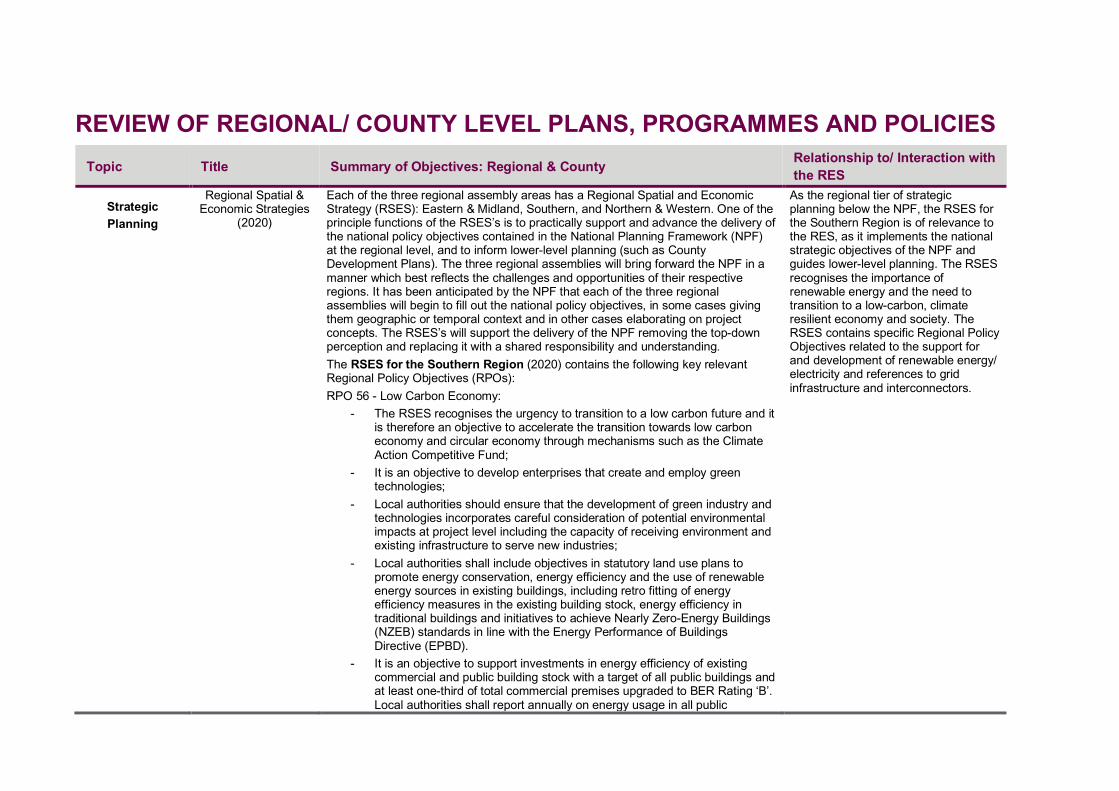
REVIEW OF REGIONAL/ COUNTY LEVEL PLANS, PROGRAMMES AND POLICIES Topic Title Summary of Objectives: Regional & County Relationship to/ Interaction with
the RES
Strategic Planning
Regional Spatial & Economic Strategies
(2020)
Each of the three regional assembly areas has a Regional Spatial and Economic Strategy (RSES): Eastern & Midland, Southern, and Northern & Western. One of the principle functions of the RSES’s is to practically support and advance the delivery of the national policy objectives contained in the National Planning Framework (NPF) at the regional level, and to inform lower-level planning (such as County Development Plans). The three regional assemblies will bring forward the NPF in a manner which best reflects the challenges and opportunities of their respective regions. It has been anticipated by the NPF that each of the three regional assemblies will begin to fill out the national policy objectives, in some cases giving them geographic or temporal context and in other cases elaborating on project concepts. The RSES’s will support the delivery of the NPF removing the top-down perception and replacing it with a shared responsibility and understanding. The RSES for the Southern Region (2020) contains the following key relevant Regional Policy Objectives (RPOs): RPO 56 - Low Carbon Economy:
- The RSES recognises the urgency to transition to a low carbon future and it is therefore an objective to accelerate the transition towards low carbon economy and circular economy through mechanisms such as the Climate Action Competitive Fund;
- It is an objective to develop enterprises that create and employ green technologies;
- Local authorities should ensure that the development of green industry and technologies incorporates careful consideration of potential environmental impacts at project level including the capacity of receiving environment and existing infrastructure to serve new industries;
- Local authorities shall include objectives in statutory land use plans to promote energy conservation, energy efficiency and the use of renewable energy sources in existing buildings, including retro fitting of energy efficiency measures in the existing building stock, energy efficiency in traditional buildings and initiatives to achieve Nearly Zero-Energy Buildings (NZEB) standards in line with the Energy Performance of Buildings Directive (EPBD).
- It is an objective to support investments in energy efficiency of existing commercial and public building stock with a target of all public buildings and at least one-third of total commercial premises upgraded to BER Rating ‘B’. Local authorities shall report annually on energy usage in all public
As the regional tier of strategic planning below the NPF, the RSES for the Southern Region is of relevance to the RES, as it implements the national strategic objectives of the NPF and guides lower-level planning. The RSES recognises the importance of renewable energy and the need to transition to a low-carbon, climate resilient economy and society. The RSES contains specific Regional Policy Objectives related to the support for and development of renewable energy/ electricity and references to grid infrastructure and interconnectors.

Topic Title Summary of Objectives: Regional & County Relationship to/ Interaction with the RES
buildings and will achieve a target of 33% improvement in energy efficiency in all buildings in accordance with the National Energy Efficiency Action Plan (NEEAP).
RPO 95: Support implementation of the National Renewable Energy Action Plan (NREAP), and the Offshore Renewable Energy Plan and the implementation of mitigation measures outlined in their respective SEA and AA and leverage the Region as a leader and innovator in sustainable renewable energy generation. RPO 96: Support the sustainable development, maintenance and upgrading of electricity and gas network grid infrastructure to integrate a renewable energy sources and ensure our national and regional energy system remains safe, secure and ready to meet increased demand as the regional economy grows. RPO 97: Support the sustainable technology upgrading and conversion of power stations in the Region to increase capacity for use of energy efficient and renewable energy sources. RPO 98: Support the development of a Regional Renewable Energy Strategy with relevant stakeholders. RPO 99: Support the sustainable development of renewable wind energy (on shore and offshore) at appropriate locations and related grid infrastructure in the Region in compliance with national Wind Energy Guidelines. RPO 100: Support the integration of indigenous renewable energy production and grid injection. RPO 101: Support continued innovation and research in the energy sector and to develop a role as an international hub for energy innovation. RPO 102: It is an objective to support initiatives for energy research funding within our Region to accelerate diversification away from fossil fuels to green energy, including the potential of wind, wave, solar, biomass, biofuels, biogas and hydrogen in the Region RP0 103: Interconnection Infrastructure It is an objective to support the sustainable development of interconnection infrastructure, in particular the potential for the sustainable development of an international connection between Ireland and France in the Region. RPO 104: It is an objective to support investment in initiatives to develop innovation, advances in technology and pilot projects for the sustainable development of energy storage and carbon capture within the Region and to work with key stakeholders in developing sustainable forestry, including initiatives for native tree planting and better management of peatland and soil management to support carbon sequestration and enhancement of biodiversity.

Topic Title Summary of Objectives: Regional & County Relationship to/ Interaction with the RES
RPO 105: It is an objective to support development of district heating schemes by promoting innovation in the use of recoverable heat sources and related technologies. RPO 106: It is an objective to support implementation of the National Energy Efficiency Action Plan, the implementation of mitigation measures outlined in their respective SEA and AA and investment in initiatives to improve energy efficiency and future proof our Region’s residential, commercial, industrial, agricultural and public building stock, including retrofitting in urban and rural areas and reduce fuel poverty. RSES supports the promotion of sustainable buildings that achieve certification under systems such as the Home Performance Index, Leadership in Energy and Environmental Design at local authority level. RPO 107: It is an objective to support innovative initiatives that develop the circular economy through implementation of the Regional Waste Management Plan for the Southern Region 2015-2021 and its successor. RPO 109: a) It is an objective to support the preparation of a Bio-energy Implementation Plan for the Southern Region in conjunction with the Local Authorities and the Regional Waste Management office. RPO 109: b) Proposals for Bio-energy development and infrastructure will need to be subject to robust site and/or route selection that includes consideration of likely significant effects on European Sites and subject to the outcome of the required appraisal, planning and environmental assessment processes
Regional Planning Guidelines for the South-East Region
2010-2022
The Regional Planning Guidelines for the South-East Region aim to provide a framework for long-term strategic development and ensure successful implementation of the National Spatial Strategy at regional, county and local level. It aims to integrate sustainable development with the protection and enhancement of the environment. It is an objective of the framework to formulate sustainable energy policies and practices which seek to: • Ensure security of energy supply in order to support economic and social
development; • Source energy at a price that does not adversely affect competitiveness; • Develop variable and alternative sources of energy generation; • Maximise the use of renewable energy technologies; • Promote a culture of energy conservation by all users; • Assist the development of indigenous sustainable energy enterprises; • Support and promote sustainable indigenous Bio-energy industries including
the Bio-ethanol industry.
The Regional Planning Guidelines for the South-East Region are directly relevant to the RES as it sets out the key objectives to formulate sustainable energy policies and practices in Carlow.

Topic Title Summary of Objectives: Regional & County Relationship to/ Interaction with the RES
Energy Transition Strategy to 2030
Energy Transition Strategy to 2030, launched by 3CEA, strategy maps the direction to be followed to 2030, addressing how the relevant stakeholders of the energy sector in the region will work together to deliver energy efficiency, clean energy, behaviour change and greater sustainability.
The Energy Transition Strategy to 2030 is directly relevant to the RES. 3CEA is the lead authority under the Climate Action Plan and have a critical role in supporting Carlow (Kilkenny, Wexford and Waterford) in reducing their CO2 emissions.
Carlow County
Development Plan 2015-2021
The County Development Plan (CDP) aims to develop and improve the social, economic, cultural and environmental assets of the county in a sustainable manner. The plan contains policies and objectives relating to settlements, land use, community services, transport, the commercial sectors, protecting the natural environment and heritage and utility services.
The CDP is in place until 2021, to be succeeded by the new CDP, to which this RES will contribute. The objectives and policies are of relevance to the RES, with direct support for the development of the RES (Energy – Policy 1 of the CDP).
Climate Change
Adaption Strategy 2019 -2024
The Climate Adaption Strategy is the process of adaptation planning in Carlow County Council and is the first step in increasing knowledge and understanding of the changing climate, growing resilience, and enabling effective responses to the threats posed by climate change. It contains the following key relevant objectives: • RM-14 To support the recording and monitoring of renewable energy potential
in the county in partnership with other stakeholders including SEAI. • RM-20 Identify sites for trialling renewable energy projects to reduce the need
for “Grey adaptation” measures • RM-25 Develop research and funding opportunities for climate adaptation,
renewable and energy efficiency project • RM-31 Explore potential for renewable energy/ micro generation at council
facilities. Including Powerstown Civic Amenity Site.
Of relevance to the RES in terms of process adaption planning in Carlow.
Carlow Noise Action
Plan 2018-2023 The Carlow Noise Action Plan aims to address issues associated with environmental noise from major roads and has been prepared in accordance with the requirements of the Environmental Noise Directive. The action planning area covers sections of the M9, N80, R724, R448 R430 & R417. Environmental noise is defined as unwanted or harmful outdoor sound created by human activities, including noise emitted by means of transport, traffic and noise in agglomerations over a specified size. The objective of the plan is to develop a sustainable approach to the planning and management of environmental noise within the region and to reduce the overall number of people exposed to high levels of noise. Management of the existing noise environment by prioritising areas for further assessment and mitigation and protect the future noise environment through
Of relevance to the RES in terms of considering the impact of potential additional noise from RE on receptors during construction and operational phases.
Topic Title Summary of Objectives: Regional & County Relationship to/ Interaction with the RES
incorporating acoustical planning into the planning process. The plan aims to prioritise, and act in the interest of, residential amenity and public health.
Carlow County
Council Corporate Plan 2014-2019
The Corporate Plan contains achievements, objectives and strategies for the area relating to economic and infrastructural development, culture, recreation, communities, organisations and the development of a cleaner and greener environment. CCC have committed to promoting and supporting the growth of the renewable energy sector in the county and striving to minimise the impact on the environment from all activities through implementing a climate change strategy and contributing to the development of sustainable energy practices and technologies.
Of relevance to the RES in terms of objectives and strategies for the county.
County Carlow 2021 Local Economic and
Community Plan
County Carlow 2021 Local Economic and Community Plan (LECP) aims to improve the well-being of the people and economy of the county. It provides a strategic framework for all publicly funded economic, local and community development programmes in the County with the objective of maximizing the social, community, cultural, sporting and economic development of County Carlow on a regional level.
Of relevance to the RES in terms of objectives and strategies for the county.
South-East Region
Bioenergy Implementation Plan
2008-2013
The primary aim of the plan is to promote the sustainable deployment of bioenergy within the South-East Region and to increase the production and consumption of bioenergy with the Region. Regional targets have been set for the penetration of bioenergy to the three sectors: heat, electricity and transport. The first set to be achieved by the end of 2010 and the next set to be achieved by the end of 2020.
Of relevance to the RES as it sets out regional targets for the South-East Region.
The Global Covenant of Mayors for Climate
and Energy
The Global Covenant of Mayors for Climate and Energy is a voluntary, bottom up, approach for cities and local governments to combat Climate Change and move towards a low emission, resilient society. The Global Covenant of Mayors for Climate and Energy brought the Compact of Mayors and the EU Covenant of Mayors under one international body in January 2017 incorporating over 9,000 cities and local governments. Carlow County Council is a signatory to the Covenant of Mayors.
Of relevance to the RES as Carlow is a signatory to the Covenant of Mayors