Embed Size (px)
Citation preview
DRAFT
Page 1 of 46
PERMIT APPLICATION REVIEW COVERED SOURCE PERMIT NO. 0793-01-C
Application for Initial Permit No. 0793-01 Company: Hawaiian Electric Company, Inc. Mailing P.O. Box 2750 Address: Honolulu, Hawaii 96840-0001 Facility: Schofield Generating Station
Six (6) Engine Generators Location: Schofield Barracks, Wahiawa, Oahu SIC Code: 4911 (Electric Services) Responsible Mr. Anthony G. Taparra Official: Manager, Generation Operations
(808) 543-4321 Contact: Ms. Karin Kimura
Senior Environmental Scientist (808) 543-4522
1. PROPOSED PROJECT Hawaiian Electric Company, Inc. (Hawaiian Electric) has applied for an initial covered source permit for the construction and operation of the proposed Schofield Generating Station. Hawaiian Electric is proposing to install and operate six (6) Wartsila 20V34DF reciprocating internal combustion engine (RICE) generators each with a peak generating capacity of 8.3 MW when fired on biofuel/diesel and 8.4 MW when fired on natural gas. The proposed units will burn biofuels, diesel, and biofuel/diesel blends with a maximum sulfur content of 0.0042% by weight (42 ppm) and natural gas with a maximum sulfur content of 1.75 grains per 100 SCF. 2. EQUIPMENT DESCRIPTION Unit Nos. Description S1, S2, S3, 8.3 MW/8.4 MW (peak) Wartsila engine generators, model no. 20V34DF, S4, S5, S6 serial nos. TBD, equipped with selective catalytic reduction and oxidation
catalyst. Note: 8.3 MW when fired on diesel no. 2, biodiesel, and blends of diesel no. 2 and biodiesel, and 8.4 MW when fired on natural gas. The maximum heat input per unit is 70.8 MMBtu/hr for diesel no. 2, biodiesel, and blends of diesel no. 2 and biodiesel, and 72.6 MMBtu/hr for natural gas.
DRAFT
Page 2 of 46
3. AIR POLLUTION CONTROLS The units will be equipped with selective catalytic reduction (SCR) to control NOX emissions. The design of the SCR system will limit ammonia slip to 10 ppmvd at 15% O2. CO, VOC, and PM emissions will be controlled by a combination of combustion design, good combustion practices, and an oxidation catalyst. SO2 emissions will be controlled by limiting the fuel sulfur content to 42 ppm for biofuels, diesel, and biofuel/diesel blends and the use of natural gas with a maximum sulfur content of 1.75 gr/100 SCF. Emissions of hazardous air pollutants will be controlled by the use of biofuels, diesel, biofuel/diesel blends, and natural gas, combustion system design, and oxidation catalyst. 4. APPLICABLE REQUIREMENTS Hawaii Administrative Rules (HAR) Title 11 Chapter 59, Ambient Air Quality Standards Title 11 Chapter 60.1, Air Pollution Control
Subchapter 1, General Requirements Subchapter 2, General Prohibitions
11-60.1-31, Applicability 11-60.1-32, Visible Emissions 11-60.1-38, Sulfur Oxides from Fuel Combustion 11-60.1-39, Storage of volatile organic compounds
Subchapter 5, Covered Sources Subchapter 6, Fees for Covered Sources, Noncovered Sources, and Agricultural Burning
11-60.1-111, Definitions 11-60.1-112, General Fee Provisions for Covered sources 11-60.1-113, Application Fees for Covered sources 11-60.1-114, Annual Fees for Covered sources 11-60.1-115, Basis of Annual Fees for Covered Sources
Subchapter 7, Prevention of Significant Deterioration Review Subchapter 8, Standards of Performance for Stationary Sources
11-60.1-161, New Source Performance Standards Subchapter 9, Hazardous Air Pollutant Sources Subchapter 10, Field Citations
Standard of Performance for New Stationary Sources (NSPS), 40 Code of Federal Regulations (CFR) Part 60 Subpart IIII – Standards of Performance for Stationary Compression Ignition Internal Combustion Engines is applicable to the engine generators because the engines commenced construction after July 11, 2005, and were manufactured after April 1, 2006. To comply with the definition of a compression ignition engine as defined in Subpart IIII, each engine generator shall be fired with an annual average of two percent or more liquid fuel (diesel no. 2, biodiesel) of total fuel on an energy equivalent basis. The permittee must comply with the applicable emission standards and compliance requirements for engines with a displacement of greater than or equal to 30 liters per cylinder.
DRAFT
Page 3 of 46
Subpart JJJJ – Standards of Performance for Stationary Spark Ignition Internal Combustion Engines is not applicable to the engine generators because the engines are not considered spark ignition internal combustion engines. As defined in Subpart JJJJ:
Spark ignition means relating to either: a gasoline-fueled engine; or any other type of engine with a spark plug (or other sparking device) and with operating characteristics significantly similar to the theoretical Otto combustion cycle. Spark ignition engines usually use a throttle to regulate intake air flow to control power during normal operation. Dual-fuel engines in which a liquid fuel (typically diesel fuel) is used for compression ignition and gaseous fuel (typically natural gas) is used as the primary fuel at an annual average ratio of less than 2 parts diesel fuel to 100 parts total fuel on an energy equivalent basis are spark ignition engines.
Hawaiian Electric’s agreement with the US Army contains a minimum biofuel consumption requirement. Each engine generator will be fired with an annual average of two percent or more liquid fuel (diesel no. 2, biodiesel) of total fuel on an energy equivalent basis. National Emission Standards for Hazardous Air Pollutants (NESHAP), 40 CFR Part 61 This source is not subject to NESHAPs because there are no standards applicable to this facility. NESHAPs for Source Categories (Maximum Achievable Control Technology (MACT)), 40 CFR Part 63 Subpart ZZZZ – National Emissions Standards for Hazardous Air Pollutants for Stationary Reciprocating Internal Combustion Engines (RICE) is applicable to the engine generators because the engines are new stationary RICE. A stationary RICE located at an area source of HAP emissions is new if you commenced construction of the stationary rice on or after June 12, 2006. A new stationary RICE located at an area source must meet the requirements of this part by meeting the requirements of 40 CFR Part 60 Subpart IIII. No further requirements apply for such engines under this part. Prevention of Significant Deterioration (PSD), 40 CFR Part 52, §52.21 This source is subject to PSD review because it meets the following three basic criteria: 1. The proposed project is a major stationary source that has the potential to emit 250 tons
per year or more of any regulated new source review (NSR) pollutant. A major stationary source, as defined in 40 CFR §52.21 and HAR, Chapter 11-60.1, Subchapter 7, is any source belonging to a list of 28 source categories which emits, or has the potential to emit, 100 tons per year or more of any regulated NSR pollutant, or any other stationary source which emits, or has the potential to emit, 250 tons per year or more of a regulated NSR pollutant. The proposed project is not listed under one of the 28 source categories. Therefore, the major source threshold for this project is 250 tons per year or more.
2. The proposed project will be located in an area that is designated as attainment or
unclassifiable. 3. The pollutants emitted in significant amounts are subject to PSD. For a new source which
is major for at least one regulated NSR pollutant, all pollutants which are emitted in amounts equal to or greater than the significant emission rate are also subject to PSD review.
DRAFT
Page 4 of 46
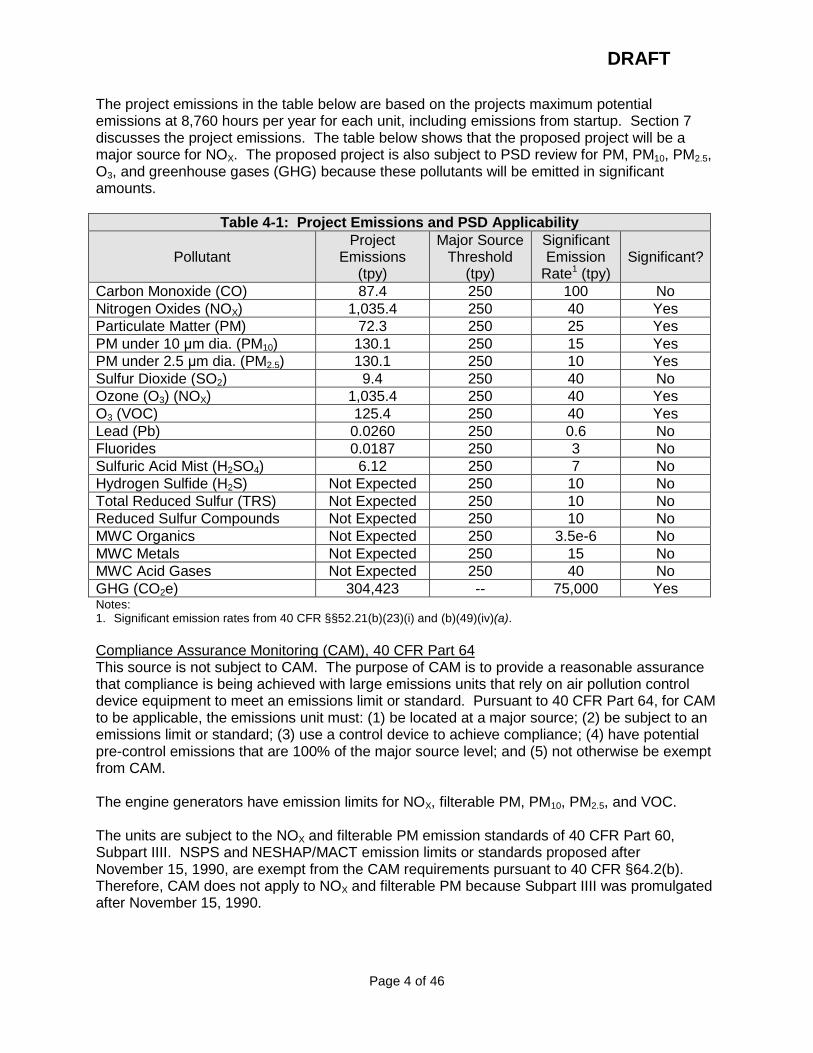
The project emissions in the table below are based on the projects maximum potential emissions at 8,760 hours per year for each unit, including emissions from startup. Section 7 discusses the project emissions. The table below shows that the proposed project will be a major source for NOX. The proposed project is also subject to PSD review for PM, PM10, PM2.5, O3, and greenhouse gases (GHG) because these pollutants will be emitted in significant amounts.
Table 4-1: Project Emissions and PSD Applicability
Pollutant Project
Emissions (tpy)
Major Source Threshold
(tpy)
Significant Emission
Rate1 (tpy) Significant?
Carbon Monoxide (CO) 87.4 250 100 No
Nitrogen Oxides (NOX) 1,035.4 250 40 Yes
Particulate Matter (PM) 72.3 250 25 Yes
PM under 10 μm dia. (PM10) 130.1 250 15 Yes
PM under 2.5 μm dia. (PM2.5) 130.1 250 10 Yes
Sulfur Dioxide (SO2) 9.4 250 40 No
Ozone (O3) (NOX) 1,035.4 250 40 Yes
O3 (VOC) 125.4 250 40 Yes
Lead (Pb) 0.0260 250 0.6 No
Fluorides 0.0187 250 3 No
Sulfuric Acid Mist (H2SO4) 6.12 250 7 No
Hydrogen Sulfide (H2S) Not Expected 250 10 No
Total Reduced Sulfur (TRS) Not Expected 250 10 No
Reduced Sulfur Compounds Not Expected 250 10 No
MWC Organics Not Expected 250 3.5e-6 No
MWC Metals Not Expected 250 15 No
MWC Acid Gases Not Expected 250 40 No
GHG (CO2e) 304,423 -- 75,000 Yes Notes: 1. Significant emission rates from 40 CFR §§52.21(b)(23)(i) and (b)(49)(iv)(a).
Compliance Assurance Monitoring (CAM), 40 CFR Part 64 This source is not subject to CAM. The purpose of CAM is to provide a reasonable assurance that compliance is being achieved with large emissions units that rely on air pollution control device equipment to meet an emissions limit or standard. Pursuant to 40 CFR Part 64, for CAM to be applicable, the emissions unit must: (1) be located at a major source; (2) be subject to an emissions limit or standard; (3) use a control device to achieve compliance; (4) have potential pre-control emissions that are 100% of the major source level; and (5) not otherwise be exempt from CAM. The engine generators have emission limits for NOX, filterable PM, PM10, PM2.5, and VOC. The units are subject to the NOX and filterable PM emission standards of 40 CFR Part 60, Subpart IIII. NSPS and NESHAP/MACT emission limits or standards proposed after November 15, 1990, are exempt from the CAM requirements pursuant to 40 CFR §64.2(b). Therefore, CAM does not apply to NOX and filterable PM because Subpart IIII was promulgated after November 15, 1990.
DRAFT
Page 5 of 46
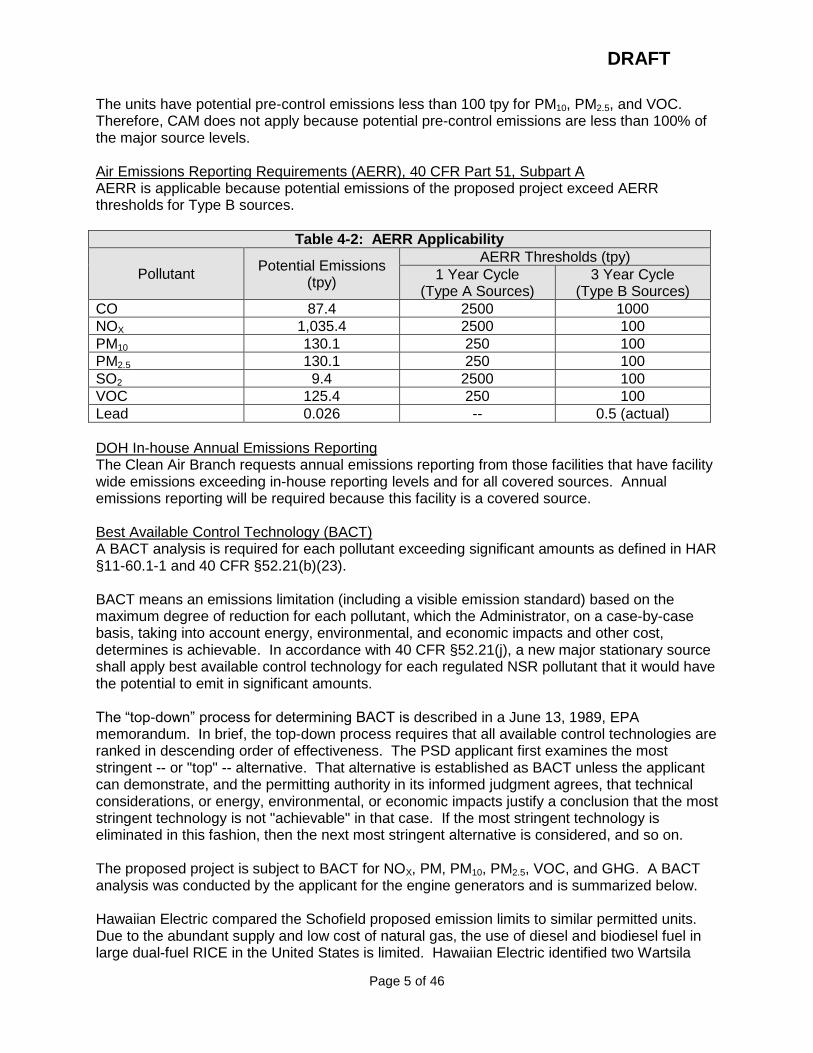
The units have potential pre-control emissions less than 100 tpy for PM10, PM2.5, and VOC. Therefore, CAM does not apply because potential pre-control emissions are less than 100% of the major source levels. Air Emissions Reporting Requirements (AERR), 40 CFR Part 51, Subpart A AERR is applicable because potential emissions of the proposed project exceed AERR thresholds for Type B sources.
Table 4-2: AERR Applicability
Pollutant Potential Emissions
(tpy)
AERR Thresholds (tpy)
1 Year Cycle (Type A Sources)
3 Year Cycle (Type B Sources)
CO 87.4 2500 1000
NOX 1,035.4 2500 100
PM10 130.1 250 100
PM2.5 130.1 250 100
SO2 9.4 2500 100
VOC 125.4 250 100
Lead 0.026 -- 0.5 (actual)
DOH In-house Annual Emissions Reporting The Clean Air Branch requests annual emissions reporting from those facilities that have facility wide emissions exceeding in-house reporting levels and for all covered sources. Annual emissions reporting will be required because this facility is a covered source. Best Available Control Technology (BACT) A BACT analysis is required for each pollutant exceeding significant amounts as defined in HAR §11-60.1-1 and 40 CFR §52.21(b)(23). BACT means an emissions limitation (including a visible emission standard) based on the maximum degree of reduction for each pollutant, which the Administrator, on a case-by-case basis, taking into account energy, environmental, and economic impacts and other cost, determines is achievable. In accordance with 40 CFR §52.21(j), a new major stationary source shall apply best available control technology for each regulated NSR pollutant that it would have the potential to emit in significant amounts. The “top-down” process for determining BACT is described in a June 13, 1989, EPA memorandum. In brief, the top-down process requires that all available control technologies are ranked in descending order of effectiveness. The PSD applicant first examines the most stringent -- or "top" -- alternative. That alternative is established as BACT unless the applicant can demonstrate, and the permitting authority in its informed judgment agrees, that technical considerations, or energy, environmental, or economic impacts justify a conclusion that the most stringent technology is not "achievable" in that case. If the most stringent technology is eliminated in this fashion, then the next most stringent alternative is considered, and so on. The proposed project is subject to BACT for NOX, PM, PM10, PM2.5, VOC, and GHG. A BACT analysis was conducted by the applicant for the engine generators and is summarized below. Hawaiian Electric compared the Schofield proposed emission limits to similar permitted units. Due to the abundant supply and low cost of natural gas, the use of diesel and biodiesel fuel in large dual-fuel RICE in the United States is limited. Hawaiian Electric identified two Wartsila
DRAFT
Page 6 of 46
dual-fuel facilities that have similar Wartsila RICE (i.e., same manufacturer, but different size RICE) to the proposed Schofield Wartsila RICE units and were permitted after the promulgation of NSPS Subpart IIII. At both facilities, diesel is permitted as a back-up fuel to natural gas and biodiesel is not permitted. Hawaiian Electric was not able to identify any large RICE units permitted to burn biodiesel. The facilities identified are discussed below.
Pacific Gas & Electric Company Humboldt Bay Generating Station (Humboldt Bay): This facility consists of ten 16.3 MW Wartsila 18V50DF RICE equipped with selective catalytic reduction (SCR) and oxidation catalyst. The primary fuel is natural gas with ultra-low sulfur diesel (ULSD) usage limited to a maximum total of 1,000 operating hours per year for all ten RICE combined.
Matanuska Electric Association, Inc. Eklutna Generation Station (Eklutna): This facility consists of ten 16.6 MW Wartsila 18V50DF RICE equipped with SCR and oxidation catalyst. The primary fuel is natural gas with ULSD usage limited to a maximum total of 1,680 operating hours per year for all ten RICE combined. This facility has additional operating limits to keep emissions below the PSD major source threshold.
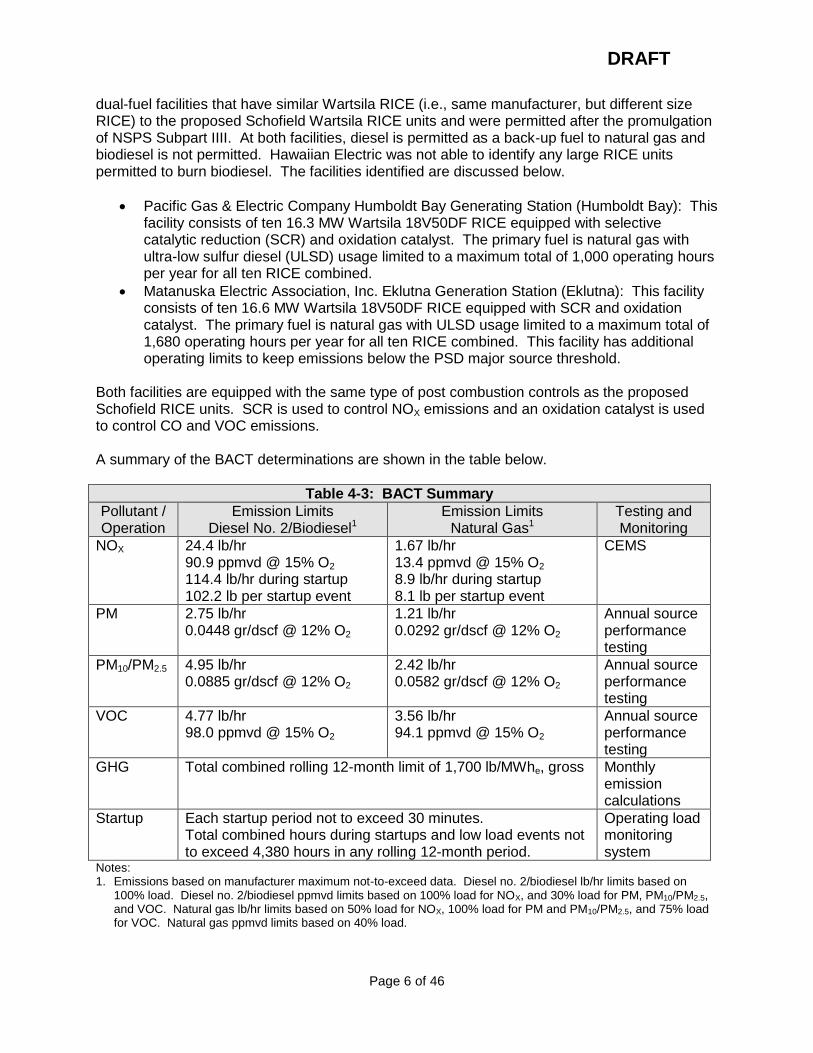
Both facilities are equipped with the same type of post combustion controls as the proposed Schofield RICE units. SCR is used to control NOX emissions and an oxidation catalyst is used to control CO and VOC emissions. A summary of the BACT determinations are shown in the table below.
Table 4-3: BACT Summary
Pollutant / Operation
Emission Limits Diesel No. 2/Biodiesel1
Emission Limits Natural Gas1
Testing and Monitoring
NOX 24.4 lb/hr 90.9 ppmvd @ 15% O2 114.4 lb/hr during startup 102.2 lb per startup event
1.67 lb/hr 13.4 ppmvd @ 15% O2 8.9 lb/hr during startup 8.1 lb per startup event
CEMS
PM 2.75 lb/hr 0.0448 gr/dscf @ 12% O2
1.21 lb/hr 0.0292 gr/dscf @ 12% O2
Annual source performance testing
PM10/PM2.5 4.95 lb/hr 0.0885 gr/dscf @ 12% O2
2.42 lb/hr 0.0582 gr/dscf @ 12% O2
Annual source performance testing
VOC 4.77 lb/hr 98.0 ppmvd @ 15% O2
3.56 lb/hr 94.1 ppmvd @ 15% O2
Annual source performance testing
GHG Total combined rolling 12-month limit of 1,700 lb/MWhe, gross Monthly emission calculations
Startup Each startup period not to exceed 30 minutes. Total combined hours during startups and low load events not to exceed 4,380 hours in any rolling 12-month period.
Operating load monitoring system
Notes: 1. Emissions based on manufacturer maximum not-to-exceed data. Diesel no. 2/biodiesel lb/hr limits based on
100% load. Diesel no. 2/biodiesel ppmvd limits based on 100% load for NOX, and 30% load for PM, PM10/PM2.5, and VOC. Natural gas lb/hr limits based on 50% load for NOX, 100% load for PM and PM10/PM2.5, and 75% load for VOC. Natural gas ppmvd limits based on 40% load.
DRAFT
Page 7 of 46
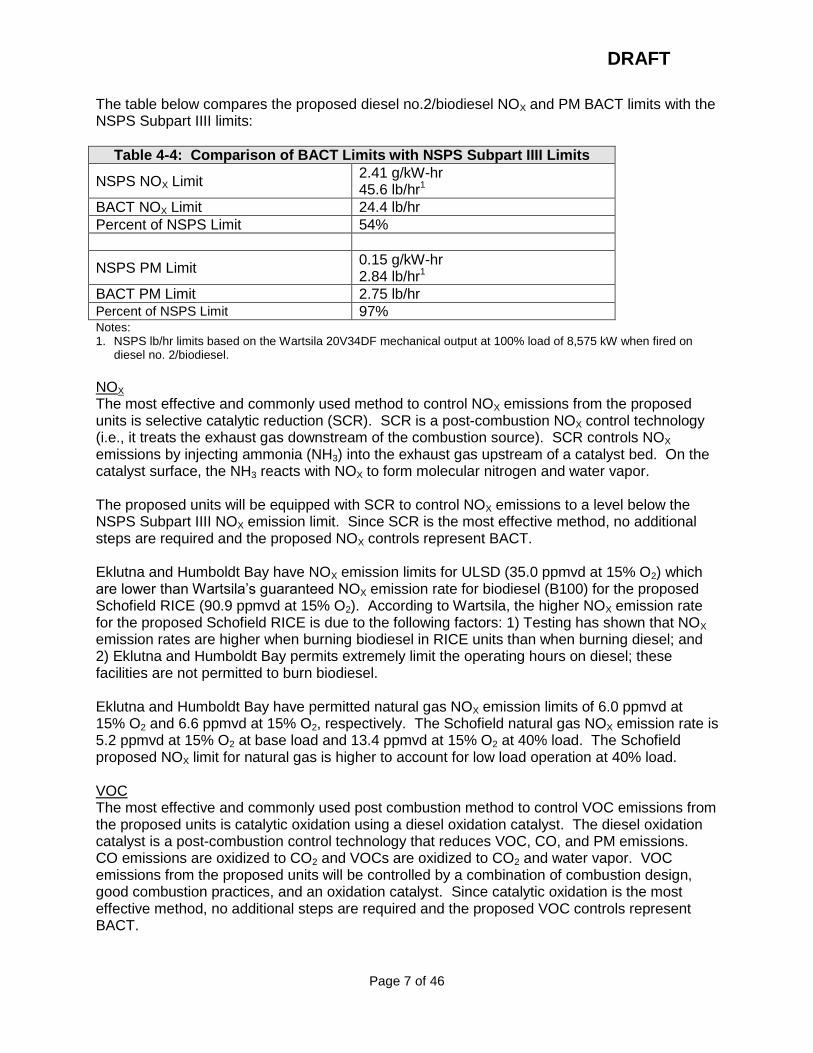
The table below compares the proposed diesel no.2/biodiesel NOX and PM BACT limits with the NSPS Subpart IIII limits:
Table 4-4: Comparison of BACT Limits with NSPS Subpart IIII Limits
NSPS NOX Limit 2.41 g/kW-hr 45.6 lb/hr1
BACT NOX Limit 24.4 lb/hr
Percent of NSPS Limit 54%
NSPS PM Limit 0.15 g/kW-hr 2.84 lb/hr1
BACT PM Limit 2.75 lb/hr Percent of NSPS Limit 97% Notes: 1. NSPS lb/hr limits based on the Wartsila 20V34DF mechanical output at 100% load of 8,575 kW when fired on
diesel no. 2/biodiesel.
NOX The most effective and commonly used method to control NOX emissions from the proposed units is selective catalytic reduction (SCR). SCR is a post-combustion NOX control technology (i.e., it treats the exhaust gas downstream of the combustion source). SCR controls NOX emissions by injecting ammonia (NH3) into the exhaust gas upstream of a catalyst bed. On the catalyst surface, the NH3 reacts with NOX to form molecular nitrogen and water vapor. The proposed units will be equipped with SCR to control NOX emissions to a level below the NSPS Subpart IIII NOX emission limit. Since SCR is the most effective method, no additional steps are required and the proposed NOX controls represent BACT. Eklutna and Humboldt Bay have NOX emission limits for ULSD (35.0 ppmvd at 15% O2) which are lower than Wartsila’s guaranteed NOX emission rate for biodiesel (B100) for the proposed Schofield RICE (90.9 ppmvd at 15% O2). According to Wartsila, the higher NOX emission rate for the proposed Schofield RICE is due to the following factors: 1) Testing has shown that NOX emission rates are higher when burning biodiesel in RICE units than when burning diesel; and 2) Eklutna and Humboldt Bay permits extremely limit the operating hours on diesel; these facilities are not permitted to burn biodiesel. Eklutna and Humboldt Bay have permitted natural gas NOX emission limits of 6.0 ppmvd at 15% O2 and 6.6 ppmvd at 15% O2, respectively. The Schofield natural gas NOX emission rate is 5.2 ppmvd at 15% O2 at base load and 13.4 ppmvd at 15% O2 at 40% load. The Schofield proposed NOX limit for natural gas is higher to account for low load operation at 40% load. VOC The most effective and commonly used post combustion method to control VOC emissions from the proposed units is catalytic oxidation using a diesel oxidation catalyst. The diesel oxidation catalyst is a post-combustion control technology that reduces VOC, CO, and PM emissions. CO emissions are oxidized to CO2 and VOCs are oxidized to CO2 and water vapor. VOC emissions from the proposed units will be controlled by a combination of combustion design, good combustion practices, and an oxidation catalyst. Since catalytic oxidation is the most effective method, no additional steps are required and the proposed VOC controls represent BACT.
DRAFT
Page 8 of 46
The Schofield proposed VOC emission limits (98.0 ppmvd at 15% O2 for diesel, biodiesel, diesel/biodiesel blends and 94.1 ppmvd at 15% O2 for natural gas) are higher than the permitted Eklutna and Humboldt Bay VOC emission limits (up to 40 ppmvd at 15% O2 for diesel and up to 28 ppmvd at 15% O2 for natural gas). The Schofield proposed VOC emission limit for diesel/biodiesel is higher to account for low load operation at 30% load. The Schofield proposed VOC emission limit for natural gas is higher due to the unknown nature of the natural gas supply and low load operation at 40% load. Natural gas must be imported to Hawaii and VOC emissions are a function of hydrocarbon content (propane, butane, pentane, and hexane) of natural gas. The Schofield proposed VOC emissions are based on the upper limit of the expected hydrocarbon content in the natural gas. PM/PM10/PM2.5 Potential methods for controlling PM/PM10/PM2.5 emissions from the proposed units listed in order of most to least effective and a discussion of their application to this project are: 1. Electrostatic precipitator (ESP) – Searches of the RACT/BACT/LAER Clearinghouse in
June 2013 and January 2015 did not identify any CI ICE in this size range. Dry ESP technology has been applied to control PM/PM10/PM2.5 emissions in marine engine applications burning high ash fuels. However, Hawaiian Electric is not proposing to burn high ash fuels. Therefore, ESPs do not represent BACT for this project.
2. Diesel particulate filter – As part of the development of NSPS Subpart IIII, EPA evaluated the feasibility of a diesel particulate filter on CI ICE with a displacement greater than or equal to 30 liters per cylinder and found it to be infeasible (70 FR 39884, July 11, 2005). A review of vendor data shows that diesel particulate filters are limited to applications less than 7 MW. The proposed units have a displacement greater than 30 liters per cylinder and are larger than 7 MW. Therefore, diesel particulate filters do not represent BACT for this project.
3. Diesel oxidation catalyst – Catalytic oxidation using a diesel oxidation catalyst reduces the organic fraction of particulate emissions. Hawaiian Electric will install diesel oxidation catalysts.
4. Combustion design & practices – Hawaiian Electric will employ good combustion design and combustion practices.
5. Low Sulfur Liquid Fuels and Natural Gas – The use of natural gas with a maximum sulfur content of 1.75 grains per 100 SCF and biofuels, diesel, and biofuel/diesel blends with a maximum sulfur content of 42 ppm (0.0042%) will minimize sulfate (PM2.5) formation. Animal-based biofuels require a 42 ppm (0.0042%) fuel sulfur limit. Some samples of beef tallow and chicken fat contain over 100 ppm of sulfur. The sulfur originates from sulfur-containing amino acids associated with proteins that carry over from the rendering process. Measurements of the sulfur levels in biodiesel produced from animal fats show that the sulfur level usually decreases by about half when the conversion to biodiesel takes place. The sulfate formation of biofuels, diesel, and biofuel/diesel blends with a maximum sulfur content of 42 ppm and natural gas with a maximum sulfur content of 1.75 grains per 100 SCF has little impact on PM2.5 emissions.
Hawaiian Electric proposes a combination of combustion design, good combustion practices, the use of biofuels, diesel, and biofuel/diesel blends with a maximum sulfur content of 42 ppm, the use of natural gas with a maximum sulfur content of 1.75 grains per 100 SCF, and catalytic oxidation as BACT for PM/PM10/PM2.5.
DRAFT
Page 9 of 46
Both Eklutna and Humboldt Bay control PM emissions by combustion design. PM10 emission limits for Eklutna and Humboldt Bay are 0.21 g/HP-hr and 0.22 g/HP-hr, respectively and the applicable NSPS Subpart IIII PM emission limit (0.11 g/HP-hr) is included in both permits. PM10/PM2.5 emissions are two times the PM emissions to account for condensable particulate matter. Thus, the Schofield proposed PM and PM10/PM2.5 emission limits (PM 0.11 g/HP-hr, PM10/PM2.5 0.22 g/HP-hr) are consistent with the PM limits for Eklutna and Humboldt Bay. Greenhouse Gases (GHGs) Hawaiian Electric selected the Wartsila 20V34DF engine generators as the best method to meet the objectives of the needed generation expansion. The key objectives of the new generation are:
Quick starting
High efficiency
Firm power (available when needed)
Fuel flexibility
Flexible generation capacity
The ability to provide 100% of the US Army generation needs at Schofield Barracks via biofuels. Hawaiian Electric’s agreement with the US Army contains a minimum biodiesel requirement.
The following technologies can be eliminated because they fundamentally redefine the nature of the source:
Nuclear Generator – Best suited for base loaded units.
Renewable energy sources (Wind, Solar, Hydro) – The project requires firm generation.
Combined-cycle gas turbines – Cannot meet the quick start requirements and do not offer the generation flexibility of six engines.
Boilers – Cannot meet the quick start requirements of the project. Also, they are less efficient than the proposed engines.
The following are the potential GHG emissions controls and technologies for S1 through S6:
Simple-cycle gas turbines.
Switching exclusively to a lower carbon fuel (natural gas).
Adding CO2 capture and storage (CCS). Simple-cycle gas turbines (heat rate ~8,700 to 10,000 Btu/kWh) are less efficient than internal combustion engines (heat rate ~7,500 to 8,500 Btu/kWh) so internal combustion engines have lower GHG emissions per kWh produced. Switching to 100% natural gas would reduce GHG emissions by approximately 27%. However, natural gas in the quantity required for it to be the primary fuel does not currently exist in Hawaii. Hawaiian Electric is currently working on the ability to import natural gas. Also, the agreement with the US Army has a minimum biofuel consumption requirement. Therefore, natural gas cannot be selected as BACT due to its limited availability and the US Army agreement.
DRAFT
Page 10 of 46
CCS is composed of two major functions; CO2 capture and CO2 storage. A number of methods may potentially be used for separating the CO2 from the exhaust gas stream, including adsorption, physical absorption, chemical absorption, cryogenic separation, and membrane separation (Wang et al., 2011). Many of these methods are either still in development or not suitable for treating power plant flue gas due to the characteristics of the exhaust stream (Wang, 2011; IPCC, 2005). Of the potentially applicable post-combustion CO2 capture options, the use of an amine solvent such as monoethanolamine (MEA) it is the most mature and well documented technology (Kvamsdal et al., 2011). EPA generally considers post-combustion CO2 capture with an amine solvent to be technically feasible for natural gas fired combined cycle combustion turbines and coal fired power plant. However, this technology has not been demonstrated on simple cycle reciprocating engines. S1 through S6 are simple cycle reciprocating engines with a CO2 flue gas exhaust concentration less than 6 percent. This concentration is much lower than other types of power plants, such as coal fired power plants, where the CO2 concentration may be as high as 12-15 percent by volume in the post combustion flue gas stream. Due to the low flue gas exhaust CO2 concentration, CO2 capture with an amine solvent is unproven for simple cycle reciprocating engines. However, in response to DOH’s question in its letter dated September 26, 2013, to Hawaiian Electric, Hawaiian Electric includes an estimated cost for implementing CO2 capture with an amine solvent. Hawaii’s remote location imposes many additional challenges implementing CO2 storage that are not present for continental U.S. sources. Hawaiian Electric is not aware of any proven CO2
geological storage sites on Hawaii. Therefore ocean storage, i.e., direct CO2 release into the ocean water column or onto the deep seafloor, appears to be the most readily available CO2
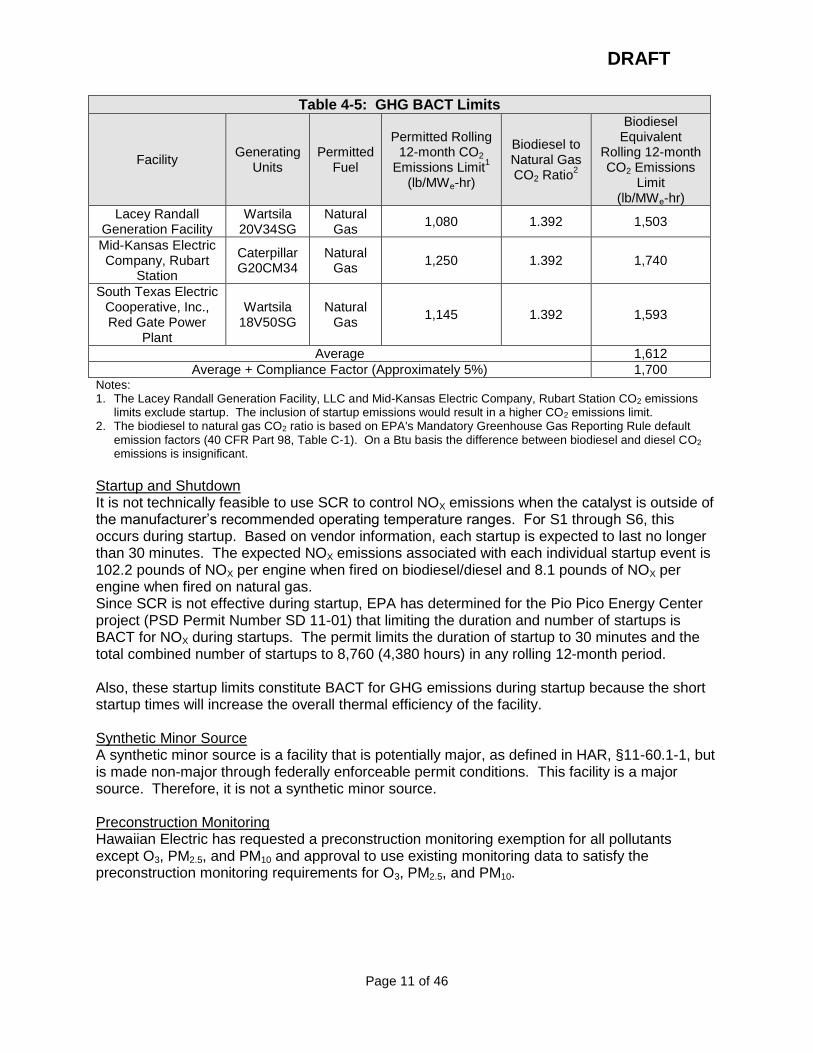
storage option. The estimated cost to add CCS to S1 through S6 equate to 5¢ to 7¢ per kWh based on unlimited operations and 17¢ to 24¢ per kWh based on expected operations. Although GHG BACT cost thresholds have not been established, this cost is not economically viable for this project. Therefore, the proposed engines are the most effective option to reduce GHG emissions and represent BACT. Eklutna and Humboldt Bay permits do not contain GHG emission limits. The proposed output based emission limit of 1,700 lb CO2/MWhe on a rolling 12-month average is consistent with recent RICE power generation permits. The table below lists GHG BACT limits from similar RICE facilities. Due to the abundant supply of natural gas on the mainland, none of these facilities are permitted to burn diesel and/or biodiesel. Therefore, the BACT limits were scaled using the biodiesel to natural gas CO2 ratio. This ratio is based on EPA's Mandatory Greenhouse Gas Reporting Rule default emission factors (40 CFR Part 98, Table C-1).
DRAFT
Page 11 of 46
Table 4-5: GHG BACT Limits
Facility Generating
Units Permitted
Fuel
Permitted Rolling 12-month CO2
Emissions Limit1
(lb/MWe-hr)
Biodiesel to Natural Gas CO2 Ratio
2
Biodiesel Equivalent
Rolling 12-month CO2 Emissions
Limit (lb/MWe-hr)
Lacey Randall Generation Facility
Wartsila 20V34SG
Natural Gas
1,080 1.392 1,503
Mid-Kansas Electric Company, Rubart
Station
Caterpillar G20CM34
Natural Gas
1,250 1.392 1,740
South Texas Electric Cooperative, Inc., Red Gate Power
Plant
Wartsila 18V50SG
Natural Gas
1,145 1.392 1,593
Average 1,612
Average + Compliance Factor (Approximately 5%) 1,700 Notes: 1. The Lacey Randall Generation Facility, LLC and Mid-Kansas Electric Company, Rubart Station CO2 emissions
limits exclude startup. The inclusion of startup emissions would result in a higher CO2 emissions limit. 2. The biodiesel to natural gas CO2 ratio is based on EPA's Mandatory Greenhouse Gas Reporting Rule default
emission factors (40 CFR Part 98, Table C-1). On a Btu basis the difference between biodiesel and diesel CO2 emissions is insignificant.
Startup and Shutdown It is not technically feasible to use SCR to control NOX emissions when the catalyst is outside of the manufacturer’s recommended operating temperature ranges. For S1 through S6, this occurs during startup. Based on vendor information, each startup is expected to last no longer than 30 minutes. The expected NOX emissions associated with each individual startup event is 102.2 pounds of NOX per engine when fired on biodiesel/diesel and 8.1 pounds of NOX per engine when fired on natural gas. Since SCR is not effective during startup, EPA has determined for the Pio Pico Energy Center project (PSD Permit Number SD 11-01) that limiting the duration and number of startups is BACT for NOX during startups. The permit limits the duration of startup to 30 minutes and the total combined number of startups to 8,760 (4,380 hours) in any rolling 12-month period. Also, these startup limits constitute BACT for GHG emissions during startup because the short startup times will increase the overall thermal efficiency of the facility. Synthetic Minor Source A synthetic minor source is a facility that is potentially major, as defined in HAR, §11-60.1-1, but is made non-major through federally enforceable permit conditions. This facility is a major source. Therefore, it is not a synthetic minor source. Preconstruction Monitoring Hawaiian Electric has requested a preconstruction monitoring exemption for all pollutants except O3, PM2.5, and PM10 and approval to use existing monitoring data to satisfy the preconstruction monitoring requirements for O3, PM2.5, and PM10.
DRAFT
Page 12 of 46
The Department approves Hawaiian Electric’s preconstruction monitoring exemption request and concurs that the use of existing monitoring data for O3, PM2.5, and PM10 collected at its Sand Island (O3), and Pearl City (PM2.5 and PM10) monitoring stations satisfy the monitoring requirements of HAR, Subchapter 7, and 40 CFR §52.21(m). 5. INSIGNIFICANT ACTIVITIES Insignificant activities identified by the applicant are listed below: Basis for Insignificant Activity Description HAR §11-60.1-82(f)(5) 300 kW MTU emergency diesel engine generator (model no.
DS300D6SRA). HAR §11-60.1-82(f)(7) Two (2) 210,000 gallon internal floating roof storage tanks store
fuel with low vapor pressure. HAR §11-60.1-82(f)(7) Fugitive equipment leaks from valves, flanges, pump seals, and
any VOC water separators. HAR §11-60.1-82(f)(7) Solvents may be used for maintenance purposes. 6. ALTERNATIVE OPERATING SCENARIOS The applicant proposed the following alternative operating scenarios: 1. The ability to switch to an alternate fuel in the event that cheaper fuels or additional
renewable fuels become available, or the supply of natural gas, biodiesel and diesel becomes limited. Hawaiian Electric proposes an alternative scenario allowing the switch to an alternate fuel provided the switch: does not require PSD review, or compliance with NSPS or NESHAP requirements that would not otherwise apply, or compliance with a requirement that is different from those specified in the permit.
2. The use of fuel additives which may be used to control algae, lubricity, improve combustion, inhibit corrosion, etc., provided all permit conditions are met.
3. The ability to use a temporary replacement unit in the event of a failure or major overhaul of an installed unit. In the event that the projected downtime of the installed unit increases the likelihood of an interruption in electrical service, the installed unit would be replaced with an equivalent unit. Emissions from the replacement unit will comply with the original unit's emission limits.
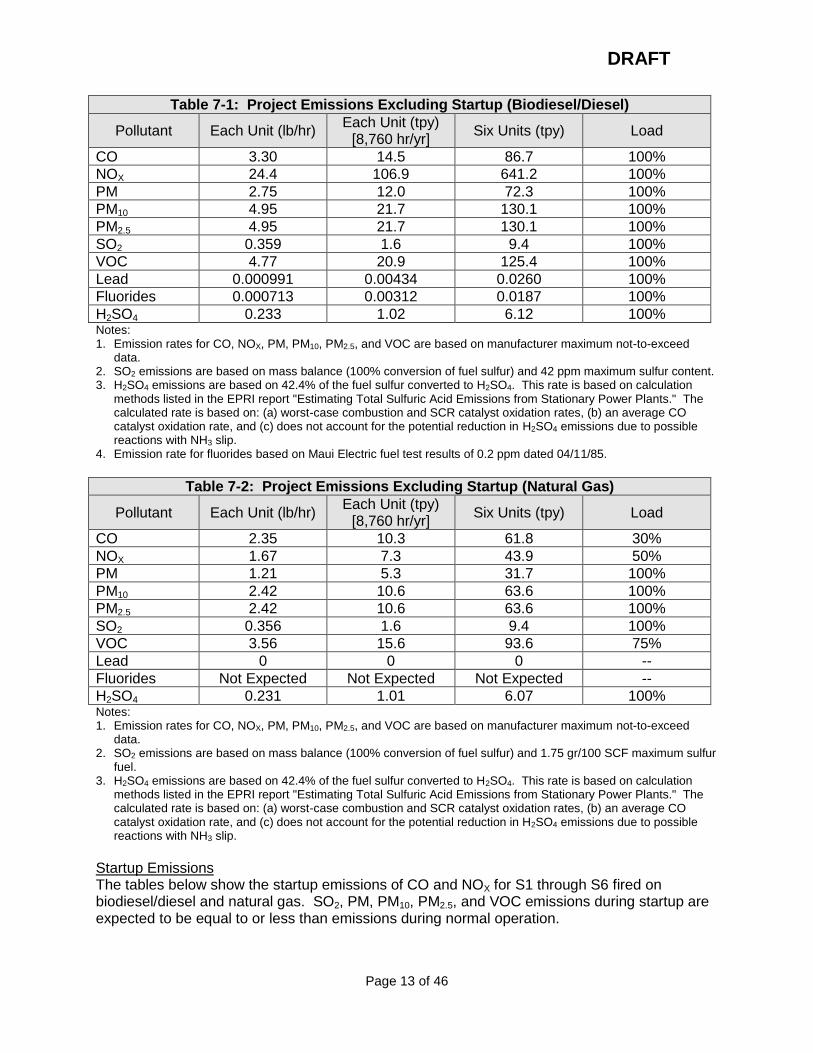
7. PROJECT EMISSIONS Project Emissions, Excluding Startup The tables below show the potential emissions of S1 through S6 fired on biodiesel/diesel and natural gas, excluding startup. PM emissions include the filterable fraction. PM10 and PM2.5 emissions include the filterable and condensable fractions. Emission rates were provided by the manufacturer for loads at 100%, 75%, 50%, and 30% for firing on biodiesel/diesel, and 100%, 75%, 50%, and 40% for firing on natural gas. The maximum emission rates for all pollutants occurs at 100% load fired on biodiesel/diesel, excluding startup.
DRAFT
Page 13 of 46
Table 7-1: Project Emissions Excluding Startup (Biodiesel/Diesel)
Pollutant Each Unit (lb/hr) Each Unit (tpy)
[8,760 hr/yr] Six Units (tpy) Load
CO 3.30 14.5 86.7 100%
NOX 24.4 106.9 641.2 100%
PM 2.75 12.0 72.3 100%
PM10 4.95 21.7 130.1 100%
PM2.5 4.95 21.7 130.1 100%
SO2 0.359 1.6 9.4 100%
VOC 4.77 20.9 125.4 100%
Lead 0.000991 0.00434 0.0260 100%
Fluorides 0.000713 0.00312 0.0187 100%
H2SO4 0.233 1.02 6.12 100% Notes: 1. Emission rates for CO, NOX, PM, PM10, PM2.5, and VOC are based on manufacturer maximum not-to-exceed
data. 2. SO2 emissions are based on mass balance (100% conversion of fuel sulfur) and 42 ppm maximum sulfur content. 3. H2SO4 emissions are based on 42.4% of the fuel sulfur converted to H2SO4. This rate is based on calculation
methods listed in the EPRI report "Estimating Total Sulfuric Acid Emissions from Stationary Power Plants." The calculated rate is based on: (a) worst-case combustion and SCR catalyst oxidation rates, (b) an average CO catalyst oxidation rate, and (c) does not account for the potential reduction in H2SO4 emissions due to possible reactions with NH3 slip.
4. Emission rate for fluorides based on Maui Electric fuel test results of 0.2 ppm dated 04/11/85.
Table 7-2: Project Emissions Excluding Startup (Natural Gas)
Pollutant Each Unit (lb/hr) Each Unit (tpy)
[8,760 hr/yr] Six Units (tpy) Load
CO 2.35 10.3 61.8 30%
NOX 1.67 7.3 43.9 50%
PM 1.21 5.3 31.7 100%
PM10 2.42 10.6 63.6 100%
PM2.5 2.42 10.6 63.6 100%
SO2 0.356 1.6 9.4 100%
VOC 3.56 15.6 93.6 75%
Lead 0 0 0 --
Fluorides Not Expected Not Expected Not Expected --
H2SO4 0.231 1.01 6.07 100% Notes: 1. Emission rates for CO, NOX, PM, PM10, PM2.5, and VOC are based on manufacturer maximum not-to-exceed
data. 2. SO2 emissions are based on mass balance (100% conversion of fuel sulfur) and 1.75 gr/100 SCF maximum sulfur
fuel. 3. H2SO4 emissions are based on 42.4% of the fuel sulfur converted to H2SO4. This rate is based on calculation
methods listed in the EPRI report "Estimating Total Sulfuric Acid Emissions from Stationary Power Plants." The calculated rate is based on: (a) worst-case combustion and SCR catalyst oxidation rates, (b) an average CO catalyst oxidation rate, and (c) does not account for the potential reduction in H2SO4 emissions due to possible reactions with NH3 slip.
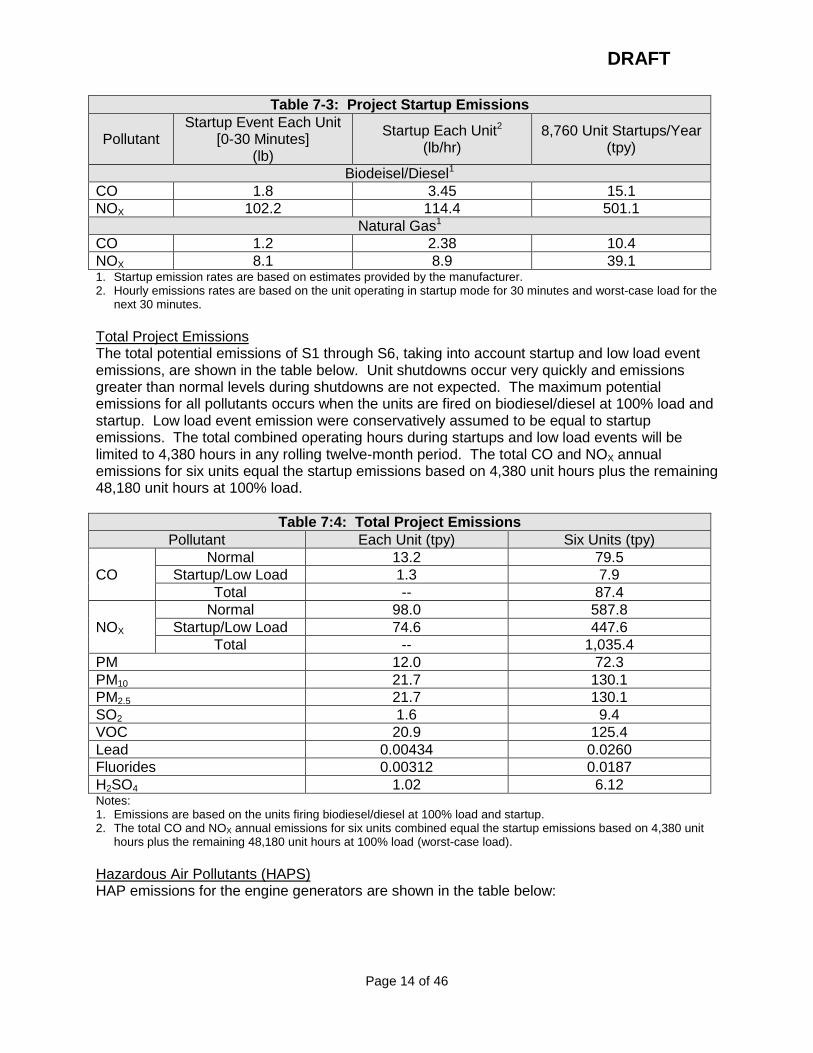
Startup Emissions The tables below show the startup emissions of CO and NOX for S1 through S6 fired on biodiesel/diesel and natural gas. SO2, PM, PM10, PM2.5, and VOC emissions during startup are expected to be equal to or less than emissions during normal operation.
DRAFT
Page 14 of 46
Table 7-3: Project Startup Emissions
Pollutant Startup Event Each Unit
[0-30 Minutes] (lb)
Startup Each Unit2 (lb/hr)
8,760 Unit Startups/Year (tpy)
Biodeisel/Diesel1
CO 1.8 3.45 15.1
NOX 102.2 114.4 501.1
Natural Gas1
CO 1.2 2.38 10.4
NOX 8.1 8.9 39.1 1. Startup emission rates are based on estimates provided by the manufacturer. 2. Hourly emissions rates are based on the unit operating in startup mode for 30 minutes and worst-case load for the
next 30 minutes.
Total Project Emissions The total potential emissions of S1 through S6, taking into account startup and low load event emissions, are shown in the table below. Unit shutdowns occur very quickly and emissions greater than normal levels during shutdowns are not expected. The maximum potential emissions for all pollutants occurs when the units are fired on biodiesel/diesel at 100% load and startup. Low load event emission were conservatively assumed to be equal to startup emissions. The total combined operating hours during startups and low load events will be limited to 4,380 hours in any rolling twelve-month period. The total CO and NOX annual emissions for six units equal the startup emissions based on 4,380 unit hours plus the remaining 48,180 unit hours at 100% load.
Table 7:4: Total Project Emissions
Pollutant Each Unit (tpy) Six Units (tpy)
CO
Normal 13.2 79.5
Startup/Low Load 1.3 7.9
Total -- 87.4
NOX
Normal 98.0 587.8
Startup/Low Load 74.6 447.6
Total -- 1,035.4
PM 12.0 72.3
PM10 21.7 130.1
PM2.5 21.7 130.1
SO2 1.6 9.4
VOC 20.9 125.4
Lead 0.00434 0.0260
Fluorides 0.00312 0.0187
H2SO4 1.02 6.12 Notes: 1. Emissions are based on the units firing biodiesel/diesel at 100% load and startup. 2. The total CO and NOX annual emissions for six units combined equal the startup emissions based on 4,380 unit
hours plus the remaining 48,180 unit hours at 100% load (worst-case load).
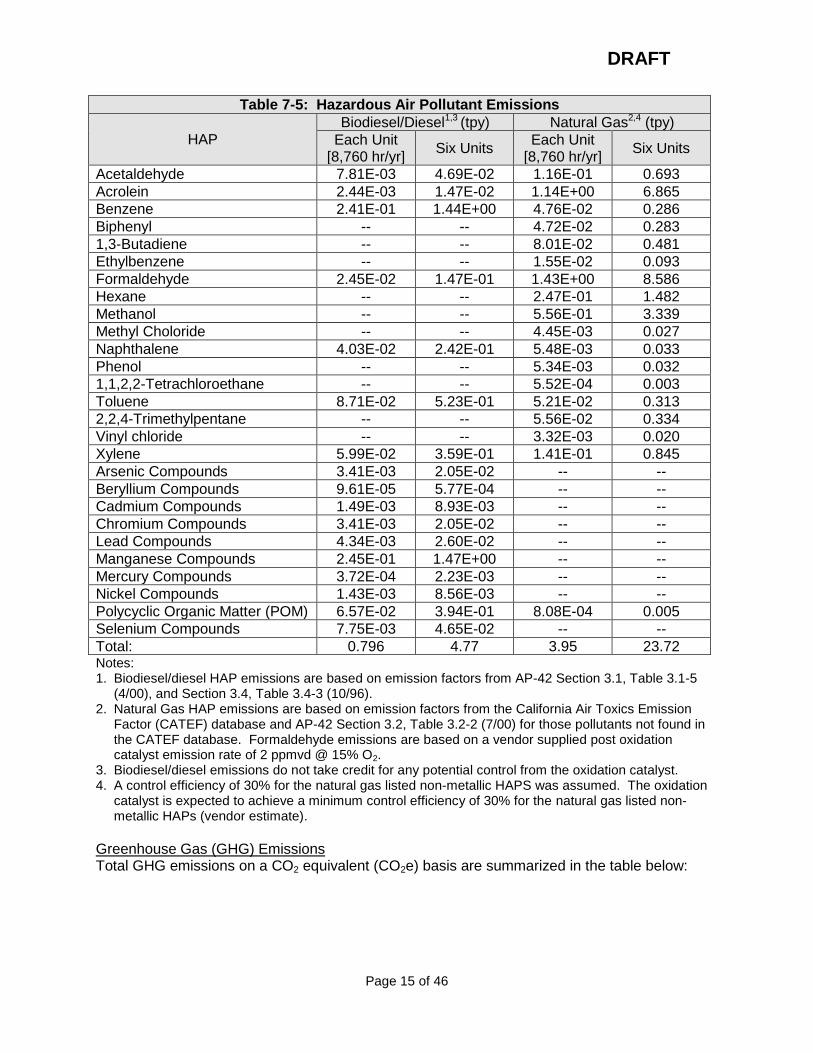
Hazardous Air Pollutants (HAPS) HAP emissions for the engine generators are shown in the table below:
DRAFT
Page 15 of 46
Table 7-5: Hazardous Air Pollutant Emissions
HAP Biodiesel/Diesel1,3 (tpy) Natural Gas2,4 (tpy)
Each Unit [8,760 hr/yr]
Six Units Each Unit
[8,760 hr/yr] Six Units
Acetaldehyde 7.81E-03 4.69E-02 1.16E-01 0.693
Acrolein 2.44E-03 1.47E-02 1.14E+00 6.865
Benzene 2.41E-01 1.44E+00 4.76E-02 0.286
Biphenyl -- -- 4.72E-02 0.283
1,3-Butadiene -- -- 8.01E-02 0.481
Ethylbenzene -- -- 1.55E-02 0.093
Formaldehyde 2.45E-02 1.47E-01 1.43E+00 8.586
Hexane -- -- 2.47E-01 1.482
Methanol -- -- 5.56E-01 3.339
Methyl Choloride -- -- 4.45E-03 0.027
Naphthalene 4.03E-02 2.42E-01 5.48E-03 0.033
Phenol -- -- 5.34E-03 0.032
1,1,2,2-Tetrachloroethane -- -- 5.52E-04 0.003
Toluene 8.71E-02 5.23E-01 5.21E-02 0.313
2,2,4-Trimethylpentane -- -- 5.56E-02 0.334
Vinyl chloride -- -- 3.32E-03 0.020
Xylene 5.99E-02 3.59E-01 1.41E-01 0.845
Arsenic Compounds 3.41E-03 2.05E-02 -- --
Beryllium Compounds 9.61E-05 5.77E-04 -- --
Cadmium Compounds 1.49E-03 8.93E-03 -- --
Chromium Compounds 3.41E-03 2.05E-02 -- --
Lead Compounds 4.34E-03 2.60E-02 -- --
Manganese Compounds 2.45E-01 1.47E+00 -- --
Mercury Compounds 3.72E-04 2.23E-03 -- --
Nickel Compounds 1.43E-03 8.56E-03 -- --
Polycyclic Organic Matter (POM) 6.57E-02 3.94E-01 8.08E-04 0.005
Selenium Compounds 7.75E-03 4.65E-02 -- --
Total: 0.796 4.77 3.95 23.72 Notes: 1. Biodiesel/diesel HAP emissions are based on emission factors from AP-42 Section 3.1, Table 3.1-5
(4/00), and Section 3.4, Table 3.4-3 (10/96). 2. Natural Gas HAP emissions are based on emission factors from the California Air Toxics Emission
Factor (CATEF) database and AP-42 Section 3.2, Table 3.2-2 (7/00) for those pollutants not found in the CATEF database. Formaldehyde emissions are based on a vendor supplied post oxidation catalyst emission rate of 2 ppmvd @ 15% O2.
3. Biodiesel/diesel emissions do not take credit for any potential control from the oxidation catalyst. 4. A control efficiency of 30% for the natural gas listed non-metallic HAPS was assumed. The oxidation
catalyst is expected to achieve a minimum control efficiency of 30% for the natural gas listed non-metallic HAPs (vendor estimate).
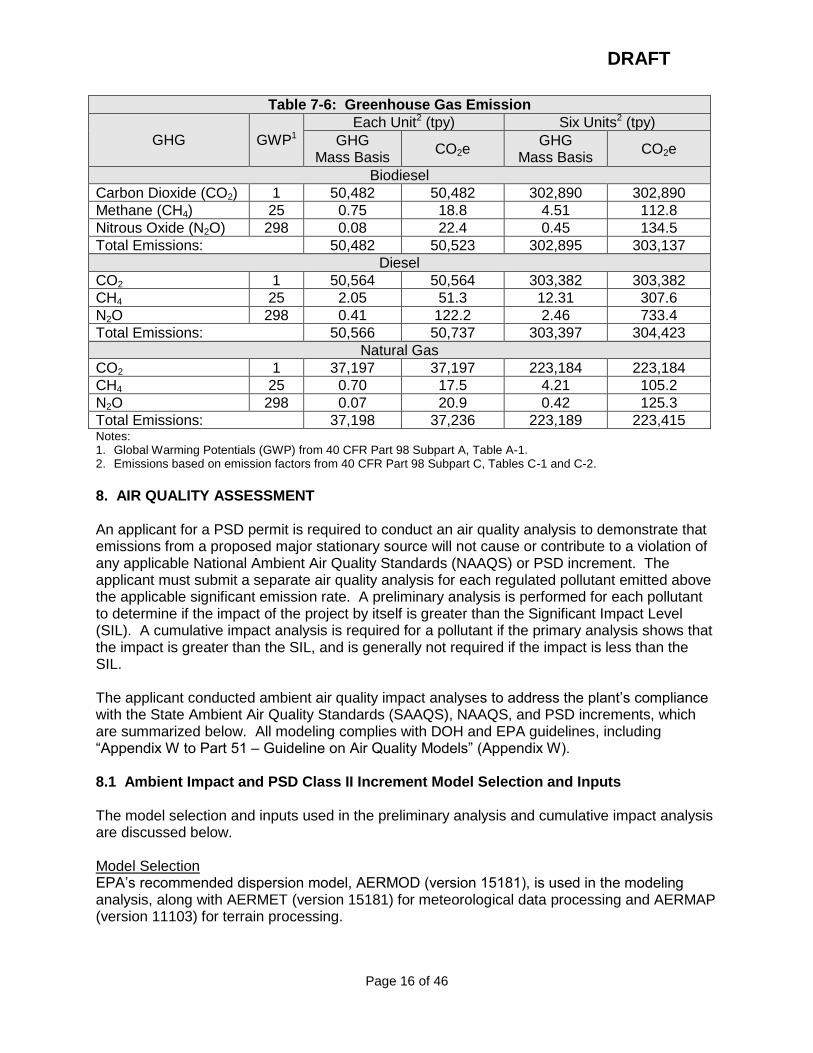
Greenhouse Gas (GHG) Emissions Total GHG emissions on a CO2 equivalent (CO2e) basis are summarized in the table below:
DRAFT
Page 16 of 46
Table 7-6: Greenhouse Gas Emission
GHG GWP1
Each Unit2 (tpy) Six Units2 (tpy)
GHG Mass Basis
CO2e GHG
Mass Basis CO2e
Biodiesel
Carbon Dioxide (CO2) 1 50,482 50,482 302,890 302,890
Methane (CH4) 25 0.75 18.8 4.51 112.8
Nitrous Oxide (N2O) 298 0.08 22.4 0.45 134.5
Total Emissions: 50,482 50,523 302,895 303,137
Diesel
CO2 1 50,564 50,564 303,382 303,382
CH4 25 2.05 51.3 12.31 307.6
N2O 298 0.41 122.2 2.46 733.4
Total Emissions: 50,566 50,737 303,397 304,423
Natural Gas
CO2 1 37,197 37,197 223,184 223,184
CH4 25 0.70 17.5 4.21 105.2
N2O 298 0.07 20.9 0.42 125.3
Total Emissions: 37,198 37,236 223,189 223,415 Notes: 1. Global Warming Potentials (GWP) from 40 CFR Part 98 Subpart A, Table A-1. 2. Emissions based on emission factors from 40 CFR Part 98 Subpart C, Tables C-1 and C-2.
8. AIR QUALITY ASSESSMENT An applicant for a PSD permit is required to conduct an air quality analysis to demonstrate that emissions from a proposed major stationary source will not cause or contribute to a violation of any applicable National Ambient Air Quality Standards (NAAQS) or PSD increment. The applicant must submit a separate air quality analysis for each regulated pollutant emitted above the applicable significant emission rate. A preliminary analysis is performed for each pollutant to determine if the impact of the project by itself is greater than the Significant Impact Level (SIL). A cumulative impact analysis is required for a pollutant if the primary analysis shows that the impact is greater than the SIL, and is generally not required if the impact is less than the SIL. The applicant conducted ambient air quality impact analyses to address the plant’s compliance with the State Ambient Air Quality Standards (SAAQS), NAAQS, and PSD increments, which are summarized below. All modeling complies with DOH and EPA guidelines, including “Appendix W to Part 51 – Guideline on Air Quality Models” (Appendix W). 8.1 Ambient Impact and PSD Class II Increment Model Selection and Inputs The model selection and inputs used in the preliminary analysis and cumulative impact analysis are discussed below. Model Selection EPA’s recommended dispersion model, AERMOD (version 15181), is used in the modeling analysis, along with AERMET (version 15181) for meteorological data processing and AERMAP (version 11103) for terrain processing.
DRAFT
Page 17 of 46
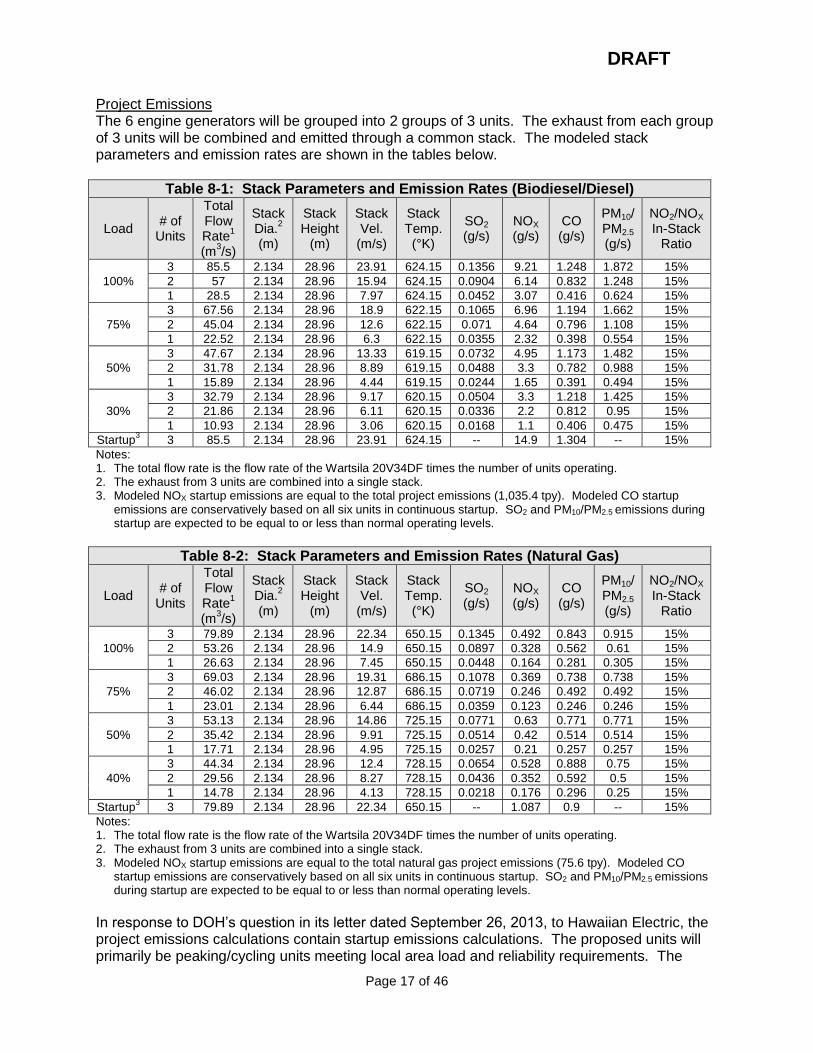
Project Emissions The 6 engine generators will be grouped into 2 groups of 3 units. The exhaust from each group of 3 units will be combined and emitted through a common stack. The modeled stack parameters and emission rates are shown in the tables below.
Table 8-1: Stack Parameters and Emission Rates (Biodiesel/Diesel)
Load # of
Units
Total Flow Rate
1
(m3/s)
Stack Dia.
2
(m)
Stack Height
(m)
Stack Vel.
(m/s)
Stack Temp. (°K)
SO2 (g/s)
NOX (g/s)
CO (g/s)
PM10/PM2.5 (g/s)
NO2/NOX In-Stack
Ratio
100%
3 85.5 2.134 28.96 23.91 624.15 0.1356 9.21 1.248 1.872 15%
2 57 2.134 28.96 15.94 624.15 0.0904 6.14 0.832 1.248 15%
1 28.5 2.134 28.96 7.97 624.15 0.0452 3.07 0.416 0.624 15%
75%
3 67.56 2.134 28.96 18.9 622.15 0.1065 6.96 1.194 1.662 15%
2 45.04 2.134 28.96 12.6 622.15 0.071 4.64 0.796 1.108 15%
1 22.52 2.134 28.96 6.3 622.15 0.0355 2.32 0.398 0.554 15%
50%
3 47.67 2.134 28.96 13.33 619.15 0.0732 4.95 1.173 1.482 15%
2 31.78 2.134 28.96 8.89 619.15 0.0488 3.3 0.782 0.988 15%
1 15.89 2.134 28.96 4.44 619.15 0.0244 1.65 0.391 0.494 15%
30%
3 32.79 2.134 28.96 9.17 620.15 0.0504 3.3 1.218 1.425 15%
2 21.86 2.134 28.96 6.11 620.15 0.0336 2.2 0.812 0.95 15%
1 10.93 2.134 28.96 3.06 620.15 0.0168 1.1 0.406 0.475 15%
Startup3 3 85.5 2.134 28.96 23.91 624.15 -- 14.9 1.304 -- 15%
Notes: 1. The total flow rate is the flow rate of the Wartsila 20V34DF times the number of units operating. 2. The exhaust from 3 units are combined into a single stack. 3. Modeled NOX startup emissions are equal to the total project emissions (1,035.4 tpy). Modeled CO startup
emissions are conservatively based on all six units in continuous startup. SO2 and PM10/PM2.5 emissions during startup are expected to be equal to or less than normal operating levels.
Table 8-2: Stack Parameters and Emission Rates (Natural Gas)
Load # of
Units
Total Flow Rate
1
(m3/s)
Stack Dia.
2
(m)
Stack Height
(m)
Stack Vel.
(m/s)
Stack Temp. (°K)
SO2 (g/s)
NOX (g/s)
CO (g/s)
PM10/PM2.5 (g/s)
NO2/NOX In-Stack
Ratio
100%
3 79.89 2.134 28.96 22.34 650.15 0.1345 0.492 0.843 0.915 15%
2 53.26 2.134 28.96 14.9 650.15 0.0897 0.328 0.562 0.61 15%
1 26.63 2.134 28.96 7.45 650.15 0.0448 0.164 0.281 0.305 15%
75%
3 69.03 2.134 28.96 19.31 686.15 0.1078 0.369 0.738 0.738 15%
2 46.02 2.134 28.96 12.87 686.15 0.0719 0.246 0.492 0.492 15%
1 23.01 2.134 28.96 6.44 686.15 0.0359 0.123 0.246 0.246 15%
50%
3 53.13 2.134 28.96 14.86 725.15 0.0771 0.63 0.771 0.771 15%
2 35.42 2.134 28.96 9.91 725.15 0.0514 0.42 0.514 0.514 15%
1 17.71 2.134 28.96 4.95 725.15 0.0257 0.21 0.257 0.257 15%
40%
3 44.34 2.134 28.96 12.4 728.15 0.0654 0.528 0.888 0.75 15%
2 29.56 2.134 28.96 8.27 728.15 0.0436 0.352 0.592 0.5 15%
1 14.78 2.134 28.96 4.13 728.15 0.0218 0.176 0.296 0.25 15%
Startup3 3 79.89 2.134 28.96 22.34 650.15 -- 1.087 0.9 -- 15%
Notes: 1. The total flow rate is the flow rate of the Wartsila 20V34DF times the number of units operating. 2. The exhaust from 3 units are combined into a single stack. 3. Modeled NOX startup emissions are equal to the total natural gas project emissions (75.6 tpy). Modeled CO
startup emissions are conservatively based on all six units in continuous startup. SO2 and PM10/PM2.5 emissions during startup are expected to be equal to or less than normal operating levels.
In response to DOH’s question in its letter dated September 26, 2013, to Hawaiian Electric, the project emissions calculations contain startup emissions calculations. The proposed units will primarily be peaking/cycling units meeting local area load and reliability requirements. The
DRAFT
Page 18 of 46
plant’s operational profile depends on system load, transmission system status, other generating facilities operations, and future renewable resources. Therefore, this analysis is based on a worst-case estimate of 8,760 total unit startups per year. During startup the unit will reach full load within 6 minutes of the initial firing. The SCR system will become fully functional once the catalyst reaches the operating temperature needed for NOX removal, not longer than 30 minutes. The time for the catalyst to reach the operating temperature is dependent on how long the unit was shutdown. The oxidation catalysts reach the operating temperature within 10 minutes of startup. Therefore, CO emissions are only slightly higher during startup. Unit shutdowns occur very quickly and emissions greater than normal levels during shutdowns are not expected. Per EPA’s March 1, 2011, memorandum, “Additional Clarification Regarding Application of Appendix W Modeling Guidance for the 1-hour NO2, National Ambient Air Quality Standard,” the modeled impacts for intermittent emissions scenarios (i.e., startup and shutdown) can be based on an average hourly emission rate instead of the maximum hourly emission rate. There is a total of 52,560 unit operating hours for the project (6 units times 8,760 operating hours per year). Therefore, the startup NOX emission rate is based on 8,760 unit startup hours plus the units operating at 100% load for the remaining 43,800 unit operating hours. Since the units will reach full load within 6 minutes of the initial firing, the startup stack parameters are based on the 100% load stack parameters. Also, the modeling assumes the startups are evenly distributed between the two stacks. The CO startup scenario conservatively models all six units in continuous startup. Taking credit for the combined flow rates in the modeling is not prohibited for this project. The PSD regulations (40 CFR §51.118(a) and 40 CFR §52.21(h)) contain limits on the use of other dispersion techniques. Dispersion techniques are defined in 40 CFR §51.100(hh)(1) as “any technique which attempts to affect the concentration of a pollutant in the ambient air by…increasing final exhaust gas plume rise by… selective handling of exhaust gas streams so as to increase the exhaust gas plume rise.” However, the merging of exhaust gas streams when the facility is originally designed and constructed with merged gas streams (40 CFR §51.100(hh)(2)(ii)(A)) is excluded from the dispersion techniques defined in 40 CFR §51.100(hh)(1). The proposed project meets this criteria. The Environmental Appeals Board (EAB) addresses the use of this exemption in its April 28, 1997, Order Denying Review of appeals in the Kawaihae Cogeneration Project case. The EAB stated:
The regulations prohibit the use of certain “dispersion techniques” in modeling ambient air quality impacts, including “any technique which attempts to affect the concentration of a pollutant in the ambient air by * * * increasing final exhaust gas plume rise by * * * combining exhaust gases from several existing stacks into one stack * * *.” 40 C.F.R. § 51.100(hh)(1)(iii). However, the regulations provide an exception to the prohibition on merged plume modeling where “the facility was originally designed and constructed with such merged gas streams * * *.” Id. § 51.100(hh)(2)(ii)(A). Plainly, there were no stacks “existing” when KCP performed its merged plume modeling. See id. § 51.100(hh)(1). Moreover, the facility as redesigned and permitted will be constructed with a single stack; therefore the merged plume modeling is not considered a prohibited “dispersion technique”.
DRAFT
Page 19 of 46
See id. § 51.100(hh)(2). We agree with the Region that the plain intent of the regulations is not “to prohibit construction of a stack that combines gas streams, but rather to prohibit post construction merging of gas streams if separate stacks were assumed for air quality impact purposes and originally constructed.” Region’s Response at 12-13.
Like the Kawaihae project, the Schofield project is proposing construction of stack(s) that combines gas streams. Existing Emissions A cumulative impact analysis considers emissions from the project itself and nearby existing sources. To account for existing sources located in the project area, an emissions inventory was generated by reviewing the current Covered and Noncovered Source Permit (CSP and NSP) Applications submitted to DOH. In addition to these sources, an emissions inventory of existing sources located in Campbell Industrial Park (CIP) was developed by starting with DOH’s 1999 report, “Campbell Industrial Park/Kahe Area Ambient Air Quality Assessment Study.” That information was updated by reviewing the current CSP Applications and annual emissions inventory/fees reports submitted to DOH. Appendix A of the PSD/CSP application contains the existing sources emissions inventory and a plot of the source locations in relation to the proposed site of the Schofield Generating Station. Review of the emissions inventory identified the following nearby sources with capped stacks or horizontal releases:
Naval Security Group Activity Kunia (NSP No. 0121-02-N) – Four (4) diesel engine generators (DEGs) with horizontal releases.
U.S. Army Garrison Hawaii (CSP No. 0226-01-C) – Two (2) Cleaver Brooks 350 HP boilers with capped stacks.
Kunia Water Association, Inc. (NSP No. 0357-01-N) – One (1) 750 HP diesel engine with twin capped stacks.
Monsanto Company (NSP No.0685-01-N) – Four (4) Donaldson Torit pulsed jet baghouses with horizontal releases.
EPA’s July 9, 1993, memorandum, “Proposal for Calculating Plume Rise for Stacks with Horizontal Releases or Rain Caps for Cookson Pigment, Newark, New Jersey,” and the AERMOD Implementation Guide suggest that capped stacks and horizontal releases be modeled with the following pseudo point source parameters:
Exit velocity of 0.001 m/s to suppress vertical momentum of the plume;
Effective diameter to maintain the actual flow rate;
Turn off stack-tip downwash via the keyword NOSTD; and
Reduce the stack height of capped stacks by three times the actual stack diameter. Without the BETA options, AERMOD is not capable of modeling capped stacks and horizontal releases with non-capped vertical point sources using the regulatory default options in the same run. AERMOD (starting with version 06341) contains BETA options for capped stacks and horizontal releases. With these options, capped stacks and horizontal releases are modeled following the pseudo point source parameters discussed above. EPA’s March 1, 2011, memorandum concludes that the most appropriate data to use for compliance demonstrations for the 1-hour NO2 NAAQS are those based on emissions scenarios that are continuous or frequent enough to contribute significantly to the annual distribution of
DRAFT
Page 20 of 46
daily maximum 1-hour concentrations. However, the average hourly emission rates may be used in place of the maximum hourly emission rates in cases where there is uncertainty regarding the operation frequency or if monitoring records show the sources operate throughout the year. This methodology is also valid for the 1-hour SO2 standard. Therefore, the following intermittent sources, identified in Appendix B of the PSD/CSP application, are modeled at their average hourly emission rates in the 1-hour modeling:
Campbell Industrial Park Generating Station (CSP No. 0548-01-C) – Two (2) Kohler black start generators with an operating limit of 500 hours per year each.
Kahe Generating station (CSP No. 0240-01-C) – Two (2) General Motors black start generators with a combined operating limit of 300 hours per year.
National Security Agency (NSP No. 0121-02-N) – Four (4) DEGs with a combined annual operating limit of 2,100 hours per year (maximum of 525 hours per year per unit).
U.S. Army Garrison Hawaii (CSP No. 0226-01-C) – One (1) flexible emissions diagnostic system (FEDS) consisting of three test stands. The FEDS does not have an hour or fuel limit. Therefore, the 1-hour emission rate is based on the projected emission rate listed in the CSP Application Review, dated September 7, 2007.
The existing Hawaiian Electric Kahe Generating Station (Kahe) generating units and existing Hawaiian Electric Waiau Generating Station (Waiau) generating units are included in the combined impact modeling. Appendix C of the PSD/CSP application contains the stack parameters and emission rates from the existing Kahe and Waiau sources. Meteorological data EPA’s meteorological processor for AERMOD, AERMET (version 15181), is used to create the required meteorological input files. National Weather Service (NWS) surface data from Wheeler Army Airfield (AAF) provide the 5 years of surface meteorological data for the modeling. In response to DOH’s question in its letter dated September 26, 2013, to Hawaiian Electric, Hawaiian Electric reviewed the 2007 to 2011 and 2008 to 2012 5-year data periods. The percentage of missing hours identified by AERMOD is 13.26% for the 2007 to 2011 period and 13.19% for the 2008 to 2012 period. Using earlier data would not be helpful as the data recovery before the automated measurement is typically less than 60%. Therefore, the selected 5-year collection period is from January 1, 2008 through December 31, 2012. To address DOH and EPA concerns over the large number of AERMOD non-calculable hours, additional existing representative meteorological data were utilized to the greatest extent possible to reduce the number of calm, variable, and missing hours. The substitution process reduced the total number of AERMOD non-calculable hours from 33.1% to 19.9%, and reduced the number of hours with either a variable wind direction or missing wind data to 4.6% of the 5-year period. Appendix L of the PSD/CSP application contains the “Wheeler AAF Meteorological Data Substitutions” report dated January 2015 which documents the data substitution process. To supplement the Wheeler AAF filled-in meteorological dataset, a weight-of-evidence ambient air impact modeling using Honolulu International Airport data was also conducted. The weight-of-evidence modeling is discussed in Section 8.3. The Lihue Airport and Hilo International Airport are the only available sources of upper air meteorological data in the state of Hawaii. The Lihue Airport station is operated by the NWS and is located on the Island of Kauai approximately 145 km (90 miles) northwest of the project.
DRAFT
Page 21 of 46
As previously recommend by DOH for sources on Oahu, the Lihue Airport soundings provide the primary required upper air meteorological data for AERMET. Receptor Grid The DOH modeling guidelines require: 1. That the refined grid should have receptor spacing no greater than 100 meters in flat and
rolling terrain. 2. If predicted impacts are greater than 75% of the applicable air standard in flat or rolling
terrain, receptor grids should have receptor spacing no greater than 50 m. 3. For areas of intermediate and complex terrain, refined grid spacing should have a receptor
spacing no greater than 30 m. The initial modeling grid (Grid 1) consists of the following:
25 m site boundary receptors;
25 m spaced receptors centered at 595,700 m Easting, 2,374,600 m Northing to 600 m;
50 m spaced receptors from the sources to 1.0 km;
100 m spaced receptors from 1.0 km to 3.0 km;
250 m spaced receptors from 3.0 km to 4 km; and
500 m spaced receptors from 4 km to 6 km. An additional 2 km spaced receptors (Grid ROI) from 6 km to 50 km is used to ensure the entire project’s 1-hour NO2 significant impact area is identified. In response to DOH’s question in its letter dated September 26, 2013, to Hawaiian Electric, the public will not have access to any areas that do not contain receptors. Receptor elevations and height scales are derived from the USGS National Elevation Dataset (NED) data using EPA’s AERMAP (version 11103) program. AERMOD uses the receptor’s height scale to determine if the plume is terrain following or terrain impacting. The AERMAP User’s Guide states that the domain boundary must include all terrain features that exceed a 10% elevation slope from any given receptor. Section 4.2 of the AERMOD Implementation Guide states:
The 10% slope rule may lead to excessively large domains in areas with considerable terrain features (e.g., fjords, successive mountain ranges, etc). In these situations, the reviewing authority may make a case-by-case determination regarding the domain size needed for AERMAP to determine the critical dividing streamline height for each receptor.
The Island of Oahu contains two mountain ranges: the Koolau Range in eastern Oahu and the Waianae Range in western Oahu. The Koolau Range is approximately 17 km (10.6 miles) to the west of the project site and does not exceed a 10% elevation slope with any given receptor. Therefore, the terrain domain for Grid 1 is limited to the western portion of Oahu (i.e., the Waianae Range). Background Concentrations A cumulative impact analysis requires the consideration of background concentrations. Background concentrations represent impacts of existing sources not included in the modeling in the impact area (e.g., area and mobile sources, natural sources), and distant point sources as well as nonanthropogenic sources. In addition, EPA’s May 20, 2014, memorandum, “Guidance
DRAFT
Page 22 of 46
for PM2.5 Permit Modeling,” states PM2.5 background concentrations also represent secondary PM2.5 impacts from regional transport and precursor emissions from nearby sources. Ambient air quality monitoring data are available at multiple DOH and Hawaiian Electric ambient air quality monitoring (AQM) stations on Oahu. In response to DOH’s question in its letter dated September 26, 2013, to Hawaiian Electric, the currently operating AQM stations and the approximate distance to the project site are listed below: DOH AQM Stations:
Pearl City located 13.0 km to the southeast of the facility;
Kapolei located 17.5 km to the south-southwest of the facility;
Sand Island located 27.5 km to the southeast of the facility; and
Honolulu located 28.0 km to the southeast of the facility. Hawaiian Electric AQM Stations:
Waianae Valley located 11.0 km to the west of the facility;
Lualualei located 15.0 km to the west-southwest of the facility; and
Timberline located 12.5 km to the west-southwest of the facility. The closest AQM stations to the project site represent a conservative estimate of background concentrations as they include the impacts of both modeled and non-modeled sources. The Waianae Valley AQM station was used for the 1-hour and annual NO2, and 24-hour and annual PM10 background concentrations. The Hawaiian Electric AQM stations do not collect PM2.5 data. Therefore, the Pearl City AQM station was used for the 24-hour and annual PM2.5 background concentrations. GEP Stack Height and Building Downwash EPA’s Building Profile Input Program for PRIME (BPIP-PRIME) was used to evaluate downwash effects of nearby structures. The engine generator stacks are 28.96 m (95.0 ft) high, which is less than the Good Engineering Practice (GEP) stack height of 65 m. Urban/Rural Classification The rural dispersion coefficient was selected based on the land use procedure provided in Appendix W, Section 7.2.3. NO2 Modeling Methodology Appendix W describes a three tier NO2 modeling approach for the conversion of nitric oxide (NO) to NO2. While Appendix W has not been updated since the addition of the 1-hour NO2 NAAQS, EPA’s June 28, 2010, memorandum, “Applicability of Appendix W Modeling Guidance for the 1-hour NO2 National Ambient Air Quality Standard,” and March 1, 2011, memorandum specify that the three tiered screening approach also applies to the new 1-hour NO2 standard. The three tiers are:
Tier 1 – Assumes total conversion of NO to NO2.
Tier 2 – The Ambient Ratio Method (ARM) is based on multiplying the modeled NOX
estimate by EPA’s default equilibrium NO2/NOX ratio of 75% for the annual averaging period and 80% for the 1-hour averaging period.
DRAFT
Page 23 of 46
Tier 3 – Detailed analysis on a case-by-case basis. EPA has implemented two Tier 3 options, Ozone Limiting Method (OLM) and Plume Volume Molar Ratio Method (PVMRM), into AERMOD as non-regulatory options.
Section 5.0 of the PSD/CSP application provides the justification for the use of the PVMRM option for determining NO2 concentrations for compliance with the NAAQS/SAAQS. The project impact modeling for NOX is based on the ARM for both the 1-hour and annual NO2 significant impact areas. The full impact modeling is based on the PVMRM for the 1-hour modeling and ARM for the annual modeling. DOH’s Sand Island AQM station is the only source of concurrent O3 data. Hourly O3 data for the 5-year period (January 1, 2008 through December 31, 2012) is used, with missing observations filled. NO2/NOX in-stack ratios In lieu of source specific data, EPA’s March 1, 2011, memorandum established a “default” NO2/NOX in-stack ratio of 50% for the OLM and PVMRM modeling methodologies. The source specific NO2/NOX in-stack ratio for the proposed units is based on test results from 12.5 MW Mitsubishi DEGs (units M10 and M12) located at the Maui Electric Company (Maui Electric) Maalaea Generating Station and EPA’s NO2/NOX In-Stack Ratio (ISR) Database. Units M10 and M12 and the proposed units have a displacement greater than 30 liters per cylinder. The measured NO2/NOX in-stack ratios for M10 and M12 are 10.0% and 10.9%, respectively. In response to DOH’s question in its letter dated September 26, 2013, to Hawaiian Electric, Hawaiian Electric reviewed EPA’s NO2/NOX ISR Database and identified the Tor Viking II Main Propulsion diesel engines as the most similar in size and controls to the proposed units when burning biodiesel/diesel. The Tor Viking II Main Propulsion diesel engines are rated at 5,046 hp and are equipped with SCR and a diesel oxidation catalyst. EPA’s ISR Database listed NO2/NOX in-stack ratios for 30%, 40%, 60%, and 80% loads range from 5% to 9%. The Caterpillar G3616LE RICE listed in EPA’s ISR Database is the most similar in size and controls to the proposed units when burning natural gas. The Caterpillar G3616LE RICE is a four-stoke lean burn engine rated at 4,735 hp and is equipped with an oxidation catalyst. EPA’s ISR Database listed NO2/NOX in-stack ratios for 92%, 94%, 97%, and 99% loads range from 0.7% to 2.8%. EPA’s ISR Database does not contain information on in-stack ratios during startup. Since the proposed units reach full load in 6 minutes, an uncontrolled unit tested at full load has the most similar operating scenario when the proposed units are in startup. A search of EPA’s ISR Database identified an uncontrolled Wartsila 12V32C (rated at 5,211 kWe). The only in-stack ratio listed was 5.52% for the 50% load. This supports the use of a 15% in-stack ratio for the proposed units during startup. The modeled source specific NO2/NOX in-stack ratio for the proposed units is set to 15% for all scenarios. To account for the potential variability in the NO2/NOX in-stack ratio, the modeled value is approximately increased by the following ratios:
Biodiesel/Diesel: 1.4 times the measured values for M10 and M12, and 1.7 times the values listed in EPA’s ISR Database.
Natural Gas – 5.3 times the values listed in EPA’s ISR Database.
DRAFT
Page 24 of 46
As described in Appendix B of the PSD/CSP application, non-default NO2/NOX in-stack ratios are appropriate for the following sources: 10% NO2/NOX in-stack ratio:
Campbell Industrial Park Generating Station (CSP No. 0548-01-C) – One (1) 135 MW Siemens Westinghouse Power Corporation combustion turbine (CT).
H-Power (CSP Nos. 0255-01-C, 0255-02-C) – Three (3) Municipal Waste Combustors.
AES Hawaii, Inc. (CSP No. 0087-02-C) – Two (2) Alhstrom Pyropower Corporation circulating fluidized bed (CFB) coal-fired steam boilers with a total maximum design heat input of 2,150 MMBtu/hr.
Kalaeloa Partners, L.P. (CSP No. 0214-01-C) – Two (2) 86 MW ABB CTs. 20% NO2/NOX in-stack ratio:
Naval Security Group Activity Kunia (NSP No. 0121-02-N) – Four (4) DEGs with horizontal releases.
Kunia Water Association, Inc. (NSP No. 0357-01-N) – One (1) 750 HP diesel engine with twin capped stacks.
The NO2/NOX in-stack ratios from Kahe’s units K1 through K6 and Waiau’s units W3 through W10 are based on 1.25 times the results from the stack testing conducted by Fossil Energy Research Corporation, final report dated October 2010. Hawaiian Electric expects that worst-case conditions will not exceed 1.25 times the stack test results. Kahe’s black starts A and B in-stack ratio of 10% NO2 is based on stack testing for Maui Electric's Maalaea Generating Station M3 conducted in June 2011. Black starts A and B and M3 are all EMD 20-645 series DEGs with factory fuel injection timing. The default NO2/NOX in-stack ratio of 50% is used for the remaining existing sources. 8.2 Ambient Impact and PSD Class II Increment Modeling Results 8.2.1 Preliminary Analysis A preliminary analysis was conducted to: 1) determine whether a full or cumulative impact analysis must be performed; 2) determine whether a source is exempt from preconstruction monitoring; and 3) define the impact area within which a full impact analysis must be performed. The preliminary analysis only models the impacts from the project itself. HAR §11-60.1-83(a)(12) requires an ambient air quality analysis for any regulated air pollutant with any increase in emissions. Therefore, the ambient air quality analysis is not limited to pollutants with a significant emissions increase, but includes all pollutants with emissions increases. In Appendix W, Section 8.1.2(a), EPA recommends that the full impact modeling should include the worst-case load and the design load (i.e., 100% load) for those pollutants and averaging periods that are above the modeling SIL. The preliminary analysis requires identifying the worst-case operating scenario for S1 through S6. The evaluation considers S1 through S6 operating at 100%, 75%, 50%, and minimum (30% for biodiesel/diesel and 40% for natural gas) loads. Also, a startup scenario is evaluated. The
DRAFT
Page 25 of 46
following steps determine the project’s maximum impact for each pollutant and averaging period: 1. Determine the project’s maximum impact for all receptors for all averaging periods for five
loads (100%, 75%, 50%, and minimum) and 1, 2, 3, 4, 5, and 6 units operating simultaneously and the startup scenario.
2. Compare the project’s maximum impact identified in step 1 with the significant monitoring concentrations (SMC) and modeling SIL.
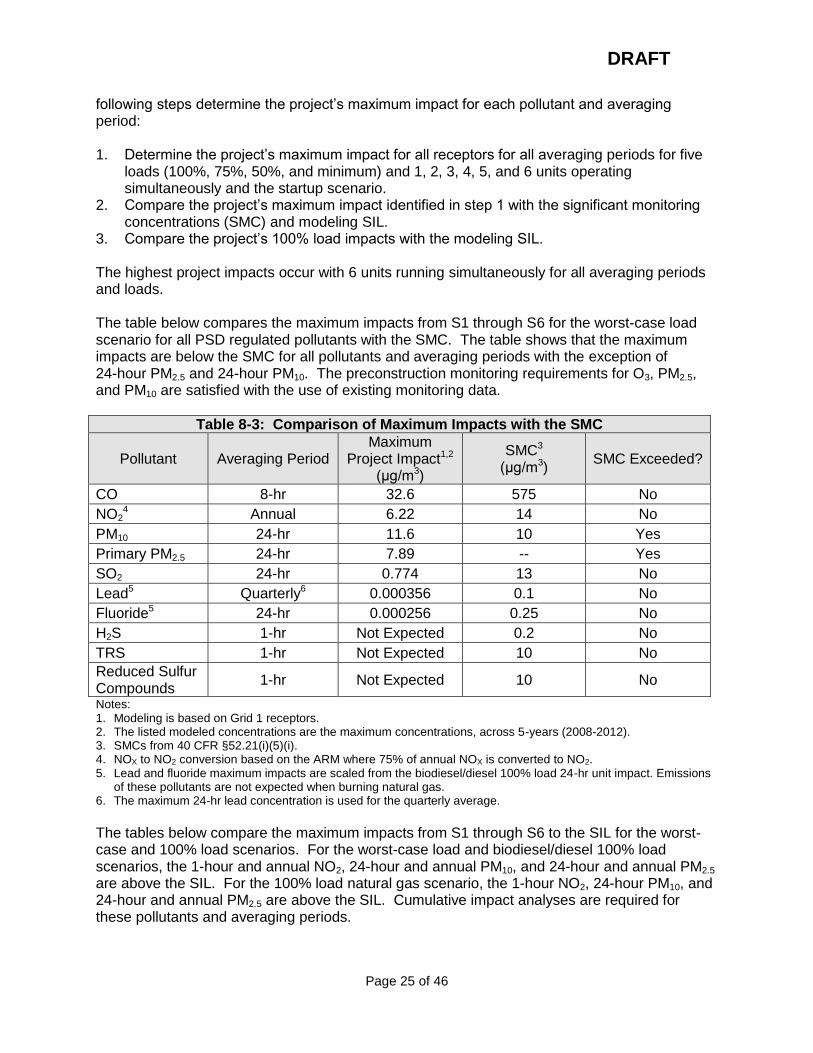
3. Compare the project’s 100% load impacts with the modeling SIL. The highest project impacts occur with 6 units running simultaneously for all averaging periods and loads. The table below compares the maximum impacts from S1 through S6 for the worst-case load scenario for all PSD regulated pollutants with the SMC. The table shows that the maximum impacts are below the SMC for all pollutants and averaging periods with the exception of 24-hour PM2.5 and 24-hour PM10. The preconstruction monitoring requirements for O3, PM2.5, and PM10 are satisfied with the use of existing monitoring data.
Table 8-3: Comparison of Maximum Impacts with the SMC
Pollutant Averaging Period Maximum
Project Impact1,2 (μg/m3)
SMC3 (μg/m3)
SMC Exceeded?
CO 8-hr 32.6 575 No
NO24 Annual 6.22 14 No
PM10 24-hr 11.6 10 Yes
Primary PM2.5 24-hr 7.89 -- Yes
SO2 24-hr 0.774 13 No
Lead5 Quarterly6 0.000356 0.1 No
Fluoride5 24-hr 0.000256 0.25 No
H2S 1-hr Not Expected 0.2 No
TRS 1-hr Not Expected 10 No
Reduced Sulfur Compounds
1-hr Not Expected 10 No
Notes: 1. Modeling is based on Grid 1 receptors. 2. The listed modeled concentrations are the maximum concentrations, across 5-years (2008-2012). 3. SMCs from 40 CFR §52.21(i)(5)(i). 4. NOX to NO2 conversion based on the ARM where 75% of annual NOX is converted to NO2. 5. Lead and fluoride maximum impacts are scaled from the biodiesel/diesel 100% load 24-hr unit impact. Emissions
of these pollutants are not expected when burning natural gas. 6. The maximum 24-hr lead concentration is used for the quarterly average.
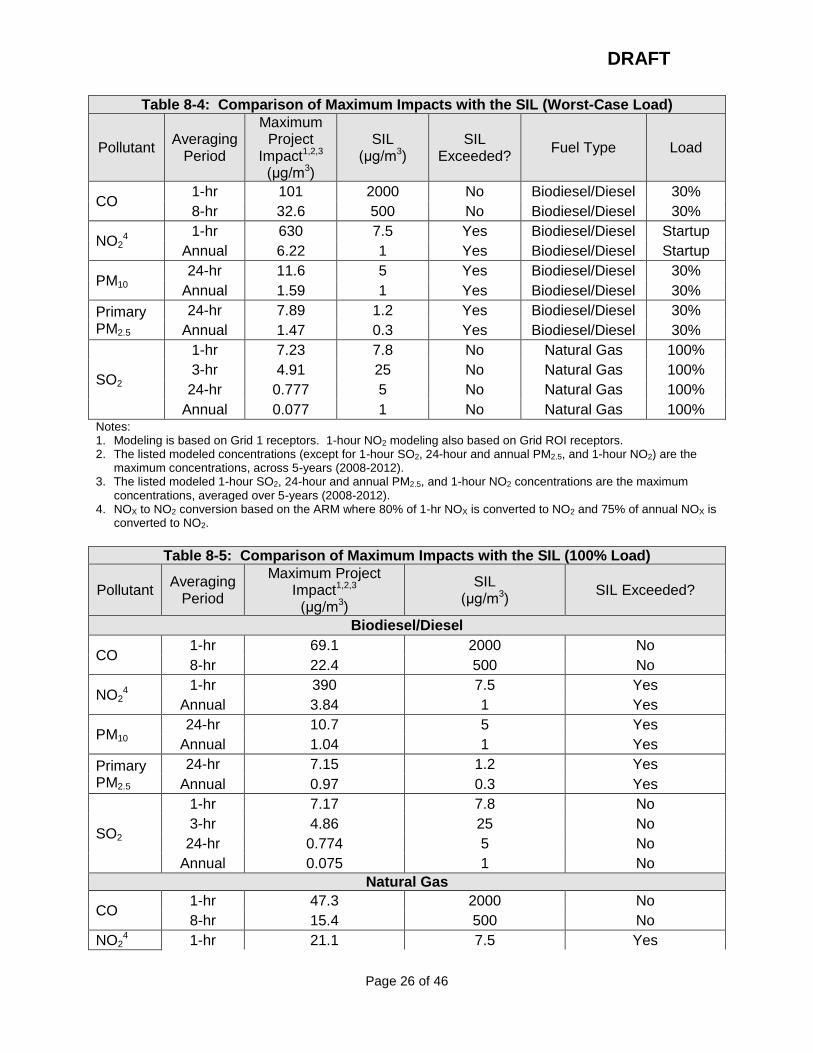
The tables below compare the maximum impacts from S1 through S6 to the SIL for the worst-case and 100% load scenarios. For the worst-case load and biodiesel/diesel 100% load scenarios, the 1-hour and annual NO2, 24-hour and annual PM10, and 24-hour and annual PM2.5 are above the SIL. For the 100% load natural gas scenario, the 1-hour NO2, 24-hour PM10, and 24-hour and annual PM2.5 are above the SIL. Cumulative impact analyses are required for these pollutants and averaging periods.
DRAFT
Page 26 of 46
Table 8-4: Comparison of Maximum Impacts with the SIL (Worst-Case Load)
Pollutant Averaging
Period
Maximum Project
Impact1,2,3 (μg/m3)
SIL (μg/m3)
SIL Exceeded?
Fuel Type Load
CO 1-hr 101 2000 No Biodiesel/Diesel 30%
8-hr 32.6 500 No Biodiesel/Diesel 30%
NO24
1-hr 630 7.5 Yes Biodiesel/Diesel Startup
Annual 6.22 1 Yes Biodiesel/Diesel Startup
PM10 24-hr 11.6 5 Yes Biodiesel/Diesel 30%
Annual 1.59 1 Yes Biodiesel/Diesel 30%
Primary PM2.5
24-hr 7.89 1.2 Yes Biodiesel/Diesel 30%
Annual 1.47 0.3 Yes Biodiesel/Diesel 30%
SO2
1-hr 7.23 7.8 No Natural Gas 100%
3-hr 4.91 25 No Natural Gas 100%
24-hr 0.777 5 No Natural Gas 100%
Annual 0.077 1 No Natural Gas 100% Notes: 1. Modeling is based on Grid 1 receptors. 1-hour NO2 modeling also based on Grid ROI receptors. 2. The listed modeled concentrations (except for 1-hour SO2, 24-hour and annual PM2.5, and 1-hour NO2) are the
maximum concentrations, across 5-years (2008-2012). 3. The listed modeled 1-hour SO2, 24-hour and annual PM2.5, and 1-hour NO2 concentrations are the maximum
concentrations, averaged over 5-years (2008-2012). 4. NOX to NO2 conversion based on the ARM where 80% of 1-hr NOX is converted to NO2 and 75% of annual NOX is
converted to NO2.
Table 8-5: Comparison of Maximum Impacts with the SIL (100% Load)
Pollutant Averaging
Period
Maximum Project Impact1,2,3
(μg/m3)
SIL (μg/m3)
SIL Exceeded?
Biodiesel/Diesel
CO 1-hr 69.1 2000 No
8-hr 22.4 500 No
NO24
1-hr 390 7.5 Yes
Annual 3.84 1 Yes
PM10 24-hr 10.7 5 Yes
Annual 1.04 1 Yes
Primary PM2.5
24-hr 7.15 1.2 Yes
Annual 0.97 0.3 Yes
SO2
1-hr 7.17 7.8 No
3-hr 4.86 25 No
24-hr 0.774 5 No
Annual 0.075 1 No
Natural Gas
CO 1-hr 47.3 2000 No
8-hr 15.4 500 No
NO24 1-hr 21.1 7.5 Yes
DRAFT
Page 27 of 46
Annual 0.211 1 No
PM10 24-hr 5.29 5 Yes
Annual 0.524 1 No
Primary PM2.5
24-hr 3.54 1.2 Yes
Annual 0.487 0.3 Yes
SO2
1-hr 7.23 7.8 No
3-hr 4.91 25 No
24-hr 0.777 5 No
Annual 0.077 1 No Notes: 1. Modeling is based on Grid 1 receptors. 1-hour NO2 modeling also based on Grid ROI receptors. 2. The listed modeled concentrations (except for 1-hour SO2, 24-hour and annual PM2.5, and 1-hour NO2) are the
maximum concentrations, across 5-years (2008-2012). 3. The listed modeled 1-hour SO2, 24-hour and annual PM2.5, and 1-hour NO2 concentrations are the maximum
concentrations, averaged over 5-years (2008-2012). 4. NOX to NO2 conversion based on the ARM where 80% of 1-hr NOX is converted to NO2 and 75% of annual NOX is
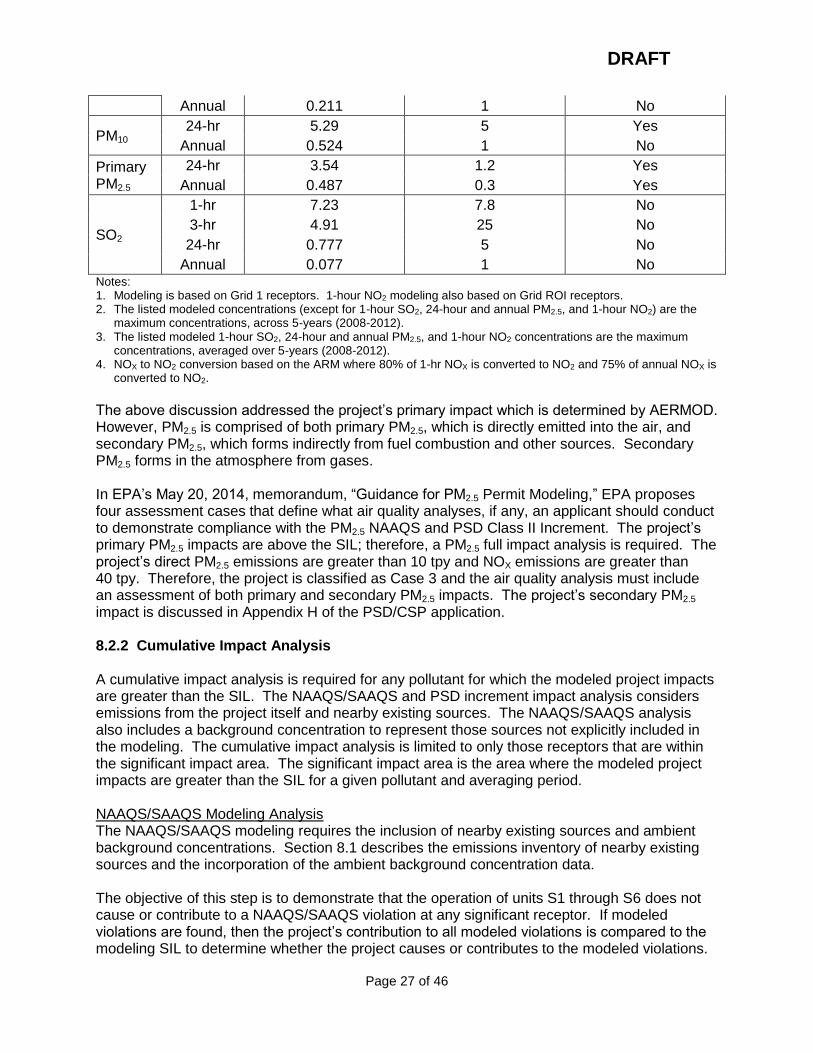
converted to NO2.
The above discussion addressed the project’s primary impact which is determined by AERMOD. However, PM2.5 is comprised of both primary PM2.5, which is directly emitted into the air, and secondary PM2.5, which forms indirectly from fuel combustion and other sources. Secondary PM2.5 forms in the atmosphere from gases. In EPA’s May 20, 2014, memorandum, “Guidance for PM2.5 Permit Modeling,” EPA proposes four assessment cases that define what air quality analyses, if any, an applicant should conduct to demonstrate compliance with the PM2.5 NAAQS and PSD Class II Increment. The project’s primary PM2.5 impacts are above the SIL; therefore, a PM2.5 full impact analysis is required. The project’s direct PM2.5 emissions are greater than 10 tpy and NOX emissions are greater than 40 tpy. Therefore, the project is classified as Case 3 and the air quality analysis must include an assessment of both primary and secondary PM2.5 impacts. The project’s secondary PM2.5 impact is discussed in Appendix H of the PSD/CSP application. 8.2.2 Cumulative Impact Analysis A cumulative impact analysis is required for any pollutant for which the modeled project impacts are greater than the SIL. The NAAQS/SAAQS and PSD increment impact analysis considers emissions from the project itself and nearby existing sources. The NAAQS/SAAQS analysis also includes a background concentration to represent those sources not explicitly included in the modeling. The cumulative impact analysis is limited to only those receptors that are within the significant impact area. The significant impact area is the area where the modeled project impacts are greater than the SIL for a given pollutant and averaging period. NAAQS/SAAQS Modeling Analysis The NAAQS/SAAQS modeling requires the inclusion of nearby existing sources and ambient background concentrations. Section 8.1 describes the emissions inventory of nearby existing sources and the incorporation of the ambient background concentration data. The objective of this step is to demonstrate that the operation of units S1 through S6 does not cause or contribute to a NAAQS/SAAQS violation at any significant receptor. If modeled violations are found, then the project’s contribution to all modeled violations is compared to the modeling SIL to determine whether the project causes or contributes to the modeled violations.
DRAFT
Page 28 of 46
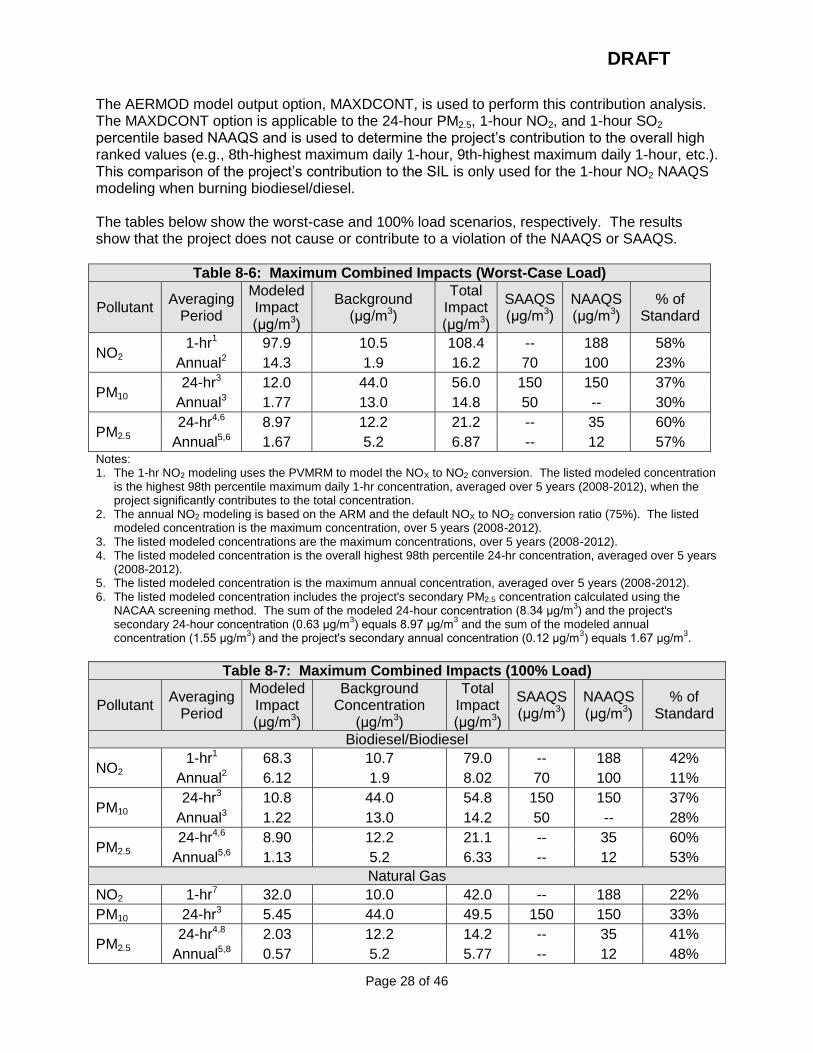
The AERMOD model output option, MAXDCONT, is used to perform this contribution analysis. The MAXDCONT option is applicable to the 24-hour PM2.5, 1-hour NO2, and 1-hour SO2 percentile based NAAQS and is used to determine the project’s contribution to the overall high ranked values (e.g., 8th-highest maximum daily 1-hour, 9th-highest maximum daily 1-hour, etc.). This comparison of the project’s contribution to the SIL is only used for the 1-hour NO2 NAAQS modeling when burning biodiesel/diesel. The tables below show the worst-case and 100% load scenarios, respectively. The results show that the project does not cause or contribute to a violation of the NAAQS or SAAQS.
Table 8-6: Maximum Combined Impacts (Worst-Case Load)
Pollutant Averaging
Period
Modeled Impact (μg/m3)
Background (μg/m3)
Total Impact (μg/m3)
SAAQS (μg/m3)
NAAQS (μg/m3)
% of Standard
NO2 1-hr1 97.9 10.5 108.4 -- 188 58%
Annual2 14.3 1.9 16.2 70 100 23%
PM10 24-hr3 12.0 44.0 56.0 150 150 37%
Annual3 1.77 13.0 14.8 50 -- 30%
PM2.5 24-hr4,6 8.97 12.2 21.2 -- 35 60%
Annual5,6 1.67 5.2 6.87 -- 12 57% Notes: 1. The 1-hr NO2 modeling uses the PVMRM to model the NOX to NO2 conversion. The listed modeled concentration
is the highest 98th percentile maximum daily 1-hr concentration, averaged over 5 years (2008-2012), when the project significantly contributes to the total concentration.
2. The annual NO2 modeling is based on the ARM and the default NOX to NO2 conversion ratio (75%). The listed modeled concentration is the maximum concentration, over 5 years (2008-2012).
3. The listed modeled concentrations are the maximum concentrations, over 5 years (2008-2012). 4. The listed modeled concentration is the overall highest 98th percentile 24-hr concentration, averaged over 5 years
(2008-2012). 5. The listed modeled concentration is the maximum annual concentration, averaged over 5 years (2008-2012). 6. The listed modeled concentration includes the project's secondary PM2.5 concentration calculated using the
NACAA screening method. The sum of the modeled 24-hour concentration (8.34 μg/m3) and the project's
secondary 24-hour concentration (0.63 μg/m3) equals 8.97 μg/m
3 and the sum of the modeled annual
concentration (1.55 μg/m3) and the project's secondary annual concentration (0.12 μg/m
3) equals 1.67 μg/m
3.
Table 8-7: Maximum Combined Impacts (100% Load)
Pollutant Averaging
Period
Modeled Impact (μg/m3)
Background Concentration
(μg/m3)
Total Impact (μg/m3)
SAAQS (μg/m3)
NAAQS (μg/m3)
% of Standard
Biodiesel/Biodiesel
NO2 1-hr1 68.3 10.7 79.0 -- 188 42%
Annual2 6.12 1.9 8.02 70 100 11%
PM10 24-hr3 10.8 44.0 54.8 150 150 37%
Annual3 1.22 13.0 14.2 50 -- 28%
PM2.5 24-hr4,6 8.90 12.2 21.1 -- 35 60%
Annual5,6 1.13 5.2 6.33 -- 12 53%
Natural Gas
NO2 1-hr7 32.0 10.0 42.0 -- 188 22%
PM10 24-hr3 5.45 44.0 49.5 150 150 33%
PM2.5 24-hr4,8 2.03 12.2 14.2 -- 35 41%
Annual5,8 0.57 5.2 5.77 -- 12 48%
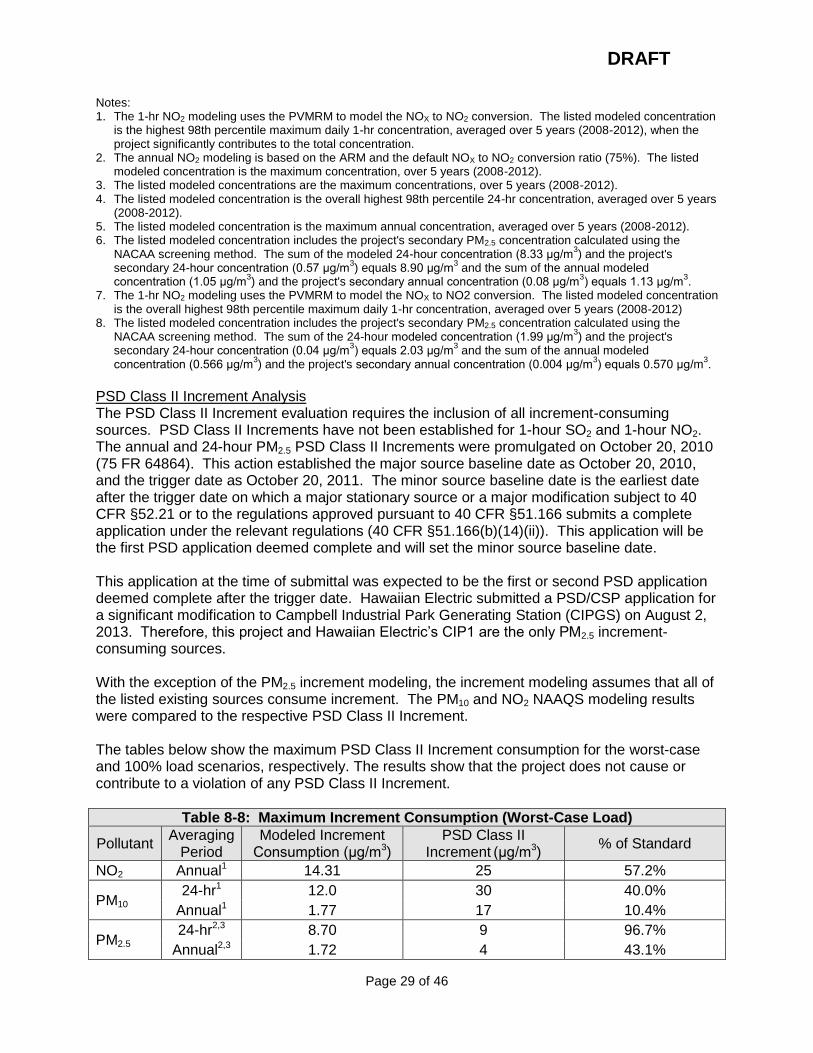
DRAFT
Page 29 of 46
Notes: 1. The 1-hr NO2 modeling uses the PVMRM to model the NOX to NO2 conversion. The listed modeled concentration
is the highest 98th percentile maximum daily 1-hr concentration, averaged over 5 years (2008-2012), when the project significantly contributes to the total concentration.
2. The annual NO2 modeling is based on the ARM and the default NOX to NO2 conversion ratio (75%). The listed modeled concentration is the maximum concentration, over 5 years (2008-2012).
3. The listed modeled concentrations are the maximum concentrations, over 5 years (2008-2012). 4. The listed modeled concentration is the overall highest 98th percentile 24-hr concentration, averaged over 5 years
(2008-2012). 5. The listed modeled concentration is the maximum annual concentration, averaged over 5 years (2008-2012). 6. The listed modeled concentration includes the project's secondary PM2.5 concentration calculated using the
NACAA screening method. The sum of the modeled 24-hour concentration (8.33 μg/m3) and the project's
secondary 24-hour concentration (0.57 μg/m3) equals 8.90 μg/m
3 and the sum of the annual modeled
concentration (1.05 μg/m3) and the project's secondary annual concentration (0.08 μg/m
3) equals 1.13 μg/m
3.
7. The 1-hr NO2 modeling uses the PVMRM to model the NOX to NO2 conversion. The listed modeled concentration is the overall highest 98th percentile maximum daily 1-hr concentration, averaged over 5 years (2008-2012)
8. The listed modeled concentration includes the project's secondary PM2.5 concentration calculated using the NACAA screening method. The sum of the 24-hour modeled concentration (1.99 μg/m
3) and the project's
secondary 24-hour concentration (0.04 μg/m3) equals 2.03 μg/m
3 and the sum of the annual modeled
concentration (0.566 μg/m3) and the project's secondary annual concentration (0.004 μg/m
3) equals 0.570 μg/m
3.
PSD Class II Increment Analysis The PSD Class II Increment evaluation requires the inclusion of all increment-consuming sources. PSD Class II Increments have not been established for 1-hour SO2 and 1-hour NO2. The annual and 24-hour PM2.5 PSD Class II Increments were promulgated on October 20, 2010 (75 FR 64864). This action established the major source baseline date as October 20, 2010, and the trigger date as October 20, 2011. The minor source baseline date is the earliest date after the trigger date on which a major stationary source or a major modification subject to 40 CFR §52.21 or to the regulations approved pursuant to 40 CFR §51.166 submits a complete application under the relevant regulations (40 CFR §51.166(b)(14)(ii)). This application will be the first PSD application deemed complete and will set the minor source baseline date. This application at the time of submittal was expected to be the first or second PSD application deemed complete after the trigger date. Hawaiian Electric submitted a PSD/CSP application for a significant modification to Campbell Industrial Park Generating Station (CIPGS) on August 2, 2013. Therefore, this project and Hawaiian Electric’s CIP1 are the only PM2.5 increment-consuming sources. With the exception of the PM2.5 increment modeling, the increment modeling assumes that all of the listed existing sources consume increment. The PM10 and NO2 NAAQS modeling results were compared to the respective PSD Class II Increment. The tables below show the maximum PSD Class II Increment consumption for the worst-case and 100% load scenarios, respectively. The results show that the project does not cause or contribute to a violation of any PSD Class II Increment.
Table 8-8: Maximum Increment Consumption (Worst-Case Load)
Pollutant Averaging
Period Modeled Increment
Consumption (μg/m3) PSD Class II
Increment (μg/m3) % of Standard
NO2 Annual1 14.31 25 57.2%
PM10 24-hr1 12.0 30 40.0%
Annual1 1.77 17 10.4%
PM2.5 24-hr2,3 8.70 9 96.7%
Annual2,3 1.72 4 43.1%
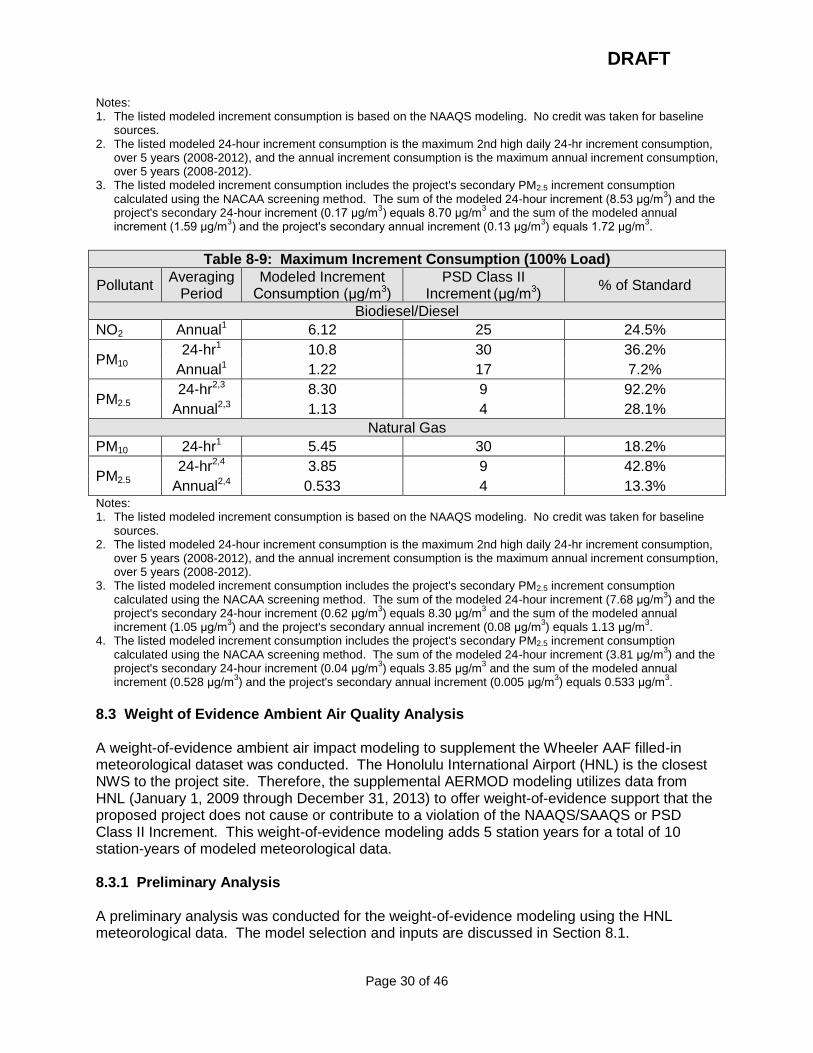
DRAFT
Page 30 of 46
Notes: 1. The listed modeled increment consumption is based on the NAAQS modeling. No credit was taken for baseline
sources. 2. The listed modeled 24-hour increment consumption is the maximum 2nd high daily 24-hr increment consumption,
over 5 years (2008-2012), and the annual increment consumption is the maximum annual increment consumption, over 5 years (2008-2012).
3. The listed modeled increment consumption includes the project's secondary PM2.5 increment consumption calculated using the NACAA screening method. The sum of the modeled 24-hour increment (8.53 μg/m
3) and the
project's secondary 24-hour increment (0.17 μg/m3) equals 8.70 μg/m
3 and the sum of the modeled annual
increment (1.59 μg/m3) and the project's secondary annual increment (0.13 μg/m
3) equals 1.72 μg/m
3.
Table 8-9: Maximum Increment Consumption (100% Load)
Pollutant Averaging
Period Modeled Increment
Consumption (μg/m3) PSD Class II
Increment (μg/m3) % of Standard
Biodiesel/Diesel
NO2 Annual1 6.12 25 24.5%
PM10 24-hr1 10.8 30 36.2%
Annual1 1.22 17 7.2%
PM2.5 24-hr2,3 8.30 9 92.2%
Annual2,3 1.13 4 28.1%
Natural Gas
PM10 24-hr1 5.45 30 18.2%
PM2.5 24-hr2,4 3.85 9 42.8%
Annual2,4 0.533 4 13.3% Notes: 1. The listed modeled increment consumption is based on the NAAQS modeling. No credit was taken for baseline
sources. 2. The listed modeled 24-hour increment consumption is the maximum 2nd high daily 24-hr increment consumption,
over 5 years (2008-2012), and the annual increment consumption is the maximum annual increment consumption, over 5 years (2008-2012).
3. The listed modeled increment consumption includes the project's secondary PM2.5 increment consumption calculated using the NACAA screening method. The sum of the modeled 24-hour increment (7.68 μg/m
3) and the
project's secondary 24-hour increment (0.62 μg/m3) equals 8.30 μg/m
3 and the sum of the modeled annual
increment (1.05 μg/m3) and the project's secondary annual increment (0.08 μg/m
3) equals 1.13 μg/m
3.
4. The listed modeled increment consumption includes the project's secondary PM2.5 increment consumption calculated using the NACAA screening method. The sum of the modeled 24-hour increment (3.81 μg/m
3) and the
project's secondary 24-hour increment (0.04 μg/m3) equals 3.85 μg/m
3 and the sum of the modeled annual
increment (0.528 μg/m3) and the project's secondary annual increment (0.005 μg/m
3) equals 0.533 μg/m
3.
8.3 Weight of Evidence Ambient Air Quality Analysis A weight-of-evidence ambient air impact modeling to supplement the Wheeler AAF filled-in meteorological dataset was conducted. The Honolulu International Airport (HNL) is the closest NWS to the project site. Therefore, the supplemental AERMOD modeling utilizes data from HNL (January 1, 2009 through December 31, 2013) to offer weight-of-evidence support that the proposed project does not cause or contribute to a violation of the NAAQS/SAAQS or PSD Class II Increment. This weight-of-evidence modeling adds 5 station years for a total of 10 station-years of modeled meteorological data. 8.3.1 Preliminary Analysis A preliminary analysis was conducted for the weight-of-evidence modeling using the HNL meteorological data. The model selection and inputs are discussed in Section 8.1.
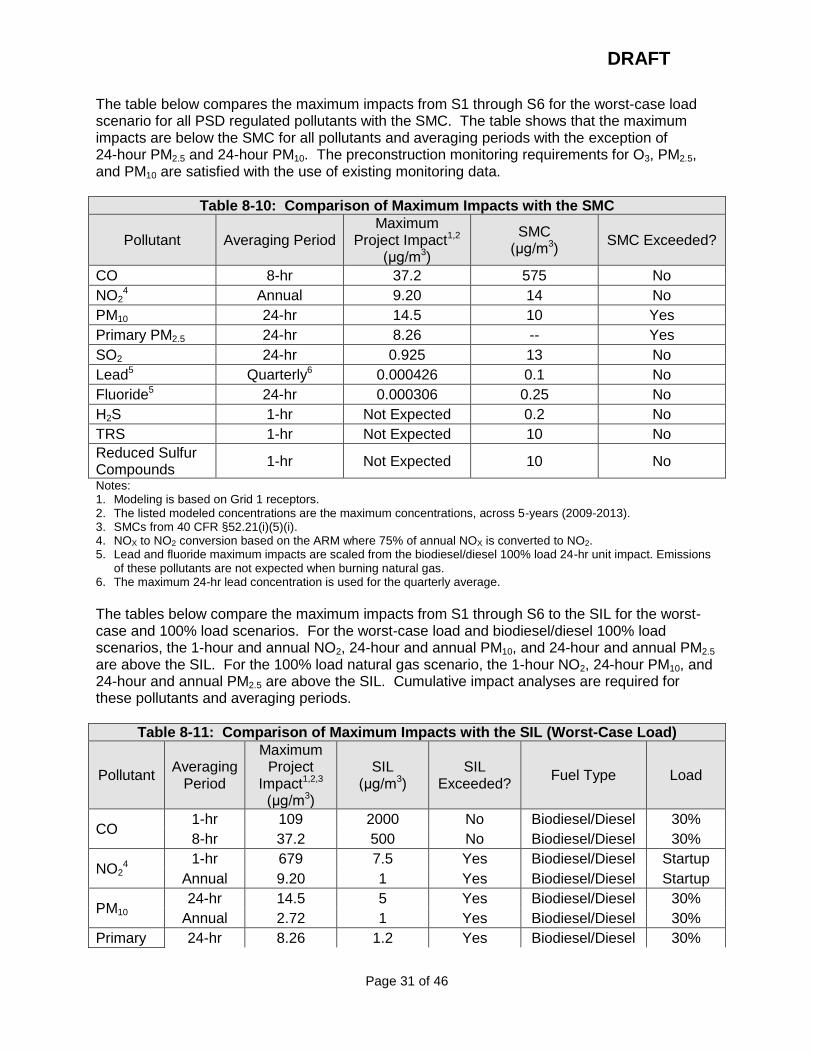
DRAFT
Page 31 of 46
The table below compares the maximum impacts from S1 through S6 for the worst-case load scenario for all PSD regulated pollutants with the SMC. The table shows that the maximum impacts are below the SMC for all pollutants and averaging periods with the exception of 24-hour PM2.5 and 24-hour PM10. The preconstruction monitoring requirements for O3, PM2.5, and PM10 are satisfied with the use of existing monitoring data.
Table 8-10: Comparison of Maximum Impacts with the SMC
Pollutant Averaging Period Maximum
Project Impact1,2 (μg/m3)
SMC (μg/m3)
SMC Exceeded?
CO 8-hr 37.2 575 No
NO24 Annual 9.20 14 No
PM10 24-hr 14.5 10 Yes
Primary PM2.5 24-hr 8.26 -- Yes
SO2 24-hr 0.925 13 No
Lead5 Quarterly6 0.000426 0.1 No
Fluoride5 24-hr 0.000306 0.25 No
H2S 1-hr Not Expected 0.2 No
TRS 1-hr Not Expected 10 No
Reduced Sulfur Compounds
1-hr Not Expected 10 No
Notes: 1. Modeling is based on Grid 1 receptors. 2. The listed modeled concentrations are the maximum concentrations, across 5-years (2009-2013). 3. SMCs from 40 CFR §52.21(i)(5)(i). 4. NOX to NO2 conversion based on the ARM where 75% of annual NOX is converted to NO2. 5. Lead and fluoride maximum impacts are scaled from the biodiesel/diesel 100% load 24-hr unit impact. Emissions
of these pollutants are not expected when burning natural gas. 6. The maximum 24-hr lead concentration is used for the quarterly average.
The tables below compare the maximum impacts from S1 through S6 to the SIL for the worst-case and 100% load scenarios. For the worst-case load and biodiesel/diesel 100% load scenarios, the 1-hour and annual NO2, 24-hour and annual PM10, and 24-hour and annual PM2.5 are above the SIL. For the 100% load natural gas scenario, the 1-hour NO2, 24-hour PM10, and 24-hour and annual PM2.5 are above the SIL. Cumulative impact analyses are required for these pollutants and averaging periods.
Table 8-11: Comparison of Maximum Impacts with the SIL (Worst-Case Load)
Pollutant Averaging
Period
Maximum Project
Impact1,2,3 (μg/m3)
SIL (μg/m3)
SIL Exceeded?
Fuel Type Load
CO 1-hr 109 2000 No Biodiesel/Diesel 30%
8-hr 37.2 500 No Biodiesel/Diesel 30%
NO24
1-hr 679 7.5 Yes Biodiesel/Diesel Startup
Annual 9.20 1 Yes Biodiesel/Diesel Startup
PM10 24-hr 14.5 5 Yes Biodiesel/Diesel 30%
Annual 2.72 1 Yes Biodiesel/Diesel 30%
Primary 24-hr 8.26 1.2 Yes Biodiesel/Diesel 30%
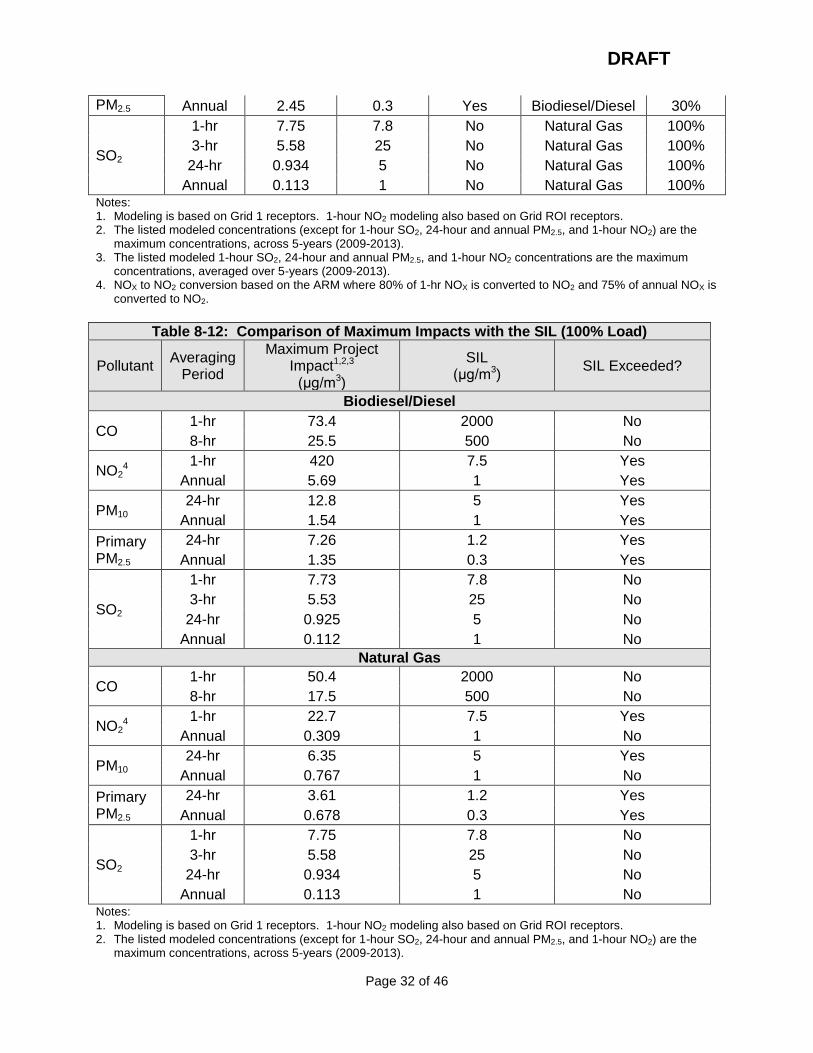
DRAFT
Page 32 of 46
PM2.5 Annual 2.45 0.3 Yes Biodiesel/Diesel 30%
SO2
1-hr 7.75 7.8 No Natural Gas 100%
3-hr 5.58 25 No Natural Gas 100%
24-hr 0.934 5 No Natural Gas 100%
Annual 0.113 1 No Natural Gas 100% Notes: 1. Modeling is based on Grid 1 receptors. 1-hour NO2 modeling also based on Grid ROI receptors. 2. The listed modeled concentrations (except for 1-hour SO2, 24-hour and annual PM2.5, and 1-hour NO2) are the
maximum concentrations, across 5-years (2009-2013). 3. The listed modeled 1-hour SO2, 24-hour and annual PM2.5, and 1-hour NO2 concentrations are the maximum
concentrations, averaged over 5-years (2009-2013). 4. NOX to NO2 conversion based on the ARM where 80% of 1-hr NOX is converted to NO2 and 75% of annual NOX is
converted to NO2.
Table 8-12: Comparison of Maximum Impacts with the SIL (100% Load)
Pollutant Averaging
Period
Maximum Project Impact1,2,3
(μg/m3)
SIL (μg/m3)
SIL Exceeded?
Biodiesel/Diesel
CO 1-hr 73.4 2000 No
8-hr 25.5 500 No
NO24
1-hr 420 7.5 Yes
Annual 5.69 1 Yes
PM10 24-hr 12.8 5 Yes
Annual 1.54 1 Yes
Primary PM2.5
24-hr 7.26 1.2 Yes
Annual 1.35 0.3 Yes
SO2
1-hr 7.73 7.8 No
3-hr 5.53 25 No
24-hr 0.925 5 No
Annual 0.112 1 No
Natural Gas
CO 1-hr 50.4 2000 No
8-hr 17.5 500 No
NO24
1-hr 22.7 7.5 Yes
Annual 0.309 1 No
PM10 24-hr 6.35 5 Yes
Annual 0.767 1 No
Primary PM2.5
24-hr 3.61 1.2 Yes
Annual 0.678 0.3 Yes
SO2
1-hr 7.75 7.8 No
3-hr 5.58 25 No
24-hr 0.934 5 No
Annual 0.113 1 No Notes: 1. Modeling is based on Grid 1 receptors. 1-hour NO2 modeling also based on Grid ROI receptors. 2. The listed modeled concentrations (except for 1-hour SO2, 24-hour and annual PM2.5, and 1-hour NO2) are the
maximum concentrations, across 5-years (2009-2013).
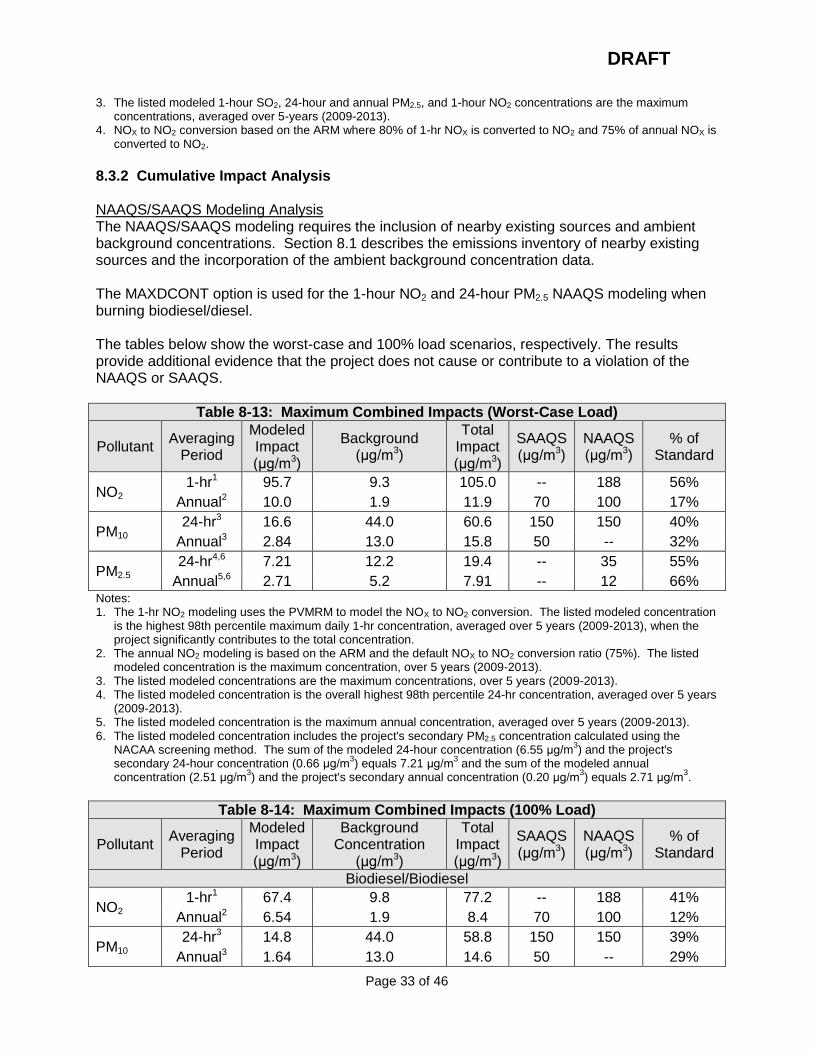
DRAFT
Page 33 of 46
3. The listed modeled 1-hour SO2, 24-hour and annual PM2.5, and 1-hour NO2 concentrations are the maximum concentrations, averaged over 5-years (2009-2013).
4. NOX to NO2 conversion based on the ARM where 80% of 1-hr NOX is converted to NO2 and 75% of annual NOX is converted to NO2.
8.3.2 Cumulative Impact Analysis NAAQS/SAAQS Modeling Analysis The NAAQS/SAAQS modeling requires the inclusion of nearby existing sources and ambient background concentrations. Section 8.1 describes the emissions inventory of nearby existing sources and the incorporation of the ambient background concentration data. The MAXDCONT option is used for the 1-hour NO2 and 24-hour PM2.5 NAAQS modeling when burning biodiesel/diesel. The tables below show the worst-case and 100% load scenarios, respectively. The results provide additional evidence that the project does not cause or contribute to a violation of the NAAQS or SAAQS.
Table 8-13: Maximum Combined Impacts (Worst-Case Load)
Pollutant Averaging
Period
Modeled Impact (μg/m3)
Background
(μg/m3)
Total Impact (μg/m3)
SAAQS (μg/m3)
NAAQS (μg/m3)
% of Standard
NO2 1-hr1 95.7 9.3 105.0 -- 188 56%
Annual2 10.0 1.9 11.9 70 100 17%
PM10 24-hr3 16.6 44.0 60.6 150 150 40%
Annual3 2.84 13.0 15.8 50 -- 32%
PM2.5 24-hr4,6 7.21 12.2 19.4 -- 35 55%
Annual5,6 2.71 5.2 7.91 -- 12 66% Notes: 1. The 1-hr NO2 modeling uses the PVMRM to model the NOX to NO2 conversion. The listed modeled concentration
is the highest 98th percentile maximum daily 1-hr concentration, averaged over 5 years (2009-2013), when the project significantly contributes to the total concentration.
2. The annual NO2 modeling is based on the ARM and the default NOX to NO2 conversion ratio (75%). The listed modeled concentration is the maximum concentration, over 5 years (2009-2013).
3. The listed modeled concentrations are the maximum concentrations, over 5 years (2009-2013). 4. The listed modeled concentration is the overall highest 98th percentile 24-hr concentration, averaged over 5 years
(2009-2013). 5. The listed modeled concentration is the maximum annual concentration, averaged over 5 years (2009-2013). 6. The listed modeled concentration includes the project's secondary PM2.5 concentration calculated using the
NACAA screening method. The sum of the modeled 24-hour concentration (6.55 μg/m3) and the project's
secondary 24-hour concentration (0.66 μg/m3) equals 7.21 μg/m
3 and the sum of the modeled annual
concentration (2.51 μg/m3) and the project's secondary annual concentration (0.20 μg/m
3) equals 2.71 μg/m
3.
Table 8-14: Maximum Combined Impacts (100% Load)
Pollutant Averaging
Period
Modeled Impact (μg/m3)
Background Concentration
(μg/m3)
Total Impact (μg/m3)
SAAQS (μg/m3)
NAAQS (μg/m3)
% of Standard
Biodiesel/Biodiesel
NO2 1-hr1 67.4 9.8 77.2 -- 188 41%
Annual2 6.54 1.9 8.4 70 100 12%
PM10 24-hr3 14.8 44.0 58.8 150 150 39%
Annual3 1.64 13.0 14.6 50 -- 29%
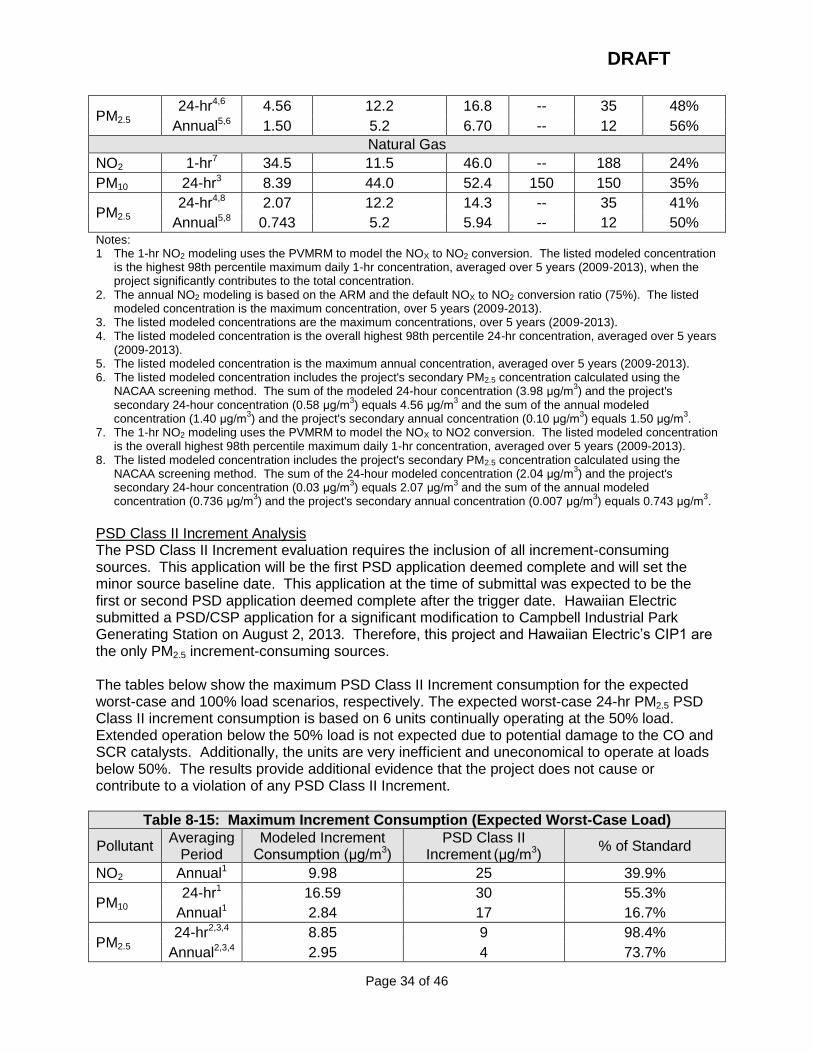
DRAFT
Page 34 of 46
PM2.5 24-hr4,6 4.56 12.2 16.8 -- 35 48%
Annual5,6 1.50 5.2 6.70 -- 12 56%
Natural Gas
NO2 1-hr7 34.5 11.5 46.0 -- 188 24%
PM10 24-hr3 8.39 44.0 52.4 150 150 35%
PM2.5 24-hr4,8 2.07 12.2 14.3 -- 35 41%
Annual5,8 0.743 5.2 5.94 -- 12 50% Notes: 1 The 1-hr NO2 modeling uses the PVMRM to model the NOX to NO2 conversion. The listed modeled concentration
is the highest 98th percentile maximum daily 1-hr concentration, averaged over 5 years (2009-2013), when the project significantly contributes to the total concentration.
2. The annual NO2 modeling is based on the ARM and the default NOX to NO2 conversion ratio (75%). The listed modeled concentration is the maximum concentration, over 5 years (2009-2013).
3. The listed modeled concentrations are the maximum concentrations, over 5 years (2009-2013). 4. The listed modeled concentration is the overall highest 98th percentile 24-hr concentration, averaged over 5 years
(2009-2013). 5. The listed modeled concentration is the maximum annual concentration, averaged over 5 years (2009-2013). 6. The listed modeled concentration includes the project's secondary PM2.5 concentration calculated using the
NACAA screening method. The sum of the modeled 24-hour concentration (3.98 μg/m3) and the project's
secondary 24-hour concentration (0.58 μg/m3) equals 4.56 μg/m
3 and the sum of the annual modeled
concentration (1.40 μg/m3) and the project's secondary annual concentration (0.10 μg/m
3) equals 1.50 μg/m
3.
7. The 1-hr NO2 modeling uses the PVMRM to model the NOX to NO2 conversion. The listed modeled concentration is the overall highest 98th percentile maximum daily 1-hr concentration, averaged over 5 years (2009-2013).
8. The listed modeled concentration includes the project's secondary PM2.5 concentration calculated using the NACAA screening method. The sum of the 24-hour modeled concentration (2.04 μg/m
3) and the project's
secondary 24-hour concentration (0.03 μg/m3) equals 2.07 μg/m
3 and the sum of the annual modeled
concentration (0.736 μg/m3) and the project's secondary annual concentration (0.007 μg/m
3) equals 0.743 μg/m
3.
PSD Class II Increment Analysis The PSD Class II Increment evaluation requires the inclusion of all increment-consuming sources. This application will be the first PSD application deemed complete and will set the minor source baseline date. This application at the time of submittal was expected to be the first or second PSD application deemed complete after the trigger date. Hawaiian Electric submitted a PSD/CSP application for a significant modification to Campbell Industrial Park Generating Station on August 2, 2013. Therefore, this project and Hawaiian Electric’s CIP1 are the only PM2.5 increment-consuming sources. The tables below show the maximum PSD Class II Increment consumption for the expected worst-case and 100% load scenarios, respectively. The expected worst-case 24-hr PM2.5 PSD Class II increment consumption is based on 6 units continually operating at the 50% load. Extended operation below the 50% load is not expected due to potential damage to the CO and SCR catalysts. Additionally, the units are very inefficient and uneconomical to operate at loads below 50%. The results provide additional evidence that the project does not cause or contribute to a violation of any PSD Class II Increment.
Table 8-15: Maximum Increment Consumption (Expected Worst-Case Load)
Pollutant Averaging
Period Modeled Increment
Consumption (μg/m3) PSD Class II
Increment (μg/m3) % of Standard
NO2 Annual1 9.98 25 39.9%
PM10 24-hr1 16.59 30 55.3%
Annual1 2.84 17 16.7%
PM2.5 24-hr2,3,4 8.85 9 98.4%
Annual2,3,4 2.95 4 73.7%
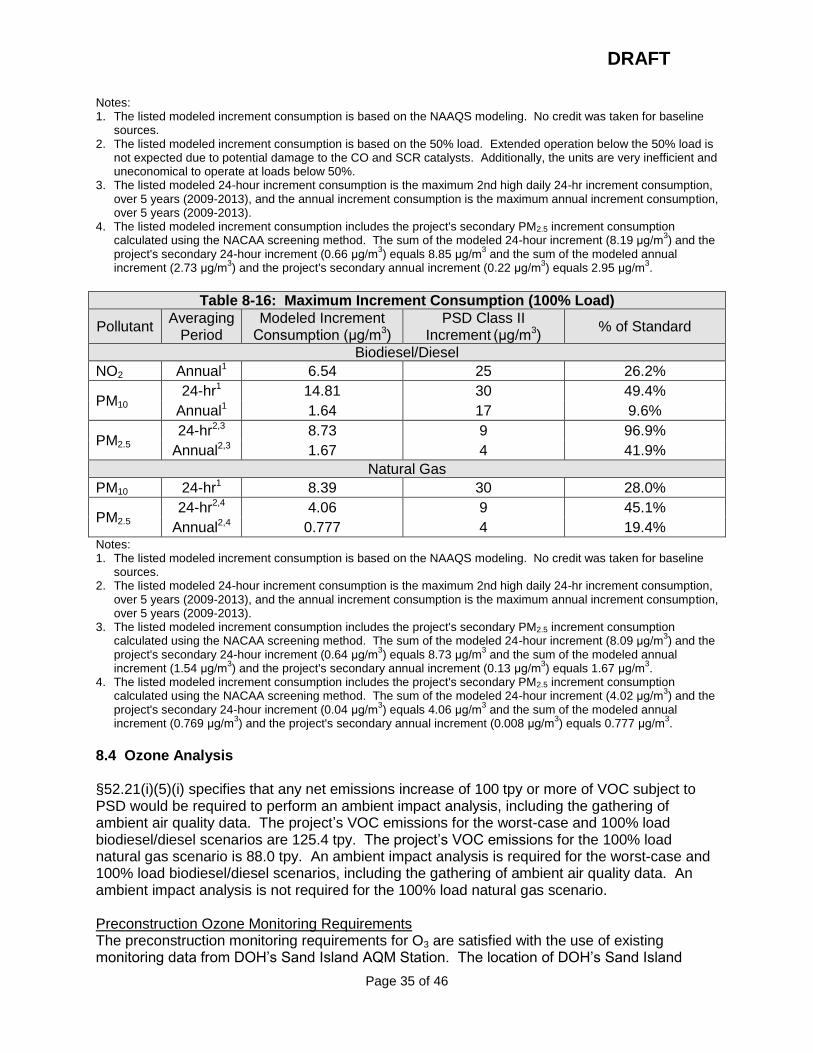
DRAFT
Page 35 of 46
Notes: 1. The listed modeled increment consumption is based on the NAAQS modeling. No credit was taken for baseline
sources. 2. The listed modeled increment consumption is based on the 50% load. Extended operation below the 50% load is
not expected due to potential damage to the CO and SCR catalysts. Additionally, the units are very inefficient and uneconomical to operate at loads below 50%.
3. The listed modeled 24-hour increment consumption is the maximum 2nd high daily 24-hr increment consumption, over 5 years (2009-2013), and the annual increment consumption is the maximum annual increment consumption, over 5 years (2009-2013).
4. The listed modeled increment consumption includes the project's secondary PM2.5 increment consumption calculated using the NACAA screening method. The sum of the modeled 24-hour increment (8.19 μg/m
3) and the
project's secondary 24-hour increment (0.66 μg/m3) equals 8.85 μg/m
3 and the sum of the modeled annual
increment (2.73 μg/m3) and the project's secondary annual increment (0.22 μg/m
3) equals 2.95 μg/m
3.
Table 8-16: Maximum Increment Consumption (100% Load)
Pollutant Averaging
Period Modeled Increment
Consumption (μg/m3) PSD Class II
Increment (μg/m3) % of Standard
Biodiesel/Diesel
NO2 Annual1 6.54 25 26.2%
PM10 24-hr1 14.81 30 49.4%
Annual1 1.64 17 9.6%
PM2.5 24-hr2,3 8.73 9 96.9%
Annual2,3 1.67 4 41.9%
Natural Gas
PM10 24-hr1 8.39 30 28.0%
PM2.5 24-hr2,4 4.06 9 45.1%
Annual2,4 0.777 4 19.4% Notes: 1. The listed modeled increment consumption is based on the NAAQS modeling. No credit was taken for baseline
sources. 2. The listed modeled 24-hour increment consumption is the maximum 2nd high daily 24-hr increment consumption,
over 5 years (2009-2013), and the annual increment consumption is the maximum annual increment consumption, over 5 years (2009-2013).
3. The listed modeled increment consumption includes the project's secondary PM2.5 increment consumption calculated using the NACAA screening method. The sum of the modeled 24-hour increment (8.09 μg/m
3) and the
project's secondary 24-hour increment (0.64 μg/m3) equals 8.73 μg/m
3 and the sum of the modeled annual
increment (1.54 μg/m3) and the project's secondary annual increment (0.13 μg/m
3) equals 1.67 μg/m
3.
4. The listed modeled increment consumption includes the project's secondary PM2.5 increment consumption calculated using the NACAA screening method. The sum of the modeled 24-hour increment (4.02 μg/m
3) and the
project's secondary 24-hour increment (0.04 μg/m3) equals 4.06 μg/m
3 and the sum of the modeled annual
increment (0.769 μg/m3) and the project's secondary annual increment (0.008 μg/m
3) equals 0.777 μg/m
3.
8.4 Ozone Analysis §52.21(i)(5)(i) specifies that any net emissions increase of 100 tpy or more of VOC subject to PSD would be required to perform an ambient impact analysis, including the gathering of ambient air quality data. The project’s VOC emissions for the worst-case and 100% load biodiesel/diesel scenarios are 125.4 tpy. The project’s VOC emissions for the 100% load natural gas scenario is 88.0 tpy. An ambient impact analysis is required for the worst-case and 100% load biodiesel/diesel scenarios, including the gathering of ambient air quality data. An ambient impact analysis is not required for the 100% load natural gas scenario. Preconstruction Ozone Monitoring Requirements The preconstruction monitoring requirements for O3 are satisfied with the use of existing monitoring data from DOH’s Sand Island AQM Station. The location of DOH’s Sand Island
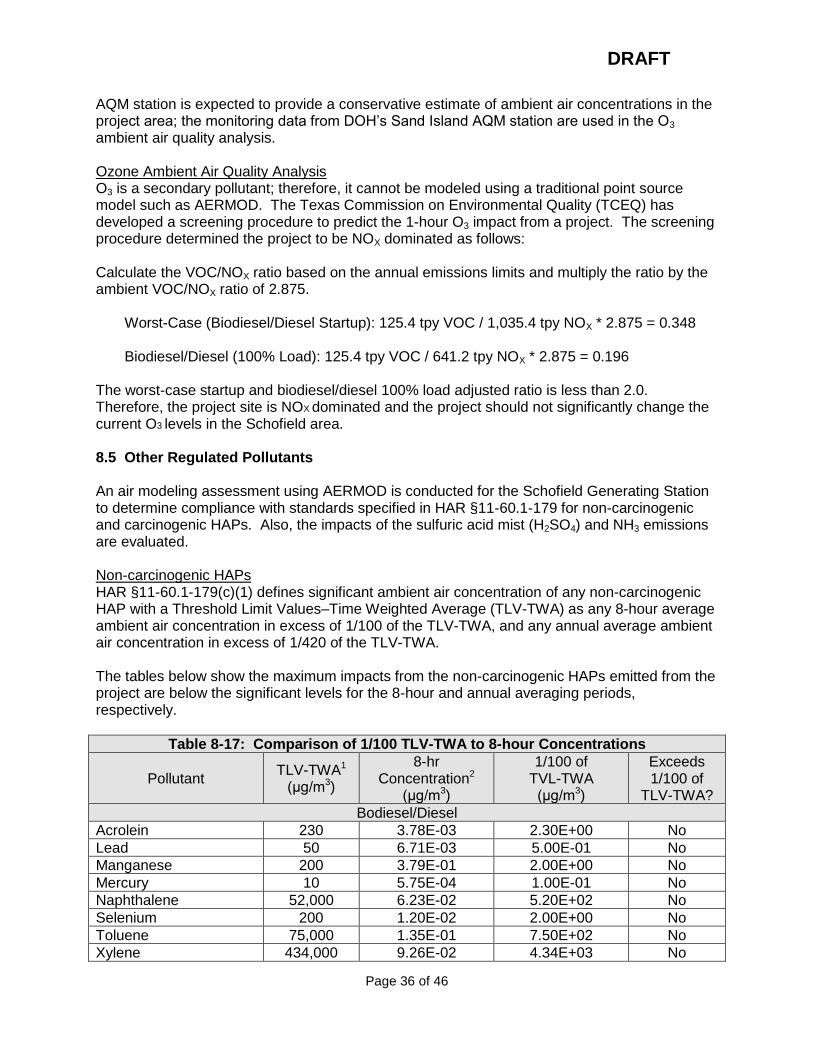
DRAFT
Page 36 of 46
AQM station is expected to provide a conservative estimate of ambient air concentrations in the project area; the monitoring data from DOH’s Sand Island AQM station are used in the O3 ambient air quality analysis. Ozone Ambient Air Quality Analysis O3 is a secondary pollutant; therefore, it cannot be modeled using a traditional point source model such as AERMOD. The Texas Commission on Environmental Quality (TCEQ) has developed a screening procedure to predict the 1-hour O3 impact from a project. The screening procedure determined the project to be NOX dominated as follows: Calculate the VOC/NOX ratio based on the annual emissions limits and multiply the ratio by the ambient VOC/NOX ratio of 2.875.
Worst-Case (Biodiesel/Diesel Startup): 125.4 tpy VOC / 1,035.4 tpy NOX * 2.875 = 0.348
Biodiesel/Diesel (100% Load): 125.4 tpy VOC / 641.2 tpy NOX * 2.875 = 0.196 The worst-case startup and biodiesel/diesel 100% load adjusted ratio is less than 2.0. Therefore, the project site is NOX dominated and the project should not significantly change the current O3 levels in the Schofield area. 8.5 Other Regulated Pollutants An air modeling assessment using AERMOD is conducted for the Schofield Generating Station to determine compliance with standards specified in HAR §11-60.1-179 for non-carcinogenic and carcinogenic HAPs. Also, the impacts of the sulfuric acid mist (H2SO4) and NH3 emissions are evaluated. Non-carcinogenic HAPs HAR §11-60.1-179(c)(1) defines significant ambient air concentration of any non-carcinogenic HAP with a Threshold Limit Values–Time Weighted Average (TLV-TWA) as any 8-hour average ambient air concentration in excess of 1/100 of the TLV-TWA, and any annual average ambient air concentration in excess of 1/420 of the TLV-TWA. The tables below show the maximum impacts from the non-carcinogenic HAPs emitted from the project are below the significant levels for the 8-hour and annual averaging periods, respectively.
Table 8-17: Comparison of 1/100 TLV-TWA to 8-hour Concentrations
Pollutant TLV-TWA1
(μg/m3)
8-hr Concentration2
(μg/m3)
1/100 of TVL-TWA (μg/m3)
Exceeds 1/100 of
TLV-TWA?
Bodiesel/Diesel
Acrolein 230 3.78E-03 2.30E+00 No
Lead 50 6.71E-03 5.00E-01 No
Manganese 200 3.79E-01 2.00E+00 No
Mercury 10 5.75E-04 1.00E-01 No
Naphthalene 52,000 6.23E-02 5.20E+02 No
Selenium 200 1.20E-02 2.00E+00 No
Toluene 75,000 1.35E-01 7.50E+02 No
Xylene 434,000 9.26E-02 4.34E+03 No
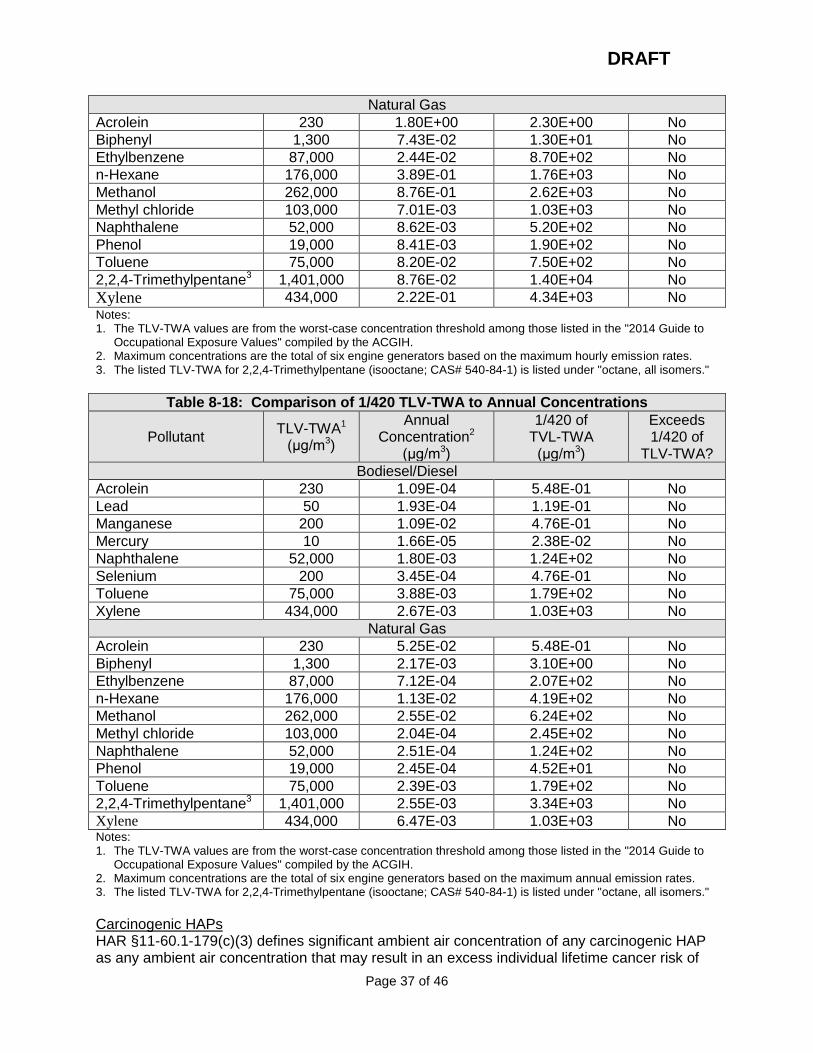
DRAFT
Page 37 of 46
Natural Gas
Acrolein 230 1.80E+00 2.30E+00 No
Biphenyl 1,300 7.43E-02 1.30E+01 No
Ethylbenzene 87,000 2.44E-02 8.70E+02 No
n-Hexane 176,000 3.89E-01 1.76E+03 No
Methanol 262,000 8.76E-01 2.62E+03 No
Methyl chloride 103,000 7.01E-03 1.03E+03 No
Naphthalene 52,000 8.62E-03 5.20E+02 No
Phenol 19,000 8.41E-03 1.90E+02 No
Toluene 75,000 8.20E-02 7.50E+02 No
2,2,4-Trimethylpentane3 1,401,000 8.76E-02 1.40E+04 No
Xylene 434,000 2.22E-01 4.34E+03 No Notes: 1. The TLV-TWA values are from the worst-case concentration threshold among those listed in the "2014 Guide to
Occupational Exposure Values" compiled by the ACGIH. 2. Maximum concentrations are the total of six engine generators based on the maximum hourly emission rates. 3. The listed TLV-TWA for 2,2,4-Trimethylpentane (isooctane; CAS# 540-84-1) is listed under "octane, all isomers."
Table 8-18: Comparison of 1/420 TLV-TWA to Annual Concentrations
Pollutant TLV-TWA1
(μg/m3)
Annual Concentration2
(μg/m3)
1/420 of TVL-TWA (μg/m3)
Exceeds 1/420 of
TLV-TWA?
Bodiesel/Diesel
Acrolein 230 1.09E-04 5.48E-01 No
Lead 50 1.93E-04 1.19E-01 No
Manganese 200 1.09E-02 4.76E-01 No
Mercury 10 1.66E-05 2.38E-02 No
Naphthalene 52,000 1.80E-03 1.24E+02 No
Selenium 200 3.45E-04 4.76E-01 No
Toluene 75,000 3.88E-03 1.79E+02 No
Xylene 434,000 2.67E-03 1.03E+03 No
Natural Gas
Acrolein 230 5.25E-02 5.48E-01 No
Biphenyl 1,300 2.17E-03 3.10E+00 No
Ethylbenzene 87,000 7.12E-04 2.07E+02 No
n-Hexane 176,000 1.13E-02 4.19E+02 No
Methanol 262,000 2.55E-02 6.24E+02 No
Methyl chloride 103,000 2.04E-04 2.45E+02 No
Naphthalene 52,000 2.51E-04 1.24E+02 No
Phenol 19,000 2.45E-04 4.52E+01 No
Toluene 75,000 2.39E-03 1.79E+02 No
2,2,4-Trimethylpentane3 1,401,000 2.55E-03 3.34E+03 No
Xylene 434,000 6.47E-03 1.03E+03 No Notes: 1. The TLV-TWA values are from the worst-case concentration threshold among those listed in the "2014 Guide to
Occupational Exposure Values" compiled by the ACGIH. 2. Maximum concentrations are the total of six engine generators based on the maximum annual emission rates. 3. The listed TLV-TWA for 2,2,4-Trimethylpentane (isooctane; CAS# 540-84-1) is listed under "octane, all isomers."
Carcinogenic HAPs HAR §11-60.1-179(c)(3) defines significant ambient air concentration of any carcinogenic HAP as any ambient air concentration that may result in an excess individual lifetime cancer risk of
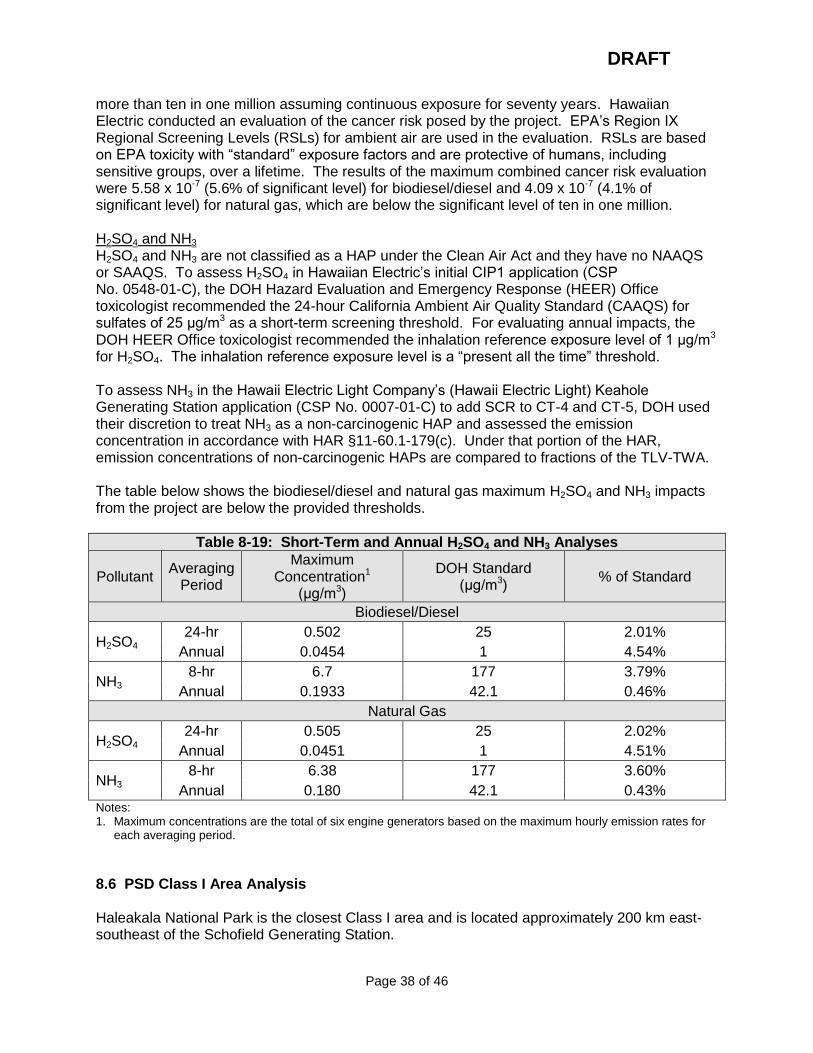
DRAFT
Page 38 of 46
more than ten in one million assuming continuous exposure for seventy years. Hawaiian Electric conducted an evaluation of the cancer risk posed by the project. EPA’s Region IX Regional Screening Levels (RSLs) for ambient air are used in the evaluation. RSLs are based on EPA toxicity with “standard” exposure factors and are protective of humans, including sensitive groups, over a lifetime. The results of the maximum combined cancer risk evaluation were 5.58 x 10⁻⁷ (5.6% of significant level) for biodiesel/diesel and 4.09 x 10⁻⁷ (4.1% of significant level) for natural gas, which are below the significant level of ten in one million. H2SO4 and NH3 H2SO4 and NH3 are not classified as a HAP under the Clean Air Act and they have no NAAQS or SAAQS. To assess H2SO4 in Hawaiian Electric’s initial CIP1 application (CSP No. 0548-01-C), the DOH Hazard Evaluation and Emergency Response (HEER) Office toxicologist recommended the 24-hour California Ambient Air Quality Standard (CAAQS) for sulfates of 25 μg/m3 as a short-term screening threshold. For evaluating annual impacts, the DOH HEER Office toxicologist recommended the inhalation reference exposure level of 1 μg/m3 for H2SO4. The inhalation reference exposure level is a “present all the time” threshold. To assess NH3 in the Hawaii Electric Light Company’s (Hawaii Electric Light) Keahole Generating Station application (CSP No. 0007-01-C) to add SCR to CT-4 and CT-5, DOH used their discretion to treat NH3 as a non-carcinogenic HAP and assessed the emission concentration in accordance with HAR §11-60.1-179(c). Under that portion of the HAR, emission concentrations of non-carcinogenic HAPs are compared to fractions of the TLV-TWA. The table below shows the biodiesel/diesel and natural gas maximum H2SO4 and NH3 impacts from the project are below the provided thresholds.
Table 8-19: Short-Term and Annual H2SO4 and NH3 Analyses
Pollutant Averaging
Period
Maximum Concentration1
(μg/m3)
DOH Standard (μg/m3)
% of Standard
Biodiesel/Diesel
H2SO4 24-hr 0.502 25 2.01%
Annual 0.0454 1 4.54%
NH3 8-hr 6.7 177 3.79%
Annual 0.1933 42.1 0.46%
Natural Gas
H2SO4 24-hr 0.505 25 2.02%
Annual 0.0451 1 4.51%
NH3 8-hr 6.38 177 3.60%
Annual 0.180 42.1 0.43% Notes: 1. Maximum concentrations are the total of six engine generators based on the maximum hourly emission rates for
each averaging period.
8.6 PSD Class I Area Analysis Haleakala National Park is the closest Class I area and is located approximately 200 km east-southeast of the Schofield Generating Station.
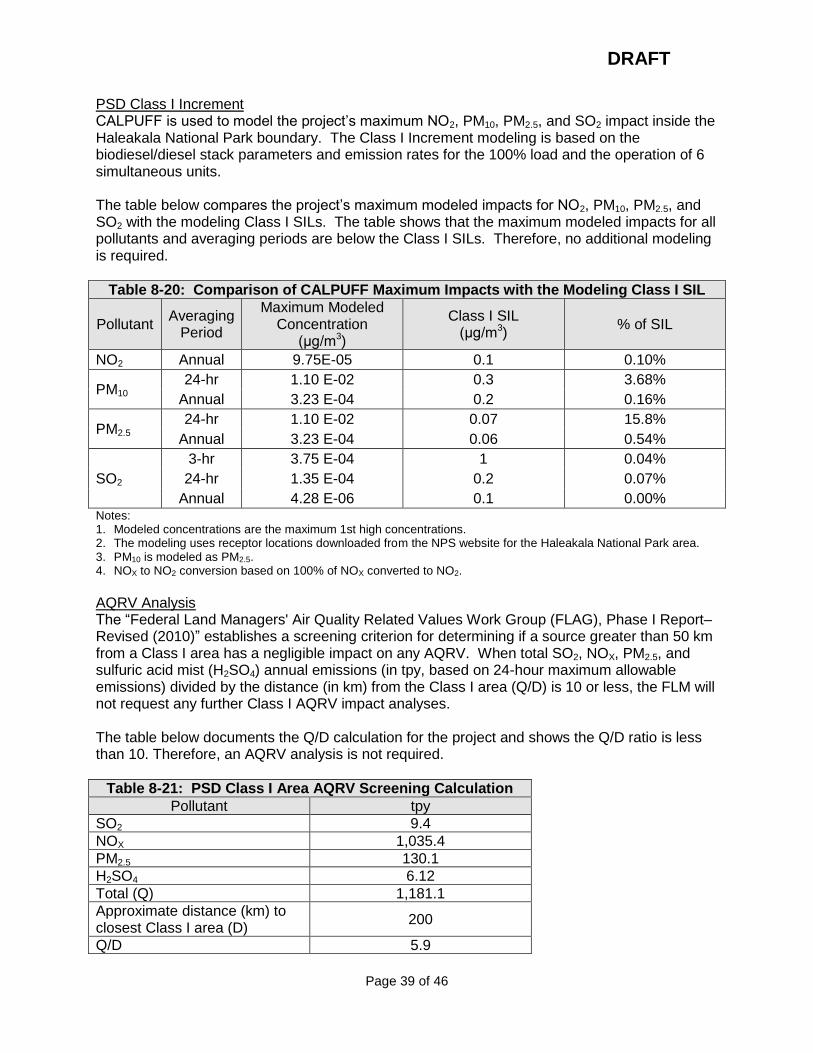
DRAFT
Page 39 of 46
PSD Class I Increment CALPUFF is used to model the project’s maximum NO2, PM10, PM2.5, and SO2 impact inside the Haleakala National Park boundary. The Class I Increment modeling is based on the biodiesel/diesel stack parameters and emission rates for the 100% load and the operation of 6 simultaneous units. The table below compares the project’s maximum modeled impacts for NO2, PM10, PM2.5, and SO2 with the modeling Class I SILs. The table shows that the maximum modeled impacts for all pollutants and averaging periods are below the Class I SILs. Therefore, no additional modeling is required.
Table 8-20: Comparison of CALPUFF Maximum Impacts with the Modeling Class I SIL
Pollutant Averaging
Period
Maximum Modeled Concentration
(μg/m3)
Class I SIL (μg/m3)
% of SIL
NO2 Annual 9.75E-05 0.1 0.10%
PM10 24-hr 1.10 E-02 0.3 3.68%
Annual 3.23 E-04 0.2 0.16%
PM2.5 24-hr 1.10 E-02 0.07 15.8%
Annual 3.23 E-04 0.06 0.54%
SO2
3-hr 3.75 E-04 1 0.04%
24-hr 1.35 E-04 0.2 0.07%
Annual 4.28 E-06 0.1 0.00% Notes: 1. Modeled concentrations are the maximum 1st high concentrations. 2. The modeling uses receptor locations downloaded from the NPS website for the Haleakala National Park area. 3. PM10 is modeled as PM2.5. 4. NOX to NO2 conversion based on 100% of NOX converted to NO2.
AQRV Analysis The “Federal Land Managers' Air Quality Related Values Work Group (FLAG), Phase I Report–Revised (2010)” establishes a screening criterion for determining if a source greater than 50 km from a Class I area has a negligible impact on any AQRV. When total SO2, NOX, PM2.5, and sulfuric acid mist (H2SO4) annual emissions (in tpy, based on 24-hour maximum allowable emissions) divided by the distance (in km) from the Class I area (Q/D) is 10 or less, the FLM will not request any further Class I AQRV impact analyses. The table below documents the Q/D calculation for the project and shows the Q/D ratio is less than 10. Therefore, an AQRV analysis is not required.
Table 8-21: PSD Class I Area AQRV Screening Calculation
Pollutant tpy
SO2 9.4
NOX 1,035.4
PM2.5 130.1
H2SO4 6.12
Total (Q) 1,181.1
Approximate distance (km) to closest Class I area (D)
200
Q/D 5.9
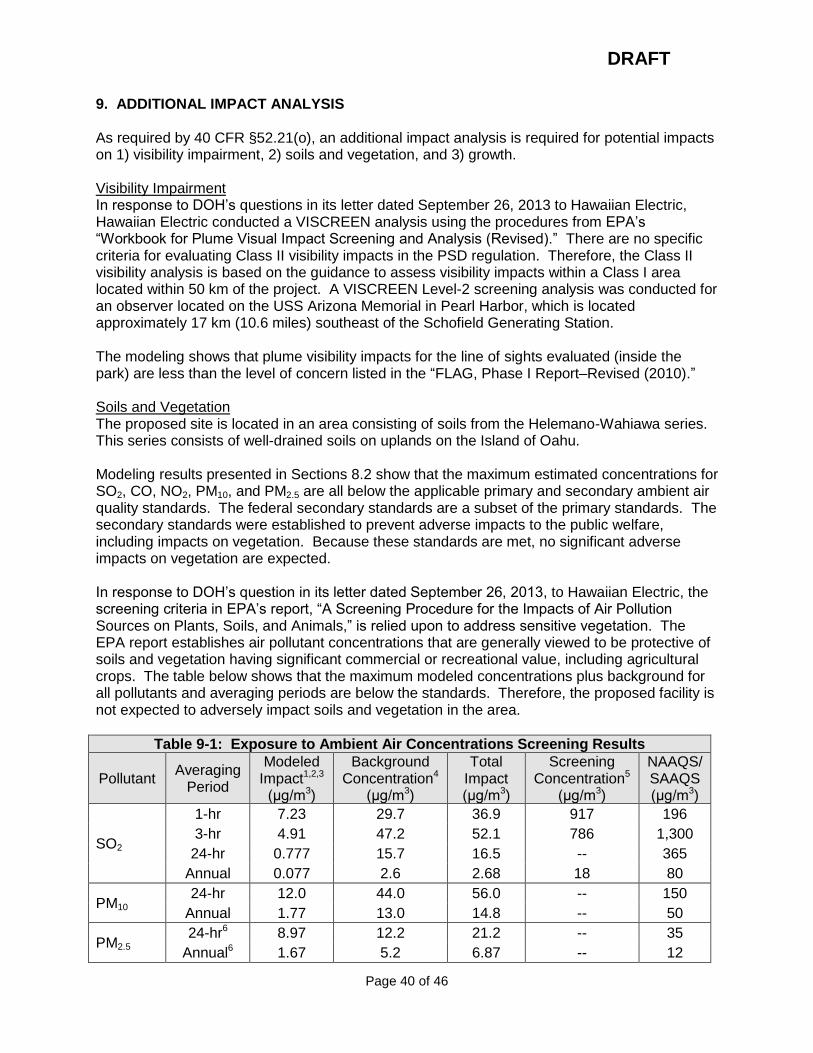
DRAFT
Page 40 of 46
9. ADDITIONAL IMPACT ANALYSIS As required by 40 CFR §52.21(o), an additional impact analysis is required for potential impacts on 1) visibility impairment, 2) soils and vegetation, and 3) growth. Visibility Impairment In response to DOH’s questions in its letter dated September 26, 2013 to Hawaiian Electric, Hawaiian Electric conducted a VISCREEN analysis using the procedures from EPA’s “Workbook for Plume Visual Impact Screening and Analysis (Revised).” There are no specific criteria for evaluating Class II visibility impacts in the PSD regulation. Therefore, the Class II visibility analysis is based on the guidance to assess visibility impacts within a Class I area located within 50 km of the project. A VISCREEN Level-2 screening analysis was conducted for an observer located on the USS Arizona Memorial in Pearl Harbor, which is located approximately 17 km (10.6 miles) southeast of the Schofield Generating Station. The modeling shows that plume visibility impacts for the line of sights evaluated (inside the park) are less than the level of concern listed in the “FLAG, Phase I Report–Revised (2010).” Soils and Vegetation The proposed site is located in an area consisting of soils from the Helemano-Wahiawa series. This series consists of well-drained soils on uplands on the Island of Oahu. Modeling results presented in Sections 8.2 show that the maximum estimated concentrations for SO2, CO, NO2, PM10, and PM2.5 are all below the applicable primary and secondary ambient air quality standards. The federal secondary standards are a subset of the primary standards. The secondary standards were established to prevent adverse impacts to the public welfare, including impacts on vegetation. Because these standards are met, no significant adverse impacts on vegetation are expected. In response to DOH’s question in its letter dated September 26, 2013, to Hawaiian Electric, the screening criteria in EPA’s report, “A Screening Procedure for the Impacts of Air Pollution Sources on Plants, Soils, and Animals,” is relied upon to address sensitive vegetation. The EPA report establishes air pollutant concentrations that are generally viewed to be protective of soils and vegetation having significant commercial or recreational value, including agricultural crops. The table below shows that the maximum modeled concentrations plus background for all pollutants and averaging periods are below the standards. Therefore, the proposed facility is not expected to adversely impact soils and vegetation in the area.
Table 9-1: Exposure to Ambient Air Concentrations Screening Results
Pollutant Averaging
Period
Modeled Impact1,2,3
(μg/m3)
Background Concentration4
(μg/m3)
Total Impact (μg/m3)
Screening Concentration5
(μg/m3)
NAAQS/SAAQS (μg/m3)
SO2
1-hr 7.23 29.7 36.9 917 196
3-hr 4.91 47.2 52.1 786 1,300
24-hr 0.777 15.7 16.5 -- 365
Annual 0.077 2.6 2.68 18 80
PM10 24-hr 12.0 44.0 56.0 -- 150
Annual 1.77 13.0 14.8 -- 50
PM2.5 24-hr6 8.97 12.2 21.2 -- 35
Annual6 1.67 5.2 6.87 -- 12
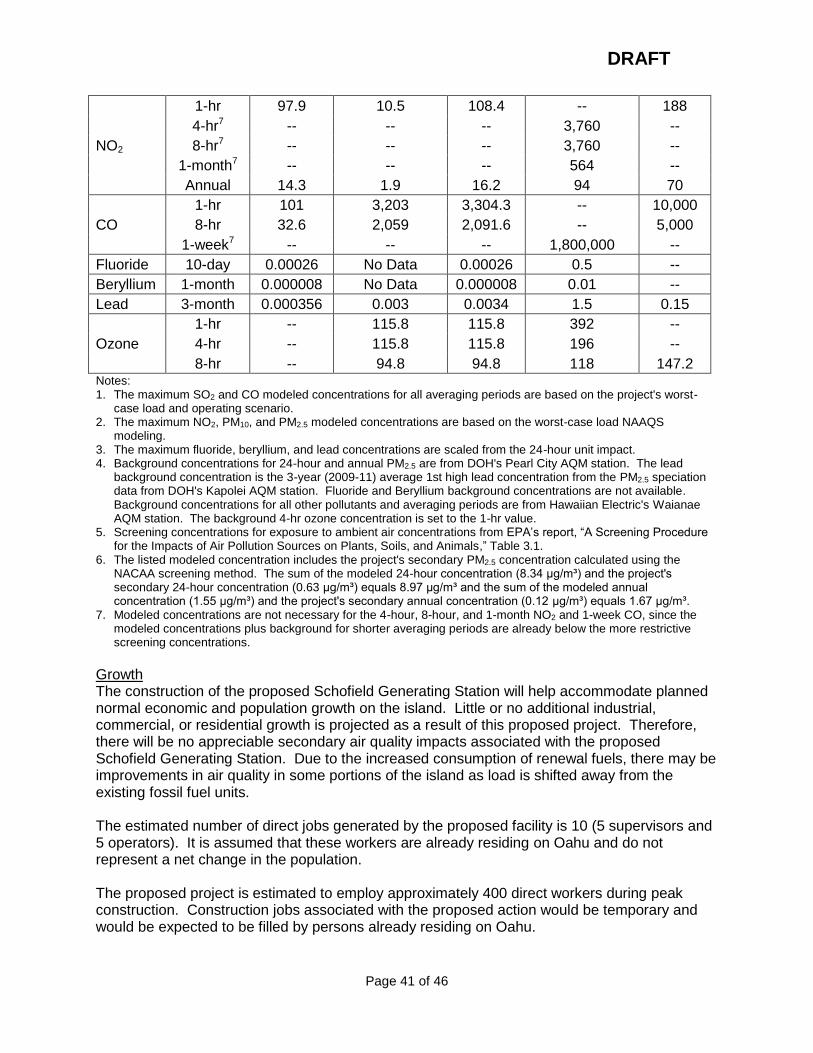
DRAFT
Page 41 of 46
NO2
1-hr 97.9 10.5 108.4 -- 188
4-hr7 -- -- -- 3,760 --
8-hr7 -- -- -- 3,760 --
1-month7 -- -- -- 564 --
Annual 14.3 1.9 16.2 94 70
CO
1-hr 101 3,203 3,304.3 -- 10,000
8-hr 32.6 2,059 2,091.6 -- 5,000
1-week7 -- -- -- 1,800,000 --
Fluoride 10-day 0.00026 No Data 0.00026 0.5 --
Beryllium 1-month 0.000008 No Data 0.000008 0.01 --
Lead 3-month 0.000356 0.003 0.0034 1.5 0.15
Ozone
1-hr -- 115.8 115.8 392 --
4-hr -- 115.8 115.8 196 --
8-hr -- 94.8 94.8 118 147.2 Notes: 1. The maximum SO2 and CO modeled concentrations for all averaging periods are based on the project's worst-
case load and operating scenario. 2. The maximum NO2, PM10, and PM2.5 modeled concentrations are based on the worst-case load NAAQS
modeling. 3. The maximum fluoride, beryllium, and lead concentrations are scaled from the 24-hour unit impact. 4. Background concentrations for 24-hour and annual PM2.5 are from DOH's Pearl City AQM station. The lead
background concentration is the 3-year (2009-11) average 1st high lead concentration from the PM2.5 speciation data from DOH's Kapolei AQM station. Fluoride and Beryllium background concentrations are not available. Background concentrations for all other pollutants and averaging periods are from Hawaiian Electric's Waianae AQM station. The background 4-hr ozone concentration is set to the 1-hr value.
5. Screening concentrations for exposure to ambient air concentrations from EPA’s report, “A Screening Procedure for the Impacts of Air Pollution Sources on Plants, Soils, and Animals,” Table 3.1.
6. The listed modeled concentration includes the project's secondary PM2.5 concentration calculated using the NACAA screening method. The sum of the modeled 24-hour concentration (8.34 μg/m³) and the project's secondary 24-hour concentration (0.63 μg/m³) equals 8.97 μg/m³ and the sum of the modeled annual concentration (1.55 μg/m³) and the project's secondary annual concentration (0.12 μg/m³) equals 1.67 μg/m³.
7. Modeled concentrations are not necessary for the 4-hour, 8-hour, and 1-month NO2 and 1-week CO, since the modeled concentrations plus background for shorter averaging periods are already below the more restrictive screening concentrations.
Growth The construction of the proposed Schofield Generating Station will help accommodate planned normal economic and population growth on the island. Little or no additional industrial, commercial, or residential growth is projected as a result of this proposed project. Therefore, there will be no appreciable secondary air quality impacts associated with the proposed Schofield Generating Station. Due to the increased consumption of renewal fuels, there may be improvements in air quality in some portions of the island as load is shifted away from the existing fossil fuel units. The estimated number of direct jobs generated by the proposed facility is 10 (5 supervisors and 5 operators). It is assumed that these workers are already residing on Oahu and do not represent a net change in the population. The proposed project is estimated to employ approximately 400 direct workers during peak construction. Construction jobs associated with the proposed action would be temporary and would be expected to be filled by persons already residing on Oahu.

DRAFT
Page 42 of 46
Total annual employment (direct, indirect, and induced) created during the construction is estimated to be approximately 775 jobs per year. The increase in employment and labor income would be small relative to the size of Honolulu County’s economy and workforce. Total annual employment for the county in 2013 was approximately 436,500. The estimated construction-generated total employment of 775 would be less than one percent of this total. The county’s total labor income was approximately $46.7 billion, and construction generated income of approximately $55 million would be 0.1 percent of this total. 10. ADDITIONAL REQUIREMENTS Endangered Species Act Letters regarding the proposed project’s potential impacts to endangered species or critical habitats were sent to the United States Department of Interior, Fish and Wildlife Service (FWS). In a letter dated August 23, 2013, the FWS indicated the federally endangered Hawaiian hoary bat may forage or roost in the area. The FWS provided recommendations to assist Hawaiian Electric in avoiding or minimizing impacts to the Hawaiian hoary bat in the project area. In a letter dated June 19, 2014, the FWS provided a list of species that may occur in two critical habitats that may be exposed to the project emissions and has determined that they do not believe the proposed project will cause adverse impacts on the listed species and their habitats if the project meets the NAAQS and SAAQS. Coastal Zone Management Act Based on the October 22, 2014, letter from the United States Army Garrison, Hawaii (USAG-HI) Director of Public Works to the Planning Program Manager, Coastal Zone Management Program, Office of Planning, the USAG-HI has concluded that the proposed Schofield Generating Station will be consistent with all enforceable policies of the Hawaii Coastal Zone Management Program. National Historic Preservation Act Based on the October 9, 2014, letter from the Office of the Garrison Commander, United States Army Garrison – Hawaii (USAG-HI) to the State Historic Preservation Officer, the Commander has requested to open consultation with the State Historic Preservation Division (SHPD). As reflected in the October 9, 2014, letter, the Area of Potential Effect (APE) for the proposed undertaking includes the National Register District at Schofield Barracks, the National Historic Landmark District at Wheeler Army Airfield (WAAF), and the National Register eligible district at WAAF. If there are any adverse effects to the historic properties within the APE, the USAG-HI will coordinate with the SHPD to avoid, minimize, or mitigate such effects. Magnuson-Stevens Fishery Conservation and Management Act A letter regarding the proposed project’s potential impacts to essential fish habitats was sent to the National Marine Fisheries Service, Pacific Islands Regional Office. Although the operation of the proposed Schofield Generating Station is not expected to have any adverse impacts to any essential fish habitats, further analysis will be conducted if deemed necessary by the National Marine Fisheries Service. Environmental Justice (EJ) The EPA defines EJ to include the fair treatment and meaningful involvement of all people regardless of race, color, national origin, or income in environmental decisions that affect them. As part of the Environmental Impact Statement (EIS) process for this project, public outreach to foster public participation, including low-income and minority populations, was completed through direct mailings, publication of notifications in the Honolulu Star-Advertiser, and a media
DRAFT
Page 43 of 46
release. The mailing list for recipients of information about the proposed project, how to participate and comment, and when and where the public scooping meetings would be, included native Hawaiian organizations (e.g., Native Hawaiian Advisory Council, Association of Hawaiians for Homestead Lands), neighborhood boards, community associations, civic clubs, libraries, schools, and local governments. No EJ concerns have been raised by these groups, and Hawaiian Electric’s assessment is that the proposed project is not an action with the potential to substantially affect human health or the environment by excluding persons, denying persons benefits, or subjecting persons to discrimination or disproportionately high environmental health or safety risks. 11. SIGNIFICANT PERMIT CONDITIONS 1. Fuel Limits
a. The engine generators shall be fired only on the following fuels:
i. Diesel no. 2, biodiesel (B99 or B100), and blends of diesel no. 2 and biodiesel (B99 or B100), with a maximum sulfur content not to exceed 0.0042% by weight (42 ppm);
ii. Natural gas with a maximum sulfur content not to exceed 1.75 grains per 100 SCF; iii. Alternate fuels in accordance with Attachment II, Special Condition No. C.8; and iv. Fuel additives in accordance with Attachment II, Special Condition No. C.8.
Reason: The fuel sulfur content limits were proposed by the applicant and are used in the air quality assessment.
b. Each engine generator shall be fired with an annual average of two (2) percent or more
liquid fuel (diesel no. 2, biodiesel) of total fuel on an energy equivalent basis to comply with the definition of a compression ignition engine as defined in 40 CFR Part 60, Subpart IIII.
Reason: To comply with the definition of a compression ignition engine as defined in Subpart IIII.
2. Startup and Low Load Events
a. Each startup period for each engine generator shall not exceed thirty (30) minutes. b. Upon completion of a thirty (30) minute startup period, the engine generator shall be at
thirty (30) percent or more of peak load when fired on diesel no. 2/biodiesel or forty (40) percent or more of peak load when fired on natural gas, and the air pollution control equipment shall be operational.
c. The total combined operating hours during startups and low load events for the engine generators shall not exceed 4,380 hours in any rolling twelve-month (12-month) period.
d. Startup shall be defined as the period starting from the time fuel use at an engine generator begins and ending thirty (30) minutes later.
e. Excluding startup, shutdown, and maintenance and testing, a low load event shall be defined as operation of an engine generator less than thirty (30) percent of peak load when fired on diesel no. 2/biodiesel and less than forty (40) percent of peak load when fired on natural gas.
DRAFT
Page 44 of 46
Reason: The startup limits are required to limit NOX emissions during startup when the SCR system is not fully functional. The air quality assessment is based on the startup limits and 30 percent and 40 percent of peak load requirements to demonstrate compliance with the ambient air quality standards at low loads. Unit shutdowns occur very quickly and emissions greater than normal levels during shutdowns are not expected. Therefore, shutdown conditions are not included in the permit.
Records must be maintained to demonstrate compliance with the startup and low load event conditions. The permittee must operate and maintain a continuous monitoring system to measure and record the operating load.
3. Air Pollution Control Equipment
The permittee shall install, continuously operate, and maintain a selective catalytic reduction (SCR) system with urea injection and oxidation catalyst on each engine generator to meet the emission limits as specified in Attachment II, Special Condition No. C.4.a. The selective catalytic reduction system shall be fully functional and in operation whenever the engine generators are in operation, excluding startup and shutdown periods.
Reason: The air pollution control equipment required to be installed and operated are based on the BACT analysis.
4. Emission Limits
a. The permittee shall not discharge or cause the discharge of nitrogen oxides (NOX) as nitrogen dioxide (NO2), filterable particulate matter (PM), particulate matter 10 micrometers and 2.5 micrometers in diameter and smaller (PM10/PM2.5), volatile organic compounds (VOC) as methane (CH4), and ammonia (NH3) into the atmosphere from each engine generator in excess of the following limits. These emission limits shall apply at all times with the exception of NOX emission limits during startup as specified in Attachment II, Special Condition No. C.4.b:
Pollutant
Maximum Emission Limit (3-hour Average)
Diesel No. 2/Biodiesel Natural Gas
(lb/hr) (ppmvd @ 15% O2) (lb/hr) (ppmvd @ 15% O2)
NOX (as NO2) 24.4 90.9 1.67 13.4
PM (filterable) 2.75 0.0448* 1.21 0.0292*
PM10/PM2.5 4.95 0.0885* 2.42 0.0582*
VOC (as CH4) 4.77 98.0 3.56 94.1
NH3 0.991 10 0.925 10 * Units are grains per dry standard cubic feet corrected to twelve (12) percent CO2.
Reason: The emission limits are based on the BACT analysis for NOX, PM, PM10, PM2.5, and VOC. The design of the SCR system will limit ammonia slip. The permittee must demonstrate compliance with these limits by conducting initial and annual performance tests with the exception of the NOX limits. The permittee must install, operate, and maintain a continuous emission monitoring system (CEMS) for NOX. Records must be maintained on the amount of ammonia slip from the operation of the SCR system on a monthly basis.
DRAFT
Page 45 of 46
b. For NOX only, during periods of startup, the permittee shall not discharge or cause the discharge of emissions into the atmosphere from each engine generator in excess of the following limits:
Pollutant Fuel Maximum Emission Limit
1-hour Average (lb/hr)
Per Startup Event (lb)
NOX (as NO2) Diesel No. 2/Biodiesel 114.4 102.2
Natural Gas 8.9 8.1
Reason: The emission limits are based on the BACT analysis for NOX during startup. The permittee must install, operate, and maintain a CEMS for NOX during startup.
c. The permittee shall not discharge or cause the discharge of carbon dioxide (CO2) into
the atmosphere from the engine generators in excess of the following total combined rolling twelve-month (12-month) limit:
Pollutant Maximum Emission Limit
(lb/MWhe, gross)
CO2 1,700
Reason: The emission limit is based on the BACT analysis for GHG. The permittee must calculate on a monthly basis the amount of CO2 emitted from the engine generators.
d. The permittee shall not discharge or cause the discharge of NOX and filterable PM into
the atmosphere from each engine generator in excess of the following limits. These emission limits shall apply at all times, except during startup, shutdown, and malfunction.
Pollutant Maximum Emission Limit
NOX (as NO2) 1.8 g/HP-hr (2.4 g/KWm-hr)*
PM (filterable) 0.11 g/HP-hr (0.15 g/KWm-hr) * Listed rate is based on 720 RPM (6.7n
-0.20 g/HP-hr (9.0n
-0.20 g/KW-hr) where n is the maximum
engine speed.
Reason: The emission limits are based on the emission standards of Subpart IIII. The engine generators are subject to the emissions standards of Subpart IIII for engines greater than or equal to 30 liters per cylinder and installed on or after January 1, 2016. The permittee must demonstrate compliance with these standards by conducting initial and annual performance tests and establishing operating parameters to be monitored continuously.
5. Visible Emissions
For any six (6) minute averaging period, the engine generators shall not exhibit visible emissions of twenty (20) percent opacity or greater, except as follows: during start-up, shutdown, or equipment breakdown, the engine generators may exhibit visible emissions not greater than sixty (60) percent opacity for a period aggregating not more than six (6) minutes in any sixty (60) minute period.
DRAFT
Page 46 of 46
Reason: The opacity limits are based on the visible emission standards of HAR, §11-60.1-32. The permittee must install, operate, and maintain a continuous opacity monitoring system (COMS) to demonstrate compliance with these standards. COMS are generally required for all covered sources subject to PSD review.
6. Stack Height
The exhaust stacks for the engine generators shall be at a minimum height of ninety-five (95) feet above ground elevation.
Reason: The applicant originally proposed a stack height of 75 feet to be used in the air quality assessment. The proposed stack height was increased from 75 feet to 95 feet in the applicant’s updated PSD/CSP application dated January 21, 2015.
7. Post-Construction Ambient Air Quality Monitoring
a. The permittee shall install, operate, and maintain an ambient air quality monitoring station for CO, NO2, PM10, PM2.5, and SO2.
b. The permittee shall install, operate, and maintain a meteorological monitoring station to monitor and record data.
Reason: Post-construction monitoring is generally required for all covered sources subject to PSD review.
12. CONCLUSION Based on the information submitted by Hawaiian Electric, it is the determination of the Department of Health that the proposed project will be in compliance all applicable Federal and State requirements, including PSD requirements and HAR Chapter 11-60.1. A BACT analysis was conducted and the air quality assessment demonstrates that the proposed project will not cause or contribute to a violation of the applicable NAAQS/SAAQS or PSD increments. Recommend issuance of the covered source permit subject to the incorporation of the significant permit conditions, 30-day public comment period, and 45-day EPA review period. Mark Saewong March 17, 2016