Embed Size (px)
Citation preview
Högskolan i Halmstad School of Business and Engineering Marknadsföringsprogrammet
BACHELOR DISSERTATION
Drinking coffee for a better world
Writers Martina Börjesson 850101-3547 Emma Renström 880228-7527
Supervisor
Timurs Umans
Examiner Jean-Charles Languilaire
Abstract
In the beginning of the twenty-first century it became clear what consequences companies’
pursuit of economical growth had created on our environment and our social lives. Now the
world is standing in front of a challenge and that is to find a sustainable way to produce,
consume and live in order to help our environment and social lives. An example of an
organization that is working towards a sustainable way of living is Fair trade Labeling
Organizations International. They set up international fair trade standards in order to support
the sustainable development of small producers in poor countries, such as ensuring that the
producers receive prices that cover their costs.
Research results indicate that the fair trade label could lower the value of the brand that it is
attached to, as well as decrease the original brand’s customer loyalty. While there is also the
belief that fair trade is a positive thing for a brand. Therefore our aim with this dissertation is
to look at how the consumer behavior changes when the product is co branded with the fair
trade label. We will therefore look at how co branding with the fair trade label affect different
aspects of consumer behavior. The different aspects that we have used are need recognition,
information search, evaluation of alternatives, post purchase behavior and perceived brand
personality.
The study is performed on Dutch consumers by doing a quantitative research. The study
showed that there are four variables that affect consumer behavior when co branding with fair
trade these are price sensitivity, reason for buying, expected quality and perceived brand
personality.
This study contributes to the lack of research concerning the connection between co branding
with fair trade and consumer behavior. The conclusions drawn from this study could be used
as guidelines for company managers that are thinking of adding a fair trade label to the
product, but it could also be used as guidelines for managers that already use fair trade.
Keywords: Fair trade, consumer behavior and co branding

Tableofcontent
1 Introduction.........................................................................................................................1
1.1 Background ..................................................................................................................1
1.2 Problem........................................................................................................................3
1.3 Purpose.........................................................................................................................4
1.4 Research question.........................................................................................................4
1.5 Theoretical limitations ..................................................................................................4
1.6 Outline .........................................................................................................................4
2 Research Method.................................................................................................................5
2.1 Introduction..................................................................................................................5
2.2 Research Philosophy.....................................................................................................5
2.3 Research approach........................................................................................................6
2.4 Choice of Theory..........................................................................................................8
2.5 Choice of Methodology ................................................................................................8
3 Literature Review..............................................................................................................10
3.1 Branding.....................................................................................................................10
3.1.1 Co branding .........................................................................................................11
3.2 Fair Trade............................................................... Fel! Bokmärket är inte definierat.
3.2.1 The emergence of the fair trade movement....... Fel! Bokmärket är inte definierat.
3.2.2 The Principles of fair trade............................... Fel! Bokmärket är inte definierat.
3.2.3 The fair trade mark .......................................... Fel! Bokmärket är inte definierat.
3.2.4 Netherland and fair trade.................................. Fel! Bokmärket är inte definierat.
3.2.5 Fair trade and marketing .................................. Fel! Bokmärket är inte definierat.
3.3 Consumer behavior.....................................................................................................13
3.3.1 Psychological factors ...........................................................................................14
3.3.2 What affects the consumers behavior ...................................................................15
3.3.3 The buying process ..............................................................................................16
3.3.3.1 Need recognition...........................................................................................17
3.3.3.2 Information search ........................................................................................17
3.3.3.3 Evaluation of alternatives ..............................................................................18
3.3.3.4 Purchase decision..........................................................................................19
3.3.3.5 Post purchase behavior..................................................................................20
3.4 Co branding and Consumer behavior ..........................................................................20
3.4.1 Fair trade and consumer behavior.........................................................................21
3.4.2 Brand perception and consumer behavior.............................................................21
3.4.3 Brand personality and consumer behavior............................................................22
3.4.4 Brand association and consumer behavior............................................................24
3.5 Conclusions of Literature review ................................................................................25
3.5.1 Need recognition..................................................................................................25
3.5.2 Information search ...............................................................................................26
3.5.3 Evaluation of alternatives.....................................................................................26
3.5.4 Post purchase behavior.........................................................................................27
3.5.5 Brand personality.................................................................................................27
4 Empirical method ..............................................................................................................28
4.1 Research design and strategy ......................................................................................31
4.2 Time Horizon .............................................................................................................32
4.3 Data collection............................................................................................................33
4.4 Sample selection.........................................................................................................34
4.5 Questionnaire operationalization.................................................................................35
4.5.1 Dependent variables.............................................................................................35
4.5.1.1 Co branding ..................................................................................................36
4.5.2 Independent variables ..........................................................................................36
4.5.2.1 The reason for buying ...................................................................................36
4.5.2.2 Source of information....................................................................................37
4.5.2.3 Price..............................................................................................................38
4.5.2.4 Purchase frequency .......................................................................................38
4.5.2.5 Expected quality............................................................................................38
4.5.2.6 Brand personality ..........................................................................................39
4.6 Reliability...................................................................................................................39
4.7 Validity ......................................................................................................................40
4.8 Generalisability ..........................................................................................................41
5 Empirical findings.............................................................................................................42
5.1 Introduction................................................................................................................42
5.2 Descriptive statistics ...................................................................................................42
5.3 Dependent variable.....................................................................................................44
5.4 Independent variables .................................................................................................44
5.5 H1 difference in reason for buying..............................................................................45
5.5.1 Discussion and analysis of Hypothesis 1 ..............................................................46
5.6 H2 difference in source of information........................................................................48
5.6.1 Discussion and analysis of Hypothesis 2 ..............................................................48
5.7 H3 difference in purchase frequency...........................................................................49
5.7.1 Discussion and analysis of Hypothesis 3 ..............................................................50
5. 8 H4 difference in price ................................................................................................50
5.8.1 Discussion and analysis of Hypothesis 4 ..............................................................51
5.9 H5 difference in expected quality................................................................................52
5.9.1 Expected quality, product without fair trade logo .................................................52
5.9.2 Expected quality, product with fair trade logo ......................................................53
5.9.3 Discussion and analysis of Hypothesis 5 ..............................................................53
5.10 H6 difference in brand personality ............................................................................54
5.10.1 Brand personality, product without fair trade logo..............................................55
5.10.2 Brand personality, product with fair trade logo...................................................55
5.10.3 Discussion and analysis of Hypothesis 5 ............................................................56
5.11 Summary of empirical findings.................................................................................57
6 Conclusion ........................................................................................................................59
6.1 Discussion and conclusions of findings.......................................................................59
6.2 Practical limitations ....................................................................................................61
6.3 Criticism.....................................................................................................................61
6.4 Future research ...........................................................................................................62
Bibliography ........................................................................................................................63
Appendices
Appendix 1: Questionnaire 69
Appendix 2: Tables 76
List of Tables
Table 1: Summary descriptive statistics 44
Table 2: Kruskal Wallis Test, Reason for buying 47 Table 3: Kruskal Wallis test, expected quality significance, without fair trade 53
Table 4: Kruskal Wallis test, expected quality significance, with fair trade 54
Table 5: Kruskal Wallis test, differs in personality, without fair trade 56
Table 6: Kruskal Wallis test, differs in personality, with fair trade 57
Table 7: Summary hypotheses 58
Table 8: Descriptive statistics of our respondents 76
Table 9: Gender 76
Table 10: Age structure of our respondents 76
Table 11: Native language of our respondents 77
Table 12: Level of education of our respondents 77
Table 13: Number of respondents drinking coffee 78
Table 14: Knowledge of fair trade logo 78
Table 15: Number of respondents who bought fair trade 78
Table 16: Consciously or unconsciously fair trade purchase 79
Table 17: Number of respondents confused by fair trade 79
Table 18: Number respondents aware of what fair trade stands for 79
Table 19: purchase decision and fair trade awareness 80
Table 20: Purchase decision from our respondents 81
Table 21: Hypothesis 1, Kruskal Wallis test, reason for buying coffee 81
Table 22: Hypothesis 2, Chi square test, Information source 82
Table 23: Hypothesis 3, Kruskal Wallis test, purchase frequency 88
Table 24: Hypothesis 4, frequency test, price 89
Table 25: Hypothesis 5, Chi square test, expected quality, without fair trade 90
Table 26: Hypothesis 5, Chi square test, expected quality, with fair trade 90
Table 27: Hypothesis 6, Kruskal Wallis test, difference in personality, with fair trade 91
Table 28: Hypothesis 6, Kruskal Wallis test, difference in personality, without fair trade 91
Table 29: Normal distribution test 92
List of Figures
Figure 1: Deductive approach 7
Figure 2: Inductive approach 7
Figure 3: Fair trade logo 30
Figure 4: Categories that affect consumer behavior 18
Figure 5: The consumer buying behavior process 20
Figure 6: Brand personality dimensions 27
Figure 7: Brand image and brand associations 28 Figure 8: Affects in consumer behavior model 61
1
1Introduction
In this chapter the reader will first be introduced to the background of this dissertation. The
problem, purpose and research question will be presented. Theoretical limitations will also be
presented and an outline will explain the following chapters of this dissertation.
1.1BackgroundDuring the twentieth century we witnessed the population pass beyond 6 billion. In order to
satisfy the great need that had been developed through the increased population the mass
market was born as well as the mass production, which of course led to a very fierce
competition. To be able to tackle the competition companies believed that economic growth
was the correct strategy to use to be able to expand as a company. It was in the beginning of
the twenty-first century that it became clear which consequences the pursuit of economical
growth had created on our environment and our social lives. Now the world is standing in
front of a challenge and that is to find a sustainable way to produce, consume and live in order
to help our environment and social lives (Baker & Hart, 2003).
An example of an organization that is working towards a sustainable way of living is Fair
trade Labeling Organizations International. They set up international fair trade standards in
order to support the sustainable development of small producers in poor countries, such as
ensuring that the producers receive prices that cover their costs. They also help the producers
with fair trade certificates and market opportunities (Fair trade Labeling Organization
International, 2010).
Examples of fair trade products are sugar, coffee, wine, bananas, tea, honey and flowers (Fair
trade Labeling Organization International, 2010). Coffee is one of the most important
products within fair trade food (De Ferran & Grunert, 2007). It is also the second most
exported product after petroleum, and the specialty coffee industry is according to analysts
still in the early rapid growth stage of the product life cycle (Levi & Linton, 2003). All of the
reasons mentioned above contribute to making fair trade coffee an up to date and interesting
product to discuss.
When adding the fair trade label to your original brand a form of co branding occurs. The
concept co branding is defined by Aaker and Joachimsthaler, (2000) as a combination of two
brands from different organizations to create an offering where each plays a driver role.
2
Whether or not the fair trade label is a brand has been discussed among a lot of researchers,
Paton, (2006) considers that the fair trade label is the archetypal brand of this new economy.
The reason for this is that, it expresses values, makes a statement and offers consistency,
which makes people trust it. In this dissertation we will therefore define the cooperation
between the fair trade label and the original brand as co branding.
According to Semenik, (2007) consumer behavior is when a person takes action in purchasing
and using products and services, including the mental and social process that appears in these
actions. The buying process can describe the consumers’ behavior. Kotler (2008) describes
the buying process with the steps need recognition, information search, evaluating
alternatives, purchase decision and post purchase behavior. In a marketing perspective, the
customers in today’s society is more concerned about moral values and the fact that
companies live up to these values and they are also more willing to buy fair trade products
(De Ferran & Grunert, 2007). Customers also care more about the information about the
products background which leads to increased ethical consumption (Alexander & Nicholls,
2006). Therefore consumer behavior is a very interesting prospective when looking at co
branded products with fair trade.
Levi and Linton, (2003, p. 419) once said “While fair traders do offer a tangible market
product, what they are essentially trying to sell is the norm that people in prosperous countries
should factor global justice into their buying decisions”. To sum it all up the fair trade
movement is a good example of making economic concepts such as market, competitiveness
and trade include concepts such as fairness, solidarity and justice (Bezencon & Blili, 2009).
Not everyone feels that the fair trade label is all that rosy, Davenport and Low, (2005) says
that the fair trade label is mostly just an additional marketing tool, and that people buy a
special product because they like the product and not because of the fair trade label.
According to Davenport and Low, (2005) the coffee company Cafédirect is getting less
customer loyalty when they communicate the fair trade label. Instead Cafédirect first convince
their customers about the good quality of their product and after they have a loyal customer
base they can start to focus on marketing the fact that they are using fair trade. The reason for
this is that they feel that the fair trade label is too complicated for their customers. With this in
mind the dissertation will look at consumer behavior when adding the fair trade label to the
original brand.

3
1.2Problem
There are researchers in today’s society that do not believe in the good effects that the fair
trade label creates. Maseland and De Vaal, (2002) are two researchers that believe there is no
proof when looking beyond the income transfer effect, that the fair trade label contributes to
giving producers in the Third World a higher price for their products and that it will help the
development. They also say that when looking at it in a wider context it could be imagined
that the fair trade label would have the opposite effect for the Third World’s producers. When
talking about the fair trade label in this perspective it could be devastating for a brand to be
associated with the fair trade label, at least when looking at the concept called co branding. As
mentioned earlier co branding stands for the powerful way of introducing a company’s
products and services to the loyalists of another but co branding is far from safe (McKee,
2009). One reason for that is the fact that the positive effect is being spread out on two brands
instead of one, which means that if the experience is not positive for one company it will
automatically affect the other. Another reason for co branding being risky is the fact that the
brand is relying on someone else, which could make it look weak in the consumers’ eyes.
As Davenport and Low, (2005) mentioned earlier, research indicate that the fair trade label
could lower the value of the brand that it is attached to, as well as decrease the original
brand’s customer loyalty. But there is also the belief that fair trade is a positive thing for a
brand. According to Fair trade Labeling Organizations International, (2007) the department
store Marks & Spencer converted all their tea and coffee assortment into fair trade. By doing
this Marks & Spencer increased their sales growth by 6% against market growth of 1.5%.
Also according to Jason Danciger from the Slug and Lettuce pub chain the conversion to fair
trade coffee has created a positive response from their customers, which has led to an
invaluable brand loyalty (ibid).
These findings contradict each other, the opinions whether the fair trade label is good or bad
for the brand are divided into two. Also according to Kim, Lee and Lee, (2007) there has been
an increased attention concerning co branding, but still the relationship between co branding
and consumer satisfaction and brand loyalty remains largely unexplored. The buying process
model by Kotler (2008) is a model that describes the whole process of a purchase. By using
this model we will get a broader prospective and understanding of consumer behavior. This
will allow the dissertation to investigate this matter further, which now leads to the purpose of
this dissertation.
4
1.3PurposeThe purpose of this dissertation is to explain how co branding with the fair trade label affects
consumer behavior. As mentioned earlier research in this field is divided into two different
sides, some researchers believe that the fair trade label increases customer loyalty for the
brand when adding the fair trade label while others believe that it decreases brand loyalty. We
will therefore look at how co branding with the fair trade label affect different aspects of
consumer behavior.
1.4Researchquestion
The study aims to explain how co branding with the fair trade label will affect consumer
behavior. Thus, the research question is:
How does co branding with the fair trade label affect consumer behavior?
1.5Theoreticallimitations
The theories used in this dissertation are limited to a few well-known and established theories
concerning consumer behavior. The model that our research will be built on is mostly the
consumer buying process model by Kotler. We will not look at theories that are not in any
way connected to Kotler’s model except for theory concerning brand personality.
The research in this study is limited to investigate the difference within consumer behavior
when adding a fair trade logo to a product. So we will not look at how co branding affects the
brand. Nor will we look at co branding with any other brands than fair trade.
1.6Outline
This dissertation consists of six chapters. Chapter number one will introduce the reader to the
background of the subject for our dissertation, the research question and purpose will also be
presented. This is followed by chapter two that includes research philosophy, research
approach, choice of theory and choice of methodology. In chapter three the literature review
is presented and it is summarized in our hypotheses. Chapter four represents the empirical
method that consists of the research design, data collection, operationalization, validity,
generalisability and reliability. In the fifth chapter the results of our research will be analyzed
and discussed. The last chapter, chapter six will present our conclusions of the findings,
practical implications and suggestions for future research.

5
2ResearchMethod
In this chapter the choice of methodology will be presented, the reader will be introduced to
the research philosophy, research approach, choice of theory and choice of methodology.
2.1IntroductionAccording to Altinay and Paraskevas, (2008) the basis of a dissertation lays in the research
philosophy, approach and strategy. The reason why it is important is because everyone has
got their own perception of how knowledge can be created and constructed in order to answer
the research problem. Some people believe that research is remote from the real world and
has to take place in a laboratory performed by a scientist to be called research. However there
is also the other belief that the research should be carried out outside the laboratory, in order
to receive relevant information about the business world. In these two cases there is a big
difference between the research philosophy, approach and strategy. Therefore by choosing
one or the other it will determine the way the knowledge will be constructed and also how the
research will be conducted (ibid). The following paragraphs will explain which research
method we used in this dissertation.
2.2ResearchPhilosophyEasterby-Smith, Thorpe, and Lowe, (2002) identifies three reasons why an understanding of
different philosophies is important to the research methodology. To begin with, it provides a
clear research design and the research design involves what kind of evidence to use, and how
it should be gathered and interpreted. Secondly by having an understanding of many types of
research philosophies the researcher will know which one is good for a particular case and
which one is less suitable. Finally it will also help the researcher to identify or create designs
that the researcher has never done before (ibid).
There are mainly five different philosophies pursuant to Saunders, Lewis and Thornhill,
(2007) positivism, realism, objectivism, interpretivism and pragmatism.
The research philosophy called positivism has got the same approach as a natural scientist.
The positivism believes that only a phenomenon that can be predicted or observed will lead to
trustworthy data (ibid). This philosophy also believes in a value of free perspective, where the
resources and the researcher can not impact the outcome. Positivism is also when the
researcher uses existing theory to develop hypotheses (Saunders et al., 2007). Another
philosophy is realism, the anticipatory idea of this philosophy is that what our senses are

6
showing us as reality is the truth and the reality that is independent from our mind. The third
philosophy view called objectivism is that social phenomena are created from the perceptions
and actions of social actors. Objectivism sees people as acting with rational selfishness rather
than as instinctive actors. The next philosophy called interpretivism believes that the
researchers have to understand the differences between humans. This philosophy is opposite
to the positivism, they do not believe in law-like generalisations, because they think that a lot
of insight in this complex world gets lost by generalizing it. The last philosophy is
pragmatism and when it is used the philosophy is based on the research question. This leads to
using either positivism, interpretivism or a mix of all the different philosophies (ibid).
In Jacobsen, (2002) the reader is enlightened with the fact that it is impossible to have a
common conception or philosophy of the world. It is also difficult to determine which
conception or philosophy that is better than the other. Therefore it is important to let the
reader know our conception of the world, since it will make the reader understand the
dissertation better. In this dissertation a positivistic research philosophy will be used. The
reason for this is that we assume a casual relationship between co branding and consumer
behavior, which is why hypotheses based on theory, will be developed. These hypotheses will
later on be tested and the end result is going to be adapted to other cases or situation, in other
words the result will be generalized (ibid).
2.3ResearchapproachSaunders et al. (2007) state that different research approaches are “better” at doing different
things, which means that one research approach is not better than the other. When choosing an
approach it should be based on the research question. There are two different approaches to
choose between namely the deductive and the inductive approach. Deductive research
approach is closely related to the research philosophy positivism and inductive approach is
related to interpretivism. The difference between these two approaches is that deductive
approach goes from theory to observations/findings (see figure 1 for more detailed
explanation) and inductive approach goes from observations/findings to theory (see figure 2
for more detailed explanation).

7
Figure 1: Deductive approach (borrowed from Creswell, 2003)
In more detail the deductive approach is a scientific research where an already existing theory
is developed. Based on the theory, hypotheses are established and these hypotheses are later
on tested with help from the observations/findings. Deduction is also when the researcher
wishes to explain the relationship between different variables (Saunders et al., 2007).
Figure 2: Inductive approach (borrowed from Creswell, 2003)
The Inductive approach is as mentioned earlier the complete opposite to deductive approach.
This approach starts with observations and findings where data is collected and from this data
new theories are developed (ibid).
In this dissertation a deductive approach will be used, the reason for this is that there is
already research made within the established fields such as fair trade, consumer behavior and
co branding. This approach is also used because we have a positivistic research philosophy.
8
The purpose of this dissertation is to explain how co branding with fair trade affects consumer
behavior. Our purpose is to explain a casual relationship. When looking at a casual
relationship a deductive approach is better to use. Another reason for choosing this approach
is that the research will go from existing theory that built our hypotheses and will later be
applied to the collected data. The deductive approach is also better to use since this research
will categorize the data before it is collected and there will be questions and answering
alternatives in the empirical questionnaire (Jacobsen, 2002).
2.4ChoiceofTheoryThis dissertation aims at finding new approaches to the theory that connects co branding with
fair trade to consumer behavior. Therefore we have three main fields that will be introduced;
co branding, fair trade and consumer behavior. This dissertation will first introduce the theory
of branding and co branding which will end up in theory about the concept called fair trade.
The next theory that will be introduced to the reader is consumer behavior, where a famous
model will be explained called, the buying behavior process by Philip Kotler. The reason for
using Philip Kotler’s buying behavior process model is that it covers the process for the
consumer in a very detailed way, from the actions that happens before the purchase to actions
after the purchase. Finally, the connection between the theory on branding and consumer
behavior will be discussed.
2.5ChoiceofMethodologyAccording to Bryman and Bell, (2007) there are two different research strategies namely,
quantitative research and qualitative research. The differences between them could be viewed
from three different angles such as, principal orientation, epistemological orientation and
ontological orientation. When looking at the principal orientation the quantitative research
approach is using a deductive approach and is testing the theory. Qualitative on the other hand
is using an inductive approach and is therefore emphasizing on the generation of theories.
When looking at the second angle called epistemological orientation, the quantitative
approach is incorporating the natural scientific model and particularly the positivism. While
the qualitative is using the way individuals interpret their social lives. The last angle that
separates the two research strategies is the ontological orientation. The quantitative approach
has got an objective view of the social reality while the qualitative research has the view of a
constantly shifting social reality (ibid).

9
The purpose of this dissertation is to explain how co branding with fair trade affects consumer
behavior. From these findings we will draw conclusions, and generalize the result. The
dissertation will start from the theory and build hypotheses which will later on be tested
through the empirical findings. This is considered to be a positivistic research philosophy and
a deductive research approach. As mentioned earlier a positivistic and deductive approach is
related to the quantitative strategy. Thus, our research strategy will be to use a quantitative
strategy.
10
3LiteratureReview
In this chapter the literature will be presented. The reader will first be introduced to the basics
of branding then to the concept called co branding. Later on the reader will be introduced to
the concept called fair trade, consumer behavior will be discussed and the buying process
model will be introduced. The final topic of the literature review will be the connection
between consumer behavior and branding.
3.1Branding
A brand is a name, term, symbol, sign, design or a combination of all these, that indicate the
producer or the seller of the product or service (Kotler, 2008). According to Semenik (2007)
the reason for using a brand, name, symbol or design is the fact that it identifies the goods or
service of one seller or group of sellers and distinguishes them from the goods and services of
competing brands.
A product/service can be divided into three layers, core product, actual product and
augmented product. The core product is what the customer actually buys. The actual product
is a group of different attributes such as brand name, features, quality level, packaging and
design. The augmented product is what happened after the purchase, such as delivery, credit,
installation, warranty and after sales service. Each of the three levels of a product delivers a
consumer value, and they are therefore important for developing a brand. Customers consider
brand as an important part of the product, it indicates the product/service and might give the
product/service benefits. The reason why the brand is important for the seller is because the
seller can create a story behind the brand which can make customers’ feel attached to the
brand (ibid).
Brand equity is a common marketing term and it is a measure of the brands value to the
customers. It includes the customer’s perception of the brand, the feeling of the
product/service and the performance (Kotler, 2008). There are, according to Schultz and
Schultz, (2004) different views of the concept brand equity. Some people see it from the
companies’ perspective and therefore believe that brand equity consists of the differential
brand attributes that give the company an increased value in their balance sheet. There is also
a definition of the concept through the customers’ point-of-view. This means that the
customers brand knowledge has a differential effect to the response of the marketing of the
11
brand. Brand equity occurs when the consumers are familiar with the brand and has strong
associations.
The place that the product has in the consumers’ minds compared to other available products
in the same market is called brand positioning (Semenik, 2007). Brand positioning gives the
product or service a clear target in the customers’ mind (Kotler, 2008). An example of this is
the store “Body Shop” that works with delivering natural and environmental friendly make-
up. They have created that brand association and established a position which they are
competing in. Positioning should be built on strong benefits and values within the company
(ibid). “Body Shop” was one of the leaders in offering fair trade products to their customers,
which made them, connect the “Body Shop” brand with the fair trade label. Thanks to “Body
Shop”, customers raised their concerns and awareness for fair trade products (Strong, 1997).
With this in mind we will discuss the concept called co branding in the following chapter.
3.1.1Cobranding
To summarize the concept co branding Kim et al. (2007) says that it is a multiple business
cooperation where the two parties work together within marketing and production but still
work for independence as a separate brand. Another definition of co branding is made by
Walchli, (2007). According to her, another term for co branding is brand alliance which
stands for the use of two or more established brands in just one product. Kapferer’s, (2009)
definition of the term co branding is that it is a symbol of an alliance that neither party is
seeking to hide. Finally Aaker and Joachimsthaler, (2000) defines co branding as a
combination of two brands from different organizations to create an offering where each plays
a driver role.
There are different reasons for using co branding as a marketing strategy, and Kapferer,
(2009) is mentioning some of them. The first reason for creating a co branding is when a
company is planning to enter a new market. By doing a co branded product the company
increases the chance for success within the new market. An example is the cooperation
between Danone and Motta that ended up in the co branded yoghurt ice cream. Another
reason for using co branding is when the image is not coherent with the target market. In this
case, the company needs someone else that can communicate and reach the target market. An
example is the soft drink called Orangina. They had an image of only targeting kids and
wanted to target a more mature audience and therefore made a co branding with the radio
12
station NRJ. Co branding is also used when a company wants to develop a product line, which
is often sold in a separate distribution channel. The reason for co branding in this situation is
to nurture certain traits of the brand’s identity kernel. Finally co branding is used to be able to
increase the price for a product. If a company for example wants to go from being an average
food product to a mass-market brand the product needs a credibility link in form of a co
branding partner (ibid).
According to Lamb, Hair and McDaniel, (2008) there are three different types of co branding;
ingredient branding, cooperative branding and complementary branding. Ingredient branding
is exactly what it sounds like the brand is a part/ingredient of the product, and an example is
the microprocessor called Intel that is used by computer producers such as Dell. Cooperative
branding is when the two brands get the same treatment and borrow each other’s brand equity.
The last type called complementary branding is when the brands are advertised together in
order to suggest usage (ibid).
Kim et al. (2007) summarizes the advantages of co branding and they conclude that the ability
to reach a broader customer base and form new relationships is the most beneficial advantage
for both partners. Another advantage is the fact that the credibility from one brand gets
enhanced by borrowing credibility from another brand. Aaker and Joachimsthaler, (2000)
believe that the positive thing about co branding is the fact that through two sources of brand
equity the value proposition and point of differentiation will be enhanced.
Aaker and Joachimsthaler’s, (2000) negative input on co branding is the fact that if one of the
partners feels that the alliance is not profitable and decides to withdraw from the alliance, the
other company risks ending up in a difficult situation. Another risk that they see with co
branding is that if one of the parties loses interest in the alliance it might affect the alliance in
a negative way.
Kapferer, (2009) mentions the concept called “coopetition”, and it means that in order for a
company to be competitive they need to use co branding as a marketing strategy. This concept
is new in today’s society and it means that sometimes companies have to cooperate and
compete against the same company.

13
3.2Consumerbehavior
According to Semenik, (2007) consumer behavior is when a person takes action in purchasing
and using products and services, including the mental and social process that appears in these
actions. Schiffman and Kanuk’s, (2004) definition of consumer behavior is the behavior of the
consumer when searching for, purchasing, using, evaluating and disposing the product or
service that was expected to satisfy the customer’s need.
According to Hoer and Macinnis, (2008) it is important not to just define consumer behavior
as buying a product or service. They believe that it also includes consumers’ use of activities,
experiences and ideas. It could for example be visiting a festival, donating money to UNICEF
or signing up for a yoga class. What Hoyer and Macinnis, (2008) also highlight is the fact that
consumer behavior is a dynamic process where the sequences of acquisition, consumption and
disposition occur over time in a dynamic order. For example, when a family buys a car they
first acquire it then consumes it for a couple of years before they dispose it and acquires a new
car. Another thing that Hoyer and Macinnis, (2008) also highlight is that consumer behavior
can involve more than just one person. An example of this could be when a group of friends
are planning a birthday party for one of their friends (ibid).
When a customer is choosing a product or service they base their choice on four different core
elements, the buyer’s income, the price of the products or service, the taste and preferences of
the customer and finally the belief that the customer acts rationally and behave in the best
possible way for themselves (Woolliams, 2004).
According to Curry and Curry, (2000) consumer behavior is a core component for company
performance. The customer’s behavior is important in three prospects. The first one is the
revenue received from the customer, which means the money earned from one single
customer. Customer share is the second prospect, meaning how much the customer is
spending on your product/service compared to other similar products/services. The last
prospect is customer lifetime (ibid). Customer lifetime is the value of all the purchases a
customer makes over a lifetime of patronage (Kotler, 2008).
The consumers can be divided into three different types of generations, generation Y,
generation X and the boomers. The generation Y is the consumers born between 1985 to 1993
and these types of consumers are very savvy and pragmatic. They are also value oriented
14
which means that they are weighing price against quality when deciding to purchase a
product. Generation X has a materialistic consumer behavior and they are born between 1961
to 1979. They are price oriented which means that they are concerned about the cost of
individual items. The boomers are born between 1946 to1960 in their buying behavior they
are very narcissistic and they have a conspicuous consumption which means that they are
buying for indulgence (Schiffman & Kanuk, 2004).
3.2.1Psychologicalfactors
According to Kotler, (2008) consumer behavior is the process in the human brain that makes
up the buying decision and the model is called the stimulus-response model. The model
describes the process from the stimuli that a customer gets from both the external and internal
market to the final decision. The internal marketing stimuli might come from factors such as
product, price, place and promotion. External stimuli can come from economical,
technological, political or cultural factors (ibid).What actually happens is a psychological
process that is hard to predict. The psychological process is described with four key words,
motivation, perception, learning and memory (Keller & Kotler, 2005).
Motivation is what comes up when the customer defines a need that has to be satisfied. When
a customer is motivated he or she is also ready to act. During the perception process the
customer selects, organizes, and interprets the information to create an overall picture of the
situation. The perception of the same product can differ from time to time because of the
stimuli from the external environment. The learning step explains the consumer’s ability to
learn from experience. Customers’ old experiences will influence how they react to stimuli
today. The last step is the memory. Both the short-term memory and the long-term memory
play important roles since these are the places where all product information is stored, such as
verbal, visual, abstract and contextual information (ibid).
After the consumers get some kind of stimuli the information is going through “the buyer’s
black box”. The buyer’s black box is where the buyer’s characteristics are collected and it is
where the buyer’s decision process takes place. This is a psychological process and what
actually happens in the buyer’s black box is unknown today. Next step is how the buyer
responds to the outcome of the black box. Buyer’s response includes a choice of product,
brand, dealer, purchase timing and purchase amount (ibid).
15
3.2.2Whataffectstheconsumersbehavior
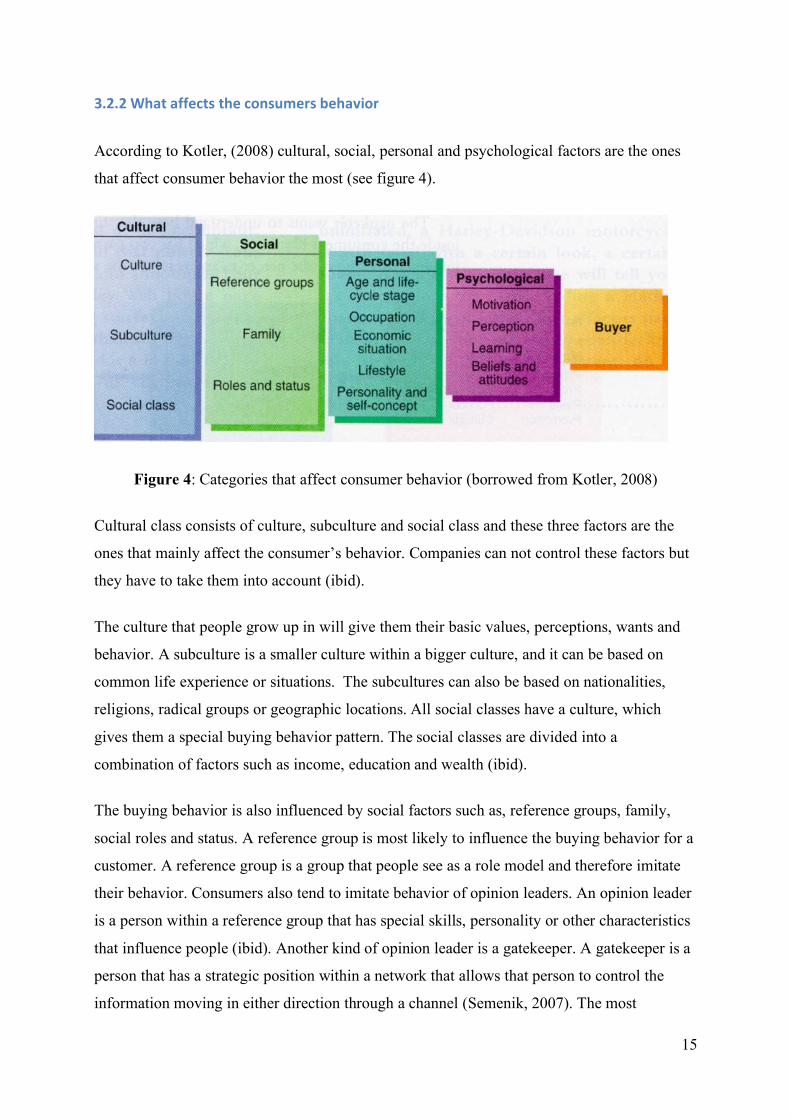
According to Kotler, (2008) cultural, social, personal and psychological factors are the ones
that affect consumer behavior the most (see figure 4).
Figure 4: Categories that affect consumer behavior (borrowed from Kotler, 2008)
Cultural class consists of culture, subculture and social class and these three factors are the
ones that mainly affect the consumer’s behavior. Companies can not control these factors but
they have to take them into account (ibid).
The culture that people grow up in will give them their basic values, perceptions, wants and
behavior. A subculture is a smaller culture within a bigger culture, and it can be based on
common life experience or situations. The subcultures can also be based on nationalities,
religions, radical groups or geographic locations. All social classes have a culture, which
gives them a special buying behavior pattern. The social classes are divided into a
combination of factors such as income, education and wealth (ibid).
The buying behavior is also influenced by social factors such as, reference groups, family,
social roles and status. A reference group is most likely to influence the buying behavior for a
customer. A reference group is a group that people see as a role model and therefore imitate
their behavior. Consumers also tend to imitate behavior of opinion leaders. An opinion leader
is a person within a reference group that has special skills, personality or other characteristics
that influence people (ibid). Another kind of opinion leader is a gatekeeper. A gatekeeper is a
person that has a strategic position within a network that allows that person to control the
information moving in either direction through a channel (Semenik, 2007). The most
16
influencing factor in a buying situation is the family. Most people belong to a variety of
groups that influence them in their buying behavior. People tend to buy products that are
appropriate to their role and status in a group (Kotler, 2008).
Personal factors such as, age, life-cycle stage, occupation, economic situation, lifestyle and
personality have an impact on the buying behavior. Different tastes in clothes, food, furniture
and recreation are often related to age and occupation. Personalities have great influence on
the buying behavior so it is important to combine the product’s personality to the personality
of the user (Kotler, 2008).
And finally the psychological factors that influence the buying behavior are motivation,
perception, learning, beliefs and attitudes. These factors are the most difficult to influence and
reach since the consumer might be unaware of them. Despite that they still have a big
influence on the buying decision (Kotler, 2008).
3.2.3Thebuyingprocess
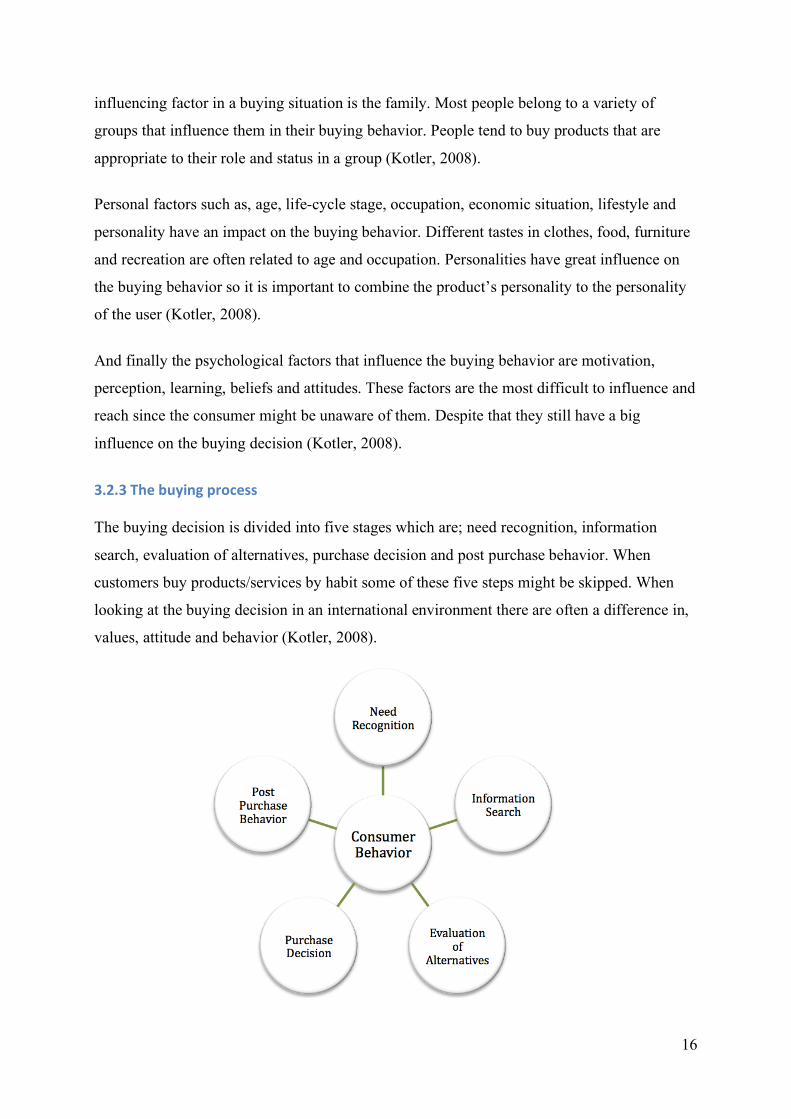
The buying decision is divided into five stages which are; need recognition, information
search, evaluation of alternatives, purchase decision and post purchase behavior. When
customers buy products/services by habit some of these five steps might be skipped. When
looking at the buying decision in an international environment there are often a difference in,
values, attitude and behavior (Kotler, 2008).
17
Figure 5: The consumer buying behavior process
3.2.3.1Needrecognition
Need recognition or problem recognition is the first step within a buying process. The buyers
recognize the problem or need that can be satisfied with a product/service. The problem or
need can be internal or external. Internal need is for example hunger or a need for higher level
of education. External need is stimulated by the external environment, for example from
advertising or a discussion with friends (Kotler, 2008). According to Solomon, Bamossy,
Askegaard, and Hoog, (2008) a problem recognition occurs when the consumer sees a
difference between their current situation and their ideal situation. Needs for the product
differs depending on where in the product life cycle the product is. An example could be
Apples new product called iPad. This product is in the early rapid growth stage of the product
lifecycle and since it is a new product it will develop a new need. Another product such as the
MP3 player is not a new product and the need recognition will therefore instead be created
between brands, quality and features (ibid).
3.2.3.2Informationsearch
The second stage in the buying behavior process is information search. In this step consumers
may act very differently depending on what kind of product it is and the interest the consumer
has for the product. When buying products that are more expensive and not so frequently
purchased the search for information is more complex. Consumers search for more
information and through more channels. When buying cheaper products that are purchased
often the opposite information search pattern appears. The information might come from,
personal sources, commercial sources, public sources and experiential sources (Kotler, 2008).
According to Solomon et al. (2008) there are two types of information search, pre-purchase
search and ongoing search. Pre-purchase search is when the consumers search for information
before the purchase in order to make the purchase as good as possible. Ongoing search is
when the consumers first buy the product and afterwards collect information for future
purchases. The information search can also be external or internal. Internal search is when the

18
consumers search for information in their memory and external search is when the consumers
search for information from, advertisement or friends (ibid).
3.2.3.3Evaluationofalternatives
Evaluation of alternatives is the third stage in the buying behavior process. It explains how the
customers use information to choose among brands. The process is different depending on
the consumer and on the buying situation. The process can involve a lot of information and a
lot of thinking but it can also be an impulse or an instinct purchase. The process can be made
by themselves or with help from others and it can involve a big combination of attributes or
just one single attribute (Kotler, 2008). When consumers choose between different brands
they often pick a brand they are familiar with. An estimate is that a consumer is able to
quickly enumerate five brands in a product category and when given more time they easily
remember a few more. The consumers tend to forget brands they do not like but if they are
constantly being exposed to a brand (in-store commercials, TV-ads, posters etc) they tend to
remember the brand even if they like it or not (Solomon et al., 2008).
To be able to choose a product consumers have to narrow down the alternatives into a smaller
amount. This process can be explained by dividing all alternatives into, inept set (products the
consumers do not want to buy), inert set (not under consideration) and evoked set (the
products already in memory). The evoked set is then divided into retrieval set which are
products that customers like and have in their memory, and prominent products which are
products that stand out in the purchase decision environment (Solomon et al., 2008).
According to Ranyard, Crozier and Svensson, (2001) decisions can be made in two steps.
First the decision maker collects similar alternatives into different groups and chooses the best
alternative in each group. The second stage is to choose the best alternative from the collected
group in the first stage (ibid).
When decision makers stand in front of a problem it is common to cancel common
components. This means that the decision maker puts common components into groups, like
for example when buying a car the consumer puts all the cars with a turbo engine into one
group and every car with a diesel motor in another group. This gives the decision maker
different groups with different attributes to base the decision on. The decision maker then
chooses a group based on the decried outcome of the group. When a group has been chosen
the decision maker picks the best alternative within the chosen group (Ranyard et al., 2001).
19
3.2.3.4Purchasedecision
Purchase decision is when the consumers make the final decision. Generally the purchase
decision is to buy the preferred brand, but there are two things that can come in between the
intention of buying the preferred brand, the attitude of others and unexpected situational
factors (Kotler, 2008).
According to Solomon et al. (2008) before a purchase the consumer evaluates different
criterions. This means that the consumer compares features, quality, and reputation among the
products in the evoked set. The purchase decision can also be based on a product’s attribute,
which is an attribute that the consumer valuates higher. Another factor to consider is that
consumers can make purchase decisions by using guidelines such as to buy the same brand as
last time or to buy products with higher price because they think that they will get better
quality. The quality and features of a product is also reflected by the visual product signals
such as the package, which can have an impact on the purchase decision (ibid).
The basic belief in theories about decision-making is that the consumer always acts rationally
from the information he or she receives, which often is not the case (Ranyard et al., 2001). To
handle rationally means to choose the option that gives the maximum possible value.
Research shows that the same decision may have different outcomes depending on the way it
was presented or because different response-measures where used. Decisions that are made in
a temporary mode often have a strong influence from decisions in the past (ibid).
According to Kotler, (2008) there are four different types of buying behavior, complex,
dissonance-reducing, habitual and variety-seeking. Complex buying behavior takes place
when the customer is highly involved in the buying decision and believes that there is a
quality difference between brands. This type of buying decision is common when the product
is expensive and involves technology, for example a PC-computer (ibid).
Dissonance-Reducing buying behavior is when the customer is highly involved, the product is
expensive but the difference between the brands is very small. It is common that the customer
choose to buy the best-known brand and the choice is often made very quickly (ibid).
Habitual buying behavior happens when there is not a big difference between the brands and
the customers are barely involved in the buying decision. Customers do not search for
information about the brands. The information mainly comes from television and magazines.
20
Customers choose the product because it is familiar and a common marketing activity for
these products is sale promotion (ibid).
Finally variety-seeking buying behavior arises when customers’ involvement is low and there
is a perceived difference between the brands. In this scenario customers usually do a lot of
brand switching. The market leaders in this case will try to make the buying process into a
habit while the minor brands seek for low-price offers and use advertising and sales
promotion as marketing activities (ibid).
3.2.3.5Postpurchasebehavior
When studying post purchase behavior (what happens after the customer has bought the
product) it is important to find out the level of satisfaction. Consumers’ expectations on the
brand have to live up to the performance of the product. Customers who are satisfied will
most likely buy the product again, buy other products from the same brand and will spread a
good word of mouth. Consumers who are dissatisfied might spread a bad word of mouth,
which could be devastating for the brand since bad word of mouth tends to spread faster than
good word of mouth (Kotler, 2008). According to Solomon, (2008) a consumer can react to
products they do not like in four ways. They can go directly to the retailer for a redress, tell a
friend or boycott the store or the consumers might take legal actions.
3.3CobrandingandConsumerbehavior
When adding a fair trade logo to a brand this brand becomes the parent brand. According to
Mengkuan, (2005) consumers might be confused if the characteristics of the parent brand are
inconsistent, and the evaluation of co branding will affect the equity of the brand.
According to Haugtvedt, Herr and Kardes (2008) co branding with a well-known brand raises
consumers’ expectations on the product. If two brands do not have the same brand awareness
the more well-known brand will increase the less-known brand’s brand awareness. According
to Schiffman, Kanuk and Hansen, (2007) the parent brand get the other brand’s equity when
co branding takes place. A negative effect from co branding could be that the parent brand
might have problems to stand out on its own. Schiffman et al. (2007) also states that co
branding confuses both the consumers and the producers of the product.
21
The reason behind co branding is often to increase brand awareness (Begemann, 2006) and it
is often used by unknown brands to increase their brand awareness. Establishing brand
awareness can lead to desirable effects such as brand preferences, targeting new markets and
brand image for a product. Begemann, (2006) describes the brand awareness as one of the
success factors from co branding.
Co branding is common in Korea between big restaurant chains and completely different
industries such as credit card companies or cell phone companies (Kim et al., 2007). Research
about how this affects consumers’ loyalty to the restaurants shows that both customer loyalty
and customer satisfaction increased when co branding. A reason for this could be the price
benefits customers receive when co branding. The research also shows that customer
satisfaction is directly linked to the price benefits rather than to brand loyalty (ibid).
3.3.1Fairtradeandconsumerbehavior
Consumers in today’s society are more concerned about moral values and the fact that
companies live up to these values. This also leads to consumers being more willing to buy fair
trade products (Ferran & Grunert, 2009). Today consumers are searching for information
about the background of the product, something which might lead to a move towards ethical
consumption (Alexander & Nicholls, 2006). Strong, (1997) introduces the concept called fair
trade consumerism, which explains the patterns of a fair trade consumer. Strong, (1997)
explains that it is important for organizations and companies to be aware of the fair trade
consumerism. When these companies have information about the consumerism they will also
have a competitive advantage against other companies. Davenport and Low, (2005) explains
the concept ethical consumerism as the power of consumers’ choice and action, and the fact
that consumers can make a positive impact on our social and environmental lives by choosing
a fair trade product over a non fair trade product.
3.3.2Brandperceptionandconsumerbehavior
The brand perception is the overall impression that customers have about the brand, based on
their exposure to the brand (Van Gelder, 2003). Brand perception includes customers’ brand
image and brand experience. Brand perception is however difficult to measure since the level
of brand exposure and brand interpretation differs between consumers. Companies try to
create a decried perception of their brand but the perception of the brand is built on the
experience of the brand from the customers (ibid).

22
The perceptual process explains how a perception is established (Solomon et al., 2008). The
process starts with response from our senses. Nose, eyes, ears, mouth and fingers gives us
stimuli from elements such as light, colors and sounds. Perception is the process when those
feelings are selected, organized and interpreted. We receive stimuli from the external
environment and after selecting, organizing and interpreting them we link a meaning to these
stimuli and a perception is created. Signals from a product thus give us external stimuli and
we form a brand perception (ibid).
The visual part of a product includes advertising, store design and packing. The visual parts
can be adjusted by products size, styling, brightness and distinctiveness from the competitors.
Smells and sounds in stores are important factors to establish the desirable consumer
perception for a product. In consumer behavior the effects from our touch senses are not
investigated as much as our other four senses, but for example a feeling of roughness is often
more valuable for men while women tend to prefer smoothness. An area in which there has
been a lot of research however is our taste senses, something that is vital in the food industry
(ibid).
Today consumers are often exposed to more information than they are capable or willing to
process. Companies have noticed this and a lot of advertising today focus on getting
consumers’ attention. Consumers therefore have to select which of the information to take in
and process (ibid).
3.3.3Brandpersonalityandconsumerbehavior
The concept brand personality consists of two different aspects, first the personality endowed
in the brand by the company and secondly the perceived personality by the consumers. The
first aspect is what the company wants the consumers to think and feel about the brand and
the second aspect is how the consumers perceive and see the brand personality. Important to
remember is that these two aspects are not always the same (Heding, Knudtzen & Bjerre,
2009).
According to Moser, (2003) every brand has a personality, in the same way as every human
being has a personality. Even a “zero” personality is considered to be a personality. The
advantage of working with your brand’s personality is that if you have a defined personality it
will create a differentiation for your brand compared to competing brands. A brand’s
personality is the tone and attitude of the communication of the company’s values and core

23
message. It is also very important for the company that this personality is seen from the top of
the organization to the very bottom (ibid).
According to Van Gelder (2003) brand personality is the set of human-like attributes that
customers relate to a brand. The reason for letting your brand have a personality is to enhance
customers’ brand appeal. Sometimes companies use a person to communicate the personality,
as for example with McDonald’s and their mascot Ronald McDonald. In most cases
companies develop an underlying character to the brand or a transfer of user imagery. An
example of the last one is Heineken who stands for a young and cool club audience (ibid).
Van Gelder, (2003) explains that there are seven different dimensions of a brands personality
that the consumers perceive as brand personality traits. The seven dimensions are sincerity,
excitement, sophistication, competence, peacefulness, passion and ruggedness. These traits
were developed by Aaker in 2000 and when identifying these he researched the differences
between societies and cultures in USA, Spain and Japan. He found three of the dimensions
being more or less constant in the different societies and they were sincerity, excitement and
sophistication. Competence was shared by brand personalities in Japan and USA and
peacefulness was shared between Spain and Japan. The last two dimensions were culture
specific, ruggedness was a brand personality in USA and passion was a personality in Spain
(see figure number 5) (ibid).
24
Figure 6: Brand personality dimensions (borrowed from Van Gelder, 2003)
3.3.4Brandassociationandconsumerbehavior
McLoughlin and Aaker, (2010) says that brand associations reflect the strategic position for
the brand and therefore is a key asset for the company. The concept brand association can be
summarized as anything that is linked in consumers’ memory to a brand. The goal for the
company is to make the brand interesting, memorable and appealing to its customers.
Examples of brand associations are that Heinz is the slowest pouring ketchup, that Skoda is a
cheap car that is priced for value and that Absolut is premium vodka.
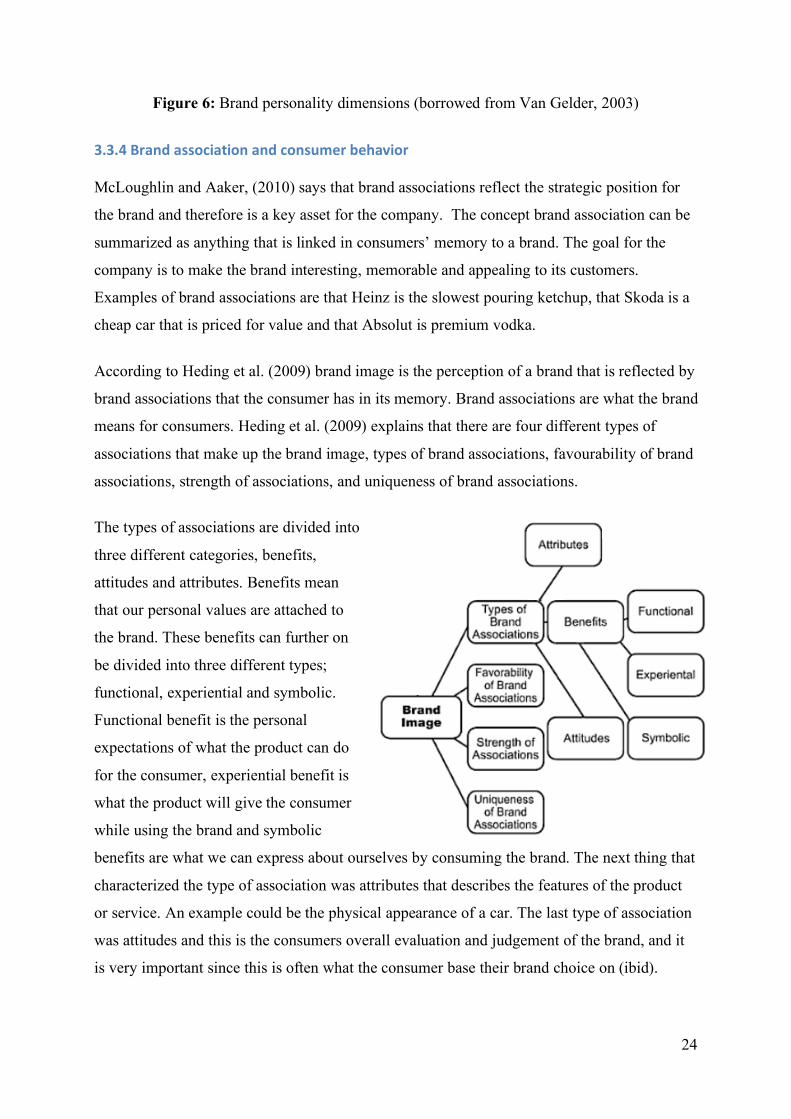
According to Heding et al. (2009) brand image is the perception of a brand that is reflected by
brand associations that the consumer has in its memory. Brand associations are what the brand
means for consumers. Heding et al. (2009) explains that there are four different types of
associations that make up the brand image, types of brand associations, favourability of brand
associations, strength of associations, and uniqueness of brand associations.
The types of associations are divided into
three different categories, benefits,
attitudes and attributes. Benefits mean
that our personal values are attached to
the brand. These benefits can further on
be divided into three different types;
functional, experiential and symbolic.
Functional benefit is the personal
expectations of what the product can do
for the consumer, experiential benefit is
what the product will give the consumer
while using the brand and symbolic
benefits are what we can express about ourselves by consuming the brand. The next thing that
characterized the type of association was attributes that describes the features of the product
or service. An example could be the physical appearance of a car. The last type of association
was attitudes and this is the consumers overall evaluation and judgement of the brand, and it
is very important since this is often what the consumer base their brand choice on (ibid).
25
Figure 7: Brand image and brand associations (borrowed from Heding et al., 2009)
3.4ConclusionsofLiteraturereview
Our purpose with this dissertation is to explain the differences in consumer behavior when
buying a product co branded with the fair trade logo compared to buying a product without
the fair trade logo. The reader has therefore been introduced to the concepts called co
branding, fair trade and consumer behavior.
The model chosen to study our problem is the buying process model since it explains in depth
consumers’ behavior within a buying decision, from the initial need to the post purchase
behavior. We believe that when buying a product co branded with fair trade the consumer
behavior in these five stages could be different from the buying behavior of a product without
the fair trade label. This is the reason for choosing this model. As mentioned earlier the
buying behavior process consists of the following steps: need recognition, information search,
evaluation of alternatives and post purchase behavior (Kotler, 2008).
Factors such as income, price of the product, taste and preferences of the customer are
important when a customer makes a buying decision. When co branding with fair trade
customers will base their buying decision differently and one thing that will be especially
different is the price of the product. Co branding with fair trade will increase the price for the
product, which we have taken into consideration and used in our research (Woolliams, 2004).
This dissertation will also look at the personality of the brand, whether or not the customer
will look at the brand’s personality different when it is co branded with fair trade and when it
is not. This is the reason why the reader has been introduced to brand-association, personality
and perception.
3.4.1Needrecognition
When the buyer recognizes a problem or need that can be satisfied with a product or service a
need is created (Kotler, 2008). Co branding with fair trade might trigger different needs for
consumers. In the need recognition stage new needs might be taken into consideration and
information about two brands is now affecting the need.
26
In our empirical research we will investigate what reasons are behind the actual purchase, and
if these reasons differ when buying a fair trade product from a non fair trade product. Thus
our hypothesis number one is as follows:
H1: The reason for buying a product that is co branded with fair trade differs from buying
a product without the fair trade logo.
3.4.2Informationsearch
The second action taken within the buying behavior is to search for information (Kotler,
2008). The information search can include information about the products, the brand or other
factors around the product. The information can appear from personal sources, commercial
sources, public sources, and experiential sources (ibid). Co branding with fair trade adds an
extra factor to the information search. When two brands are combined more information are
available and new sources for information could appear. Thus our hypothesis number two is
as follows:
H2: Consumers are using a different source of information when buying a product that is
co branded with fair trade compared to buying a product without the fair trade logo.
3.4.3Evaluationofalternatives
The evaluation of alternatives is the process where consumers use the information to choose
among different brands (Kotler 2008). The process is different depending on the buying
situation and the consumer. The process to choose a product can involve a lot of information
and evaluation but it can also be an impulse or an instinct (ibid). In the evaluation step the co
branded product will have a different position against other products since it has two different
brands that will result in double information for the consumer. Two things that we believe are
very interesting to study are whether or not people are buying products with the fair trade logo
with a higher purchase frequency and if they are willing to pay more for the product that is co
branded with fair trade. Thus our hypothesis number three and four are as follows:
H3: Co branded products with fair trade have a higher purchase frequency compared to
products without the fair trade logo.
27
H4: Consumers are willing to pay more for a product that is co branded with fair trade
than for a product without the fair trade logo.
3.4.4Postpurchasebehavior
Post purchase behavior is the process that takes place in consumers’ mind after the purchase.
After the customer has bought the product it is important to find out the level of satisfaction
(Kotler, 2008). There has to be a balance between customers’ expectations and what the
product actually delivers. A product with a fair trade logo might increase consumers’
expectations, raise new expectations and/or drop old ones. Co branding might make
consumers require more from the same product, thus changing the levels of satisfaction.
If the consumers have higher expectations on a product it will take more to make the
consumer satisfied (ibid). In our empirical research we will investigate consumers’ quality
expectations on a product co branded with fair trade compared to a product without the fair
trade logo. Thus our hypothesis number five is as follows:
H5: Consumers believe that a product that is co branded with fair trade has a higher
expected quality than a product without the fair trade logo.
3.4.5Brandpersonality
When having a well defined personality for your brand the company will create a
differentiation compared to competing brands. A brand’s personality is the tone and attitude
of the communication of the company’s values and core message (Moser,2003). This is the
reason why we believe that this is very important to investigate. Thus our hypothesis number
six is as follows:
H6: Consumers perceive the brand personality different for a product that is co branded
with fair trade from a product without the fair trade label
28
4Empiricalmethod
In this chapter the reader will be informed of what research design and strategy that will be
used. Information about how to collect data and what sampling selection to be used will be
explained. After that we will explain how the hypotheses are measured by operationalize the
variables. And finally we will discuss three very important concepts namely reliability,
validity and generalisability.
4.1FairTrade
A frequently cited definition of fair trade is “Fair trade is a trading partnership, based on
dialogue, transparency and respect, that seeks greater equity in international trade. It
contributes to sustainable development by offering better trading conditions to, and securing
the rights of, disadvantaged producers and workers[…]”(Bzencon and Blili, 2009, p. 95).
4.1.1Theemergenceofthefairtrademovement
A lot of people believe that the fair trade concept was created during the last 15 years, but this
is not true. Fair trade has its origins in something called “charity trade” and “development
trade” which was established in the 1950s and 1960s, which had the philosophy to create an
alternative approach to consumption and production. Other fair trade certifications that
followed were Max Havelaar, Transfair International and Fair trade mark (Davenport & Low,
2005).
It was first in 1988 that the fair trade organization called Fair Trade Labeling Organizations
International was founded (Fair trade labeling organization international, 2010). The reason
for this was the need to standardize the different certification initiatives, which Fair Trade
Labeling Organizations did as a nongovernmental organization (Davenport & Low, 2005).
In 2000 fair trade coffee became available for cafés, which made fair trade coffee available
for the big coffee chains (Fair trade labeling organization international, 2010). Two years later
in 2002 the big chain Starbucks decided to have fair trade coffee as an option to regular coffee
in their cafés. In UK 2004 the coffee chain ATM coffee was the first chain to be 100% fair
trade. This initiative was followed by Starbucks who became 100% fair trade in 2009 (ibid).
29
Today the fair trade label is available for a variety of products such as food products, clothes,
sports products and beauty products and it is accessible in 23 countries in Europe, North
America, Japan, Australia and New Zealand (ibid).
4.1.2ThePrinciplesoffairtrade
The goal of fair trade is to make trading an equal exchange between the First and Third world
(Strong, 1997). In more depth the fair trade organization improves the relation between the
consumers and the producers (Fair trade labeling organization international, 2010). The aim is
to give the small producers in developing countries a chance to compete and be a part of the
world market (Nicholls & Opal, 2005). This is done by developing their business and setting a
price that not only give the producers a basic standard of living but also gives them the chance
to develop their business (ibid).
The idea is that the product with a fair trade label is produced during fair circumstances and
the producers have the chance to improve their lives (Fair trade labeling organization
international, 2010). Producers are guaranteed the right to join trade unions and to work under
health and safety standards. They are provided with adequate house holding that is relevant,
and are also guaranteed a minimum price for their products. The minimum price makes sure
that small farmers from the third world do not sell products below the market price. The
money the producers receive is used for improving the areas of social, economical and
environmental circumstances. On an individual level the money is often used for education,
healthcare, farm improvements, increase yield and quality or processing facilities to increase
income (ibid).
4.1.3Thefairtrademark
The fair trade mark is a certification mark that certifies that the products meet the social,
economical and environmental standards established by the Fair Trade Labeling Organization.
Today the fair trade mark is the most extensively recognized social and development label in
the world. The label was created in 2002 and has gradually replaced other national labels. The
fair trade mark symbolizes a “cheering man” with his right arm raised (see figure 3), and it
represents all the producers and consumers within the fair trade movement (Fair trade labeling
organization international, 2010).
30
Fair trade labeling organization international, (2010) defines the fair trade mark as a product
label. They explain that the label is mainly intended to be used on the packaging or in
promotional material. But there are also people who believe that the fair trade label is a brand.
Paton, (2006) consider the fair trade label being the archetypal brand of this new economy. He
also feels that it is becoming a very strong brand, since it expresses values, makes a statement
and offers consistency, all which makes people trust what it represents.
Figure 3: Fair trade logo (borrowed from Fair trade labeling organization international, 2010)
3.1.4Netherlandandfairtrade
The first fair trade label in the world was launched in Dutch supermarkets. The label was
called Max Haverlaar and was established in 1988. The Netherlands has the longest history of
fair trade retailing and today 3% of the coffee market has a fair trade logo. The leading
supermarket chain Albert Heijn is selling their own coffee label, which is a fair trade product.
The Max Haverlaar label now certifies fair trade coffee, tea, cocoa, and more food products in
different European countries (Nicholls & Opal, 2005).
When looking at the national sales of fair trade products per capita in the Netherlands, they
are in second place right after Switzerland. The Dutch people buy fair trade products for US$
4.47 per capita/year. This is a very high number compared to Spain who had the lowest
number with US$ 0.10 per capita/year, in this research (Davenport & Low, 2005).
31
3.1.5Fairtradeandmarketing
Fair trade has been an effective tool for companies to create effective marketing
communication (Nicholls & Opal, 2005). Often fair trade is used as a brand in their marketing
or used as a part of the marketing communication message. Big chains have also introduced
sub brands that carry the fair trade logo. They function as their own brand but all products are
marked with fair trade. This has given fair trade other associations in different countries
(ibid).
Fair trade products have been positioned as quality products (Nicholls & Opal, 2005).
Marketing campaigns about fair trade have included feelings like “guilt” and “do good” but
also “life quality”. The aim for the fair trade brand is to be associated with positive feelings
instead of negative. In USA they have a campaign for fair trade that has been built on the
sentence “Quality fruit for you, Quality life for farmers” (ibid).
4.2Researchdesignandstrategy
The research design will let the reader know how the researcher will link the data and the
research findings to the initial research question. In total there are three different research
designs; exploratory, descriptive and explanatory (Munhall, 2007).
According to Creswell, (2009) exploratory strategy is the design of choice when a researcher
wants to develop an instrument, because existing instruments are inadequate or not available.
Gray, (2004) explains that this is the research design to use if there is not enough known
about a phenomenon. The exploratory studies can be conducted through, search of literature,
talking to experts and conducting focus groups interviews. The descriptive research design is
used when the researcher wants to provide a picture of a phenomenon as it naturally occurs.
An example of a descriptive study could be to study the level and nature of crime among 16-
21 year-olds (ibid). According to Saunders et al. (2007) the descriptive research design is very
closely related to both the explanatory and the exploratory. The last research design is called
explanatory, it has the nature of discovering causal relationships between variables. An
example could be to determine the relationship between drug use and other variables such as
employment, social class and age (Gray, 2004).
The purpose of the research in this dissertation is to explain the relationship between
consumer behavior and co branding. This means that we will determine the causal

32
relationship between variables, therefore the use of an explanatory research design is
appropriate. Another reason for choosing this research design is because we want to analyze
the correlation between independent and dependent variables.
Stated by Saunders et al. (2007) there are seven different research strategies that could be
used in all of the three earlier mentioned research designs. These seven are; experiment,
survey, case study, action research, grounded theory, ethnography and archival research.
In this dissertation the strategy that will be used is survey, and the data will be collected
through a consumer survey. The reason for using a survey is that we want a large
representative sample in order to be able to investigate the casual relationship between co
branding and consumer behavior.
4.3TimeHorizon
There are two different types of time horizons that the study can use which are either cross-
sectional or longitudinal. Longitudinal is when data is collected before and after a
manipulation (Frauendorf, 2006). Altinay and Paraskevas,(2008) definition of longitudinal
time horizon is when the researcher is studying the developmental trends of a phenomenon
across a period of time. According to Cohen, Manion, and Morrison, (2003) the disadvantages
of longitudinal studies are, firstly that they are expensive and time-consuming, and secondly
that there is a difficulty in sample mortality since a long term study can make subjects drop
off. It is called a Cross sectional study when different respondents are studied at different
points in time, and the study produce a “snapshot” of a population’s behavior or
characteristics at a specific point in time. The advantages of cross sectional is the
disadvantages of longitudinal, so the reason that many researchers choose the cross sectional
time horizon is because it is less expensive, they produce findings more quickly and they are
less likely to suffer from control effects (ibid).
In this dissertation we will use the cross sectional time horizon. The reason for this is that we
are limited to produce this study within 15 weeks, but also because we want to study the
consumer behavior of the respondents in a specific point of time. The data will be collected
from the 26 of April until the 2 of May 2010.
33
4.4Datacollection
According to Saunders et al. (2007) there are two ways of collecting data; either primary data
(new data) or secondary data (already collected data). Primary data is information that is
collected for the first time, and this type of data collection gives the researcher richer and
more detailed information than with secondary data. An example of primary data is statistics
collected through a survey where people are asked about their preferences for product
improvements (Kurtz, MacKenzie & Snow, 2009). With this in mind the type of data that we
are going to use in our empirical research is primary data, and the type of primary data source
that will be used is a survey.
The target group for our survey is coffee consumers in all ages. To reach our target group the
survey is made at Dam Square in Amsterdam, the Netherlands. This square is a central area in
Amsterdam where all kinds of people are crossing, therefore the data will come from a mixed
group of people that reflect the consumers in the stores. According to Amsterdam.info, (2010)
the square is just a five-minute walk from the central station and it is always packed with
people both day and night. The reason for choosing the Netherlands as a country to do the
research in is because the Netherlands was the first country in the world to launch the fair
trade label, another reason for choosing the Netherlands is that they have the longest history
of fair trade retailing and today 3% of the coffee market has a fair trade logo (Nicholls &
Opal, 2005).
The survey will focus on finding the differences in consumer behavior when buying a fair
trade product and a non fair trade product. We will therefore first ask the respondents general
questions about their coffee buying behavior. After that consumers have to make a decision as
if they were in a real buying situation, and choose between coffee with or without fair trade.
Pictures, price and a little story behind the two different products will be provided to the
respondent so that they will be able to make a real buying decision. The answers from the
people that chose the fair trade coffee will be compared to the answers from the people that
chose the non fair trade coffee.
The advantages of using a questionnaire are according to Gratton and Jones, (2004) that it
enables the researcher to get data from a geographically dispersed sample group. It is also
much cheaper than interviewing and also less time consuming since the researcher does not
have to be present when the respondents fill out the survey, which also leads to more
34
respondents and a larger sample. Two other advantages that Gratton and Jones, (2004)
mention are the possibility of anonymity and the fact that the data that will be collected is
more structured.
We are also aware of the disadvantages such as the potential problem of complex questions.
Another thing to acknowledge is that the respondents will not be able to elaborate their
answers due to likert scale and categorized answering alternatives. Finally the last
disadvantage is the risk of a potential low response rate (Gratton &Jones, 2004).
4.5Sampleselection
The sampling process is very important since it is where the survey respondents are selected,
and if the right respondents are not included in the research that accurately reflects the target
market the research is likely to make misleading conclusions (Kurtz et al., 2009).
According to Bryman and Bell, (2007) the definition of population is the units that the sample
will be collected from and the definition for sample is the part of the population that has been
selected for investigation. It could also be seen as a subset of the population. There are two
different types of sample selection; probability or a non-probability approach. The probability
approach is when a sample is being randomly selected, which means that everyone in the
population has got the same likelihood of being selected. Non probability approach is when a
sample is not being randomly selected, which implies that some units in the population have a
higher likelihood of being selected. There are four types of probability sample; simple random
sample, systematic sample, stratified random sampling and multi-stage cluster sampling. The
non probability sampling has three different types convenience sampling, snowball sampling
and quota sampling.
In order to get an accurate representation of the population, random sampling would be a
favourable technique to use. Random sampling is when each person has an equal chance of
being selected out of the total population, but in order to give everyone the same chance every
member must be identified. In our case it would be impossible to identify every citizen in
Amsterdam. The sampling technique that we will therefore use is convenient sampling and
this is often used when the researcher wants o get an inexpensive approximation of the truth
and is under time pressure (ibid).
35
The first question in our survey is “Have you ever bought coffee?” With this question we will
limit our population to only people that buy coffee. The reason for doing this is that it is only
relevant to collect information from people that have actually been in a buying situation
where they have bought coffee. Many of the questions in the questionnaire cannot be
answered if the respondents have never bought coffee before. The final justification for not
using people that do not buy coffee is that this dissertation will research the difference in a
coffee buyer’s behavior when buying fair trade coffee compared to non fair trade coffee. By
collecting information from people that do not buy coffee in general our result would most
likely be incorrect. Still we are aware that these people that we exclude from the survey could
possibly give us different but interesting answers since they are watching the coffee buying
process from a distance.
4.6Questionnaireoperationalization
The most basic criterion for hypotheses is that they are testable. At the moment our
hypotheses are at a conceptual level, which means that they can be generalized but not
directly tested. Therefore it is necessary to convert the hypotheses into operational level, and
this process is called Operationalization (Walliman, 2005).
As mentioned earlier this dissertation will research a causal relationship between co branding
and consumer behavior. A causal relationship is when there is a variation in one factor that is
responsible for a variation in another factor (Schwab, 2008). In this dissertation the difference
in co branding will be divided into two groups that will test the difference in consumer
behavior. According to Babbie, (2010) this is with other words known as independent and
dependent variables, where we examine the effect of the dependent variable (co branding) on
an independent variable (consumer behaivor) (ibid).
4.6.1Dependentvariables
The difference in consumer behavior will be measured with the dependent variable co
branding. Co branding is the dependent variable since our hypotheses test the difference
between two groups. These two groups are the consumers that buy fair trade and the
consumer who do not buy fair trade.
36
4.6.1.1Cobranding
The last question in our questionnaire will operationalize the concept co branding. The last
question is when we set up a buying situation for the respondents. They will be given pictures
of two products and information about them (see appendix 1). Product number one will be
Douwe Egberts without the fair trade label for 2.90 € and product number two will be Douwe
Egberts with the fair trade label for 4.29 €. At mataffären.se, (2010) the cost of 1kg Löfbergs
Lila is 59,80 SEK and 1kg of the same coffee with fair trade cost 89.00 SEK. Fair trade coffee
is 48,8% more expensive than regular coffee, which also is the price difference we used in our
questionnaire.
The respondent will be asked the question:
“Which coffee product would you choose if you were in a buying situation right now?”.
4.6.2Independentvariables
The concept consumer behavior has been broken down into five variables. These five
variables are developed with help of Philip Kotler’s buying process model and the variables
are the basis of our hypothesis. Another variable that we have chosen to research is brand
personality. All these six elements are independent variables and will further down be
explained and discussed.
The independent variables are reason for buying, source of information, price, purchase
frequency, expected quality and brand personality.
4.6.2.1Thereasonforbuying
The first independent variable is reason for buying a product, this will be operationalized into
our own definitions of the concept. When choosing between products we believe that the
reason for buying one of them could be that consumers are concerned about the price, the
environment, what kind of brand it is, the taste and labor conditions of producers. The
respondents will therefore be asked if these five elements are important for them when they
buy coffee products in general. The respondents will have to say what they believe match
their own buying behavior on a likert scale. A likert scale is divided into 7 items which all
have the same attitudinal value, where 1 will be “do not agree” and 7 is “I agree” (Kumar,
2005).
37
The respondent will have to declare their opinion to five different statements:
“When buying coffee the most important thing is how it tastes”
“When I go shopping I always consider the environment when choosing a coffee product”
“When buying coffee I always take into account that the coffee producers/workers were paid
the correct amount of money for their work”
“When buying coffee in a supermarket I always look at the price”
“When buying coffee the most important thing is the brand”
In order for us to compare the consumer behavior for non fair trade and fair trade products,
we will as mentioned earlier let them choose between fair trade coffee and non fair-trade
coffee (see appendix1). We will then compare the respondents’ general answers for example
the importance of price, with the product they chose in the last question. This method where
we compare the two groups will apply for all our independent variable, except for the variable
price.
4.6.2.2Sourceofinformation
The second independent variable is source of information. This concept will be
operationalized by dividing the concept source of information into possible sources.
According to Kurtz et al. (2009) the information search in Kotler’s model is either internal or
external sources of information. The internal search is a mental review in the consumers
mind. We will therefore ask the consumers if they collect information about the product prior
to the purchase. If they are collecting information they will be given categorized answering
alternatives for possible sources of information such as friends, the package, internet,
advertisement, the supermarket/store. We will also give them the opportunity to answer “I do
not know”.
The respondent will be asked the following two questions:
“When buying coffee I collect information about the product before the purchase”
“I collect information thorough the following sources”
38
4.6.2.3Price
Price is the third independent variable and it means that we want to measure if people are
willing to pay more for fair trade coffee. Therefore this variable will be operationalized by
asking the respondents how much money they are willing to pay extra to get a fair trade
product. It will be an open answer where the respondents can give us the exact amount that
they are willing to pay, if their answer is zero euro this means that they are not willing to pay
anything extra to get the product that is co branded with fair trade.
The respondents will be asked the following question:
“ When choosing between 1 kg fair trade coffee and 1 kg non fair trade coffee I am willing to
pay this much extra to get the fair trade coffee”
4.6.2.4Purchasefrequency
The third independent variable is purchase frequency. The purchase frequency is
operationalized by asking the respondents how often they buy coffee in general. The
answering alternatives that they will choose between are once every week, once every second
week, once a month, every other month, every third month, less than every third month, and I
do not know.
The respondents will be asked the following question:
“I buy coffee in the supermarket...”
4.6.2.5Expectedquality
Expected quality is operationalized by breaking down the term quality into factors that
explains the term. The factors we have used are, excellent coffee beans, worthy its price and
an appealing appearance. The respondents will have to say what they believe match the two
products on a likert scale. A likert scale is divided into 7 items which all have the same
attitudinal value, where 1 will be “do not agree” and 7 will be “I agree” (Kumar, 2005). The
respondent will be asked the following questions:
“When looking at picture number 1, I believe that the following items match the product”
“When looking at picture number 2, I believe that the following items match the product”
39
4.6.2.6Brandpersonality
The last independent variable is brand personality. We will measure if the respondents believe
that the two different products have different personalities. We will operationalize the concept
brand personality into Van Gelder’s, (2003) seven different dimensions of a brand’s
personality, sincerity, excitement, sophistication, competence, peacefulness, passion and
ruggedness. The respondents will answer on a likert scale if they agree or not agree with the
seven different personality traits for product number one and product number two.
The respondents will be asked the following two questions:
“When looking at picture number 1, I believe that the product possesses the following
personality”
“When looking at picture number 2, I believe that the product possesses the following
personality”
4.7ReliabilityReliability is an element that determines the quality of the measurement instruments, in this
case a questionnaire. An example why reliability is important could be when a researcher
wants to measure the weight of a person. In this case the researcher wants to be sure that the
scale does not say 78 kg and after 1 min changes to 65 kg for the same person. When talking
about statistical measurement, there always exists some form of measurement error. What
reliability does is that it refers to the extent to which test scores are free from measurement
errors. What every researcher wants to measure is of course the score with no errors, the true
score. Unfortunately there are always three different elements in the score that the researcher
attains; it is the true score, systematic error and random error that combined together makes
up for the total score. The systematic error is the same error every time we measure
something. For example the scale that we use to weight people could be put to a start weight
of 2 kg instead of 0 kg, as long as we know the systematic error it will not affect the
reliability. The error that is affecting the reliability is the second error called random error,
and it is an error that will change from one measurement to another and it is unpredictable
(Muijs, 2004).
According to Saunders et al. (2007) there are four different types of error called, subject or
participant error, subject or participant bias, observer error and observer bias. Subject or
40
participant error is an error that can occur due to the time or mindset of the study. Subject or
participant bias means that there will be errors if the participants answer in a certain way
because they think that it is the answer that the researcher wants to hear. Observer error can
come up if the observers are conducting the research differently. Finally the observer bias
means that if the observers do not perceive the data coherently there will be an error.
According to Muijis, (2004) there are mainly two different ways of testing the reliability. The
first one is called repeated measurement and it means that the same thing should be measured
but at different times. This will confirm if the instrument will show the same scores even if it
is measured at two different occasions. The second type is called internal consistency
reliability. This is applicable if the researcher is using more than one question to measure the
same thing.
The reliability is insured by the formulation of our questions in the survey. We will also
insure the reliability by doing a critical review of our survey.
4.8ValidityAccording to Muijis, (2004) validity asks the question: are we measuring what we want to
measure? Bell and Bryman, (2007) highlight some examples where people argue about the
validity, for example whether or not the IQ test really measures a person’s level of
intelligence and if examinations give a correct picture of the academic ability for a student.
There are four different types of validity; measurement validity, internal validity, external
validity and ecological validity. Measurement validity is applied to quantitative research and
social scientific concepts. It means that the researcher is really measuring the correct concept.
Internal validity is about whether or not a conclusion that has a casual relationship with a
variable is correct. External validity is concerned about whether or not the result can be
generalized. The last one is ecological validity and this one is concerned if the result is
applicable to a person’s everyday life (ibid).
In order to establish validity in a research there are according to Bell and Bryman, (2007) five
different ways of doing it. The first one is concurrent validity and it means that the researcher
employs a criterion on the item where it usually differs, for example when measuring job
satisfaction a criterion could be absenteeism. The second type is face validity and it means

41
that the researcher has to make sure that the measure reflects the content of the concept in the
question. The third type is predictive validity, and here the researcher uses a future criterion
measure. In the example where measuring job satisfaction the predictive validity would use
future levels of absenteeism. The fourth type is construct validity and in this case the
researcher should create the hypotheses from theory that is relevant to the concept (ibid).
4.9Generalisability The concept generalisability means that the researcher wants to apply the results to an entire
population (Bryman & Bell, 2007). According to Newman and Benz, (1998) the
generalisability is mostly applicable on the quantitative research, which is the type of research
in this dissertation. There are two types of generalisability; statistical and aggregate. The
statistical model is more consistent with quantitative assumptions while aggregate is more
consistent with qualitative assumptions.
There are three different concepts within generalisability; applicability, transferability and
replicability. Applicable means that the research should be able to be applied to other
samples. Transferable means that the findings of the research should be able to be applicable
to other settings and situations. The last one, replicable means that the research should have
the same outcome again if given the same circumstances (ibid).
In our dissertation the aim is to use a sample that is representative for Dutch people, in order
to generalize the results. If a similar study is conducted in the Netherlands the result should be
consistent with our results.
42
5Empiricalfindings
In this chapter the findings from our empirical research will be presented. First the
demographic of our respondents and descriptive statistics will be presented followed by a
presentation of our dependent and independent variables. The answers to our hypotheses will
then be explained and discussed. Finally we will present a chart summarizing our hypotheses
and let the reader know whether they were rejected or accepted.
5.1Introduction
In our empirical findings we will accept the hypotheses if they are within a confidential
interval of 95%, meaning we will only accept a significance below 5%. We set these limits in
order to reduce the risk of aleatoric results. Some of the questions have missing variables,
which means that the respondent did not answer the question or the answer is not readable.
This is reason why some results are not completed. Throughout our empirical analysis we
have used chi-square test in cross tabulation, frequency test and Kruskal Wallis test. These
three tests were chosen since our survey has scale ordinal and nominal level of measurements
and two groups within the dependent variable.
5.2Descriptivestatistics
Our survey consists of 95 respondents, and out of these 95 we had 70 valid surveys which we
have based our analysis and conclusions on. This means that out of all the people that we
asked we got a respondent rate on 73.7%. For the remaining 25 surveys, 23 were where
respondents answered No to our first question (“Have you ever bought coffee?”) and 2 were
when the respondents never completed the survey. The distribution between men and female
were 30 to 40 respectively. This gives us a percentage of 43% male and 57% female. The age
range was from 14 years to 70 years old and the mean age of the respondents were 25,66
years.
The native languages of our respondents were English, Dutch, Swedish, Spanish, Chinese,
German, French and Papiamentu. The reason for this large collection of native languages is
due to a national holiday called the Queen’s Day. Our survey was conducted during the time
for that the holiday and the holiday attracts a lot of people from other countries. The two
biggest languages were Dutch (20%) and English (28,6%). Out of 70 people that responded to
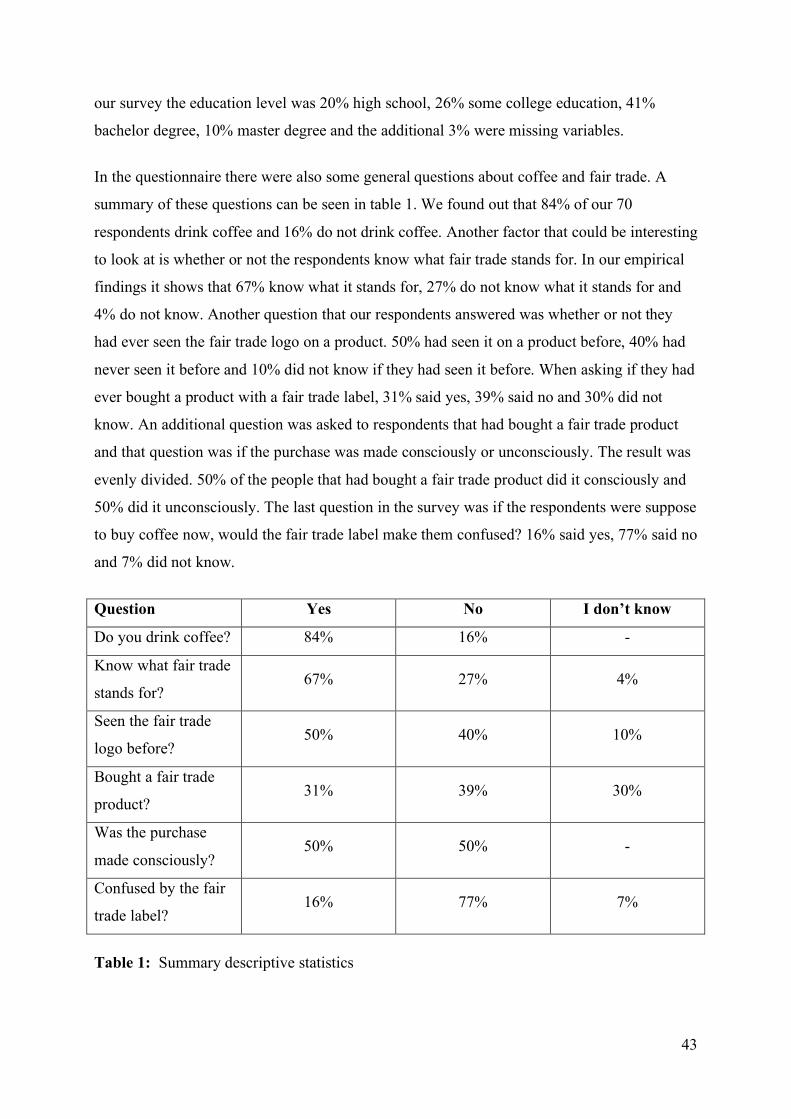
43
our survey the education level was 20% high school, 26% some college education, 41%
bachelor degree, 10% master degree and the additional 3% were missing variables.
In the questionnaire there were also some general questions about coffee and fair trade. A
summary of these questions can be seen in table 1. We found out that 84% of our 70
respondents drink coffee and 16% do not drink coffee. Another factor that could be interesting
to look at is whether or not the respondents know what fair trade stands for. In our empirical
findings it shows that 67% know what it stands for, 27% do not know what it stands for and
4% do not know. Another question that our respondents answered was whether or not they
had ever seen the fair trade logo on a product. 50% had seen it on a product before, 40% had
never seen it before and 10% did not know if they had seen it before. When asking if they had
ever bought a product with a fair trade label, 31% said yes, 39% said no and 30% did not
know. An additional question was asked to respondents that had bought a fair trade product
and that question was if the purchase was made consciously or unconsciously. The result was
evenly divided. 50% of the people that had bought a fair trade product did it consciously and
50% did it unconsciously. The last question in the survey was if the respondents were suppose
to buy coffee now, would the fair trade label make them confused? 16% said yes, 77% said no
and 7% did not know.
Question Yes No I don’t know
Do you drink coffee? 84% 16% -
Know what fair trade
stands for? 67% 27% 4%
Seen the fair trade
logo before? 50% 40% 10%
Bought a fair trade
product? 31% 39% 30%
Was the purchase
made consciously? 50% 50% -
Confused by the fair
trade label? 16% 77% 7%
Table 1: Summary descriptive statistics
44
We also studied if there was a difference in the awareness of the fair trade label between
consumers who buy fair trade and consumers who do not buy fair trade coffee. The result was
that out of all the respondents that bought fair trade coffee, 25% of them did not know what
fair trade stands for. For the respondents that did not buy fair trade coffee, 21% did not know
what fair trade stands for.
5.3Dependentvariable
Our dependent variable concerns whether our respondents would by coffee co branded with or
without the fair trade label. The respondents got four different alternatives; product A, product
B, I do not know which product I would buy and I would not buy either of the products. The
last two variables are excluded in our tests since we are only interested in the differences
between consumers who buy fair trade or do not buy fair trade.
Out of our 70 respondents, 45,7% would buy coffee without a fait trade logo and 23,9%
(when missing values are excluded) would buy fair trade coffee. 14,9% (missing values
excluded) of respondents did not know which product they would buy and 14,9% (excluded
missing values) would not buy either of the products. The reason for why 14,9% would not
buy either of the products might be the fact that they do not like/did not recognize the brand
we used in our survey or that they thought the price was too high. 14,9% did not know which
product they would buy, and a reason for this could be that they did not know what the
concept fair trade was or did not recognize the brand.
5.4Independentvariables
To be able to answer our hypotheses we have a number of independent variables. The
differences in reason for buying a product before and after co-branding are measured by using
the independent variables such as taste, environmental friendliness, labor conditions, price
and brand. The source of information is measured by our independent variables; friends,
advertising, the package, the store, Internet and I do not know. Those are measured by making
the respondents decide which sources of information they use. Another independent variable
is the price that respondents are willing to pay extra for a fair trade product. The purchase
frequency is measured by the independent variables once every week, once every second
week, once a month, every other month, every third month, less than every third month, and I
do not know. Differences in expected quality before and after co-branding with fair trade are
measured by three different variables; an appealing appearance, worthy its price and excellent
45
coffee beans. Differences in perceived brand personality are measured by six different brand
personalities from the model by Van Gelder.
5.5H1differenceinreasonforbuying
The first hypothesis is as follows:
The reason for buying a product that is co branded with fair trade differs from buying a
product without the fair trade logo.
Differences in reason for buying a product with or without co branding with fair trade are
tested with the independent variables; importance of taste, importance of environment,
importance of labour conditions, importance of price and importance of brand. In more depth
we will investigate if people who buy fair trade products buy, for example coffee more
because of the taste compared to people who buy coffee without the fair trade label. Another
example could be that people who buy fair trade coffee buy it because they are concerned
more about the environment compared to people who buy coffee without the fair trade label.
The differences between the groups are measured by making a Kruskal Wallis test. The
reason for using a non-parametric test is because the dependent variable is nominal and the
independent variables have an ordinal level of measurement. A Kruskal Wallis test is based
on ranked data, and the test compares the data between groups.
There is a significant difference between the groups within the variables; importance of
environment, importance of labor conditions and importance of price. The difference for
importance of taste and brand is not as significant. The respondents who chose to buy fair
trade coffee ranked the importance of the environment higher. The mean rank for “importance
of environment” was 31,84 for consumers who bought fair trade compared to 20,28 for
consumers who chose the product without fair trade. The significance in this question was
0.9%, and as mentioned earlier this is below our 5% limit and is therefore a valid significance.
This shows that consumers who chose a fair trade product were more concerned about the
environment than consumers who chose to buy the coffee without fair trade. When looking at
the importance of labor conditions, the respondents that buy fair trade coffee believe that the
labor conditions of the coffee producers/workers are more important than the respondents that
buy coffee without fair trade do. The mean rank for “importance of labor conditions” was
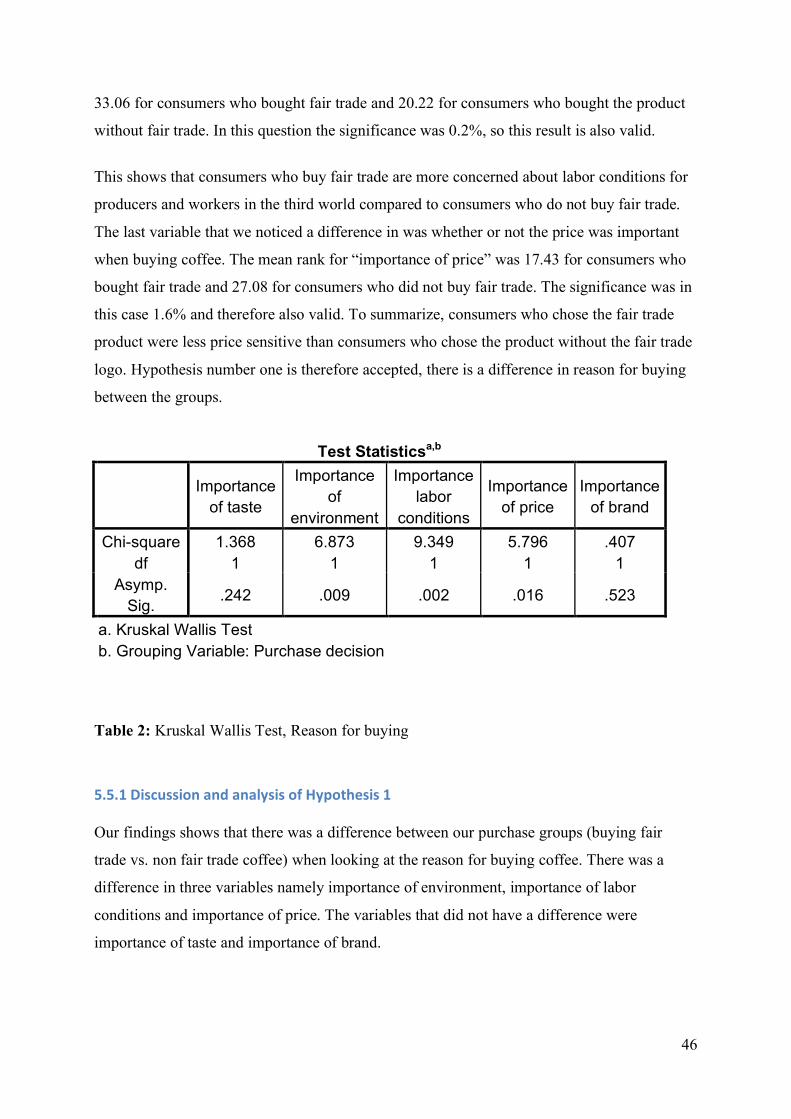
46
33.06 for consumers who bought fair trade and 20.22 for consumers who bought the product
without fair trade. In this question the significance was 0.2%, so this result is also valid.
This shows that consumers who buy fair trade are more concerned about labor conditions for
producers and workers in the third world compared to consumers who do not buy fair trade.
The last variable that we noticed a difference in was whether or not the price was important
when buying coffee. The mean rank for “importance of price” was 17.43 for consumers who
bought fair trade and 27.08 for consumers who did not buy fair trade. The significance was in
this case 1.6% and therefore also valid. To summarize, consumers who chose the fair trade
product were less price sensitive than consumers who chose the product without the fair trade
logo. Hypothesis number one is therefore accepted, there is a difference in reason for buying
between the groups.
Table 2: Kruskal Wallis Test, Reason for buying
5.5.1DiscussionandanalysisofHypothesis1
Our findings shows that there was a difference between our purchase groups (buying fair
trade vs. non fair trade coffee) when looking at the reason for buying coffee. There was a
difference in three variables namely importance of environment, importance of labor
conditions and importance of price. The variables that did not have a difference were
importance of taste and importance of brand.
Test Statisticsa,b
Importance of taste
Importance of
environment
Importance labor
conditions
Importance of price
Importance of brand
Chi-square 1.368 6.873 9.349 5.796 .407 df 1 1 1 1 1
Asymp. Sig. .242 .009 .002 .016 .523
a. Kruskal Wallis Test b. Grouping Variable: Purchase decision

47
Consumers who buy fair trade coffee have different reasons for buying when it comes to the
importance of labor conditions, importance of environment and importance of price compared
to consumers who do not buy non fair trade coffee. The fair trade consumers take the
environment and the labor conditions more into account when buying coffee compared to
consumers who do not buy fair trade coffee. When it comes to price the consumers who buy
fair trade coffee are less concerned about the price of the coffee compared to consumers that
do not buy fair trade coffee.
The overall goal of the fair trade method is to make trading an equal exchange between the
First and Third world (Strong, 1997). In more depth the fair trade organization improves the
relationship between consumers and producers (Fair trade labeling organization international,
2010). The description of fair trade mentioned above is reflected in the result of our research.
People who buy fair trade coffee buy them since they are concerned about labor conditions in
the third world. This indicates that the principles of fair trade has reached and appeals to the
fair trade consumers.
The fair trade concept does not work with finding new environmental friendly solutions, still
we found a difference in importance of environment when making a purchase. This might
indicate that consumers who are concerned about labor conditions are also concerned about
our environment. A conclusion of this could be that consumers who buy fair trade coffee take
more responsibility for the future of our planet. Out of the respondents who bought fair trade
coffee 25% of them did not know or was unsure of what fair trade stands for. Consumers that
did not buy fair trade had a rate of 21% that did not know what the concept was. There is also
a possibility that the 75% and 79% that said yes did not know what fair trade stands for. The
fact that people are unaware of what fair trade stands for could be an explanation to why
consumers who buy fair trade coffee are more concerned about the environment. Consumers
might believe that fair trade is improving the environment of our planet. Another explanation
could be that consumers do not see a difference between organizations that are working
towards a sustainable way of living such as Svanenmärkt.
According to our survey when buying coffee, the importance of taste and brand when
choosing coffee did not differ between our groups (buy fair trade or do not buy fair trade).
The reason for this could be that consumers that buy or do not buy fair trade have the same
opinion about the importance of price and brand.

48
5.6H2differenceinsourceofinformation
The second hypothesis is as follows:
Consumers are using a different source of information when buying a product that is co
branded with fair trade compared to buying a product without the fair trade logo.
This hypothesis is tested with a chi square test since all our variables have a nominal level of
measurement. The chi square test is based on frequencies within groups. The actual numbers
of respondents within a group who used a specific source of information are compared with
the expected value. The expected value is the calculated value which the groups would have if
there was no difference between them.
The test shows that there is no significant difference between the groups. Our cross tabulation
shows that consumers who buy fair trade search for information more often compared to
consumers who do not buy fair trade. The respondents who bought fair trade have a higher
than expected value for the answer “Yes I search for information”. The respondents who
chose not to buy fair trade have a lower value than the expected value. There is a difference
between the groups but it is not significant, the significance is 20,6%.
The tests concerning sources of information show the difference in source of information
between the two purchase decision groups. The tests indicated no significant difference in
source of information between the groups. The tests of source of information are based on the
independent variables; friends, advertising, the package, store, Internet, and I do not know.
All tests have significance over 50%, which is very high since 5% is our accepted value.
Hypothesis number two is thus rejected since there is no difference within source of
information between the groups. The respondent who chose to buy fair trade did not use a
different source of information than the respondents who did not buy fair trade.
5.6.1DiscussionandanalysisofHypothesis2
The result showed that there was no difference between the two groups (buy fair trade or non
fair trade) when it comes to searching information or not. It was also no difference in the
types of sources that the two groups used for searching information.
50% of the respondents who made the purchase decision fair trade, searched for information
before the purchase. 31% of the respondents who made the purchase decision non fair trade,
49
searched for information before the purchase. The reason for this difference could be that
consumers that are concerned about ethical consumption tend to search for information about
the background of the coffee. Consumers today care more about goods and services which
they consume (Alexander & Nicholls, 2006). Our respondents who made the purchase
decision non fair trade, might not care as much about ethical goods and services in the same
way that consumers who buy fair trade do, which also is proved by hypothesis number 1. This
is an interesting difference but the result will not be generalized since it is not significant.
Buying coffee can be seen as a habitual buying behavior since coffee is a consumption
product. Consumers tend to not search for information when buying consumption products
like coffee. This leads to the fact that the source of information is usually television and
magazines (Kotler, 2008). Therefore both of our two groups are likely to receive information
from the same sources.
There was no difference in source of information between the two groups. The reason could
be that searching information on consumption products is usually not made consciously. For
example when buying a car, people usually search for information and are aware of it. When
it comes to coffee and other consumption products, searching information might be made
unconsciously (Kotler, 2008). The result might be created since our respondents are not aware
of where and if they search information before the purchase.
5.7H3differenceinpurchasefrequency
The third hypothesis is as follows:
Co branded products with fair trade have a higher purchase frequency compared to products
without the fair trade logo.
This is measured with a Kruskal Wallis Test since our dependent variables have a nominal
level of measurement and the independent variable has an ordinal level of measurement. The
test measures the difference in purchase frequency between the groups of respondents who
buy fair trade and to not buy fair trade. The test is based on the independent variables; once a
week, once every second week, once a month, every other month, every third month and less
than every third month. The variables I do not know are excluded from the test since that
variable can miss lead the result of the test. The test is made by coding the variable from 1 to
6, in a range from “every week” to “less than every third month”.

50
The test shows a mean for the respondents who made the purchase decision to buy fair trade
of 24,25 and for the respondents who chose the non fair trade product 22,44. This indicates
that consumers who buy fair trade have a higher purchase frequency than consumers who do
not buy fare trade. The worth of this test is 66,2% which means that the difference can be a
coincidence. Hypothesis number three is rejected since the significance is more than 5%, there
is no difference in purchase frequency between the groups. Consumers who buy fair trade do
not have a higher purchase frequency than consumers who do not buy fair trade.
5.7.1DiscussionandanalysisofHypothesis3
The purchase frequency is the same for the two products. We expected the purchase
frequency to be higher for the consumers that bought fair trade coffee. This was not the case
the reason might be that consumers who buy fair trade coffee buy the same amount of coffee
as consumers who buy non fair trade coffee.
5.8H4differenceinprice
The fourth hypothesis is as follows:
Consumers are willing to pay more for a product that is co branded with fair trade than for a
product without the fair trade logo.
This is measured with a frequency test, a frequency test calculates the mean, median, standard
deviation and other descriptive statistics of the variable. The test is used since we have one
variable with scale level of measurement.
The test shows that our respondents are prepared to pay 0€ to 10€ more for one kilo fair trade
coffee compared to one kilo non fair trade coffee. The test shows that the mean price our
respondents are prepared to pay extra for one kilo fair trade coffee is 1,796€. The median
price they are prepared to pay extra is 1,5€. The mean of 1,796€ and median of 1,5€ indicates
that our consumers are prepared to pay more for fair trade coffee. The percentages of
respondents who were not prepared to pay anything extra for a fair trade coffee was 11,9%
(excluding missing variables). The numbers of respondents who were prepared to pay extra
for fair trade coffee was 98,1% (excluding missing variables). The high percentage of
respondents that were prepared to pay extra for fair trade coffee shows that the risk of a result
created by coincidence is very small. The price that was the most frequent one was 2€, which
51
was the price that 18 respondents could pay extra for 1 kg fair trade coffee out of 59
respondents.
Hypothesis number four is accepted since the mean and median are above 0€ and since 98,1%
of the respondents are prepared to pay more for a fair trade coffee. Consumers are willing to
pay more for a product that is co branded with fair trade.
5.8.1DiscussionandanalysisofHypothesis4
This hypothesis shows that people are willing to pay extra to get fair trade coffee. This
indicates that fair trade has an extra value that consumers are willing to pay extra for to
obtain. The brands perception is the total impression that customers have of a brand, based on
their exposure of the brand (Van Gelder, 2003). The fact that consumers find an extra value in
the product affect the total impression of the brand and therefore also the position of the
product in consumers’ minds. The position will go from being a regular coffee product to
delivering something more than just coffee.
When looking at the age of our respondents we have a very low average age, 78.6 % is under
25 years. The generation Y is consumers born between 1985-1993 (Schiffman & Kanuk,
2004). This means that 78.6 % of our respondents belong to generation Y. As mentioned
earlier generation Y is savvy and pragmatic. They are also value oriented which means that
they are comparing price against quality when deciding to purchase a product (ibid). This
could be an explanation why 98.1 % were willing to pay extra for the fair trade coffee. Since
generation Y is not just looking at the price like generation X does. Instead they compare the
value that they get for the price it cost. This could be the reason why our respondents are
willing to pay extra to get the fair trade coffee.
The respondents that did not choose the coffee with the fare trade logo were still willing to
pay extra for the fair trade product. This shows that the fair trade logo still ads value for
customers that do not buy fair trade coffee today. To summarize it almost all of our
respondents are willing to pay extra for fair trade. The fair trade logo ads extra value to the
coffee, which affects consumers’ behavior in the way that they are willing to pay more and
their brand perception changes. With brand perception we mean that the new value creates a
new perception of the brand in the consumers mind.
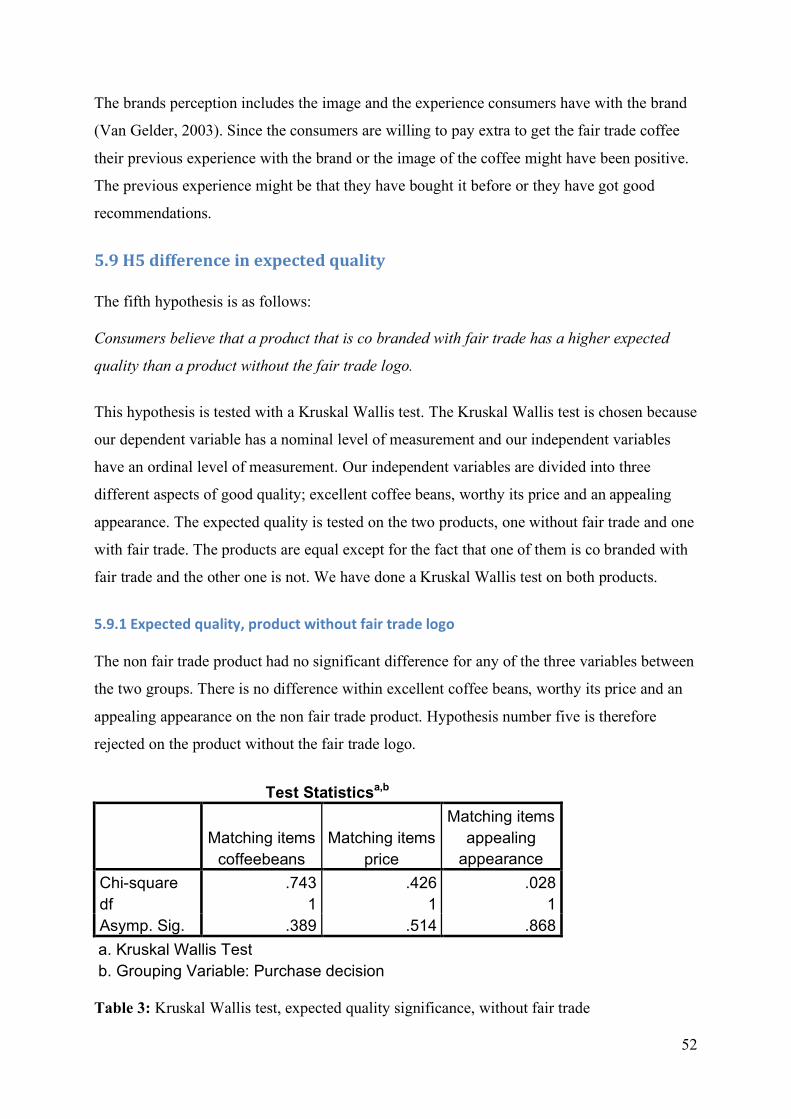
52
The brands perception includes the image and the experience consumers have with the brand
(Van Gelder, 2003). Since the consumers are willing to pay extra to get the fair trade coffee
their previous experience with the brand or the image of the coffee might have been positive.
The previous experience might be that they have bought it before or they have got good
recommendations.
5.9H5differenceinexpectedquality
The fifth hypothesis is as follows:
Consumers believe that a product that is co branded with fair trade has a higher expected
quality than a product without the fair trade logo.
This hypothesis is tested with a Kruskal Wallis test. The Kruskal Wallis test is chosen because
our dependent variable has a nominal level of measurement and our independent variables
have an ordinal level of measurement. Our independent variables are divided into three
different aspects of good quality; excellent coffee beans, worthy its price and an appealing
appearance. The expected quality is tested on the two products, one without fair trade and one
with fair trade. The products are equal except for the fact that one of them is co branded with
fair trade and the other one is not. We have done a Kruskal Wallis test on both products.
5.9.1Expectedquality,productwithoutfairtradelogo
The non fair trade product had no significant difference for any of the three variables between
the two groups. There is no difference within excellent coffee beans, worthy its price and an
appealing appearance on the non fair trade product. Hypothesis number five is therefore
rejected on the product without the fair trade logo.
Test Statisticsa,b
Matching items coffeebeans
Matching items price
Matching items appealing
appearance Chi-square .743 .426 .028 df 1 1 1 Asymp. Sig. .389 .514 .868 a. Kruskal Wallis Test b. Grouping Variable: Purchase decision
Table 3: Kruskal Wallis test, expected quality significance, without fair trade
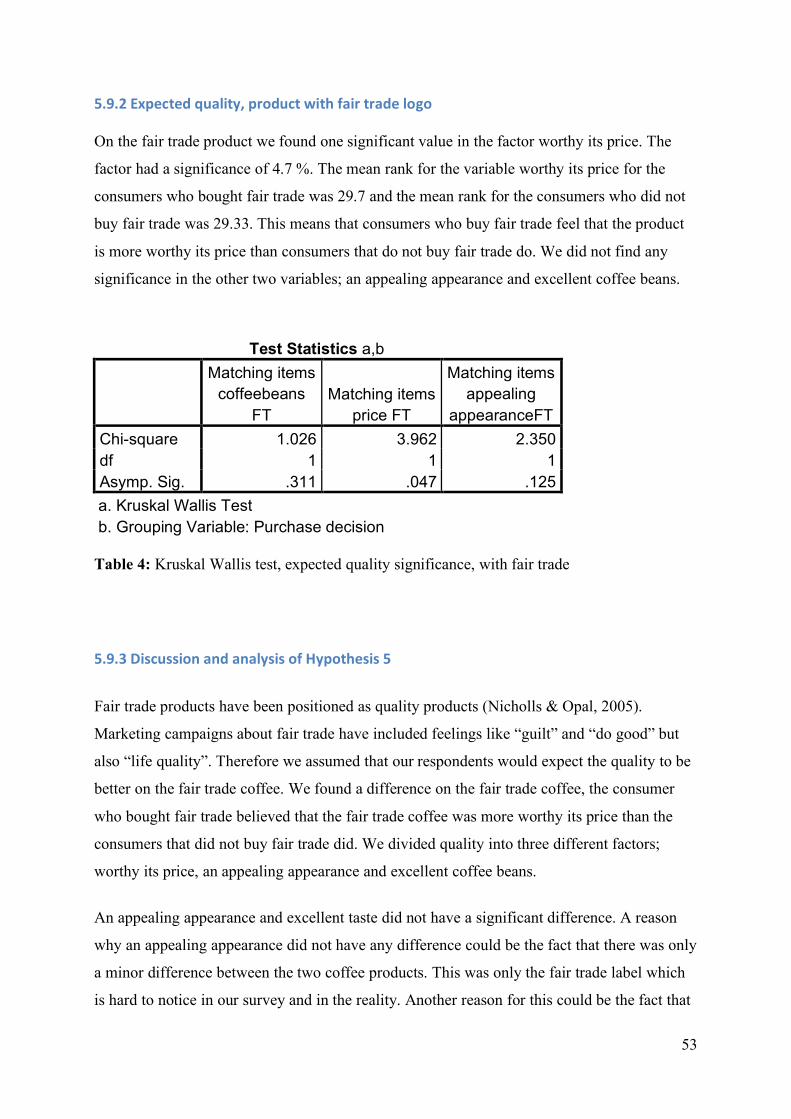
53
5.9.2Expectedquality,productwithfairtradelogo
On the fair trade product we found one significant value in the factor worthy its price. The
factor had a significance of 4.7 %. The mean rank for the variable worthy its price for the
consumers who bought fair trade was 29.7 and the mean rank for the consumers who did not
buy fair trade was 29.33. This means that consumers who buy fair trade feel that the product
is more worthy its price than consumers that do not buy fair trade do. We did not find any
significance in the other two variables; an appealing appearance and excellent coffee beans.
Test Statistics a,b
Matching items
coffeebeans FT
Matching items price FT
Matching items appealing
appearanceFT Chi-square 1.026 3.962 2.350 df 1 1 1 Asymp. Sig. .311 .047 .125 a. Kruskal Wallis Test b. Grouping Variable: Purchase decision
Table 4: Kruskal Wallis test, expected quality significance, with fair trade
5.9.3DiscussionandanalysisofHypothesis5
Fair trade products have been positioned as quality products (Nicholls & Opal, 2005).
Marketing campaigns about fair trade have included feelings like “guilt” and “do good” but
also “life quality”. Therefore we assumed that our respondents would expect the quality to be
better on the fair trade coffee. We found a difference on the fair trade coffee, the consumer
who bought fair trade believed that the fair trade coffee was more worthy its price than the
consumers that did not buy fair trade did. We divided quality into three different factors;
worthy its price, an appealing appearance and excellent coffee beans.
An appealing appearance and excellent taste did not have a significant difference. A reason
why an appealing appearance did not have any difference could be the fact that there was only
a minor difference between the two coffee products. This was only the fair trade label which
is hard to notice in our survey and in the reality. Another reason for this could be the fact that
54
we have used the same coffee brand on both the fair trade product and the non fair trade
product namely Douwe Egberts. The fact that we used the same brand might have created
similar feelings to the products. The respondents could also have given more attention to the
price difference than the fair trade logo when looking at the two pictures. The result on the
variable excellent coffee beans might be explained by the fact that consumers do not see any
difference on the coffee beans regarding fair trade or not.
The brand is well known in the Netherlands and therefore the respondents might already have
an opinion or a relationship to the brand, which could have reflected their response to the
variables excellent coffee beans and appealing appearance. A lot of the respondents already
had an opinion about the brand and therefore it might be the same even if it is a fair trade logo
or not.
The third variable worthy its price was accepted. This means that consumers who buy fair
trade coffee believe that a fair trade coffee is more worthy its price than consumers that do not
buy fair trade coffee do. Since they think that it is more worthy its price they might believe
that the coffee with fair trade has better quality than consumers that do not buy fair trade do.
The reason for this could be as mentioned in hypothesis number 1 that the consumers that buy
fair trade are more concerned about the environment and labor conditions when making a
purchase. Those factors might be a reason for why fair trade consumers feel that it is more
worthy its price.
5.10H6differenceinbrandpersonality
The sixth hypothesis is as follows:
Consumers perceive the brand personality different on a product that is co branded with fair
trade from a product without the fair trade label.
This hypothesis is tested with a Kruskal Wallis test. This test is chosen since we have two
dependent groups and the independent variables have an ordinal level of measurement. The
differences are tested first on the product without a fair trade logo and then on the product
with a fair trade logo. The independent variables are the brand personalities; sincerity,
excitement, sophistication, competence, peacefulness, passion and ruggedness.
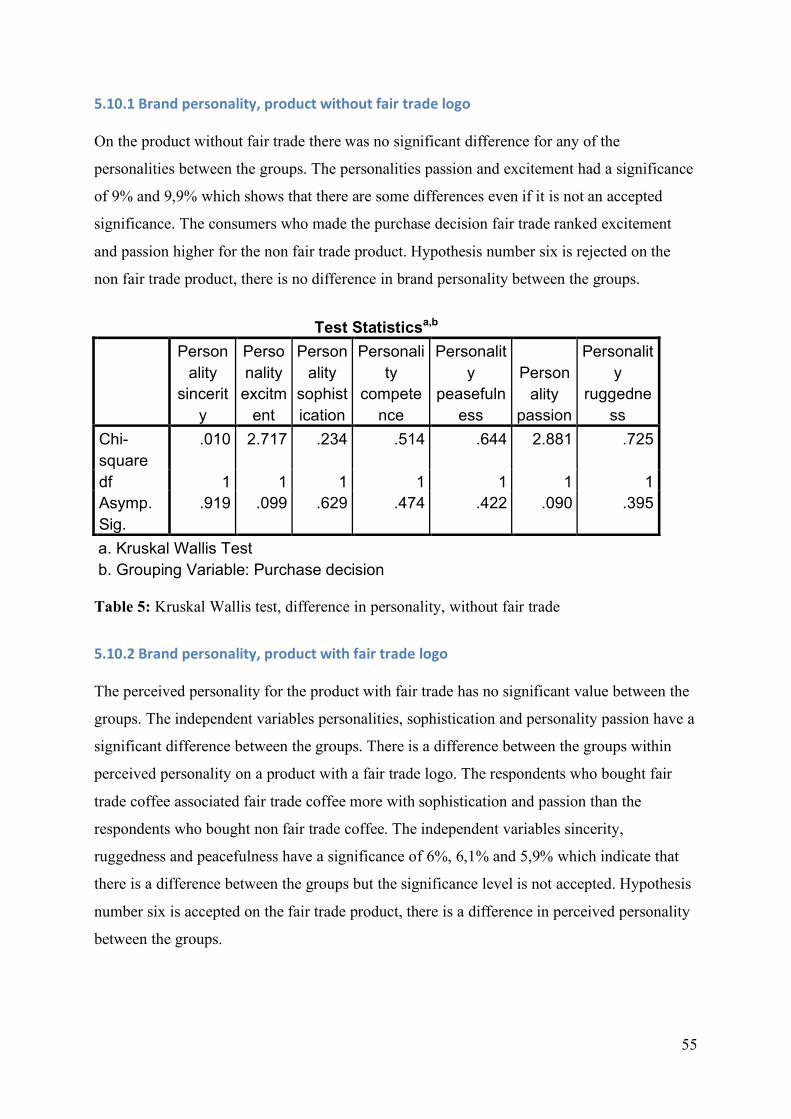
55
5.10.1Brandpersonality,productwithoutfairtradelogo
On the product without fair trade there was no significant difference for any of the
personalities between the groups. The personalities passion and excitement had a significance
of 9% and 9,9% which shows that there are some differences even if it is not an accepted
significance. The consumers who made the purchase decision fair trade ranked excitement
and passion higher for the non fair trade product. Hypothesis number six is rejected on the
non fair trade product, there is no difference in brand personality between the groups.
Test Statisticsa,b
Personality
sincerity
Personality
excitment
Personality
sophistication
Personality
competence
Personality
peasefulness
Personality
passion
Personality
ruggedness
Chi-square
.010 2.717 .234 .514 .644 2.881 .725
df 1 1 1 1 1 1 1 Asymp. Sig.
.919 .099 .629 .474 .422 .090 .395
a. Kruskal Wallis Test b. Grouping Variable: Purchase decision
Table 5: Kruskal Wallis test, difference in personality, without fair trade
5.10.2Brandpersonality,productwithfairtradelogo
The perceived personality for the product with fair trade has no significant value between the
groups. The independent variables personalities, sophistication and personality passion have a
significant difference between the groups. There is a difference between the groups within
perceived personality on a product with a fair trade logo. The respondents who bought fair
trade coffee associated fair trade coffee more with sophistication and passion than the
respondents who bought non fair trade coffee. The independent variables sincerity,
ruggedness and peacefulness have a significance of 6%, 6,1% and 5,9% which indicate that
there is a difference between the groups but the significance level is not accepted. Hypothesis
number six is accepted on the fair trade product, there is a difference in perceived personality
between the groups.
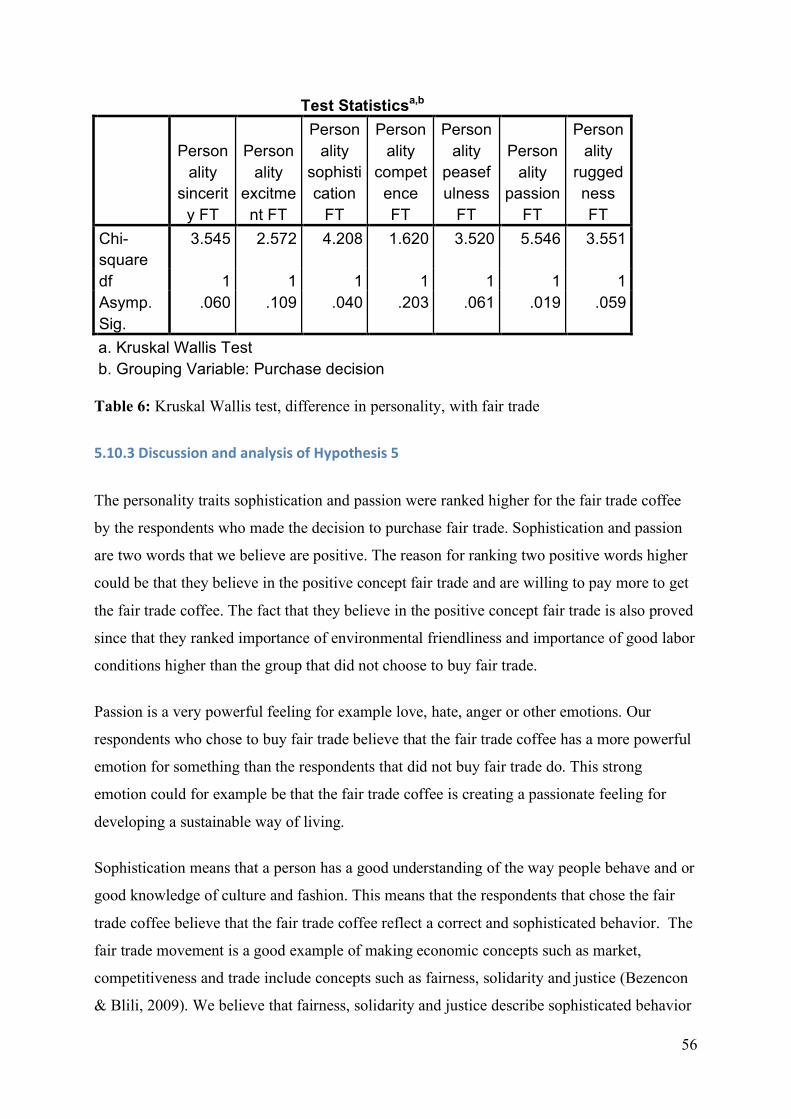
56
Test Statisticsa,b
Person
ality sincerit
y FT
Personality
excitment FT
Personality
sophistication
FT
Personality
competence FT
Personality
peasefulness
FT
Personality
passion FT
Personality
ruggedness FT
Chi-square
3.545 2.572 4.208 1.620 3.520 5.546 3.551
df 1 1 1 1 1 1 1 Asymp. Sig.
.060 .109 .040 .203 .061 .019 .059
a. Kruskal Wallis Test b. Grouping Variable: Purchase decision
Table 6: Kruskal Wallis test, difference in personality, with fair trade
5.10.3DiscussionandanalysisofHypothesis5
The personality traits sophistication and passion were ranked higher for the fair trade coffee
by the respondents who made the decision to purchase fair trade. Sophistication and passion
are two words that we believe are positive. The reason for ranking two positive words higher
could be that they believe in the positive concept fair trade and are willing to pay more to get
the fair trade coffee. The fact that they believe in the positive concept fair trade is also proved
since that they ranked importance of environmental friendliness and importance of good labor
conditions higher than the group that did not choose to buy fair trade.
Passion is a very powerful feeling for example love, hate, anger or other emotions. Our
respondents who chose to buy fair trade believe that the fair trade coffee has a more powerful
emotion for something than the respondents that did not buy fair trade do. This strong
emotion could for example be that the fair trade coffee is creating a passionate feeling for
developing a sustainable way of living.
Sophistication means that a person has a good understanding of the way people behave and or
good knowledge of culture and fashion. This means that the respondents that chose the fair
trade coffee believe that the fair trade coffee reflect a correct and sophisticated behavior. The
fair trade movement is a good example of making economic concepts such as market,
competitiveness and trade include concepts such as fairness, solidarity and justice (Bezencon
& Blili, 2009). We believe that fairness, solidarity and justice describe sophisticated behavior

57
in a good way and it is an explanation why our respondents associate the fair trade coffee with
sophistication.
Consumers that buy fair trade coffee look at the personality of the brand differently compared
to consumers that buy non fair trade coffee. When adding a fair trade logo to the coffee new
associations will be added to the coffee and a new brand personality will be developed. This
might give the coffee a different position in the consumers’ minds and could also possibly
attract a different target group. The product’s personality is often reflected by the personality
of the user (Kotler, 2008). So when adding fair trade to the product it will attract consumers
with a different personality. As our study showed, this personality will be a more passionate
and sophisticated consumer.
The personality traits that had no difference between the two groups were ruggedness,
sincerity, competence, excitement and peacefulness. The reason for this could be that for
some of the respondents that did not have English as a native language it could be difficult to
understand the meaning of the different personality traits. Another reason for not having any
difference could be that these traits could be hard to apply to a product like coffee.
5.11SummaryofempiricalfindingsConclusion of our hypotheses
H1: The reason for buying a product that is co branded with fair trade differs from buying a product without the fair trade logo.
Ordinal Kruskal wallis test
Accepted Accepted: environment, importance of labor conditions and importance of price. Rejected: taste and brand. H1: accepted.
H2: Consumers are using a different source of information when buying a product that is co branded with fair trade compared to buying a product without the fair trade logo.
Nominal chi square Rejected All variables rejected
H3: Co branded products with fair trade have a higher purchase frequency compared to products without the fair trade logo.
Nominal Kruskal wallis test
Rejected Rejected
H4: Consumers are willing to pay more for a product that is co branded with fair trade than for a product without the fair trade logo.
Scale Frequency test
Accepted Accepted
H5: Consumers believe that a product that is co branded with fair trade has a higher expected quality than a product without the fair trade logo.
Nominal Kruskal Wallis test
Accepted The fair trade product is accepted on worthy its price and the non fair trade product is rejected.
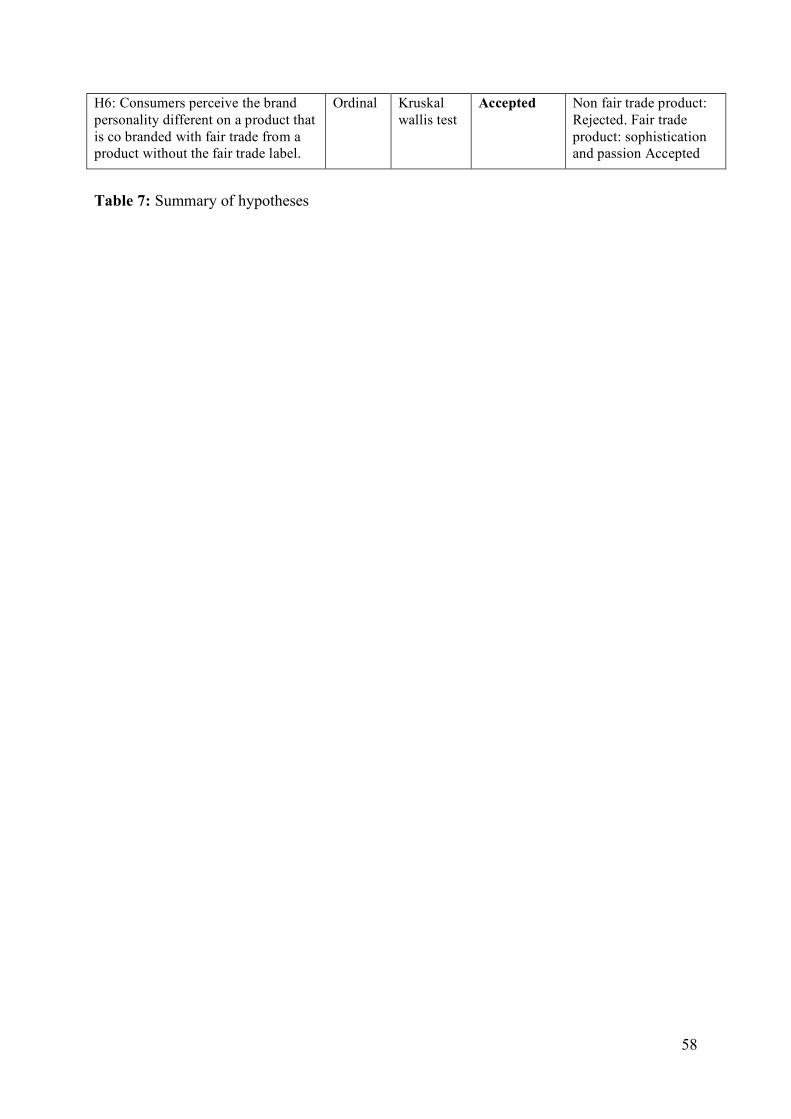
58
H6: Consumers perceive the brand personality different on a product that is co branded with fair trade from a product without the fair trade label.
Ordinal Kruskal wallis test
Accepted Non fair trade product: Rejected. Fair trade product: sophistication and passion Accepted
Table 7: Summary of hypotheses
59
6Conclusion
In this chapter our conclusions from our empirical findings will be presented. These will end
up in an overall conclusion of consumer behavior and co branding with fair trade. There will
also be a paragraph about the criticism that we have against our dissertation. Finally we will
also present some future research within our chosen field of study.
6.1Discussionandconclusionsoffindings
From the theoretical review we decided to use Kotler’s buying behavior process model. This
model is divided into the following steps; need recognition, information search, evaluation of
alternatives, purchase decision and post purchase behavior. These factors are tested with the
following variables reason for buying; source of information, purchase frequency, price
sensitivity and expected quality. Except for these five variables we have also used an
additional variable called brand personality were we test the consumers’ perceived
personalities.
Our research showed that there was a difference in reason for buying. Consumers who bought
fair trade value the importance for the environment and labor conditions higher than
consumers that bought non fair trade. There was also a difference between the groups when it
comes to importance of price. Consumers who bought fair trade were less price sensitive than
consumers that bought non fair trade. The two variables that did not differ between the two
groups (buy fair trade or not fair trade) were the importance of taste and the importance of
brand.
The next difference we found was within perceived personality on the fair trade coffee.
Consumer who bought fair trade linked the traits passion and sophistication to the fair trade
coffee more than consumers who did not buy fair trade. There was no difference in the other
five personality traits ruggedness, peacefulness, competence, excitement and sincerity. We
also found that consumers are willing to pay extra for coffee that is co branded with fair trade.
There was no difference between the two groups concerning whether they searched for
information before the purchase or not. There was also no difference in which sources of
information they used. All consumers had the same purchase frequency, regardless of interest
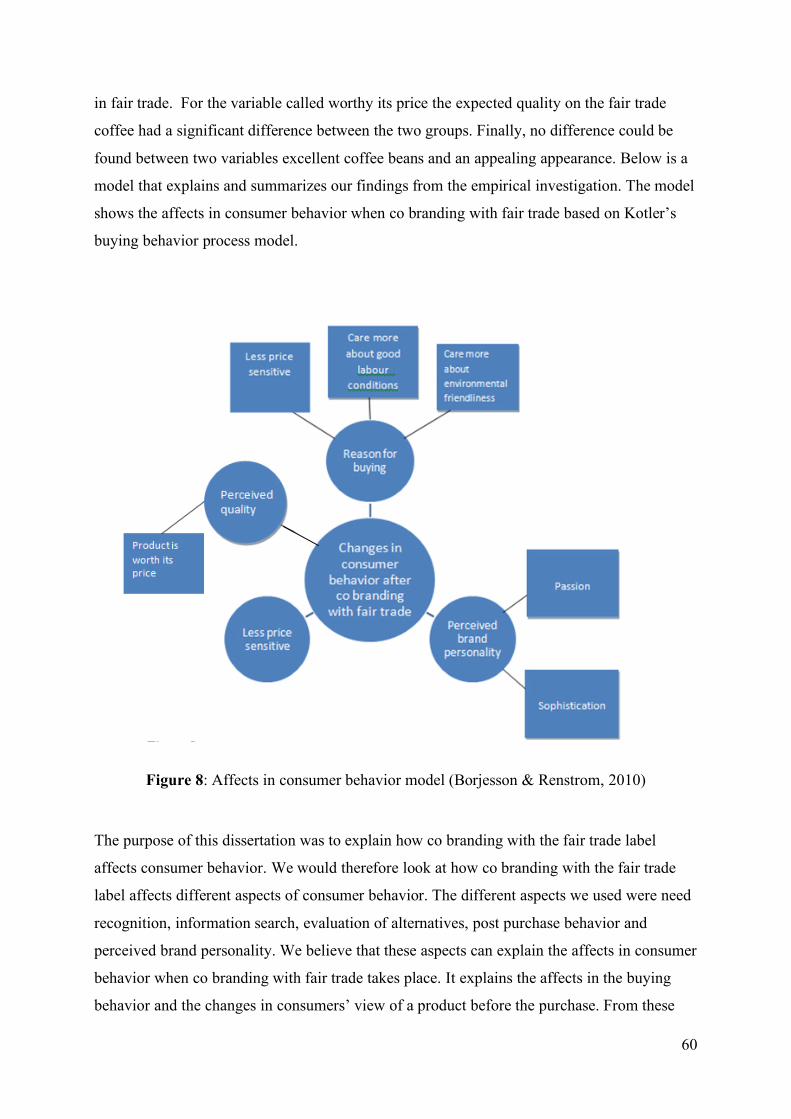
60
in fair trade. For the variable called worthy its price the expected quality on the fair trade
coffee had a significant difference between the two groups. Finally, no difference could be
found between two variables excellent coffee beans and an appealing appearance. Below is a
model that explains and summarizes our findings from the empirical investigation. The model
shows the affects in consumer behavior when co branding with fair trade based on Kotler’s
buying behavior process model.
Figure 8: Affects in consumer behavior model (Borjesson & Renstrom, 2010)
The purpose of this dissertation was to explain how co branding with the fair trade label
affects consumer behavior. We would therefore look at how co branding with the fair trade
label affects different aspects of consumer behavior. The different aspects we used were need
recognition, information search, evaluation of alternatives, post purchase behavior and
perceived brand personality. We believe that these aspects can explain the affects in consumer
behavior when co branding with fair trade takes place. It explains the affects in the buying
behavior and the changes in consumers’ view of a product before the purchase. From these

61
aspects we found four variables that affected consumer behavior. These four variables are
price sensitivity, reason for buying, expected quality and perceived brand personality.
The research question was to investigate how co branding with the fair trade label affects
consumer behavior. Our conclusion is that there are four variables that affect consumer
behavior in different ways when co branding with fair trade takes place. As previously
mentioned these are price sensitivity, reason for buying, expected quality and perceived brand
personality.
6.2Practicallimitations
We mentioned in the beginning of our dissertation that the goal for our dissertation was to
find new approaches to the theory that connects co branding with fair trade to consumer
behavior. There is an academic gap in theories that connect consumer behavior to co branding
with fair trade. Our dissertation has therefore established an academic value by adding new
theory within these fields of study. We have investigated the affects in consumer behavior
when co branding with fair trade, something that has never been done before.
Our findings may lead to an increased awareness for companies and organizations about the
effects of co branding with fair trade. Our result can be used in marketing strategies for
companies and organizations that are co branding their product with fair trade, since we
indicated the differences in consumer behavior when co branding with fair trade. Our findings
can also be used as a base for making decisions when deciding to start a cooperation with or
without fair trade.
6.3Criticism
The first criticism we have is that the reader of this dissertation may not interpret the
cooperation between the brand and the fair trade label as co branding. As mentioned earlier in
this dissertation researchers have different opinions about this, but we have chosen to look at
it as co branding.
Consumer behavior is a very wide concept and we have chosen to narrow it down to Kotler’s
buying behavior model and Van Gelder’s brand personality model. Therefore we have
excluded parts within consumer behavior, which the reader might consider as important. We
believe that the chosen model covers the most important parts of consumer behavior when it
comes to answering our research question.
62
Another criticism that we have concerns our survey. Our respondents had to answer an
English survey. This might have an effect on the overall result since 71.4% of our respondents
were not native English speakers. Most of the respondents were also young, this could have
affected the research in some way. An explanation to this young sample group could be that
our research was conducted during a Dutch National holiday, called the Queen’s Day.
Queen’s Day is celebrated on the 30th of April every years and this holiday attracts young
people from all over Europe. We collected our data during six days, so this holiday might
have affected our result in some way. The length of our survey is also something that we have
to take into account since our respondents might have paid less attention to the second half of
the survey. We had a total of 95 respondents, and we used 70 of them. A bigger sample would
have given us a more reliable result to generalize.
6.4Futureresearch
One potential future research we see is that different aspects of consumer behavior can be
used. As mentioned earlier, we have concentrated on Kotler’s buying behavior process model
but there is also a model that describes which factors that influence consumer behavior (see
figure 4) that could be interesting to look at. This model could also give the researcher an
overall picture of how consumer behavior changes when co branding with fair trade.
It would also be interesting to conduct research in countries other than the Netherlands, and
also comparing results between different countries. Opinions might differ between countries,
something that previous research about consumer behavior between different countries
indicates.
We found that consumers that are concerned about the environment buy more fair trade
products, even if the fair trade concept does not handle environmental questions. It would be
interesting to look at similar organizations that work for a sustainable way of living such as
Svanenmärkt. It would also be interesting to research if consumers had the same perspective
for these types of organizations even if they work for a different cause than fair trade.
63
Bibliography
Aaker, D. A. and Joachimsthaler, E. (2000). Brand leadership. New York: The Free Press
Alexander, A. and Nicholls, A. (2006). Rediscovering consumer-producer involvement- A
network perspective on fair trade marketing. European Journal of Marketing, Vol. 40, No.
11/12.
Altinay, L. and Paraskevas, A. (2008). Planning Research in Hospitality and Tourism. 1st ed.
Oxford: Butterworth-Heinemann
Amsterdam.info (2010). Amsterdam info. [Online] Available from:
<http://www.amsterdam.info/sights/dam_square/> [Accessed 27 April 2010]
Babbie, E. (2010). The Practice of Social Research. Belmont: Wadsworth Cengage Learning
Baker, M. and Hart, S. (2003). The Marketing Book. Oxford: Elsevier Ltd
Begemann, F. (2006). Co branding as a Brand Strategy – An Analysis from the Resource-
based View. Germany: GRIN Verlag
Bezencon, V. and Blili, S. (2009). Fair trade managerial practices Strategy, Organization
and Engagement. Journal of Business Ethics, Vol. 90, No. 1.
Bryman, A. and Bell, E. (2007). Business research method. 2nd ed. Oxford: Oxford University
Press
Cohen, L., Manion, L. and Morrison, K. (2003). Research methods in education. London:
RoutledgeFalmer
Curry, A. and Curry, J. (2000). The customer marketing method. New York: The free press
Creswell, J.W. (2009). Research Design: Qualitative, Quantitative, and Mixed Methods
Approaches. London: Sage Publications Ltd
De Ferran, F. and Grunert, K. (2007). French fair trade coffee buyers purchasing motives:
64
An exploratory study using means-end chains analysis. Food Quality and Preference, Vol. 18,
No, 2.
Easterby-Smith, M., Thorpe, R. and Lowe, A. (2002). Management research: an introduction.
2nd ed. London: Sage Publications Ltd
Fair trade Labeling Organizations International., (2010). Fair trade. [Online] Available from:
< http://www.fairtrade.net/about_fairtrade.html> [Accessed 3 February 2010]
Fair trade Labeling Organizations International., (2007). Fair trade. [Online] Available from:
<http://www.fairtrade.org.uk/press_office/press_releases_and_statements/archive_2007/feb_2
007/hot_beverage_business_piping_hot_in_the_run_up_to_fairtrade_fortnight.aspx >
[Accessed 3 February 2010]
Frauendorf, J. (2006). Customer Processes in Business-to-Business Service Transactions.
Wiesbaden: GWV Fachverlage GmbH
Gratton, C. and Jones, I. (2004). Research Methods for sport studies. London: Routledge
Gray, D.E. (2004). Doing research in the real world. London: Sage Publications Ltd
Haugtvedt, C. P., Herr, P. M. and Kardes, F. R. (2008). Handbook of consumer psychology.
New York: Taylor & Francis Group
Heding, T., Knudtzen, C. and Bjerre, M. (2009). Brand Management: Theory and Practice.
New York: Routledge
Hoyer, W. and Macinnis, D. (2008). Consumer behavior.5th ed. Mason: South Western
Cengage Learning
Jacobssen, D. (2002). Vad, hur och varför. Lund: Studentlitteratur
Kapferer, J-N. (2009). The new strategic brand management: Creating and Sustaining Brand
Equity Long Term. 4th ed. London: MPG Books Ltd
Keller, K. L. and Kotler, P. (2005). Marketing management. 12th ed. Upper Saddle River, NJ:
Pearson Prentice Hall
65
Kim, W., Lee, S. and Lee, H. (2007). Co branding and Brand Loyalty. Journal of Quality
Assurance in Hospitality & Tourism, Vol. 8, No. 2.
Kotler, P. (2008). Principles of marketing International edition. 12th ed. Upper Saddle River:
Pearson education international
Kumar, R. (2005). Research methodology: a step by step guide for beginners. London: Sage
publications Inc
Kurtz, D., MacKenzie, H.F. and Snow, K. (2009). Contemporary Marketing. Toronto: Nelson
Education Inc
Lamb, C.W., Hair, J.F. and McDaniel, C. (2008). Essentials of Marketing. 6th ed. Mason:
South-Western Cengage Learning.
Levi, M. and Linton, A. (2003). A cup at a time?. Politics & Society, Vol. 31, No. 3.
Low, W. and Davenport, E. (2005). Has the medium (roast) become the message?
International Marketing Review, Vol. 22, No. 5.
Maseland, R. and De Vaal, A. (2002). How Fair is Fair Trade?, De Economist, Vol.150, No.
3.
Mackey, A. and Gass, S. (2005). Second Language Research: Methodology and Design.
Mataffaren. (2010). Mataffaren. [Online] Available from: < http://www.mataffaren.se/ >
[Accessed 17 February 2010]
McKee, S. (2009). The Pros and Cons of Co branding. Business Week, 10th July.
McLoughlin, D. and Aaker, D. (2010). Strategic Market Management: Global Perspectives.
West Sussex: John Wiley & sons Ltd
Mengkuan, L. (2005). Asia Pacific Advances in Consumer Research Volume 6, Taiwan:
National Chengkung University
Moser, M. (2003). United we brand: how to create a cohesive brand that’s seen heard and
remembered. Boston: Harvard Business School Press
66
Muijis, D. (2004). Doing quantitative research in education with SPSS. London: Sage
publications Ltd
Munhall, P. (2007). Nursing research: a qualitative perspective. London:Jones and Bartlett
Publishers, Inc.
Newman, I. and Benz, C. (1998). Qualitative-quantitative research methodology: exploring
the interactive continuum. Illinois: The board of Trustees Southern Illinios University
Nicholls, A. and Opal, C. (2005). Fair trade market-driven ethical consumption. London:
SAGE publications Ltd
Paton, R. (2006). Fair trade matters. [Online] Available from:
<http://www.open2.net/money/briefs_20060310_fair trade.html> [Accessed: 17 March 2010]
Ranyard, R., Crozier, R. and Svensson, O., (2001). Decision making: cognitive models and
explanations. New York: Routledge
Saunders, M., Lewis, P. and Thornhill, A. (2007). Research methods for business students. 4th
ed. Essex: Pearson Education Limited
Schiffman, L. G., Hansen, H. and Kanuk, L. L. (2007). Consumer Behavior: A European
Outlook. Harlow: Pearson Education Limited
Schiffman, L.G. and Kanuk, L.L. (2004). Consumer behavior. London: Pearson Education
Schultz, D. and Schultz, H. (2004). IMC, the next generation: five steps for delivering value
and measuring returns using marketing communication. New York: McGraw-Hill
Schwab, D. (2008). Research methods for organizational studies. New Jersey: Lawrence
Erlbam Associates Inc
Semenik, R. (2007). Promotion and integrated marketing communications 1st edition. United States: An Academic Internet Publisher
Solomon, M., Bamossy, G., Askegaard, S. and Hoog, M.K. (2008). Consumer Behavior a
European prospective 3th ed. Harlow: Pearson education limited
67
Strong, C. (1997). The problems of translating fair trade principles into consumer purchase
behavior. Marketing Intelligence and Planning, Vol. 15, No.1
Van Gelder, S. (2003). Global Brand Strategy. London: Kogan page limited
Walchli, S. (2007). The Effects of Between Partner Congruity on Consumer Evaluation of Co
branded Products. Psychology & Marketing, Vol. 24, No. 11.
Walliman, N. (2005). Your research project: a step-by-step guide for the first-time
researcher. 2nd ed. London: Sage publications Ltd
Woo Gon, K., Soojin, L. and Hae Young, L. (2007). Co branding and Brand Loyalty - Journal
Woolliams, P. (2004). Marketing across cultures Chichester: Capstone Publishing Ltd

68
Appendix 1, Questionnaire
1. My gender is Female Male
2. I am_____years old.
3. My native language is ____________________
4. My highest level of education is (tick one of the boxes)
Less than high school High school Some college (no degree)
Bachelor degree Master-level degree Doctorate level degree
5. I drink coffee
Yes No
6. I buy coffee in the supermarket (tick one of the boxes)
Once a week Once every second week Once a month
Every other month Every third month I don’t know
Less than every third month
7. I have seen this fair trade logo on a product (see picture on a separate piece of paper)
Yes No I don’t know
If No go to question number 10
8. I have bought coffee with this logo on it
Yes No I don’t know
If your answer was I do not know or No go to question number 10
9. The choice to buy fair trade coffee was made
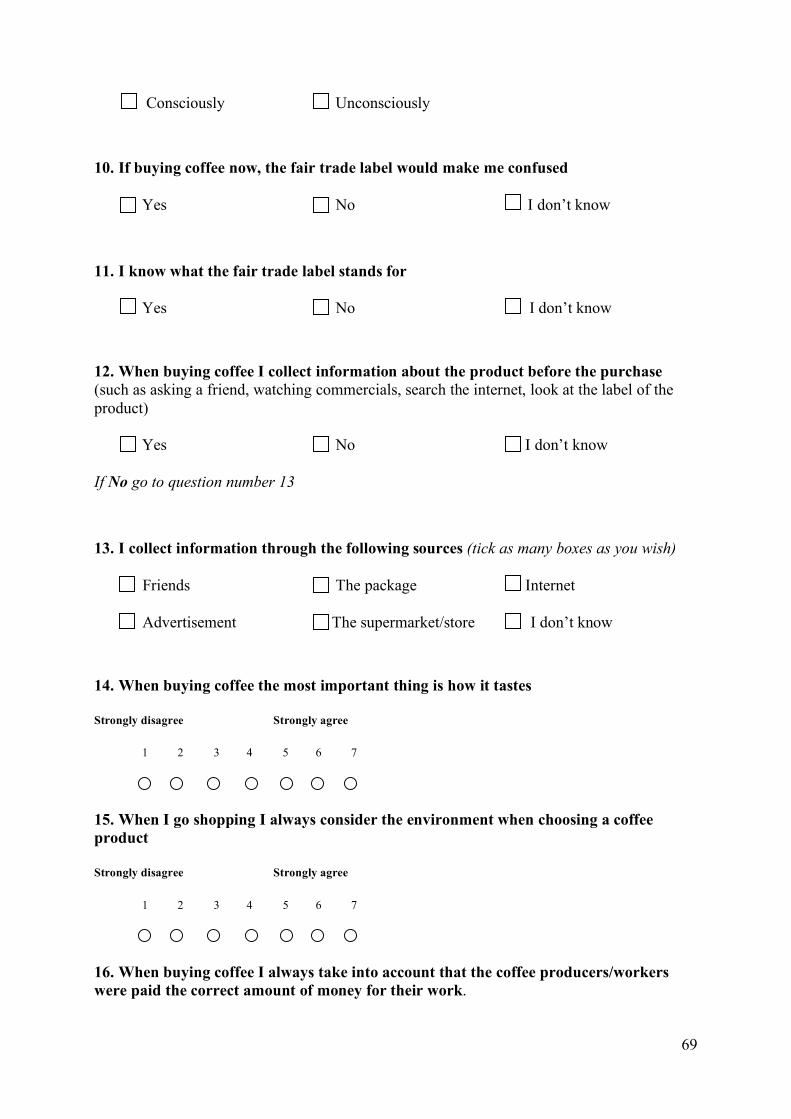
69
Consciously Unconsciously
10. If buying coffee now, the fair trade label would make me confused
Yes No I don’t know
11. I know what the fair trade label stands for
Yes No I don’t know
12. When buying coffee I collect information about the product before the purchase (such as asking a friend, watching commercials, search the internet, look at the label of the product)
Yes No I don’t know
If No go to question number 13
13. I collect information through the following sources (tick as many boxes as you wish)
Friends The package Internet
Advertisement The supermarket/store I don’t know
14. When buying coffee the most important thing is how it tastes
Strongly disagree Strongly agree
1 2 3 4 5 6 7
15. When I go shopping I always consider the environment when choosing a coffee product
Strongly disagree Strongly agree
1 2 3 4 5 6 7
16. When buying coffee I always take into account that the coffee producers/workers were paid the correct amount of money for their work.
70
Strongly disagree Strongly agree
1 2 3 4 5 6 7
17. When buying coffee in a supermarket I always look at the price
Strongly disagree Strongly agree
1 2 3 4 5 6 7
18. When buying the coffee the most important thing is the brand
Strongly disagree Strongly agree
1 2 3 4 5 6 7
19. When choosing between an 1kg fair trade coffee and an 1kg non fair trade coffee I am willing to pay this much extra to get the fair trade coffee__________€
20. When looking at picture number 1, I believe that the product possesses the following personality (see picture on a separate piece of paper)
Sincerity
Strongly disagree Strongly agree
1 2 3 4 5 6 7
Excitement
Strongly disagree Strongly agree
1 2 3 4 5 6 7
Sophistication
Strongly disagree Strongly agree
1 2 3 4 5 6 7
71
Competence
Strongly disagree Strongly agree
1 2 3 4 5 6 7
Peacefulness
Strongly disagree Strongly agree
1 2 3 4 5 6 7
Passion
Strongly disagree Strongly agree
1 2 3 4 5 6 7
Ruggedness
Strongly disagree Strongly agree
1 2 3 4 5 6 7
21. When looking at picture number 2, I believe that the product possesses the following personality (see picture on a separate piece of paper)
Sincerity
Strongly disagree Strongly agree
1 2 3 4 5 6 7
Excitement
Strongly disagree Strongly agree
1 2 3 4 5 6 7
Sophistication
Strongly disagree Strongly agree
72
1 2 3 4 5 6 7
Competence
Strongly disagree Strongly agree
1 2 3 4 5 6 7
Peacefulness
Strongly disagree Strongly agree
1 2 3 4 5 6 7
Passion
Strongly disagree Strongly agree
1 2 3 4 5 6 7
Ruggedness
Strongly disagree Strongly agree
1 2 3 4 5 6 7
22. When looking at picture nr 1, I believe that the following items match the product
Excellent Strongly disagree Strongly agree
coffee-beans 1 2 3 4 5 6 7
Worthy its price Strongly disagree Strongly agree
1 2 3 4 5 6 7
An appealing Strongly disagree Strongly agree
appearance 1 2 3 4 5 6 7
73
23. When looking at picture nr 2, I believe that the following items match the product
Excellent Strongly disagree Strongly agree
coffee-beans 1 2 3 4 5 6 7
Worthy its price Strongly disagree Strongly agree
1 2 3 4 5 6 7
An appealing Strongly disagree Strongly agree
appearance 1 2 3 4 5 6 7
The story about the coffee
Coffee number 1 (see picture number 1): This coffee is a very rich, aromatic and flavourful coffee, with a medium roast. The coffee beans that the coffee is made out of are called Arabica coffee beans and they are cultivated in Latin America. The price for this product is 2.90 €.
Coffee number 2 (see picture number 2): This coffee contains the same quality in coffee as coffee number 1, the price for this coffee is 4.29€. The difference about this coffee is that it is fair trade and has a fair trade logo on it.
24. If I was in a shopping situation I would choose to buy
Coffee number 1 Coffee number 2 I don’t know None one of them
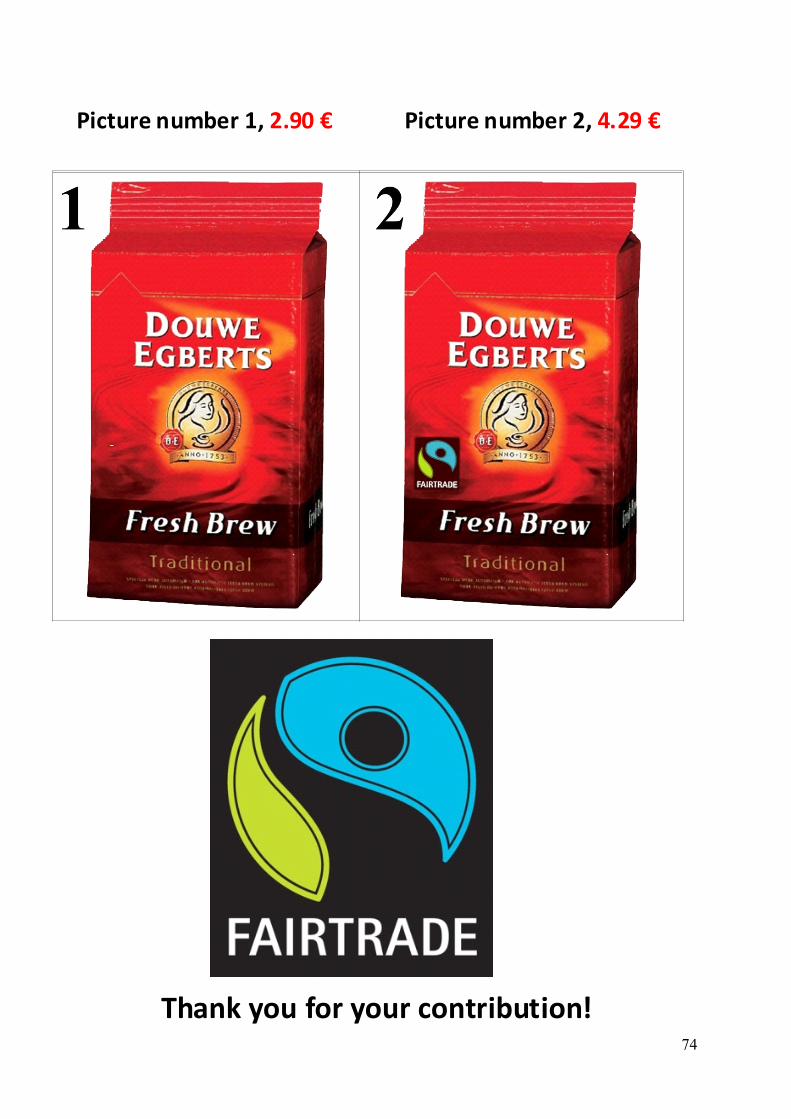
74
Picturenumber1,2.90€ Picturenumber2,4.29€
Thankyouforyourcontribution!

75
Appendix 2, Tables
Table 8: Descriptive statistics of our respondents
Descriptive Statistics N Minimum Maximum Mean Std. Deviation
Gender 70 1 2 1.43 .498 Age 70 14 70 25.66 9.808 Native language 70 1 8 3.54 2.104 Level of education 68 2 5 3.43 .935 Valid N (listwise) 68
Table 9: gender
Gender
Frequency Percent Valid Percent
Cumulative Percent
Female 40 57.1 57.1 57.1 Male 30 42.9 42.9 100.0
Valid
Total 70 100.0 100.0
Table 10: age structure our respondents
Age
Frequency Percent Valid Percent
Cumulative Percent
14 1 1.4 1.4 1.4 18 1 1.4 1.4 2.9 19 1 1.4 1.4 4.3 20 11 15.7 15.7 20.0 21 15 21.4 21.4 41.4 22 9 12.9 12.9 54.3 23 10 14.3 14.3 68.6 24 5 7.1 7.1 75.7 25 2 2.9 2.9 78.6 26 1 1.4 1.4 80.0 29 1 1.4 1.4 81.4 30 1 1.4 1.4 82.9 32 1 1.4 1.4 84.3 33 1 1.4 1.4 85.7
Valid
34 2 2.9 2.9 88.6
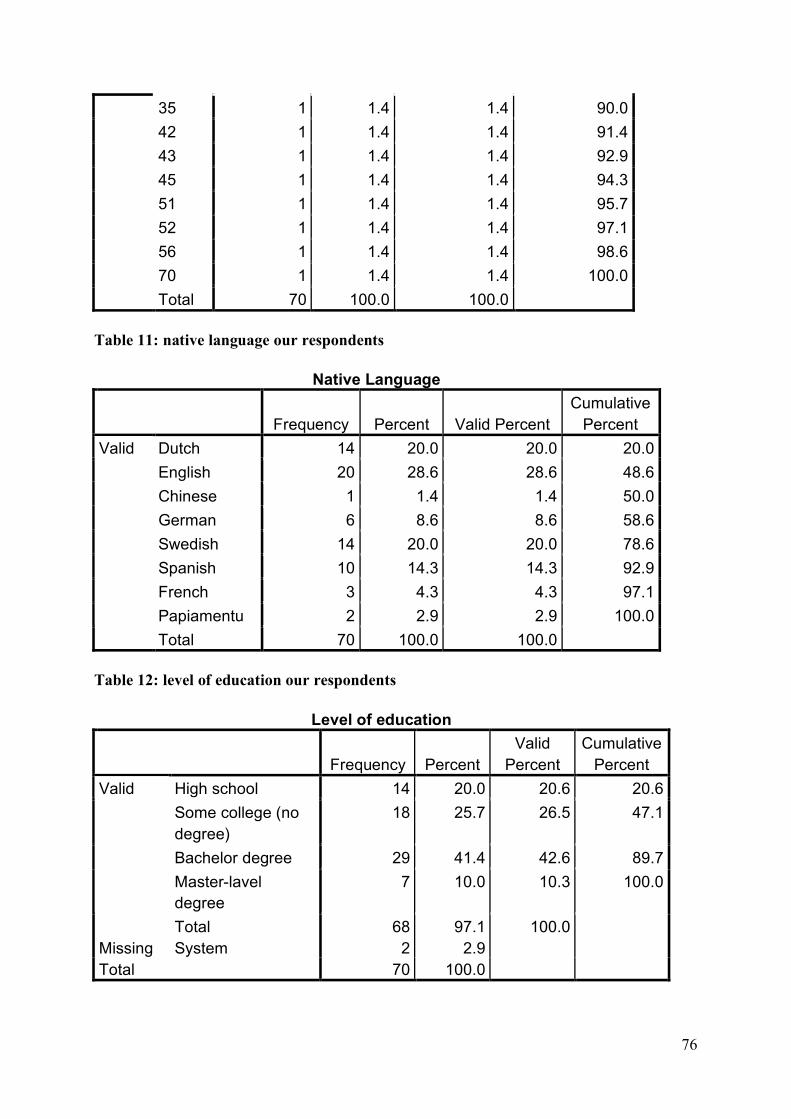
76
35 1 1.4 1.4 90.0 42 1 1.4 1.4 91.4 43 1 1.4 1.4 92.9 45 1 1.4 1.4 94.3 51 1 1.4 1.4 95.7 52 1 1.4 1.4 97.1 56 1 1.4 1.4 98.6 70 1 1.4 1.4 100.0
Total 70 100.0 100.0
Table 11: native language our respondents
Native Language
Frequency Percent Valid Percent
Cumulative Percent
Dutch 14 20.0 20.0 20.0 English 20 28.6 28.6 48.6 Chinese 1 1.4 1.4 50.0 German 6 8.6 8.6 58.6 Swedish 14 20.0 20.0 78.6 Spanish 10 14.3 14.3 92.9 French 3 4.3 4.3 97.1 Papiamentu 2 2.9 2.9 100.0
Valid
Total 70 100.0 100.0
Table 12: level of education our respondents
Level of education
Frequency Percent
Valid Percent
Cumulative Percent
High school 14 20.0 20.6 20.6 Some college (no degree)
18 25.7 26.5 47.1
Bachelor degree 29 41.4 42.6 89.7 Master-lavel degree
7 10.0 10.3 100.0
Valid
Total 68 97.1 100.0 Missing System 2 2.9 Total 70 100.0
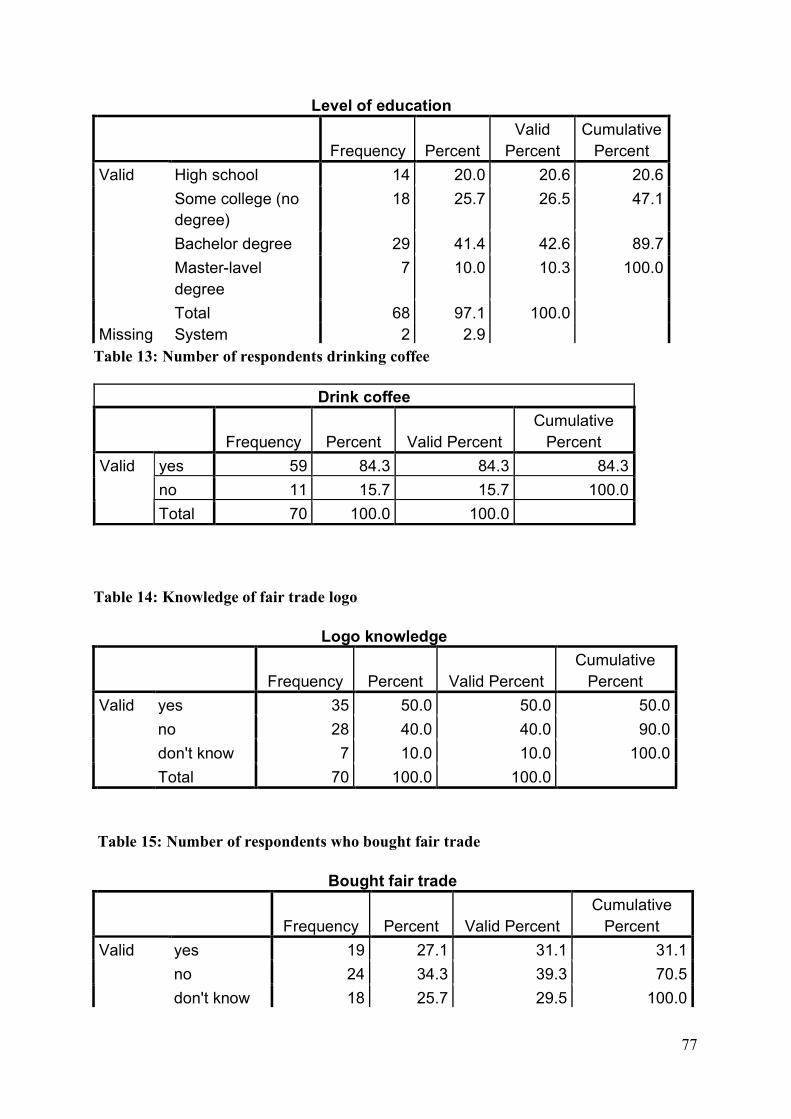
77
Level of education
Frequency Percent
Valid Percent
Cumulative Percent
High school 14 20.0 20.6 20.6 Some college (no degree)
18 25.7 26.5 47.1
Bachelor degree 29 41.4 42.6 89.7 Master-lavel degree
7 10.0 10.3 100.0
Valid
Total 68 97.1 100.0 Missing System 2 2.9
Table 13: Number of respondents drinking coffee
Drink coffee
Frequency Percent Valid Percent
Cumulative Percent
yes 59 84.3 84.3 84.3 no 11 15.7 15.7 100.0
Valid
Total 70 100.0 100.0
Table 14: Knowledge of fair trade logo
Logo knowledge
Frequency Percent Valid Percent
Cumulative Percent
yes 35 50.0 50.0 50.0 no 28 40.0 40.0 90.0 don't know 7 10.0 10.0 100.0
Valid
Total 70 100.0 100.0
Table 15: Number of respondents who bought fair trade
Bought fair trade
Frequency Percent Valid Percent
Cumulative Percent
yes 19 27.1 31.1 31.1 no 24 34.3 39.3 70.5
Valid
don't know 18 25.7 29.5 100.0
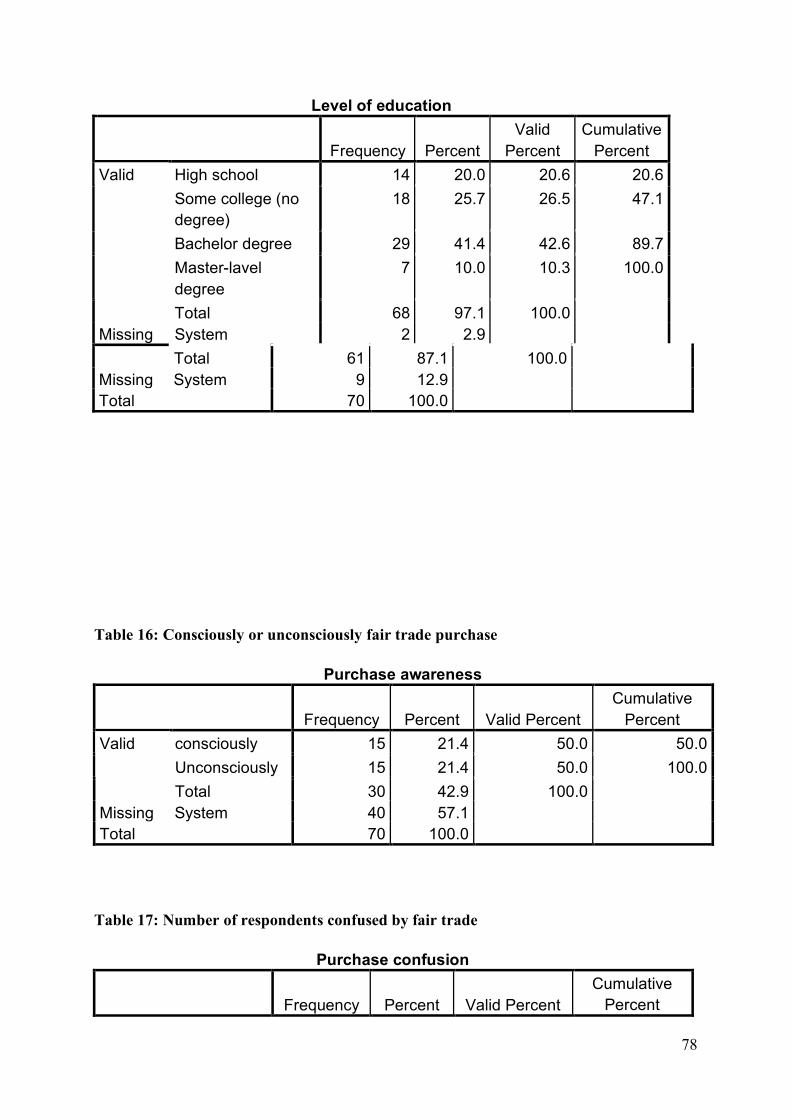
78
Level of education
Frequency Percent
Valid Percent
Cumulative Percent
High school 14 20.0 20.6 20.6 Some college (no degree)
18 25.7 26.5 47.1
Bachelor degree 29 41.4 42.6 89.7 Master-lavel degree
7 10.0 10.3 100.0
Valid
Total 68 97.1 100.0 Missing System 2 2.9 Total 61 87.1 100.0 Missing System 9 12.9 Total 70 100.0
Table 16: Consciously or unconsciously fair trade purchase
Purchase awareness
Frequency Percent Valid Percent
Cumulative Percent
consciously 15 21.4 50.0 50.0 Unconsciously 15 21.4 50.0 100.0
Valid
Total 30 42.9 100.0 Missing System 40 57.1 Total 70 100.0
Table 17: Number of respondents confused by fair trade
Purchase confusion
Frequency Percent Valid Percent
Cumulative Percent
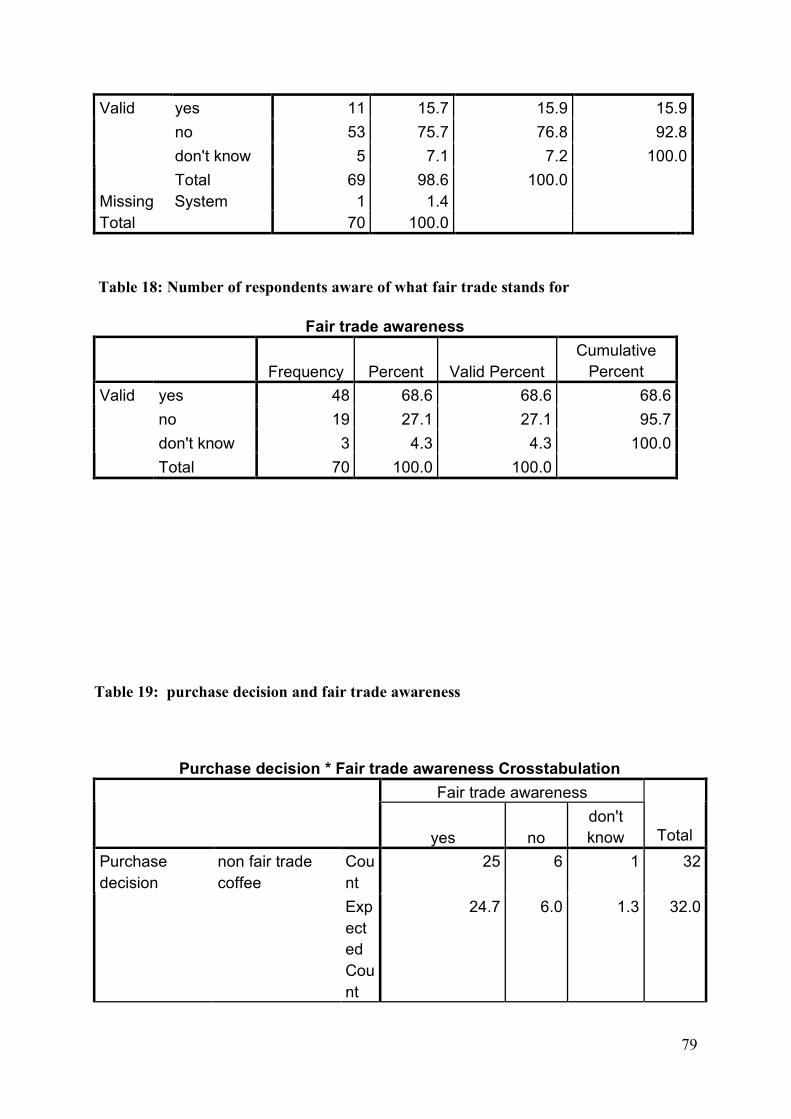
79
yes 11 15.7 15.9 15.9 no 53 75.7 76.8 92.8 don't know 5 7.1 7.2 100.0
Valid
Total 69 98.6 100.0 Missing System 1 1.4 Total 70 100.0
Table 18: Number of respondents aware of what fair trade stands for
Fair trade awareness
Frequency Percent Valid Percent
Cumulative Percent
yes 48 68.6 68.6 68.6 no 19 27.1 27.1 95.7 don't know 3 4.3 4.3 100.0
Valid
Total 70 100.0 100.0
Table 19: purchase decision and fair trade awareness
Purchase decision * Fair trade awareness Crosstabulation Fair trade awareness
yes no
don't know Total
Count
25 6 1 32 Purchase decision
non fair trade coffee
Expected Count
24.7 6.0 1.3 32.0
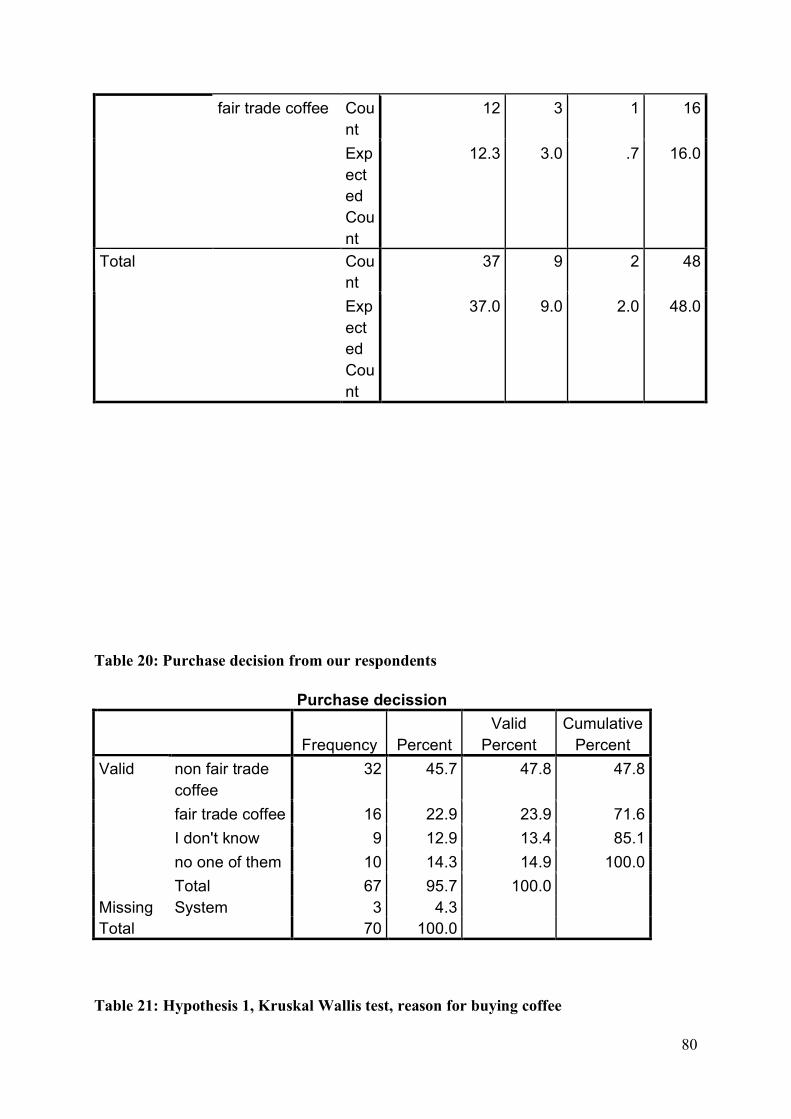
80
Count
12 3 1 16 fair trade coffee
Expected Count
12.3 3.0 .7 16.0
Count
37 9 2 48 Total
Expected Count
37.0 9.0 2.0 48.0
Table 20: Purchase decision from our respondents
Purchase decission
Frequency Percent
Valid Percent
Cumulative Percent
non fair trade coffee
32 45.7 47.8 47.8
fair trade coffee 16 22.9 23.9 71.6 I don't know 9 12.9 13.4 85.1 no one of them 10 14.3 14.9 100.0
Valid
Total 67 95.7 100.0 Missing System 3 4.3 Total 70 100.0
Table 21: Hypothesis 1, Kruskal Wallis test, reason for buying coffee
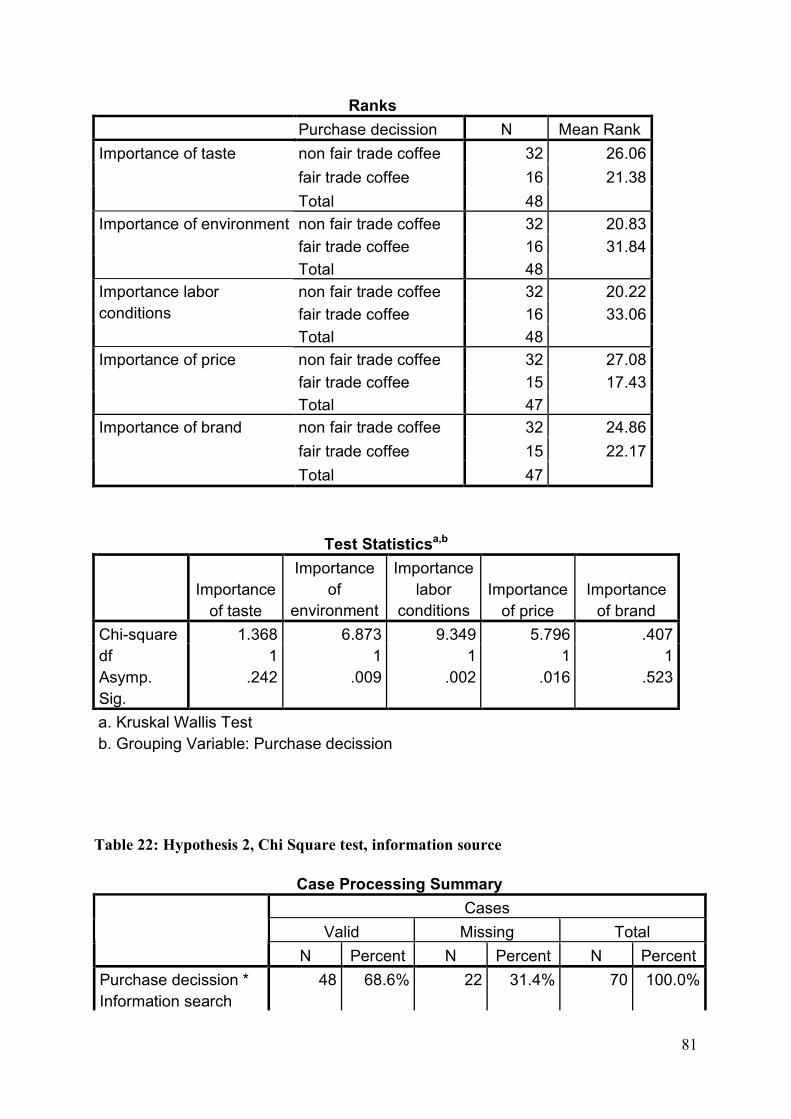
81
Ranks Purchase decission N Mean Rank
non fair trade coffee 32 26.06 fair trade coffee 16 21.38
Importance of taste
Total 48 non fair trade coffee 32 20.83 fair trade coffee 16 31.84
Importance of environment
Total 48 non fair trade coffee 32 20.22 fair trade coffee 16 33.06
Importance labor conditions
Total 48 non fair trade coffee 32 27.08 fair trade coffee 15 17.43
Importance of price
Total 47 non fair trade coffee 32 24.86 fair trade coffee 15 22.17
Importance of brand
Total 47
Test Statisticsa,b
Importance of taste
Importance of
environment
Importance labor
conditions Importance
of price Importance
of brand Chi-square 1.368 6.873 9.349 5.796 .407 df 1 1 1 1 1 Asymp. Sig.
.242 .009 .002 .016 .523
a. Kruskal Wallis Test b. Grouping Variable: Purchase decission
Table 22: Hypothesis 2, Chi Square test, information source
Case Processing Summary Cases
Valid Missing Total
N Percent N Percent N Percent Purchase decission * Information search
48 68.6% 22 31.4% 70 100.0%
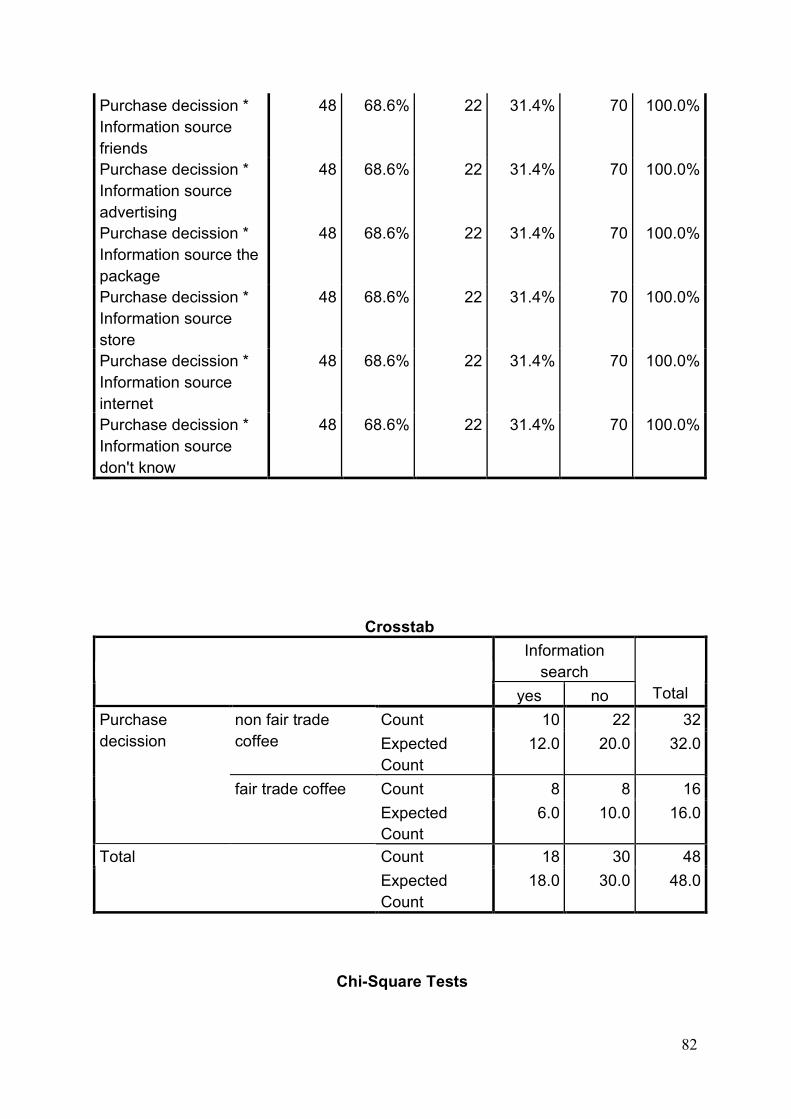
82
Purchase decission * Information source friends
48 68.6% 22 31.4% 70 100.0%
Purchase decission * Information source advertising
48 68.6% 22 31.4% 70 100.0%
Purchase decission * Information source the package
48 68.6% 22 31.4% 70 100.0%
Purchase decission * Information source store
48 68.6% 22 31.4% 70 100.0%
Purchase decission * Information source internet
48 68.6% 22 31.4% 70 100.0%
Purchase decission * Information source don't know
48 68.6% 22 31.4% 70 100.0%
Crosstab Information
search yes no Total
Count 10 22 32 non fair trade coffee Expected
Count 12.0 20.0 32.0
Count 8 8 16
Purchase decission
fair trade coffee Expected Count
6.0 10.0 16.0
Count 18 30 48 Total Expected Count
18.0 30.0 48.0
Chi-Square Tests
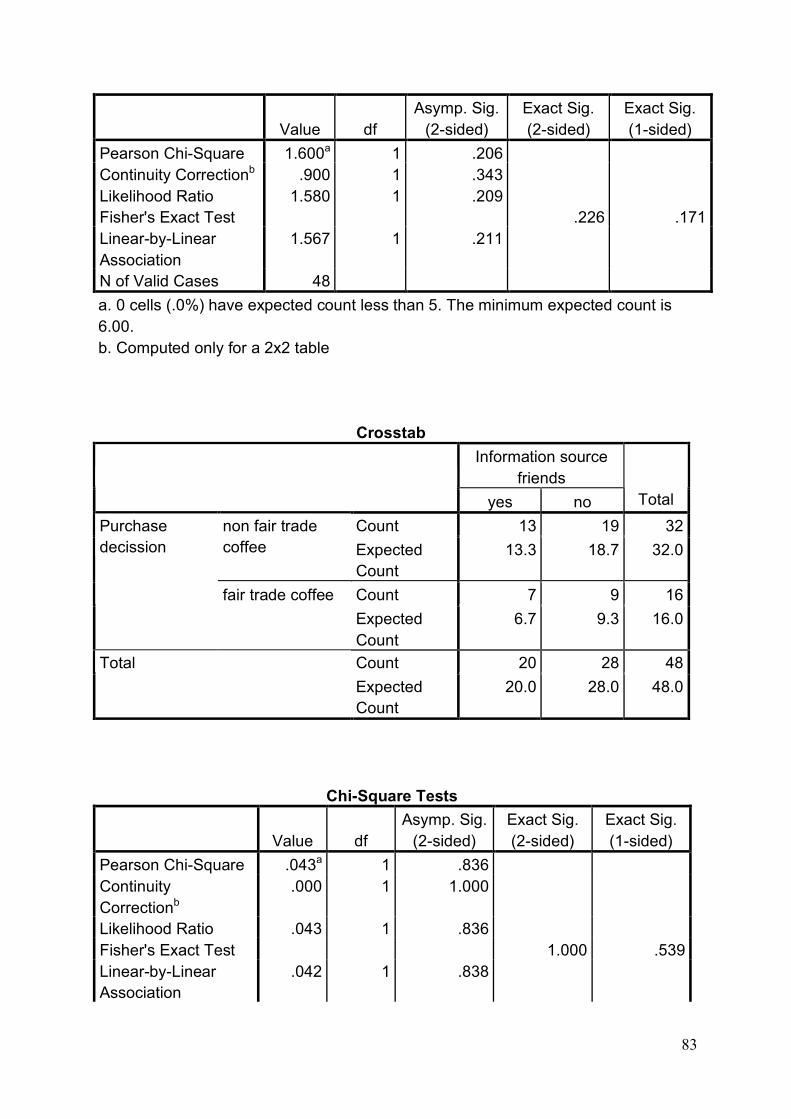
83
Value df
Asymp. Sig. (2-sided)
Exact Sig. (2-sided)
Exact Sig. (1-sided)
Pearson Chi-Square 1.600a 1 .206 Continuity Correctionb .900 1 .343 Likelihood Ratio 1.580 1 .209 Fisher's Exact Test .226 .171 Linear-by-Linear Association
1.567 1 .211
N of Valid Cases 48 a. 0 cells (.0%) have expected count less than 5. The minimum expected count is 6.00. b. Computed only for a 2x2 table
Crosstab Information source
friends yes no Total
Count 13 19 32 non fair trade coffee Expected
Count 13.3 18.7 32.0
Count 7 9 16
Purchase decission
fair trade coffee Expected Count
6.7 9.3 16.0
Count 20 28 48 Total Expected Count
20.0 28.0 48.0
Chi-Square Tests
Value df
Asymp. Sig. (2-sided)
Exact Sig. (2-sided)
Exact Sig. (1-sided)
Pearson Chi-Square .043a 1 .836 Continuity Correctionb
.000 1 1.000
Likelihood Ratio .043 1 .836 Fisher's Exact Test 1.000 .539 Linear-by-Linear Association
.042 1 .838
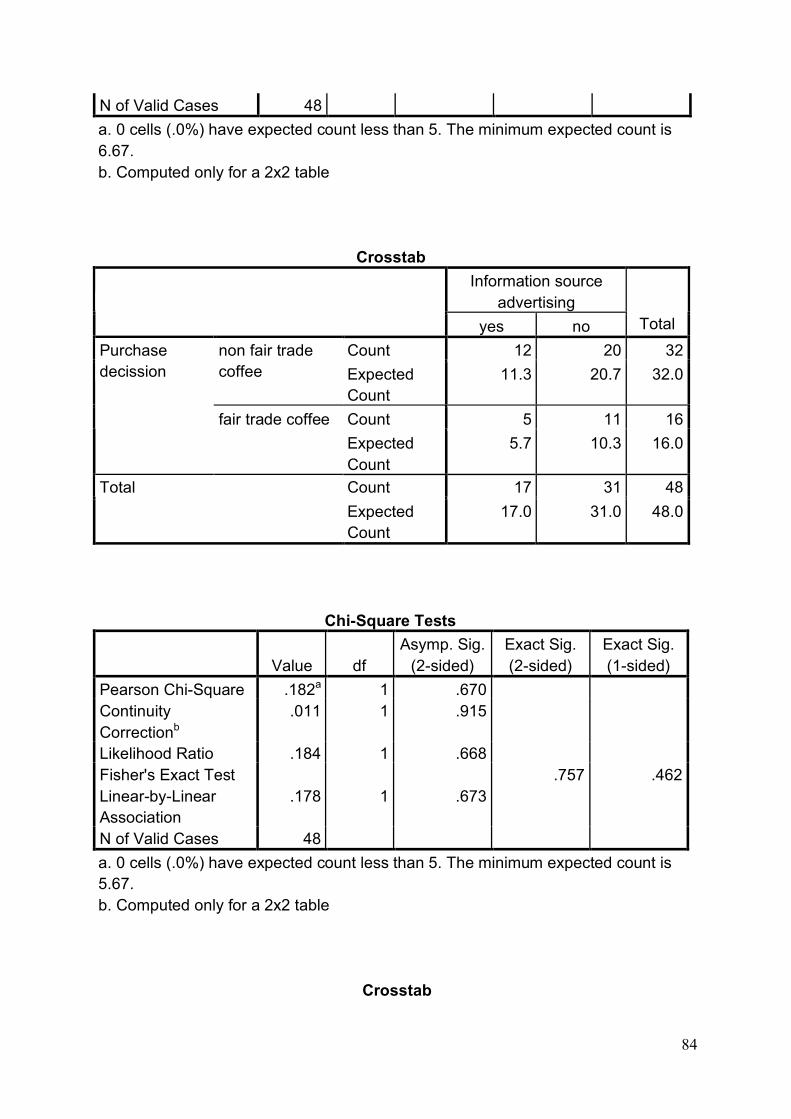
84
N of Valid Cases 48 a. 0 cells (.0%) have expected count less than 5. The minimum expected count is 6.67. b. Computed only for a 2x2 table
Crosstab Information source
advertising yes no Total
Count 12 20 32 non fair trade coffee Expected
Count 11.3 20.7 32.0
Count 5 11 16
Purchase decission
fair trade coffee Expected Count
5.7 10.3 16.0
Count 17 31 48 Total Expected Count
17.0 31.0 48.0
Chi-Square Tests
Value df
Asymp. Sig. (2-sided)
Exact Sig. (2-sided)
Exact Sig. (1-sided)
Pearson Chi-Square .182a 1 .670 Continuity Correctionb
.011 1 .915
Likelihood Ratio .184 1 .668 Fisher's Exact Test .757 .462 Linear-by-Linear Association
.178 1 .673
N of Valid Cases 48 a. 0 cells (.0%) have expected count less than 5. The minimum expected count is 5.67. b. Computed only for a 2x2 table
Crosstab
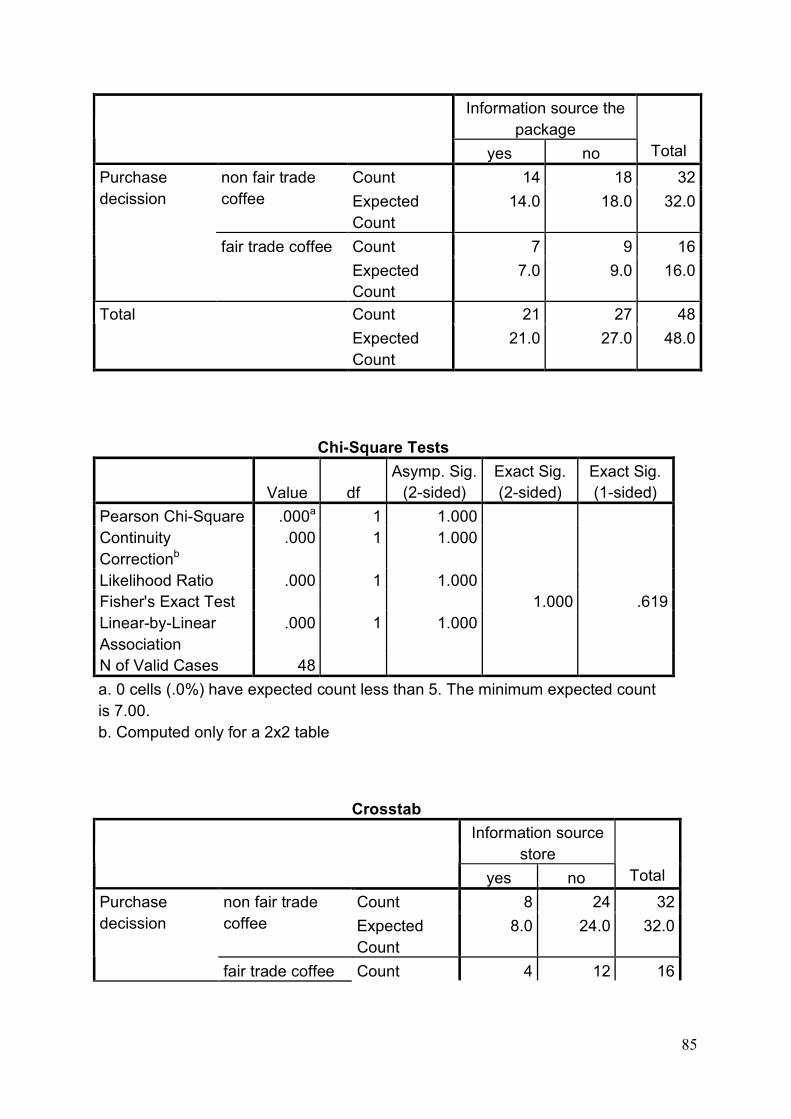
85
Information source the package
yes no Total Count 14 18 32 non fair trade
coffee Expected Count
14.0 18.0 32.0
Count 7 9 16
Purchase decission
fair trade coffee Expected Count
7.0 9.0 16.0
Count 21 27 48 Total Expected Count
21.0 27.0 48.0
Chi-Square Tests
Value df
Asymp. Sig. (2-sided)
Exact Sig. (2-sided)
Exact Sig. (1-sided)
Pearson Chi-Square .000a 1 1.000 Continuity Correctionb
.000 1 1.000
Likelihood Ratio .000 1 1.000 Fisher's Exact Test 1.000 .619 Linear-by-Linear Association
.000 1 1.000
N of Valid Cases 48 a. 0 cells (.0%) have expected count less than 5. The minimum expected count is 7.00. b. Computed only for a 2x2 table
Crosstab Information source
store yes no Total
Count 8 24 32 non fair trade coffee Expected
Count 8.0 24.0 32.0
Purchase decission
fair trade coffee Count 4 12 16
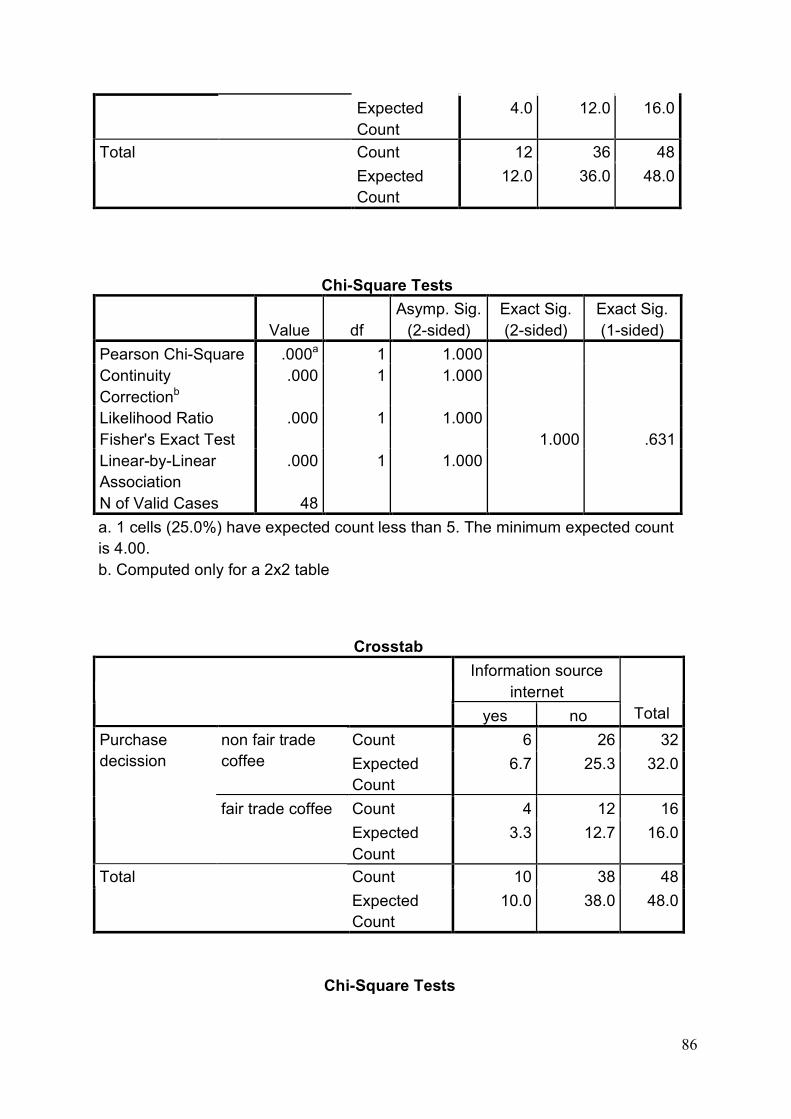
86
Expected Count
4.0 12.0 16.0
Count 12 36 48 Total Expected Count
12.0 36.0 48.0
Chi-Square Tests
Value df
Asymp. Sig. (2-sided)
Exact Sig. (2-sided)
Exact Sig. (1-sided)
Pearson Chi-Square .000a 1 1.000 Continuity Correctionb
.000 1 1.000
Likelihood Ratio .000 1 1.000 Fisher's Exact Test 1.000 .631 Linear-by-Linear Association
.000 1 1.000
N of Valid Cases 48 a. 1 cells (25.0%) have expected count less than 5. The minimum expected count is 4.00. b. Computed only for a 2x2 table
Crosstab Information source
internet yes no Total
Count 6 26 32 non fair trade coffee Expected
Count 6.7 25.3 32.0
Count 4 12 16
Purchase decission
fair trade coffee Expected Count
3.3 12.7 16.0
Count 10 38 48 Total Expected Count
10.0 38.0 48.0
Chi-Square Tests
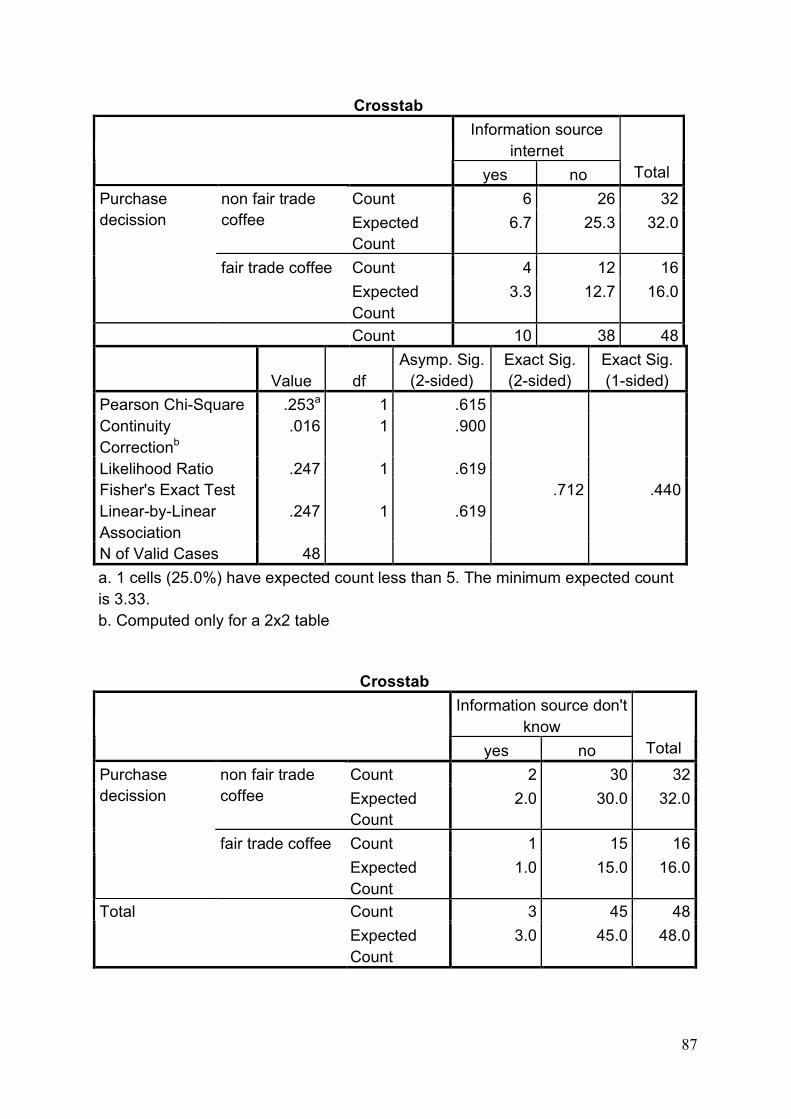
87
Crosstab Information source
internet yes no Total
Count 6 26 32 non fair trade coffee Expected
Count 6.7 25.3 32.0
Count 4 12 16
Purchase decission
fair trade coffee Expected Count
3.3 12.7 16.0
Count 10 38 48
Value df
Asymp. Sig. (2-sided)
Exact Sig. (2-sided)
Exact Sig. (1-sided)
Pearson Chi-Square .253a 1 .615 Continuity Correctionb
.016 1 .900
Likelihood Ratio .247 1 .619 Fisher's Exact Test .712 .440 Linear-by-Linear Association
.247 1 .619
N of Valid Cases 48 a. 1 cells (25.0%) have expected count less than 5. The minimum expected count is 3.33. b. Computed only for a 2x2 table
Crosstab Information source don't
know yes no Total
Count 2 30 32 non fair trade coffee Expected
Count 2.0 30.0 32.0
Count 1 15 16
Purchase decission
fair trade coffee Expected Count
1.0 15.0 16.0
Count 3 45 48 Total Expected Count
3.0 45.0 48.0

88
Crosstab Information source
internet yes no Total
Count 6 26 32 non fair trade coffee Expected
Count 6.7 25.3 32.0
Count 4 12 16
Purchase decission
fair trade coffee Expected Count
3.3 12.7 16.0
Count 10 38 48
Chi-Square Tests
Value df
Asymp. Sig. (2-sided)
Exact Sig. (2-sided)
Exact Sig. (1-sided)
Pearson Chi-Square .000a 1 1.000 Continuity Correctionb
.000 1 1.000
Likelihood Ratio .000 1 1.000 Fisher's Exact Test 1.000 .713 Linear-by-Linear Association
.000 1 1.000
N of Valid Cases 48 a. 2 cells (50.0%) have expected count less than 5. The minimum expected count is 1.00. b. Computed only for a 2x2 table
Table 23: Hypothesis 3, Kruskal Wallis test, Purchase frequency
Descriptive Statistics N Mean Std. Deviation Minimum Maximum
Purchase frequency 65 4.23 1.549 1 6 Purchase decission 48 1.33 .476 1 2
Ranks Purchase decission N Mean Rank Purchase frequency
non fair trade coffee 31 22.44
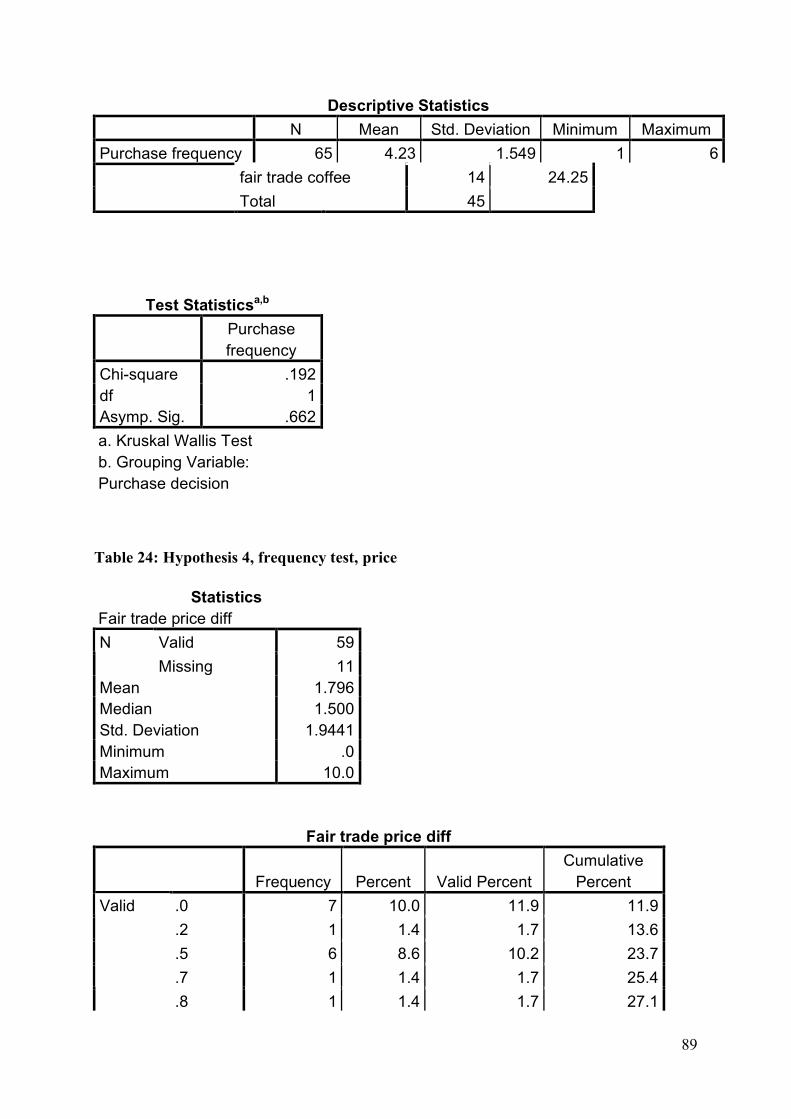
89
Descriptive Statistics N Mean Std. Deviation Minimum Maximum
Purchase frequency 65 4.23 1.549 1 6 fair trade coffee 14 24.25
Total 45
Test Statisticsa,b
Purchase frequency
Chi-square .192 df 1 Asymp. Sig. .662 a. Kruskal Wallis Test b. Grouping Variable: Purchase decision
Table 24: Hypothesis 4, frequency test, price
Statistics Fair trade price diff
Valid 59 N Missing 11
Mean 1.796 Median 1.500 Std. Deviation 1.9441 Minimum .0 Maximum 10.0
Fair trade price diff
Frequency Percent Valid Percent
Cumulative Percent
.0 7 10.0 11.9 11.9
.2 1 1.4 1.7 13.6
.5 6 8.6 10.2 23.7
.7 1 1.4 1.7 25.4
Valid
.8 1 1.4 1.7 27.1
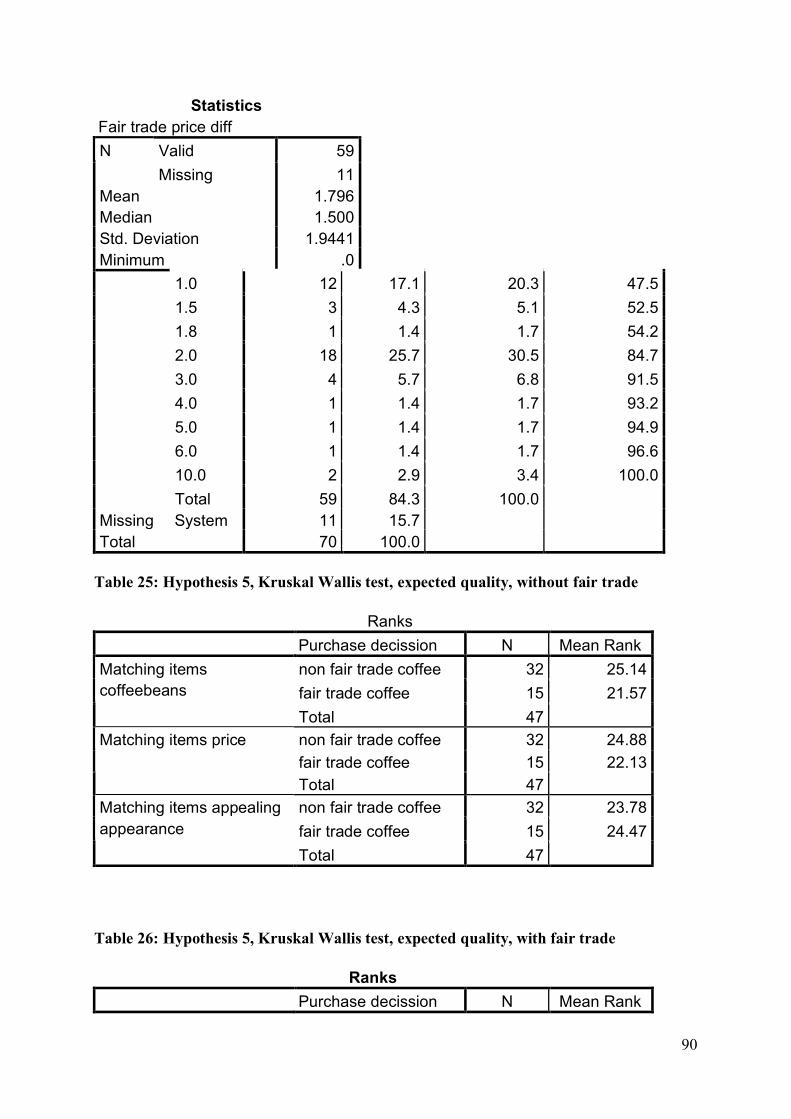
90
Statistics Fair trade price diff
Valid 59 N Missing 11
Mean 1.796 Median 1.500 Std. Deviation 1.9441 Minimum .0
1.0 12 17.1 20.3 47.5 1.5 3 4.3 5.1 52.5 1.8 1 1.4 1.7 54.2 2.0 18 25.7 30.5 84.7 3.0 4 5.7 6.8 91.5 4.0 1 1.4 1.7 93.2 5.0 1 1.4 1.7 94.9 6.0 1 1.4 1.7 96.6 10.0 2 2.9 3.4 100.0
Total 59 84.3 100.0 Missing System 11 15.7 Total 70 100.0
Table 25: Hypothesis 5, Kruskal Wallis test, expected quality, without fair trade
Ranks Purchase decission N Mean Rank
non fair trade coffee 32 25.14 fair trade coffee 15 21.57
Matching items coffeebeans
Total 47 non fair trade coffee 32 24.88 fair trade coffee 15 22.13
Matching items price
Total 47 non fair trade coffee 32 23.78 fair trade coffee 15 24.47
Matching items appealing appearance
Total 47
Table 26: Hypothesis 5, Kruskal Wallis test, expected quality, with fair trade
Ranks Purchase decission N Mean Rank
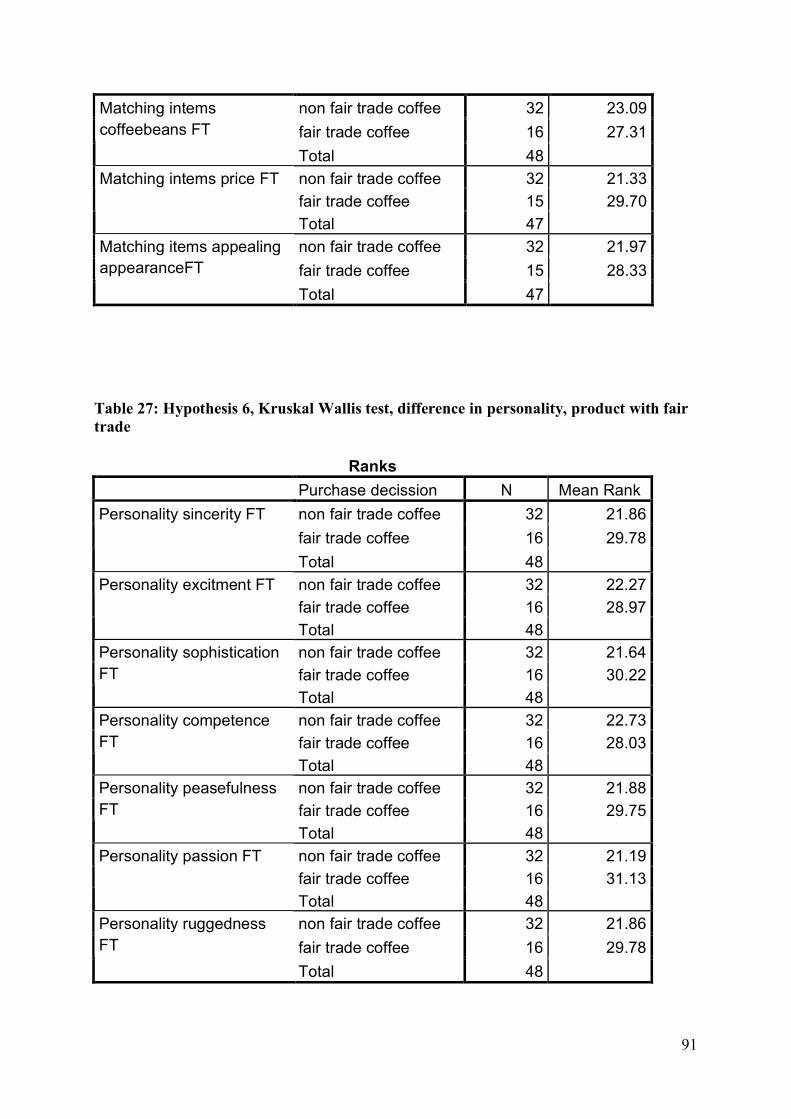
91
non fair trade coffee 32 23.09 fair trade coffee 16 27.31
Matching intems coffeebeans FT
Total 48 non fair trade coffee 32 21.33 fair trade coffee 15 29.70
Matching intems price FT
Total 47 non fair trade coffee 32 21.97 fair trade coffee 15 28.33
Matching items appealing appearanceFT
Total 47
Table 27: Hypothesis 6, Kruskal Wallis test, difference in personality, product with fair trade
Ranks Purchase decission N Mean Rank
non fair trade coffee 32 21.86 fair trade coffee 16 29.78
Personality sincerity FT
Total 48 non fair trade coffee 32 22.27 fair trade coffee 16 28.97
Personality excitment FT
Total 48 non fair trade coffee 32 21.64 fair trade coffee 16 30.22
Personality sophistication FT
Total 48 non fair trade coffee 32 22.73 fair trade coffee 16 28.03
Personality competence FT
Total 48 non fair trade coffee 32 21.88 fair trade coffee 16 29.75
Personality peasefulness FT
Total 48 non fair trade coffee 32 21.19 fair trade coffee 16 31.13
Personality passion FT
Total 48 non fair trade coffee 32 21.86 fair trade coffee 16 29.78
Personality ruggedness FT
Total 48
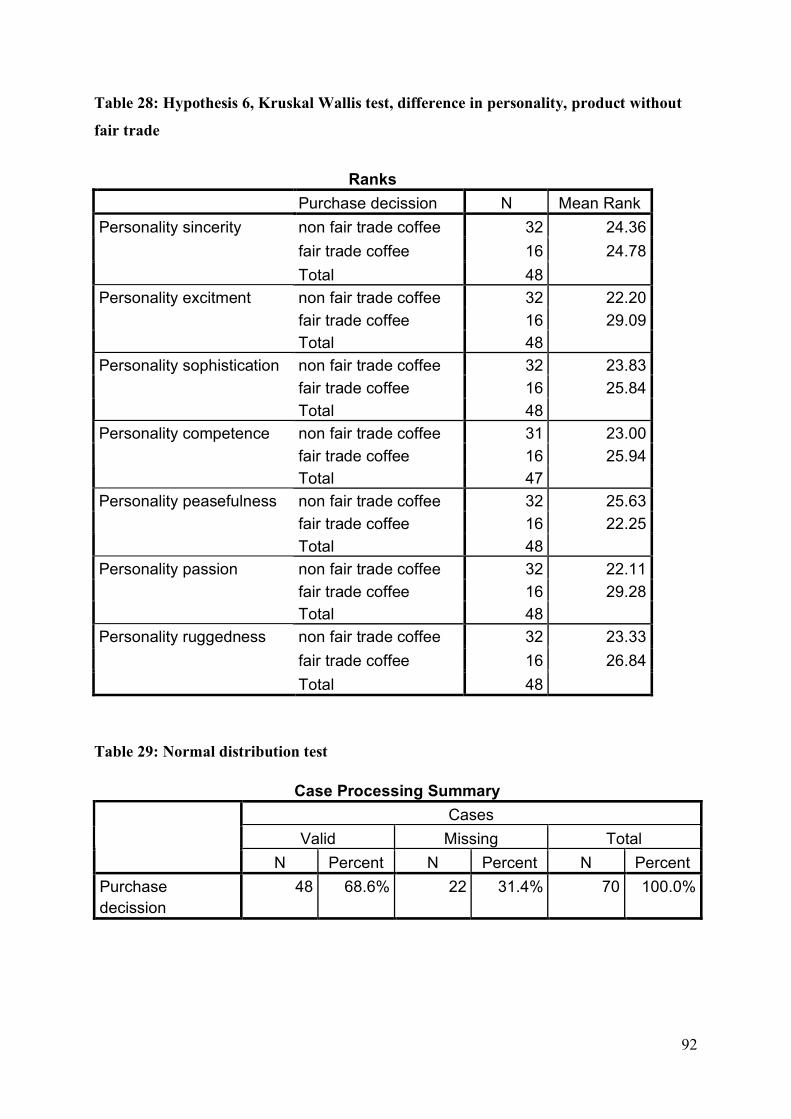
92
Table 28: Hypothesis 6, Kruskal Wallis test, difference in personality, product without
fair trade
Ranks Purchase decission N Mean Rank
non fair trade coffee 32 24.36 fair trade coffee 16 24.78
Personality sincerity
Total 48 non fair trade coffee 32 22.20 fair trade coffee 16 29.09
Personality excitment
Total 48 non fair trade coffee 32 23.83 fair trade coffee 16 25.84
Personality sophistication
Total 48 non fair trade coffee 31 23.00 fair trade coffee 16 25.94
Personality competence
Total 47 non fair trade coffee 32 25.63 fair trade coffee 16 22.25
Personality peasefulness
Total 48 non fair trade coffee 32 22.11 fair trade coffee 16 29.28
Personality passion
Total 48 non fair trade coffee 32 23.33 fair trade coffee 16 26.84
Personality ruggedness
Total 48
Table 29: Normal distribution test
Case Processing Summary Cases
Valid Missing Total
N Percent N Percent N Percent Purchase decission
48 68.6% 22 31.4% 70 100.0%
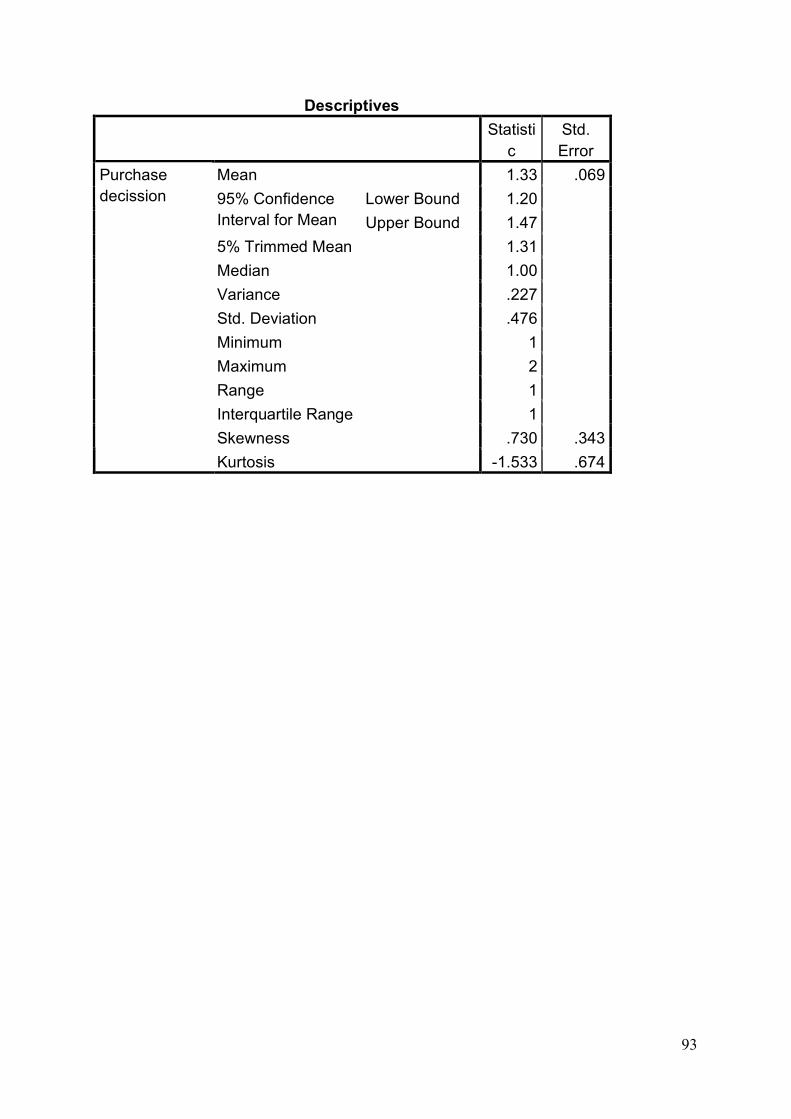
93
Descriptives
Statistic
Std. Error
Mean 1.33 .069 Lower Bound 1.20 95% Confidence
Interval for Mean Upper Bound 1.47 5% Trimmed Mean 1.31 Median 1.00 Variance .227 Std. Deviation .476 Minimum 1 Maximum 2 Range 1 Interquartile Range 1 Skewness .730 .343
Purchase decission
Kurtosis -1.533 .674