Embed Size (px)
Citation preview
2014Annual Report
Driving Change and Building Value
Year ended March 31, 2014
Contents
2 A Message to Shareholders and Investors
3 Special Feature Restructuring Initiatives + Transformation and Growth Strategies
8 Business Group Review
8 Advanced Fibers and Composites
Business Group
10 Electronics Materials and Performance
Polymer Products Business Group
12 Healthcare Business Group
14 Trading and Retail Business Group
15 IT Business Group
16 New Business Development Business Unit
17 Research and Development
20 Corporate Governance
23 Corporate Social Responsibility
25 Financial Section
26 Financial Highlights and Consolidated
10-Year Summary
28 Management’s Discussion and Analysis
36 Consolidated Financial Statements
79 Corporate Data
Profi le
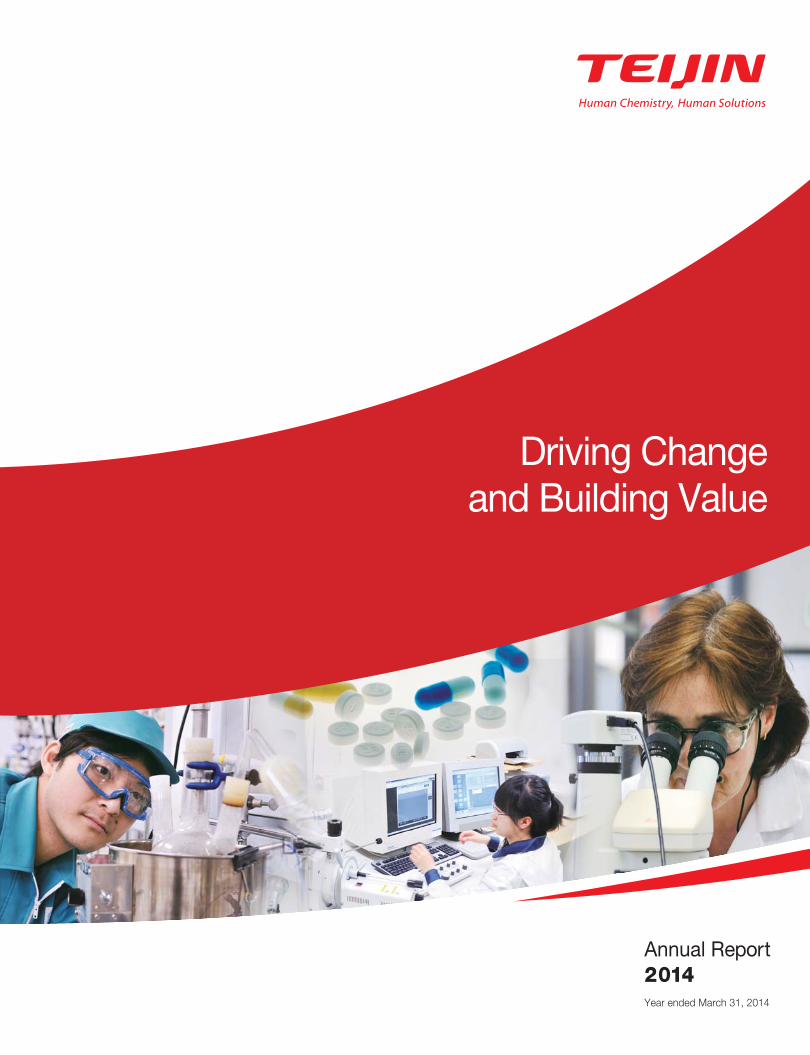
With the aim of attaining the targets of its medium- to long-term
management vision, the Teijin Group is working to provide
solutions to customers and markets, thereby enhancing the
quality of life of people everywhere, by concentrating on core
business domains, namely, high-performance materials,
healthcare and IT, as well as on domains that overlap these
areas. The Group is also striving to secure both sustainable
growth and profi tability by promoting restructuring initiatives
and implementing transformation and growth strategies.
Breakdown of Consolidated Net Sales in Fiscal 2013
Advanced Fibers and Composites
Healthcare
Other
16%
Electronics Materials and Performance Polymer Products
23%
18%
32%
11%●IT
●Trading, retail
●Pharmaceuticals●Home healthcare
●Polycarbonate resin●PET film●PEN film
●Aramid fibers●Carbon fibers and composites●Polyester fibers for industrial applications
Trading and Retail
Disclaimer Regarding Forward-Looking Statements
Any statements in this document, other than those of historical fact, are forward-looking statements about
the future performance of Teijin and its Group companies, which are based on management’s assump-
tions and beliefs in light of information currently available and involve risks and uncertainties. Actual results
may differ materially from these forecasts. Potential risks and uncertainties include, but are not limited to,
domestic and overseas economic conditions, such as consumer spending and private capital expendi-
tures; currency exchange rate fl uctuations, notably with the Japanese yen, U.S. dollar, Asian currencies,
the euro and other currencies in which Teijin operates its international business; direct and indirect restric-
tions imposed by other countries; fl uctuations in the market prices of securities in which Teijin has sub-
stantial holdings; and Teijin’s ability to maintain its strength in many product and geographical areas,
through such means as new product introductions, in a market that is highly competitive in terms of
both price and technology, pertinent to the industry to which the Company primarily belongs.
Driving Change and
1Teijin Limited
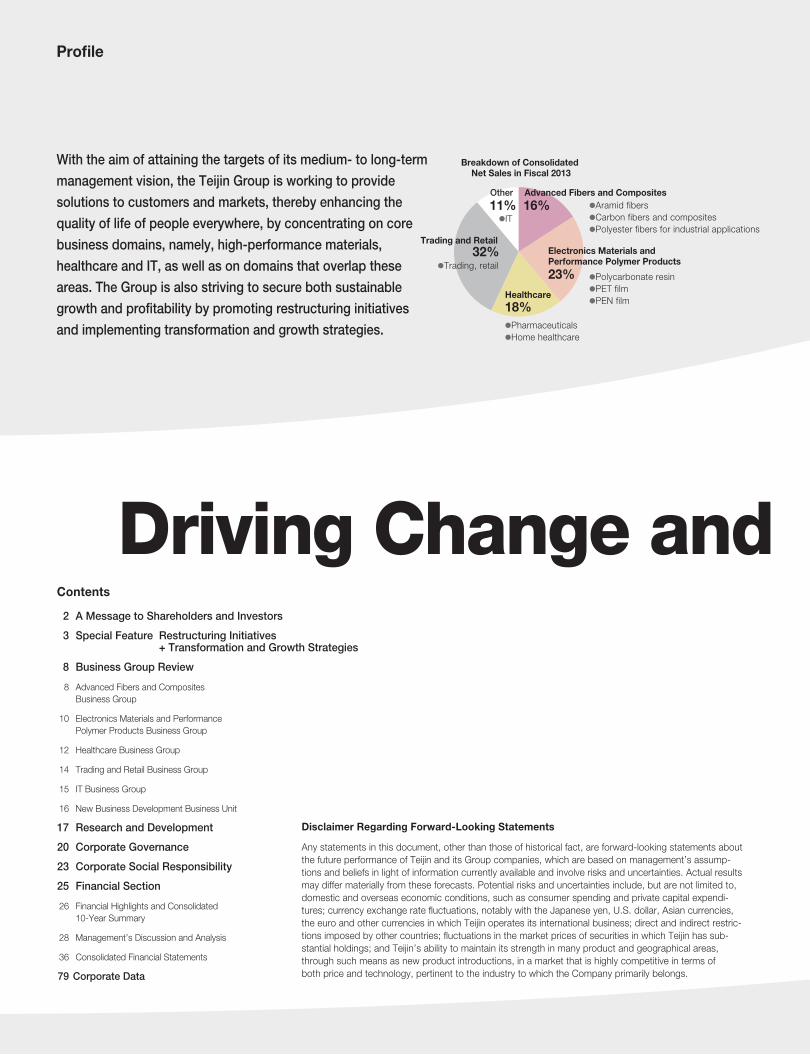
* In our view, a company that has attained “global excellence” is one that is recognized as a key global player in its
core businesses, has business activities worldwide, is evaluated positively by society
and is a source of pride for its employees.
Secure profi table sustainable growth by providing customers with the solutions they need
Build value that also benefi ts society and contribute to the advancement of humanity by focusing
on businesses that leverage our cutting-edge technologies
Be recognized as a leading global player that has attained global excellence*
Long-term vision:
Transformation and Growth Strategies
Restructuring Initiatives
Reduce costs
Evolve our business model
Rebuild our
competitive
advantages
(Offensive measures)
Reorganize
unprofi table
businesses
(Defensive measures)
Further transform andgrow key businesses
Restore basic profi tability
Foster new businesses in overlapping domains
Building Value
Existing businesses
2 Teijin Limited
A Message to Shareholders and InvestorsA Message to Shareholders and Investors
Bolstered by a recovery in results in the Advanced Fibers and
Composites segment and the impact of restructuring initiatives,
particularly in our materials businesses, consolidated net sales in
fi scal 2013 rose 5.2%, to ¥784.4 billion, while operating income
climbed 46.3%, to ¥18.1 billion. Net income amounted to ¥8.4
billion, up from a net loss of ¥29.1 billion in fi scal 2012.
The foremost objective of CHANGE for 2016, the medium- to
long-term management vision we announced in 2012, is to evolve
toward a solutions-oriented business model and by doing so build
value that benefi ts our customers and society. Accordingly, we
continue to promote ambitious restructuring initiatives and at the
same time have begun implementing forward-looking strategies,
which we have dubbed “transformation and growth strategies.”
Teijin has moved decisively to restructure its businesses numer-
ous times in the 90-plus years since its establishment. The most
notable, perhaps, was our decision to shift the focus of our fi bers
business from rayon to polyester—a major change in direction—in
the late 1950s. In subsequent decades, the emergence of manu-
facturers in, among others, the People’s Republic of China (PRC)
and India fundamentally altered the structure of the polyester fi bers
market such that simply chasing production volume and market
share was no longer a viable strategy for survival. With the global
economic slump precipitated by the collapse of Lehman Brothers,
polyester fi bers became the target of drastic structural reforms, as
a result of which our fi bers business now centers on aramid fi bers
and carbon fi bers. In short, we have always recognized that the
ability to accurately interpret social imperatives and market trends,
and the willingness to make changes accordingly, without being
swayed by past success, are essential to prevent businesses from
falling into decline.
Since the beginning of fi scal 2013, we have suspended opera-
tions on certain loss-making production lines and at certain poorly
performing facilities in Japan and overseas, primarily in our Elec-
tronics Materials and Performance Polymer Products segment.
While the goal of these measures is a short-term improvement in
profi tability through the liquidation or scaling back of unprofi table
sites, our restructuring initiatives are aimed at more than a quick
fi x. In our view, restructuring means decisively paring down existing
businesses using four basic criteria—market growth potential,
technology-derived competitive advantages, medium- to long-term
profi tability and prospects for the creation of signifi cant barriers to
new market entrants—while at the same time working to clarify
and refi ne our competitive strengths, to create a business structure
that is conducive to sustainable growth.
Having also recognized that simply persisting with our current
business model will not enable us to secure sustainable growth,
we are also implementing bold transformation and growth strate-
gies aimed at cultivating promising new businesses. In our materials
businesses, for example, we are shifting away from our traditional
business model, which centers on the production and sales of
materials, toward one that also emphasizes value-added compo-
nents and devices. We will also promote the focused allocation
of resources to expand the Teijin Group’s three core business
domains, namely, high-performance materials, healthcare and IT,
and foster new, highly profi table businesses that overlap these
domains, combining products, services and IT solutions to enhance
value and utility for customers.
We will press forward with efforts to complete restructuring ini-
tiatives by the end of fi scal 2016 at the latest, as well as to restore
basic profi tability enabling us to boost annual operating income
above ¥50.0 billion. We are also confi dent that our transformation
and growth strategies—the seeds of which we are currently plant-
ing—will yield major positive results by around fi scal 2020, thereby
positioning us for a new stage of growth.
Teijin has embarked upon an era of signifi cant change. To
advance our transformation as an organization committed to creat-
ing value for customers, management and staff will work together
to implement the strategies we have formulated. In these and all
our efforts, we look forward to the continued understanding and
support of shareholders.
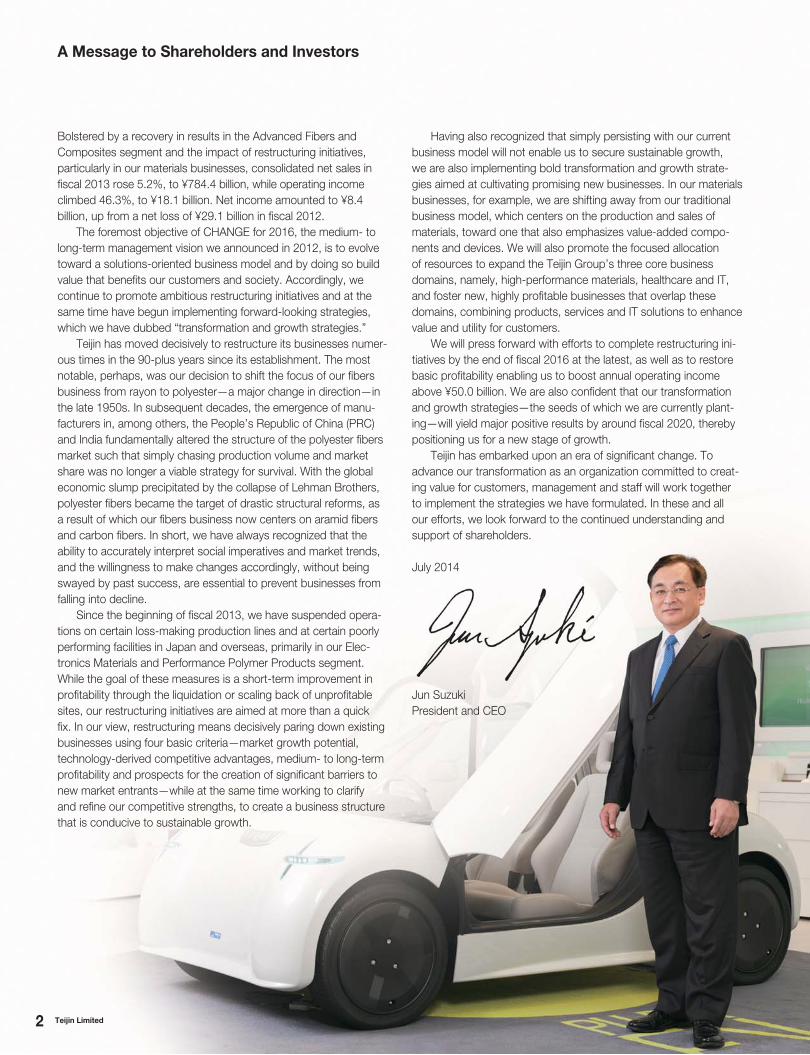
July 2014
Jun Suzuki
President and CEO
2 Teijin Limited
3Teijin Limited
Special Feature
Driving Change and Building Value
RestructuringInitiatives
Transformation and
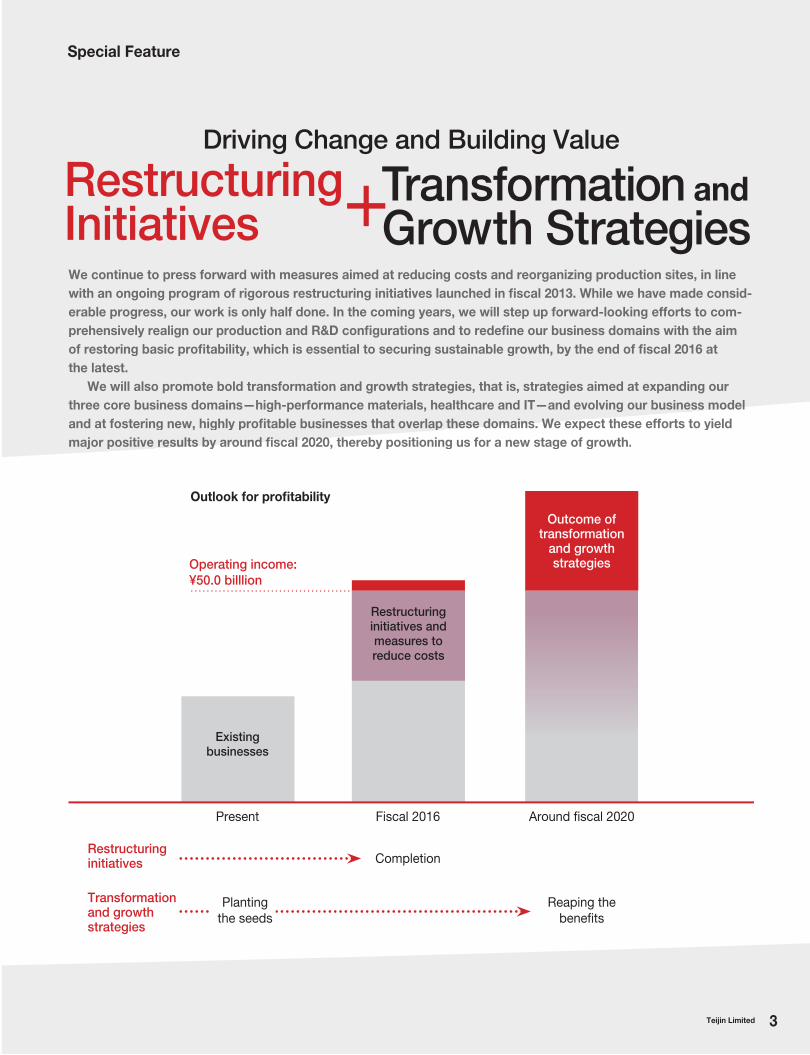
Growth Strategies +We continue to press forward with measures aimed at reducing costs and reorganizing production sites, in line
with an ongoing program of rigorous restructuring initiatives launched in fi scal 2013. While we have made consid-
erable progress, our work is only half done. In the coming years, we will step up forward-looking efforts to com-
prehensively realign our production and R&D confi gurations and to redefi ne our business domains with the aim
of restoring basic profi tability, which is essential to securing sustainable growth, by the end of fi scal 2016 at
the latest.
We will also promote bold transformation and growth strategies, that is, strategies aimed at expanding our
three core business domains—high-performance materials, healthcare and IT—and evolving our business model ness model
and at fostering new, highly profi table businesses that overlap these domains. We expecap these domains. We expect these efforts to yield
major positive results by around fi scal 2020, ve results by around fi scal 2020, thereby positioning us for a new stage of growth.
Existing businesses
Present
Planting
the seeds
Reaping the
benefi ts
Completion
Fiscal 2016 Around fi scal 2020
Outlook for profi tability
Restructuring initiatives
Transformationand growth strategies
Restructuring initiatives and measures to reduce costs
Outcome of transformation
and growth strategies Operating income:
¥50.0 billlion
4 Teijin Limited
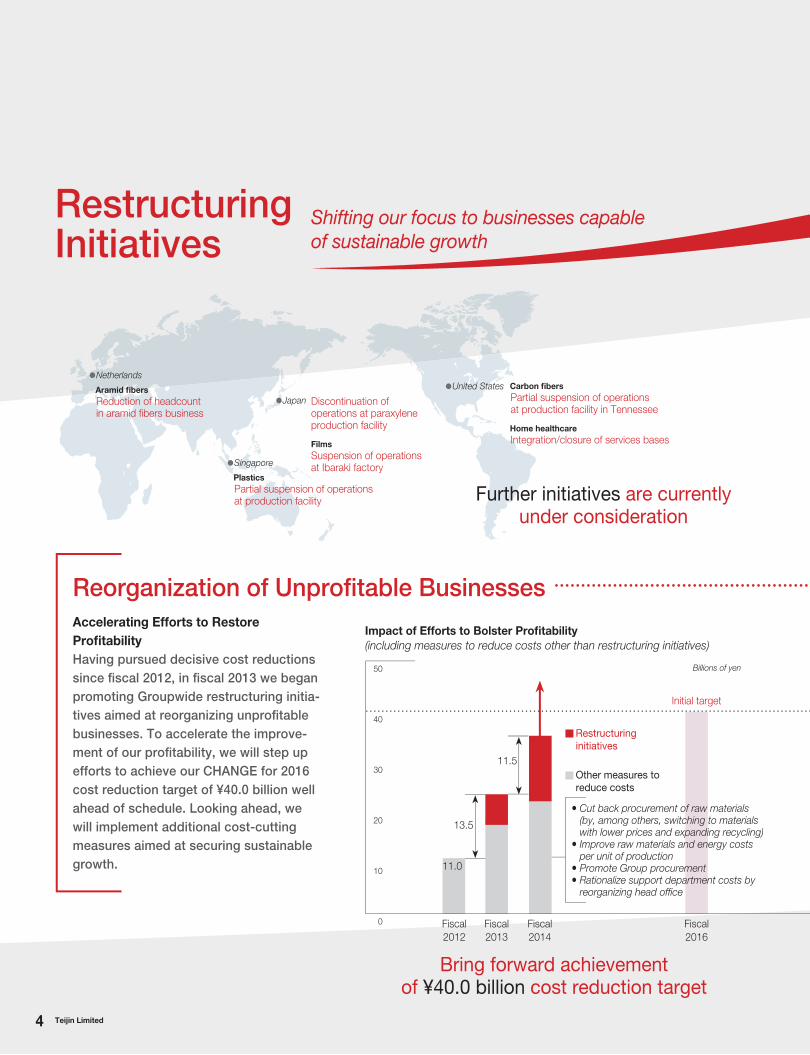
RestructuringInitiatives
Shifting our focus to businesses capable of sustainable growth
•Netherlands
Aramid fi bers
Reduction of headcount in aramid fi bers business
•Singapore
Plastics
Partial suspension of operations at production facility
Accelerating Efforts to Restore
Profi tability
Having pursued decisive cost reductions
since fi scal 2012, in fi scal 2013 we began
promoting Groupwide restructuring initia-
tives aimed at reorganizing unprofi table
businesses. To accelerate the improve-
ment of our profi tability, we will step up
efforts to achieve our CHANGE for 2016
cost reduction target of ¥40.0 billion well
ahead of schedule. Looking ahead, we
will implement additional cost-cutting
measures aimed at securing sustainable
growth.
Reorganization of Unprofi table Businesses
Further initiatives are currently under consideration
Bring forward achievement of ¥40.0 billion cost reduction target
Impact of Efforts to Bolster Profi tability
(including measures to reduce costs other than restructuring initiatives)
Discontinuation of operations at paraxylene production facility
Films
Suspension of operations at Ibaraki factory
Billions of yen
•Japan
•United States
Carbon fi bers
Partial suspension of operations at production facility in Tennessee
Home healthcare
Integration/closure of services bases
Fiscal
2012
Fiscal
2013
Fiscal
2014
Fiscal
2016
50
40
30
20
10
0
Restructuring initiatives
Other measures to reduce costs
• Cut back procurement of raw materials(by, among others, switching to materials with lower prices and expanding recycling)
• Improve raw materials and energy costs per unit of production
• Promote Group procurement• Rationalize support department costs by
reorganizing head offi ce
13.5
11.5
11.0
Initial target
5Teijin Limited
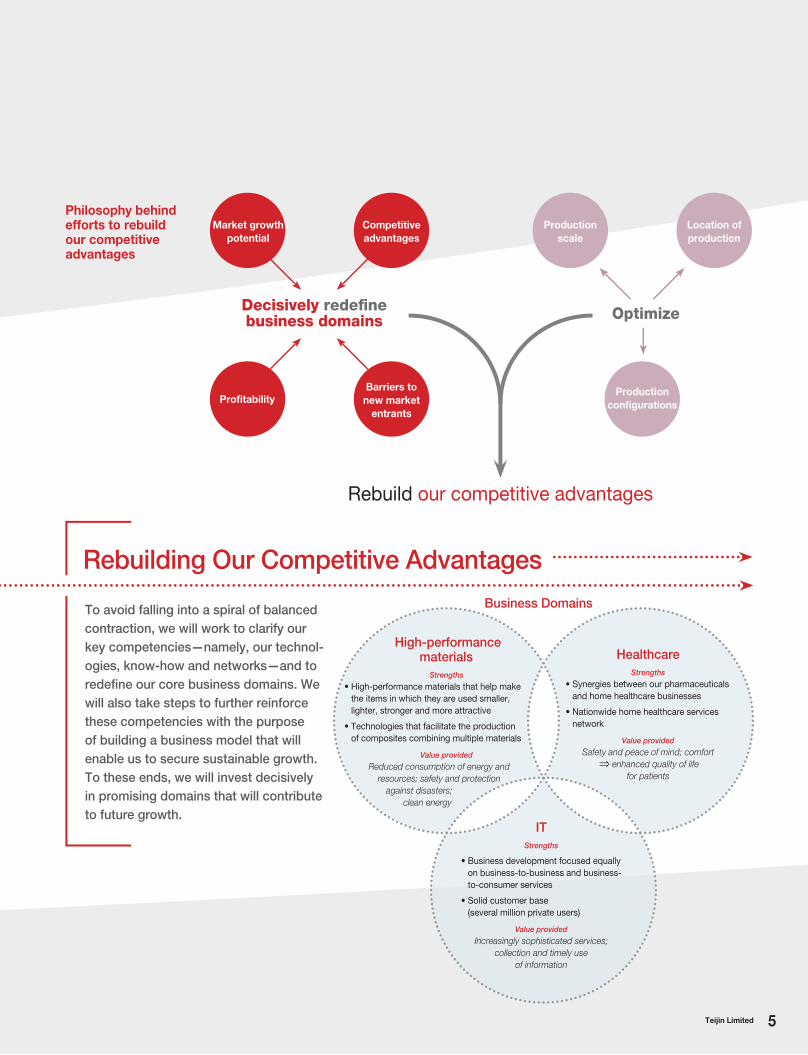
Business Domains
High-performance materials
Strengths
• High-performance materials that help make
the items in which they are used smaller,
lighter, stronger and more attractive
• Technologies that facilitate the production
of composites combining multiple materials
Value provided
Reduced consumption of energy and
resources; safety and protection
against disasters;
clean energy
Healthcare
Strengths
• Synergies between our pharmaceuticals
and home healthcare businesses
• Nationwide home healthcare services
network
Value provided
Safety and peace of mind; comfort
enhanced quality of life
for patients
IT
Strengths
• Business development focused equally
on business-to-business and business-
to-consumer services
• Solid customer base
(several million private users)
Value provided
Increasingly sophisticated services;
collection and timely use
of information
Market growth
potential
Profi tability
Competitive
advantages
Barriers to
new market
entrants
Production
scale
Location of
production
Production
confi gurations
Decisively redefi ne business domains Optimize
Rebuilding Our Competitive Advantages
Rebuild our competitive advantages
Philosophy behind efforts to rebuild our competitive advantages
To avoid falling into a spiral of balanced
contraction, we will work to clarify our
key competencies—namely, our technol-
ogies, know-how and networks—and to
redefi ne our core business domains. We
will also take steps to further reinforce
these competencies with the purpose
of building a business model that will
enable us to secure sustainable growth.
To these ends, we will invest decisively
in promising domains that will contribute
to future growth.
6 Teijin Limited
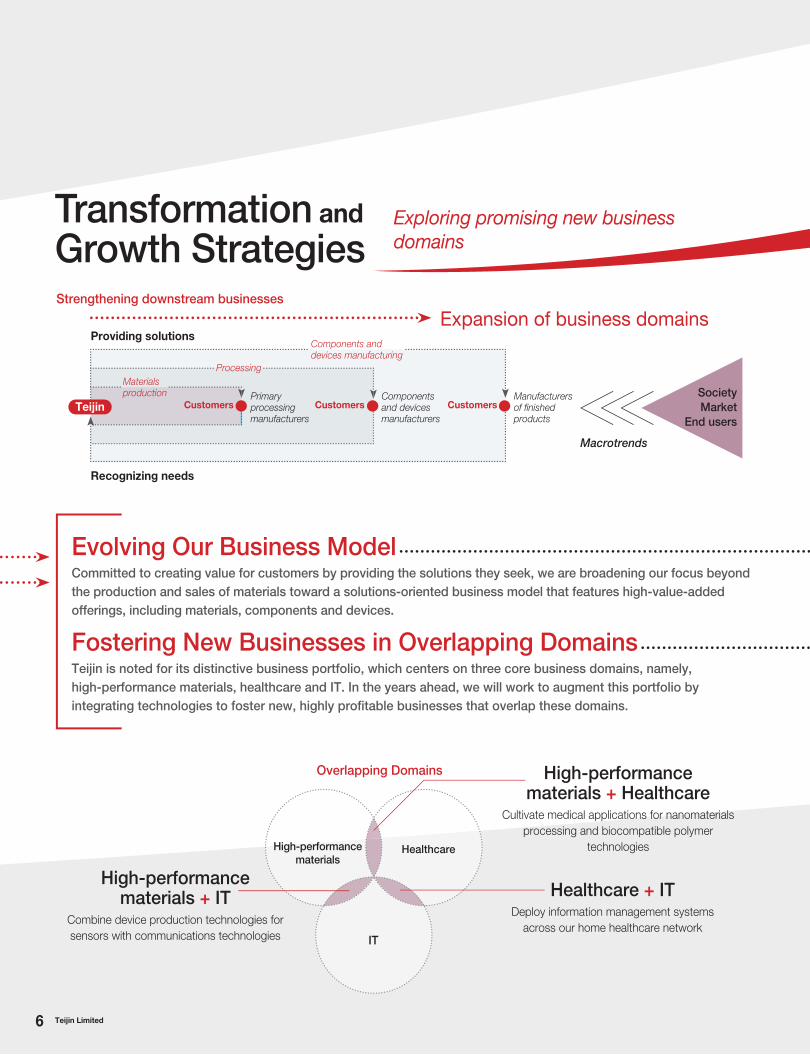
Transformation and
Growth StrategiesExploring promising new business domains
Expansion of business domainsStrengthening downstream businesses
Overlapping Domains
Providing solutions
Recognizing needs
Macrotrends
Society
Market
End users
Evolving Our Business ModelCommitted to creating value for customers by providing the solutions they seek, we are broadening our focus beyond
the production and sales of materials toward a solutions-oriented business model that features high-value-added
offerings, including materials, components and devices.
Fostering New Businesses in Overlapping DomainsTeijin is noted for its distinctive business portfolio, which centers on three core business domains, namely,
high-performance materials, healthcare and IT. In the years ahead, we will work to augment this portfolio by
integrating technologies to foster new, highly profi table businesses that overlap these domains.
High-performance materials + Healthcare
Cultivate medical applications for nanomaterials
processing and biocompatible polymer
technologies
Healthcare + ITDeploy information management systems
across our home healthcare network
High-performance materials + IT
Combine device production technologies for
sensors with communications technologies
High-performance materials
Healthcare
IT
Teijin CustomersPrimary processing manufacturers
Materials production
Processing
Components and devices manufacturing
Components and devices manufacturers
Manufacturers of fi nished products
Customers Customers
7Teijin Limited
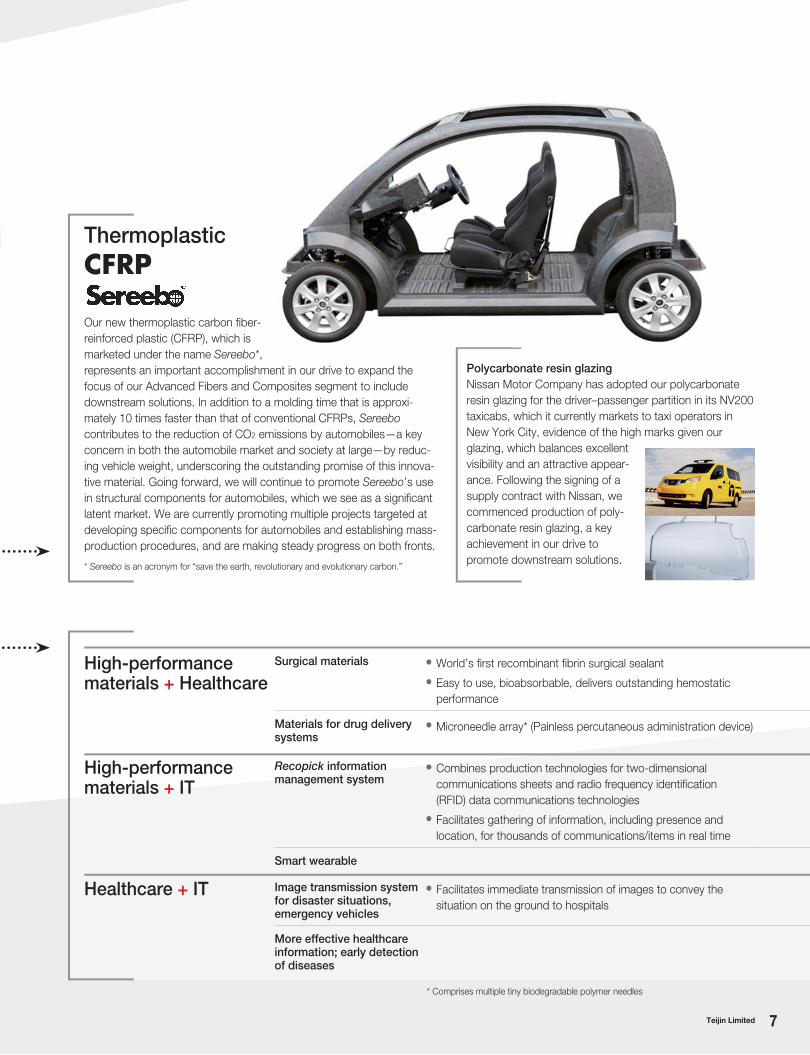
Polycarbonate resin glazing
Nissan Motor Company has adopted our polycarbonate
resin glazing for the driver–passenger partition in its NV200
taxicabs, which it currently markets to taxi operators in
New York City, evidence of the high marks given our
glazing, which balances excellent
visibility and an attractive appear-
ance. Following the signing of a
supply contract with Nissan, we
commenced production of poly-
carbonate resin glazing, a key
achievement in our drive to
promote downstream solutions.
Surgical materials • World’s fi rst recombinant fi brin surgical sealant
• Easy to use, bioabsorbable, delivers outstanding hemostatic
performance
Materials for drug delivery systems
• Microneedle array* (Painless percutaneous administration device)
Recopick information management system
• Combines production technologies for two-dimensional
communications sheets and radio frequency identifi cation
(RFID) data communications technologies
• Facilitates gathering of information, including presence and
location, for thousands of communications/items in real time
Smart wearable
Image transmission system for disaster situations, emergency vehicles
• Facilitates immediate transmission of images to convey the
situation on the ground to hospitals
More effective healthcare information; early detection of diseases
High-performance materials + Healthcare
High-performance materials + IT
Healthcare + IT
* Comprises multiple tiny biodegradable polymer needles
Thermoplastic
CFRP
Our new thermoplastic carbon fi ber-
reinforced plastic (CFRP), which is
marketed under the name Sereebo*,
represents an important accomplishment in our drive to expand the
focus of our Advanced Fibers and Composites segment to include
downstream solutions. In addition to a molding time that is approxi-
mately 10 times faster than that of conventional CFRPs, Sereebo
contributes to the reduction of CO2 emissions by automobiles—a key
concern in both the automobile market and society at large—by reduc-
ing vehicle weight, underscoring the outstanding promise of this innova-
tive material. Going forward, we will continue to promote Sereebo’s use
in structural components for automobiles, which we see as a signifi cant
latent market. We are currently promoting multiple projects targeted at
developing specifi c components for automobiles and establishing mass-
production procedures, and are making steady progress on both fronts.
* Sereebo is an acronym for “save the earth, revolutionary and evolutionary carbon.”
8 Teijin Limited
Business Group Review
Q How did segment
businesses perform in
fi scal 2013?
A Sales of mainstay Twaron
para-aramid fi bers picked up,
as sales for automotive applica-
tions rallied and sales for
infrastructure-related applica-
tions were fi rm, although
demand for use in ballistic protection products and protective cloth-
ing remained lackluster. Sales of Technora para-aramid fi bers were
stable for automotive applications in Japan, while the weakening of
the yen enhanced the profi tability of exports.
In carbon fi bers, sales were fi rm for use in aircraft. Among gen-
eral industrial applications, sales expanded encouragingly for use in
pressure vessels, but softened for other applications in the second
half of the period. With sales of polyester fi bers solid for automotive
applications, results at our subsidiary in Thailand, which was dam-
aged by the severe fl ooding in that country in fi scal 2011, continued
to recover.
Q What do you see as your principal challenges in fi scal
2014 and how will you respond?
A Overall, demand is on the mend, but pricing competition
remains fi erce for certain applications. In fi scal 2014, we will seek
to further strengthen profi tability by stepping up the implementation
of restructuring initiatives and measures intended to reduce costs.
In aramid fi bers, we will work to boost profi tability by shrinking
production and head offi ce fi xed costs. In addition to increasing
sales for automotive and infrastructure-related applications, we will
endeavor to increase sales for use in ballistic protection products
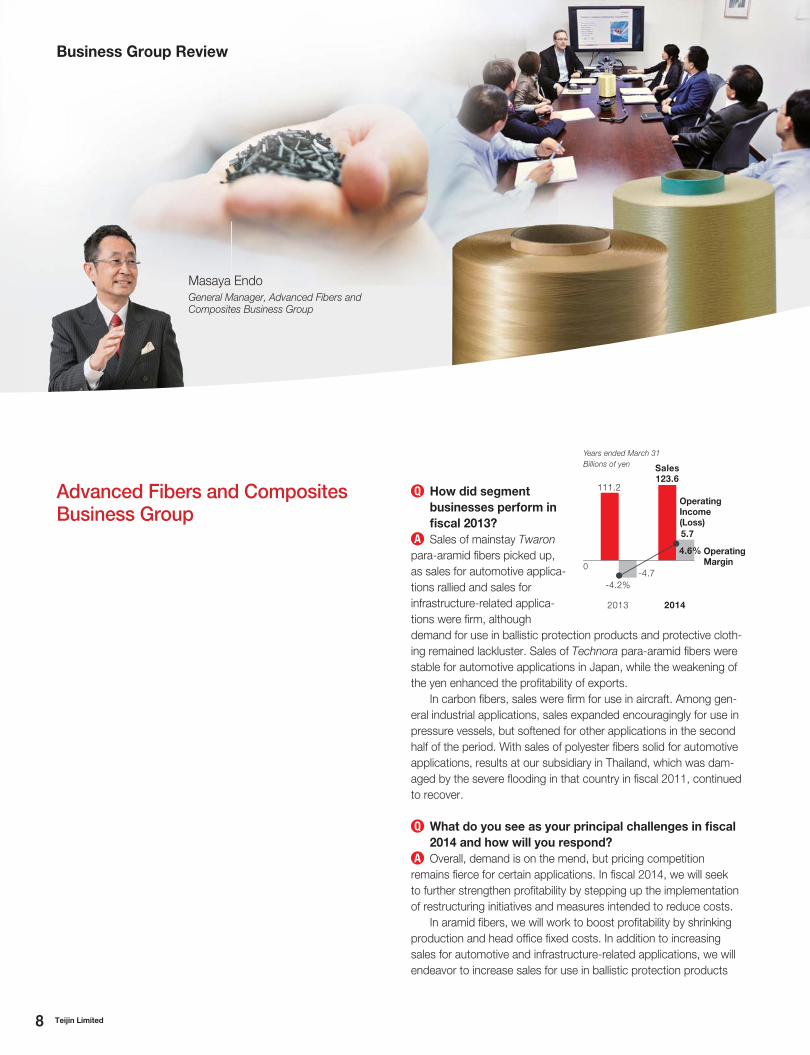
Masaya EndoGeneral Manager, Advanced Fibers and Composites Business Group
0
20142013
111.2
-4.7-4.2%
123.6
5.7
4.6%
Billions of yenYears ended March 31
Sales
Operating Income (Loss)
Operating Margin
Advanced Fibers and Composites Business Group
9Teijin Limited
and protective clothing in emerging economies, as well as to build
an effective supply chain. Efforts to enhance profi tability in the
carbon fi bers business will emphasize raising the effi ciency of our
two-pronged production confi guration, which encompasses facili-
ties in Japan and Europe. We will also take steps to augment sales
for highly profi table applications, such as aircraft, and for use in
pressure vessels, an area in which barriers to new market entrants
are signifi cant.
Q What are your medium- to long-term strategies?
A With demand expected to continue growing, particularly for
automotive and infrastructure-related applications, we continue to
position para-aramid fi bers as a promising growth business. Our
strategic focus in this area will remain on expanding the scope of
our operations and bolstering our competitiveness. These are chal-
lenges we will address by building on our competitive advantages—
which include the leading share of the global market and the ability
to offer diverse solutions—to reinforce our presence in emerging
economies and advance joint development with customers with
the aim of cultivating new applications. We will also proceed with
the construction of a new facility in Thailand that will produce a
newly developed type of meta-aramid fi ber that combines superior
heat resistance with excellent dyeability, the latter traditionally an
issue with aramid fi bers, thereby enabling us to expand sales
throughout Asia.
Competition in the carbon fi bers and composites business is
likely to intensify further, owing to a shift toward in-house produc-
tion by prepreg manufacturers, as well as to the presence of new
market entrants and aggressive marketing efforts by large-tow
manufacturers. Nonetheless, demand is expected to grow for
use in aircraft and for general industrial applications. We also
anticipate increased demand for use in automotive materials,
a consequence of tighter environmental regulations, in response
to which we will press forward steadily with efforts to hasten the
commercialization of thermoplastic CFRP for mass-produced
automotive applications.
Principal Products
Para-aramid fibers
Brand names Twaron®, Technora®
Applications Brake pads, gaskets, rubber reinforcements (hoses, belts), tires, protective clothing, plastic reinforcements, civil engineering materials, optical fiber reinforcements
Meta-aramid fibers
Brand name Teijinconex®
Applications Fireproof clothing, heat-resistant filters, rubber reinforcements, plastic reinforcements
Carbon fibers
Brand name TENAX®
Applications Aircraft (structural and interior components), general industrial applications (wind turbine blades, pressure vessels), sporting goods (golf club shafts, fishing rods, tennis racquets, yacht bodies)
Carbon fiber composite materials
Applications Automobiles (principal parts and components)
Artificial leather
Brand name Cordley®
Applications Sporting goods (shoes, balls)
Polyester fibers
Brand name Teijin®Tetoron®
Applications Automobile, train and aircraft seats, tire cords, rubber reinforcements, seat belts, mats, cushions, filters
PEN fibers
Brand name Teonex®
Applications Tire cords, transmission belts, high-pressure hoses, speaker cones
10 Teijin Limited
Q How did segment businesses
perform in fi scal 2013?
A Both polycarbonate resin and
polyester fi lm struggled, as heightened
pricing competition drove down sales
prices. In this environment, we took
steps to create an effi cient production
confi guration and reduce costs. In our polycarbonate resin busi-
ness, we suspended production on certain lines at our plant in
Singapore, while in our fi lms business we terminated production
at our domestic joint venture’s Ibaraki factory.
Q What do you see as your principal challenges in fi scal
2014 and how will you respond?
A Given that the adverse supply–demand balance for polycarbon-
ate resin is expected to continue, harsh operating conditions in
this business are likely to persist. In response, we will endeavor
to bolster profi tability by suspending production on an additional
line at our Singapore plant. We are also looking to broaden our
high-performance compounds and processed products businesses,
as well as to expand applications in such areas as automobiles,
housing and infrastructure development, and have established new
sales bases with the goal of cultivating customers in inland areas in
the PRC and the ASEAN region.
We also expect operating conditions in our polyester fi lms busi-
ness to remain challenging, owing mainly to sluggishness in the
market for liquid crystal display (LCD) televisions. In addition to
developing low-priced fi lms for use in LCD televisions, we will
work to further expand sales of release fi lms for manufacturing
processes, which are currently fi rm, particularly for use in the pro-
duction of smartphones and tablet computers. We will also further
integrate and enhance the effi ciency of domestic production facili-
ties, as well as increase capacity and promote the production of
high-value-added items at facilities in Asia.
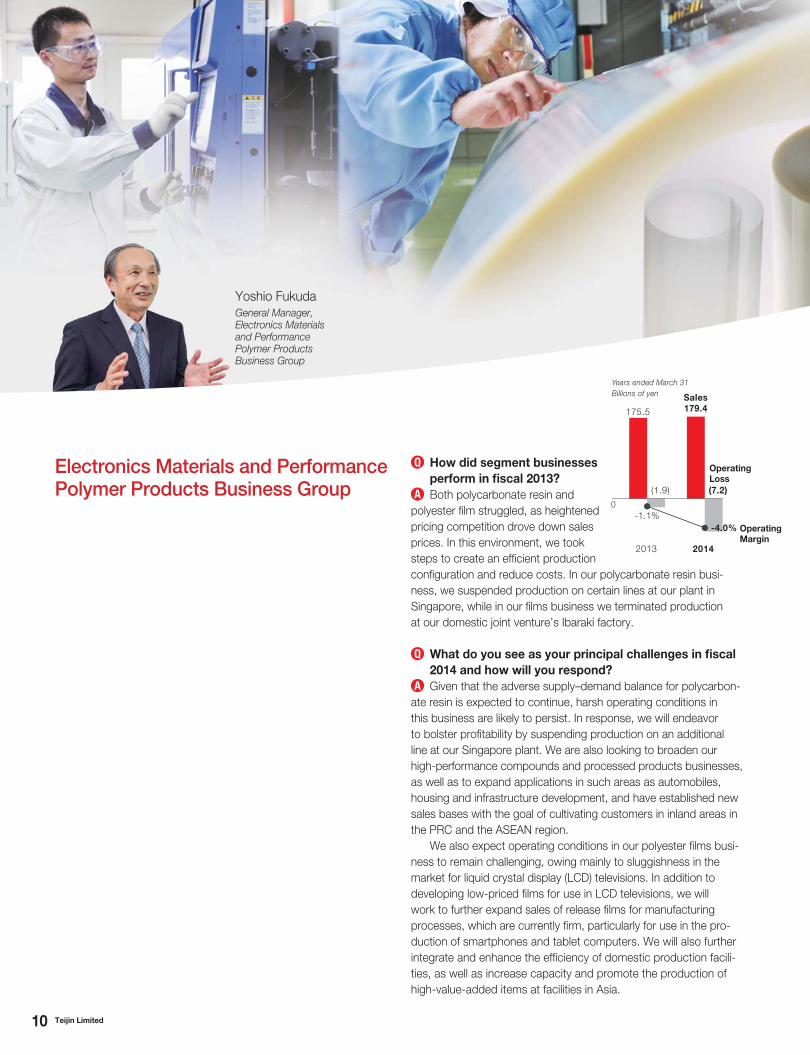
Yoshio FukudaGeneral Manager, Electronics Materials and Performance Polymer Products Business Group
20142013
-1.1%-4.0%
0
175.5 179.4
(1.9) (7.2)
Billions of yenYears ended March 31
Sales
Operating Loss
Operating Margin
Electronics Materials and Performance Polymer Products Business Group
11Teijin Limited
Q What are your medium- to long-term strategies?
A We will continue to direct our attention to achieving a dramatic
increase in profi tability by improving our ability to provide attractive
solutions. We will also accelerate the integration of sales capabilities,
technologies and personnel.
In the resin and plastics processing business, we will broaden
our lineup of compounds that feature other types of resin or com-
bine resin with our high-performance fi bers. As part of this effort,
we will proceed with preparations for the start of operations at a
new polyphenylene sulfi de (PPS) joint venture, which is scheduled
for fi scal 2015. In processed products, our emphasis will be on bol-
stering sales of fi lms that capitalize on the properties of polycarbonate
resin for use in smartphones and tablet computers, as well as on
expanding our lineup of materials that offer both outstanding perfor-
mance and superb decorative potential, including plastic glazing for
automotive applications.
In polyester fi lm, we will promote bold measures aimed at realiz-
ing cost-effective operations and optimizing our product mix in
promising Asian markets. With the goal of providing solutions in
such wide-ranging areas as fl exible displays, next-generation batter-
ies and energy, and automobiles, we will push ahead with the
development of distinctive new fi lms made with materials other than
polyester and will fortify and widen the scope of new processing
technologies.
Principal Products
Polycarbonate resin
Brand name Panlite®
Applications Electrical and electronics components, audiovisual (AV) and
office automation (OA) equipment, personal computer casings,
optical discs (Blu-ray discs, DVDs and CDs), precision instru-
ment components, automotive components (headlamps, door
handles, bumpers)
Brand names Panlite® Sheet, ELECLEAR®, PURE-ACE®
Applications Sheet Mobile phone front panels, flat panel LCD televisions (flame-
resistant sheet), automotive instrument panels, dummy cans
for vending machines
Film LCDs for mobile phones, personal digital assistants (PDAs) and
other handheld electronics equipment, touch screens (OA and
FA equipment, handheld video game machines)
PEN resin
Brand name Teonex®
Applications Cosmetics containers, school lunch dishware,
pharmaceuticals containers, fire extinguishers
PET film
Brand names Teijin®Tetoron®, Mylar®, Melinex®, Teflex®
Applications Industrial applications Film for use in LCD reflective film and in solar cell back sheets,
materials for LCDs and plasma and organic electroluminescent
displays (OELDs), cards (integrated circuit [IC] cards, ID cards,
RFID chips), automotive products (interior and exterior materials
and electronics components)
Packaging materials Laminating film for beverage and food cans, shrink wrap, retort
pouches, environment-friendly plastic trays
PEN film
Brand name Teonex®
Applications Digital videocassettes (DVCs), high-density data backup tapes,
electronics materials, electronic circuit materials, high-performance
materials for automotive applications (seat sensors and hybrid
motor materials)
Processed film
Brand name Purex®
Applications Materials for LCDs, electronics materials, films for semiconduc-
tor materials, medical materials, photocatalysts, moisturizing
facial masks
12 Teijin Limited
Q How did segment
businesses perform in
fi scal 2013?
A Operating conditions for our
domestic pharmaceuticals busi-
ness remained harsh, owing to
the launch of rival products and
rising sales of generic drugs, but
sales of hyperuricemia and gout
treatment febuxostat expanded favorably. In the home healthcare
business, rental volume for therapeutic oxygen concentrators
remained fi rm, while that for CPAP ventilators for the treatment
of sleep apnea syndrome (SAS) rose steadily. Adverse conditions
also persisted in the United States, a situation we responded to by
integrating and closing sales bases and by reducing headcount.
Q What do you see as your principal challenges in fi scal
2014 and how will you respond?
A Our principal challenges in fi scal 2014 will be to ensure sustain-
able growth and improve profi tability. We will address these chal-
lenges by reinforcing marketing efforts and reducing costs, as well
Overview
Pharmaceuticals: Teijin specializes in three key therapeutic
areas, namely, bone and joint disease, respiratory disease
and cardiovascular and metabolic disease, and in Japan
commands a major share of the markets for pharmaceuticals
for treating bone and joint disease and respiratory disease. In
the area of cardiovascular and metabolic disease, Teijin has
positioned febuxostat—a promising treatment for hyperurice-
mia and gout developed in-house—as a strategic product
with global currency and is pushing ahead with efforts to
expand marketing worldwide.
Home Healthcare: Teijin was the fi rst company to commer-
cialize home oxygen therapy (HOT) services in Japan and
maintains its position as the domestic market leader. Teijin
is also Japan’s top provider of continuous positive airway
pressure (CPAP) ventilators. Overseas, Teijin provides home
healthcare services in the United States, Spain and the
Republic of Korea (ROK). Globally, approximately 430,000
individuals use Teijin’s home healthcare services.
Pharmaceuticals Development Pipeline
Area Code No. Target Disease Phase of Clinical Trials Approved/
New LaunchPhase I Phase II Phase III Filed
Bone and joint disease
KTP-001* Lumbar disc hernia
ITM-058 Osteoporosis
Respiratorydisease
NA872ET Expectorant FFeb 2014
PTR-36 Bronchial asthma JJune 20133
Cardiovascular and metabolic disease
TMG-123 Type 2 diabetes
ITM-014N Neuroendocrine tumors OOct 2013
TMX-67TLS Tumor lysis syndrome OOct 2013
TMX-67(PRC) Hyperuricemia and gout
Other
GGS-MPA Microscopic polyangiitis NNov 2013
GGS-ON Optic neuritis
GGS-CIDP Chronic infl ammatory demyelinating polyneuropathy DDec 2013
24.8 24.5
138.3 138.4
17.9% 17.7%
0 20142013
Billions of yenYears ended March 31
Sales
Operating Income
Operating Margin
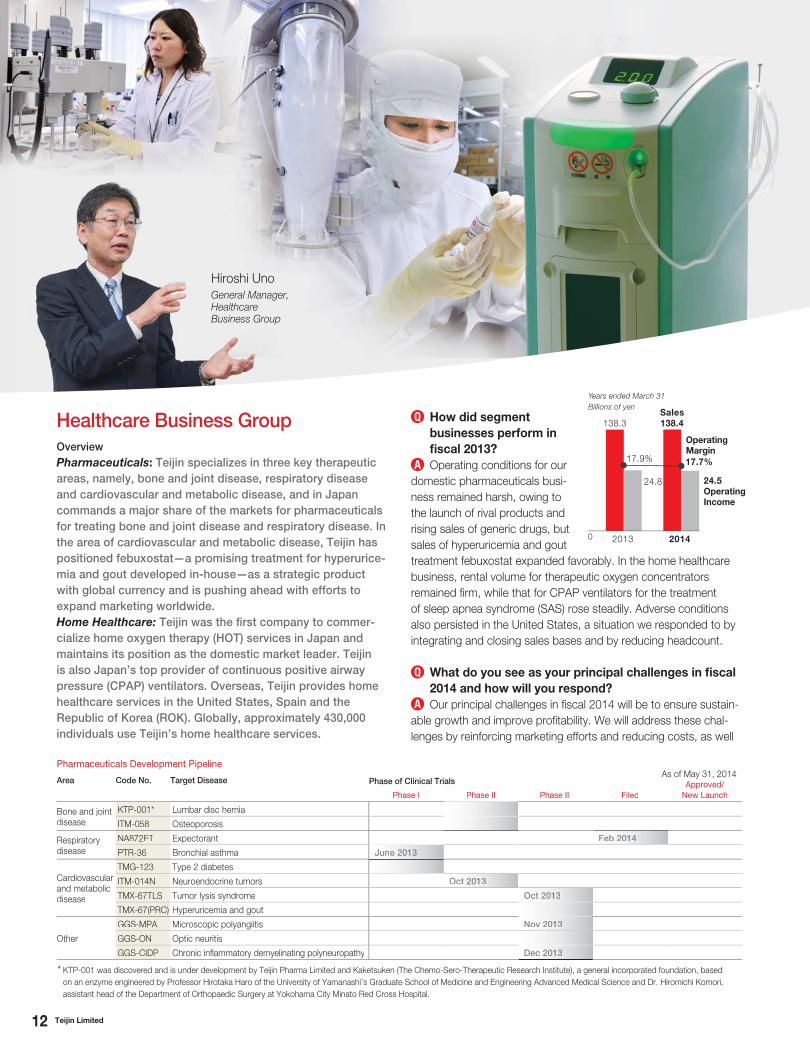
Hiroshi UnoGeneral Manager,Healthcare Business Group
Healthcare Business Group
As of May 31, 2014
* KTP-001 was discovered and is under development by Teijin Pharma Limited and Kaketsuken (The Chemo-Sero-Therapeutic Research Institute), a general incorporated foundation, based
on an enzyme engineered by Professor Hirotaka Haro of the University of Yamanashi’s Graduate School of Medicine and Engineering Advanced Medical Science and Dr. Hiromichi Komori,
assistant head of the Department of Orthopaedic Surgery at Yokohama City Minato Red Cross Hospital.
13Teijin Limited
as by fortifying our drug discovery capabilities and hastening clinical
development efforts.
In pharmaceuticals, we will focus on further bolstering domestic
sales of febuxostat as well as on broadening the overseas availability
of the drug beyond North America and Europe, where it continues
to enjoy solid growth. In home healthcare, our emphasis will be on
increasing rentals of our CPAP ventilators by capitalizing on our
new monitoring system, expanding our call center services and
stepping up marketing efforts. Overseas, we will seek to boost prof-
itability and rebuild the operating foundation of our U.S. operations.
Q What are your medium- to long-term strategies?
A Maintaining our focus on our three key therapeutic areas of
bone and joint disease, respiratory disease and cardiovascular and
metabolic disease, we will continue working to develop new prod-
ucts and services in our pharmaceuticals and home healthcare
businesses, as well as to provide distinctive healthcare solutions
that maximize synergies between the two.
In pharmaceuticals, marketing efforts for febuxostat currently
target the developed world, but in the years ahead we will concen-
trate on augmenting sales in the PRC and other emerging econo-
mies. At the same time, we will actively seek to enlarge our product
portfolio by promoting the in-house development and licensing-in
of promising drug candidates and by ensuring effective life cycle
management. Additionally, we will step up efforts aimed at strength-
ening our pharmaceuticals lineup by collaborating actively with
other fi rms. These include commencing joint R&D with Amgen Inc.
of the United States in the area of novel treatments for autoimmune
disorders.
The focus of initiatives in our home healthcare business will be
on ensuring sustainable growth by advancing the use of CPAP ven-
tilators in the treatment of a wider range of diseases, as well as by
introducing new models—one example being our new portable
oxygen concentrator—and maximizing our expanded call center
capabilities to strengthen our competitive edge. Additionally, we
will strive to diversify into new areas, with a particular emphasis
on devices used in physical rehabilitation.
* Bonalon® is the registered trademark of Merck Sharp & Dohme Corp., Whitehouse
Station, NJ, U.S.A.
† Somatuline® is a registered trademark of Ipsen Pharma S.A.S., Paris, France.
Principal Products
Bone and joint disease
Pharmaceuticals
Bonalon®* Treatment for osteoporosis
Onealfa® Treatment for osteoporosis
Synvisc® Treatment for pain associated with osteoarthritis of
the knee
Home Healthcare
SAFHS® Sonic Accelerated Fracture Healing System
Respiratory disease
Pharmaceuticals
Mucosolvan® Expectorant
Spiropent ® Bronchodilator
Atrovent ® Prophylaxis for bronchial constriction
Rhinocort ® Treatment for allergic rhinitis
Alvesco® Inhaled corticosteroid agent for asthma
Home Healthcare
Hi-Sanso™ series Therapeutic oxygen concentrator
Mildsanso® Therapeutic oxygen concentrator
NIP NASAL® Noninvasive positive pressure ventilator (NPPV) for
sufferers of sleep apnea syndrome (SAS)
SLEEPMATE ® Positive pressure ventilator for sufferers of SAS
AutoSet Positive pressure ventilator for sufferers of SAS
GoodKnight ® Positive pressure ventilator for sufferers of SAS
SleepWatcher ® High-performance sleep disorder diagnostic system
Cardiovascular and metabolic disease
Feburic ® Treatment for hyperuricemia and gout
Tricor ® Treatment for hyperlipidemia
Somatuline ®† Treatment for acromegaly
Other
Venilon ® Treatment for severe infectious diseases
Laxoberon ® Laxative
Bonalfa ® Treatment for psoriasis
14 Teijin Limited
Q How did segment businesses perform in fi scal 2013?
A Results in our fi ber materials and apparel business benefi ted
from robust exports of textiles for use in fashion apparel and sports-
wear to Europe and North America. In textiles and apparel, sales in
our mainstay OEM business rose, although yen depreciation and
higher production costs overseas combined to squeeze profi tability
in all product categories. In industrial textiles and materials, sales of
Overview
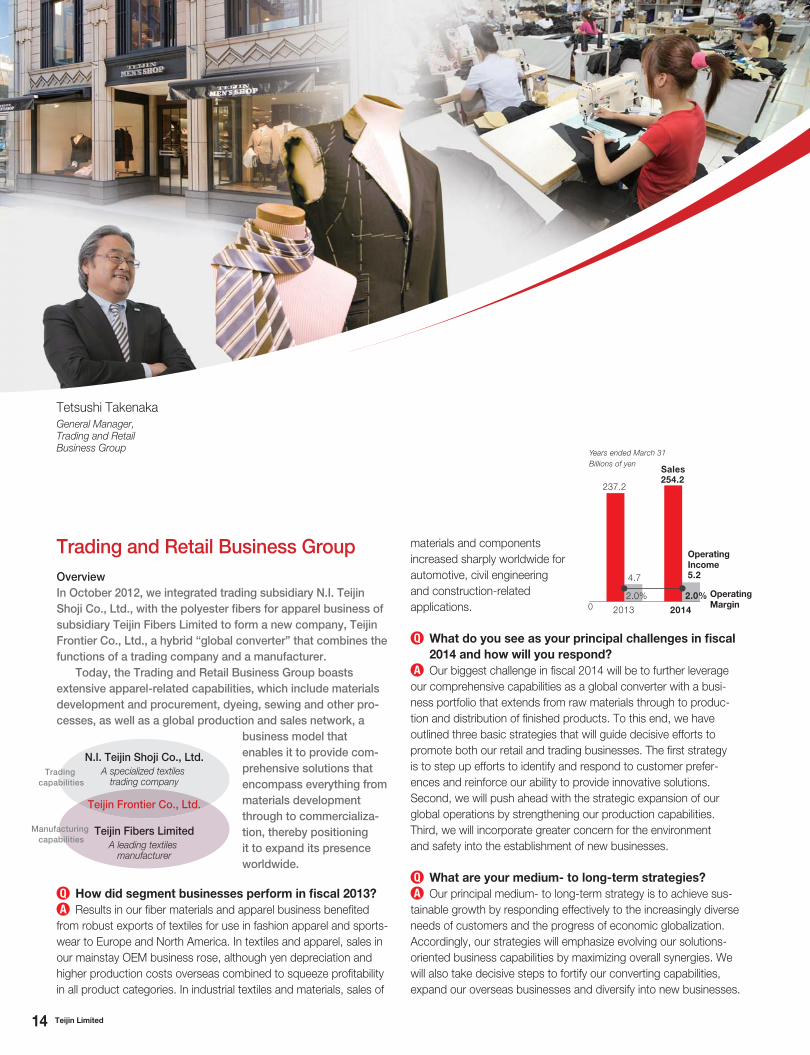
In October 2012, we integrated trading subsidiary N.I. Teijin
Shoji Co., Ltd., with the polyester fi bers for apparel business of
subsidiary Teijin Fibers Limited to form a new company, Teijin
Frontier Co., Ltd., a hybrid “global converter” that combines the
functions of a trading company and a manufacturer.
Today, the Trading and Retail Business Group boasts
extensive apparel-related capabilities, which include materials
development and procurement, dyeing, sewing and other pro-
cesses, as well as a global production and sales network, a
business model that
enables it to provide com-
prehensive solutions that
encompass everything from
materials development
through to commercializa-
tion, thereby positioning
it to expand its presence
worldwide.
N.I. Teijin Shoji Co., Ltd.A specialized textiles
trading company
Teijin Fibers LimitedA leading textiles
manufacturer
Manufacturing
capabilities
Trading
capabilities
Teijin Frontier Co., Ltd.
materials and components
increased sharply worldwide for
automotive, civil engineering
and construction-related
applications.
Q What do you see as your principal challenges in fi scal
2014 and how will you respond?
A Our biggest challenge in fi scal 2014 will be to further leverage
our comprehensive capabilities as a global converter with a busi-
ness portfolio that extends from raw materials through to produc-
tion and distribution of fi nished products. To this end, we have
outlined three basic strategies that will guide decisive efforts to
promote both our retail and trading businesses. The fi rst strategy
is to step up efforts to identify and respond to customer prefer-
ences and reinforce our ability to provide innovative solutions.
Second, we will push ahead with the strategic expansion of our
global operations by strengthening our production capabilities.
Third, we will incorporate greater concern for the environment
and safety into the establishment of new businesses.
Q What are your medium- to long-term strategies?
A Our principal medium- to long-term strategy is to achieve sus-
tainable growth by responding effectively to the increasingly diverse
needs of customers and the progress of economic globalization.
Accordingly, our strategies will emphasize evolving our solutions-
oriented business capabilities by maximizing overall synergies. We
will also take decisive steps to fortify our converting capabilities,
expand our overseas businesses and diversify into new businesses.
Tetsushi TakenakaGeneral Manager,Trading and Retail Business Group
0
4.7 5.2
237.2254.2
2.0% 2.0%
20142013
Billions of yenYears ended March 31
Sales
Operating Income
Operating Margin
Trading and Retail Business Group
15Teijin Limited
Q How did segment businesses perform in fi scal 2013?
A In IT services, sales generated by healthcare-related services
rose, while ongoing efforts to strengthen quality control, the transfer
of unprofi table businesses and other factors supported an increase
in profi tability. In net services, results were fi rm for smartphone-based
services, including the distribution of e-books. As a consequence,
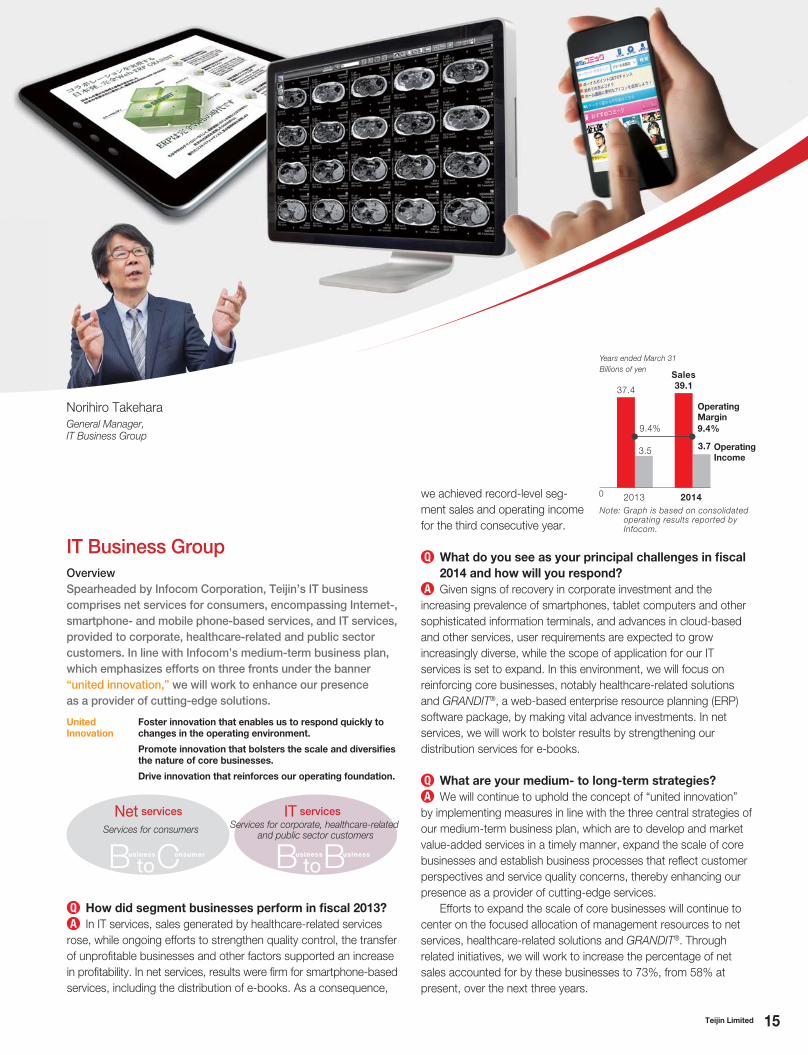
Norihiro TakeharaGeneral Manager,IT Business Group
Overview
Spearheaded by Infocom Corporation, Teijin’s IT business
comprises net services for consumers, encompassing Internet-,
smartphone- and mobile phone-based services, and IT services,
provided to corporate, healthcare-related and public sector
customers. In line with Infocom’s medium-term business plan,
which emphasizes efforts on three fronts under the banner
“united innovation,” we will work to enhance our presence
as a provider of cutting-edge solutions.
Net services IT services
Services for consumers Services for corporate, healthcare-related and public sector customers
toB Business usiness
toB Cusiness onsumer
we achieved record-level seg-
ment sales and operating income
for the third consecutive year.
Q What do you see as your principal challenges in fi scal
2014 and how will you respond?
A Given signs of recovery in corporate investment and the
increasing prevalence of smartphones, tablet computers and other
sophisticated information terminals, and advances in cloud-based
and other services, user requirements are expected to grow
increasingly diverse, while the scope of application for our IT
services is set to expand. In this environment, we will focus on
reinforcing core businesses, notably healthcare-related solutions
and GRANDIT®, a web-based enterprise resource planning (ERP)
software package, by making vital advance investments. In net
services, we will work to bolster results by strengthening our
distribution services for e-books.
Q What are your medium- to long-term strategies?
A We will continue to uphold the concept of “united innovation”
by implementing measures in line with the three central strategies of
our medium-term business plan, which are to develop and market
value-added services in a timely manner, expand the scale of core
businesses and establish business processes that refl ect customer
perspectives and service quality concerns, thereby enhancing our
presence as a provider of cutting-edge services.
Efforts to expand the scale of core businesses will continue to
center on the focused allocation of management resources to net
services, healthcare-related solutions and GRANDIT®. Through
related initiatives, we will work to increase the percentage of net
sales accounted for by these businesses to 73%, from 58% at
present, over the next three years.
United Innovation
Foster innovation that enables us to respond quickly to changes in the operating environment.
Promote innovation that bolsters the scale and diversifi es the nature of core businesses.
Drive innovation that reinforces our operating foundation.
0
3.5 3.7
37.4 39.1
9.4% 9.4%
20142013
Billions of yenYears ended March 31
Sales
Operating Income
Operating Margin
Note: Graph is based on consolidated operating results reported by Infocom.
IT Business Group
16 Teijin Limited
Q What was the purpose of recent organizational
changes?
A Guided by our current medium- to long-term management
vision, CHANGE for 2016, which began in 2012, the Teijin Group is
working to drive growth and evolve its business model. In line with
the Group’s transformation and growth strategies, and to revamp
the Group’s fundamental portfolios, there is a greater need now
than ever before to rally the capabilities of the Group to facilitate the
creation of new businesses. The recent realignment of the Group’s
R&D and new business development structure was meant principally
to facilitate this.
In April 2014, the business development side of the former New
Business Development Group was reorganized and renamed the
New Business Development Business Unit, while the group’s
research function became part of the Technology Center. This
realignment has positioned us to focus on swiftly commercializing
the achievements of core projects.
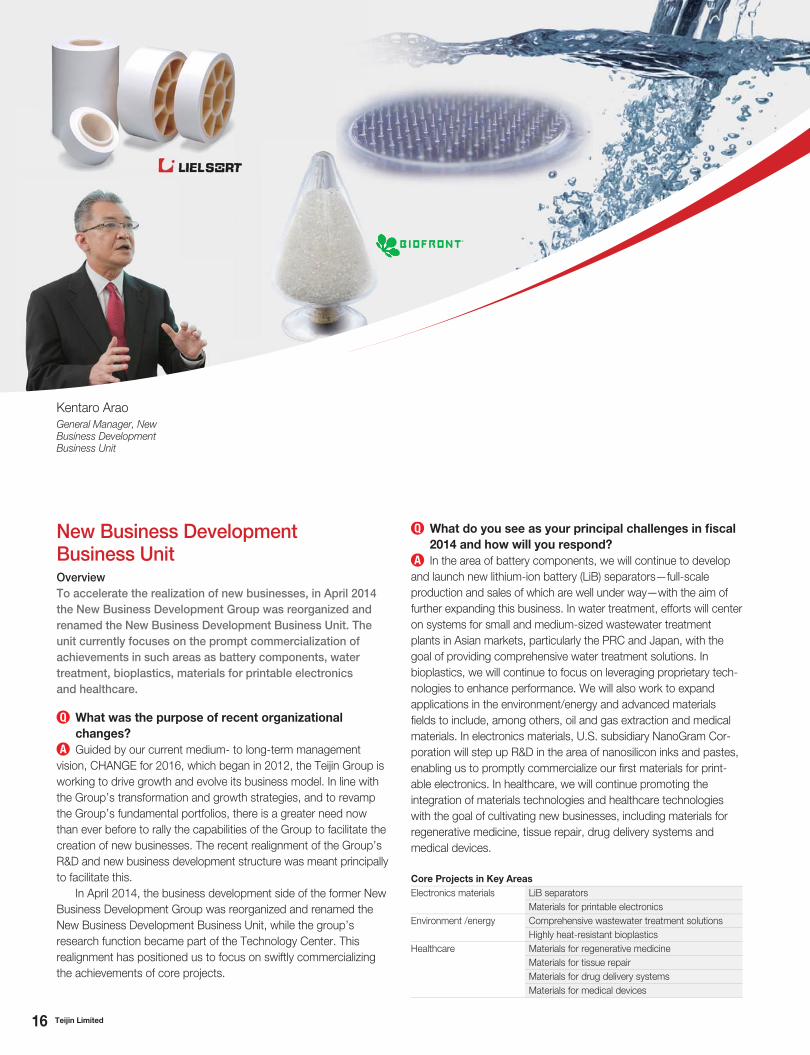
Overview
To accelerate the realization of new businesses, in April 2014
the New Business Development Group was reorganized and
renamed the New Business Development Business Unit. The
unit currently focuses on the prompt commercialization of
achievements in such areas as battery components, water
treatment, bioplastics, materials for printable electronics
and healthcare.
Q What do you see as your principal challenges in fi scal
2014 and how will you respond?
A In the area of battery components, we will continue to develop
and launch new lithium-ion battery (LiB) separators—full-scale
production and sales of which are well under way—with the aim of
further expanding this business. In water treatment, efforts will center
on systems for small and medium-sized wastewater treatment
plants in Asian markets, particularly the PRC and Japan, with the
goal of providing comprehensive water treatment solutions. In
bioplastics, we will continue to focus on leveraging proprietary tech-
nologies to enhance performance. We will also work to expand
applications in the environment/energy and advanced materials
fi elds to include, among others, oil and gas extraction and medical
materials. In electronics materials, U.S. subsidiary NanoGram Cor-
poration will step up R&D in the area of nanosilicon inks and pastes,
enabling us to promptly commercialize our fi rst materials for print-
able electronics. In healthcare, we will continue promoting the
integration of materials technologies and healthcare technologies
with the goal of cultivating new businesses, including materials for
regenerative medicine, tissue repair, drug delivery systems and
medical devices.
New Business Development Business Unit
Kentaro AraoGeneral Manager, New Business Development Business Unit
Core Projects in Key Areas
Electronics materials LiB separators
Materials for printable electronics
Environment /energy Comprehensive wastewater treatment solutions
Highly heat-resistant bioplastics
Healthcare Materials for regenerative medicine
Materials for tissue repair
Materials for drug delivery systems
Materials for medical devices
17Teijin Limited
Recognizing technological innovation as vital to ensuring
sustainable growth, we continue to place a high priority on
R&D. Guided by the Chief Science and Technology Offi cer,
more than 1,600 researchers at eight major R&D sites in Japan
and eight overseas continue to undertake ambitious R&D and
contribute to the evolution of our unique solutions-oriented
business model.
For strategic purposes, we group highly promising markets
into fi ve key fi elds—sustainable transportation; information
and electronics; safety and protection; environment/energy;
and healthcare—in which we concentrate R&D resources with
the aim of providing innovative solutions.
Research and Development
In existing businesses, our focus is on improving competi-
tiveness. Having expanded our product pipeline, reviewed our
technology roadmap and taken steps to optimize our produc-
tion confi gurations, we are now promoting investments
designed to improve the effi ciency of our R&D efforts, among
others. We are also pressing forward with the development of
components and devices that integrate our outstanding propri-
etary materials with advanced processing technologies and
with collaboration with customers in the development of new
products. In addition, we continue to encourage open innova-
tion through partnerships involving industry, government and
academia, as well as to reassess and strengthen processes
and systems that support R&D, including our intellectual prop-
erty strategies and materials analysis practices. We also work
to foster the abilities of R&D personnel.
In April 2014, we integrated the functions of the Chief
Science and Technology Offi cer with the Engineering Division,
the Raw Materials and Polymers Technology Development
Division and the research function of the former New Business
Development Group to create the Technology Center, a move
designed to reinforce overall R&D. We also established the
New Business Development Business Unit, which is charged
with promoting individual projects and accelerating commer-
cialization.
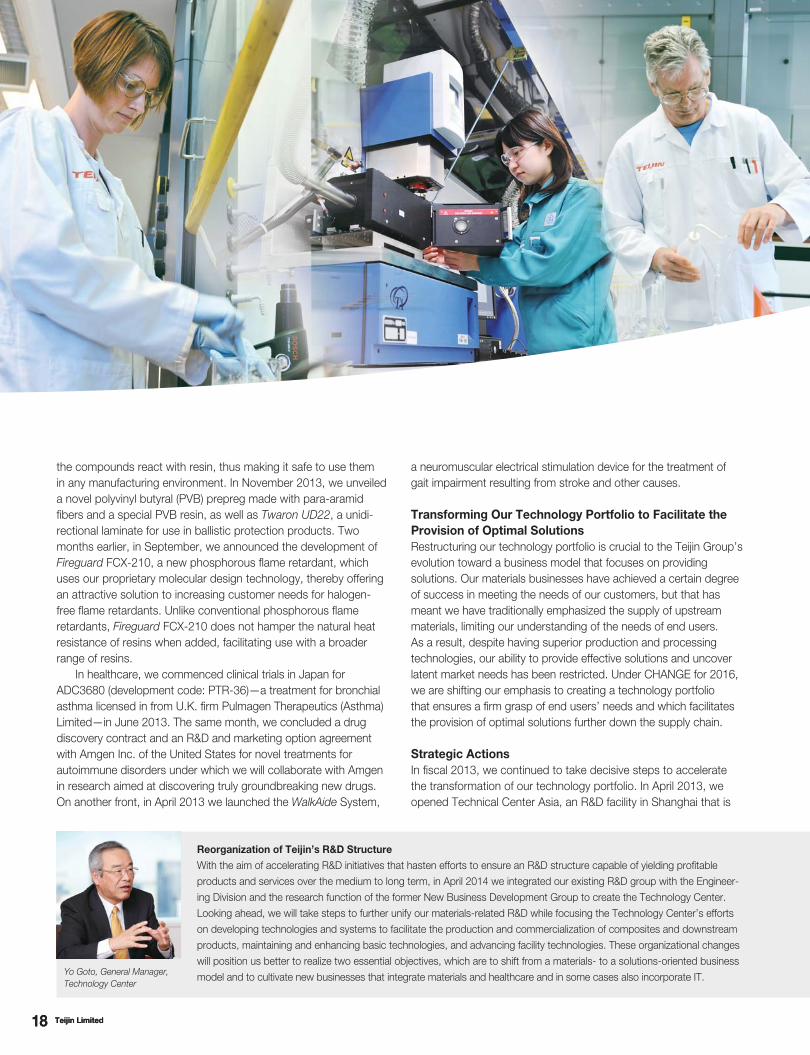
Achievements in Fiscal 2013
R&D highlights in our materials businesses included the develop-
ment in July 2013 of a new hydrolysis-resisting agent for use in
cyclic carbodiimide compounds. The cyclic structure of these
compounds prevents the generation of isocyanate gas when
We are implementing a number of organizational reforms aimed
at reinforcing our R&D capabilities and facilitating the early commercialization
of promising new products.
18 Teijin Limited 18 Teijin Limited
the compounds react with resin, thus making it safe to use them
in any manufacturing environment. In November 2013, we unveiled
a novel polyvinyl butyral (PVB) prepreg made with para-aramid
fi bers and a special PVB resin, as well as Twaron UD22, a unidi-
rectional laminate for use in ballistic protection products. Two
months earlier, in September, we announced the development of
Fireguard FCX-210, a new phosphorous fl ame retardant, which
uses our proprietary molecular design technology, thereby offering
an attractive solution to increasing customer needs for halogen-
free fl ame retardants. Unlike conventional phosphorous fl ame
retardants, Fireguard FCX-210 does not hamper the natural heat
resistance of resins when added, facilitating use with a broader
range of resins.
In healthcare, we commenced clinical trials in Japan for
ADC3680 (development code: PTR-36)—a treatment for bronchial
asthma licensed in from U.K. fi rm Pulmagen Therapeutics (Asthma)
Limited—in June 2013. The same month, we concluded a drug
discovery contract and an R&D and marketing option agreement
with Amgen Inc. of the United States for novel treatments for
autoimmune disorders under which we will collaborate with Amgen
in research aimed at discovering truly groundbreaking new drugs.
On another front, in April 2013 we launched the WalkAide System,
a neuromuscular electrical stimulation device for the treatment of
gait impairment resulting from stroke and other causes.
Transforming Our Technology Portfolio to Facilitate the
Provision of Optimal Solutions
Restructuring our technology portfolio is crucial to the Teijin Group’s
evolution toward a business model that focuses on providing
solutions. Our materials businesses have achieved a certain degree
of success in meeting the needs of our customers, but that has
meant we have traditionally emphasized the supply of upstream
materials, limiting our understanding of the needs of end users.
As a result, despite having superior production and processing
technologies, our ability to provide effective solutions and uncover
latent market needs has been restricted. Under CHANGE for 2016,
we are shifting our emphasis to creating a technology portfolio
that ensures a fi rm grasp of end users’ needs and which facilitates
the provision of optimal solutions further down the supply chain.
Strategic Actions
In fi scal 2013, we continued to take decisive steps to accelerate
the transformation of our technology portfolio. In April 2013, we
opened Technical Center Asia, an R&D facility in Shanghai that is
Reorganization of Teijin’s R&D Structure
With the aim of accelerating R&D initiatives that hasten efforts to ensure an R&D structure capable of yielding profi table
products and services over the medium to long term, in April 2014 we integrated our existing R&D group with the Engineer-
ing Division and the research function of the former New Business Development Group to create the Technology Center.
Looking ahead, we will take steps to further unify our materials-related R&D while focusing the Technology Center’s efforts
on developing technologies and systems to facilitate the production and commercialization of composites and downstream
products, maintaining and enhancing basic technologies, and advancing facility technologies. These organizational changes
will position us better to realize two essential objectives, which are to shift from a materials- to a solutions-oriented business
model and to cultivate new businesses that integrate materials and healthcare and in some cases also incorporate IT.Yo Goto, General Manager,
Technology Center
19Teijin Limited
charged with developing applications and providing technical ser-
vices to customers in the PRC and elsewhere in Asia. Designed as
an open facility, Technical Center Asia will seek to create new solu-
tions that accommodate the needs of Teijin customers throughout
the region.
In our polyester fi bers business, we proceeded with preparations
for the April 2014 establishment of Teijin Product Development
China Co., Ltd., in Nantong, Jiangsu Province. This facility conducts
R&D in all aspects of polyester fi bers, from yarn through to fi nished
products, and in the area of production capabilities, enabling us
to respond swiftly to local demand for the integration of R&D and
production in one location.
In May 2013, we relocated the Teijin Composites Innovation
Center, the hub of R&D in the area of thermoplastic CFRP, from
Shizuoka Prefecture to our Matsuyama Plant, which is in Ehime
Prefecture and also houses a thermoplastic CFRP pilot plant,
thereby creating a confi guration that allows us to centralize
all CFRP-related development, from molding technologies to
composite materials and engineering and bonding technologies.
Fostering the Next Generation of Teijin Researchers
In addition to seconding individuals to leading research institutions
both in Japan and overseas, we work to foster junior researchers
through such initiatives as the Teijin 21st Century Forum, which
provides an opportunity for the exchange of information and opinions
with leading researchers invited from top domestic university and
public sector research institutions, and the Teijin Technology Advi-
sory Council. Our Teijin Techno College is staffed by former Teijin
employees, retired from management-level positions, who act as
instructors, sharing their expertise, skill and technological knowledge
with current R&D personnel. We are also fortunate to have Dr. Ei-ichi
Negishi, a Nobel Prize in Chemistry 2010 laureate and a former Teijin
employee, on staff as a Teijin Group Distinguished Fellow, a capacity
that enables him to extend invaluable guidance to our researchers.
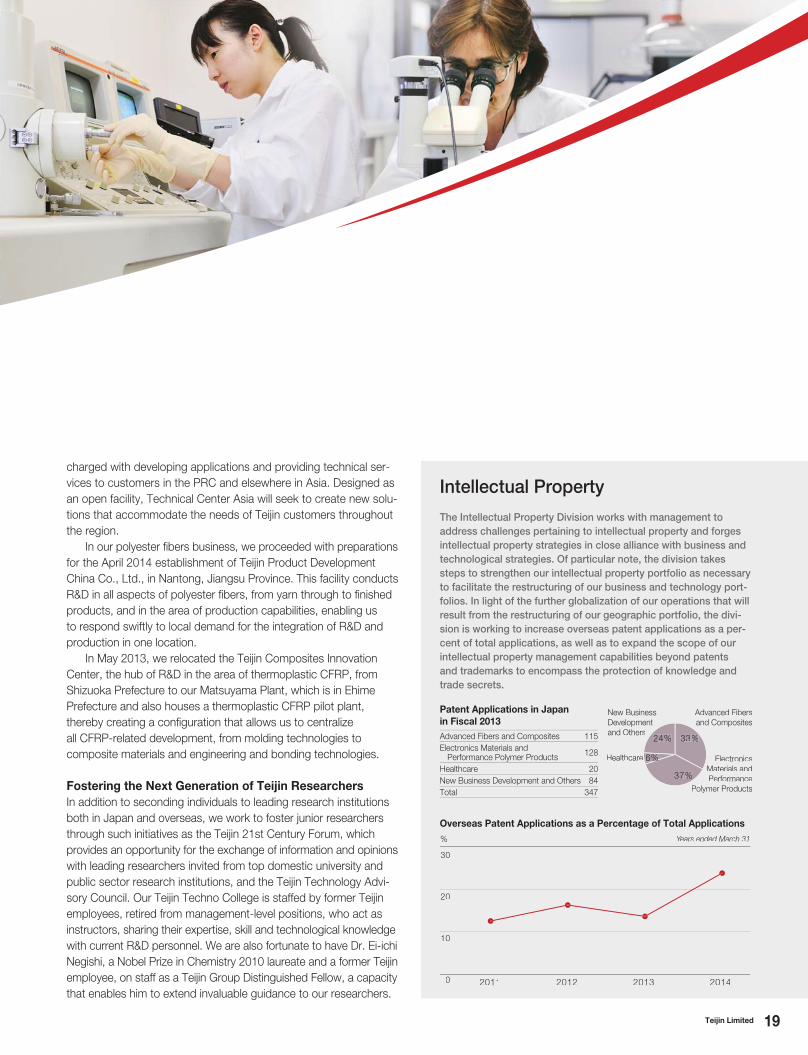
Overseas Patent Applications as a Percentage of Total Applications
Advanced Fibers and Composites 115
Electronics Materials and Performance Polymer Products
128
Healthcare 20
New Business Development and Others 84
Total 347
Intellectual Property
The Intellectual Property Division works with management to
address challenges pertaining to intellectual property and forges
intellectual property strategies in close alliance with business and
technological strategies. Of particular note, the division takes
steps to strengthen our intellectual property portfolio as necessary
to facilitate the restructuring of our business and technology port-
folios. In light of the further globalization of our operations that will
result from the restructuring of our geographic portfolio, the divi-
sion is working to increase overseas patent applications as a per-
cent of total applications, as well as to expand the scope of our
intellectual property management capabilities beyond patents
and trademarks to encompass the protection of knowledge and
trade secrets.
Patent Applications in Japan
in Fiscal 2013
33%24%
6%%%%
New BusinessDevelopmentand Others
Healthcare
Advanced Fibers and Composites
37%
Electronics Materials andPerformance
Polymer Products
10
20
30
0 2011 20142012 2013
% Years ended March 31
20 Teijin Limited
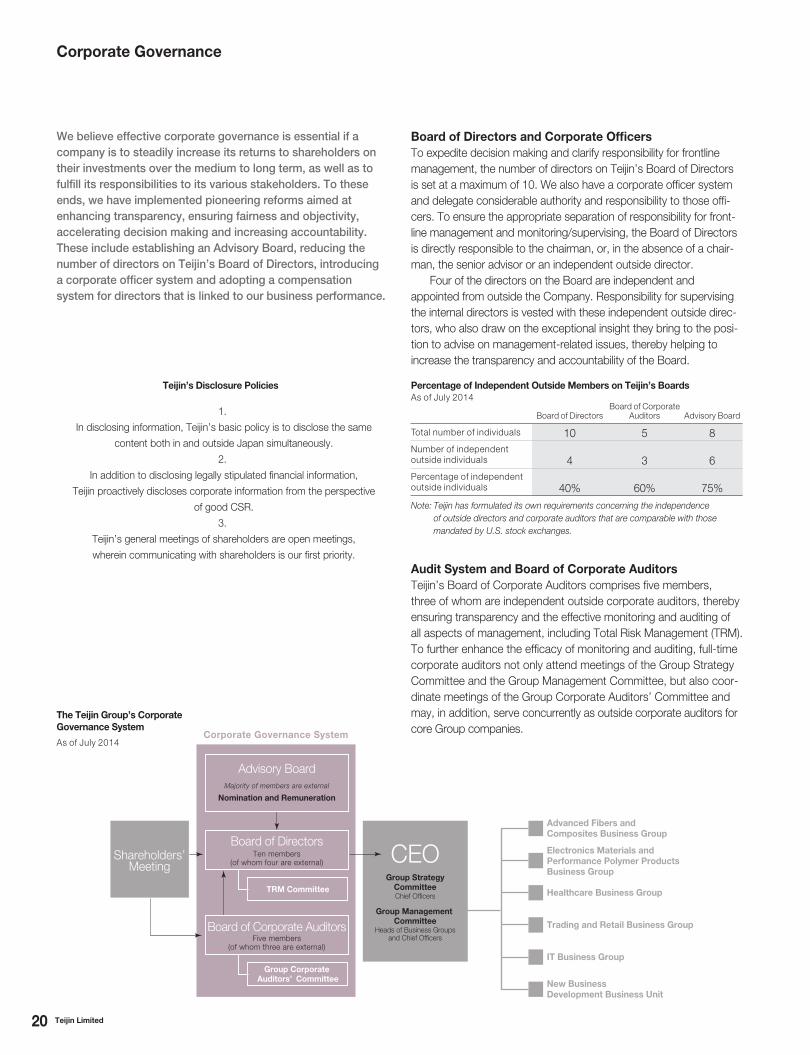
New Business Development Business Unit
IT Business Group
Trading and Retail Business Group
Healthcare Business Group
Electronics Materials andPerformance Polymer Products Business Group
Advanced Fibers and Composites Business Group
Majority of members are external
Corporate Governance System
Ten members(of whom four are external)
Five members(of whom three are external)
Advisory Board
Shareholders’Meeting
Board of Directors
Board of Corporate Auditors
CEOTRM Committee
Nomination and Remuneration
Group Corporate Auditors’ Committee
Group Management Committee
Heads of Business Groupsand Chief Officers
Group Strategy CommitteeChief Officers
We believe effective corporate governance is essential if a
company is to steadily increase its returns to shareholders on
their investments over the medium to long term, as well as to
fulfi ll its responsibilities to its various stakeholders. To these
ends, we have implemented pioneering reforms aimed at
enhancing transparency, ensuring fairness and objectivity,
accelerating decision making and increasing accountability.
These include establishing an Advisory Board, reducing the
number of directors on Teijin’s Board of Directors, introducing
a corporate offi cer system and adopting a compensation
system for directors that is linked to our business performance.
Board of Directors and Corporate Offi cers
To expedite decision making and clarify responsibility for frontline management, the number of directors on Teijin’s Board of Directors is set at a maximum of 10. We also have a corporate offi cer system and delegate considerable authority and responsibility to those offi -cers. To ensure the appropriate separation of responsibility for front-line management and monitoring/supervising, the Board of Directors is directly responsible to the chairman, or, in the absence of a chair-man, the senior advisor or an independent outside director. Four of the directors on the Board are independent and appointed from outside the Company. Responsibility for supervising the internal directors is vested with these independent outside direc-tors, who also draw on the exceptional insight they bring to the posi-tion to advise on management-related issues, thereby helping to increase the transparency and accountability of the Board.
Teijin’s Disclosure Policies
1.
In disclosing information, Teijin’s basic policy is to disclose the same
content both in and outside Japan simultaneously.
2.
In addition to disclosing legally stipulated fi nancial information,
Teijin proactively discloses corporate information from the perspective
of good CSR.
3.
Teijin’s general meetings of shareholders are open meetings,
wherein communicating with shareholders is our fi rst priority.
The Teijin Group’s Corporate
Governance System
As of July 2014
Corporate Governance
Audit System and Board of Corporate Auditors
Teijin’s Board of Corporate Auditors comprises fi ve members, three of whom are independent outside corporate auditors, thereby ensuring transparency and the effective monitoring and auditing of all aspects of management, including Total Risk Management (TRM). To further enhance the effi cacy of monitoring and auditing, full-time corporate auditors not only attend meetings of the Group Strategy Committee and the Group Management Committee, but also coor-dinate meetings of the Group Corporate Auditors’ Committee and may, in addition, serve concurrently as outside corporate auditors for core Group companies.
Board of DirectorsBoard of Corporate
Auditors Advisory Board
Total number of individuals 10 5 8Number of independent outside individuals 4 3 6Percentage of independent outside individuals 40% 60% 75%
Note: Teijin has formulated its own requirements concerning the independence
of outside directors and corporate auditors that are comparable with those
mandated by U.S. stock exchanges.
Percentage of Independent Outside Members on Teijin’s BoardsAs of July 2014
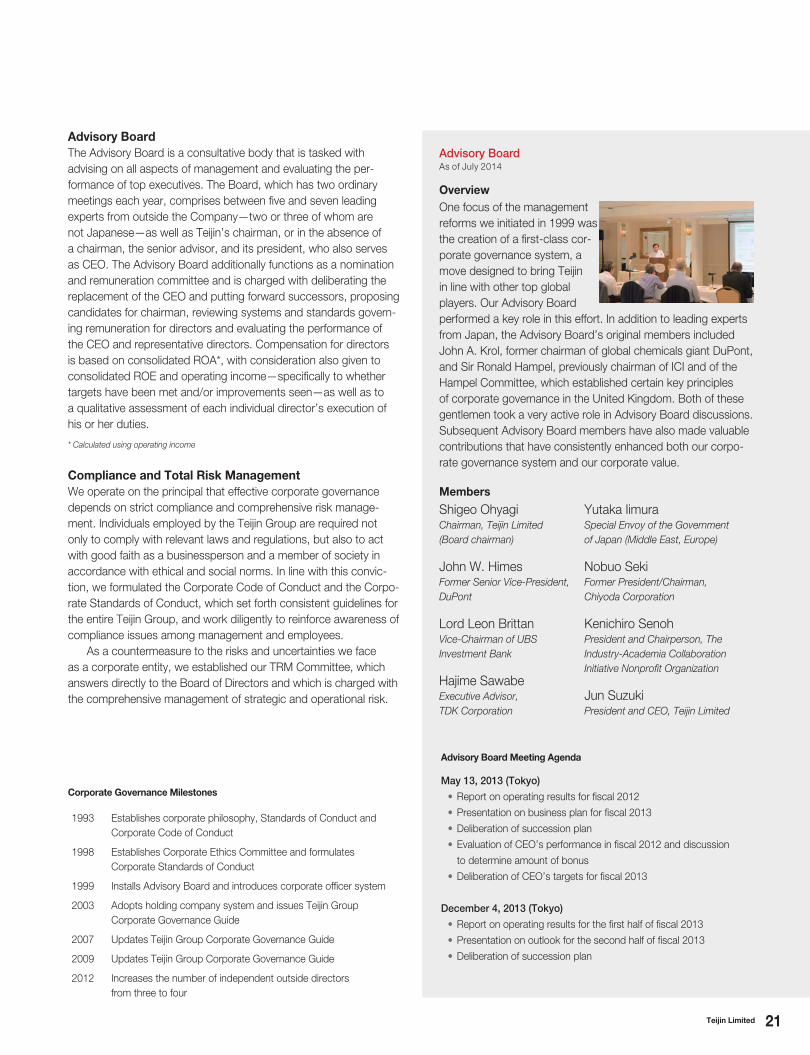
21Teijin Limited
One focus of the management reforms we initiated in 1999 was the creation of a fi rst-class cor-porate governance system, a move designed to bring Teijin in line with other top global players. Our Advisory Board performed a key role in this effort. In addition to leading experts from Japan, the Advisory Board’s original members included John A. Krol, former chairman of global chemicals giant DuPont, and Sir Ronald Hampel, previously chairman of ICI and of the Hampel Committee, which established certain key principles of corporate governance in the United Kingdom. Both of these gentlemen took a very active role in Advisory Board discussions. Subsequent Advisory Board members have also made valuable contributions that have consistently enhanced both our corpo-rate governance system and our corporate value.
Shigeo OhyagiChairman, Teijin Limited
(Board chairman)
John W. HimesFormer Senior Vice-President,
DuPont
Lord Leon BrittanVice-Chairman of UBS
Investment Bank
Hajime SawabeExecutive Advisor,
TDK Corporation
Corporate Governance Milestones
1993 Establishes corporate philosophy, Standards of Conduct and Corporate Code of Conduct
1998 Establishes Corporate Ethics Committee and formulates Corporate Standards of Conduct
1999 Installs Advisory Board and introduces corporate offi cer system
2003 Adopts holding company system and issues Teijin Group Corporate Governance Guide
2007 Updates Teijin Group Corporate Governance Guide
2009 Updates Teijin Group Corporate Governance Guide
2012 Increases the number of independent outside directors from three to four
Advisory Board
The Advisory Board is a consultative body that is tasked with advising on all aspects of management and evaluating the per-formance of top executives. The Board, which has two ordinary meetings each year, comprises between fi ve and seven leading experts from outside the Company—two or three of whom are not Japanese—as well as Teijin’s chairman, or in the absence of a chairman, the senior advisor, and its president, who also serves as CEO. The Advisory Board additionally functions as a nomination and remuneration committee and is charged with deliberating the replacement of the CEO and putting forward successors, proposing candidates for chairman, reviewing systems and standards govern-ing remuneration for directors and evaluating the performance of the CEO and representative directors. Compensation for directors is based on consolidated ROA*, with consideration also given to consolidated ROE and operating income—specifi cally to whether targets have been met and/or improvements seen—as well as to a qualitative assessment of each individual director’s execution of his or her duties.
* Calculated using operating income
Compliance and Total Risk Management
We operate on the principal that effective corporate governance depends on strict compliance and comprehensive risk manage-ment. Individuals employed by the Teijin Group are required not only to comply with relevant laws and regulations, but also to act with good faith as a businessperson and a member of society in accordance with ethical and social norms. In line with this convic-tion, we formulated the Corporate Code of Conduct and the Corpo-rate Standards of Conduct, which set forth consistent guidelines for the entire Teijin Group, and work diligently to reinforce awareness of compliance issues among management and employees. As a countermeasure to the risks and uncertainties we face as a corporate entity, we established our TRM Committee, which answers directly to the Board of Directors and which is charged with the comprehensive management of strategic and operational risk.
Yutaka IimuraSpecial Envoy of the Government
of Japan (Middle East, Europe)
Nobuo SekiFormer President/Chairman,
Chiyoda Corporation
Kenichiro SenohPresident and Chairperson, The
Industry-Academia Collaboration
Initiative Nonprofi t Organization
Jun SuzukiPresident and CEO, Teijin Limited
Advisory BoardAs of July 2014
Advisory Board Meeting Agenda
May 13, 2013 (Tokyo)
• Report on operating results for fi scal 2012
• Presentation on business plan for fi scal 2013
• Deliberation of succession plan
• Evaluation of CEO’s performance in fi scal 2012 and discussion
to determine amount of bonus
• Deliberation of CEO’s targets for fi scal 2013
December 4, 2013 (Tokyo)
• Report on operating results for the fi rst half of fi scal 2013
• Presentation on outlook for the second half of fi scal 2013
• Deliberation of succession plan
Overview
Members
22 Teijin Limited
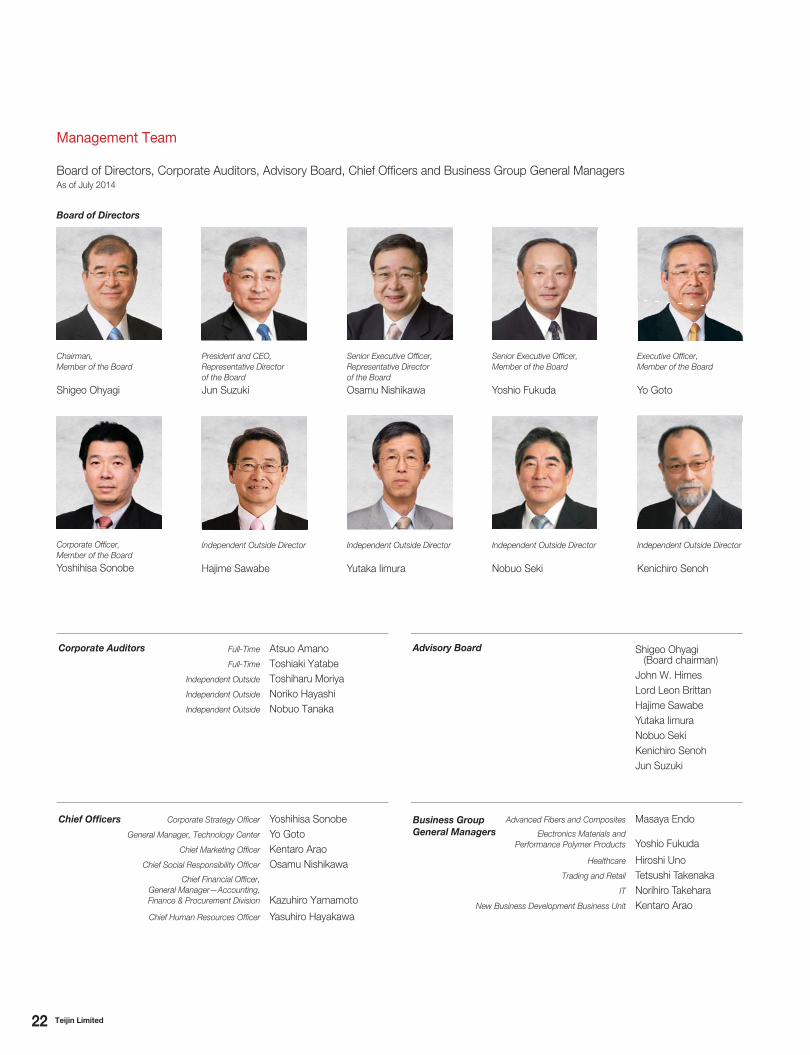
Management Team
Board of Directors, Corporate Auditors, Advisory Board, Chief Offi cers and Business Group General ManagersAs of July 2014
Board of Directors
Chairman,
Member of the Board
Shigeo Ohyagi
President and CEO,
Representative Director
of the Board
Jun Suzuki
Senior Executive Officer,
Representative Director
of the Board
Osamu Nishikawa
Senior Executive Officer,
Member of the Board
Yoshio Fukuda
Corporate Officer,
Member of the Board
Yoshihisa Sonobe
Independent Outside Director
Hajime Sawabe
Independent Outside Director
Yutaka Iimura
Independent Outside Director
Kenichiro Senoh
Independent Outside Director
Nobuo Seki
Executive Officer,
Member of the Board
Yo Goto
Corporate Auditors Full-Time Atsuo Amano Full-Time Toshiaki Yatabe
Independent Outside Toshiharu Moriya Independent Outside Noriko HayashiIndependent Outside Nobuo Tanaka
Advisory Board Shigeo Ohyagi (Board chairman)John W. HimesLord Leon BrittanHajime SawabeYutaka IimuraNobuo SekiKenichiro SenohJun Suzuki
Business Group General Managers
Advanced Fibers and Composites Masaya EndoElectronics Materials and
Performance Polymer Products Yoshio Fukuda
Healthcare Hiroshi UnoTrading and Retail Tetsushi Takenaka
IT Norihiro Takehara New Business Development Business Unit Kentaro Arao
Chief Offi cers Corporate Strategy Offi cer Yoshihisa SonobeGeneral Manager, Technology Center Yo Goto
Chief Marketing Offi cer Kentaro Arao Chief Social Responsibility Offi cer Osamu Nishikawa
Chief Financial Offi cer,
General Manager—Accounting,
Finance & Procurement Division Kazuhiro Yamamoto
Chief Human Resources Offi cer Yasuhiro Hayakawa
23Teijin Limited
Selective CSR
Advanced CSR
Philanthropic activities
Personnel and occupational issues,
Purchasing and procurement
Basic CSR Compliance, Risk management, ESH, Disaster mitigation,
Product liability issues and quality assurance
CSR Management
The Evolution of Teijin’s CSR Program
The basic goals underlying our approach to CSR are articulated
by the phrases, “Quality of Life,” “In Harmony with Society” and
“Empowering our People,” which comprise the Teijin Group corpo-
rate philosophy, set forth in 1993. To achieve the goals entailed in
this philosophy, we have formulated a basic policy for CSR and
continue to implement systematic, well-planned initiatives. In April
2005, we inaugurated the role of Chief Social Responsibility Offi cer
and created an internal organization to coordinate all aspects of our
CSR program, including corporate ethics; compliance; risk man-
agement; environment, safety and health (ESH); product liability;
and efforts to contribute to society. We have also developed spe-
cifi c policies, targets and strategies and continue to promote a wide
range of related activities. Fiscal 2011 was our fi rst year as a mem-
ber of the United Nations Global Compact. By joining this program,
we committed ourselves to abiding by a set of universally accepted
principles related to human rights, labor practices, environmental
concerns and the prevention of corruption.
Advancing CSR Management
We categorize our various CSR initiatives as addressing “basic,”
“advanced” or “selective” issues. This categorization has enabled
us to clarify the focus of and appropriate course of action for these
initiatives, set medium-term goals and enhance the effectiveness
of our activities.
Our CSR management system centers on the Group CSR
Committee, which considers proposals and drives the implementa-
tion of CSR initiatives for the entire Teijin Group. The Committee
oversees six supporting entities, comprising fi ve subcommittees
and one conference. Four of these supporting entities—the Group
ESH Subcommittee, the Group Compliance and Risk Management
Subcommittee, the Group Product Liability and Quality Assurance
Subcommittee and the Group Secure Export Control Conference—
are collectively in charge of CSR initiatives that focus on basic
issues, which the Group views as particularly important. CSR
initiatives pertaining to advanced and selective issues are the
responsibility of the Group CSR Promotion Subcommittee.
Corporate Social Responsibility
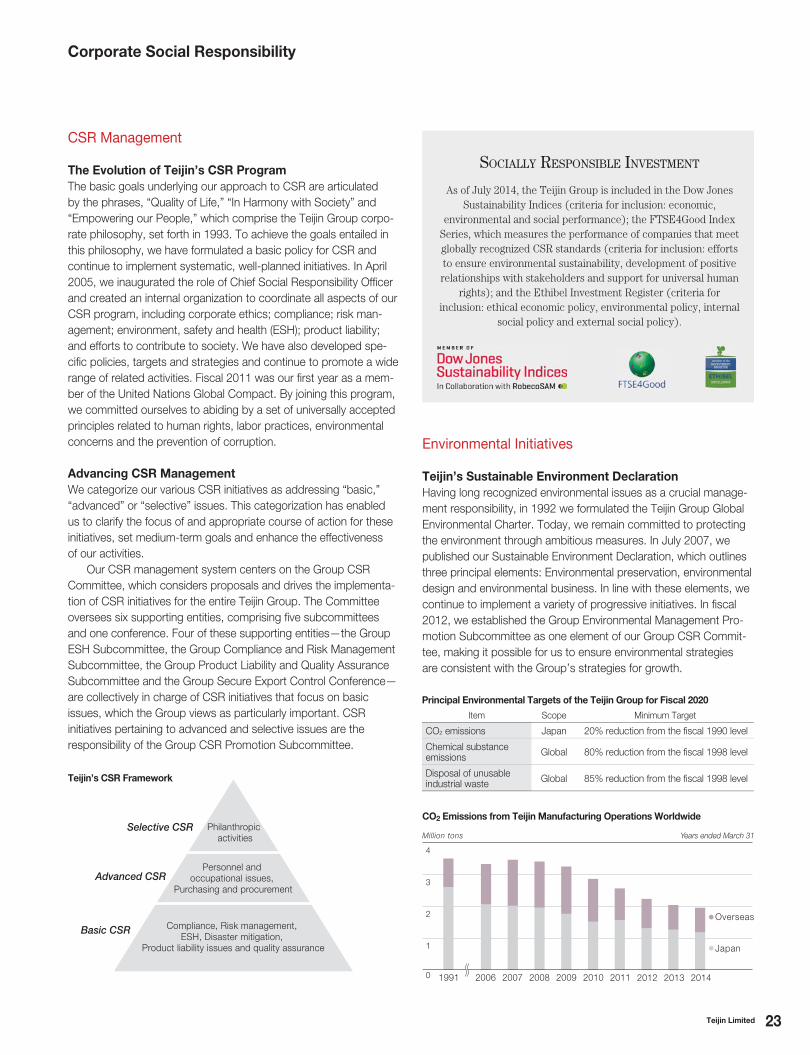
SOCIALLY RESPONSIBLE INVESTMENT
As of July 2014, the Teijin Group is included in the Dow Jones Sustainability Indices (criteria for inclusion: economic,
environmental and social performance); the FTSE4Good Index Series, which measures the performance of companies that meet globally recognized CSR standards (criteria for inclusion: efforts to ensure environmental sustainability, development of positive relationships with stakeholders and support for universal human
rights); and the Ethibel Investment Register (criteria for inclusion: ethical economic policy, environmental policy, internal
social policy and external social policy).
Environmental Initiatives
Teijin’s Sustainable Environment Declaration
Having long recognized environmental issues as a crucial manage-
ment responsibility, in 1992 we formulated the Teijin Group Global
Environmental Charter. Today, we remain committed to protecting
the environment through ambitious measures. In July 2007, we
published our Sustainable Environment Declaration, which outlines
three principal elements: Environmental preservation, environmental
design and environmental business. In line with these elements, we
continue to implement a variety of progressive initiatives. In fi scal
2012, we established the Group Environmental Management Pro-
motion Subcommittee as one element of our Group CSR Commit-
tee, making it possible for us to ensure environmental strategies
are consistent with the Group’s strategies for growth.
1
2
3
4
Million tons Years ended March 31
0 1991 2006 2007 2008 2010 20112009
Overseas
Japan
2012 2013 2014
CO2 Emissions from Teijin Manufacturing Operations Worldwide
Item Scope Minimum Target
CO2 emissions Japan 20% reduction from the fi scal 1990 level
Chemical substance emissions
Global 80% reduction from the fi scal 1998 level
Disposal of unusable industrial waste
Global 85% reduction from the fi scal 1998 levelTeijin’s CSR Framework
Principal Environmental Targets of the Teijin Group for Fiscal 2020
24 Teijin Limited
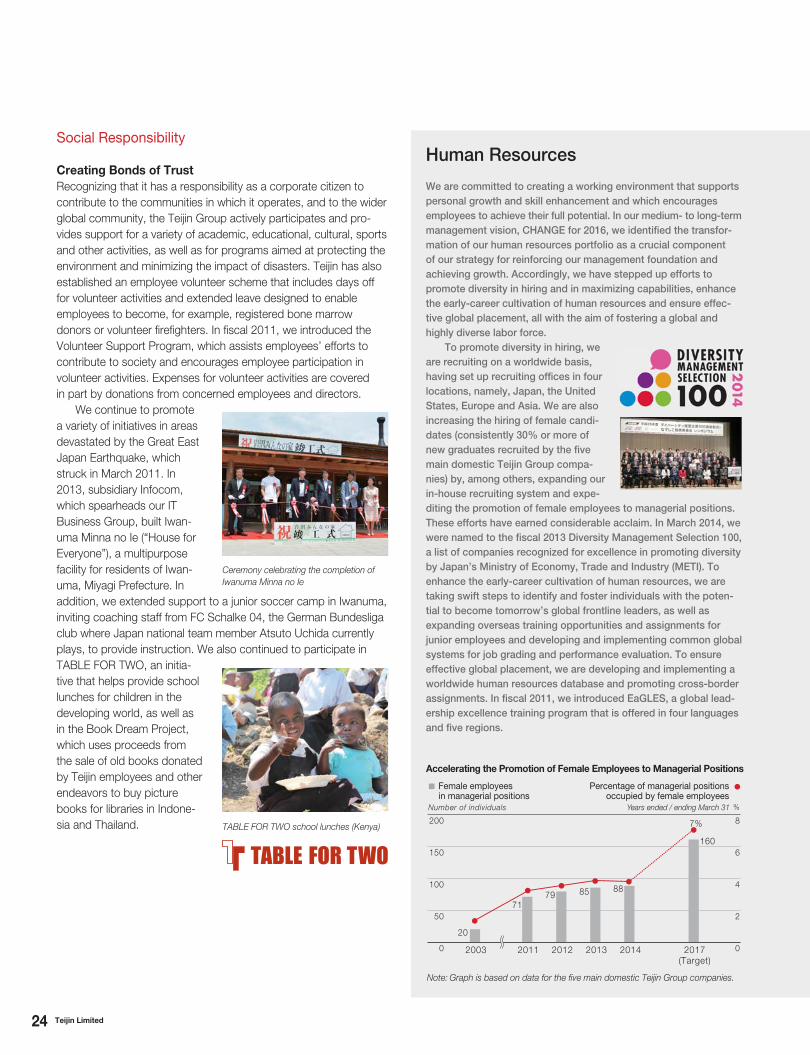
50
100
150
200
0
Number of individuals Years ended / ending March 31
2
4
6
8
%
0
7%
160
85 8879
71
20
Percentage of managerial positions occupied by female employees
Female employees in managerial positions
2003 2011 2012 2013 2014 2017(Target)
We are committed to creating a working environment that supports
personal growth and skill enhancement and which encourages
employees to achieve their full potential. In our medium- to long-term
management vision, CHANGE for 2016, we identifi ed the transfor-
mation of our human resources portfolio as a crucial component
of our strategy for reinforcing our management foundation and
achieving growth. Accordingly, we have stepped up efforts to
promote diversity in hiring and in maximizing capabilities, enhance
the early-career cultivation of human resources and ensure effec-
tive global placement, all with the aim of fostering a global and
highly diverse labor force.
To promote diversity in hiring, we
are recruiting on a worldwide basis,
having set up recruiting offi ces in four
locations, namely, Japan, the United
States, Europe and Asia. We are also
increasing the hiring of female candi-
dates (consistently 30% or more of
new graduates recruited by the fi ve
main domestic Teijin Group compa-
nies) by, among others, expanding our
in-house recruiting system and expe-
diting the promotion of female employees to managerial positions.
These efforts have earned considerable acclaim. In March 2014, we
were named to the fi scal 2013 Diversity Management Selection 100,
a list of companies recognized for excellence in promoting diversity
by Japan’s Ministry of Economy, Trade and Industry (METI). To
enhance the early-career cultivation of human resources, we are
taking swift steps to identify and foster individuals with the poten-
tial to become tomorrow’s global frontline leaders, as well as
expanding overseas training opportunities and assignments for
junior employees and developing and implementing common global
systems for job grading and performance evaluation. To ensure
effective global placement, we are developing and implementing a
worldwide human resources database and promoting cross-border
assignments. In fi scal 2011, we introduced EaGLES, a global lead-
ership excellence training program that is offered in four languages
and fi ve regions.
Accelerating the Promotion of Female Employees to Managerial Positions
Human Resources
Note: Graph is based on data for the fi ve main domestic Teijin Group companies.
Social Responsibility
Creating Bonds of Trust
Recognizing that it has a responsibility as a corporate citizen to
contribute to the communities in which it operates, and to the wider
global community, the Teijin Group actively participates and pro-
vides support for a variety of academic, educational, cultural, sports
and other activities, as well as for programs aimed at protecting the
environment and minimizing the impact of disasters. Teijin has also
established an employee volunteer scheme that includes days off
for volunteer activities and extended leave designed to enable
employees to become, for example, registered bone marrow
donors or volunteer fi refi ghters. In fi scal 2011, we introduced the
Volunteer Support Program, which assists employees’ efforts to
contribute to society and encourages employee participation in
volunteer activities. Expenses for volunteer activities are covered
in part by donations from concerned employees and directors.
We continue to promote
a variety of initiatives in areas
devastated by the Great East
Japan Earthquake, which
struck in March 2011. In
2013, subsidiary Infocom,
which spearheads our IT
Business Group, built Iwan-
uma Minna no Ie (“House for
Everyone”), a multipurpose
facility for residents of Iwan-
uma, Miyagi Prefecture. In
addition, we extended support to a junior soccer camp in Iwanuma,
inviting coaching staff from FC Schalke 04, the German Bundesliga
club where Japan national team member Atsuto Uchida currently
plays, to provide instruction. We also continued to participate in
TABLE FOR TWO, an initia-
tive that helps provide school
lunches for children in the
developing world, as well as
in the Book Dream Project,
which uses proceeds from
the sale of old books donated
by Teijin employees and other
endeavors to buy picture
books for libraries in Indone-
sia and Thailand. TABLE FOR TWO school lunches (Kenya)
Ceremony celebrating the completion of
Iwanuma Minna no Ie
25Teijin Limited
Financial Section
Financial Highlights and
Consolidated 10-Year Summary 26
Management’s Discussion and Analysis 28
Summary 28
Results of Operations 29
Business Segment Results 30
Financial Position 34
Outlook for Fiscal 2014 34
Risk Factors 35
Consolidated Financial Statements 36
Consolidated Balance Sheets 36
Consolidated Statements of Operations 38
Consolidated Statements of Comprehensive Income 39
Consolidated Statements of Changes in Net Assets 40
Consolidated Statements of Cash Flows 42
Notes to Consolidated Financial Statements 43
Independent Auditor’s Report 78
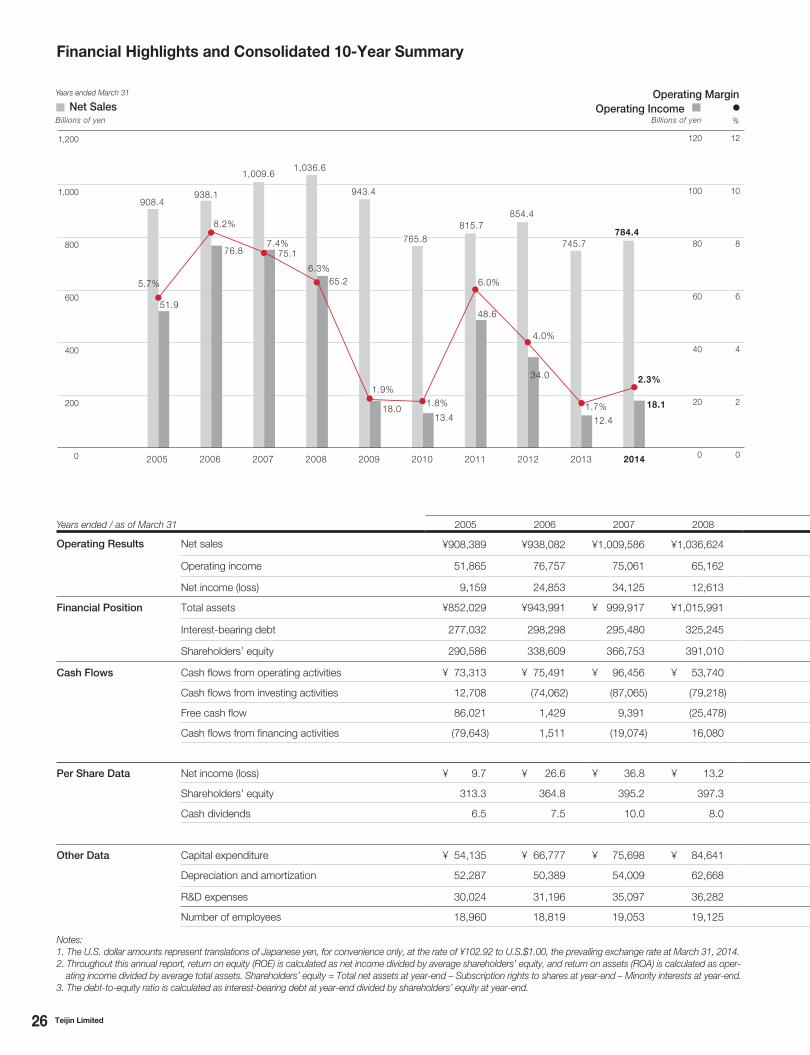
26 Teijin Limited
815.7854.4
48.6
34.0
908.4938.1
1,009.61,036.6
943.4
765.8
13.418.0
75.1
65.2
76.8
51.9
5.7%
8.2%
7.4%
6.3%
1.9%1.8%
6.0%
4.0%
745.7
12.4
1.7%
784.4
18.1
2.3%
0
200
400
600
800
1,000
1,200
0
20
40
60
80
100
120
0
2
4
6
8
10
12
2005 2006 2007 2008 2009 2010 2011 2012 20142013
Billions of yen
Net Sales
Years ended March 31
Billions of yen %Operating Income
Operating Margin
Notes:
1. The U.S. dollar amounts represent translations of Japanese yen, for convenience only, at the rate of ¥102.92 to U.S.$1.00, the prevailing exchange rate at March 31, 2014.
2. Throughout this annual report, return on equity (ROE) is calculated as net income divided by average shareholders’ equity, and return on assets (ROA) is calculated as oper-
ating income divided by average total assets. Shareholders’ equity = Total net assets at year-end – Subscription rights to shares at year-end – Minority interests at year-end.
3. The debt-to-equity ratio is calculated as interest-bearing debt at year-end divided by shareholders’ equity at year-end.
Financial Highlights and Consolidated 10-Year Summary
Years ended / as of March 31 2005 2006 2007 2008
Operating Results Net sales ¥908,389 ¥938,082 ¥1,009,586 ¥1,036,624
Operating income 51,865 76,757 75,061 65,162
Net income (loss) 9,159 24,853 34,125 12,613
Financial Position Total assets ¥852,029 ¥943,991 ¥ 999,917 ¥1,015,991
Interest-bearing debt 277,032 298,298 295,480 325,245
Shareholders’ equity 290,586 338,609 366,753 391,010
Cash Flows Cash fl ows from operating activities ¥ 73,313 ¥ 75,491 ¥ 96,456 ¥ 53,740
Cash fl ows from investing activities 12,708 (74,062) (87,065) (79,218)
Free cash fl ow 86,021 1,429 9,391 (25,478)
Cash fl ows from fi nancing activities (79,643) 1,511 (19,074) 16,080
Per Share Data Net income (loss) ¥ 9.7 ¥0 26.6 ¥ 36.8 ¥ 13.2
Shareholders’ equity 313.3 364.8 395.2 397.3
Cash dividends 6.5 7.5 10.0 8.0
Other Data Capital expenditure ¥ 54,135 ¥ 66,777 ¥ 75,698 ¥ 84,641
Depreciation and amortization 52,287 50,389 54,009 62,668
R&D expenses 30,024 31,196 35,097 36,282
Number of employees 18,960 18,819 19,053 19,125
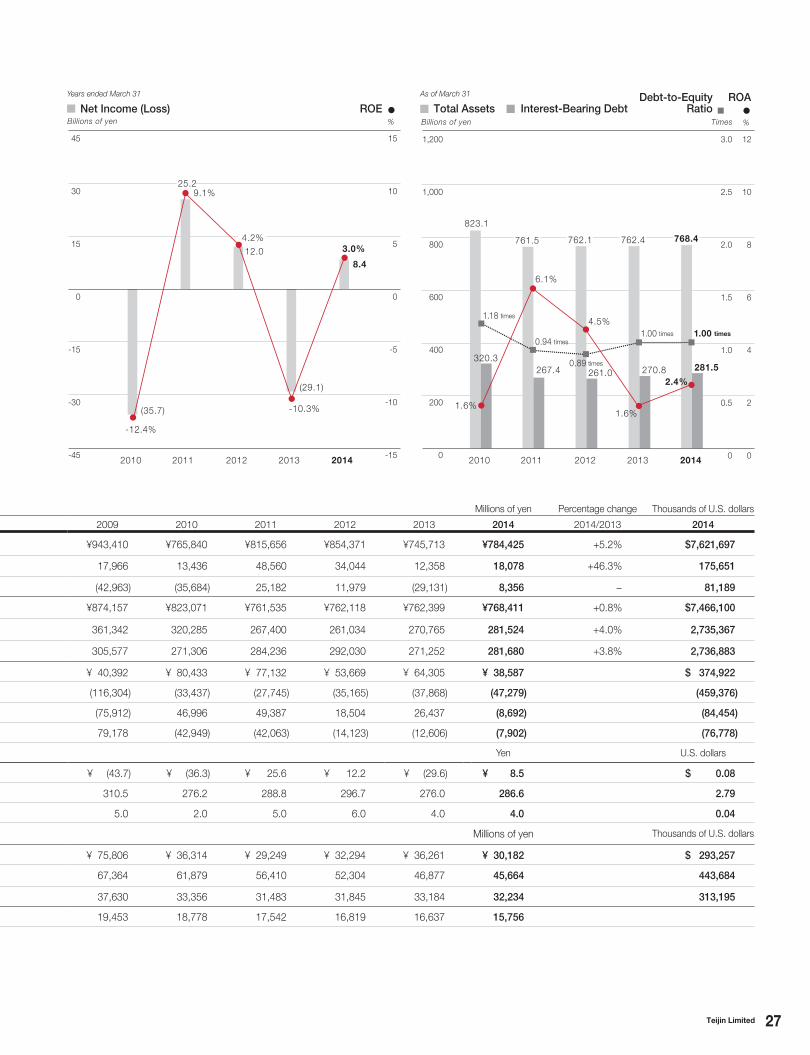
27Teijin Limited
(35.7)
25.2
-12.4%
9.1%
12.04.2%
(29.1)
-10.3%
8.4
3.0%
320.3267.4
1.6%
6.1%
1.18 times
0.94 times
823.1
761.5
261.0
4.5%
0.89 times
762.1
270.8
1.6%
281.5
2.4%
1.00 times 1.00 times
762.4 768.4
0
200
400
600
800
1,000
1,200
0
2
4
6
8
10
12
0
0.5
1.0
1.5
2.0
2.5
3.0
-45
-30
-15
0
15
30
45
-15
-10
-5
0
5
10
15
2010 2011 2012 20142013 2010 2011 2012 20142013
Years ended March 31 As of March 31
Billions of yenNet Income (Loss)
%
ROETimesBillions of yen %
Total Assets Interest-Bearing DebtROADebt-to-Equity
Ratio
Millions of yen Percentage change Thousands of U.S. dollars
2009 2010 2011 2012 2013 2014 2014/2013 2014
¥943,410 ¥765,840 ¥815,656 ¥854,371 ¥745,713 ¥784,425 +5.2% $7,621,697
17,966 13,436 48,560 34,044 12,358 18,078 +46.3% 175,651
(42,963) (35,684) 25,182 11,979 (29,131) 8,356 − 81,189
¥874,157 ¥823,071 ¥761,535 ¥762,118 ¥762,399 ¥768,411 +0.8% $7,466,100
361,342 320,285 267,400 261,034 270,765 281,524 +4.0% 2,735,367
305,577 271,306 284,236 292,030 271,252 281,680 +3.8% 2,736,883
¥ 40,392 ¥ 80,433 ¥ 77,132 ¥ 53,669 ¥ 64,305 ¥ 38,587 $ 374,922
(116,304) (33,437) (27,745) (35,165) (37,868) (47,279) (459,376)
(75,912) 46,996 49,387 18,504 26,437 (8,692) (84,454)
79,178 (42,949) (42,063) (14,123) (12,606) (7,902) (76,778)
Yen U.S. dollars
¥ (43.7) ¥ (36.3) ¥ 25.6 ¥ 12.2 ¥ (29.6) ¥ 8.5 $ 0.08
310.5 276.2 288.8 296.7 276.0 286.6 2.79
5.0 2.0 5.0 6.0 4.0 4.0 0.04
Millions of yen Thousands of U.S. dollars
¥ 75,806 ¥ 36,314 ¥ 29,249 ¥ 32,294 ¥ 36,261 ¥ 30,182 $ 293,257
67,364 61,879 56,410 52,304 46,877 45,664 443,684
37,630 33,356 31,483 31,845 33,184 32,234 313,195
19,453 18,778 17,542 16,819 16,637 15,756
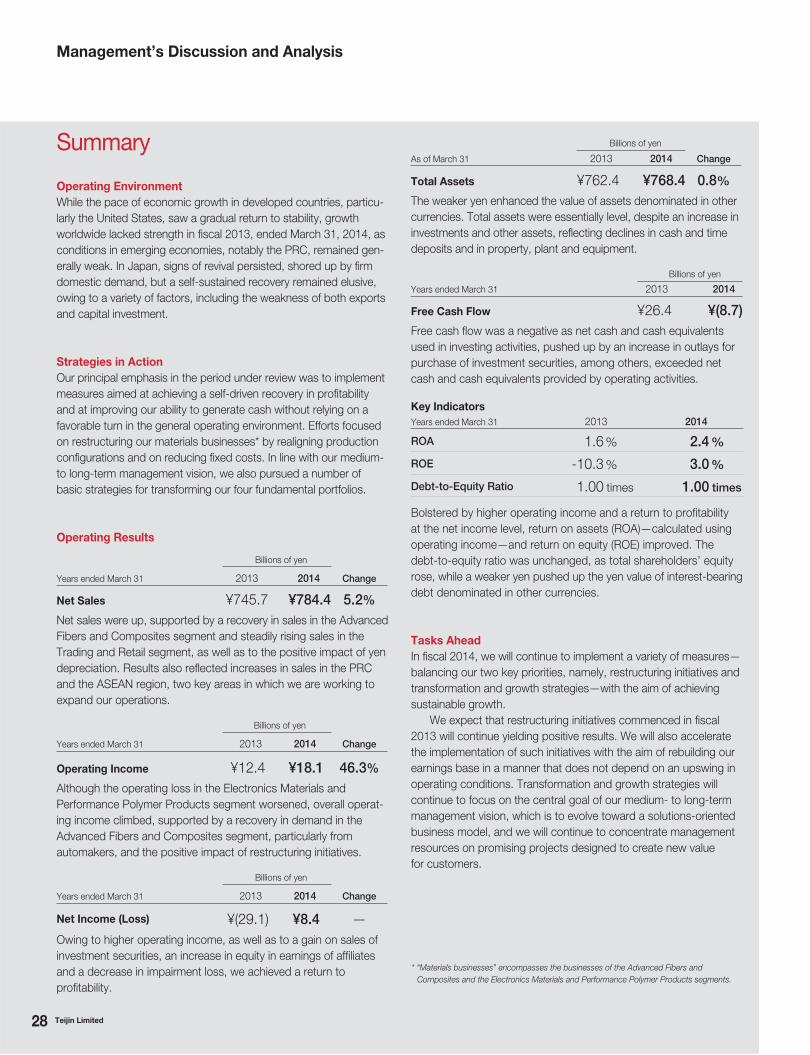
28 Teijin Limited
Management’s Discussion and Analysis
Operating Environment
While the pace of economic growth in developed countries, particu-
larly the United States, saw a gradual return to stability, growth
worldwide lacked strength in fiscal 2013, ended March 31, 2014, as
conditions in emerging economies, notably the PRC, remained gen-
erally weak. In Japan, signs of revival persisted, shored up by firm
domestic demand, but a self-sustained recovery remained elusive,
owing to a variety of factors, including the weakness of both exports
and capital investment.
Strategies in Action
Our principal emphasis in the period under review was to implement
measures aimed at achieving a self-driven recovery in profitability
and at improving our ability to generate cash without relying on a
favorable turn in the general operating environment. Efforts focused
on restructuring our materials businesses* by realigning production
configurations and on reducing fixed costs. In line with our medium-
to long-term management vision, we also pursued a number of
basic strategies for transforming our four fundamental portfolios.
Operating Results
Billions of yen
Years ended March 31 2013 2014 Change
Net Sales ¥745.7 ¥784.4 5.2%
Net sales were up, supported by a recovery in sales in the Advanced
Fibers and Composites segment and steadily rising sales in the
Trading and Retail segment, as well as to the positive impact of yen
depreciation. Results also reflected increases in sales in the PRC
and the ASEAN region, two key areas in which we are working to
expand our operations.
Billions of yen
Years ended March 31 2013 2014 Change
Operating Income ¥12.4 ¥18.1 46.3%
Although the operating loss in the Electronics Materials and
Performance Polymer Products segment worsened, overall operat-
ing income climbed, supported by a recovery in demand in the
Advanced Fibers and Composites segment, particularly from
automakers, and the positive impact of restructuring initiatives.
Billions of yen
Years ended March 31 2013 2014 Change
Net Income (Loss) ¥(29.1) ¥8.4 —
Owing to higher operating income, as well as to a gain on sales of
investment securities, an increase in equity in earnings of affiliates
and a decrease in impairment loss, we achieved a return to
profitability.
Summary Billions of yen
As of March 31 2013 2014 Change
Total Assets ¥762.4 ¥768.4 0.8%
The weaker yen enhanced the value of assets denominated in other
currencies. Total assets were essentially level, despite an increase in
investments and other assets, reflecting declines in cash and time
deposits and in property, plant and equipment.
Billions of yen
Years ended March 31 2013 2014
Free Cash Flow ¥26.4 ¥(8.7)
Free cash flow was a negative as net cash and cash equivalents
used in investing activities, pushed up by an increase in outlays for
purchase of investment securities, among others, exceeded net
cash and cash equivalents provided by operating activities.
Key Indicators
Years ended March 31 2013 2014
ROA 1.6 % 2.4 %
ROE -10.3 % 3.0 %
Debt-to-Equity Ratio 1.00 times 1.00 times
Bolstered by higher operating income and a return to profitability
at the net income level, return on assets (ROA)—calculated using
operating income—and return on equity (ROE) improved. The
debt-to-equity ratio was unchanged, as total shareholders’ equity
rose, while a weaker yen pushed up the yen value of interest-bearing
debt denominated in other currencies.
Tasks Ahead
In fiscal 2014, we will continue to implement a variety of measures—
balancing our two key priorities, namely, restructuring initiatives and
transformation and growth strategies—with the aim of achieving
sustainable growth.
We expect that restructuring initiatives commenced in fiscal
2013 will continue yielding positive results. We will also accelerate
the implementation of such initiatives with the aim of rebuilding our
earnings base in a manner that does not depend on an upswing in
operating conditions. Transformation and growth strategies will
continue to focus on the central goal of our medium- to long-term
management vision, which is to evolve toward a solutions-oriented
business model, and we will continue to concentrate management
resources on promising projects designed to create new value
for customers.
* “Materials businesses” encompasses the businesses of the Advanced Fibers and
Composites and the Electronics Materials and Performance Polymer Products segments.
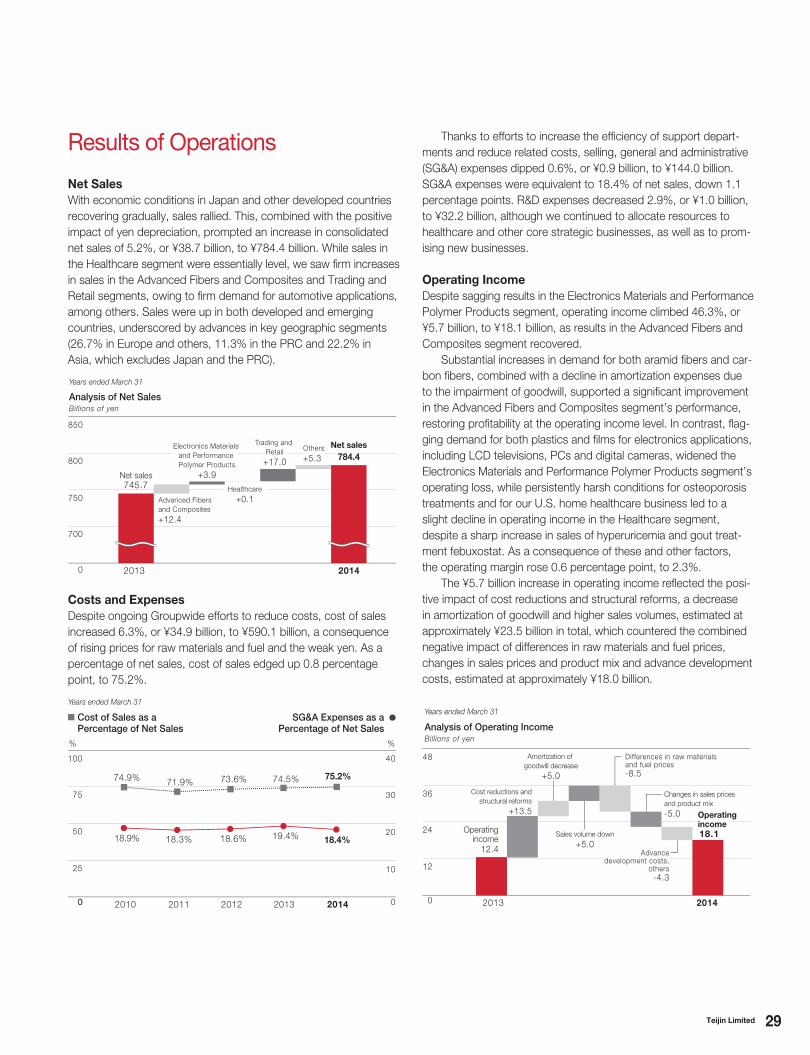
29Teijin Limited
Costs and Expenses
Despite ongoing Groupwide efforts to reduce costs, cost of sales
increased 6.3%, or ¥34.9 billion, to ¥590.1 billion, a consequence
of rising prices for raw materials and fuel and the weak yen. As a
percentage of net sales, cost of sales edged up 0.8 percentage
point, to 75.2%.
Net Sales
With economic conditions in Japan and other developed countries
recovering gradually, sales rallied. This, combined with the positive
impact of yen depreciation, prompted an increase in consolidated
net sales of 5.2%, or ¥38.7 billion, to ¥784.4 billion. While sales in
the Healthcare segment were essentially level, we saw firm increases
in sales in the Advanced Fibers and Composites and Trading and
Retail segments, owing to firm demand for automotive applications,
among others. Sales were up in both developed and emerging
countries, underscored by advances in key geographic segments
(26.7% in Europe and others, 11.3% in the PRC and 22.2% in
Asia, which excludes Japan and the PRC).
Results of Operations Thanks to efforts to increase the efficiency of support depart-
ments and reduce related costs, selling, general and administrative
(SG&A) expenses dipped 0.6%, or ¥0.9 billion, to ¥144.0 billion.
SG&A expenses were equivalent to 18.4% of net sales, down 1.1
percentage points. R&D expenses decreased 2.9%, or ¥1.0 billion,
to ¥32.2 billion, although we continued to allocate resources to
healthcare and other core strategic businesses, as well as to prom-
ising new businesses.
Operating Income
Despite sagging results in the Electronics Materials and Performance
Polymer Products segment, operating income climbed 46.3%, or
¥5.7 billion, to ¥18.1 billion, as results in the Advanced Fibers and
Composites segment recovered.
Substantial increases in demand for both aramid fibers and car-
bon fibers, combined with a decline in amortization expenses due
to the impairment of goodwill, supported a significant improvement
in the Advanced Fibers and Composites segment’s performance,
restoring profitability at the operating income level. In contrast, flag-
ging demand for both plastics and films for electronics applications,
including LCD televisions, PCs and digital cameras, widened the
Electronics Materials and Performance Polymer Products segment’s
operating loss, while persistently harsh conditions for osteoporosis
treatments and for our U.S. home healthcare business led to a
slight decline in operating income in the Healthcare segment,
despite a sharp increase in sales of hyperuricemia and gout treat-
ment febuxostat. As a consequence of these and other factors,
the operating margin rose 0.6 percentage point, to 2.3%.
The ¥5.7 billion increase in operating income reflected the posi-
tive impact of cost reductions and structural reforms, a decrease
in amortization of goodwill and higher sales volumes, estimated at
approximately ¥23.5 billion in total, which countered the combined
negative impact of differences in raw materials and fuel prices,
changes in sales prices and product mix and advance development
costs, estimated at approximately ¥18.0 billion.
700
750
800
850
0 2013 2014
745.7
784.4
Trading and Retail
+17.0
Others+5.3
Advanced Fibers and Composites+12.4
Electronics Materials and Performance Polymer Products
+3.9
Healthcare+0.1
Net sales
Net sales
Billions of yenAnalysis of Net Sales
Years ended March 31
25
50
75
100 40
30
20
10
%%
0 0
75.2%74.9% 71.9% 73.6%
18.4%18.9% 18.3% 18.6%
74.5%
19.4%
0 2010 2011 20142012 2013
Years ended March 31
Cost of Sales as a Percentage of Net Sales
SG&A Expenses as aPercentage of Net Sales
12
24
36
48
0 2013 2014
Operatingincome
12.4
18.1
Cost reductions and structural reforms
+13.5
Amortization of goodwill decrease
+5.0
Sales volume down+5.0
Changes in sales prices and product mix-5.0
Differences in raw materialsand fuel prices-8.5
Advancedevelopment costs,
others-4.3
Operatingincome
Billions of yenAnalysis of Operating Income
Years ended March 31
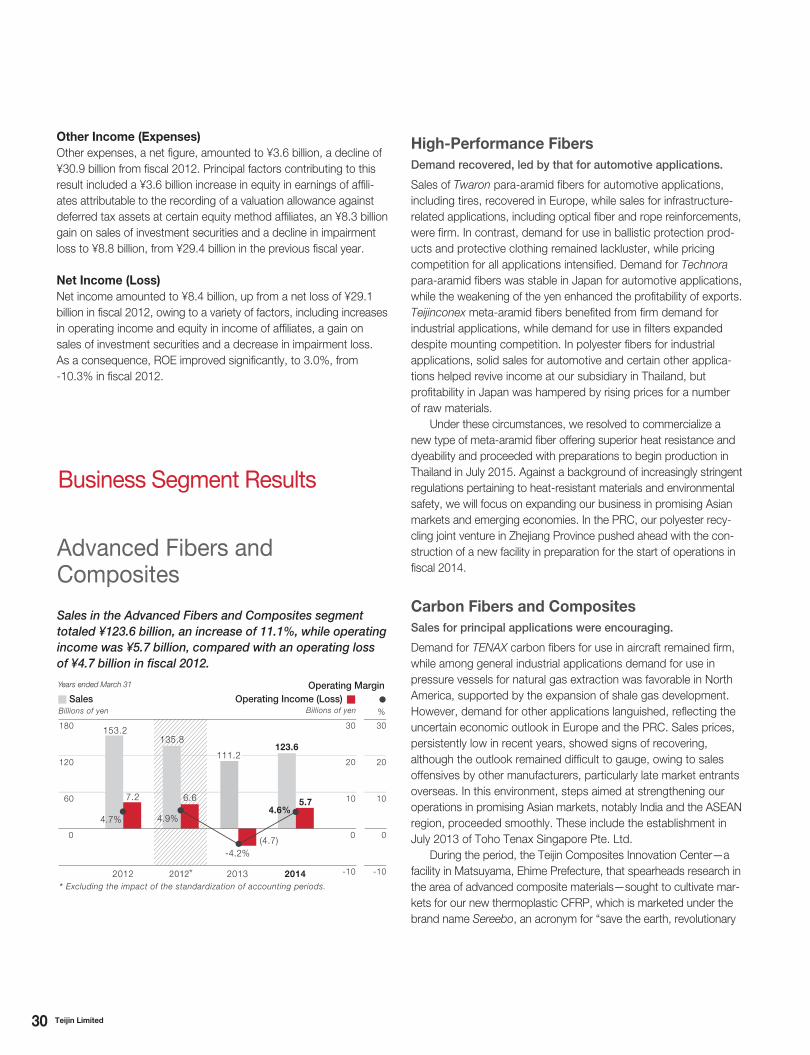
30 Teijin Limited
Advanced Fibers and Composites
Sales in the Advanced Fibers and Composites segment
totaled ¥123.6 billion, an increase of 11.1%, while operating
income was ¥5.7 billion, compared with an operating loss
of ¥4.7 billion in fiscal 2012.
Other Income (Expenses)
Other expenses, a net figure, amounted to ¥3.6 billion, a decline of
¥30.9 billion from fiscal 2012. Principal factors contributing to this
result included a ¥3.6 billion increase in equity in earnings of affili-
ates attributable to the recording of a valuation allowance against
deferred tax assets at certain equity method affiliates, an ¥8.3 billion
gain on sales of investment securities and a decline in impairment
loss to ¥8.8 billion, from ¥29.4 billion in the previous fiscal year.
Net Income (Loss)
Net income amounted to ¥8.4 billion, up from a net loss of ¥29.1
billion in fiscal 2012, owing to a variety of factors, including increases
in operating income and equity in income of affiliates, a gain on
sales of investment securities and a decrease in impairment loss.
As a consequence, ROE improved significantly, to 3.0%, from
-10.3% in fiscal 2012.
Business Segment Results
High-Performance Fibers
Demand recovered, led by that for automotive applications.
Sales of Twaron para-aramid fibers for automotive applications,
including tires, recovered in Europe, while sales for infrastructure-
related applications, including optical fiber and rope reinforcements,
were firm. In contrast, demand for use in ballistic protection prod-
ucts and protective clothing remained lackluster, while pricing
competition for all applications intensified. Demand for Technora
para-aramid fibers was stable in Japan for automotive applications,
while the weakening of the yen enhanced the profitability of exports.
Teijinconex meta-aramid fibers benefited from firm demand for
industrial applications, while demand for use in filters expanded
despite mounting competition. In polyester fibers for industrial
applications, solid sales for automotive and certain other applica-
tions helped revive income at our subsidiary in Thailand, but
profitability in Japan was hampered by rising prices for a number
of raw materials.
Under these circumstances, we resolved to commercialize a
new type of meta-aramid fiber offering superior heat resistance and
dyeability and proceeded with preparations to begin production in
Thailand in July 2015. Against a background of increasingly stringent
regulations pertaining to heat-resistant materials and environmental
safety, we will focus on expanding our business in promising Asian
markets and emerging economies. In the PRC, our polyester recy-
cling joint venture in Zhejiang Province pushed ahead with the con-
struction of a new facility in preparation for the start of operations in
fiscal 2014.
Carbon Fibers and Composites
Sales for principal applications were encouraging.
Demand for TENAX carbon fibers for use in aircraft remained firm,
while among general industrial applications demand for use in
pressure vessels for natural gas extraction was favorable in North
America, supported by the expansion of shale gas development.
However, demand for other applications languished, reflecting the
uncertain economic outlook in Europe and the PRC. Sales prices,
persistently low in recent years, showed signs of recovering,
although the outlook remained difficult to gauge, owing to sales
offensives by other manufacturers, particularly late market entrants
overseas. In this environment, steps aimed at strengthening our
operations in promising Asian markets, notably India and the ASEAN
region, proceeded smoothly. These include the establishment in
July 2013 of Toho Tenax Singapore Pte. Ltd.
During the period, the Teijin Composites Innovation Center—a
facility in Matsuyama, Ehime Prefecture, that spearheads research in
the area of advanced composite materials—sought to cultivate mar-
kets for our new thermoplastic CFRP, which is marketed under the
brand name Sereebo, an acronym for “save the earth, revolutionary
4.9%4.7%
-4.2%
123.6
5.74.6%
%
60
120
180 30
20
10
-10
0 0
2012 2012*
30
20
10
-10
0
2013 2014
153.2135.8
7.2 6.6
111.2
(4.7)
Billions of yenBillions of yen
Years ended March 31
Sales Operating Income (Loss)
Operating Margin
* Excluding the impact of the standardization of accounting periods.
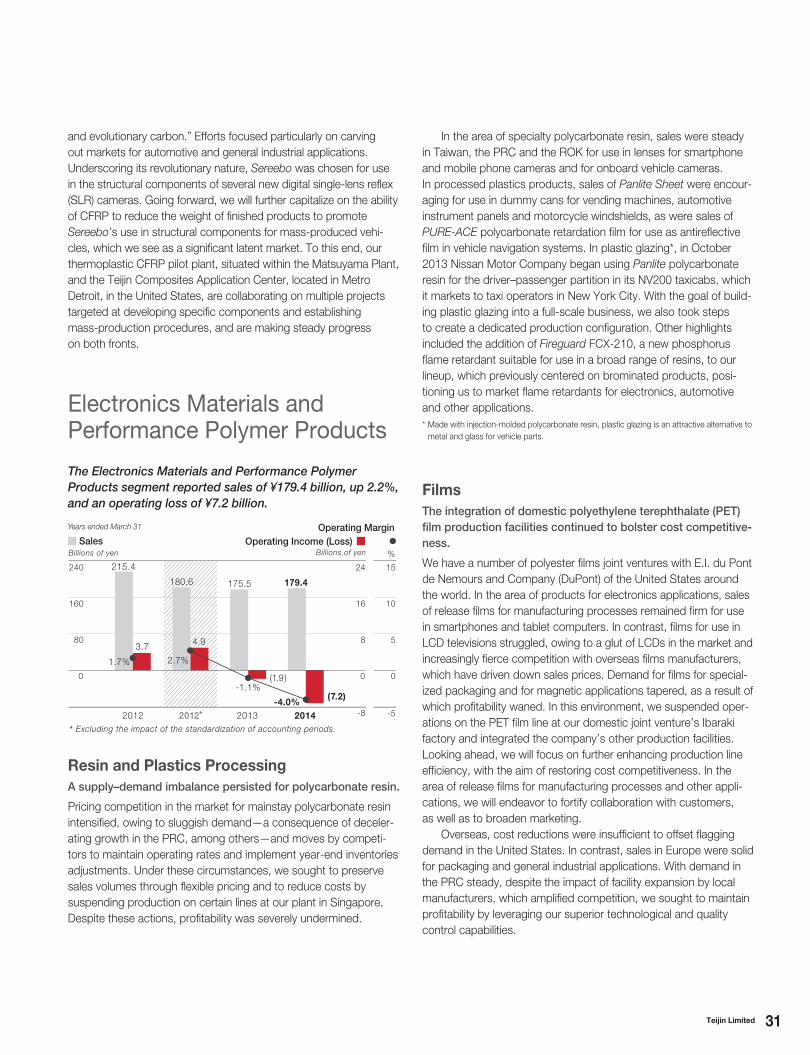
31Teijin Limited
and evolutionary carbon.” Efforts focused particularly on carving
out markets for automotive and general industrial applications.
Underscoring its revolutionary nature, Sereebo was chosen for use
in the structural components of several new digital single-lens reflex
(SLR) cameras. Going forward, we will further capitalize on the ability
of CFRP to reduce the weight of finished products to promote
Sereebo’s use in structural components for mass-produced vehi-
cles, which we see as a significant latent market. To this end, our
thermoplastic CFRP pilot plant, situated within the Matsuyama Plant,
and the Teijin Composites Application Center, located in Metro
Detroit, in the United States, are collaborating on multiple projects
targeted at developing specific components and establishing
mass-production procedures, and are making steady progress
on both fronts.
Electronics Materials and Performance Polymer Products
The Electronics Materials and Performance Polymer
Products segment reported sales of ¥179.4 billion, up 2.2%,
and an operating loss of ¥7.2 billion.
Resin and Plastics Processing
A supply–demand imbalance persisted for polycarbonate resin.
Pricing competition in the market for mainstay polycarbonate resin
intensified, owing to sluggish demand—a consequence of deceler-
ating growth in the PRC, among others—and moves by competi-
tors to maintain operating rates and implement year-end inventories
adjustments. Under these circumstances, we sought to preserve
sales volumes through flexible pricing and to reduce costs by
suspending production on certain lines at our plant in Singapore.
Despite these actions, profitability was severely undermined.
In the area of specialty polycarbonate resin, sales were steady
in Taiwan, the PRC and the ROK for use in lenses for smartphone
and mobile phone cameras and for onboard vehicle cameras.
In processed plastics products, sales of Panlite Sheet were encour-
aging for use in dummy cans for vending machines, automotive
instrument panels and motorcycle windshields, as were sales of
PURE-ACE polycarbonate retardation film for use as antireflective
film in vehicle navigation systems. In plastic glazing*, in October
2013 Nissan Motor Company began using Panlite polycarbonate
resin for the driver–passenger partition in its NV200 taxicabs, which
it markets to taxi operators in New York City. With the goal of build-
ing plastic glazing into a full-scale business, we also took steps
to create a dedicated production configuration. Other highlights
included the addition of Fireguard FCX-210, a new phosphorus
flame retardant suitable for use in a broad range of resins, to our
lineup, which previously centered on brominated products, posi-
tioning us to market flame retardants for electronics, automotive
and other applications.
* Made with injection-molded polycarbonate resin, plastic glazing is an attractive alternative to
metal and glass for vehicle parts.
Films
The integration of domestic polyethylene terephthalate (PET)
film production facilities continued to bolster cost competitive-
ness.
We have a number of polyester films joint ventures with E.I. du Pont
de Nemours and Company (DuPont) of the United States around
the world. In the area of products for electronics applications, sales
of release films for manufacturing processes remained firm for use
in smartphones and tablet computers. In contrast, films for use in
LCD televisions struggled, owing to a glut of LCDs in the market and
increasingly fierce competition with overseas films manufacturers,
which have driven down sales prices. Demand for films for special-
ized packaging and for magnetic applications tapered, as a result of
which profitability waned. In this environment, we suspended oper-
ations on the PET film line at our domestic joint venture’s Ibaraki
factory and integrated the company’s other production facilities.
Looking ahead, we will focus on further enhancing production line
efficiency, with the aim of restoring cost competitiveness. In the
area of release films for manufacturing processes and other appli-
cations, we will endeavor to fortify collaboration with customers,
as well as to broaden marketing.
Overseas, cost reductions were insufficient to offset flagging
demand in the United States. In contrast, sales in Europe were solid
for packaging and general industrial applications. With demand in
the PRC steady, despite the impact of facility expansion by local
manufacturers, which amplified competition, we sought to maintain
profitability by leveraging our superior technological and quality
control capabilities.
3.7
215.4
4.9
180.6
(1.9)
175.5
(7.2)
179.4
2.7%1.7%
-1.1%
-4.0%
-5
%
2012 2012* 2013 2014
80
160
240 24
16
8
-8
0 0
15
10
5
0
Operating Income (Loss)Billions of yenBillions of yen
Years ended March 31
Sales
Operating Margin
* Excluding the impact of the standardization of accounting periods.
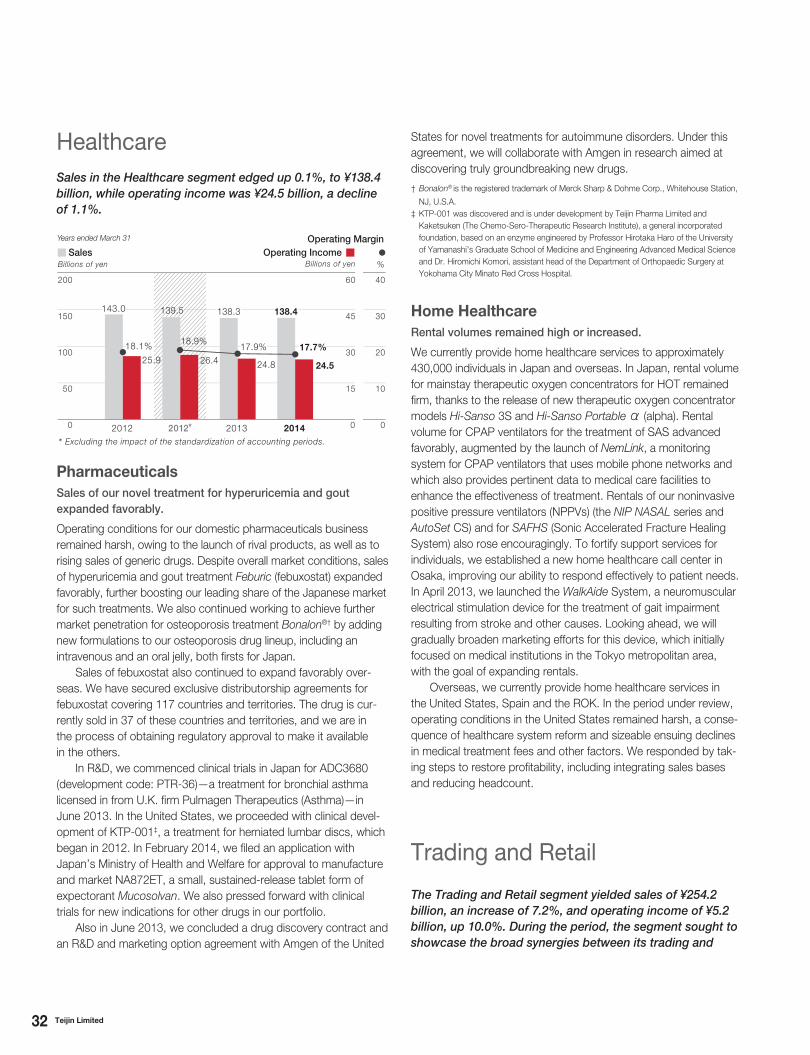
32 Teijin Limited
HealthcareSales in the Healthcare segment edged up 0.1%, to ¥138.4
billion, while operating income was ¥24.5 billion, a decline
of 1.1%.
Pharmaceuticals
Sales of our novel treatment for hyperuricemia and gout
expanded favorably.
Operating conditions for our domestic pharmaceuticals business
remained harsh, owing to the launch of rival products, as well as to
rising sales of generic drugs. Despite overall market conditions, sales
of hyperuricemia and gout treatment Feburic (febuxostat) expanded
favorably, further boosting our leading share of the Japanese market
for such treatments. We also continued working to achieve further
market penetration for osteoporosis treatment Bonalon®† by adding
new formulations to our osteoporosis drug lineup, including an
intravenous and an oral jelly, both firsts for Japan.
Sales of febuxostat also continued to expand favorably over-
seas. We have secured exclusive distributorship agreements for
febuxostat covering 117 countries and territories. The drug is cur-
rently sold in 37 of these countries and territories, and we are in
the process of obtaining regulatory approval to make it available
in the others.
In R&D, we commenced clinical trials in Japan for ADC3680
(development code: PTR-36)—a treatment for bronchial asthma
licensed in from U.K. firm Pulmagen Therapeutics (Asthma)—in
June 2013. In the United States, we proceeded with clinical devel-
opment of KTP-001‡, a treatment for herniated lumbar discs, which
began in 2012. In February 2014, we filed an application with
Japan’s Ministry of Health and Welfare for approval to manufacture
and market NA872ET, a small, sustained-release tablet form of
expectorant Mucosolvan. We also pressed forward with clinical
trials for new indications for other drugs in our portfolio.
Also in June 2013, we concluded a drug discovery contract and
an R&D and marketing option agreement with Amgen of the United
States for novel treatments for autoimmune disorders. Under this
agreement, we will collaborate with Amgen in research aimed at
discovering truly groundbreaking new drugs.
† Bonalon® is the registered trademark of Merck Sharp & Dohme Corp., Whitehouse Station,
NJ, U.S.A.
‡ KTP-001 was discovered and is under development by Teijin Pharma Limited and
Kaketsuken (The Chemo-Sero-Therapeutic Research Institute), a general incorporated
foundation, based on an enzyme engineered by Professor Hirotaka Haro of the University
of Yamanashi’s Graduate School of Medicine and Engineering Advanced Medical Science
and Dr. Hiromichi Komori, assistant head of the Department of Orthopaedic Surgery at
Yokohama City Minato Red Cross Hospital.
Home Healthcare
Rental volumes remained high or increased.
We currently provide home healthcare services to approximately
430,000 individuals in Japan and overseas. In Japan, rental volume
for mainstay therapeutic oxygen concentrators for HOT remained
firm, thanks to the release of new therapeutic oxygen concentrator
models Hi-Sanso 3S and Hi-Sanso Portable α (alpha). Rental
volume for CPAP ventilators for the treatment of SAS advanced
favorably, augmented by the launch of NemLink, a monitoring
system for CPAP ventilators that uses mobile phone networks and
which also provides pertinent data to medical care facilities to
enhance the effectiveness of treatment. Rentals of our noninvasive
positive pressure ventilators (NPPVs) (the NIP NASAL series and
AutoSet CS) and for SAFHS (Sonic Accelerated Fracture Healing
System) also rose encouragingly. To fortify support services for
individuals, we established a new home healthcare call center in
Osaka, improving our ability to respond effectively to patient needs.
In April 2013, we launched the WalkAide System, a neuromuscular
electrical stimulation device for the treatment of gait impairment
resulting from stroke and other causes. Looking ahead, we will
gradually broaden marketing efforts for this device, which initially
focused on medical institutions in the Tokyo metropolitan area,
with the goal of expanding rentals.
Overseas, we currently provide home healthcare services in
the United States, Spain and the ROK. In the period under review,
operating conditions in the United States remained harsh, a conse-
quence of healthcare system reform and sizeable ensuing declines
in medical treatment fees and other factors. We responded by tak-
ing steps to restore profitability, including integrating sales bases
and reducing headcount.
Trading and Retail
The Trading and Retail segment yielded sales of ¥254.2
billion, an increase of 7.2%, and operating income of ¥5.2
billion, up 10.0%. During the period, the segment sought to
showcase the broad synergies between its trading and
25.9
143.0
26.4
139.5
24.8 24.5
138.3 138.4
18.9%18.1% 17.9% 17.7%
0 0
40
30
20
10
0
%
2012 2012* 2013 2014
50
100
150
200 60
45
30
15
Billions of yenBillions of yen
Years ended March 31
Sales Operating Income
Operating Margin
* Excluding the impact of the standardization of accounting periods.
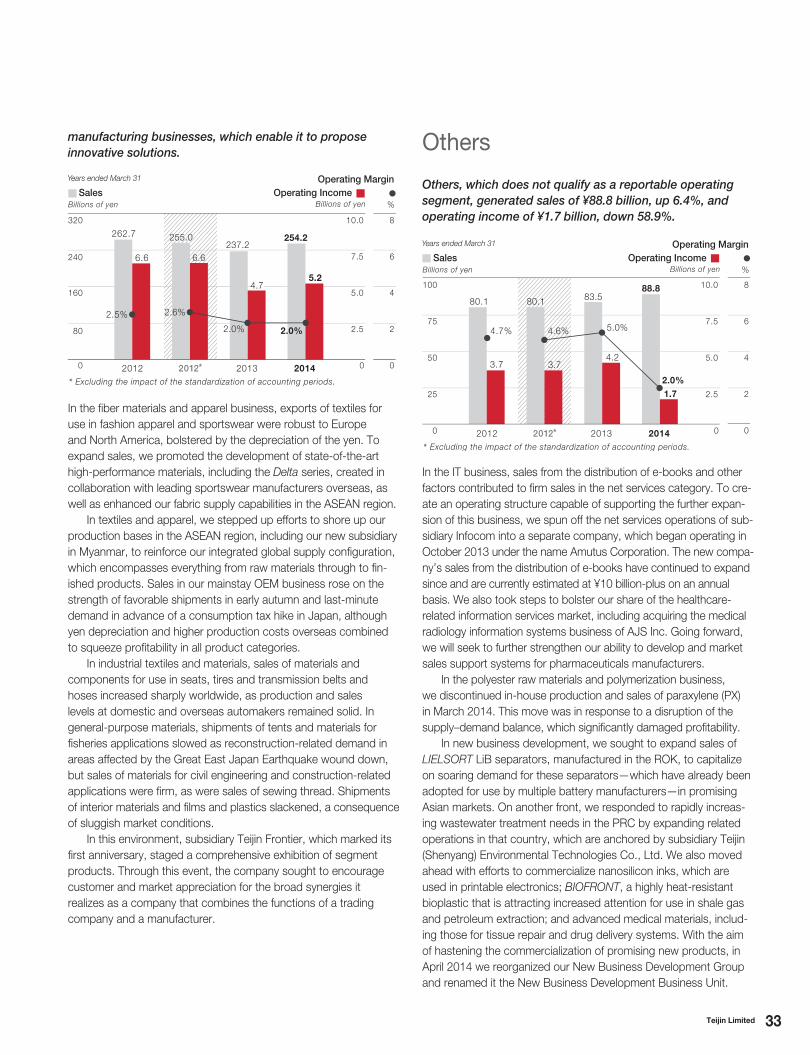
33Teijin Limited
manufacturing businesses, which enable it to propose
innovative solutions.
In the fiber materials and apparel business, exports of textiles for
use in fashion apparel and sportswear were robust to Europe
and North America, bolstered by the depreciation of the yen. To
expand sales, we promoted the development of state-of-the-art
high-performance materials, including the Delta series, created in
collaboration with leading sportswear manufacturers overseas, as
well as enhanced our fabric supply capabilities in the ASEAN region.
In textiles and apparel, we stepped up efforts to shore up our
production bases in the ASEAN region, including our new subsidiary
in Myanmar, to reinforce our integrated global supply configuration,
which encompasses everything from raw materials through to fin-
ished products. Sales in our mainstay OEM business rose on the
strength of favorable shipments in early autumn and last-minute
demand in advance of a consumption tax hike in Japan, although
yen depreciation and higher production costs overseas combined
to squeeze profitability in all product categories.
In industrial textiles and materials, sales of materials and
components for use in seats, tires and transmission belts and
hoses increased sharply worldwide, as production and sales
levels at domestic and overseas automakers remained solid. In
general-purpose materials, shipments of tents and materials for
fisheries applications slowed as reconstruction-related demand in
areas affected by the Great East Japan Earthquake wound down,
but sales of materials for civil engineering and construction-related
applications were firm, as were sales of sewing thread. Shipments
of interior materials and films and plastics slackened, a consequence
of sluggish market conditions.
In this environment, subsidiary Teijin Frontier, which marked its
first anniversary, staged a comprehensive exhibition of segment
products. Through this event, the company sought to encourage
customer and market appreciation for the broad synergies it
realizes as a company that combines the functions of a trading
company and a manufacturer.
Others
Others, which does not qualify as a reportable operating
segment, generated sales of ¥88.8 billion, up 6.4%, and
operating income of ¥1.7 billion, down 58.9%.
In the IT business, sales from the distribution of e-books and other
factors contributed to firm sales in the net services category. To cre-
ate an operating structure capable of supporting the further expan-
sion of this business, we spun off the net services operations of sub-
sidiary Infocom into a separate company, which began operating in
October 2013 under the name Amutus Corporation. The new compa-
ny’s sales from the distribution of e-books have continued to expand
since and are currently estimated at ¥10 billion-plus on an annual
basis. We also took steps to bolster our share of the healthcare-
related information services market, including acquiring the medical
radiology information systems business of AJS Inc. Going forward,
we will seek to further strengthen our ability to develop and market
sales support systems for pharmaceuticals manufacturers.
In the polyester raw materials and polymerization business,
we discontinued in-house production and sales of paraxylene (PX)
in March 2014. This move was in response to a disruption of the
supply–demand balance, which significantly damaged profitability.
In new business development, we sought to expand sales of
LIELSORT LiB separators, manufactured in the ROK, to capitalize
on soaring demand for these separators—which have already been
adopted for use by multiple battery manufacturers—in promising
Asian markets. On another front, we responded to rapidly increas-
ing wastewater treatment needs in the PRC by expanding related
operations in that country, which are anchored by subsidiary Teijin
(Shenyang) Environmental Technologies Co., Ltd. We also moved
ahead with efforts to commercialize nanosilicon inks, which are
used in printable electronics; BIOFRONT, a highly heat-resistant
bioplastic that is attracting increased attention for use in shale gas
and petroleum extraction; and advanced medical materials, includ-
ing those for tissue repair and drug delivery systems. With the aim
of hastening the commercialization of promising new products, in
April 2014 we reorganized our New Business Development Group
and renamed it the New Business Development Business Unit.
0 0
6.6
262.7
6.6
255.0
4.75.2
237.2254.2
2.6%2.5%
2.0% 2.0%
8
6
4
2
0
%
2012 2012* 2013 2014
80
160
240
320 10.0
7.5
5.0
2.5
Billions of yenBillions of yen
Years ended March 31
Sales Operating Income
Operating Margin
* Excluding the impact of the standardization of accounting periods.
0 0
3.7
80.1
3.7
80.1
4.2
1.7
83.588.8
4.6%4.7% 5.0%
2.0%
8
6
4
2
0
%
2012 2012* 2013 2014
25
50
75
100 10.0
7.5
5.0
2.5
Billions of yenBillions of yen
Years ended March 31
Sales Operating Income
Operating Margin
* Excluding the impact of the standardization of accounting periods.
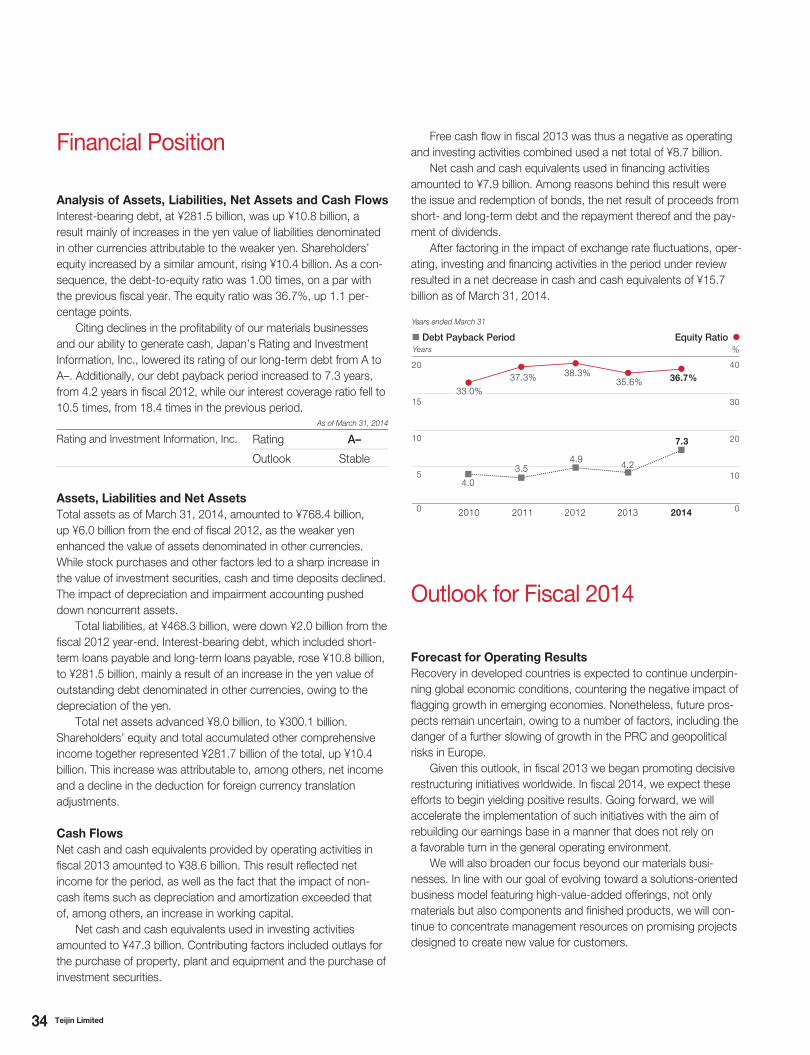
34 Teijin Limited
Free cash flow in fiscal 2013 was thus a negative as operating
and investing activities combined used a net total of ¥8.7 billion.
Net cash and cash equivalents used in financing activities
amounted to ¥7.9 billion. Among reasons behind this result were
the issue and redemption of bonds, the net result of proceeds from
short- and long-term debt and the repayment thereof and the pay-
ment of dividends.
After factoring in the impact of exchange rate fluctuations, oper-
ating, investing and financing activities in the period under review
resulted in a net decrease in cash and cash equivalents of ¥15.7
billion as of March 31, 2014.
Forecast for Operating Results
Recovery in developed countries is expected to continue underpin-
ning global economic conditions, countering the negative impact of
flagging growth in emerging economies. Nonetheless, future pros-
pects remain uncertain, owing to a number of factors, including the
danger of a further slowing of growth in the PRC and geopolitical
risks in Europe.
Given this outlook, in fiscal 2013 we began promoting decisive
restructuring initiatives worldwide. In fiscal 2014, we expect these
efforts to begin yielding positive results. Going forward, we will
accelerate the implementation of such initiatives with the aim of
rebuilding our earnings base in a manner that does not rely on
a favorable turn in the general operating environment.
We will also broaden our focus beyond our materials busi-
nesses. In line with our goal of evolving toward a solutions-oriented
business model featuring high-value-added offerings, not only
materials but also components and finished products, we will con-
tinue to concentrate management resources on promising projects
designed to create new value for customers.
Outlook for Fiscal 2014
Analysis of Assets, Liabilities, Net Assets and Cash Flows
Interest-bearing debt, at ¥281.5 billion, was up ¥10.8 billion, a
result mainly of increases in the yen value of liabilities denominated
in other currencies attributable to the weaker yen. Shareholders’
equity increased by a similar amount, rising ¥10.4 billion. As a con-
sequence, the debt-to-equity ratio was 1.00 times, on a par with
the previous fiscal year. The equity ratio was 36.7%, up 1.1 per-
centage points.
Citing declines in the profitability of our materials businesses
and our ability to generate cash, Japan’s Rating and Investment
Information, Inc., lowered its rating of our long-term debt from A to
A–. Additionally, our debt payback period increased to 7.3 years,
from 4.2 years in fiscal 2012, while our interest coverage ratio fell to
10.5 times, from 18.4 times in the previous period.As of March 31, 2014
Rating and Investment Information, Inc. Rating A–
Outlook Stable
Assets, Liabilities and Net Assets
Total assets as of March 31, 2014, amounted to ¥768.4 billion,
up ¥6.0 billion from the end of fiscal 2012, as the weaker yen
enhanced the value of assets denominated in other currencies.
While stock purchases and other factors led to a sharp increase in
the value of investment securities, cash and time deposits declined.
The impact of depreciation and impairment accounting pushed
down noncurrent assets.
Total liabilities, at ¥468.3 billion, were down ¥2.0 billion from the
fiscal 2012 year-end. Interest-bearing debt, which included short-
term loans payable and long-term loans payable, rose ¥10.8 billion,
to ¥281.5 billion, mainly a result of an increase in the yen value of
outstanding debt denominated in other currencies, owing to the
depreciation of the yen.
Total net assets advanced ¥8.0 billion, to ¥300.1 billion.
Shareholders’ equity and total accumulated other comprehensive
income together represented ¥281.7 billion of the total, up ¥10.4
billion. This increase was attributable to, among others, net income
and a decline in the deduction for foreign currency translation
adjustments.
Cash Flows
Net cash and cash equivalents provided by operating activities in
fiscal 2013 amounted to ¥38.6 billion. This result reflected net
income for the period, as well as the fact that the impact of non-
cash items such as depreciation and amortization exceeded that
of, among others, an increase in working capital.
Net cash and cash equivalents used in investing activities
amounted to ¥47.3 billion. Contributing factors included outlays for
the purchase of property, plant and equipment and the purchase of
investment securities.
Financial Position
5
10
15
20 40
30
20
10
0 0
4.93.5
4.0
38.3%
7.3
36.7%
4.2
35.6%37.3%33.0%
%
2010 2011 20142012 2013
Years
Years ended March 31
Debt Payback Period Equity Ratio
35Teijin Limited
Risk Factors
The Teijin Group recognizes certain risks as having the potential to
affect its operating results and/or financial position. As of the date
of this document, these risks included, but were not limited to,
the risks listed below.
Market-Related Risk
The Teijin Group manufactures and sells products, the sales of
which may be affected by market conditions and competition with
other companies, as well as by market price fluctuations arising
thereof. Businesses involving commoditized materials—notably
polyester fibers, polyester films and polycarbonate resin—are
particularly vulnerable to fluctuations in shipments, sales prices
and procurement costs for raw materials and fuel related to market
conditions and competition with other companies. Because the
cost of raw materials and fuel accounts for a major portion of pro-
duction costs in these businesses, fluctuations in the price of
crude oil may have a significant impact on the Group’s income
performance.
The majority of products in the Teijin Group’s materials busi-
nesses are intermediates. Owing to inventory adjustments at each
stage of production and sales, the rate of expansion or contraction
of end-user demand for such products may exceed that of the real
economy.
The Teijin Group’s Healthcare segment is vulnerable to
changes in drug reimbursement prices under Japan’s National
Health Insurance (NHI) scheme, as well as to increasingly intense
competition, both of which may have a negative impact on sales
prices.
Fluctuations in foreign exchange and interest rates also have
the potential to affect the Teijin Group’s operating results and/or
financial position.
Product Quality Risk
Teijin Pharma Limited, the principal subsidiary in the Teijin Group’s
Healthcare segment, has established its own product reliability
assurance function in the form of a compliance division. This
division, which functions independently of other Group businesses,
is charged with quality assurance in all aspects of our healthcare
businesses. The Group maintains insurance coverage against
product liability.
Nonetheless, as the pharmaceuticals business involves prod-
ucts that may affect the lives of users, quality issues have the
potential to negatively affect, among others, the Group’s operating
results, financial position and public reputation.
R&D-Related Risk in the Pharmaceuticals Business
R&D in the pharmaceuticals business is characterized by significant
investments of funds and time. Pharmaceuticals discovery research
has a high incidence of failure. In the initial stages, there is a high
risk that researchers will fail to discover a promising drug. Even if a
promising drug is discovered, clinical trials may prove it not to be as
effective as anticipated, or to have unexpected adverse side effects,
thereby forcing the abandonment of plans to apply for approval.
There is also a risk that a new drug candidate may not receive reg-
ulatory approval as a result of the examination process that follows
application, or that approval may be rescinded based on the
outcome of research conducted subsequent to launch.
Risks Related to Overseas Operations
The Teijin Group has operations in the PRC, Southeast Asia
(including Thailand and Singapore), Europe (including Germany
and the Netherlands) and the United States. These operations are
vulnerable to the impact of fluctuations in foreign exchange and
interest rates. Our operations in the PRC and Southeast Asia, in
particular, may also be affected by such factors as the enforcement
of new—or unexpected changes to existing—laws, regulations or
tax systems that exert an adverse impact on the Group; economic
fluctuations; and social unrest triggered by, among others, changes
of government or acts of terror or war. The manifestation of such
risks has the potential to adversely affect the Group’s operating
results and/or financial position.
Risks Related to Accidents and Disasters
The Teijin Group has prepared common disaster prevention
guidelines for use by all Group companies and is an active propo-
nent of efforts to prevent and/or alleviate the impact of disasters
through disaster prevention diagnostics, earthquake response
measures, fire prevention and other advance prevention strategies,
disaster prevention education and training and post-disaster
impact mitigation measures.
Nonetheless, in the event of a major natural disaster or unfore-
seen accident that results in damage to the Group’s production
facilities or significantly impedes the Group’s supply chain, such
developments may have a negative impact on the Group’s
operating results and/or financial position.
At present, we forecast consolidated net sales of ¥780.0 billion,
a decline of about 1% from fiscal 2013. We also forecast operating
income of ¥25.0 billion, ordinary income of ¥22.5 billion and net
income of ¥10.0 billion, representing increases of approximately
38%, 13% and 20%, respectively. These forecasts assume an
exchange rate of ¥100 to US$1.00.
Forecast for Financial Position
In fiscal 2014, we will press forward with efforts to first maintain,
and then enhance, financial soundness. At the same time, we will
actively promote promising investments and projects with the
potential to contribute to future growth, in line with our current
medium- to long-term management vision. Our forecasts for fiscal
2014 are for an ROA of 3.2%, ROE of 3.6% and a debt-to-equity
ratio of 1.00 times.
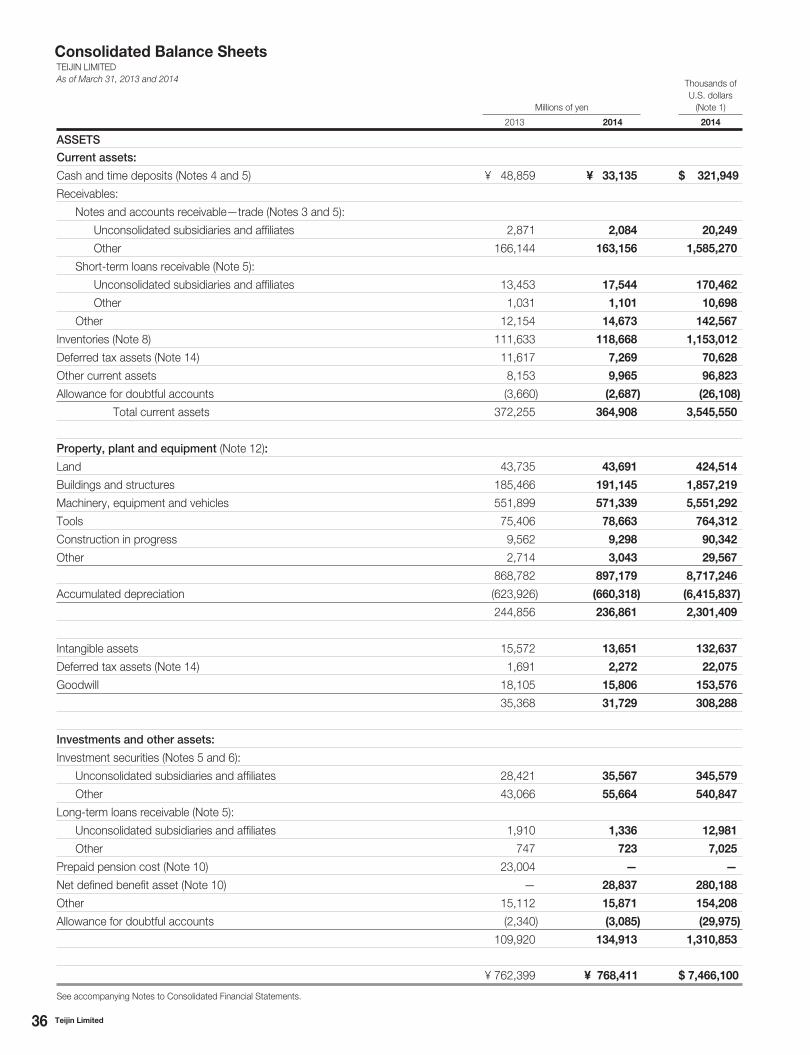
36 Teijin Limited
Consolidated Balance Sheets
Millions of yen
Thousands of
U.S. dollars
(Note 1)
2013 2014 2014
ASSETS
Current assets:
Cash and time deposits (Notes 4 and 5) ¥ 48,859 ¥ 33,135 $ 321,949
Receivables:
Notes and accounts receivable—trade (Notes 3 and 5):
Unconsolidated subsidiaries and affiliates 2,871 2,084 20,249
Other 166,144 163,156 1,585,270
Short-term loans receivable (Note 5):
Unconsolidated subsidiaries and affiliates 13,453 17,544 170,462
Other 1,031 1,101 10,698
Other 12,154 14,673 142,567
Inventories (Note 8) 111,633 118,668 1,153,012
Deferred tax assets (Note 14) 11,617 7,269 70,628
Other current assets 8,153 9,965 96,823
Allowance for doubtful accounts (3,660) (2,687) (26,108)
Total current assets 372,255 364,908 3,545,550
Property, plant and equipment (Note 12):
Land 43,735 43,691 424,514
Buildings and structures 185,466 191,145 1,857,219
Machinery, equipment and vehicles 551,899 571,339 5,551,292
Tools 75,406 78,663 764,312
Construction in progress 9,562 9,298 90,342
Other 2,714 3,043 29,567
868,782 897,179 8,717,246
Accumulated depreciation (623,926) (660,318) (6,415,837)
244,856 236,861 2,301,409
Intangible assets 15,572 13,651 132,637
Deferred tax assets (Note 14) 1,691 2,272 22,075
Goodwill 18,105 15,806 153,576
35,368 31,729 308,288
Investments and other assets:
Investment securities (Notes 5 and 6):
Unconsolidated subsidiaries and affiliates 28,421 35,567 345,579
Other 43,066 55,664 540,847
Long-term loans receivable (Note 5):
Unconsolidated subsidiaries and affiliates 1,910 1,336 12,981
Other 747 723 7,025
Prepaid pension cost (Note 10) 23,004 — —
Net defined benefit asset (Note 10) — 28,837 280,188
Other 15,112 15,871 154,208
Allowance for doubtful accounts (2,340) (3,085) (29,975)
109,920 134,913 1,310,853
¥ 762,399 ¥ 768,411 $ 7,466,100
See accompanying Notes to Consolidated Financial Statements.
TEIJIN LIMITED
As of March 31, 2013 and 2014
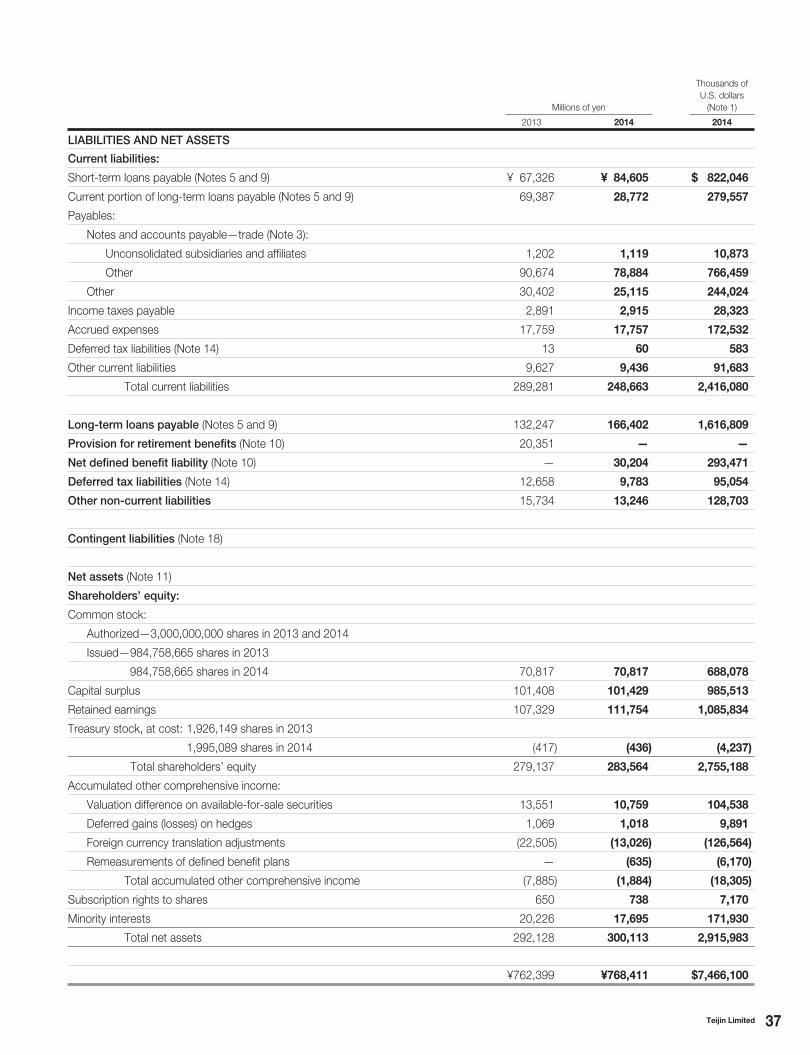
37Teijin Limited
Millions of yen
Thousands of
U.S. dollars
(Note 1)
2013 2014 2014
LIABILITIES AND NET ASSETS
Current liabilities:
Short-term loans payable (Notes 5 and 9) ¥ 67,326 ¥ 84,605 $ 822,046
Current portion of long-term loans payable (Notes 5 and 9) 69,387 28,772 279,557
Payables:
Notes and accounts payable—trade (Note 3):
Unconsolidated subsidiaries and affiliates 1,202 1,119 10,873
Other 90,674 78,884 766,459
Other 30,402 25,115 244,024
Income taxes payable 2,891 2,915 28,323
Accrued expenses 17,759 17,757 172,532
Deferred tax liabilities (Note 14) 13 60 583
Other current liabilities 9,627 9,436 91,683
Total current liabilities 289,281 248,663 2,416,080
Long-term loans payable (Notes 5 and 9) 132,247 166,402 1,616,809
Provision for retirement benefits (Note 10) 20,351 — —
Net defined benefit liability (Note 10) — 30,204 293,471
Deferred tax liabilities (Note 14) 12,658 9,783 95,054
Other non-current liabilities 15,734 13,246 128,703
Contingent liabilities (Note 18)
Net assets (Note 11)
Shareholders’ equity:
Common stock:
Authorized—3,000,000,000 shares in 2013 and 2014
Issued—984,758,665 shares in 2013
984,758,665 shares in 2014 70,817 70,817 688,078
Capital surplus 101,408 101,429 985,513
Retained earnings 107,329 111,754 1,085,834
Treasury stock, at cost: 1,926,149 shares in 2013
1,995,089 shares in 2014 (417) (436) (4,237)
Total shareholders’ equity 279,137 283,564 2,755,188
Accumulated other comprehensive income:
Valuation difference on available-for-sale securities 13,551 10,759 104,538
Deferred gains (losses) on hedges 1,069 1,018 9,891
Foreign currency translation adjustments (22,505) (13,026) (126,564)
Remeasurements of defined benefit plans — (635) (6,170)
Total accumulated other comprehensive income (7,885) (1,884) (18,305)
Subscription rights to shares 650 738 7,170
Minority interests 20,226 17,695 171,930
Total net assets 292,128 300,113 2,915,983
¥762,399 ¥768,411 $7,466,100
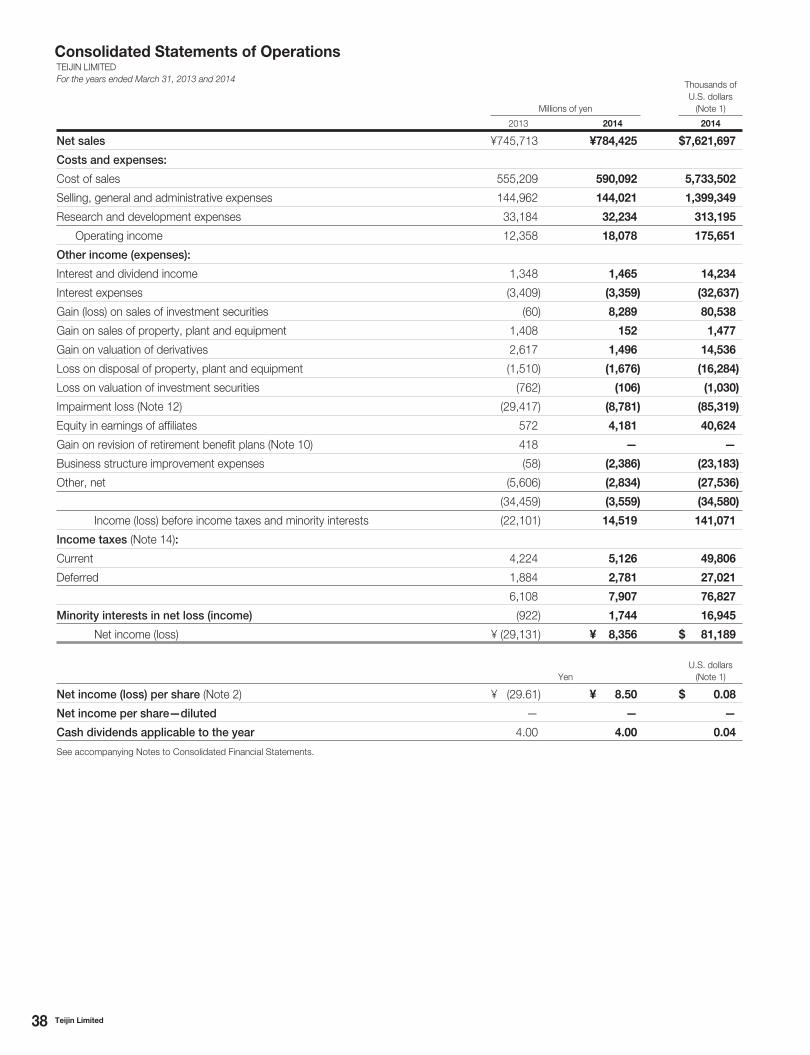
38 Teijin Limited
Millions of yen
Thousands of
U.S. dollars
(Note 1)
2013 2014 2014
Net sales ¥745,713 ¥784,425 $7,621,697
Costs and expenses:
Cost of sales 555,209 590,092 5,733,502
Selling, general and administrative expenses 144,962 144,021 1,399,349
Research and development expenses 33,184 32,234 313,195
Operating income 12,358 18,078 175,651
Other income (expenses):
Interest and dividend income 1,348 1,465 14,234
Interest expenses (3,409) (3,359) (32,637)
Gain (loss) on sales of investment securities (60) 8,289 80,538
Gain on sales of property, plant and equipment 1,408 152 1,477
Gain on valuation of derivatives 2,617 1,496 14,536
Loss on disposal of property, plant and equipment (1,510) (1,676) (16,284)
Loss on valuation of investment securities (762) (106) (1,030)
Impairment loss (Note 12) (29,417) (8,781) (85,319)
Equity in earnings of affiliates 572 4,181 40,624
Gain on revision of retirement benefit plans (Note 10) 418 — —
Business structure improvement expenses (58) (2,386) (23,183)
Other, net (5,606) (2,834) (27,536)
(34,459) (3,559) (34,580)
Income (loss) before income taxes and minority interests (22,101) 14,519 141,071
Income taxes (Note 14):
Current 4,224 5,126 49,806
Deferred 1,884 2,781 27,021
6,108 7,907 76,827
Minority interests in net loss (income) (922) 1,744 16,945
Net income (loss) ¥ (29,131) ¥ 8,356 $ 81,189
Yen
U.S. dollars
(Note 1)
Net income (loss) per share (Note 2) ¥ (29.61) ¥ 8.50 $ 0.08
Net income per share—diluted — — —
Cash dividends applicable to the year 4.00 4.00 0.04
See accompanying Notes to Consolidated Financial Statements.
Consolidated Statements of OperationsTEIJIN LIMITED
For the years ended March 31, 2013 and 2014
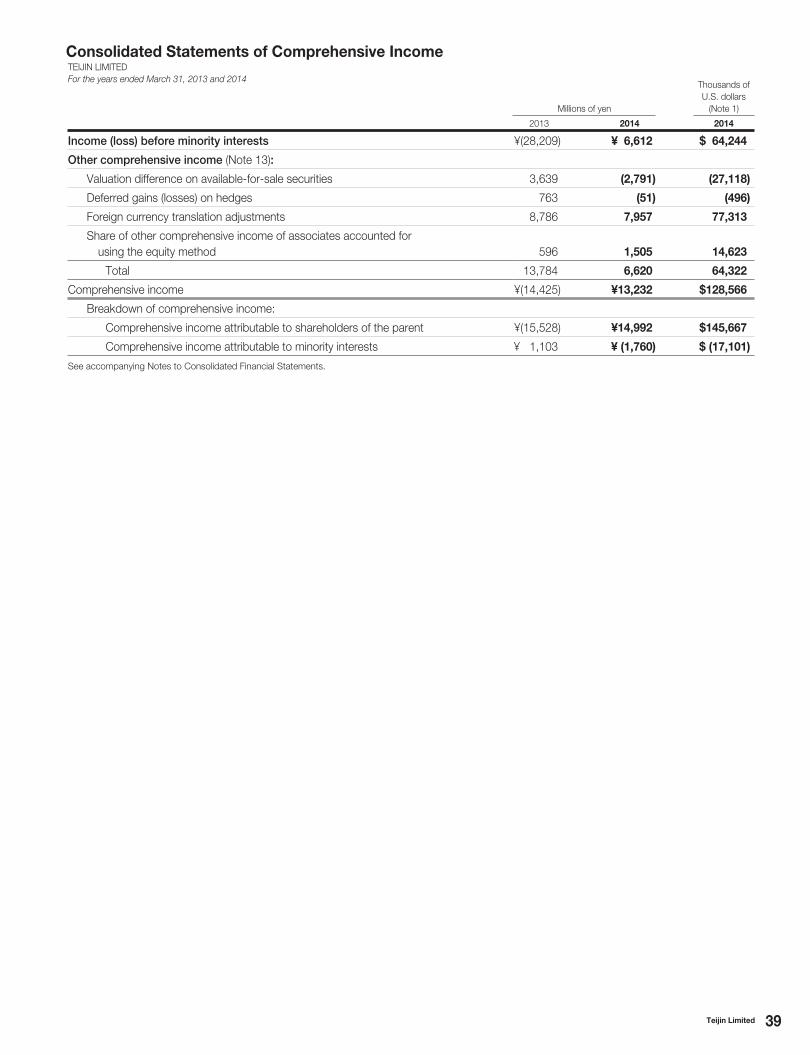
39Teijin Limited
Millions of yen
Thousands of
U.S. dollars
(Note 1)
2013 2014 2014
Income (loss) before minority interests ¥(28,209) ¥ 6,612 $ 64,244
Other comprehensive income (Note 13):
Valuation difference on available-for-sale securities 3,639 (2,791) (27,118)
Deferred gains (losses) on hedges 763 (51) (496)
Foreign currency translation adjustments 8,786 7,957 77,313
Share of other comprehensive income of associates accounted for
using the equity method 596 1,505 14,623
Total 13,784 6,620 64,322
Comprehensive income ¥(14,425) ¥13,232 $128,566
Breakdown of comprehensive income:
Comprehensive income attributable to shareholders of the parent ¥(15,528) ¥14,992 $145,667
Comprehensive income attributable to minority interests ¥ 1,103 ¥ (1,760) $ (17,101)
See accompanying Notes to Consolidated Financial Statements.
Consolidated Statements of Comprehensive IncomeTEIJIN LIMITED
For the years ended March 31, 2013 and 2014
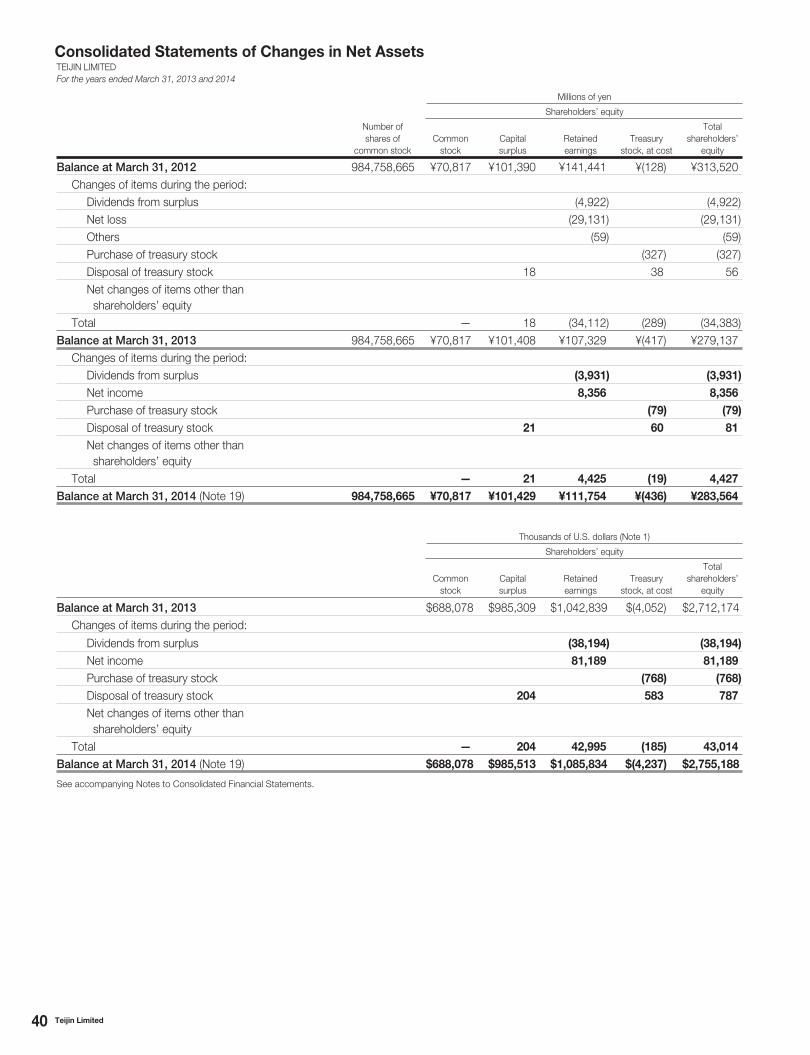
40 Teijin Limited
Millions of yen
Shareholders’ equity
Number of
shares of
common stock
Common
stock
Capital
surplus
Retained
earnings
Treasury
stock, at cost
Total
shareholders’
equity
Balance at March 31, 2012 984,758,665 ¥70,817 ¥101,390 ¥141,441 ¥(128) ¥313,520
Changes of items during the period:
Dividends from surplus (4,922) (4,922)
Net loss (29,131) (29,131)
Others (59) (59)
Purchase of treasury stock (327) (327)
Disposal of treasury stock 18 38 56
Net changes of items other than
shareholders’ equity
Total — 18 (34,112) (289) (34,383)
Balance at March 31, 2013 984,758,665 ¥70,817 ¥101,408 ¥107,329 ¥(417) ¥279,137
Changes of items during the period:
Dividends from surplus (3,931) (3,931)
Net income 8,356 8,356
Purchase of treasury stock (79) (79)
Disposal of treasury stock 21 60 81
Net changes of items other than
shareholders’ equity
Total — 21 4,425 (19) 4,427
Balance at March 31, 2014 (Note 19) 984,758,665 ¥70,817 ¥101,429 ¥111,754 ¥(436) ¥283,564
Thousands of U.S. dollars (Note 1)
Shareholders’ equity
Common
stock
Capital
surplus
Retained
earnings
Treasury
stock, at cost
Total
shareholders’
equity
Balance at March 31, 2013 $688,078 $985,309 $1,042,839 $(4,052) $2,712,174
Changes of items during the period:
Dividends from surplus (38,194) (38,194)
Net income 81,189 81,189
Purchase of treasury stock (768) (768)
Disposal of treasury stock 204 583 787
Net changes of items other than
shareholders’ equity
Total — 204 42,995 (185) 43,014
Balance at March 31, 2014 (Note 19) $688,078 $985,513 $1,085,834 $(4,237) $2,755,188
See accompanying Notes to Consolidated Financial Statements.
Consolidated Statements of Changes in Net AssetsTEIJIN LIMITED
For the years ended March 31, 2013 and 2014
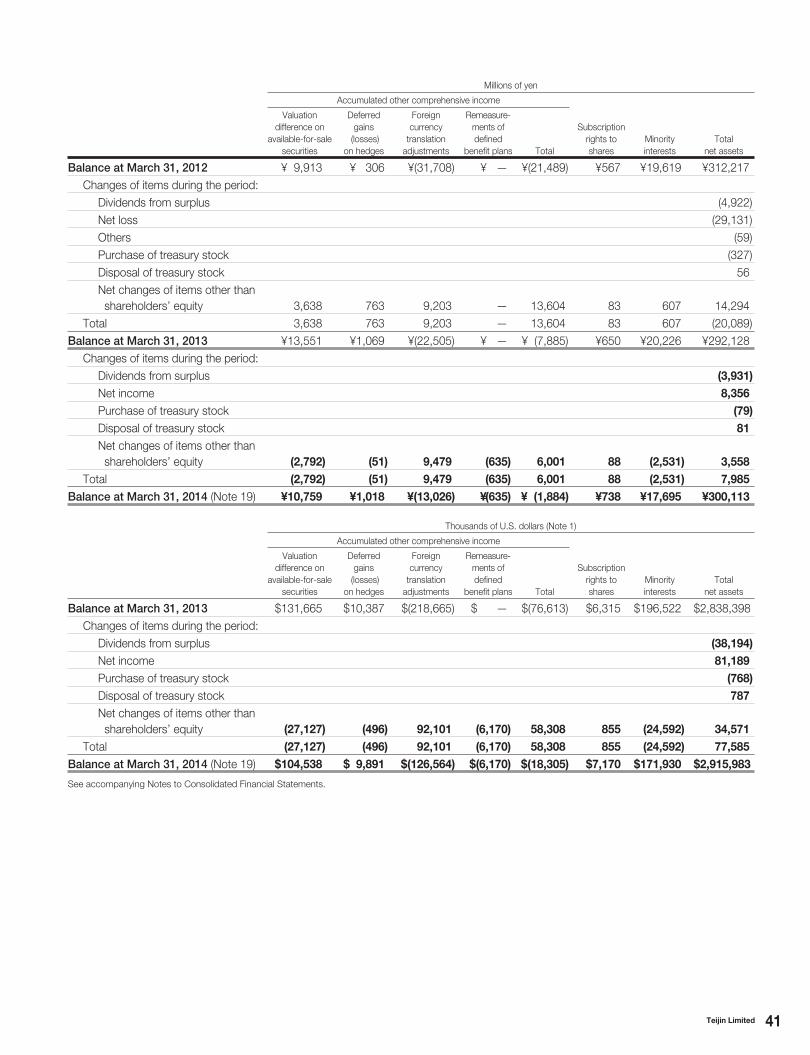
41Teijin Limited
Millions of yen
Accumulated other comprehensive income
Valuation
difference on
available-for-sale
securities
Deferred
gains
(losses)
on hedges
Foreign
currency
translation
adjustments
Remeasure-
ments of
defined
benefit plans Total
Subscription
rights to
shares
Minority
interests
Total
net assets
Balance at March 31, 2012 ¥ 9,913 ¥ 306 ¥(31,708) ¥ — ¥(21,489) ¥567 ¥19,619 ¥312,217
Changes of items during the period:
Dividends from surplus (4,922)
Net loss (29,131)
Others (59)
Purchase of treasury stock (327)
Disposal of treasury stock 56
Net changes of items other than
shareholders’ equity 3,638 763 9,203 — 13,604 83 607 14,294
Total 3,638 763 9,203 — 13,604 83 607 (20,089)
Balance at March 31, 2013 ¥13,551 ¥1,069 ¥(22,505) ¥ — ¥ (7,885) ¥650 ¥20,226 ¥292,128
Changes of items during the period:
Dividends from surplus (3,931)
Net income 8,356
Purchase of treasury stock (79)
Disposal of treasury stock 81
Net changes of items other than
shareholders’ equity (2,792) (51) 9,479 (635) 6,001 88 (2,531) 3,558
Total (2,792) (51) 9,479 (635) 6,001 88 (2,531) 7,985
Balance at March 31, 2014 (Note 19) ¥10,759 ¥1,018 ¥(13,026) ¥(635) ¥ (1,884) ¥738 ¥17,695 ¥300,113
Thousands of U.S. dollars (Note 1)
Accumulated other comprehensive income
Valuation
difference on
available-for-sale
securities
Deferred
gains
(losses)
on hedges
Foreign
currency
translation
adjustments
Remeasure-
ments of
defined
benefit plans Total
Subscription
rights to
shares
Minority
interests
Total
net assets
Balance at March 31, 2013 $131,665 $10,387 $(218,665) $ — $(76,613) $6,315 $196,522 $2,838,398
Changes of items during the period:
Dividends from surplus (38,194)
Net income 81,189
Purchase of treasury stock (768)
Disposal of treasury stock 787
Net changes of items other than
shareholders’ equity (27,127) (496) 92,101 (6,170) 58,308 855 (24,592) 34,571
Total (27,127) (496) 92,101 (6,170) 58,308 855 (24,592) 77,585
Balance at March 31, 2014 (Note 19) $104,538 $ 9,891 $(126,564) $(6,170) $(18,305) $7,170 $171,930 $2,915,983
See accompanying Notes to Consolidated Financial Statements.
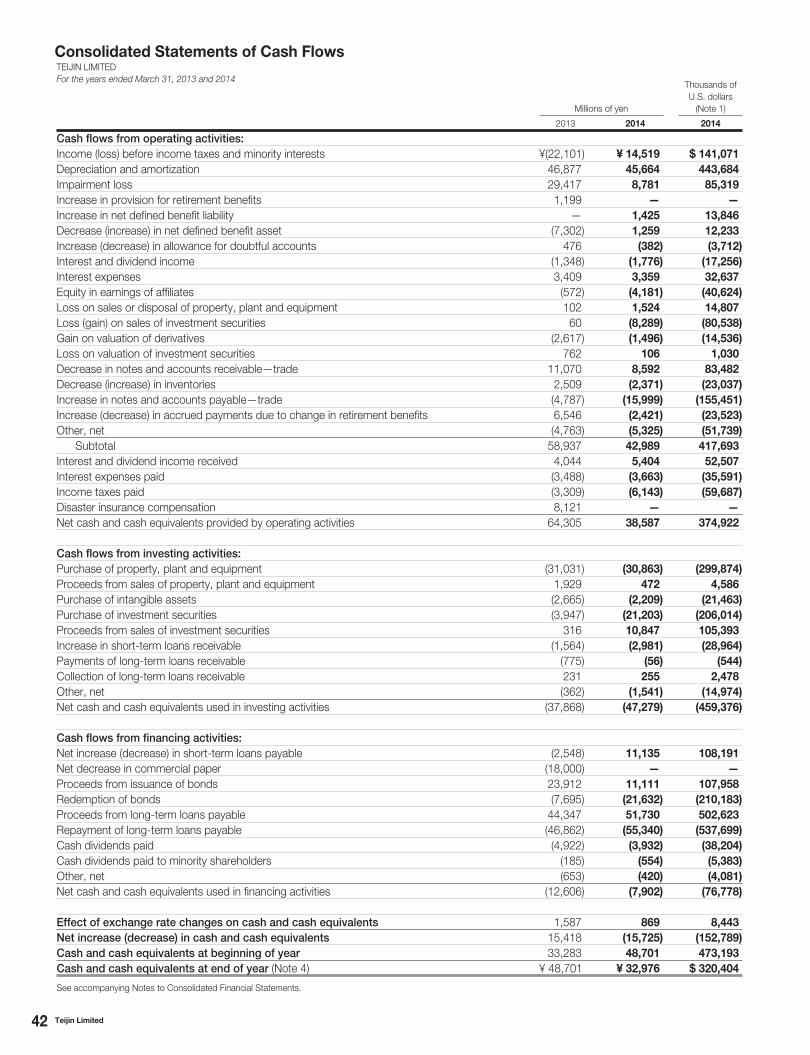
42 Teijin Limited
Consolidated Statements of Cash Flows
Millions of yen
Thousands of
U.S. dollars
(Note 1)
2013 2014 2014
Cash flows from operating activities:
Income (loss) before income taxes and minority interests ¥(22,101) ¥ 14,519 $ 141,071
Depreciation and amortization 46,877 45,664 443,684
Impairment loss 29,417 8,781 85,319
Increase in provision for retirement benefits 1,199 — —
Increase in net defined benefit liability — 1,425 13,846
Decrease (increase) in net defined benefit asset (7,302) 1,259 12,233
Increase (decrease) in allowance for doubtful accounts 476 (382) (3,712)
Interest and dividend income (1,348) (1,776) (17,256)
Interest expenses 3,409 3,359 32,637
Equity in earnings of affiliates (572) (4,181) (40,624)
Loss on sales or disposal of property, plant and equipment 102 1,524 14,807
Loss (gain) on sales of investment securities 60 (8,289) (80,538)
Gain on valuation of derivatives (2,617) (1,496) (14,536)
Loss on valuation of investment securities 762 106 1,030
Decrease in notes and accounts receivable—trade 11,070 8,592 83,482
Decrease (increase) in inventories 2,509 (2,371) (23,037)
Increase in notes and accounts payable—trade (4,787) (15,999) (155,451)
Increase (decrease) in accrued payments due to change in retirement benefits 6,546 (2,421) (23,523)
Other, net (4,763) (5,325) (51,739)
Subtotal 58,937 42,989 417,693
Interest and dividend income received 4,044 5,404 52,507
Interest expenses paid (3,488) (3,663) (35,591)
Income taxes paid (3,309) (6,143) (59,687)
Disaster insurance compensation 8,121 — —
Net cash and cash equivalents provided by operating activities 64,305 38,587 374,922
Cash flows from investing activities:
Purchase of property, plant and equipment (31,031) (30,863) (299,874)
Proceeds from sales of property, plant and equipment 1,929 472 4,586
Purchase of intangible assets (2,665) (2,209) (21,463)
Purchase of investment securities (3,947) (21,203) (206,014)
Proceeds from sales of investment securities 316 10,847 105,393
Increase in short-term loans receivable (1,564) (2,981) (28,964)
Payments of long-term loans receivable (775) (56) (544)
Collection of long-term loans receivable 231 255 2,478
Other, net (362) (1,541) (14,974)
Net cash and cash equivalents used in investing activities (37,868) (47,279) (459,376)
Cash flows from financing activities:
Net increase (decrease) in short-term loans payable (2,548) 11,135 108,191
Net decrease in commercial paper (18,000) — —
Proceeds from issuance of bonds 23,912 11,111 107,958
Redemption of bonds (7,695) (21,632) (210,183)
Proceeds from long-term loans payable 44,347 51,730 502,623
Repayment of long-term loans payable (46,862) (55,340) (537,699)
Cash dividends paid (4,922) (3,932) (38,204)
Cash dividends paid to minority shareholders (185) (554) (5,383)
Other, net (653) (420) (4,081)
Net cash and cash equivalents used in financing activities (12,606) (7,902) (76,778)
Effect of exchange rate changes on cash and cash equivalents 1,587 869 8,443
Net increase (decrease) in cash and cash equivalents 15,418 (15,725) (152,789)
Cash and cash equivalents at beginning of year 33,283 48,701 473,193
Cash and cash equivalents at end of year (Note 4) ¥ 48,701 ¥ 32,976 $ 320,404
See accompanying Notes to Consolidated Financial Statements.
TEIJIN LIMITED
For the years ended March 31, 2013 and 2014
43Teijin Limited
Notes to Consolidated Financial StatementsTEIJIN LIMITED
Note 1. Basis of presenting consolidated financial statements
The accompanying consolidated financial statements of Teijin
Limited (the “Company”) have been prepared in accordance with
the provisions set forth in Japan’s Financial Instruments and
Exchange Law (the “Law”) and the related accounting regulations,
and in conformity with accounting principles generally accepted in
Japan (“Japanese GAAP”), which are different in certain respects as
to application and disclosure requirements of International Financial
Reporting Standards (“IFRS”).
Prior to the year ended March 31, 2009, the accounts of
overseas subsidiaries were based on their accounting records
maintained in conformity with generally accepted accounting princi-
ples prevailing in their respective countries of domicile. From the
year ended March 31, 2009, the Company adopted the “Practical
Solution on Unification of Accounting Policies Applied to Foreign
Subsidiaries for Consolidated Financial Statements” (Practical
Issues Task Force (“PITF”) No. 18, issued by the Accounting
Standards Board of Japan (“ASBJ”) on May 17, 2006). In principle,
the Company has unified the accounting standards for overseas
subsidiaries and makes necessary adjustments upon consolidation.
There were no material effects as a result of the adoption of PITF
No. 18 on the consolidated financial statements for the years ended
March 31, 2013 and 2014.
The accompanying consolidated financial statements have
been reformatted and translated into English with some expanded
descriptions from the consolidated financial statements of the
Company prepared in accordance with Japanese GAAP and filed
with the appropriate Local Finance Bureau of the Ministry of Finance
as required by the Law. Certain supplementary information included
in the statutory Japanese-language consolidated financial state-
ments, but not required for fair presentation, is not presented in the
accompanying consolidated financial statements.
The translation of the Japanese yen amounts into U.S. dollar
amounts is included solely for the convenience of readers outside
Japan, using the prevailing exchange rate at March 31, 2014, which
was ¥102.92 to U.S.$1.00. The convenience translations should
not be construed as representations that the Japanese yen amounts
have been, could have been or could in the future be converted into
U.S. dollars at this or any other rate of exchange.
Note 2. Summary of significant accounting policies
Consolidation
The consolidated financial statements include the accounts of the
Company and 69 significant subsidiaries for the year ended March
31, 2014. For 2013, 72 significant subsidiaries were included in the
consolidated financial statements. Investments made in 78 (71 in
2013) unconsolidated subsidiaries and affiliates are, with minor
exceptions, stated at cost, adjusted for equity in undistributed
earnings and losses since acquisition.
Companies which are 40% or more owned and substantially
controlled by the Company are considered subsidiaries for inclusion
in the consolidation. Equity method accounting is applied to uncon-
solidated subsidiaries and affiliates which are substantially con-
trolled or of which operating and financial policies are significantly
influenced by the Company.
In the elimination of investments in subsidiaries, the assets
and liabilities of the subsidiaries, including the portion attributable
to minority shareholders, are evaluated using the fair value at the
time the Company acquired control of the respective subsidiaries.
Goodwill is usually amortized using the straight-line method
over the estimated useful life from five to 20 years.
Of the Company’s consolidated subsidiaries, 11 (same in 2013)
did not change their fiscal year-end from December 31. These 11
subsidiaries prepared, for consolidation purposes, statements for
the period that correspond to the fiscal year of the Company.
Statements of cash flows
In preparing the consolidated statements of cash flows, cash on
hand, readily available deposits and short-term highly liquid invest-
ments with maturities not exceeding three months at the time of
purchase are considered to be cash and cash equivalents.
Allowance for doubtful accounts
The allowance for doubtful accounts is provided in amounts
sufficient to cover possible losses on collection. It is determined
by adding the individually estimated uncollectible amounts of certain
accounts to an amount calculated using the provision rate based
on past experience.
Securities
Under the Japanese accounting standard for financial instruments,
all companies are required to classify securities as (a) securities
held for trading purposes (“trading securities”), (b) debt securities
intended to be held to maturity (“held-to-maturity debt securities”),
(c) equity securities issued by subsidiaries and affiliated companies
and (d) all other securities that are not classified in any of the above
categories (“available-for-sale securities”).
The Company and its consolidated subsidiaries (the “Companies”)
do not hold trading securities. Held-to-maturity debt securities are
stated at amortized cost.
44 Teijin Limited
Equity securities issued by subsidiaries and affiliated companies,
which are not consolidated or accounted for using the equity
method, are stated at moving-average cost. Available-for-sale
securities with available fair market values are stated at fair market
value. Unrealized gains and losses on these securities are reported,
net of applicable income taxes, as a separate component of net
assets. Realized gains and losses on sales of such securities are
computed using moving-average cost.
Debt securities with no available fair market value are stated at
amortized cost, net of the amount considered not collectible. Other
securities with no available fair market value are stated at moving-
average cost.
If the market value of held-to-maturity debt securities, equity
securities issued by unconsolidated subsidiaries and affiliated com-
panies and available-for-sale securities decline significantly, such
securities are stated at fair market value and the difference between
fair market value and the carrying amount is recognized as a loss in
the period of the decline. If the fair market value of equity securities
issued by unconsolidated subsidiaries and affiliated companies not
accounted for using the equity method is not readily available, the
securities will be written down to net asset value with a correspond-
ing charge in the consolidated statements of operations in the event
net asset value declines significantly. In these cases, the fair market
value or the net asset value will be the carrying amount of the
securities at the beginning of the following year.
Inventories
Inventories are stated at the lower of average cost or net realizable
value.
Property, plant and equipment
Property, plant and equipment are amortized using the straight-line
method over the estimated useful life of the asset.
(Change in accounting treatment for rental home health-care devices)Up to and including the year ended March 31, 2013, certain of the
home healthcare devices that the Companies rent were recognized
in expenses at the time of rental. However, effective from the year
ended March 31, 2014, the Companies have recognized these
devices as fixed assets and have depreciated them using the
straight-line method.
The Companies anticipate rapid growth in the market for con-
tinuous positive airway pressure (“CPAP”) ventilators for the treat-
ment of sleep apnea syndrome (“SAS”) and have established a
business configuration capable of responding to such growth. In
light of these factors, having considered what accounting method
would most appropriately reflect the constant environment for
use of its core CPAP ventilators at present and in the future, the
Companies resolved to treat these devices as property, plant and
equipment and to depreciate them using the straight-line method,
which they use to depreciate its other home healthcare devices. As
a result of this change, consolidated operating income and income
before income taxes and minority interests for the year ended
March 31, 2014 were each ¥1,740 million ($16,906 thousand)
higher than would have been the case had the previous method
of depreciation been used.
Additionally, up to and including the year ended March 31,
2013, purchases of the aforementioned devices for rental, now
recognized as property, plant and equipment, were accounted for
in “Cash flows from operating activities.” However, effective from
the year ended March 31, 2014, these outlays are accounted for
in “Purchase of property, plant and equipment” in “Cash flows
from investing activities.” Depreciation of such equipment is now
accounted for in “Depreciation and amortization” in “Cash flows
from operating activities.” As a result of this change, “Net cash and
cash equivalents provided by operating activities” and “Net cash
and cash equivalents used in investing activities” for the year ended
March 31, 2014 were ¥2,139 million ($20,783 thousand) higher and
¥2,139 million ($20,783 thousand) lower, respectively, than would
have been the case had the previous method of accounting
been used.
For information, on the impact of this change on segment
results, see Note 17, “Segment information.”
Intangible assets
Goodwill, patents, trademarks and other intangible assets are
amortized using the straight-line method over the estimated useful
life of the asset.
Software for internal use is amortized using the straight-line
method over the estimated useful life, i.e. five to 10 years.
Research and development expenses
The Company charges research and development expenses to
income as incurred.
Retirement benefits
(1) EmployeesThe Company has an unfunded lump-sum benefit plan and a funded
contributory pension plan, generally covering all employees. Certain
consolidated subsidiaries have unfunded lump-sum benefit plans
and non-contributory pension plans. Most overseas subsidiaries
do not have pension plans.
Under the terms of the lump-sum benefit plans, eligible
employees are upon mandatory retirement at age 60 or voluntary
termination before such age, entitled under most circumstances to
a lump-sum payment based on their compensation at the time of
severance and years of service.
The liabilities and expenses for severance and retirement
benefits are determined based on the amounts actuarially calcu-
lated using certain assumptions. The Companies provided for
employees’ severance and retirement benefits at March 31, 2013
and 2014 based on the estimated amounts of projected benefit
obligation and the fair value of the plan assets at those dates.
Prior service costs and actuarial gains and losses are recog-
nized in expenses using the straight-line method over mainly 12
years, which is within the average of the estimated remaining ser-
vice years of the employees, commencing with the current and the
45Teijin Limited
following period, respectively. Effective from October 1, 2012, the
Company and certain consolidated subsidiaries transferred the
defined benefit portions of their pension plans for current employ-
ees to a defined contribution pension plan. The period used to
amortize prior service costs and actuarial gains and losses for the
defined benefit portion prior to the transfer was changed to mainly
five years, which is within the average of the estimated remaining
payout periods for the employees at the time of the transfer.
(Application of Accounting Standard for Retirement Benefits)Effective March 31, 2014, the Company has applied the “Accounting
Standard for Retirement Benefits” (ASBJ Statement No. 26, issued
on May 17, 2012) and “Guidance on Accounting Standard for
Retirement Benefits” (ASBJ Guidance No. 25, issued on May 17,
2012), with the exception of provisions set forth in Clause 35 of the
standard and Clause 67 of its accompanying guidance.
Under the new accounting standard, the difference between
projected benefit obligation and fair value of plan assets is recog-
nized as a net defined benefit liability or, in the event that the fair
value of plan assets exceeds the projected benefit obligation, as
a net defined benefit asset. Unrecognized actuarial gains and
losses and prior service costs are recognized as a net defined
benefit liability.
The application of the new accounting standard and its accom-
panying guidance is subject to the transitional accounting treatment
set forth in Clause 37 of the standard. In the year ended March 31,
2014, remeasurements of defined benefit plans were included in
accumulated other comprehensive income to reflect the impact
of this change in method of accounting. As a result, the Company
recorded a net defined benefit liability of ¥7,729 million ($75,097
thousand) and a net defined benefit asset of ¥7,091 million ($68,898
thousand), while comprehensive income decreased by ¥635 million
($6,169 thousand). Shareholders’ equity per share was reduced by
¥0.65 ($0.006).
(Additional information)Previously, the pension plans of the Company and certain consoli-
dated subsidiaries included a defined benefit portion. Effective from
October 1, 2012, the Company and these subsidiaries transferred
the defined benefit portion of their pension plans for current
employees to a defined contribution pension plan. To account for
this transfer, effective from the year ended March 31, 2013, the
Company has applied the “Guidance on Accounting for Transfers
between Retirement Benefit Plans” (ASBJ Guidance No. 1, issued
on January 31, 2002). As a result of this change, a gain on revision
of retirement benefit plans of ¥418 million is included in other
income.
(Change in accounting estimates)Prior service costs and actuarial gains and losses for the defined
benefit portion of pension plans were previously recognized in
expenses using the straight-line method over mainly 12 years,
which is within the average of the estimated remaining service
years of current employees. With the transfer of the defined
benefit portion of pension plans for current employees to a defined
contribution pension plan, the period used in this calculation was
changed to mainly five years, which is within the average of the
estimated remaining payout period for these employees. As a
result, in the year ended March 31, 2013, operating income and
ordinary income decreased by ¥616 million, and loss before income
taxes and minority interests increased by ¥616 million, compared
to what would have been recorded had the previous accounting
estimate been used.
(2) Directors and statutory auditorsPrior to the general shareholders’ meeting held on June 22, 2011,
the Company resolved to abolish the lump-sum retirement payments
for directors and auditors of the Company and instead to make
upon retirement a lump-sum payment to each eligible director
and auditor for duties performed up to the date of abolition.
Liabilities arising from the application of the equity
method
Liabilities arising from the application of the equity method have
been provided with respect to losses that may arise from the
Company’s portion of the capital deficits of unconsolidated subsid-
iaries and affiliates that are accounted for by the equity method,
after giving consideration to the Company’s investments in, and
guarantees for, such companies.
Derivatives and hedge accounting
The Companies state derivative financial instruments at fair value
and recognize changes in the fair value as gain or loss unless the
derivative financial instruments are used for hedging purposes.
If derivative financial instruments are used as hedges and meet
certain hedging criteria, the Company and its consolidated subsid-
iaries defer recognition of the gain or loss resulting from a change
in fair value of the derivative financial instrument until the related
gain or loss on the hedged item is recognized.
If a forward foreign exchange contract is executed to hedge a
future transaction denominated in a foreign currency, the forecast
transaction will be recorded using the contracted forward rate on
recognition, and no gains or losses on the forward foreign exchange
contract are recognized (the “principle-based method”).
If interest rate swap contracts of the Company are used as
hedges and meet certain hedging criteria, the net amount to be
paid or received under the interest rate swap contract is added to
or deducted from the interest on the assets or liabilities for which
the swap contract was executed (the “conventional method”).
Income taxes
The provision for income taxes is based on income for financial
statement purposes. Income taxes comprise corporation tax,
enterprise tax and prefectural and municipal inhabitants’ taxes.
The assets and liabilities approach is used to recognize deferred
tax assets and liabilities for the expected future tax consequences
of temporary differences between the carrying amounts of assets
46 Teijin Limited
and liabilities for financial reporting purposes and the amounts used
for income tax purposes.
The Company and its wholly owned domestic consolidated
subsidiaries have adopted the consolidated tax return filing under
Japanese tax regulations for the year ended March 31, 2006 and
thereafter.
Translation of foreign currency
Cash, receivables and payables denominated in foreign currencies
are translated into Japanese yen at year-end exchange rates. All
revenues and expenses in foreign currencies are translated at the
exchange rates prevailing when such transactions are made. The
resulting exchange loss or gain is charged or credited to income.
The balance sheet accounts of the overseas consolidated
subsidiaries and foreign investments accounted for by the equity
method are translated at the rates of exchange in effect at the
balance sheet date, except for capital accounts and assets and
liabilities due to/from the Company, which are translated at historical
rates. Accounts in the consolidated statements of operations are
translated at the average rates of exchange for the year. Differences
arising from translations are presented as “Foreign currency trans-
lation adjustments” in the accompanying consolidated financial
statements. The Companies report foreign currency translation
adjustments in net assets.
Net income (loss) per share
Computations of net income (loss) per share of common stock are
based on the weighted-average number of shares outstanding dur-
ing each period. Diluted net income per share is calculated based
on the assumption that all dilutive convertible debentures and stock
warrants were converted or exercised at the beginning of the year
or at the time of issue.
Net income (loss) per share for the years ended March 31,
2013 and 2014 is calculated based on the following factors:
Year ended March 31, 2013
( a ) Net loss ¥29,131 million
(b ) Amount not attributable to common share-holders: ¥ — million
( c ) Bonuses to directors and statutory auditors included in (b): ¥ — million
(d ) Net loss allocated to common stock: ¥29,131 million
( e ) Average number of shares outstanding dur-ing the period: 983,748 thousand shares
( f ) Increase in number of shares: —
(g ) Increase in number of subscription rights to shares included in (f): —
( h ) Summary of outstanding potential shares excluded from the computation of diluted EPS, if calculated for the period, since such potential stocks do not have a dilutive effect:
—
Year ended March 31, 2014
( a ) Net income: ¥8,356 million ($81,189 thousand)
(b ) Amount not attributable to com-mon shareholders: ¥ — million ($ — thousand)
( c ) Bonuses to directors and statutory auditors included in (b): ¥ — million ($ — thousand)
(d ) Net income allocated to common stock: ¥8,356 million ($81,189 thousand)
( e ) Average number of shares out-standing during the period: 982,860 thousand shares
( f ) Increase in number of shares: 2,947
(g ) Increase in number of subscription rights to shares included in (f): 2,947
( h ) Summary of outstanding potential shares excluded from the compu-tation of diluted EPS, if calculated for the period, since such potential stocks do not have a dilutive effect:
—
(Accounting standards issued but not yet effective)(1) Accounting Standard for Retirement Benefits“Accounting Standard for Retirement Benefits” (ASBJ Statement
No. 26, issued on May 17, 2012)
“Guidance on Accounting Standard for Retirement Benefits” (ASBJ
Guidance No. 25, issued on May 17, 2012)
1. Outline
The new accounting standard contains amendments to, among
others, formulas for amortizing unrecognized actuarial gains and
losses and prior service costs, as well as formulas for computing
and standards for disclosing projected benefit obligation and ser-
vice costs.
2. Timing of adoption
The Company expects to adopt new methods for computing
projected benefit obligation and service costs from the beginning
of the year ending March 31, 2015.
The new accounting standard and its accompanying guid-
ance are subject to transitional accounting treatment.
Accordingly, it will not be applied retroactively to consolidated
financial statements from past years.
3. Impact of the adoption of the accounting standard
The Company is currently in the process of evaluating the impact
of the application of this new accounting standard on its consoli-
dated financial statements in the year ending March 31, 2015.
(2) Accounting standards for business combinations “Revised Accounting Standard for Business Combinations” (ASBJ
Statement No. 21)
“Revised Accounting Standard for Consolidated Financial
Statements” (ASBJ Statement No. 22)
“Revised Accounting Standard for Business Divestitures” (ASBJ
Statement No. 7)
47Teijin Limited
“Revised Accounting Standard for Earnings per Share” (ASBJ
Statement No. 2)
“Revised Guidance on Accounting Standard for Business
Combinations and Accounting Standard for Business Divestitures”
(ASBJ Guidance No. 10)
“Revised Guidance on Accounting Standard for Earnings per
Share” (ASBJ Guidance No. 4)
All of the above were issued on September 13, 2013.
1. Outline
The accounting treatment for changes in a parent’s ownership
interest in a subsidiary when the parent retains control over the
subsidiary in the additional acquisition of shares therein and
acquisition related costs was revised. In addition, besides the
amendment of “minority interests” to “non-controlling interests,”
the presentation method of net income was amended and transi-
tional provisions for accounting treatments were defined.
2. Timing of adoption
The Company expects to apply these revised accounting stan-
dards and guidance from the beginning of the fiscal year ending
March 31, 2016.
However, the transitional provisions for accounting treatments
will be applied from business combinations performed on or after
the beginning of the fiscal year ending March 31, 2016.
3. Impact of the adoption of the accounting standards
The effect of adoption of these revised accounting standards is
now under assessment at the time of preparation of the accom-
panying consolidated financial statements.
(Reclassifications and restatements)Certain prior year amounts have been reclassified and restated to
conform to the current year’s presentation. These reclassifications
and restatements have no impact on previously reported results of
operations or retained earnings.
(Additional information)Accounting Standard for Accounting Changes and
Error Corrections
Effective from the year ended March 31, 2012, the Company and
the consolidated companies adopted the “Accounting Standard for
Accounting Changes and Error Corrections” (ASBJ Statement No.
24, issued on December 4, 2009) and “Guidance on Accounting
Standard for Accounting Changes and Error Corrections” (ASBJ
Guidance No. 24, issued on December 4, 2009). This standard and
its accompanying guidance are applied to accounting changes and
corrections of prior periods’ errors made on or after April 1, 2011.
Note 3. Effect of March 31, 2013 being a bank holiday
Although financial institutions in Japan were closed on March 31, 2013 and notes maturing on March 31, 2013 were settled on the following
business day—April 1, 2013—notes receivable of ¥2,778 million and notes payable of ¥2,315 million were accounted for as if settled on
March 31, 2013.
Note 4. Statements of cash flows
The reconciliations of cash and time deposits in the consolidated balance sheets and cash and cash equivalents in the consolidated state-
ments of cash flows as of March 31, 2013 and 2014 are as follows:
Millions of yenThousands of U.S. dollars
2013 2014 2014
Cash and time deposits in the consolidated balance sheets ¥48,859 ¥ 33,135 $321,949
Time deposits with maturities exceeding 3 months (158) (159) (1,545)
Cash and cash equivalents in the consolidated statements of cash flows ¥48,701 ¥32,976 $320,404
48 Teijin Limited
Note 5. Fair value of financial instruments
(1) Qualitative information on financial instruments
(a) Policies for using financial instrumentsThe Companies’ fund management policy is to put money
into short-term deposits only and to raise money through
loans payable, commercial paper and corporate bonds.
The Companies principally enter into derivative transac-
tions in connection with managing their market risk and not
for speculation or trading purposes.
(b) Details of financial instruments used and the exposure to risk and how it arisesNotes and accounts receivable–trade are exposed to cus-
tomers’ credit risk. To manage that risk, the Companies
check the balance of the accounts and confirm the collec-
tion of money at the due date. The Companies also review
the credit risk of their main customers every six months in
accordance with the Company’s credit management
regulations.
Securities are exposed to market price fluctuation risk;
however, the Companies only hold shares in firms with
which they have business relations and these are not held
for speculation.
The due dates of notes and accounts payable–trade
are mainly within one year.
Short-term loans receivable are used mainly for operating
purposes, and funding through corporate bonds and long-
term loans payable is mainly for capital investment. Debts
with a floating rate are exposed to interest rate fluctuation
risk, but interest on some long-term loans payable is con-
verted to a fixed rate through interest rate swap transactions.
The Companies use derivative transactions of, for
example, forward currency exchange and currency swaps
that are used to hedge the risk of fluctuation in foreign
currency exchange rates with respect to monetary receiv-
ables and payables denominated in foreign currencies
resulting from import and export transactions.
With respect to other derivative transactions, interest
rate swap transactions are used to hedge the risk of fluctu-
ation in interest rates. The Companies evaluate hedge effec-
tiveness by comparing the cumulative changes in cash
flows from, or the changes in fair value of, hedged items
with the corresponding changes in the hedging derivative
instruments.
The Companies report periodically to the Chief Financial
Officer and the Treasury Office on the actual results of deriv-
ative transactions. The actual results of derivative transac-
tions for which hedge accounting cannot be applied are
reported to the Board of Directors after the end of each
year. Furthermore, the Companies enter into contracts
with highly rated international institutions as counterparts
to these transactions to minimize credit risk exposure.
(c) Supplementary information on fair valuesThe fair value of financial instruments is calculated based
on quoted market price or, in cases where there is no mar-
ket price, by making a reasonable estimation. Because the
preconditions applied include a floating element, estima-
tions of fair value may vary. The contracted amounts, as
presented in Note 7, “Derivative transactions,” do not
reflect market risk.
(2) Fair values of financial instruments
The following tables summarize fair value and book value of the
financial instruments, and the difference between them, as of
March 31, 2013 and 2014. Items for which fair value is difficult
to estimate are not included in the following tables.
49Teijin Limited
Millions of yen
2013
Book value Fair value Difference
(1) Cash and time deposits ¥ 48,859 ¥ 48,859 ¥ —
(2) Receivables 169,015 169,015 —
(3) Short-term loans receivable 14,243 14,243 —
(4) Investment securities 38,472 38,472 —
(5) Long-term loans receivable 2,897 — —
Allowance for doubtful accounts* (543) — —
2,354 2,354 —
Total ¥272,943 ¥272,943 ¥ —
(1) Payables ¥ 91,876 ¥ 91,876 ¥ —
(2) Short-term loans payable 67,326 67,326 —
(3) Bonds 46,996 47,741 745
(4) Long-term loans payable 154,638 155,595 957
Total ¥360,836 ¥362,538 ¥1,702
Derivative transactions†
(1) For which hedge accounting is not applied ¥ 3,023 ¥ 3,023 ¥ —
(2) For which hedge accounting is applied 1,638 1,638 —
Total ¥ 4,661 ¥ 4,661 ¥ —
Millions of yen
2014
Book value Fair value Difference
(1) Cash and time deposits ¥ 33,135 ¥ 33,135 ¥ —
(2) Receivables 165,240 165,240 —
(3) Short-term loans receivable 18,600 18,600 —
(4) Investment securities 51,485 51,485 —
(5) Long-term loans receivable 2,104 — —
Allowance for doubtful accounts* (537) — —
1,567 1,567 —
Total ¥270,027 ¥270,027 ¥ —
(1) Payables ¥ 80,003 ¥ 80,003 ¥ —
(2) Short-term loans payable 84,605 84,605 —
(3) Bonds 36,961 37,434 473
(4) Long-term loans payable 158,213 159,445 1,232
Total ¥359,782 ¥361,487 ¥1,705
Derivative transactions†
(1) For which hedge accounting is not applied ¥ 4,395 ¥ 4,395 ¥ —
(2) For which hedge accounting is applied 1,393 1,393 —
Total ¥ 5,788 ¥ 5,788 ¥ —
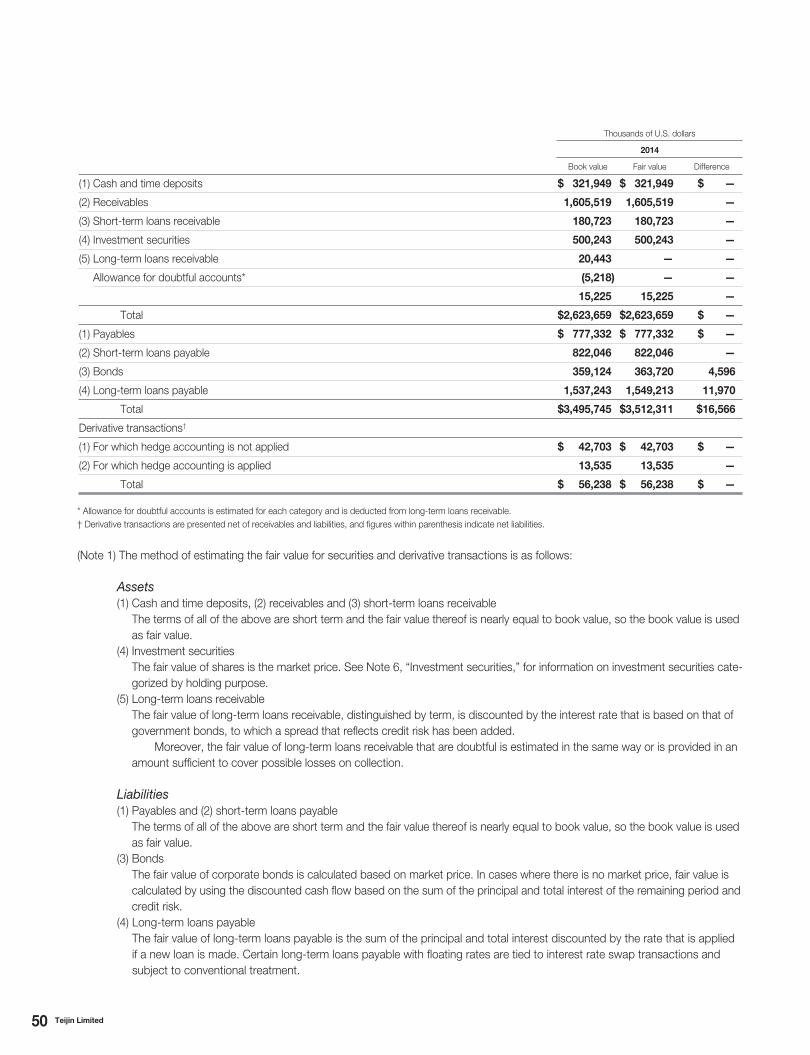
50 Teijin Limited
Thousands of U.S. dollars
2014
Book value Fair value Difference
(1) Cash and time deposits $ 321,949 $ 321,949 $ —
(2) Receivables 1,605,519 1,605,519 —
(3) Short-term loans receivable 180,723 180,723 —
(4) Investment securities 500,243 500,243 —
(5) Long-term loans receivable 20,443 — —
Allowance for doubtful accounts* (5,218) — —
15,225 15,225 —
Total $2,623,659 $2,623,659 $ —
(1) Payables $ 777,332 $ 777,332 $ —
(2) Short-term loans payable 822,046 822,046 —
(3) Bonds 359,124 363,720 4,596
(4) Long-term loans payable 1,537,243 1,549,213 11,970
Total $3,495,745 $3,512,311 $16,566
Derivative transactions†
(1) For which hedge accounting is not applied $ 42,703 $ 42,703 $ —
(2) For which hedge accounting is applied 13,535 13,535 —
Total $ 56,238 $ 56,238 $ —
* Allowance for doubtful accounts is estimated for each category and is deducted from long-term loans receivable.
† Derivative transactions are presented net of receivables and liabilities, and figures within parenthesis indicate net liabilities.
(Note 1) The method of estimating the fair value for securities and derivative transactions is as follows:
Assets(1) Cash and time deposits, (2) receivables and (3) short-term loans receivable
The terms of all of the above are short term and the fair value thereof is nearly equal to book value, so the book value is used
as fair value.
(4) Investment securities
The fair value of shares is the market price. See Note 6, “Investment securities,” for information on investment securities cate-
gorized by holding purpose.
(5) Long-term loans receivable
The fair value of long-term loans receivable, distinguished by term, is discounted by the interest rate that is based on that of
government bonds, to which a spread that reflects credit risk has been added.
Moreover, the fair value of long-term loans receivable that are doubtful is estimated in the same way or is provided in an
amount sufficient to cover possible losses on collection.
Liabilities(1) Payables and (2) short-term loans payable
The terms of all of the above are short term and the fair value thereof is nearly equal to book value, so the book value is used
as fair value.
(3) Bonds
The fair value of corporate bonds is calculated based on market price. In cases where there is no market price, fair value is
calculated by using the discounted cash flow based on the sum of the principal and total interest of the remaining period and
credit risk.
(4) Long-term loans payable
The fair value of long-term loans payable is the sum of the principal and total interest discounted by the rate that is applied
if a new loan is made. Certain long-term loans payable with floating rates are tied to interest rate swap transactions and
subject to conventional treatment.
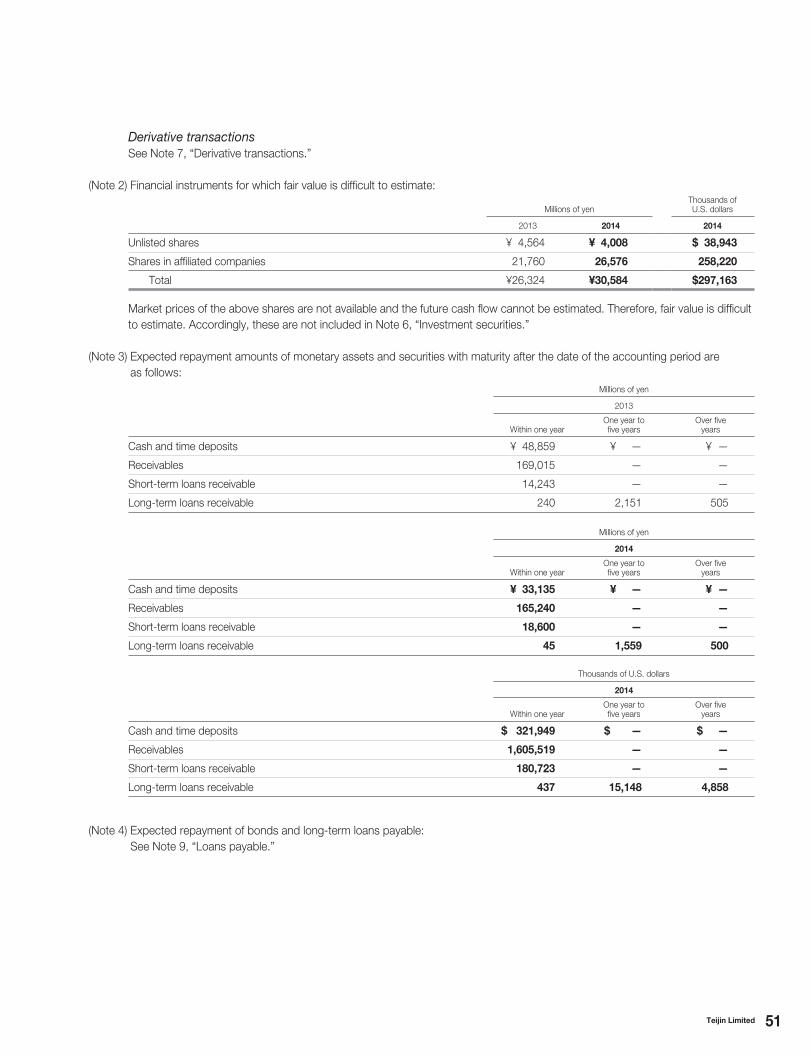
51Teijin Limited
Derivative transactions See Note 7, “Derivative transactions.”
(Note 2) Financial instruments for which fair value is difficult to estimate:
Millions of yenThousands of U.S. dollars
2013 2014 2014
Unlisted shares ¥ 4,564 ¥ 4,008 $ 38,943
Shares in affiliated companies 21,760 26,576 258,220
Total ¥26,324 ¥30,584 $297,163
Market prices of the above shares are not available and the future cash flow cannot be estimated. Therefore, fair value is difficult
to estimate. Accordingly, these are not included in Note 6, “Investment securities.”
(Note 3) Expected repayment amounts of monetary assets and securities with maturity after the date of the accounting period are
as follows:
Millions of yen
2013
Within one yearOne year to five years
Over five years
Cash and time deposits ¥ 48,859 ¥ — ¥ —
Receivables 169,015 — —
Short-term loans receivable 14,243 — —
Long-term loans receivable 240 2,151 505
Millions of yen
2014
Within one yearOne year to five years
Over five years
Cash and time deposits ¥ 33,135 ¥ — ¥ —
Receivables 165,240 — —
Short-term loans receivable 18,600 — —
Long-term loans receivable 45 1,559 500
Thousands of U.S. dollars
2014
Within one yearOne year to five years
Over five years
Cash and time deposits $ 321,949 $ — $ —
Receivables 1,605,519 — —
Short-term loans receivable 180,723 — —
Long-term loans receivable 437 15,148 4,858
(Note 4) Expected repayment of bonds and long-term loans payable:
See Note 9, “Loans payable.”
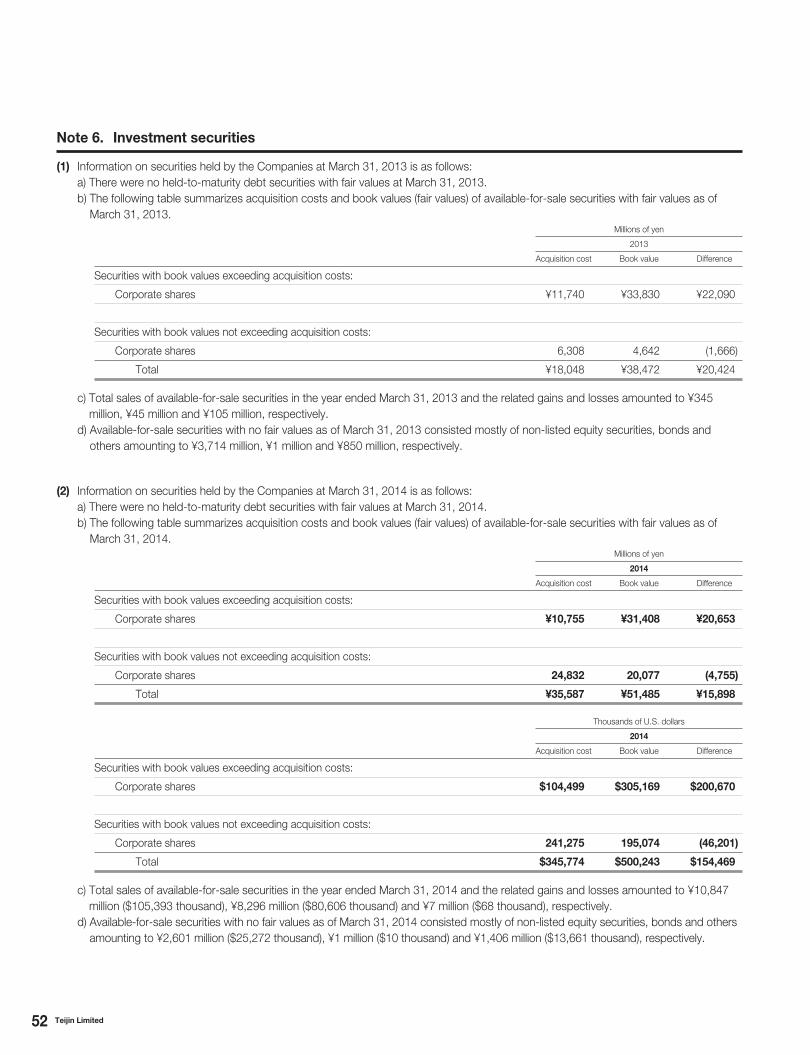
52 Teijin Limited
(2) Information on securities held by the Companies at March 31, 2014 is as follows:
a) There were no held-to-maturity debt securities with fair values at March 31, 2014.
b) The following table summarizes acquisition costs and book values (fair values) of available-for-sale securities with fair values as of
March 31, 2014.Millions of yen
2014
Acquisition cost Book value Difference
Securities with book values exceeding acquisition costs:
Corporate shares ¥10,755 ¥31,408 ¥20,653
Securities with book values not exceeding acquisition costs:
Corporate shares 24,832 20,077 (4,755)
Total ¥35,587 ¥51,485 ¥15,898
Thousands of U.S. dollars
2014
Acquisition cost Book value Difference
Securities with book values exceeding acquisition costs:
Corporate shares $104,499 $305,169 $200,670
Securities with book values not exceeding acquisition costs:
Corporate shares 241,275 195,074 (46,201)
Total $345,774 $500,243 $154,469
c) Total sales of available-for-sale securities in the year ended March 31, 2014 and the related gains and losses amounted to ¥10,847
million ($105,393 thousand), ¥8,296 million ($80,606 thousand) and ¥7 million ($68 thousand), respectively.
d) Available-for-sale securities with no fair values as of March 31, 2014 consisted mostly of non-listed equity securities, bonds and others
amounting to ¥2,601 million ($25,272 thousand), ¥1 million ($10 thousand) and ¥1,406 million ($13,661 thousand), respectively.
Note 6. Investment securities
(1) Information on securities held by the Companies at March 31, 2013 is as follows:
a) There were no held-to-maturity debt securities with fair values at March 31, 2013.
b) The following table summarizes acquisition costs and book values (fair values) of available-for-sale securities with fair values as of
March 31, 2013.Millions of yen
2013
Acquisition cost Book value Difference
Securities with book values exceeding acquisition costs:
Corporate shares ¥11,740 ¥33,830 ¥22,090
Securities with book values not exceeding acquisition costs:
Corporate shares 6,308 4,642 (1,666)
Total ¥18,048 ¥38,472 ¥20,424
c) Total sales of available-for-sale securities in the year ended March 31, 2013 and the related gains and losses amounted to ¥345
million, ¥45 million and ¥105 million, respectively.
d) Available-for-sale securities with no fair values as of March 31, 2013 consisted mostly of non-listed equity securities, bonds and
others amounting to ¥3,714 million, ¥1 million and ¥850 million, respectively.
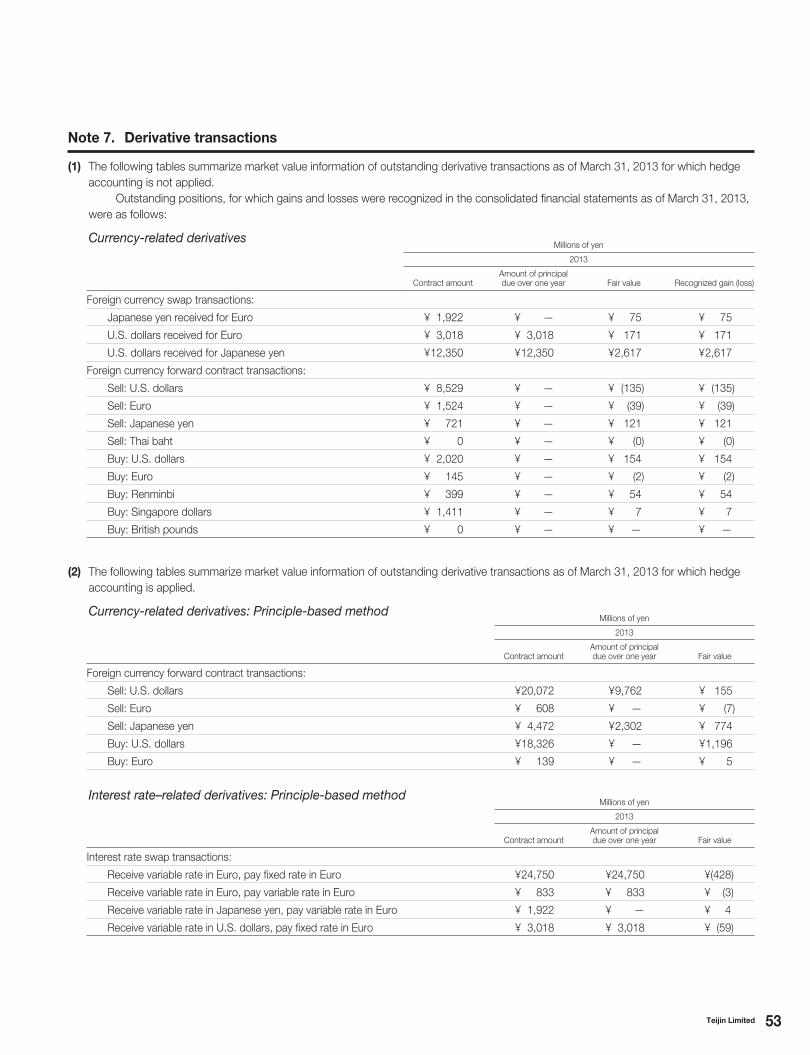
53Teijin Limited
(1) The following tables summarize market value information of outstanding derivative transactions as of March 31, 2013 for which hedge
accounting is not applied.
Outstanding positions, for which gains and losses were recognized in the consolidated financial statements as of March 31, 2013,
were as follows:
Currency-related derivativesMillions of yen
2013
Contract amountAmount of principal due over one year Fair value Recognized gain (loss)
Foreign currency swap transactions:
Japanese yen received for Euro ¥ 1,922 ¥ — ¥ 75 ¥ 75
U.S. dollars received for Euro ¥ 3,018 ¥ 3,018 ¥ 171 ¥ 171
U.S. dollars received for Japanese yen ¥ 12,350 ¥ 12,350 ¥ 2,617 ¥ 2,617
Foreign currency forward contract transactions:
Sell: U.S. dollars ¥ 8,529 ¥ — ¥ (135) ¥ (135)
Sell: Euro ¥ 1,524 ¥ — ¥ (39) ¥ (39)
Sell: Japanese yen ¥ 721 ¥ — ¥ 121 ¥ 121
Sell: Thai baht ¥ 0 ¥ — ¥ (0) ¥ (0)
Buy: U.S. dollars ¥ 2,020 ¥ — ¥ 154 ¥ 154
Buy: Euro ¥ 145 ¥ — ¥ (2) ¥ (2)
Buy: Renminbi ¥ 399 ¥ — ¥ 54 ¥ 54
Buy: Singapore dollars ¥ 1,411 ¥ — ¥ 7 ¥ 7
Buy: British pounds ¥ 0 ¥ — ¥ — ¥ —
(2) The following tables summarize market value information of outstanding derivative transactions as of March 31, 2013 for which hedge
accounting is applied.
Currency-related derivatives: Principle-based methodMillions of yen
2013
Contract amountAmount of principal due over one year Fair value
Foreign currency forward contract transactions:
Sell: U.S. dollars ¥ 20,072 ¥ 9,762 ¥ 155
Sell: Euro ¥ 608 ¥ — ¥ (7)
Sell: Japanese yen ¥ 4,472 ¥ 2,302 ¥ 774
Buy: U.S. dollars ¥ 18,326 ¥ — ¥ 1,196
Buy: Euro ¥ 139 ¥ — ¥ 5
Interest rate–related derivatives: Principle-based methodMillions of yen
2013
Contract amountAmount of principal due over one year Fair value
Interest rate swap transactions:
Receive variable rate in Euro, pay fixed rate in Euro ¥ 24,750 ¥ 24,750 ¥ (428)
Receive variable rate in Euro, pay variable rate in Euro ¥ 833 ¥ 833 ¥ (3)
Receive variable rate in Japanese yen, pay variable rate in Euro ¥ 1,922 ¥ — ¥ 4
Receive variable rate in U.S. dollars, pay fixed rate in Euro ¥ 3,018 ¥ 3,018 ¥ (59)
Note 7. Derivative transactions
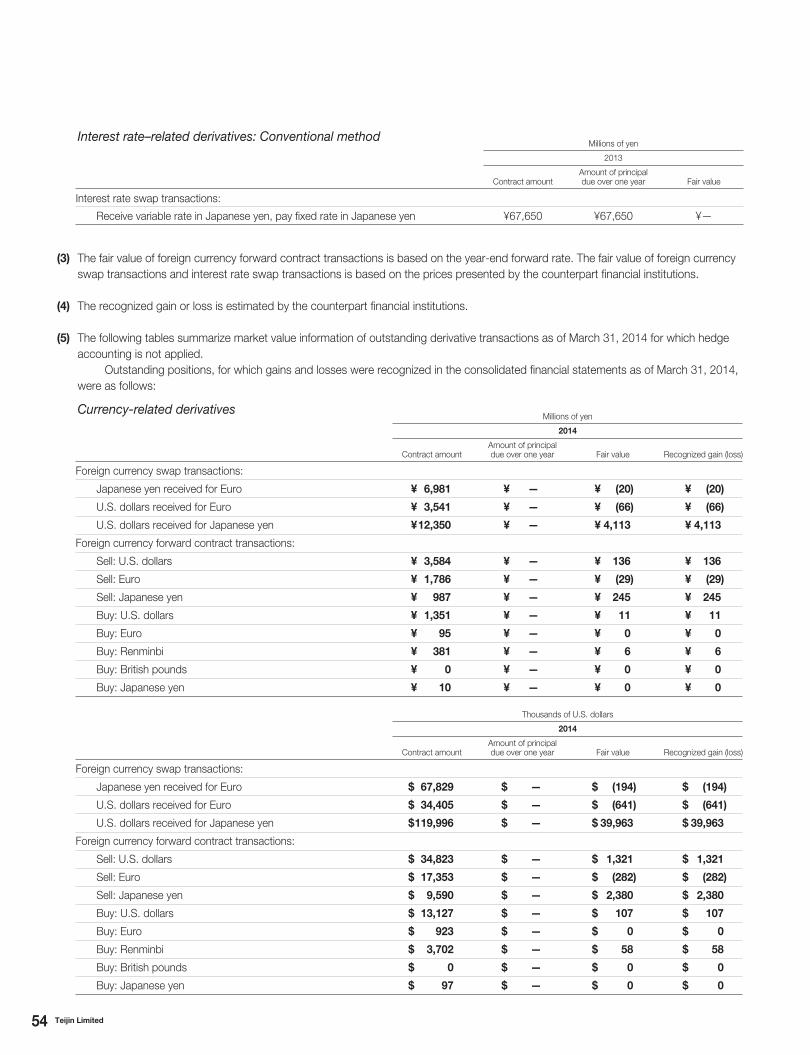
54 Teijin Limited
Interest rate–related derivatives: Conventional methodMillions of yen
2013
Contract amountAmount of principal due over one year Fair value
Interest rate swap transactions:
Receive variable rate in Japanese yen, pay fixed rate in Japanese yen ¥67,650 ¥67,650 ¥—
(3) The fair value of foreign currency forward contract transactions is based on the year-end forward rate. The fair value of foreign currency
swap transactions and interest rate swap transactions is based on the prices presented by the counterpart financial institutions.
(4) The recognized gain or loss is estimated by the counterpart financial institutions.
(5) The following tables summarize market value information of outstanding derivative transactions as of March 31, 2014 for which hedge
accounting is not applied.
Outstanding positions, for which gains and losses were recognized in the consolidated financial statements as of March 31, 2014,
were as follows:
Currency-related derivativesMillions of yen
2014
Contract amountAmount of principal due over one year Fair value Recognized gain (loss)
Foreign currency swap transactions:
Japanese yen received for Euro ¥ 6,981 ¥ — ¥ (20) ¥ (20)
U.S. dollars received for Euro ¥ 3,541 ¥ — ¥ (66) ¥ (66)
U.S. dollars received for Japanese yen ¥ 12,350 ¥ — ¥ 4,113 ¥ 4,113
Foreign currency forward contract transactions:
Sell: U.S. dollars ¥ 3,584 ¥ — ¥ 136 ¥ 136
Sell: Euro ¥ 1,786 ¥ — ¥ (29) ¥ (29)
Sell: Japanese yen ¥ 987 ¥ — ¥ 245 ¥ 245
Buy: U.S. dollars ¥ 1,351 ¥ — ¥ 11 ¥ 11
Buy: Euro ¥ 95 ¥ — ¥ 0 ¥ 0
Buy: Renminbi ¥ 381 ¥ — ¥ 6 ¥ 6
Buy: British pounds ¥ 0 ¥ — ¥ 0 ¥ 0
Buy: Japanese yen ¥ 10 ¥ — ¥ 0 ¥ 0
Thousands of U.S. dollars
2014
Contract amountAmount of principal due over one year Fair value Recognized gain (loss)
Foreign currency swap transactions:
Japanese yen received for Euro $ 67,829 $ — $ (194) $ (194)
U.S. dollars received for Euro $ 34,405 $ — $ (641) $ (641)
U.S. dollars received for Japanese yen $ 119,996 $ — $ 39,963 $ 39,963
Foreign currency forward contract transactions:
Sell: U.S. dollars $ 34,823 $ — $ 1,321 $ 1,321
Sell: Euro $ 17,353 $ — $ (282) $ (282)
Sell: Japanese yen $ 9,590 $ — $ 2,380 $ 2,380
Buy: U.S. dollars $ 13,127 $ — $ 107 $ 107
Buy: Euro $ 923 $ — $ 0 $ 0
Buy: Renminbi $ 3,702 $ — $ 58 $ 58
Buy: British pounds $ 0 $ — $ 0 $ 0
Buy: Japanese yen $ 97 $ — $ 0 $ 0
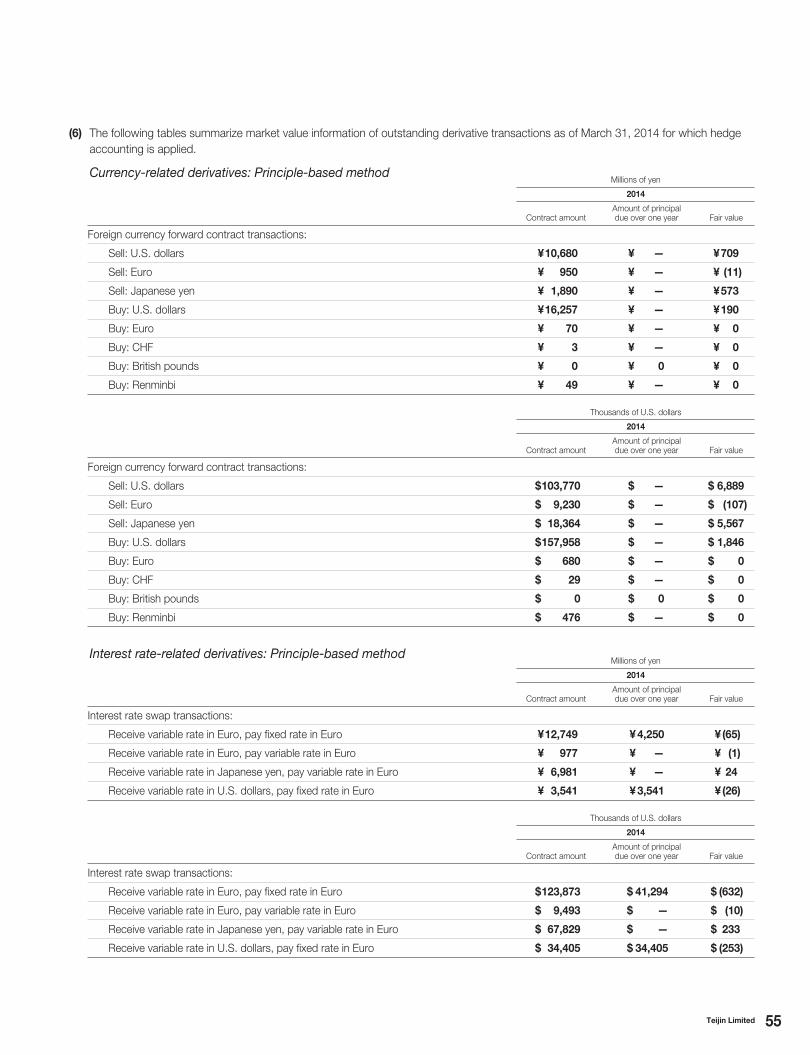
55Teijin Limited
(6) The following tables summarize market value information of outstanding derivative transactions as of March 31, 2014 for which hedge
accounting is applied.
Currency-related derivatives: Principle-based methodMillions of yen
2014
Contract amountAmount of principal due over one year Fair value
Foreign currency forward contract transactions:
Sell: U.S. dollars ¥ 10,680 ¥ — ¥ 709
Sell: Euro ¥ 950 ¥ — ¥ (11)
Sell: Japanese yen ¥ 1,890 ¥ — ¥ 573
Buy: U.S. dollars ¥ 16,257 ¥ — ¥ 190
Buy: Euro ¥ 70 ¥ — ¥ 0
Buy: CHF ¥ 3 ¥ — ¥ 0
Buy: British pounds ¥ 0 ¥ 0 ¥ 0
Buy: Renminbi ¥ 49 ¥ — ¥ 0
Thousands of U.S. dollars
2014
Contract amountAmount of principal due over one year Fair value
Foreign currency forward contract transactions:
Sell: U.S. dollars $ 103,770 $ — $ 6,889
Sell: Euro $ 9,230 $ — $ (107)
Sell: Japanese yen $ 18,364 $ — $ 5,567
Buy: U.S. dollars $ 157,958 $ — $ 1,846
Buy: Euro $ 680 $ — $ 0
Buy: CHF $ 29 $ — $ 0
Buy: British pounds $ 0 $ 0 $ 0
Buy: Renminbi $ 476 $ — $ 0
Interest rate-related derivatives: Principle-based methodMillions of yen
2014
Contract amountAmount of principal due over one year Fair value
Interest rate swap transactions:
Receive variable rate in Euro, pay fixed rate in Euro ¥ 12,749 ¥ 4,250 ¥ (65)
Receive variable rate in Euro, pay variable rate in Euro ¥ 977 ¥ — ¥ (1)
Receive variable rate in Japanese yen, pay variable rate in Euro ¥ 6,981 ¥ — ¥ 24
Receive variable rate in U.S. dollars, pay fixed rate in Euro ¥ 3,541 ¥ 3,541 ¥ (26)
Thousands of U.S. dollars
2014
Contract amountAmount of principal due over one year Fair value
Interest rate swap transactions:
Receive variable rate in Euro, pay fixed rate in Euro $ 123,873 $ 41,294 $ (632)
Receive variable rate in Euro, pay variable rate in Euro $ 9,493 $ — $ (10)
Receive variable rate in Japanese yen, pay variable rate in Euro $ 67,829 $ — $ 233
Receive variable rate in U.S. dollars, pay fixed rate in Euro $ 34,405 $ 34,405 $ (253)
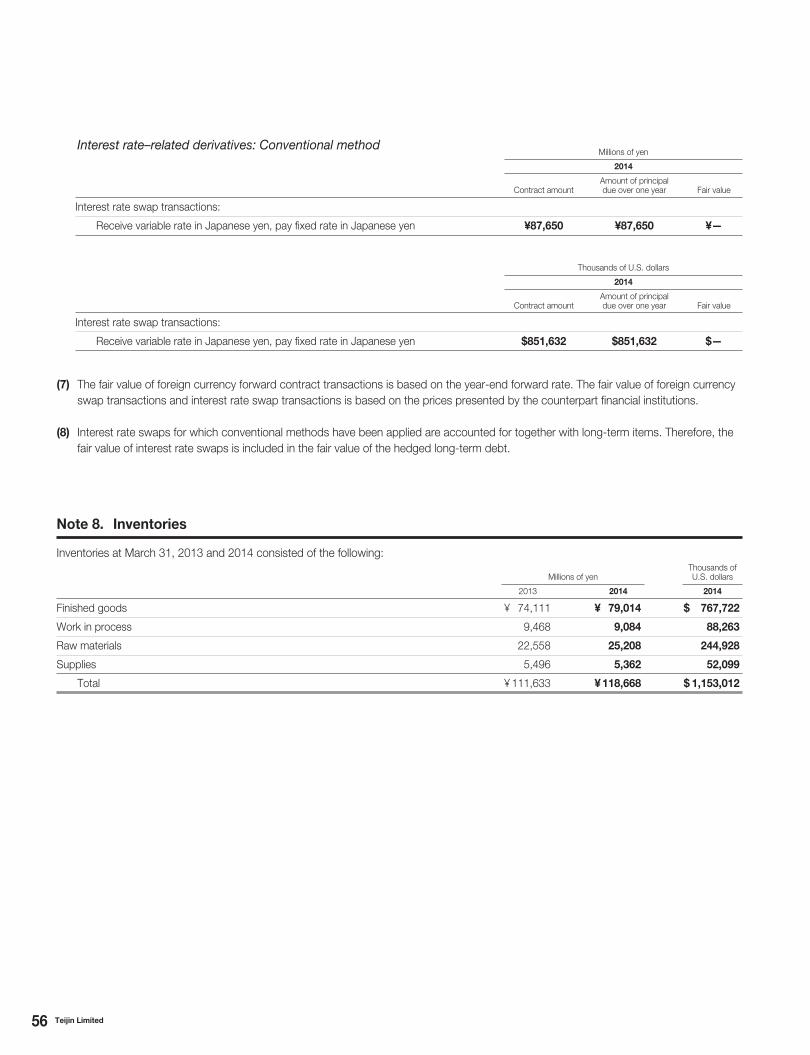
56 Teijin Limited
Interest rate–related derivatives: Conventional methodMillions of yen
2014
Contract amountAmount of principal due over one year Fair value
Interest rate swap transactions:
Receive variable rate in Japanese yen, pay fixed rate in Japanese yen ¥87,650 ¥87,650 ¥—
Thousands of U.S. dollars
2014
Contract amountAmount of principal due over one year Fair value
Interest rate swap transactions:
Receive variable rate in Japanese yen, pay fixed rate in Japanese yen $851,632 $851,632 $—
(7) The fair value of foreign currency forward contract transactions is based on the year-end forward rate. The fair value of foreign currency
swap transactions and interest rate swap transactions is based on the prices presented by the counterpart financial institutions.
(8) Interest rate swaps for which conventional methods have been applied are accounted for together with long-term items. Therefore, the
fair value of interest rate swaps is included in the fair value of the hedged long-term debt.
Inventories at March 31, 2013 and 2014 consisted of the following:
Millions of yenThousands of U.S. dollars
2013 2014 2014
Finished goods ¥ 74,111 ¥ 79,014 $ 767,722
Work in process 9,468 9,084 88,263
Raw materials 22,558 25,208 244,928
Supplies 5,496 5,362 52,099
Total ¥ 111,633 ¥ 118,668 $ 1,153,012
Note 8. Inventories
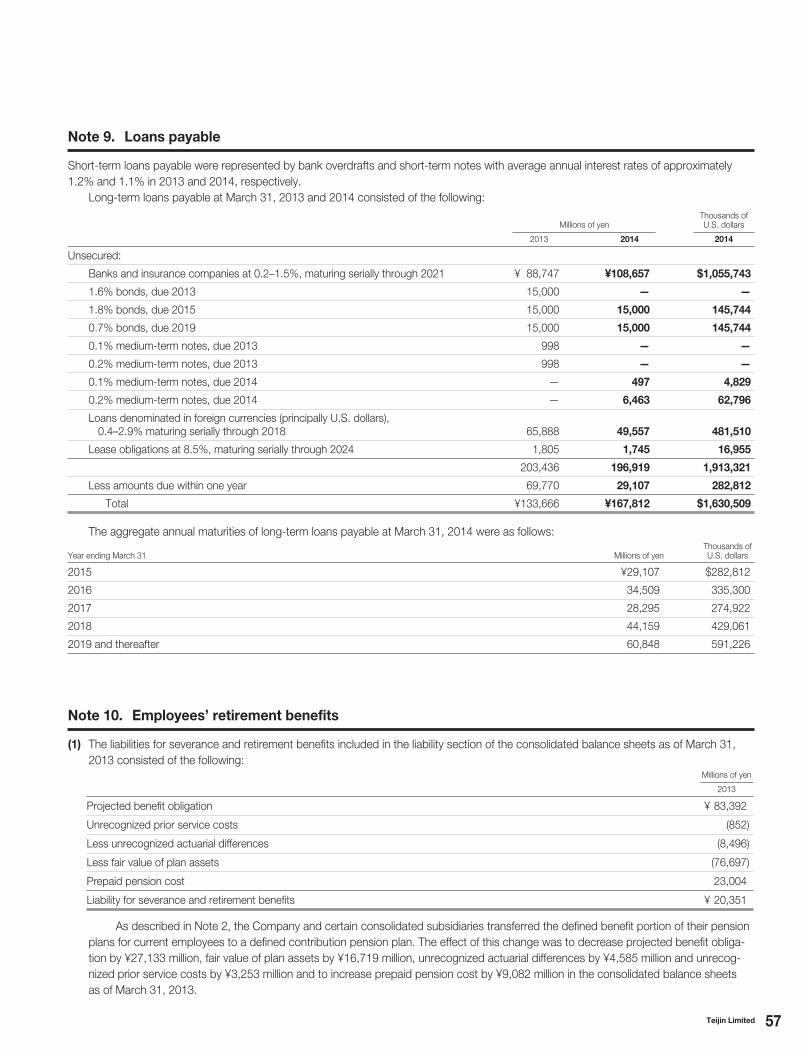
57Teijin Limited
Millions of yenThousands of U.S. dollars
2013 2014 2014
Unsecured:
Banks and insurance companies at 0.2–1.5%, maturing serially through 2021 ¥ 88,747 ¥108,657 $1,055,743
1.6% bonds, due 2013 15,000 — —
1.8% bonds, due 2015 15,000 15,000 145,744
0.7% bonds, due 2019 15,000 15,000 145,744
0.1% medium-term notes, due 2013 998 — —
0.2% medium-term notes, due 2013 998 — —
0.1% medium-term notes, due 2014 — 497 4,829
0.2% medium-term notes, due 2014 — 6,463 62,796
Loans denominated in foreign currencies (principally U.S. dollars), 0.4–2.9% maturing serially through 2018 65,888 49,557 481,510
Lease obligations at 8.5%, maturing serially through 2024 1,805 1,745 16,955
203,436 196,919 1,913,321
Less amounts due within one year 69,770 29,107 282,812
Total ¥133,666 ¥167,812 $1,630,509
The aggregate annual maturities of long-term loans payable at March 31, 2014 were as follows:
Year ending March 31 Millions of yenThousands of U.S. dollars
2015 ¥29,107 $282,812
2016 34,509 335,300
2017 28,295 274,922
2018 44,159 429,061
2019 and thereafter 60,848 591,226
Short-term loans payable were represented by bank overdrafts and short-term notes with average annual interest rates of approximately
1.2% and 1.1% in 2013 and 2014, respectively.
Long-term loans payable at March 31, 2013 and 2014 consisted of the following:
Note 9. Loans payable
(1) The liabilities for severance and retirement benefits included in the liability section of the consolidated balance sheets as of March 31,
2013 consisted of the following:Millions of yen
2013
Projected benefit obligation ¥ 83,392
Unrecognized prior service costs (852)
Less unrecognized actuarial differences (8,496)
Less fair value of plan assets (76,697)
Prepaid pension cost 23,004
Liability for severance and retirement benefits ¥ 20,351
As described in Note 2, the Company and certain consolidated subsidiaries transferred the defined benefit portion of their pension
plans for current employees to a defined contribution pension plan. The effect of this change was to decrease projected benefit obliga-
tion by ¥27,133 million, fair value of plan assets by ¥16,719 million, unrecognized actuarial differences by ¥4,585 million and unrecog-
nized prior service costs by ¥3,253 million and to increase prepaid pension cost by ¥9,082 million in the consolidated balance sheets
as of March 31, 2013.
Note 10. Employees’ retirement benefits
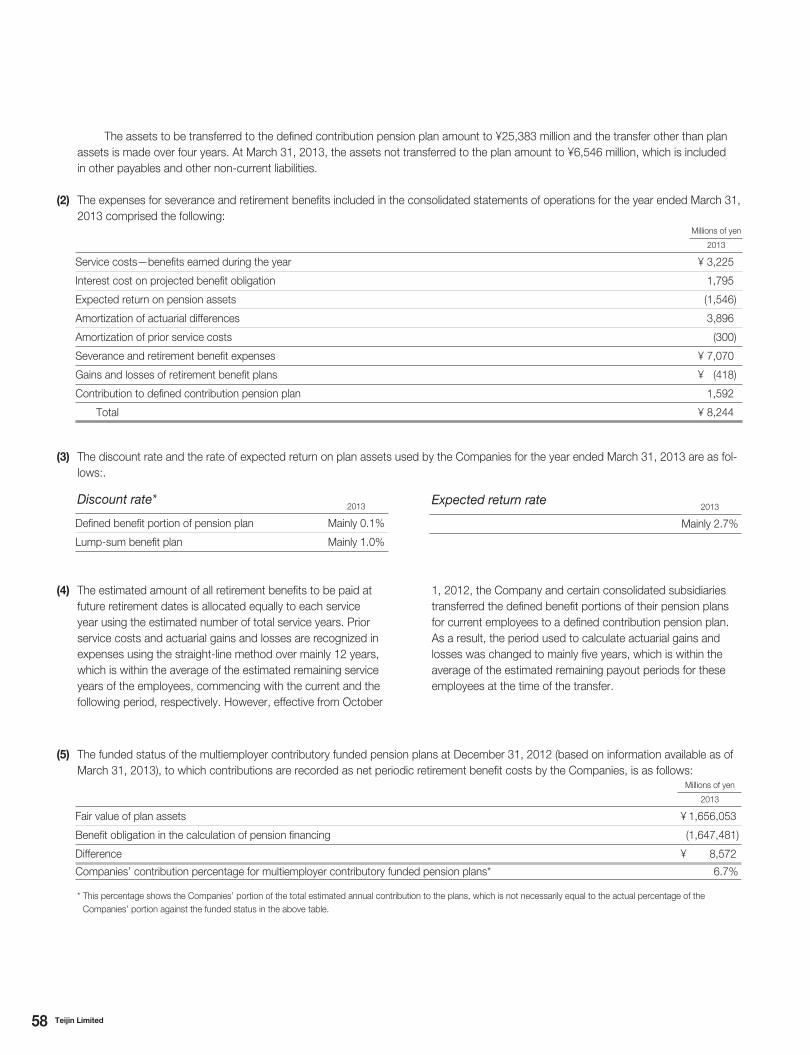
58 Teijin Limited
Discount rate*2013
Defined benefit portion of pension plan Mainly 0.1%
Lump-sum benefit plan Mainly 1.0%
(4) The estimated amount of all retirement benefits to be paid at
future retirement dates is allocated equally to each service
year using the estimated number of total service years. Prior
service costs and actuarial gains and losses are recognized in
expenses using the straight-line method over mainly 12 years,
which is within the average of the estimated remaining service
years of the employees, commencing with the current and the
following period, respectively. However, effective from October
(5) The funded status of the multiemployer contributory funded pension plans at December 31, 2012 (based on information available as of
March 31, 2013), to which contributions are recorded as net periodic retirement benefit costs by the Companies, is as follows:Millions of yen
2013
Fair value of plan assets ¥ 1,656,053
Benefit obligation in the calculation of pension financing (1,647,481)
Difference ¥ 8,572
Companies’ contribution percentage for multiemployer contributory funded pension plans* 6.7%
* This percentage shows the Companies’ portion of the total estimated annual contribution to the plans, which is not necessarily equal to the actual percentage of the
Companies’ portion against the funded status in the above table.
Expected return rate2013
Mainly 2.7%
1, 2012, the Company and certain consolidated subsidiaries
transferred the defined benefit portions of their pension plans
for current employees to a defined contribution pension plan.
As a result, the period used to calculate actuarial gains and
losses was changed to mainly five years, which is within the
average of the estimated remaining payout periods for these
employees at the time of the transfer.
The assets to be transferred to the defined contribution pension plan amount to ¥25,383 million and the transfer other than plan
assets is made over four years. At March 31, 2013, the assets not transferred to the plan amount to ¥6,546 million, which is included
in other payables and other non-current liabilities.
(2) The expenses for severance and retirement benefits included in the consolidated statements of operations for the year ended March 31,
2013 comprised the following:Millions of yen
2013
Service costs—benefits earned during the year ¥ 3,225
Interest cost on projected benefit obligation 1,795
Expected return on pension assets (1,546)
Amortization of actuarial differences 3,896
Amortization of prior service costs (300)
Severance and retirement benefit expenses ¥ 7,070
Gains and losses of retirement benefit plans ¥ (418)
Contribution to defined contribution pension plan 1,592
Total ¥ 8,244
(3) The discount rate and the rate of expected return on plan assets used by the Companies for the year ended March 31, 2013 are as fol-
lows:.
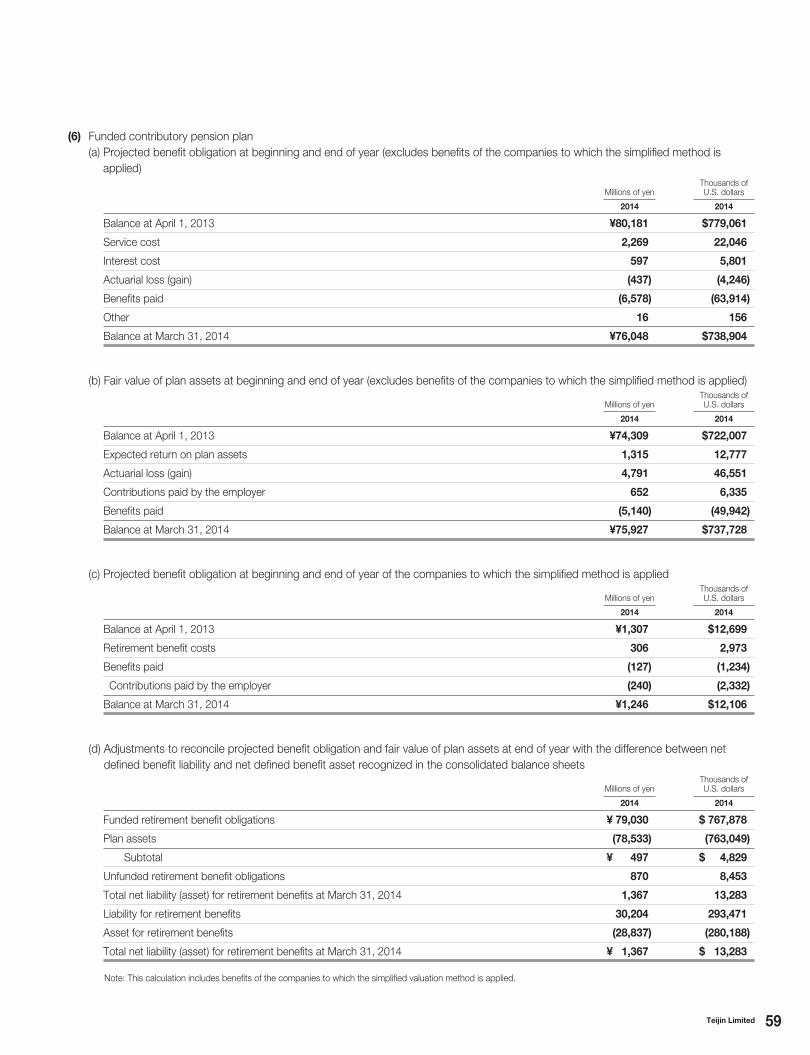
59Teijin Limited
(6) Funded contributory pension plan
(a) Projected benefit obligation at beginning and end of year (excludes benefits of the companies to which the simplified method is
applied)
Millions of yenThousands of U.S. dollars
2014 2014
Balance at April 1, 2013 ¥80,181 $779,061
Service cost 2,269 22,046
Interest cost 597 5,801
Actuarial loss (gain) (437) (4,246)
Benefits paid (6,578) (63,914)
Other 16 156
Balance at March 31, 2014 ¥76,048 $738,904
(b) Fair value of plan assets at beginning and end of year (excludes benefits of the companies to which the simplified method is applied)
Millions of yenThousands of U.S. dollars
2014 2014
Balance at April 1, 2013 ¥74,309 $722,007
Expected return on plan assets 1,315 12,777
Actuarial loss (gain) 4,791 46,551
Contributions paid by the employer 652 6,335
Benefits paid (5,140) (49,942)
Balance at March 31, 2014 ¥75,927 $737,728
(c) Projected benefit obligation at beginning and end of year of the companies to which the simplified method is applied
Millions of yenThousands of U.S. dollars
2014 2014
Balance at April 1, 2013 ¥1,307 $12,699
Retirement benefit costs 306 2,973
Benefits paid (127) (1,234)
Contributions paid by the employer (240) (2,332)
Balance at March 31, 2014 ¥1,246 $12,106
(d) Adjustments to reconcile projected benefit obligation and fair value of plan assets at end of year with the difference between net
defined benefit liability and net defined benefit asset recognized in the consolidated balance sheets
Millions of yenThousands of U.S. dollars
2014 2014
Funded retirement benefit obligations ¥ 79,030 $ 767,878
Plan assets (78,533) (763,049)
Subtotal ¥ 497 $ 4,829
Unfunded retirement benefit obligations 870 8,453
Total net liability (asset) for retirement benefits at March 31, 2014 1,367 13,283
Liability for retirement benefits 30,204 293,471
Asset for retirement benefits (28,837) (280,188)
Total net liability (asset) for retirement benefits at March 31, 2014 ¥ 1,367 $ 13,283
Note: This calculation includes benefits of the companies to which the simplified valuation method is applied.
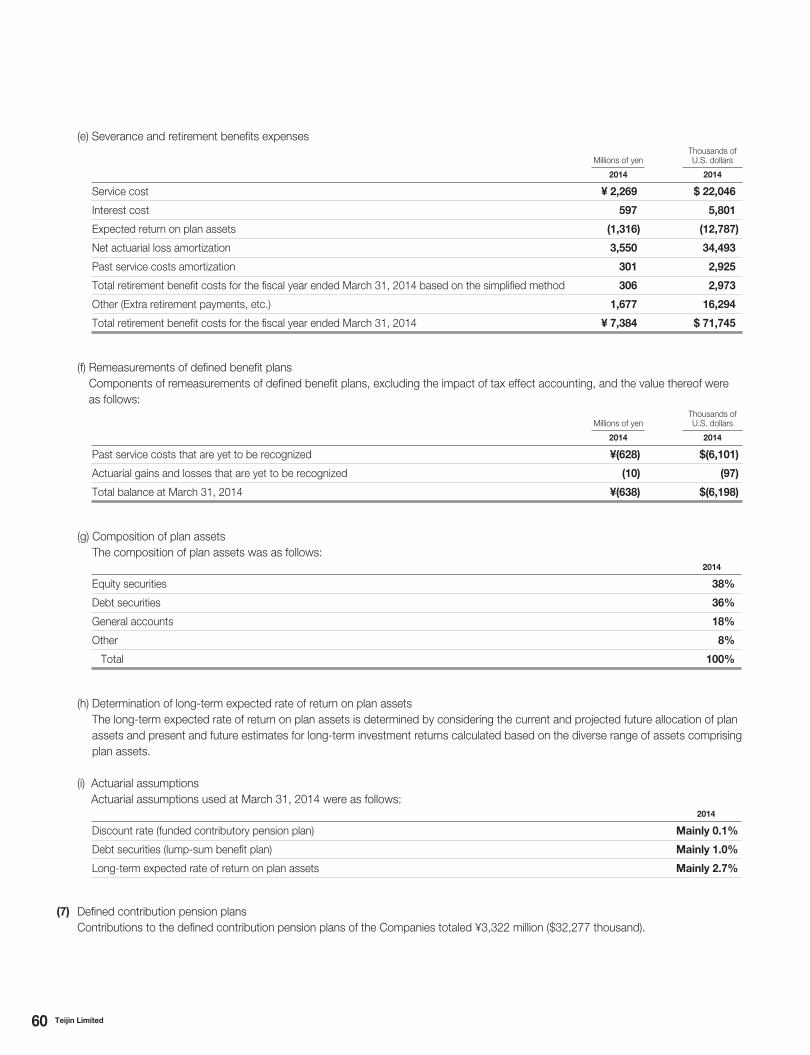
60 Teijin Limited
(e) Severance and retirement benefits expenses
Millions of yenThousands of U.S. dollars
2014 2014
Service cost ¥ 2,269 $ 22,046
Interest cost 597 5,801
Expected return on plan assets (1,316) (12,787)
Net actuarial loss amortization 3,550 34,493
Past service costs amortization 301 2,925
Total retirement benefit costs for the fiscal year ended March 31, 2014 based on the simplified method 306 2,973
Other (Extra retirement payments, etc.) 1,677 16,294
Total retirement benefit costs for the fiscal year ended March 31, 2014 ¥ 7,384 $ 71,745
(f) Remeasurements of defined benefit plans
Components of remeasurements of defined benefit plans, excluding the impact of tax effect accounting, and the value thereof were
as follows:
Millions of yenThousands of U.S. dollars
2014 2014
Past service costs that are yet to be recognized ¥(628) $(6,101)
Actuarial gains and losses that are yet to be recognized (10) (97)
Total balance at March 31, 2014 ¥(638) $(6,198)
(g) Composition of plan assets
The composition of plan assets was as follows:2014
Equity securities 38%
Debt securities 36%
General accounts 18%
Other 8%
Total 100%
(h) Determination of long-term expected rate of return on plan assets
The long-term expected rate of return on plan assets is determined by considering the current and projected future allocation of plan
assets and present and future estimates for long-term investment returns calculated based on the diverse range of assets comprising
plan assets.
(i) Actuarial assumptions
Actuarial assumptions used at March 31, 2014 were as follows: 2014
Discount rate (funded contributory pension plan) Mainly 0.1%
Debt securities (lump-sum benefit plan) Mainly 1.0%
Long-term expected rate of return on plan assets Mainly 2.7%
(7) Defined contribution pension plans
Contributions to the defined contribution pension plans of the Companies totaled ¥3,322 million ($32,277 thousand).
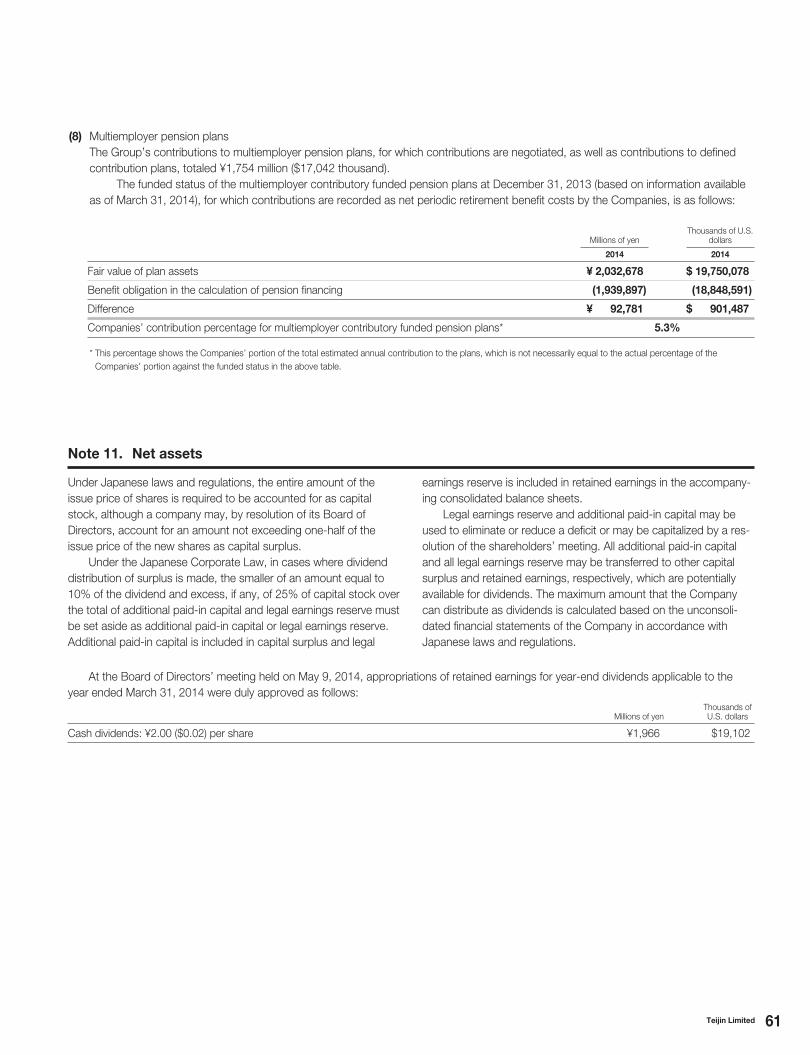
61Teijin Limited
earnings reserve is included in retained earnings in the accompany-
ing consolidated balance sheets.
Legal earnings reserve and additional paid-in capital may be
used to eliminate or reduce a deficit or may be capitalized by a res-
olution of the shareholders’ meeting. All additional paid-in capital
and all legal earnings reserve may be transferred to other capital
surplus and retained earnings, respectively, which are potentially
available for dividends. The maximum amount that the Company
can distribute as dividends is calculated based on the unconsoli-
dated financial statements of the Company in accordance with
Japanese laws and regulations.
Under Japanese laws and regulations, the entire amount of the
issue price of shares is required to be accounted for as capital
stock, although a company may, by resolution of its Board of
Directors, account for an amount not exceeding one-half of the
issue price of the new shares as capital surplus.
Under the Japanese Corporate Law, in cases where dividend
distribution of surplus is made, the smaller of an amount equal to
10% of the dividend and excess, if any, of 25% of capital stock over
the total of additional paid-in capital and legal earnings reserve must
be set aside as additional paid-in capital or legal earnings reserve.
Additional paid-in capital is included in capital surplus and legal
At the Board of Directors’ meeting held on May 9, 2014, appropriations of retained earnings for year-end dividends applicable to the
year ended March 31, 2014 were duly approved as follows:
Millions of yenThousands of U.S. dollars
Cash dividends: ¥2.00 ($0.02) per share ¥1,966 $19,102
Note 11. Net assets
(8) Multiemployer pension plans
The Group’s contributions to multiemployer pension plans, for which contributions are negotiated, as well as contributions to defined
contribution plans, totaled ¥1,754 million ($17,042 thousand).
The funded status of the multiemployer contributory funded pension plans at December 31, 2013 (based on information available
as of March 31, 2014), for which contributions are recorded as net periodic retirement benefit costs by the Companies, is as follows:
Millions of yenThousands of U.S.
dollars
2014 2014
Fair value of plan assets ¥ 2,032,678 $ 19,750,078
Benefit obligation in the calculation of pension financing (1,939,897) (18,848,591)
Difference ¥ 92,781 $ 901,487
Companies’ contribution percentage for multiemployer contributory funded pension plans* 5.3%
* This percentage shows the Companies’ portion of the total estimated annual contribution to the plans, which is not necessarily equal to the actual percentage of the
Companies’ portion against the funded status in the above table.
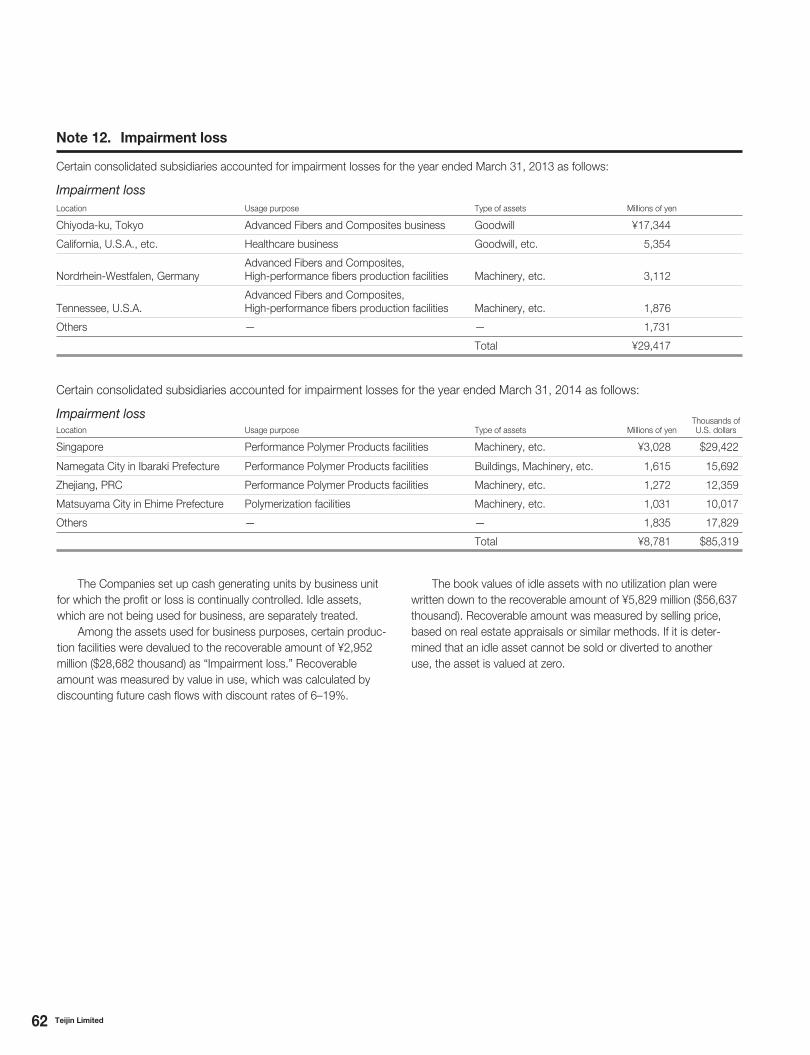
62 Teijin Limited
Certain consolidated subsidiaries accounted for impairment losses for the year ended March 31, 2013 as follows:
Impairment lossLocation Usage purpose Type of assets Millions of yen
Chiyoda-ku, Tokyo Advanced Fibers and Composites business Goodwill ¥17,344
California, U.S.A., etc. Healthcare business Goodwill, etc. 5,354
Nordrhein-Westfalen, GermanyAdvanced Fibers and Composites, High-performance fibers production facilities Machinery, etc. 3,112
Tennessee, U.S.A.Advanced Fibers and Composites, High-performance fibers production facilities Machinery, etc. 1,876
Others — — 1,731
Total ¥29,417
Certain consolidated subsidiaries accounted for impairment losses for the year ended March 31, 2014 as follows:
Impairment lossLocation Usage purpose Type of assets Millions of yen
Thousands of U.S. dollars
Singapore Performance Polymer Products facilities Machinery, etc. ¥3,028 $29,422
Namegata City in Ibaraki Prefecture Performance Polymer Products facilities Buildings, Machinery, etc. 1,615 15,692
Zhejiang, PRC Performance Polymer Products facilities Machinery, etc. 1,272 12,359
Matsuyama City in Ehime Prefecture Polymerization facilities Machinery, etc. 1,031 10,017
Others — — 1,835 17,829
Total ¥8,781 $85,319
Note 12. Impairment loss
The Companies set up cash generating units by business unit
for which the profit or loss is continually controlled. Idle assets,
which are not being used for business, are separately treated.
Among the assets used for business purposes, certain produc-
tion facilities were devalued to the recoverable amount of ¥2,952
million ($28,682 thousand) as “Impairment loss.” Recoverable
amount was measured by value in use, which was calculated by
discounting future cash flows with discount rates of 6–19%.
The book values of idle assets with no utilization plan were
written down to the recoverable amount of ¥5,829 million ($56,637
thousand). Recoverable amount was measured by selling price,
based on real estate appraisals or similar methods. If it is deter-
mined that an idle asset cannot be sold or diverted to another
use, the asset is valued at zero.
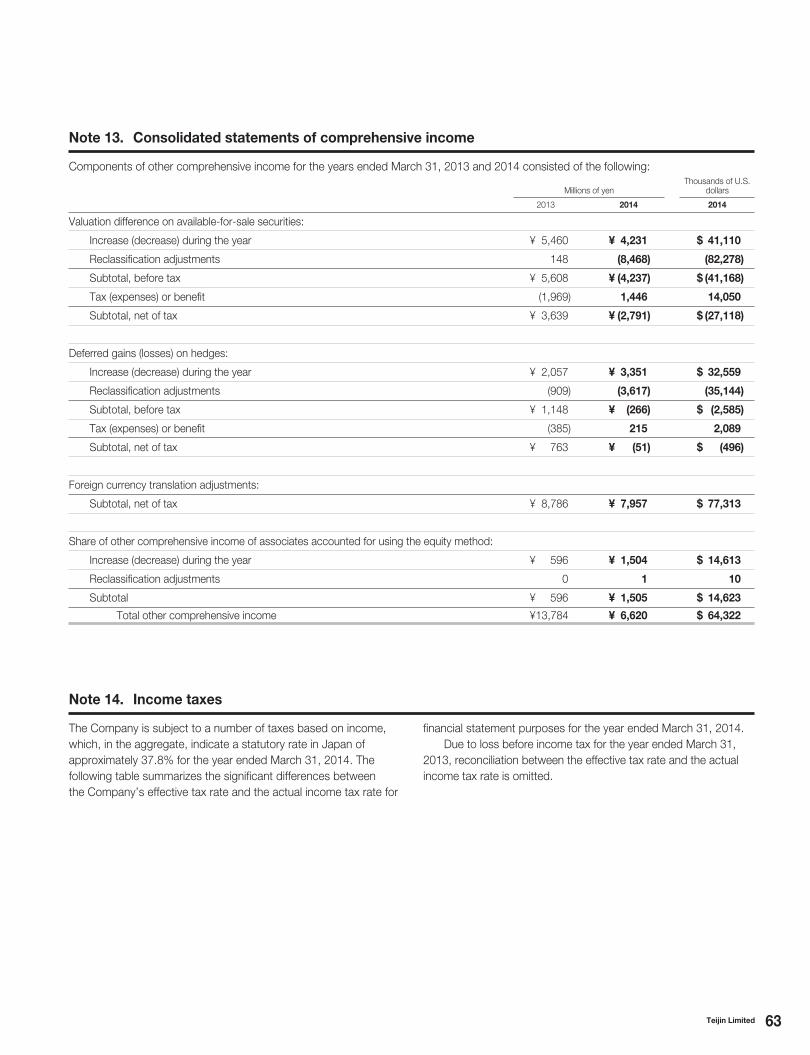
63Teijin Limited
Components of other comprehensive income for the years ended March 31, 2013 and 2014 consisted of the following:
Millions of yenThousands of U.S.
dollars
2013 2014 2014
Valuation difference on available-for-sale securities:
Increase (decrease) during the year ¥ 5,460 ¥ 4,231 $ 41,110
Reclassification adjustments 148 (8,468) (82,278)
Subtotal, before tax ¥ 5,608 ¥ (4,237) $ (41,168)
Tax (expenses) or benefit (1,969) 1,446 14,050
Subtotal, net of tax ¥ 3,639 ¥ (2,791) $ (27,118)
Deferred gains (losses) on hedges:
Increase (decrease) during the year ¥ 2,057 ¥ 3,351 $ 32,559
Reclassification adjustments (909) (3,617) (35,144)
Subtotal, before tax ¥ 1,148 ¥ (266) $ (2,585)
Tax (expenses) or benefit (385) 215 2,089
Subtotal, net of tax ¥ 763 ¥ (51) $ (496)
Foreign currency translation adjustments:
Subtotal, net of tax ¥ 8,786 ¥ 7,957 $ 77,313
Share of other comprehensive income of associates accounted for using the equity method:
Increase (decrease) during the year ¥ 596 ¥ 1,504 $ 14,613
Reclassification adjustments 0 1 10
Subtotal ¥ 596 ¥ 1,505 $ 14,623
Total other comprehensive income ¥ 13,784 ¥ 6,620 $ 64,322
Note 13. Consolidated statements of comprehensive income
The Company is subject to a number of taxes based on income,
which, in the aggregate, indicate a statutory rate in Japan of
approximately 37.8% for the year ended March 31, 2014. The
following table summarizes the significant differences between
the Company’s effective tax rate and the actual income tax rate for
financial statement purposes for the year ended March 31, 2014.
Due to loss before income tax for the year ended March 31,
2013, reconciliation between the effective tax rate and the actual
income tax rate is omitted.
Note 14. Income taxes
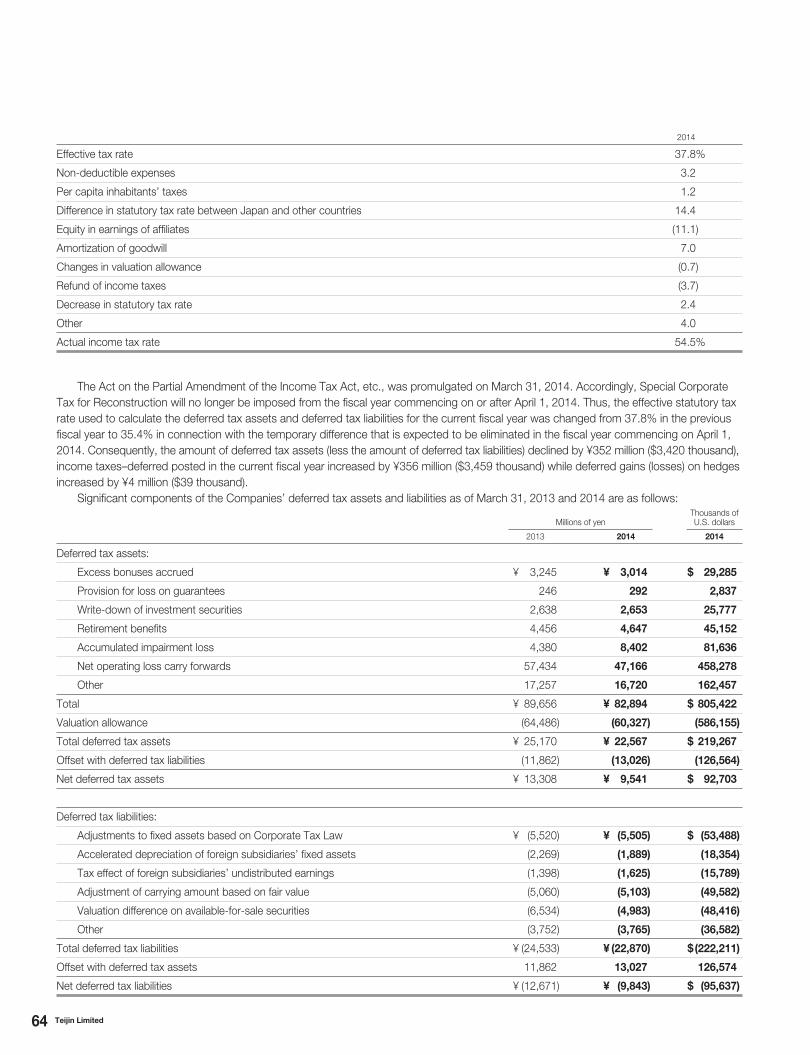
64 Teijin Limited
2014
Effective tax rate 37.8%
Non-deductible expenses 3.2
Per capita inhabitants’ taxes 1.2
Difference in statutory tax rate between Japan and other countries 14.4
Equity in earnings of affiliates (11.1)
Amortization of goodwill 7.0
Changes in valuation allowance (0.7)
Refund of income taxes (3.7)
Decrease in statutory tax rate 2.4
Other 4.0
Actual income tax rate 54.5%
The Act on the Partial Amendment of the Income Tax Act, etc., was promulgated on March 31, 2014. Accordingly, Special Corporate
Tax for Reconstruction will no longer be imposed from the fiscal year commencing on or after April 1, 2014. Thus, the effective statutory tax
rate used to calculate the deferred tax assets and deferred tax liabilities for the current fiscal year was changed from 37.8% in the previous
fiscal year to 35.4% in connection with the temporary difference that is expected to be eliminated in the fiscal year commencing on April 1,
2014. Consequently, the amount of deferred tax assets (less the amount of deferred tax liabilities) declined by ¥352 million ($3,420 thousand),
income taxes–deferred posted in the current fiscal year increased by ¥356 million ($3,459 thousand) while deferred gains (losses) on hedges
increased by ¥4 million ($39 thousand).
Significant components of the Companies’ deferred tax assets and liabilities as of March 31, 2013 and 2014 are as follows:
Millions of yenThousands of U.S. dollars
2013 2014 2014
Deferred tax assets:
Excess bonuses accrued ¥ 3,245 ¥ 3,014 $ 29,285
Provision for loss on guarantees 246 292 2,837
Write-down of investment securities 2,638 2,653 25,777
Retirement benefits 4,456 4,647 45,152
Accumulated impairment loss 4,380 8,402 81,636
Net operating loss carry forwards 57,434 47,166 458,278
Other 17,257 16,720 162,457
Total ¥ 89,656 ¥ 82,894 $ 805,422
Valuation allowance (64,486) (60,327) (586,155)
Total deferred tax assets ¥ 25,170 ¥ 22,567 $ 219,267
Offset with deferred tax liabilities (11,862) (13,026) (126,564)
Net deferred tax assets ¥ 13,308 ¥ 9,541 $ 92,703
Deferred tax liabilities:
Adjustments to fixed assets based on Corporate Tax Law ¥ (5,520) ¥ (5,505) $ (53,488)
Accelerated depreciation of foreign subsidiaries’ fixed assets (2,269) (1,889) (18,354)
Tax effect of foreign subsidiaries’ undistributed earnings (1,398) (1,625) (15,789)
Adjustment of carrying amount based on fair value (5,060) (5,103) (49,582)
Valuation difference on available-for-sale securities (6,534) (4,983) (48,416)
Other (3,752) (3,765) (36,582)
Total deferred tax liabilities ¥ (24,533) ¥ (22,870) $ (222,211)
Offset with deferred tax assets 11,862 13,027 126,574
Net deferred tax liabilities ¥ (12,671) ¥ (9,843) $ (95,637)
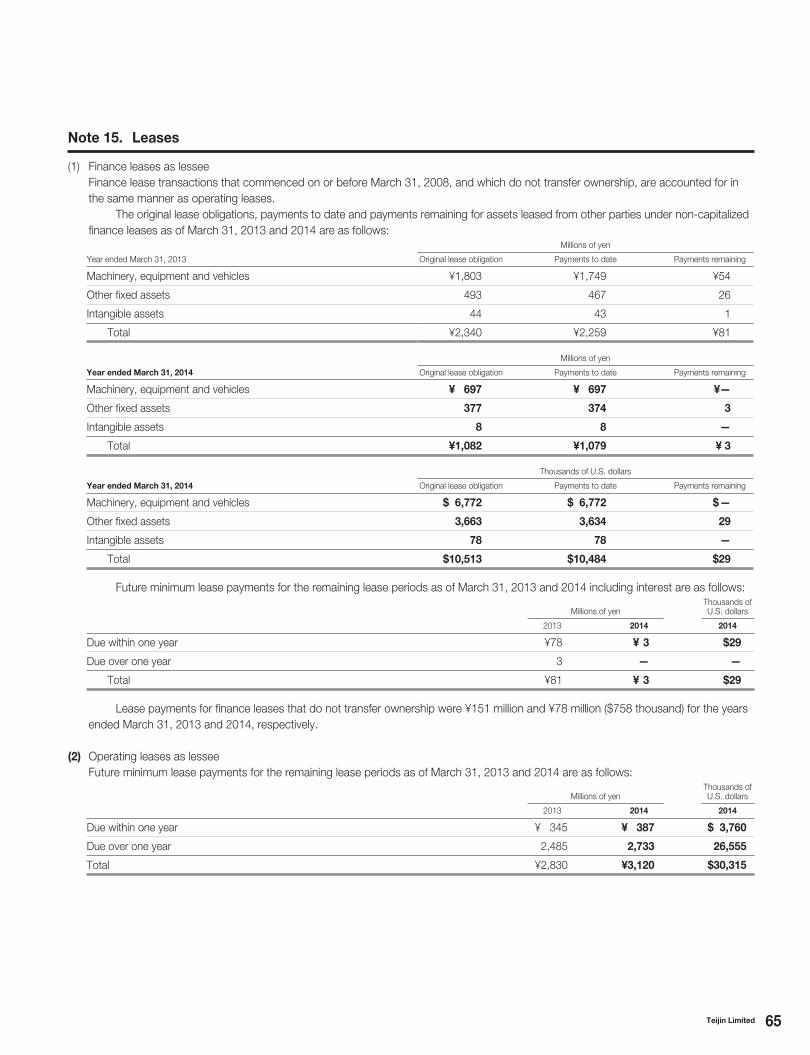
65Teijin Limited
(1) Finance leases as lessee
Finance lease transactions that commenced on or before March 31, 2008, and which do not transfer ownership, are accounted for in
the same manner as operating leases.
The original lease obligations, payments to date and payments remaining for assets leased from other parties under non-capitalized
finance leases as of March 31, 2013 and 2014 are as follows: Millions of yen
Year ended March 31, 2013 Original lease obligation Payments to date Payments remaining
Machinery, equipment and vehicles ¥1,803 ¥1,749 ¥54
Other fixed assets 493 467 26
Intangible assets 44 43 1
Total ¥2,340 ¥2,259 ¥81
Millions of yen
Year ended March 31, 2014 Original lease obligation Payments to date Payments remaining
Machinery, equipment and vehicles ¥ 697 ¥ 697 ¥—
Other fixed assets 377 374 3
Intangible assets 8 8 —
Total ¥1,082 ¥1,079 ¥ 3
Thousands of U.S. dollars
Year ended March 31, 2014 Original lease obligation Payments to date Payments remaining
Machinery, equipment and vehicles $ 6,772 $ 6,772 $—
Other fixed assets 3,663 3,634 29
Intangible assets 78 78 —
Total $10,513 $10,484 $29
Future minimum lease payments for the remaining lease periods as of March 31, 2013 and 2014 including interest are as follows:
Millions of yenThousands of U.S. dollars
2013 2014 2014
Due within one year ¥78 ¥ 3 $29
Due over one year 3 — —
Total ¥81 ¥ 3 $29
Lease payments for finance leases that do not transfer ownership were ¥151 million and ¥78 million ($758 thousand) for the years
ended March 31, 2013 and 2014, respectively.
(2) Operating leases as lessee
Future minimum lease payments for the remaining lease periods as of March 31, 2013 and 2014 are as follows:
Millions of yenThousands of U.S. dollars
2013 2014 2014
Due within one year ¥ 345 ¥ 387 $ 3,760
Due over one year 2,485 2,733 26,555
Total ¥2,830 ¥3,120 $30,315
Note 15. Leases
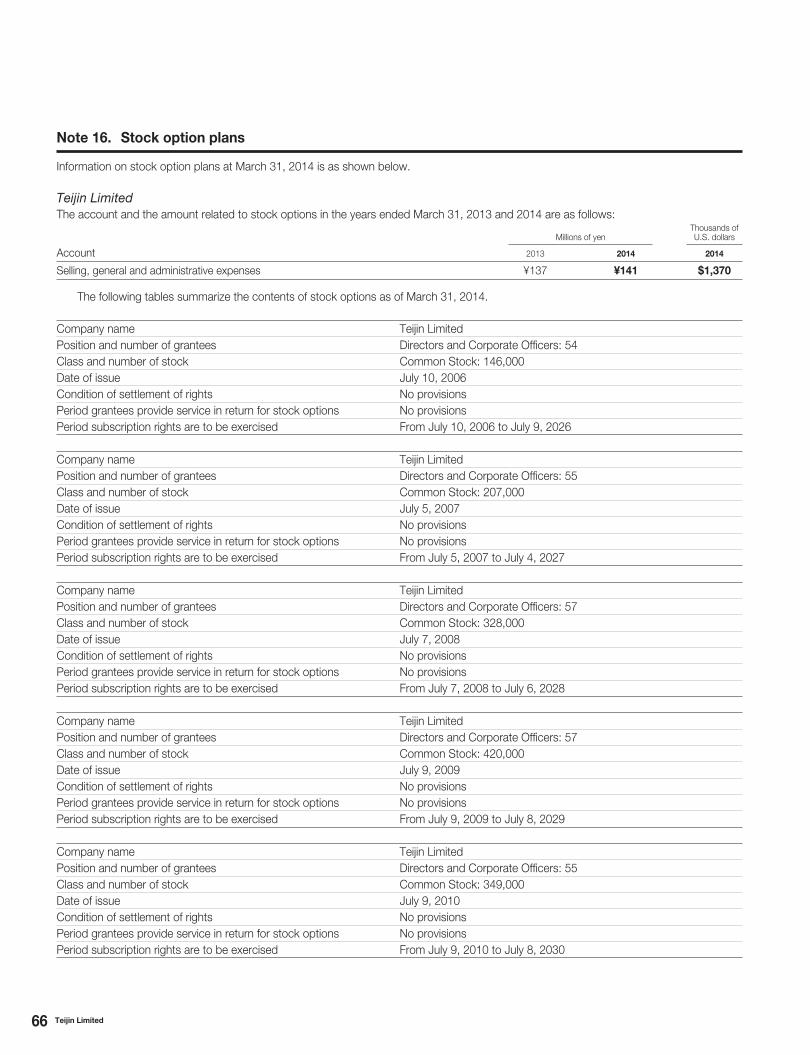
66 Teijin Limited
Information on stock option plans at March 31, 2014 is as shown below.
Teijin LimitedThe account and the amount related to stock options in the years ended March 31, 2013 and 2014 are as follows:
Millions of yenThousands of U.S. dollars
Account 2013 2014 2014
Selling, general and administrative expenses ¥137 ¥141 $1,370
The following tables summarize the contents of stock options as of March 31, 2014.
Company name Teijin Limited
Position and number of grantees Directors and Corporate Officers: 54
Class and number of stock Common Stock: 146,000
Date of issue July 10, 2006
Condition of settlement of rights No provisions
Period grantees provide service in return for stock options No provisions
Period subscription rights are to be exercised From July 10, 2006 to July 9, 2026
Company name Teijin Limited
Position and number of grantees Directors and Corporate Officers: 55
Class and number of stock Common Stock: 207,000
Date of issue July 5, 2007
Condition of settlement of rights No provisions
Period grantees provide service in return for stock options No provisions
Period subscription rights are to be exercised From July 5, 2007 to July 4, 2027
Company name Teijin Limited
Position and number of grantees Directors and Corporate Officers: 57
Class and number of stock Common Stock: 328,000
Date of issue July 7, 2008
Condition of settlement of rights No provisions
Period grantees provide service in return for stock options No provisions
Period subscription rights are to be exercised From July 7, 2008 to July 6, 2028
Company name Teijin Limited
Position and number of grantees Directors and Corporate Officers: 57
Class and number of stock Common Stock: 420,000
Date of issue July 9, 2009
Condition of settlement of rights No provisions
Period grantees provide service in return for stock options No provisions
Period subscription rights are to be exercised From July 9, 2009 to July 8, 2029
Company name Teijin Limited
Position and number of grantees Directors and Corporate Officers: 55
Class and number of stock Common Stock: 349,000
Date of issue July 9, 2010
Condition of settlement of rights No provisions
Period grantees provide service in return for stock options No provisions
Period subscription rights are to be exercised From July 9, 2010 to July 8, 2030
Note 16. Stock option plans
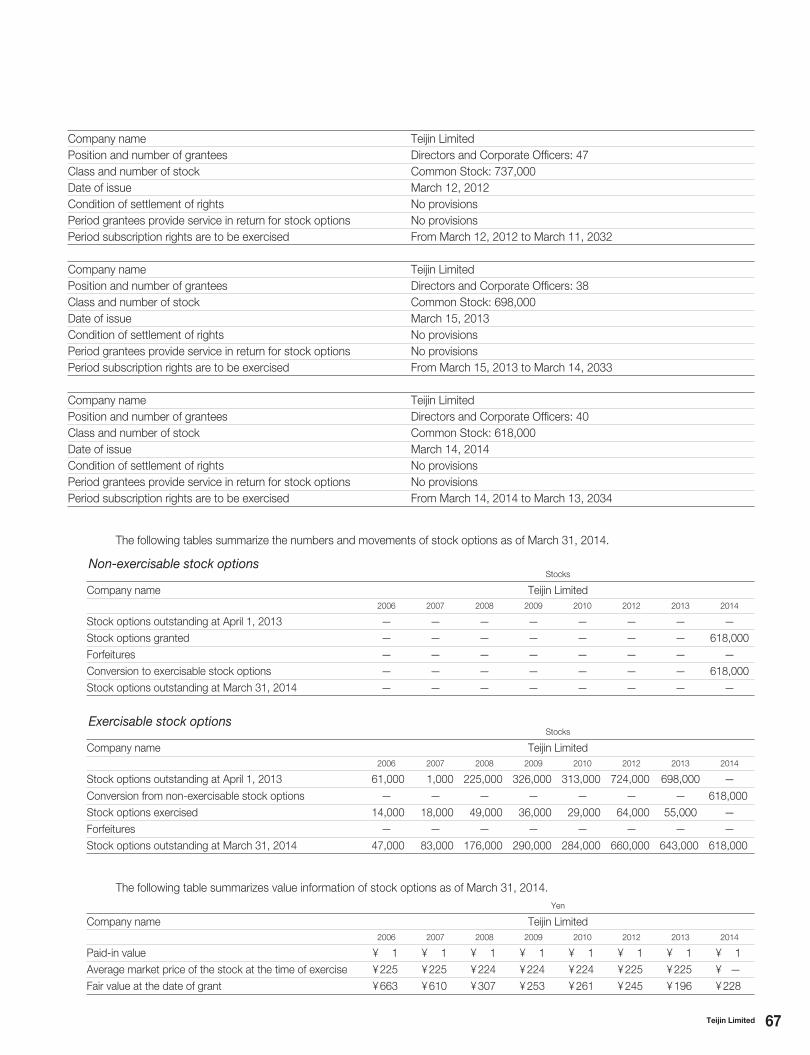
67Teijin Limited
Company name Teijin Limited
Position and number of grantees Directors and Corporate Officers: 47
Class and number of stock Common Stock: 737,000
Date of issue March 12, 2012
Condition of settlement of rights No provisions
Period grantees provide service in return for stock options No provisions
Period subscription rights are to be exercised From March 12, 2012 to March 11, 2032
Company name Teijin Limited
Position and number of grantees Directors and Corporate Officers: 38
Class and number of stock Common Stock: 698,000
Date of issue March 15, 2013
Condition of settlement of rights No provisions
Period grantees provide service in return for stock options No provisions
Period subscription rights are to be exercised From March 15, 2013 to March 14, 2033
Company name Teijin Limited
Position and number of grantees Directors and Corporate Officers: 40
Class and number of stock Common Stock: 618,000
Date of issue March 14, 2014
Condition of settlement of rights No provisions
Period grantees provide service in return for stock options No provisions
Period subscription rights are to be exercised From March 14, 2014 to March 13, 2034
The following tables summarize the numbers and movements of stock options as of March 31, 2014.
Non-exercisable stock optionsStocks
Company name Teijin Limited
2006 2007 2008 2009 2010 2012 2013 2014
Stock options outstanding at April 1, 2013 — — — — — — — —
Stock options granted — — — — — — — 618,000
Forfeitures — — — — — — — —
Conversion to exercisable stock options — — — — — — — 618,000
Stock options outstanding at March 31, 2014 — — — — — — — —
Exercisable stock optionsStocks
Company name Teijin Limited
2006 2007 2008 2009 2010 2012 2013 2014
Stock options outstanding at April 1, 2013 61,000 1,000 225,000 326,000 313,000 724,000 698,000 —
Conversion from non-exercisable stock options — — — — — — — 618,000
Stock options exercised 14,000 18,000 49,000 36,000 29,000 64,000 55,000 —
Forfeitures — — — — — — — —
Stock options outstanding at March 31, 2014 47,000 83,000 176,000 290,000 284,000 660,000 643,000 618,000
The following table summarizes value information of stock options as of March 31, 2014.
Yen
Company name Teijin Limited
2006 2007 2008 2009 2010 2012 2013 2014
Paid-in value ¥ 1 ¥ 1 ¥ 1 ¥ 1 ¥ 1 ¥ 1 ¥ 1 ¥ 1
Average market price of the stock at the time of exercise ¥ 225 ¥ 225 ¥ 224 ¥ 224 ¥ 224 ¥ 225 ¥ 225 ¥ —
Fair value at the date of grant ¥ 663 ¥ 610 ¥ 307 ¥ 253 ¥ 261 ¥ 245 ¥ 196 ¥ 228
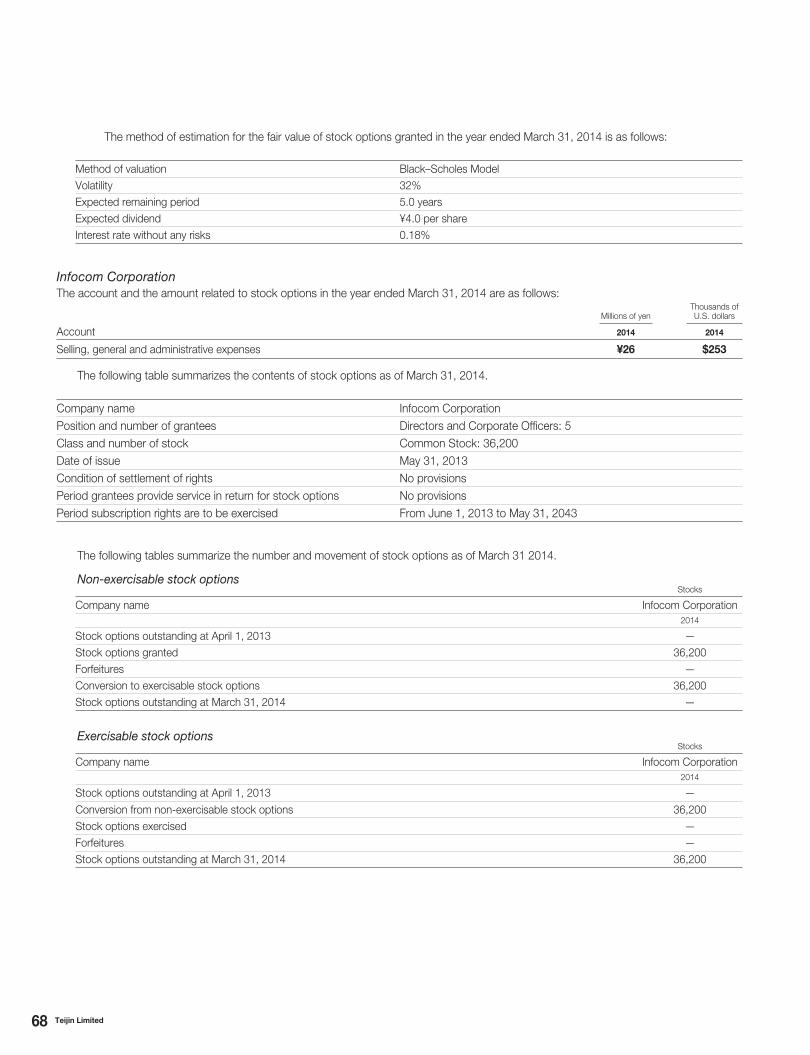
68 Teijin Limited
The method of estimation for the fair value of stock options granted in the year ended March 31, 2014 is as follows:
Method of valuation Black–Scholes Model
Volatility 32%
Expected remaining period 5.0 years
Expected dividend ¥4.0 per share
Interest rate without any risks 0.18%
Infocom CorporationThe account and the amount related to stock options in the year ended March 31, 2014 are as follows:
Millions of yenThousands of U.S. dollars
Account 2014 2014
Selling, general and administrative expenses ¥26 $253
The following table summarizes the contents of stock options as of March 31, 2014.
Company name Infocom Corporation
Position and number of grantees Directors and Corporate Officers: 5
Class and number of stock Common Stock: 36,200
Date of issue May 31, 2013
Condition of settlement of rights No provisions
Period grantees provide service in return for stock options No provisions
Period subscription rights are to be exercised From June 1, 2013 to May 31, 2043
The following tables summarize the number and movement of stock options as of March 31 2014.
Non-exercisable stock optionsStocks
Company name Infocom Corporation
2014
Stock options outstanding at April 1, 2013 —
Stock options granted 36,200
Forfeitures —
Conversion to exercisable stock options 36,200
Stock options outstanding at March 31, 2014 —
Exercisable stock optionsStocks
Company name Infocom Corporation
2014
Stock options outstanding at April 1, 2013 —
Conversion from non-exercisable stock options 36,200
Stock options exercised —
Forfeitures —
Stock options outstanding at March 31, 2014 36,200
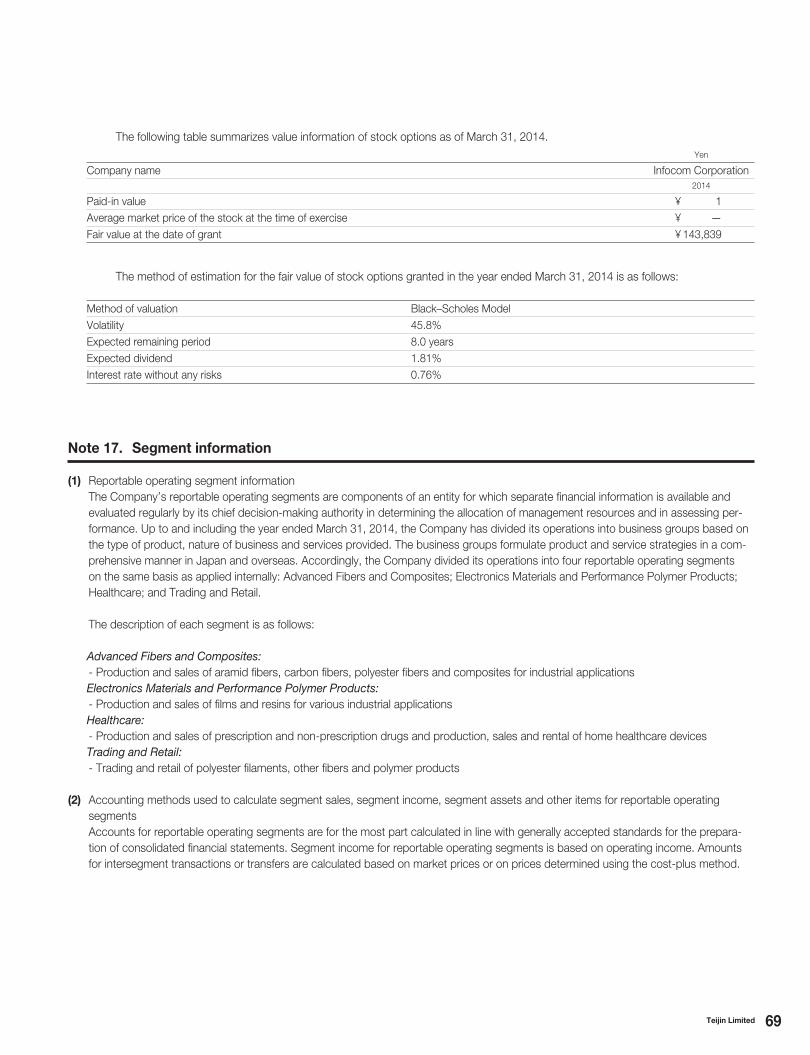
69Teijin Limited
The following table summarizes value information of stock options as of March 31, 2014.
Yen
Company name Infocom Corporation
2014
Paid-in value ¥ 1
Average market price of the stock at the time of exercise ¥ —
Fair value at the date of grant ¥ 143,839
The method of estimation for the fair value of stock options granted in the year ended March 31, 2014 is as follows:
Method of valuation Black–Scholes Model
Volatility 45.8%
Expected remaining period 8.0 years
Expected dividend 1.81%
Interest rate without any risks 0.76%
Note 17. Segment information
(1) Reportable operating segment information
The Company’s reportable operating segments are components of an entity for which separate financial information is available and
evaluated regularly by its chief decision-making authority in determining the allocation of management resources and in assessing per-
formance. Up to and including the year ended March 31, 2014, the Company has divided its operations into business groups based on
the type of product, nature of business and services provided. The business groups formulate product and service strategies in a com-
prehensive manner in Japan and overseas. Accordingly, the Company divided its operations into four reportable operating segments
on the same basis as applied internally: Advanced Fibers and Composites; Electronics Materials and Performance Polymer Products;
Healthcare; and Trading and Retail.
The description of each segment is as follows:
Advanced Fibers and Composites:- Production and sales of aramid fibers, carbon fibers, polyester fibers and composites for industrial applications
Electronics Materials and Performance Polymer Products:- Production and sales of films and resins for various industrial applications
Healthcare:- Production and sales of prescription and non-prescription drugs and production, sales and rental of home healthcare devices
Trading and Retail:- Trading and retail of polyester filaments, other fibers and polymer products
(2) Accounting methods used to calculate segment sales, segment income, segment assets and other items for reportable operating
segments
Accounts for reportable operating segments are for the most part calculated in line with generally accepted standards for the prepara-
tion of consolidated financial statements. Segment income for reportable operating segments is based on operating income. Amounts
for intersegment transactions or transfers are calculated based on market prices or on prices determined using the cost-plus method.
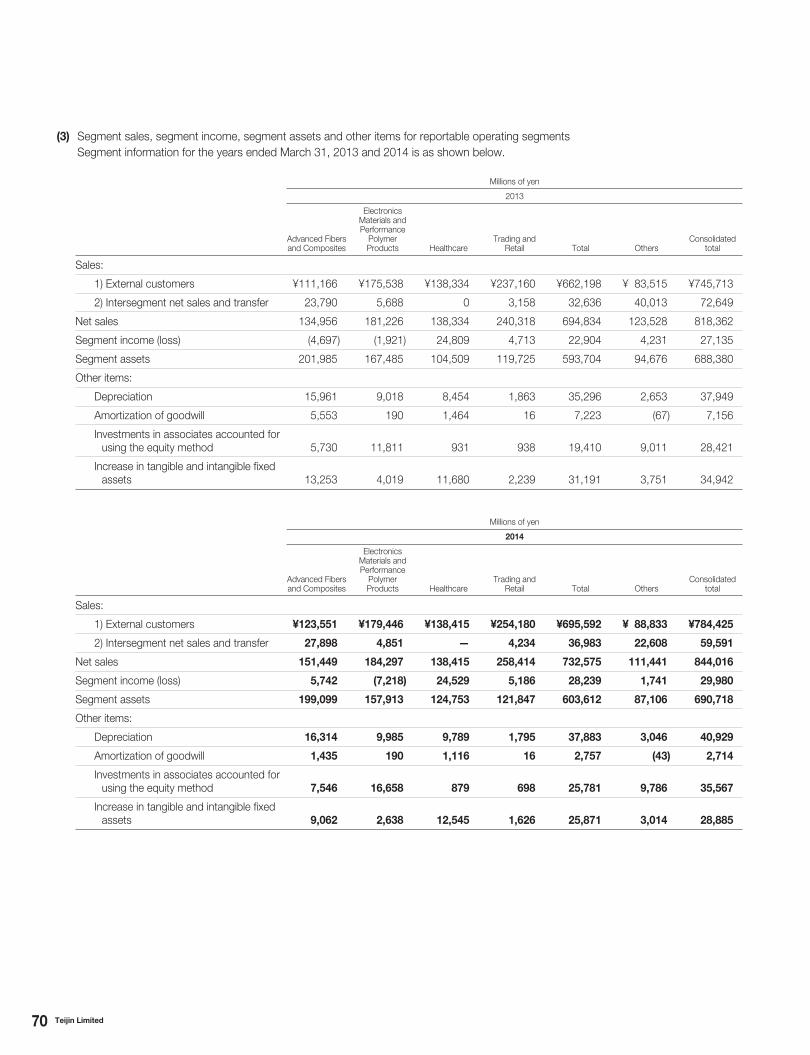
70 Teijin Limited
Millions of yen
2013
Advanced Fibers and Composites
Electronics Materials and Performance
Polymer Products Healthcare
Trading and Retail Total Others
Consolidated total
Sales:
1) External customers ¥111,166 ¥175,538 ¥138,334 ¥237,160 ¥662,198 ¥ 83,515 ¥745,713
2) Intersegment net sales and transfer 23,790 5,688 0 3,158 32,636 40,013 72,649
Net sales 134,956 181,226 138,334 240,318 694,834 123,528 818,362
Segment income (loss) (4,697) (1,921) 24,809 4,713 22,904 4,231 27,135
Segment assets 201,985 167,485 104,509 119,725 593,704 94,676 688,380
Other items:
Depreciation 15,961 9,018 8,454 1,863 35,296 2,653 37,949
Amortization of goodwill 5,553 190 1,464 16 7,223 (67) 7,156
Investments in associates accounted for using the equity method 5,730 11,811 931 938 19,410 9,011 28,421
Increase in tangible and intangible fixed assets 13,253 4,019 11,680 2,239 31,191 3,751 34,942
Millions of yen
2014
Advanced Fibers and Composites
Electronics Materials and Performance
Polymer Products Healthcare
Trading and Retail Total Others
Consolidated total
Sales:
1) External customers ¥123,551 ¥179,446 ¥138,415 ¥254,180 ¥695,592 ¥ 88,833 ¥784,425
2) Intersegment net sales and transfer 27,898 4,851 — 4,234 36,983 22,608 59,591
Net sales 151,449 184,297 138,415 258,414 732,575 111,441 844,016
Segment income (loss) 5,742 (7,218) 24,529 5,186 28,239 1,741 29,980
Segment assets 199,099 157,913 124,753 121,847 603,612 87,106 690,718
Other items:
Depreciation 16,314 9,985 9,789 1,795 37,883 3,046 40,929
Amortization of goodwill 1,435 190 1,116 16 2,757 (43) 2,714
Investments in associates accounted for using the equity method 7,546 16,658 879 698 25,781 9,786 35,567
Increase in tangible and intangible fixed assets 9,062 2,638 12,545 1,626 25,871 3,014 28,885
(3) Segment sales, segment income, segment assets and other items for reportable operating segments
Segment information for the years ended March 31, 2013 and 2014 is as shown below.
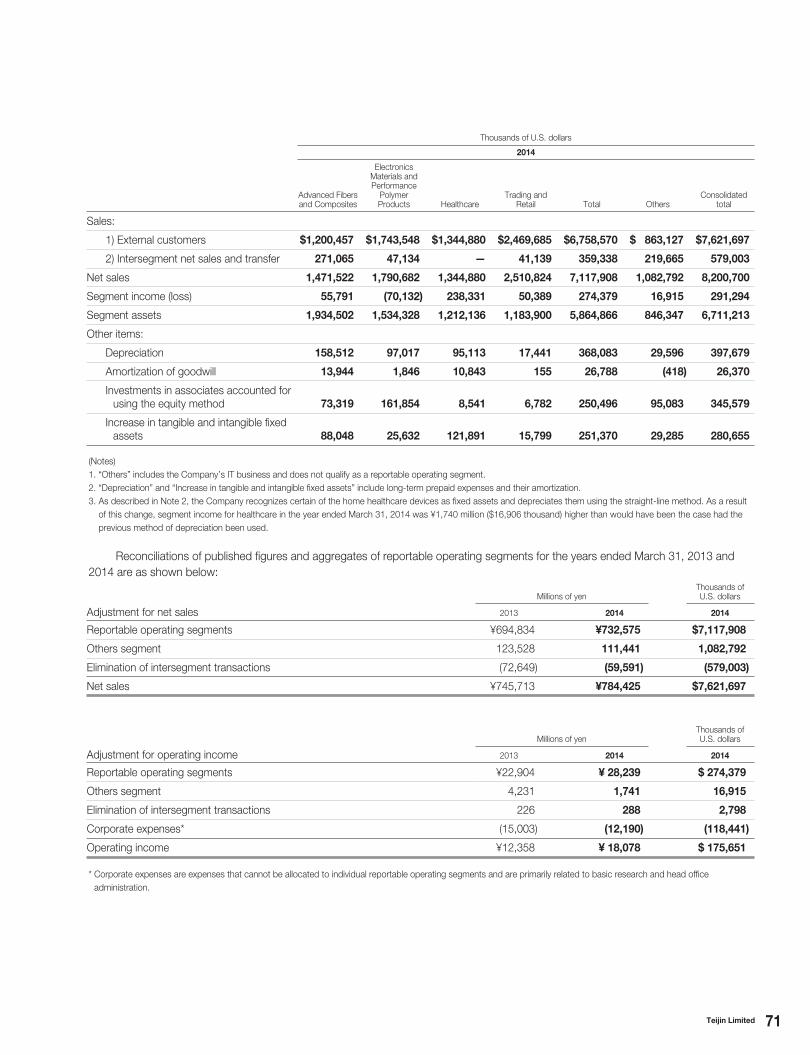
71Teijin Limited
Thousands of U.S. dollars
2014
Advanced Fibers and Composites
Electronics Materials and Performance
Polymer Products Healthcare
Trading and Retail Total Others
Consolidated total
Sales:
1) External customers $1,200,457 $1,743,548 $1,344,880 $2,469,685 $6,758,570 $ 863,127 $7,621,697
2) Intersegment net sales and transfer 271,065 47,134 — 41,139 359,338 219,665 579,003
Net sales 1,471,522 1,790,682 1,344,880 2,510,824 7,117,908 1,082,792 8,200,700
Segment income (loss) 55,791 (70,132) 238,331 50,389 274,379 16,915 291,294
Segment assets 1,934,502 1,534,328 1,212,136 1,183,900 5,864,866 846,347 6,711,213
Other items:
Depreciation 158,512 97,017 95,113 17,441 368,083 29,596 397,679
Amortization of goodwill 13,944 1,846 10,843 155 26,788 (418) 26,370
Investments in associates accounted for using the equity method 73,319 161,854 8,541 6,782 250,496 95,083 345,579
Increase in tangible and intangible fixed assets 88,048 25,632 121,891 15,799 251,370 29,285 280,655
(Notes)
1. “Others” includes the Company’s IT business and does not qualify as a reportable operating segment.
2. “Depreciation” and “Increase in tangible and intangible fixed assets” include long-term prepaid expenses and their amortization.
3. As described in Note 2, the Company recognizes certain of the home healthcare devices as fixed assets and depreciates them using the straight-line method. As a result
of this change, segment income for healthcare in the year ended March 31, 2014 was ¥1,740 million ($16,906 thousand) higher than would have been the case had the
previous method of depreciation been used.
Reconciliations of published figures and aggregates of reportable operating segments for the years ended March 31, 2013 and
2014 are as shown below:
Millions of yenThousands of U.S. dollars
Adjustment for net sales 2013 2014 2014
Reportable operating segments ¥694,834 ¥732,575 $7,117,908
Others segment 123,528 111,441 1,082,792
Elimination of intersegment transactions (72,649) (59,591) (579,003)
Net sales ¥745,713 ¥784,425 $7,621,697
Millions of yenThousands of U.S. dollars
Adjustment for operating income 2013 2014 2014
Reportable operating segments ¥22,904 ¥ 28,239 $ 274,379
Others segment 4,231 1,741 16,915
Elimination of intersegment transactions 226 288 2,798
Corporate expenses* (15,003) (12,190) (118,441)
Operating income ¥12,358 ¥ 18,078 $ 175,651
* Corporate expenses are expenses that cannot be allocated to individual reportable operating segments and are primarily related to basic research and head office
administration.
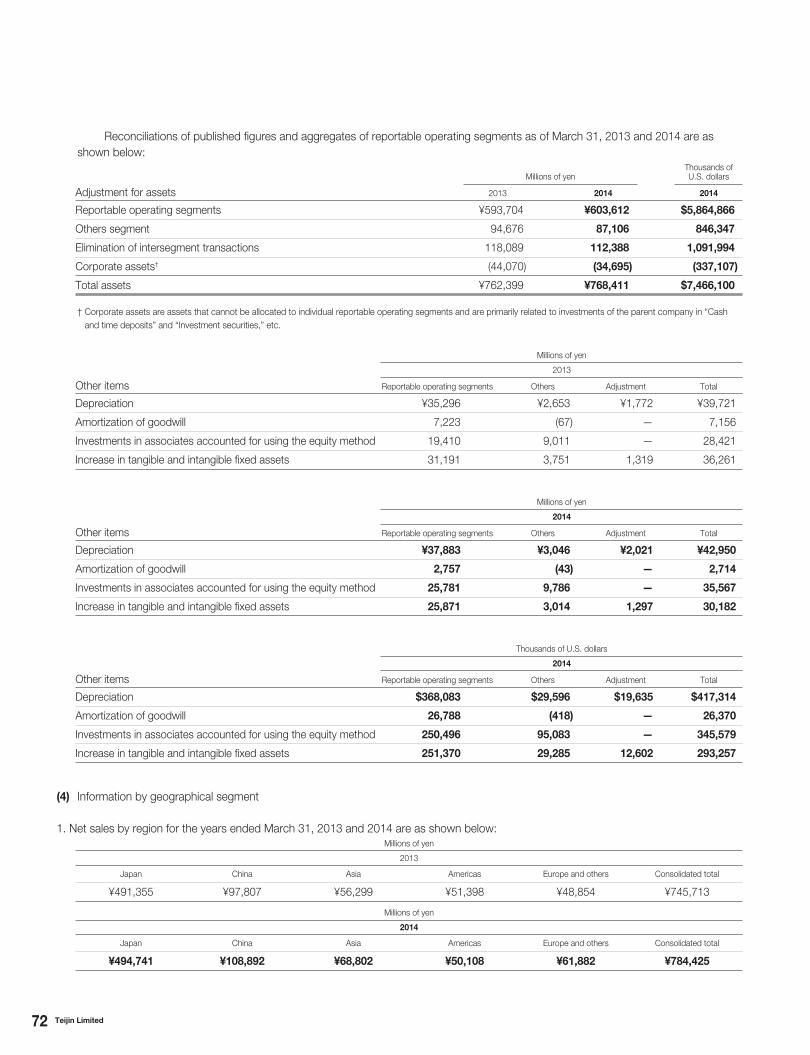
72 Teijin Limited
Reconciliations of published figures and aggregates of reportable operating segments as of March 31, 2013 and 2014 are as
shown below:
Millions of yenThousands of U.S. dollars
Adjustment for assets 2013 2014 2014
Reportable operating segments ¥593,704 ¥603,612 $5,864,866
Others segment 94,676 87,106 846,347
Elimination of intersegment transactions 118,089 112,388 1,091,994
Corporate assets† (44,070) (34,695) (337,107)
Total assets ¥762,399 ¥768,411 $7,466,100
† Corporate assets are assets that cannot be allocated to individual reportable operating segments and are primarily related to investments of the parent company in “Cash
and time deposits” and “Investment securities,” etc.
Millions of yen
2013
Other items Reportable operating segments Others Adjustment Total
Depreciation ¥35,296 ¥2,653 ¥1,772 ¥39,721
Amortization of goodwill 7,223 (67) — 7,156
Investments in associates accounted for using the equity method 19,410 9,011 — 28,421
Increase in tangible and intangible fixed assets 31,191 3,751 1,319 36,261
Millions of yen
2014
Other items Reportable operating segments Others Adjustment Total
Depreciation ¥37,883 ¥3,046 ¥2,021 ¥42,950
Amortization of goodwill 2,757 (43) — 2,714
Investments in associates accounted for using the equity method 25,781 9,786 — 35,567
Increase in tangible and intangible fixed assets 25,871 3,014 1,297 30,182
Thousands of U.S. dollars
2014
Other items Reportable operating segments Others Adjustment Total
Depreciation $368,083 $29,596 $19,635 $417,314
Amortization of goodwill 26,788 (418) — 26,370
Investments in associates accounted for using the equity method 250,496 95,083 — 345,579
Increase in tangible and intangible fixed assets 251,370 29,285 12,602 293,257
(4) Information by geographical segment
1. Net sales by region for the years ended March 31, 2013 and 2014 are as shown below:Millions of yen
2013
Japan China Asia Americas Europe and others Consolidated total
¥491,355 ¥97,807 ¥56,299 ¥51,398 ¥48,854 ¥745,713
Millions of yen
2014
Japan China Asia Americas Europe and others Consolidated total
¥494,741 ¥108,892 ¥68,802 ¥50,108 ¥61,882 ¥784,425
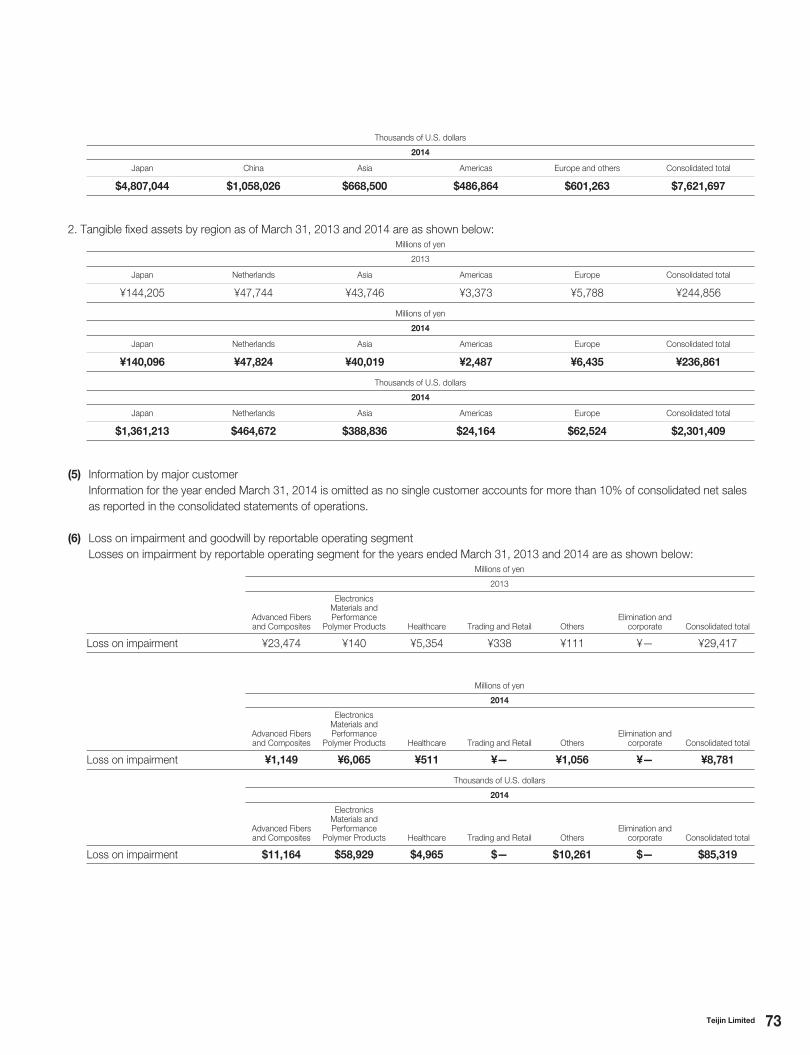
73Teijin Limited
Thousands of U.S. dollars
2014
Japan China Asia Americas Europe and others Consolidated total
$4,807,044 $1,058,026 $668,500 $486,864 $601,263 $7,621,697
2. Tangible fixed assets by region as of March 31, 2013 and 2014 are as shown below:Millions of yen
2013
Japan Netherlands Asia Americas Europe Consolidated total
¥144,205 ¥47,744 ¥43,746 ¥3,373 ¥5,788 ¥244,856
Millions of yen
2014
Japan Netherlands Asia Americas Europe Consolidated total
¥140,096 ¥47,824 ¥40,019 ¥2,487 ¥6,435 ¥236,861
Thousands of U.S. dollars
2014
Japan Netherlands Asia Americas Europe Consolidated total
$1,361,213 $464,672 $388,836 $24,164 $62,524 $2,301,409
(5) Information by major customer
Information for the year ended March 31, 2014 is omitted as no single customer accounts for more than 10% of consolidated net sales
as reported in the consolidated statements of operations.
(6) Loss on impairment and goodwill by reportable operating segment
Losses on impairment by reportable operating segment for the years ended March 31, 2013 and 2014 are as shown below:Millions of yen
2013
Advanced Fibers and Composites
Electronics Materials and Performance
Polymer Products Healthcare Trading and Retail OthersElimination and
corporate Consolidated total
Loss on impairment ¥23,474 ¥140 ¥5,354 ¥338 ¥111 ¥— ¥29,417
Millions of yen
2014
Advanced Fibers and Composites
Electronics Materials and Performance
Polymer Products Healthcare Trading and Retail OthersElimination and
corporate Consolidated total
Loss on impairment ¥1,149 ¥6,065 ¥511 ¥— ¥1,056 ¥— ¥8,781
Thousands of U.S. dollars
2014
Advanced Fibers and Composites
Electronics Materials and Performance
Polymer Products Healthcare Trading and Retail OthersElimination and
corporate Consolidated total
Loss on impairment $11,164 $58,929 $4,965 $— $10,261 $— $85,319
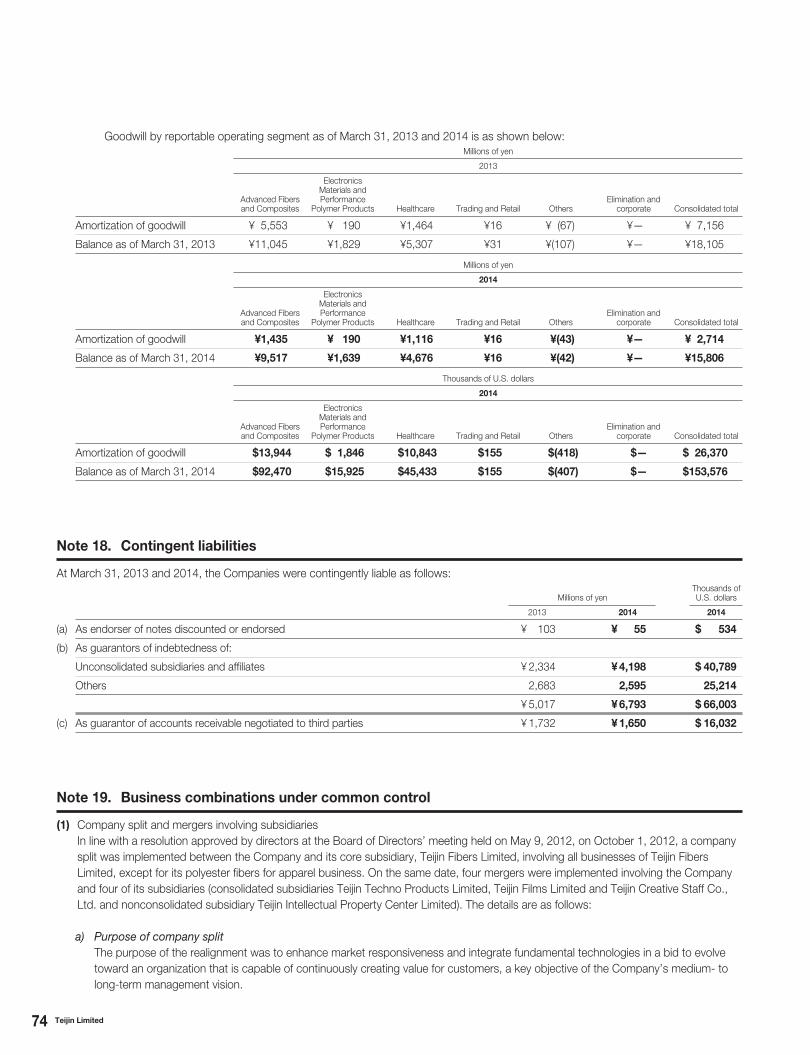
74 Teijin Limited
Goodwill by reportable operating segment as of March 31, 2013 and 2014 is as shown below:Millions of yen
2013
Advanced Fibers and Composites
Electronics Materials and Performance
Polymer Products Healthcare Trading and Retail OthersElimination and
corporate Consolidated total
Amortization of goodwill ¥ 5,553 ¥ 190 ¥1,464 ¥16 ¥ (67) ¥— ¥ 7,156
Balance as of March 31, 2013 ¥11,045 ¥1,829 ¥5,307 ¥31 ¥(107) ¥— ¥18,105
Millions of yen
2014
Advanced Fibers and Composites
Electronics Materials and Performance
Polymer Products Healthcare Trading and Retail OthersElimination and
corporate Consolidated total
Amortization of goodwill ¥1,435 ¥ 190 ¥1,116 ¥16 ¥(43) ¥— ¥ 2,714
Balance as of March 31, 2014 ¥9,517 ¥1,639 ¥4,676 ¥16 ¥(42) ¥— ¥15,806
Thousands of U.S. dollars
2014
Advanced Fibers and Composites
Electronics Materials and Performance
Polymer Products Healthcare Trading and Retail OthersElimination and
corporate Consolidated total
Amortization of goodwill $13,944 $ 1,846 $10,843 $155 $(418) $— $ 26,370
Balance as of March 31, 2014 $92,470 $15,925 $45,433 $155 $(407) $— $153,576
Note 18. Contingent liabilities
At March 31, 2013 and 2014, the Companies were contingently liable as follows:
Millions of yenThousands of U.S. dollars
2013 2014 2014
(a) As endorser of notes discounted or endorsed ¥ 103 ¥ 55 $ 534
(b) As guarantors of indebtedness of:
Unconsolidated subsidiaries and affiliates ¥ 2,334 ¥ 4,198 $ 40,789
Others 2,683 2,595 25,214
¥ 5,017 ¥ 6,793 $ 66,003
(c) As guarantor of accounts receivable negotiated to third parties ¥ 1,732 ¥ 1,650 $ 16,032
Note 19. Business combinations under common control
(1) Company split and mergers involving subsidiaries
In line with a resolution approved by directors at the Board of Directors’ meeting held on May 9, 2012, on October 1, 2012, a company
split was implemented between the Company and its core subsidiary, Teijin Fibers Limited, involving all businesses of Teijin Fibers
Limited, except for its polyester fibers for apparel business. On the same date, four mergers were implemented involving the Company
and four of its subsidiaries (consolidated subsidiaries Teijin Techno Products Limited, Teijin Films Limited and Teijin Creative Staff Co.,
Ltd. and nonconsolidated subsidiary Teijin Intellectual Property Center Limited). The details are as follows:
a) Purpose of company splitThe purpose of the realignment was to enhance market responsiveness and integrate fundamental technologies in a bid to evolve
toward an organization that is capable of continuously creating value for customers, a key objective of the Company’s medium- to
long-term management vision.
75Teijin Limited
Approval of the Board of Directors May 9, 2012
Date of contract May 25, 2012
Approval granted at the general shareholders’ meeting June 22, 2012
Effective date of the company split October 1, 2012
b. Legal form of the split
A simple absorption-type split in which the Company, as the successor company, absorbed all businesses of Teijin Fibers Limited,
the split company, except for its polyester fibers for apparel business
c. Allocation of shares
Because the two parties involved were the parent company and its wholly owned subsidiary, there was no issue or allocation of new
shares or other form of compensation as a result of this company split.
b) Outline of company splita. Agenda
Name Major business
Split company Teijin Fibers Limited Manufacturing and sales of polyester fibers
Successor company Teijin Limited Holding company
e. Split business
All businesses of Teijin Fibers Limited, except for its polyester fibers for apparel business
f. Outline of accounting treatment
This transaction was implemented as a business combination under common control, in accordance with accounting principles for
company splits.
c) Outline of mergersa. Agenda
Approval of the Board of Directors May 9, 2012
Date of contract May 25, 2012
Approval granted at the general shareholders’ meeting June 22, 2012
Effective date of merger October 1, 2012
For the Company, the mergers were simple absorption-type mergers as provided for in Article 796, Paragraph 3, of the Companies
Act of Japan, with the Company as the surviving company. For Teijin Techno Products Limited, Teijin Films Limited, Teijin Creative
Staff Co., Ltd. and Teijin Intellectual Property Center Limited, the mergers were short-form mergers as provided for in Article 784,
Paragraph 1, of the Companies Act of Japan, with these four consolidated subsidiaries as the absorbed companies. Accordingly,
there was no requirement that these contracts be submitted for approval at the general shareholders’ meeting.
b. Legal form of the mergers
A simple absorption-type merger in which the Company is the surviving company and Teijin Techno Products Limited, Teijin Films
Limited, Teijin Creative Staff Co., Ltd. and Teijin Intellectual Property Center Limited were the absorbed companies
c. Allocation of shares
Because Teijin Techno Products Limited, Teijin Films Limited, Teijin Creative Staff Co., Ltd. and Teijin Intellectual Property Center
Limited were wholly owned subsidiaries of the Company, there was no issue or allocation of new shares and no increase in capital
as a result of the mergers.
d. Names and major businesses of the parties
76 Teijin Limited
d. Names and major businesses of the parties
Name Major business
Absorbed companies Teijin Techno Products Limited Manufacturing and sales of high-performance fibers
Teijin Films Limited Coordination of joint venture films business
Teijin Creative Staff Co., Ltd. Contracting out of support service personnel for the Teijin Group
Teijin Intellectual Property Center Limited Intellectual property–related services for the Teijin Group
Surviving company Teijin Limited Holding company
e. Outline of accounting treatment
These transactions were implemented as business combinations under common control, in accordance with accounting principles
for business combinations.
(2) Transfer of intellectual property held by a subsidiary to the Company following a company split
At the Board of Directors’ meeting held on July 31, 2012, directors resolved to implement an absorption-type company split between
the Company and its consolidated subsidiary, Teijin Pharma Limited, whereby the Company would absorb the intellectual property, as
well as the agreements for licensing in technologies and pharmaceuticals and related rights and obligations, of all businesses of Teijin
Pharma Limited, the split company. The company split was implemented on October 1, 2012. The details are as follows:
a) Purpose of company splitThe purpose of the company split was to maximize the benefits of intellectual property by facilitating its unified management and
seamless deployment, with the aim of cultivating new healthcare businesses that integrate materials and healthcare technologies,
a key objective of the Company’s medium- to long-term management vision.
b) Outline of company splita. Agenda
Approval of the Board of Directors July 31, 2012
Date of contract August 1, 2012
Effective date of the company split October 1, 2012
b. Legal form of the split
A simple absorption-type split in which the Company, as the successor company, absorbed the intellectual property, as well as the
agreements for licensing in technologies and pharmaceuticals and related rights and obligations, of all businesses of Teijin Pharma
Limited
c. Allocation of shares
Because the two parties involved were the parent company and its wholly owned subsidiary, there was no issue or allocation of new
shares or other form of compensation as a result of the company split.
d. Names and major businesses of the parties
Name Major business
Split company Teijin Pharma LimitedR&D, production and sales of prescription and non-prescription pharmaceuticals; Sales and rentals of home healthcare equipment
Successor company Teijin Limited Holding company
e. Outline of accounting treatment
This transaction was implemented as a business combination under common control in accordance with accounting principles for
company splits.
77Teijin Limited
(3) In line with a resolution approved by directors at the Board of Directors’ meeting held on May 9, 2012, a merger was implemented on
April 1, 2013 between the Company and its core subsidiary, Teijin Chemicals Limited, with the Company as the surviving company.
a) Purpose of mergerThe purpose of the realignment was to enhance market responsiveness and integrate fundamental technologies in a bid to evolve
toward an organization that is capable of continuously creating value for customers, a key objective of the Company’s medium- to
long-term management vision.
b) Outline of mergera. Agenda
Approval of the Board of Directors May 9, 2012
Date of contract May 25, 2012
Effective date of the merger April 1, 2013
For the Company, the merger was a simple absorption-type merger as provided for in Article 796, Paragraph 3, of the Companies
Act of Japan, with the Company as the surviving company. For Teijin Chemicals Limited, the merger was a short-form merger as
provided for in Article 784, Paragraph 1, of the Companies Act of Japan, with Teijin Chemicals Limited as the absorbed company.
Accordingly, there was no requirement that these contracts be submitted for approval at the general shareholders’ meeting.
b. Legal form of the merger
A simple absorption-type merger in which the Company is the surviving company and Teijin Chemicals Limited was the absorbed
company
c. Allocation of shares
Because the two parties involved were the parent company and its wholly owned subsidiary, there was no issue or allocation of new
shares and no increase in capital as a result of the merger.
d. Names and major businesses of the parties
Name Major business
Absorbed company Teijin Chemicals Limited Manufacturing and sales of films and plastics
Surviving company Teijin Limited Holding company
e. Outline of accounting treatment
This transaction was implemented as a business combination under common control, in accordance with accounting principles for
business combinations.
Note 20. Subsequent events
At the Board of Directors’ meeting held on May 9, 2014, appropriations of retained earnings for year-end dividends applicable to the year
ended March 31, 2014 were duly approved as follows:
Millions of yenThousands of U.S. dollars
Cash dividends: ¥2.00 ($0.02) per share ¥1,966 $19,102
78 Teijin Limited
To the Shareholders and Board of Directors of Teijin Limited:
We have audited the accompanying consolidated financial statements of Teijin Limited and its consolidated subsidiaries, which comprise the
consolidated balance sheets as at March 31, 2013 and 2014, and the consolidated statements of operations, statements of comprehensive
income, statements of changes in net assets and statements of cash flows for the years then ended, and a summary of significant
accounting policies and other explanatory information.
Management’s Responsibility for the Consolidated Financial Statements
Management is responsible for the preparation and fair presentation of these consolidated financial statements in accordance with
accounting principles generally accepted in Japan, and for such internal control as management determines is necessary to enable the
preparation of consolidated financial statements that are free from material misstatements, whether due to fraud or error.
Auditor’s Responsibility
Our responsibility is to express an opinion on these consolidated financial statements based on our audits. We conducted our audits in
accordance with auditing standards generally accepted in Japan. Those standards require that we comply with ethical requirements and
plan and perform the audit to obtain reasonable assurance about whether the consolidated financial statements are free from material
misstatement.
An audit involves performing procedures to obtain audit evidence about the amounts and disclosures in the consolidated financial
statements. The procedures selected depend on our judgement, including the assessment of the risk of material misstatement of the
consolidated financial statements, whether due to fraud or error. In making those risk assessments, we consider internal control relevant
to the entity’s preparation and fair presentation of the consolidated financial statements in order to design audit procedures that are
appropriate in the circumstances, while the objective of the financial statement audit is not for the purpose of expressing an opinion on
the effectiveness of the entity’s internal control. An audit also includes evaluating the appropriateness of accounting policies used and the
reasonableness of accounting estimates made by management, as well as evaluating the overall presentation of the consolidated financial
statements.
We believe that the audit evidence we have obtained is sufficient and appropriate to provide a basis for our audit opinion.
Opinion
In our opinion, the consolidated financial statements present fairly, in all material respects, the financial position of Teijin Limited and its
consolidated subsidiaries as at March 31, 2013 and 2014, and their financial performance and cash flows for the years then ended in
accordance with accounting principles generally accepted in Japan.
Emphasis of Matter
Without qualifying our opinion, we draw attention to Note 2 to the consolidated financial statements. As indicated in Note 2, Teijin Limited
and its consolidated subsidiaries previously recognized part of its leased home healthcare devices as expenses at the time of rental.
However, from the year ended March 31, 2014 Teijin Limited and its consolidated subsidiaries have recognized such devices as fixed assets
and has depreciated them using the straight-line method.
Convenience Translation
The U.S. dollar amounts in the accompanying consolidated financial statements with respect to the year ended March 31, 2014 are
presented solely for convenience. Our audit also included the translation of yen amounts into U.S. dollar amounts and, in our opinion, such
translation has been made on the basis described in Note 1 to the consolidated financial statements.
June 20, 2014
Tokyo, Japan
Independent Auditor’s Report
Building Value
© 2014 Teijin Limited. All Rights Reserved.
Italicized product names and service names in this report are trademarks or registered trademarks of the
Teijin Group in Japan and/or other countries. Where noted, other italicized product names and service
names used in this report are protected as the trademarks and/or trade names of other companies.
Established June 17, 1918
Head Offices Osaka Head Office
6-7, Minami Hommachi 1-chome, Chuo-ku, Osaka 541-8587, Japan
Tel: +81-6-6268-2132
Tokyo Head Office
Kasumigaseki Common Gate West Tower,
2-1, Kasumigaseki 3-chome, Chiyoda-ku, Tokyo 100-8585, Japan
Tel: +81-3-3506-4529
Fiscal Year-End March 31
Common Stock Authorized 3,000,000,000 shares
Issued 984,758,665 shares
Paid-in capital ¥70,817 million
Shareholders 115,132
Number of Teijin Group Companies Japan 55
Overseas 95
Total 150
Number of Teijin Group Employees
(Consolidated)
Japan 9,436
Overseas 6,320
Total 15,756
Stock Exchange Listing Tokyo
Stock Code 3401
Stock Transfer Agent Mitsubishi UFJ Trust and Banking Corporation
Dividends Dividends are usually declared in May and November.
Dividends are usually paid in or about May and November.
Reports Available to Shareholders and Investors Corporate Brochure
Annual Report
Fact Book
Kessan Tanshin (Japanese summary financial report)
The Teijin Group CSR Report
Annual Meeting of Shareholders The annual meeting of shareholders is held before the end of June.
Independent Public Accountants KPMG AZSA LLC
Teijin on the Internet http://www.teijin.com
Teijin’s web site offers a wealth of corporate and product information, including the latest annual report,
financial results and corporate news.
Investor Relations If you have any questions or would like copies of any of our reports, please contact:
Masahiro Ikeda,
General Manager, IR Section,
Finance & Investor Relations Department,
Kasumigaseki Common Gate West Tower,
2-1, Kasumigaseki 3-chome,
Chiyoda-ku, Tokyo 100-8585, Japan
Tel: +81-3-3506-4407 Fax: +81-3-5510-7977
E-mail: [email protected]
Corporate Data As of March 31, 2014
79Teijin Limited
http://www.teijin.com
Printed in Japan using waterless printing. Issued 2014.7