Embed Size (px)
Citation preview

Drug Use Profile
Alcohol Use/Abuse
Historically, alcohol is the most prevalent substance of use and abuse by adults in Iowa. Research from
the Behavioral Risk Factor Surveillance System compiled by the federal Centers for Disease Control and
Prevention indicates that almost six of every ten adult Iowans are classified as current drinkers of
alcoholic beverages. Further, one in five adult Iowans is classified as a binge drinker of alcoholic
beverages, a classification indicative of abuse of, or addiction to, the substance.
In order to better understand some of the social implications resulting from the widespread use and
abuse of this substance, data indicators concerning the use of alcohol, are presented below.
Distilled Spirits Sales in Gallons (Millions) (age 21+), SFY 1998 – 2011
Source: Iowa Department of Commerce, Alcoholic Beverages Division
This figure displays data compiled by the Iowa Department of Commerce, Alcoholic Beverages Division,
reporting the sale of millions of gallons of distilled spirits within the State of Iowa, and represents by
inference the consumption of those beverages by adult Iowans. It also indicates that since 1998 alcohol
consumption has steadily increased (67.6% over the past twelve years) reaching its current high of 4.56
million gallons in FY 2011. This translates to the average Iowan, over the age of 21, consuming a total of
2.14 gallons of distilled spirits in one year, in addition to 1.86 gallons of wine and 37.2 gallons of beer.
The use of alcohol has been implicated in certain forms of behavior that are detrimental to the health,
safety and well-being of individuals as well as to society as a whole. Some of these behaviors are
examined below.
2.72 2.84 2.86 2.90 3.04 3.26 3.47 3.70 3.94 4.06 4.30 4.40 4.56
0.0
1.0
2.0
3.0
4.0
5.0
6.0
1999 2000 2001 2002 2003 2004 2005 2006 2007 2008 2009 2010 2011

Drug Use Profile
OWI Arrest Rate/100,000 Population, CY 1994 – 2010
Source: Iowa Department of Public Safety
During the period of calendar years 1994 - 2010, more arrests were made in Iowa for Operating While
Intoxicated (OWI) than for any other single criminal offense. The OWI arrest rate has remained
consistently high for over 15 years.
Reported Number of OWI Charges Disposed and Number of OWI Convictions,
CY 1999 – 2010
Source: Division
of Criminal and Juvenile Justice Planning
*Charges and convictions included in this table do not include cases in which a deferred judgment resulted in the removal of the record prior to the analysis of the data. As a result, the data may underreport the number of charges and convictions.
Clerk of Court data compiled by the Division of Criminal and Juvenile Justice Planning (CJJP) indicates
that both the number of OWI charges disposed and the number of OWI convictions reported by the
courts have remained quite high for the reporting period. OWI arbitrations represent a significant
proportion of the criminal caseload in Iowa courts. In 2010, OWI represented 19.4% of the charges
disposed and 28.7% of the overall convictions for serious misdemeanors and above.
Alcohol-Related Motor Vehicle Fatalities in Iowa CY 1994 – 2010
Source: Iowa Department of Public Safety
658 638 649 627 671 626 597 561 598 569 632 630 619 618 613 463
0
200
400
600
800
1000
1994 1995 1996 1997 1998 1999 2000 2001 2002 2003 2004 2005 2006 2007 2008 2009 2010
15,905
14,366
0
6,000
12,000
18,000
1999 2000 2001 2002 2003 2004 2005 2006 2007 2008 2009 2010
Charges
Convictions
151 160 139 126 114 132
112 117 121 123
78 85 106 111
81 92 73
0306090
120150180
1994 1996 1998 2000 2002 2004 2006 2008 2010

Drug Use Profile
Alcohol related motor vehicle fatalities reported by the Iowa Department of Public Safety, Governor’s
Traffic Safety Bureau (GTSB), have varied significantly over the reporting period. However, in 2010, the
GTSB reported the lowest number of alcohol-related fatalities in our state’s history.
An examination of the rates for reported arrests for drunkenness (public intoxication) reveals that
following several years of decline, the record high occurred in 2007. The rate has decreased again since.
Drunkenness Arrest Rate/100,000 Population, CY 1994 – 2009
Source: Iowa Department of Public Safety
The Iowa Department of Public Health (IDPH) Division of Behavioral Health requires all licensed
substance abuse treatment providers to report data on services provided through the SARS/I-SMART
data system. Among other things, the system is capable of tracking the number of clients served, along
with the drug(s) of choice and post-treatment outcome measures.
Primary Substance of Abuse for Clients Screened/Admitted to Substance Abuse
Treatment SFY 2011
Primary Substance Juvenile Clients Adult Clients % of Total
Alcohol 1,166 (28.3%) 25,330 (57.6%) 55.2%
Marijuana 2,672 (64.9%) 9,703 (22.1%) 25.7%
Methamphetamine 59 (1.4%) 4,568 (10.4%) 9.6%
Cocaine/Crack 14 (0.3%) 911 (2.1%) 1.9%
Other/Unknown 207 (5.1%) 3,444 (7.8%) 7.6%
Total 100 %
Source: Iowa Department of Public Health, Division of Behavioral Health – SARS/I-SMART
325 356 348 352
416 456 451
368 360 343 393 380
463 522 518
370
0
100
200
300
400
500
600
1994 1995 1996 1997 1998 1999 2000 2001 2002 2003 2004 2005 2006 2007 2008 2009

Drug Use Profile
Primary Substance of Abuse for Adult and Juvenile Clients Screened/Admitted
to Substance Abuse Treatment SFY 1992 - 2011
Year Alcohol Marijuana Meth Cocaine/
Crack
Heroin Other Total
Clients*
1992 85.0% 7.0% 1.0% 5.0% 0.5% 1.5% 22,471
1993 82.0% 9.0% 1.3% 5.0% 0.7% 2.0% 22,567
1994 78.0% 11.0% 2.2% 6.0% 0.8% 4.0% 25,328
1995 69.0% 14.3% 7.3% 6.0% 0.7% 2.7% 29,377
1996 64.0% 18.1% 9.1% 6.0% 0.5% 1.8% 33,269
1997 62.5% 19.3% 9.6% 6.3% 0.6% 1.7% 38,297
1998 60.0% 20.0% 12.0% 6.0% 0.5% 1.5% 38,347
1999 63.0% 20.0% 8.3% 5.6% 0.5% 1.3% 40,424
2000 62.3% 20.9% 9.4% 5.4% 0.5% 1.5% 43,217
2001 60.5% 22.2% 10.7% 4.6% 0.5% 1.5% 44,147
2002 58.5% 22.7% 12.3% 4.2% 0.5% 1.8% 42,911
2003 57.5% 21.8% 13.4% 4.6% 0.6% 1.9% 40,925
2004 55.6% 22.7% 14.6% 4.7% 0.6% 1.8% 42,449
2005 55.8% 22.4% 14.4% 5.0% 0.6% 1.9% 43,692
2006 55.9% 22.8% 13.6% 5.1% 0.5% 2.2% 44,863
2007 58.3% 22.5% 10.7% 5.2% 0.4% 2.9% 47,252
2008 61.9% 22.7% 7.5% 4.5% 0.4% 2.9% 44,528
2009 61.4% 23.2% 7.8% 3.7% 0.5% 3.4% 44,849
2010 58.6% 25.0% 8.8% 2.9% 0.7% 4.0% 44,904
2011 55.2% 25.7% 9.6% 1.9% 0.9% 6.7% 47,974
*In some instances, screens/admissions may be double counted if a client is screened and later admitted for different substances.
Source: Iowa Department of Public Health, Division of Behavioral Health – SARS/I-SMART
According to the I-SMART substance abuse data system, the number of clients
screened/admitted for substance abuse treatment in Iowa remains high. IDPH reported 47,974
clients screened/admitted in FY 2011, more than double the number 19 years ago, and the
highest number of clients ever admitted. The percent of clients with a primary substance of
alcohol reached an all-time low of 55.2% in 2011, while the percent of marijuana clients reached
an all-time high of 25.7%. Meth admissions are back on the rise, up to 9.6%. Crack/cocaine
admissions reached an all-time low of 1.9%, while heroin admissions reached an all-time high of
.9%. The “other or unknown” category of admissions includes inhalants, synthetics, prescription
drugs, other opiates, and unknown drugs. This category reached an all-time high in 2011 at
6.7%.

Drug Use Profile
The Number of Adult Substance Abuse Treatment Screenings/Admissions
Identifying Alcohol as the Primary Drug of Abuse, SFY 1996 – 2011
Source: Iowa Department of Public Health, Division of Behavioral Health – SARS/I-SMART
IDPH data show that alcohol remains by far the number one substance of abuse in Iowa. The
data indicate that the number of adults screened or seeking substance abuse treatment with a
reported primary substance of alcohol increased 30.5% from 2003 to 2009. More people were
screened and/or admitted for alcohol in 2009 than any other year since 1992.
Primary Substance of Abuse for Adults Screened/Admitted to Substance Abuse
Treatment Programs, SFY 1997 – 2011
Source: Iowa Department of Public Health, Division of Behavioral Health – SARS/I-SMART
Adverse societal consequences resulting from the use of alcohol are not limited to criminal acts
based solely and directly on excess consumption, such as OWI and drunkenness. A number of
studies have found that alcohol is considered a contributing factor in the commission of a
variety of other criminal offenses.
Although some of the data indicate a decrease in occurrence, alcohol remains the primary
substance of abuse by adults in Iowa. The level of alcohol consumption within the state
increased slowly over the past thirteen years. The number of screenings/admissions to
substance abuse treatment programs with alcohol as the primary substance of abuse remains
disproportionately high. The number of OWI arrests and OWI court arbitrations continue to
burden the court system, representing 28.7% of the convictions for indictable misdemeanors
and felonies.
25,330
0
10,000
20,000
30,000
1996 1997 1998 1999 2000 2001 2002 2003 2004 2005 2006 2007 2008 2009 2010 2011
57.6%
42.4%
0%
20%
40%
60%
80%
1997 1999 2001 2003 2005 2007 2009 2011
Alcohol Other Substance

Drug Use Profile
Percent of Students Self-Reporting the Current Use of Alcohol, 1999 through
2010
Source: Iowa Department of Public Health, Division of Behavioral Health – IYS
Percent of Students Self-Reporting Ever Having Used Alcohol, 1999 through
2010
Source: Iowa Department of Public Health, Division of Behavioral Health – IYS
While there have been decreases in self-reported youth alcohol use since the 1999 Iowa Youth
Survey (IYS), the data indicate that in 2010 nearly one third (32%) of 11th graders surveyed
responded that they had consumed an alcoholic beverage in the past 30 days. The good news
overall however, is that both current and past alcohol use by students in all three of the grades
continues to decline or remain relatively steady.
Percent of Students Self-Reporting Current Binge Drinking,
1999 through 2010
Source: Iowa Department of Public Health, Division of Behavioral Health – IYS
7%
22%
49%
2%
18%
44%
4% 14%
41%
5%
16%
36%
5% 13%
32%
0%
20%
40%
60%
6th Grade 8th Grade 11th Grade
1999 2002 2005 2008 2010
20%
43%
75%
17%
38%
71%
15%
32%
67%
15%
32%
63%
12% 27%
57%
0%
50%
6th Grade 8th Grade 11th Grade
1999 2002 2005 2008 2010
3%
14%
40%
3%
12%
36%
2% 8%
32%
1% 8%
27%
2% 8%
24%
0%
20%
40%
6th Grade 8th Grade 11th Grade
1999 2002 2005 2008 2010

Drug Use Profile
Current (over the past 30 days) binge drinking (consuming five or more drinks at one time) by
youth in grades 6, 8, and 11 as reported in the Iowa Youth Survey has decreased since 1999.
However, over one quarter of 11th graders reported binge drinking in the past month in the
2008 survey. Iowa also reports a higher binge drinking rate among youth than the national rate.
According to the 2009 National Survey on Drug Use and Health (NSDUH) data, 17% of 16-17 year
olds nationally reported binge drinking within the past thirty days, versus 27% of 11th graders in
Iowa. This finding mirrors Iowa’s above average binge drinking rate among adults.
The IDPH, Division of Behavioral Health, SARS/I-SMART substance abuse reporting system data
report the primary substance of abuse for all screens/admissions to substance abuse treatment
programs, including those of youths. Unlike the adult population, youth screens/admissions
with alcohol identified as the primary substance of abuse make up only 28.3% of the total.
Percentage of Youth Screens/Admissions to Substance Abuse Treatment
Programs with a reported Primary Substance of Abuse of Alcohol, SFY 1997 –
2011
Source: Iowa Department of Public Health, Division of Behavioral Health – SARS/I-SMART
For the fifteen-year reporting period, juvenile OWI arrest rates have ranged from 27 to 48
per 100,000 in population. Reports for the past four years have shown a decline, to a low of
27.
Arrest Rates for Persons Under 18 Years of Age for OWI
per 100,000 Youth Iowa Residents, CY 1994 – 2009
Source: Iowa Department of Public Safety
Based on self-reported use, substance abuse treatment screens/admissions and arrest rates, it
would appear that while positive strides are being made, alcohol remains a substantial problem
for the youth of Iowa.
28.3%
71.7%
0%
20%
40%
60%
80%
1997 1999 2001 2003 2005 2007 2009 2011
Alcohol
OtherSubstance
29
44 46 48 46 44 42 37 47 46 47
33 46
37 33 27
0
20
40
60
1994 1995 1996 1997 1998 1999 2000 2001 2002 2003 2004 2005 2006 2007 2008 2009

Drug Use Profile
Illegal Drug Use in Iowa – General Indicators of the Trends in Drug Abuse
One indicator of illegal drug use in Iowa is the number of adults seeking substance abuse
treatment for a primary substance of abuse other than alcohol. This number has continued to
rise over the past eighteen years, and reached a new high in 2011.
Substance Abuse Treatment Program Screenings/Admissions for Adults with
a Primary Substance Other Than Alcohol, SFY 1996 - 2011
Source: Iowa Department of Public Health, Division of Behavioral Health – SARS/I-SMART
Another indicator is derived from data collected by the Department of Public Safety relative to
the adjusted arrest rate per 100,000 in population for drug related offenses. While a slight
reduction was reported in each of the past six years, the arrest rate for drug offenses remains
far higher than the rate reported by DPS in 1994.
Adult Arrest Rate/100,000 Population for Drug Offenses, CY 1994 – 2009
Source: Iowa Department of Public Safety
Data collected by the Division of Criminal and Juvenile Justice Planning illustrate two additional
facets of the trends in substance abuse as they relate to Iowa’s District Court System. These
data are displayed in the figures below, and include indictable misdemeanors and felonies.
Drug Charges Disposed, CY 1999 – 2010
Source: Criminal and Juvenile Justice Planning
*Charges and convictions do not include cases which deferred judgment resulted in the removal of the record prior to the analysis of
the data. As a result, the data may underreport the number of charges and convictions.
18,626
0
5,000
10,000
15,000
20,000
25,000
1996 1997 1998 1999 2000 2001 2002 2003 2004 2005 2006 2007 2008 2009 2010 2011
23
4.8
34
4.2
37
0.9
43
7.7
45
8.2
47
4.9
47
6.4
46
2.7
53
7.5
53
6.4
52
3.5
52
3.3
46
9.2
46
6.1
42
4.2
38
6.4
0
200
400
600
1994 1995 1996 1997 1998 1999 2000 2001 2002 2003 2004 2005 2006 2007 2008 2009
24,408
0
20000
40000
1999 2000 2001 2002 2003 2004 2005 2006 2007 2008 2009 2010

Drug Use Profile
The number of indictable drug charges disposed by the Iowa District Court peaked in 2004 and
has varied since. However, it is important to note that this number is back on the rise.
Drug related convictions have followed the same trend. Drug cases constitute a significant
proportion of the court docket in Iowa, representing 29.8% of the charges and 25.9% of the
convictions in CY 2010.
Drug Convictions, CY 1999 – 2010
Source: Criminal and Juvenile Justice Planning
Another indicator of the levels of use and abuse of drugs can be found in drug-related prison
admissions collected by the Division of Criminal and Juvenile Justice Planning. This data shows a
248% increase in drug-related prison admissions from 1995 to 2004. Beginning in 2005, drug
related prison admissions began to decline largely due to a drop in methamphetamine-related
admissions, which was driven by a decline in methamphetamine lab incidents. However, with a
recent resurgence of methamphetamine lab incidents, drug-related prison admissions are again
on the rise.
It should be noted that data in this section does not include alcohol. As the most abused
substance in Iowa, including alcohol would significantly increase these figures.
Drug-Related Prison Admissions, FY 1995 – 2011
Source: Criminal and Juvenile Justice Planning
The data in this figure relate to the number of offenders admitted to prison with a drug offense
as their lead charge. In a study conducted by the Mid-Eastern Council on Chemical Abuse for
the Iowa Department of Corrections, over 75% of those entering the state correctional system
were found to be in need of substance abuse treatment. In 2011, the Department of
13,003
0
3,000
6,000
9,000
12,000
15,000
18,000
1999 2000 2001 2002 2003 2004 2005 2006 2007 2008 2009 2010
316 478 533
651 663 839 901
959 1,091
1,110 1,049
988 882
795 693
797 880
0
300
600
900
1200
1500
1995 1997 1999 2001 2003 2005 2007 2009 2011

Drug Use Profile
Corrections provided substance abuse treatment to only 52.4% of the addicted custodial
inmates and 49.6% of the addicted offenders in community corrections.
Department of Corrections Institutional and Community-Based
Substance Abuse Treatment FY 2003 – FY 2011
2003 2004 2005 2006 2007 2008 2009 2010 2011
Institutions
Inmates in need of treatment
3,556 4,074 4,369 4,713 4,374 4,441 4,440 3,887 3,903
Inmates who received treatment
2,279 2,646 2,669 2,936 2,618 2,615 2,535 2,235 2,046
Percent 64% 64.9% 61.1% 62.3% 59.9% 58.9% 57.1% 57.5% 52.4%
Community Corrections
Clients in need of treatment
8,762 10,299 11,920 12,650 12,921 13,047 12,434 12,509 11,660
Clients who received treatment
4,734 5,413 5,855 6,201 6,367 6,315 6,243 6,176 5,782
Percent 54.0% 52.6% 49.1% 49.0% 49.3% 48.4% 50.2% 49.4% 49.6%
Source: Iowa Department of Corrections
A significant portion of the drug abusing population in Iowa is in the child rearing age group.
Studies have shown that children raised in drug-involved families are at a heightened risk for a
variety of types of abuse and neglect. The Iowa Department of Human Services (DHS) reports
on two measures of abuse that specifically relate to parent/caregiver involvement with drugs.
The first of the indicators is the number of confirmed or founded child abuse cases resulting
from the presence of illegal drugs in a child’s body and the second is the number of confirmed
or founded child abuse cases resulting from a parent/caregiver manufacturing a dangerous drug
in the presence of a child.
Confirmed or Founded Child Abuse Involving the Presence of Illegal Drugs
in a Child’s Body CY 2001 - 2010
Source: Department of Human Services
*Beginning in 2006, DHS reported Confirmed and Founded Abuse together. Previous years in this chart show only Confirmed cases.
*Beginning in 2008 DHS began drug testing fewer children (see below).
The number of confirmed or founded child abuse cases involving the presence of illegal drugs in
a child’s body rose sharply from 2001 to 2004. In the years since, the number of reported cases
678 846
1,501 1,713 1,354 1,481
1,173
633 689 827
0
400
800
1,200
1,600
2,000
2001 2002 2003 2004 2005 2006 2007 2008 2009 2010

Drug Use Profile
has varied. In 2008, DHS discontinued the practice of testing all children for the presence of
drugs, which may account for some of the significant drop in numbers.
While a relatively new measure, the number of confirmed or founded child abuse cases
involving a caretaker’s manufacturing of illegal drugs, specifically methamphetamine, decreased
from 2003 to 2007. This number, like other methamphetamine statistics, was driven down by
the reduction in methamphetamine labs across the State. However, along with the recent
resurgence in methamphetamine lab incidents, the number of children affected by
methamphetamine labs has also risen.
Confirmed or Founded Child Abuse Involving Caretaker’s
Manufacture of Illegal Drugs CY 2002-2010
Source: Department of Human Services
*Beginning in 2006, DHS reported Confirmed and Founded Abuse together. Previous years this chart show only Confirmed cases.
Elsewhere in the Drug Use Profile regarding the youth population of Iowa, there is discussion
about drugs other than alcohol and tobacco. In these discussions, it should be understood that
the term “drug(s)” refers to illicit substances such as methamphetamine, cocaine,
THC/marijuana, etc. Discussion referring specifically to prescription or over- the-counter
medications will be noted.
Data are currently collected reflecting the general trend in youth substance abuse in Iowa. One
general indicator of the trend of substance abuse among youth can be found in the rate of
juvenile arrests reported for drug offenses. The arrest rate rose from 79 per 100,000 in
population in 1994 to a record 265 per 100,000 in 2007, an increase of 235% for that period.
Juvenile Arrest Rate per 100,000 Juvenile Residents for Drug Offenses,
CY 1994 – 2009
Source: Iowa Department of Public Safety
325 353 299
128 107 56
110 86 169
0
100
200
300
400
500
2002 2003 2004 2005 2006 2007 2008 2009 2010
79 118
183 211 229 238 240 237 252 241 222 239 233 265 228.6 210.3
0
100
200
300
1994 1995 1996 1997 1998 1999 2000 2001 2002 2003 2004 2005 2006 2007 2008 2009

Drug Use Profile
Prescription and Over the Counter Medications
The newest, and fastest growing, form of substance abuse by Iowans involves prescription and
over-the-counter medicines. Teenagers tend to view these drugs as “safe,” and many parents
are not yet aware of their potential for abuse. Stories of teens sharing pills to get high are
increasingly common in Iowa communities. These drugs are easy to get, can be as potent and
dangerous as illicit drugs, and are associated with criminal behavior. Prescription drugs most
often abused are narcotic painkillers, stimulants, and central nervous system depressants. The
Iowa Department of Public Safety, Division of Narcotics Enforcement (DNE), opened 83
pharmaceutical diversion cases and seized 7,407 dosage units over two fiscal years (2010 and
2011). Treatment centers anecdotally report a dramatic increase in prescription drug abuse
clients. And, according to the 2010 Iowa Youth Survey, 7% of Iowa 11th graders have used
prescription drugs for non-medicinal purposes.
The trends are clear. According to the Partnership at Drugfree.org, 2010 Partnership Attitudes
Tracking Survey (PATS), one in four teens (25 percent) nationally report intentionally abusing
prescription drugs to get high at least once in their lives. According to the 2010 National Survey
on Drug Use and Health (NSDUH), there were 2.4 million persons aged 12 or older who used
psychotherapeutics non-medically for the first time within the past year, which averages out to
around 6,000 initiates per day. In 2010, past-year initiation of prescription drugs exceeded that
of marijuana.
The Iowa Prescription Monitoring Program (PMP) indicates possible doctor shopping and/or
pharmacy hopping to obtain excessive amounts of prescription drugs. In 2010, there were 2,016
Iowans that filled CII – CIV prescriptions from 5 or more prescribers or pharmacies. Only 17% of
prescribers, such as physicians, have registered for access to the PMP. Pharmacists are required
to submit data, but not to consult the PMP when filling a prescription. Iowa overdose deaths
from “other opioids” – which include hydrocodone and oxycodone – increased more than
1,233%, from 3 deaths in 2000 to 40 deaths in 2009.
Attitude drives behavior. Many teens and adults have a false sense of security about
prescription and over-the-counter drugs. This attitude leads them to believe that using these
drugs is not dangerous, or at least not as dangerous as using drugs like methamphetamine or
heroin. This in turn leads them to wrongly believe that using a medicine without a prescription
once in a while is not harmful, that abusing prescription pain killers will not cause addiction, and
that getting high from cough syrup isn’t risky. These substances are also widely available and are
often obtained within the home. Additionally, many parents and other adults do not
understand the behavior of intentionally abusing medicine to get high, and are not discussing
the risks of this behavior with their children. According to the 2010 PATS results, only 22% of
parents are talking to their children about the dangers of using prescription drugs without a
prescription.

Drug Use Profile
Percent of Student Self-Reporting the Current Non-Medical Use of
Prescription Medications (2005, 2008, and 2010)
Source: Iowa Department of Public Health, Division of Behavioral Health – IYS
Percent of Student Self-Reporting the Current Non-Medical Use of
Over-the-Counter Medications (2005, 2008, and 2010)
Source: Iowa Department of Public Health, Division of Behavioral Health – IYS
Painkillers (e.g., hydrocodone and oxycodone) seem to be the favorite targets of thieves who
steal from medicine cabinets and pharmacies. In Iowa, public calls to the Statewide Poison
Control Center to identify hydrocodone and oxycodone pain pills have increased 2,232% since
2002, and officials with the center believe some of that increase signifies the growing diversion
and abuse of prescription drugs in Iowa.
Hydrocodone and Oxycodone ID Calls from Iowans (Iowa SPCC-CYs)
Source: Iowa Statewide Poison Control Center
The U.S. Drug Enforcement Administration notes that hydrocodone is the most commonly
diverted and abused controlled pharmaceutical in the U.S. According to data from the
Prescription Drug Monitoring Program, hydrocodone is the most prescribed drug in Iowa with
1%
3%
7%
2%
4%
7%
2% 3%
7%
0%
5%
10%
6th Grade 8th Grade 11th Grade
2005 2008 2010
1% 3%
7%
2% 4%
7%
2% 3%
5%
0%
5%
10%
6th Grade 8th Grade 11th Grade
2005 2008 2010
265 544 649 873 1,450
2,354
3,512
5,648 6,180
0
2,000
4,000
6,000
2002 2003 2004 2005 2006 2007 2008 2009 2010

Drug Use Profile
over 68 million doses prescribed to Iowans in 2010 – comprising nearly 30% of all Schedule II –
Schedule IV controlled substances prescribed in the State of Iowa. When combined with
oxycodone, the number of doses prescribed to Iowans in 2010 totals almost 89,500,000 or
38.2% of all CII – CIV controlled substances prescribed.
Doses of Controlled Substances Prescribed to Iowans in CY 2010 (IBPE)
Source: Iowa Board of Pharmacy
Marijuana
Data indicate that marijuana is the most prevalent illegal drug and after alcohol, the second
most used/abused substance by adults in Iowa. It also appears as though marijuana has held
this distinction for quite some time.
One indicator of the use of illegal drugs, such as marijuana, can be found in the number of drug
offenses reported to the Department of Public Safety by law enforcement agencies for the
manufacture/distribution and the possession/use of the drug.
Hydrocodone 68,396,346
Alprazolam, 25,531,513
Oxycodone, 21,081,065
Lorazepam, 14,756,746
Clonazepam, 14,288,278
Methylphenidate, 13,585,575
Amphetamine, 10,540,533
Codeine, 6,558,554
Propoxyphene, 8,432,426
Zolpidem, 11,009,001
All Other CII - CIV, 40,054,023

Drug Use Profile
Reported Offenses of Manufacture/Distribution of Drugs by Known Drug Type,
CY 1996 - 2009
Source: Iowa Department of Public Safety
Reported Offenses of Possession/Use of Drugs by Known Drug Type,
CY 1996 –2009
Source: Iowa Department of Public Safety
These figures illustrate the prevalence of marijuana as the single illegal drug for which most
offenses are reported by law enforcement. In CY 2009, nearly 51% of reported arrests for
offenses of manufacture/distribution of drugs, where the drug type was known, involved
marijuana. Further, 73.7% of reported offenses for possession/use of drugs, where the drug
type was known, involved marijuana.
Law enforcement officials have also reported that the potency of marijuana has increased in
recent years. The Division of Criminal Investigation Laboratory reports that most of the
marijuana it currently sees is made up primarily of the buds of the female plants, versus
marijuana of the past which also contained inactive particles such as leaves and stems. The
685
0
200
400
600
800
1000
1996 1997 1998 1999 2000 2001 2002 2003 2004 2005 2006 2007 2008 2009
Marijuana/THC
Meth/Amphet
Cocaine
Other Drugs
7,324
0
2,000
4,000
6,000
8,000
10,000
1996 1997 1998 1999 2000 2001 2002 2003 2004 2005 2006 2007 2008 2009
Marijuana/THC
Meth/Amphet
Cocaine
Other Drugs

Drug Use Profile
buds contain the delta-9-tetrahydrocannabinol (THC), which is the primary psychoactive
chemical in marijuana. This change represents a significant increase in the potency of this drug
which is expected to have more acute personal and societal consequences.
Additional analysis of the data indicates that the number of offenses involving possession or use
of marijuana increased steadily from 1994 to 2007. 2008 was the first year Iowa saw a decrease
in that number, but it rose again in 2009. The Iowa Department of Public Safety (DPS) reported a
new high in marijuana seizures in 2008. Marijuana seizures reported by DPS have fluctuated,
but generally remain significantly higher than that reported in the mid and late 1990s. According
to the DPS, marijuana submission rates are up 17%, but the average weight of samples
submitted is down. There have been much fewer large cases, such as highway drug interdiction
stops, than in past years.
Marijuana Seizures, in Pounds, in Incidents Involving the Iowa Division of
Narcotics Enforcement, CY 1995 – *2011
*Calendar year 2011 through September 15
Source: Iowa Department of Public Safety
The prevalence of marijuana use is further demonstrated by the adult screenings/admissions to
substance abuse treatment programs in Iowa. In data collected during those
screenings/admissions, marijuana was the most often reported primary drug of use/abuse,
other than alcohol, for adults during the period of SFY 1996 – 2011. This data reinforces the fact
that despite misconceptions by some, marijuana can be an addictive drug.
Primary Drug of Abuse for Adults Screened or Admitted to
Substance Abuse Treatment Programs, SFY 1996 – 2011
Source: Iowa Department of Public Health, Division of Behavioral Health – SARS/I-SMART
751
1,967
1,018 520
1,052
3,035
736
2,596 2,399 2,157
728
2,389
3,946 3,984
1,284
2,558
1,335
0
1,000
2,000
3,000
4,000
5,000
1995 1997 1999 2001 2003 2005 2007 2009 *2011
34,253
9,703
0
10,000
20,000
30,000
40,000
1996 1998 2000 2002 2004 2006 2008 2010
OtherSubstanceMarijuana

Drug Use Profile
Between state fiscal year 1996 and 2010, the IDPH, Division of Behavioral Health, reported a
75.9% increase in the number of clients screened/admitted with marijuana as their primary drug
of choice.
Marijuana-Related Prison Admissions SFY 2004 - 2011
Source: Criminal and Juvenile Justice Planning
For the period of time for which data is available, marijuana-related prison admissions increased
from 16% to nearly 29% of the drug related admissions. Based on the data presented in this
section, it is clear that marijuana is the drug of choice for the majority of adult Iowans who use
illegal drugs; however, comparatively few are admitted to prison with a primary charge related
to marijuana.
In a recent review of Iowa workplace drug test results, marijuana was the drug for which Iowa
workers most frequently tested positive. Of the positive drug tests reported to the Iowa
Department of Public Health over the past 7 years, nearly 60% were positive for marijuana. The
next most prevalent drug was methamphetamine, at 15.8%.
The Iowa Youth Survey shows that marijuana is the illicit drug of choice among youth.
Marijuana use has remained constant. 17% of 11th graders surveyed in 1999 reported current
use of marijuana. In 2010, 13% of 11th graders reported current use of marijuana, only a 4
percentage point decrease from 1999.
Percent of Students Self-Reporting the Current Use of Marijuana, 1999
through 2010
Source: Iowa Department of Public Health, Division of Behavioral Health – IYS
221 172 205 193 201 200 227 250
0
200
400
2004 2005 2006 2007 2008 2009 2010 2011
1%
6%
17%
1% 5%
15%
0% 3%
13%
1% 3%
13%
1% 4%
13%
0%
10%
20%
30%
6th Grade 8th Grade 11th Grade
1999 2002 2005 2008 2010

Drug Use Profile
Additionally, of the high school juniors surveyed in 1999, 35% reported having used marijuana at
some point in their lifetime. This dropped to 26% in 2010.
Percent of Students Self-Reporting Ever Having Used Marijuana, 1999 through
2010
Source: Iowa Department of Public Health, Division of Behavioral Health – IYS
Substance abuse reporting system data also illustrate that marijuana is the primary illicit drug of
choice among Iowa youth, and that its prevalence as the drug of choice for this population has
generally increased for the period of time included in this review. It should be noted that in SFY
2011, the greatest percentage of youth ever (64.9%) were screened/admitted for marijuana.
Percentage of Youth Screenings/Admissions to Substance Abuse Treatment
Programs with Marijuana as Primary Drug SFY 1996 – 2011
Source: Iowa Department of Public Health, Division of Behavioral Health – SARS/I-SMART
2% 11%
35%
1% 9%
34%
3% 9%
33%
1% 7%
27%
1% 7%
26%
0%
20%
40%
6th Grade 8th Grade 11th Grade
1999 2002 2005 2008 2010
64.9%
0%
20%
40%
60%
80%
100%
1996 1997 1998 1999 2000 2001 2002 2003 2004 2005 2006 2007 2008 2009 2010 2011

Drug Use Profile
Amphetamine/Methamphetamine
Iowa Division of Narcotics Enforcement Methamphetamine Seizures in Grams,
CY 1994 – *2011
*Calendar year 2011 through September 15
Source: Iowa Department of Public Safety
This figure illustrates a significant increase in methamphetamine seizures in Iowa beginning in
1997. In 2003, the Iowa Department of Public Safety, Division of Narcotics Enforcement, seized
a record 174 kilograms of methamphetamine. Since its peak in 2003, seizures of
methamphetamine decreased every year until 2008. As the number of methamphetamine labs
gradually increases again, so does the number of grams seized – as illustrated by 2010 data.
The data displayed below demonstrate the impressive growth in the number of
methamphetamine laboratory incidents responded to by state and local law enforcement
through calendar year 2004. In 2004, state and local law enforcement responded on average to
125 methamphetamine laboratories per month, or four per day. The rapid decline of
methamphetamine lab incidents hit a low in 2007. But, there has been a 71.3% rise in
methamphetamine lab activity since then. One new development that may affect the
prevalence of methamphetamine labs in the future is the emergence of new methods of
manufacturing methamphetamine, called “shake ‘n bake” and “one-pot” cooks. These methods
generally use less pseudoephedrine and produce methamphetamine in smaller quantities, but
are no less dangerous than other production methods. They are fast, portable, and unstable.
The remnants can easily be transported in a vehicle and disposed of in neighborhoods and
ditches. Aside from its environmental impact, it poses a hazard to children and unsuspecting
Iowans who come into contact with the waste or are impacted by flash fires from these cooks.
Due to their public safety threat, a substantial amount of time and resources is directed at
responding to clandestine laboratories. In 2005, the Iowa Legislature passed legislation limiting
the availability of pseudoephedrine, a key ingredient in the illegal manufacture of
methamphetamine. In 2009, the Iowa Legislature passed legislation requiring all pharmacies in
the state that sell pseudoephedrine products over-the-counter to participate in an electronic
Pseudoephedrine Tracking System.
4,5
45
18
,22
7
16
,60
2
52
,47
2
70
,65
8
61
,51
5
39
,86
3
73
,36
5
58
,70
1 1
74
,11
5
12
6,3
56
67
,90
9
43
,77
5
30
,12
0
31
,08
0
18
,30
2
30
,60
4
13
,90
8
0
50,000
100,000
150,000
200,000
250,000

Drug Use Profile
State and Local Methamphetamine Clandestine Laboratory Responses,
CY 1994 – 2011* YTD
*Calendar year 2011 through September 30
Source: Iowa Department of Public Safety
Beginning September 1, 2010, Iowa implemented an electronic Pseudoephedrine Tracking
System (PTS). The PTS is a real-time tracking system, but because of the robust information
contained within the system, it is used by virtually all Iowa pharmacies as a stop-sale system.
That is, transactions are immediately added to the system and the system will direct the
pharmacist to prevent a sale from taking place if the daily or monthly limits are exceeded.
Blocking sales in real-time prevents smurfing and consequently the production of
methamphetamine. Since the start-up of the PTS, more than 21,000 illegal purchase attempts
have been blocked, preventing the sale of over 123 pounds of pseudoephedrine, and averting
an estimated 450 additional meth labs in the first year of the system’s operation.
8 31 63
320
805 660
768 1,009
1,195 1,500 764
345
178 201 267 305 257
0300600900
1,2001,5001,800
1995 1997 1999 2001 2003 2005 2007 2009 2011*

Drug Use Profile
Another indicator of the availability of methamphetamine is the price and purity of seizures.
Price and purity correspond to the simple economic principals of supply and demand. The price
and purity of methamphetamine indicate that the price of methamphetamine per gram has
fluctuated over the past several years. While the purity level was reduced in the late
1990s/early 2000s, recent reports show a higher purity level for Iowa seizures. Crystal
methamphetamine smuggled into Iowa from Mexico and the Southwest U.S. has grown in
recent years. The increase in crystal methamphetamine or “ice” is disturbing due to the fact
that ice is typically much purer than its powder counterpart. The physical, psychological,
addictive, and social impact of this purer form of the drug is expected to be more acute. The
new one-pot and shake-n-bake methods of producing methamphetamine are also reportedly
producing purer methamphetamine. Methamphetamine purity is at an all-time high of 89%.
Iowa Division of Narcotics Enforcement Methamphetamine Seizure
Price and Purity CY 1996 – 2011
1996 1998 2000 2002 2004 2006 2008 2010 2011
Price $135 N/A $90 $100 $100 $120 $123 $130 $130
Purity 43% 14% 25% 16% 33% 40% 40% 79% 89% Source: Iowa Counterdrug Task Force
Percentage of Adults Screened/Admitted to Substance Abuse Treatment with
Methamphetamine as the Primary Drug of Abuse SFY 1996 – 2011
Source: Iowa Department of Public Health, Division of Behavioral Health – SARS/I-SMART
Prior to the emergence of what has been referred to as Iowa’s “methamphetamine epidemic” in
1994 and 1995, the percent of adults screened/admitted with methamphetamine as the
preliminary substance of abuse was under 3%. Since that time, according to the IDPH Division of
Behavioral Health, adult methamphetamine screenings/admissions have varied from 9.1% to
15.8%. As a percent of all screens/admissions, methamphetamine had diminished until 2008
when it reached its lowest point (8.5%) since the methamphetamine epidemic began. However,
along with the recent increase in methamphetamine lab activity, the percentage has risen to
10.4%.
10.4%
0%
4%
8%
12%
16%
20%
1996 1997 1998 1999 2000 2001 2002 2003 2004 2005 2006 2007 2008 2009 2010 2011

Drug Use Profile
Methamphetamine-Related Prison Admissions SFY 2004 - 2011
Source: Criminal and Juvenile Justice Planning
Along with the rise in methamphetamine lab incidents, the number of methamphetamine
related prison admissions is on the rise again. From 2004 to 2009, methamphetamine-related
prison admissions had decreased 57.9%. This reduction had driven down the drug-related
prison admissions reported in recent years.
Law Enforcement Reported Offenses of Manufacture/ Distribution and
Possession/Use of Methamphetamine, CY 1994 – 2009
Source: Iowa Department of Public Safety
With the resurgence in methamphetamine lab incidents across the state, the numbers of
offenses involving both manufacturing/distribution and possession/use have begun to rise. The
number of law enforcement reported offenses for methamphetamine possession/use nearly
doubled from 1999 to 2002 and remained at this high level for the next three reporting periods,
but have since declined. Following the passage of the pseudoephedrine control legislation in
2005, arrests for methamphetamine manufacture/distribution as well as possession/use
declined significantly until 2008 (43.6% and 49.2% respectively).
According to the 2008 Iowa Youth Survey amphetamine and methamphetamine use among the
younger population has remained relatively stable. The percentage of eleventh grade students
reporting “ever” using these drugs dropped from 17% to 9% - an indication that fewer students,
although still too many, are using these drugs.
711 702 571
448 343 304 358 416
0
300
600
900
2004 2005 2006 2007 2008 2009 2010 2011
143
293 283 455 425 475 476
606 667 646 618 372 302
189 222 232 429
1,028 814
1,282 1,087 928 1,020
1,320
1,729 1,783 1,782 1,808
1,251 1,019
804 843
0
400
800
1,200
1,600
2,000
1994 1995 1996 1997 1998 1999 2000 2001 2002 2003 2004 2005 2006 2007 2008 2009
Manufacture/Distribution
Possession/Use

Drug Use Profile
Percent of Students Self-Reporting Ever Having Used
Amphetamine/Methamphetamine, 1999 through 2010
Source: Iowa Department of Public Health, Division of Behavioral Health – IYS
Percent of Student Self-Reporting the Current Use of
Amphetamine/Methamphetamine, 1999 through 2010
Source: Iowa Department of Public Health, Division of Behavioral Health – IYS
Following several years of increasing youth screening/admissions for amphetamine or
methamphetamine, the IDPH Division of Behavioral Health reported a significant reduction in
SFY 2009, and the number has remained low for the 2010.
Percentage of Youth Screenings/Admissions to Substance Abuse Treatment
Programs with Amphetamine/Methamphetamine as Primary Drug SFY 1996 –
2011
Source: Iowa Department of Public Health Division of Behavioral Health – SARS/I-SMART
2% 5%
17%
2% 3%
13%
0% 1%
10%
2% 3%
9%
1% 2% 5%
0%
10%
20%
6th Grade 8th Grade 11th Grade1999 2002 2005 2008 2010
0%
3%
7%
0%
2%
7%
0% 1%
3%
0%
2% 3%
0% 1%
3%
0%
5%
10%
6th Grade 8th Grade 11th Grade
1999 2002 2005 2008 2010
1.4%
0%
2%
4%
6%
8%
10%
1996 1997 1998 1999 2000 2001 2002 2003 2004 2005 2006 2007 2008 2009 2010 2011

Drug Use Profile
Cocaine/Crack Cocaine
Until the growth in the use of methamphetamine in the 1990s, the second most prevalent illegal
drug in Iowa was cocaine or crack cocaine. Overshadowed by the use of methamphetamine,
cocaine represents a smaller but significant problem.
Law Enforcement Reported Offenses of Manufacture/ Distribution and
Possession/Use of Cocaine/Crack Cocaine, CY 1994 – 2009
Source: Iowa Department of Public Safety
Cocaine possession/use offenses were at a fourteen year high in 2006 but have decreased over
the past three years. This figure illustrates that arrest rates for cocaine have varied a great deal
for the years examined. In calendar year 2005, manufacture/distribution arrests posted a
twelve year low of 143 per 100,000 in population.
The amount of cocaine/crack cocaine seized in incidents involving the Iowa Division of Narcotics
Enforcement reached a 14-year high in 2005. Cocaine/crack cocaine seizures have fluctuated
greatly since then. In 2008 and 2010, DNE reports having several large cases involving cocaine.
So far in 2011, there have been fewer large cases of cocaine/crack seizures.
Cocaine/Crack Cocaine Seizures, in Grams,
Involving the Iowa Division of Narcotics Enforcement CY 1994 – *2011
*Calendar year 2010 through September 15
Source: Iowa Department of Public Safety
233 175 255 195 243 291
197 255 250 214 226 143
250 234 275 197
600 595 716
616 624 651 617 523
663 637 756
876 988
842 710
528
0
200
400
600
800
1,000
1,200
1994 1995 1996 1997 1998 1999 2000 2001 2002 2003 2004 2005 2006 2007 2008 2009
Manfacture/Distribute
Possession/Use
4,8
20
6,1
05
15
,49
3
14
,37
9
16
,67
5
14
,81
8
2,4
41
33
,69
4
53
,04
9
28
,44
6 13
1,6
02
58
,28
5
40
,17
8
20
7,2
75
18
,56
2
10
8,5
05
12
,39
5
040,00080,000
120,000160,000200,000240,000
1995 1997 1999 2001 2003 2005 2007 2009 2011*

Drug Use Profile
As shown below, the price of cocaine has fluctuated from a low of $80 to a high of $150 over the
past nine years.
Iowa Division of Narcotics Enforcement Cocaine Seizure Price
CY 1996 – 2011
1996 1998 2000 2002 2004 2006 2008 2010 2011
Price $130 $130 $150 $150 $100 $110 $80 $125 $125 Source: Iowa Counterdrug Task Force
The primary substance of abuse for individuals assessed with or seeking treatment for substance
use/abuse issues may also be indicative of the level of prevalence of a specific drug. The figure
below illustrates that the percentage of adults entering substance abuse treatment programs
with cocaine as their primary substance of abuse has slightly decreased in the past four years.
Percentage of Adults Entering Substance Abuse Treatment Programs with a
Primary Substance of Abuse of Cocaine, SFY 1996 – 2011
Source: Iowa Department of Public Health, Division of Behavioral Health – SARS/I-SMART
Cocaine/Crack Cocaine-Related Prison Admissions SFY 2004 – 2011
Source: Criminal and Juvenile Justice Planning
Cocaine-related admissions to prison represented 17.2% of drug-related prison admissions in FY
2011. Based on the data indicators illustrated above, it would appear that cocaine/crack
cocaine continues to represent a drug of substantial use/abuse among the drug using
population in Iowa.
There is little reported use of cocaine/crack cocaine by Iowa youth. Overall there was little change in cocaine usage between 1999 and 2008, but a large drop in reported usage occurred in 2010.
2.1%
0%
5%
10%
15%
20%
1996 1997 1998 1999 2000 2001 2002 2003 2004 2005 2006 2007 2008 2009 2010 2011
152 149 181 213 212 154 148 151
0
100
200
300
2004 2005 2006 2007 2008 2009 2010 2011

Drug Use Profile
Percent of Student Self-Reporting the Current Use of Cocaine,
1999 through 2010
Source: Iowa Department of Public Health, Division of Behavioral Health – IYS
Percent of Students Self-Reporting Ever Having Used Cocaine,
1999 through 2010
Source: Iowa Department of Public Health, Division of Behavioral Health – IYS
Data depicting the prevalence of cocaine/crack cocaine as the primary substance of abuse
among juveniles screened/admitted to substance abuse treatment programs is shown below.
Percentage of Youth Screenings/Admissions to Substance Abuse Treatment
Programs Reporting Cocaine/Crack Cocaine as the Primary Substance of
Abuse SFY 1996 – 2011
Source: Iowa Department of Public Health, Division of Behavioral Health – SARS/I-SMART
These data indicate that the prevalence of cocaine/crack cocaine as the primary substance of abuse within the youth substance abusing community remains low and relatively constant during the reviewed period.
0% 1% 3%
0% 1% 3%
0% 1% 2% 0% 1% 2%
0% 1% 2%
0%
10%
6th Grade 8th Grade 11th Grade
1999 2002 2005 2008 2010
1% 2%
7%
1% 2%
6%
0% 1%
6%
1% 1%
5%
1% 1%
4%
0%
5%
10%
6th Grade 8th Grade 11th Grade1999 2002 2005 2008 2010
0.3%
0%
2%
4%
6%
8%
10%
1996 1997 1998 1999 2000 2001 2002 2003 2004 2005 2006 2007 2008 2009 2010 2011
Drug Use Profile
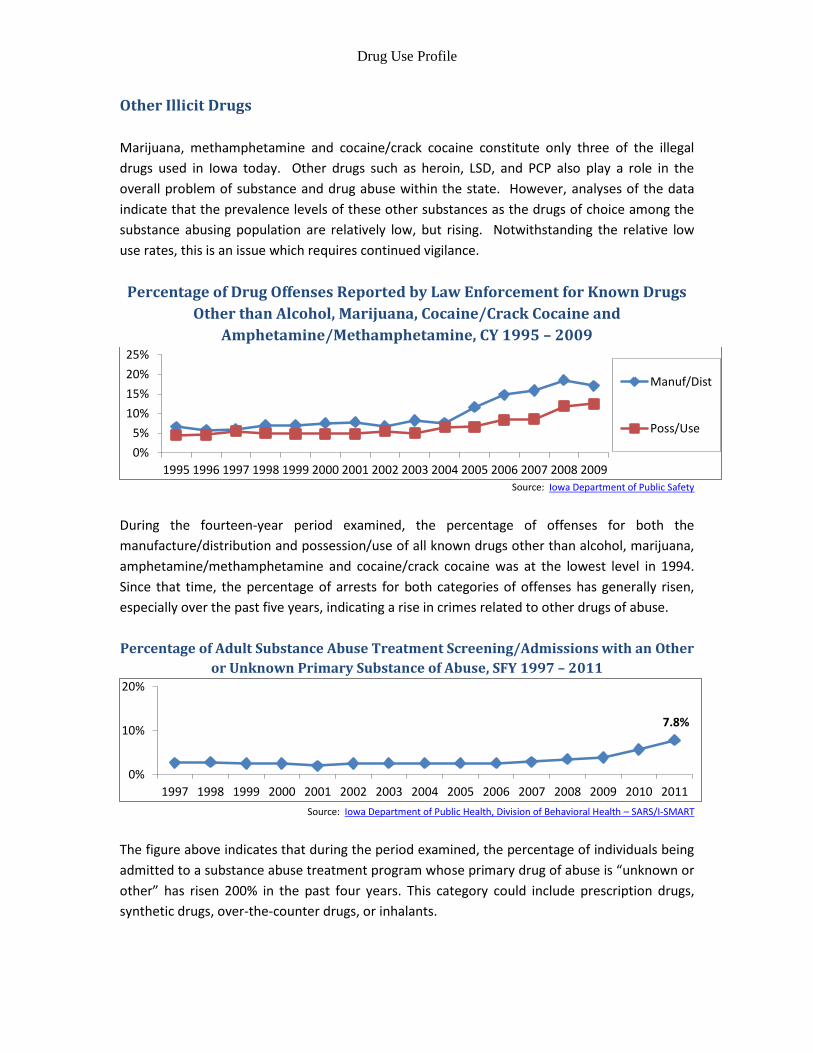
Other Illicit Drugs
Marijuana, methamphetamine and cocaine/crack cocaine constitute only three of the illegal
drugs used in Iowa today. Other drugs such as heroin, LSD, and PCP also play a role in the
overall problem of substance and drug abuse within the state. However, analyses of the data
indicate that the prevalence levels of these other substances as the drugs of choice among the
substance abusing population are relatively low, but rising. Notwithstanding the relative low
use rates, this is an issue which requires continued vigilance.
Percentage of Drug Offenses Reported by Law Enforcement for Known Drugs
Other than Alcohol, Marijuana, Cocaine/Crack Cocaine and
Amphetamine/Methamphetamine, CY 1995 – 2009
Source: Iowa Department of Public Safety
During the fourteen-year period examined, the percentage of offenses for both the
manufacture/distribution and possession/use of all known drugs other than alcohol, marijuana,
amphetamine/methamphetamine and cocaine/crack cocaine was at the lowest level in 1994.
Since that time, the percentage of arrests for both categories of offenses has generally risen,
especially over the past five years, indicating a rise in crimes related to other drugs of abuse.
Percentage of Adult Substance Abuse Treatment Screening/Admissions with an Other
or Unknown Primary Substance of Abuse, SFY 1997 – 2011
Source: Iowa Department of Public Health, Division of Behavioral Health – SARS/I-SMART
The figure above indicates that during the period examined, the percentage of individuals being
admitted to a substance abuse treatment program whose primary drug of abuse is “unknown or
other” has risen 200% in the past four years. This category could include prescription drugs,
synthetic drugs, over-the-counter drugs, or inhalants.
0%
5%
10%
15%
20%
25%
1995 1996 1997 1998 1999 2000 2001 2002 2003 2004 2005 2006 2007 2008 2009
Manuf/Dist
Poss/Use
7.8%
0%
10%
20%
1997 1998 1999 2000 2001 2002 2003 2004 2005 2006 2007 2008 2009 2010 2011

Drug Use Profile
All indications are that the drugs marijuana, methamphetamine and cocaine/crack cocaine are,
in the order indicated, the most used/abused illegal drugs by adult Iowans. Together, they
constitute the drugs involved in nearly 90% of the reported drug arrests. They also constitute
the primary illegal drugs listed for over 87.8% of adults screened/admitted for treatment.
So-called “club drugs” or “predatory drugs” such as Ecstasy, Rohypnol and Gamma-
Hydroxybutyrate (GHB) are rarely reported in Iowa. However, they warrant attention to prevent
larger problems.
Another emerging threat to the health and safety of Iowans is the use of synthetic drugs. These
substances, also known as synthetic cannabinoids and synthetic cathinones, are marketed as K2,
Spice, and bath salts. The cannabinoids are herbal substances that are sprayed with one or more
chemical compounds. They are marketed as incense and not for human consumption, but are
being used as a new way to get high. Bath Salts are the newest synthetic drug available,
mimicking the effects of cocaine. This year Governor Branstad signed into law Senate File 510
which added these bath salts, synthetic cannabinoids, and Salvia divinorum to the list of
Schedule I Controlled Substances and provided penalties.
Inhalants
Inhalant use continues to be of concern in Iowa, and inhalant use more often starts at younger
ages. The perception of risk related to inhalant use is dropping, which may contribute to
continued use. As attitudes toward inhalant abuse weaken, abuse is more likely to increase.
Percent of Student Self-Reporting the Current Use of Inhalants, 1999 through
2010
Source: Iowa Department of Public Health, Division of Behavioral Health – IYS
Percent of Students Self-Reporting Ever Having Used Inhalants, 1999 through
2010
Source: Iowa Department of Public Health, Division of Behavioral Health – IYS
2% 3% 3% 2% 3% 2% 2% 3% 2% 3% 4% 2% 2% 3% 2%
0%
5%
10%
6th Grade 8th Grade 11th Grade
1999 2002 2005 2008 2010
4% 9% 11%
4% 7% 9%
4% 7% 9%
6% 8% 9% 4%
7% 7%
0%
20%
6th Grade 8th Grade 11th Grade1999 2002 2005 2008 2010

Drug Use Profile
Examination of IDPH Division of Behavioral Health substance abuse reporting system data
indicate that the use of inhalants is more prominent among youth in comparison to adults. They
also indicate that the prevalence of these substances as a “drug of choice” for juveniles has
remained steady in recent years, representing less than one percent of youth
screened/admitted to substance abuse treatment.
Percentage of Screenings/Admissions to Substance Abuse Treatment
Programs with Inhalants Indicated as the Primary Substance of Abuse SFY
1996 – 2011
Source: Iowa Department of Public Health, Division of Behavioral Health – SARS/I-SMART
Tobacco
Tobacco, like alcohol, is a legal substance for adults under current federal and state law. Much
data and information have been published by the federal Centers for Disease Control and
Prevention, the Iowa Department of Public Health, American Lung Association and many other
organizations in attempts to inform the general public of the possible dire consequences
associated with the use of various tobacco products regardless of the method of use. Based on
analyses of the data compiled by these organizations, it is estimated that 265.6 of every 100,000
Iowa deaths are related to smoking – nearly 4,600 deaths annually. It is further estimated that
smoking results in the loss of 13.4 years of potential life.
Percentage of Current Iowa Male, Female & Total Smokers, CY 1989 - 2010
Source: Centers for Disease Control
The levels of tobacco use among adult Iowans can be seen above. These data, compiled by the
National Center for Chronic Disease Prevention and Health Promotion of the federal Centers for
Disease Control, are published as part of the Behavioral Risk Factor Surveillance System (BRFSS).
In 2010 the total percentage of combined male and female smokers in Iowa reached its lowest
point in twenty-one years. Part of this decline can be attributed to the 2007 tobacco tax
increase in Iowa. Other factors that may contribute to fewer cigarette sales in Iowa include: the
Iowa Smoke-free Air Act, the fire-safe cigarette requirement that took effect January 1st, 2009,
0.10%
0.60%
0%
5%
10%
1996 1997 1998 1999 2000 2001 2002 2003 2004 2005 2006 2007 2008 2009 2010 2011
Adults
Youths
0%
20%
40%
19
89
19
90
19
91
19
92
19
93
19
94
19
95
19
96
19
97
19
98
20
00
20
02
20
03
20
04
20
05
20
06
20
07
20
08
20
09
20
10
Male
Female
Total

Drug Use Profile
the federal cigarette tax rate increase that took effect April 1st, 2009, and the current economic
recession.
The Department of Public Health also reports that Quitline Iowa remains busy, with 7,129 clients
calling during FY 2011. Seventy-five percent of those clients were Medicaid members. Even
though Quitline Iowa is one of the most successful programs of its kind in the nation, most
smokers attempt to quit "cold turkey," so Quitline Iowa only represents a fraction of the total
number of smokers trying to quit in a given year. Because of state budget cuts to the FY11
budget, Quitline Iowa discontinued the distribution of free nicotine patches, gum and lozenges
on July 1, 2010. According to client follow-up for FY11, 24% said they had not smoked cigarettes
or used other tobacco in the past 30 days, after 7 months, and again after 13 months.
Percent of Students Self-Reporting the Current Use of Tobacco, 1999 through
2010
Source: Iowa Department of Public Health, Division of Behavioral Health – IYS
In 2010, less than one quarter of eleventh graders reported current use of tobacco. The most
significant changes in both current and past use of tobacco occurred among students in grade 8.
In 2010, 7% of 8th graders reported current tobacco use, a decline of 63% from 2002. In 1999,
57% of students in grade 11 reported past use of tobacco use. This figure dropped by nearly half
to 32% in 2010.
Percent of Students Self-Reporting Ever Having Used Tobacco, 1999 through
2010
Source: Iowa Department of Public Health, Division of Behavioral Health – IYS
4% 15%
38%
2%
19% 29%
2% 8%
27%
2% 7%
24%
2% 7%
22%
0%
50%
6th Grade 8th Grade 11th Grade1999 2002 2005 2008 2010
9%
28%
57%
6%
29%
47%
5% 16%
42%
4% 14%
37%
4% 12%
32%
0%
6th Grade 8th Grade 11th Grade1999 2002 2005 2008 2010


![Interventions for Alcohol Use and Alcohol Use Disorders in ... · Edition (DSM–IV) for alcohol abuse and dependence (Substance Abuse and Mental Health Services Administration [SAMHSA]](https://img.pdfslide.net/doc/110x75/5f0a5cd37e708231d42b4583/interventions-for-alcohol-use-and-alcohol-use-disorders-in-edition-dsmaiv.jpg)