Embed Size (px)
Citation preview
DSC01459.JPG
Eva Pereira Blanco
Máster de Ecología terrestre y gestión de la biodiversidad Especialidad Ecología terrestre Dpt. Biologia Animal, Biologia Vegetal i Ecologia, Facultat de Biociències, UAB
Response of fine root respiration to variations in biotic and abiotic factors in a mixed Mediterranean forest affected by drought-induced secondary succession
2014
Màster de Ecologia Terrestre i Gestió de la Biodiversitat Especialitat en Ecologia Terrestre
Dpt. Biologia Animal, Biologia Vegetal i Ecologia, Facultat de Biociències, UAB
Eva Pereira Blanco
30-Enero-2014
Tutores del Proyecto:
Francisco Lloret Maya
Jorge Curiel Yuste
Josep Barba
1
TITLE: RESPONSE OF FINE ROOT RESPIRATION TO VARIATIONS IN BIOTIC AND ABIOTIC FACTORS IN A 1
MIXED MEDITERRANEAN FOREST AFFECTED BY DROUGHT INDUCED SECONDARY SUCCESSION ........... 2 2
ABSTRACT ............................................................................................................................................. 2 3
INTRODUCTION....................................................................................................................................... 3 4
MATERIALS AND METHODS ....................................................................................................................... 5 5
Study area...................................................................................................................................... 5 6
Root respiration ............................................................................................................................. 5 7
Mean daily carbon assimilation rate ............................................................................................... 7 8
Ancillary data ................................................................................................................................. 8 9
Data analysis ................................................................................................................................. 8 10
RESULTS ............................................................................................................................................... 8 11
Ancillary data ................................................................................................................................. 8 12
FRR under tree categories............................................................................................................... 9 13
FRR and daily mean assimilation .................................................................................................... 9 14
DISCUSSION ......................................................................................................................................... 10 15
Die-off impact on canopy ............................................................................................................. 10 16
Seasonal variation in FRR and sensibility to environmental factors and tree assimilation ............... 10 17
TABLES AND GRAPHICS ........................................................................................................................... 12 18
REFERENCES ........................................................................................................................................ 17 19
20
21
22
23
24
25
26
Starting date February 2013; Finalizing date January 2014 27
Additional material: Appendix at the end of the article 28
Author Contributions: 29
Francisco Lloret Maya conceived and designed the study, and revised the paper. 30
Jorge Curiel Yuste conceived and designed the study, and revised the paper. 31
Josep Barba conceived and designed the study, developed the methodology, performed 32
research and revised the paper. 33
Rafael Poyatos collected and treated sap flow and environmental data, and offered 34
methodology support. 35
Eva Pereira designed the study, developed the methodology, performed research, treated-36
analyzed data and wrote the paper. 37
2
Title: Response of fine root respiration to variations in biotic and 38
abiotic factors in a mixed Mediterranean forest affected by 39
drought induced secondary succession 40
Abstract 41
Understanding the factors controlling fine root respiration (FRR) at different temporal scales 42
will help to improve our knowledge about the spatial and temporal variability of SR and to 43
improve future predictions of CO2 effluxes to the atmosphere. Here we present a comparative 44
study of how FRR respond to variability in soil temperature and moisture in two widely spread 45
species, Scots pines (Pinus sylvestris L.) and Holm-oaks (HO; Quercus ilex L.). Those two species 46
show contrasting water use strategies during the extreme summer-drought conditions that 47
characterize the Mediterranean climate. The study was carried out on a mixed Mediterranean 48
forest where Scots pines affected by drought induced die-back are slowly being replaced by 49
the more drought resistant HO. FRR was measured in spring and early fall 2013 in excised roots 50
freshly removed from the soil and collected under HO and under Scots pines at three different 51
health stages: dead (D), defoliated (DP) and non-defoliated (NDP). Variations in soil 52
temperature, soil water content and daily mean assimilation per tree were also recorded to 53
evaluate FRR sensibility to abiotic and biotic environmental variations. Our results show that 54
values of FRR were substantially lower under HO (1.26 ± 0.16 μg CO2 /groot·min) than under 55
living pines (1.89 ± 0.19 μg CO2 /groot·min) which disagrees with the similar rates of soil 56
respiration (SR) previously observed under both canopies and suggest that FRR contribution to 57
total SR varies under different tree species. The similarity of FRR rates under HO and DP 58
furthermore confirms other previous studies suggesting a recent Holm-oak root colonization of 59
the gaps under dead trees. A linear mixed effect model approach indicated that seasonal 60
variations in FRR were best explained by soil temperature (p<0.05) while soil moisture was not 61
exerting any direct control over FRR, despite the low soil moisture values during the summer 62
sampling. Plant assimilation rates were positively related to FRR explaining part of the 63
observed variability (p<0.01). However the positive relations of FRR with plant assimilation 64
occurred mainly during spring, when both soil moisture and plant assimilation rates were 65
higher. Our results finally suggest that plants might be able to maintain relatively high rates of 66
FRR during the sub-optimal abiotic and biotic summer conditions probably thanks to their 67
capacity to re-mobilize carbon reserves and their capacity to passively move water from 68
moister layers to upper layers with lower water potentials (where the FR were collected) by 69
hydraulic lift. 70
Abbreviations 71
A CO2 assimilation 72
C Carbon 73
D Dead pines 74
DBH diameter at breast high 75
DP defoliated pines 76
FRR Fine root respiration 77
GPP Gross primary production 78
HO Holm-oaks 79
NDP non-defoliated pines 80
RH Relative humidity 81
SR Soil respiration 82
ST Soil temperature 83
SWC Soil water content 84
T Transpiration water loss 85
WUE Water use efficiency 86
3
Introduction 87
Soil respiration (SR), the product of the autotrophic and heterotrophic aerobic respiration in 88
soils, is the principal terrestrial source of CO2 to the atmosphere only after gross CO2 flux from 89
oceans (Schlesinger & Andrews, 2000). Recent works point to root respiration as an important 90
process underlying SR variability (Hopkins et al., 2013; Gonzalez-Meler & Taneva, 2005; Vargas 91
& Allen, 2008) and identify photosynthesis as key factor ultimately needed to understand 92
spatial and temporal variability of SR (Kuzyakov & Gavrichkova, 2010; Bahn et al., 2009). 93
Particularly root respiration alone can account for more than a half of soil CO2 efflux in forest 94
ecosystems (Hanson et al., 2000; Högber et al., 2001; Fahey et al., 2005), eventually 95
representing the majority of soil CO2 respired during periods of high productivity (Subke et al., 96
2006; Gomez-Casanovas et al., 2012). Fine roots (<0.5 cm Ø) responsible of water and nutrient 97
uptake are metabolically more active and more dynamics than coarse roots which have a 98
structural and storage role (Pregitzer et al., 1998). Therefore fine roots exhibit higher specific 99
respiration rates and faster turnover (Vogt, 1991) representing a major loss of CO2 from plants. 100
Approximately 52% of gross diary assimilation is respired back to the atmosphere by roots, 101
with fine roots alone accounting for 22-32% of the total autotrophic respiration (Janssens et 102
al., 2002, Ruehr & Buchmann, 2009). Understanding the factors controlling fine root 103
respiration (FRR) at different temporal scales will help to improve our knowledge about the 104
spatial and temporal variability of SR and to improve future predictions of CO2 effluxes to the 105
atmosphere. 106
Soil temperature increase FRR and has been classically considered the most determinant factor 107
influencing it (Atkin et al., 2000; Atkin et al., 2005) although other studies point to soil 108
moisture as an important abiotic driver of FRR variability (Bryla et al., 2001, Burton & Pregitzer, 109
2003). Atkin and Tjoelker (2003) assign variations in temperature sensitivity of respiration to 110
either limitations of substrate availability under high temperatures or limitations of enzyme 111
catalytic activity under low temperatures. During the last years growing evidences have 112
demonstrated that root respiration was not exclusively controlled by soil temperature and 113
moisture but instead there is a strong and dynamic linkage between canopy assimilation rates 114
and root respiration in trees (Horwath et al., 1994; Högber et al., 2001; Trueman & Gonzalez-115
Meler, 2005). However there are many difficulties in the study of the coupling between carbon 116
assimilation and root respiration in trees. Firstly, many studies that focused on the 117
temperature effect on root respiration have been developed in temperate or boreal areas 118
where water availability is not a limiting factor and high temperature periods are often 119
correlated with elevated radiation and peaks of gross primary production (GPP) (Burton & 120
Pregitzer, 2003; Subke et al., 2006). Thus, in these ecosystems, responses to temperature 121
could have been masking the photoassimilation effect on root respiration. In contrast, 122
Mediterranean ecosystems where the highest summer temperatures are accompanied by 123
severe water droughts and where some species can maintain their assimilation capacity under 124
such conditions, offer the possibility to discern between the effect on root respiration of 125
photosynthetic activity and soil temperature and moisture. Secondly, the time lag between 126
canopy assimilation and root respiration in mature trees is still discussed due to the 127
uncertainties associated with gas diffusivity delay through the soil or to the existence of 128
artefacts in isotopic methods (Drake et al., 2008; Irvine et al., 2008; Kuzyakov & Gavrichkova 129
2010). Finally root respiration may be determined by the phenological patterns of carbon (C) 130
4
allocation coupled to photosynthetic activity. The fuelling of C for fine root respiration may 131
come from recent photosynthates (Högber et al., 2001; Steinmann et al., 2004; Kuzyakov & 132
Gavrichkova, 2010) or from stored C (Bahn et al., 2006; Bahn et al., 2009). Carbon reserves 133
would support FRR when C allocation to roots is restricted, as it happens during the growing 134
season (Lynch et al., 2013), when GPP is low as it under stressful conditions like drought, high 135
vapour pressure deficit (VPD) or extreme temperatures (Czimczik et al., 2006; 136
Schuur&Trumbore, 2006). Hence coupling between C assimilation and root respiration largely 137
depends on stored C pools that buffer the variability of current photosynthate supply. 138
Successional processes in ecosystems which imply species replacements due to exposure to 139
different kind of stressful conditions (i.e. high competition pressure combined with extreme 140
environmental events as drought) could entail important implications in FRR through changes 141
in plant species composition and possible species-specific patterns of photosyntathe-root 142
respiration coupling and carbon allocation processes. However, at our knowledge no previous 143
studies have been done to study how a successional process may affect FRR rates. Under this 144
context, the current and widespread drought induced-mortality events (Allen et al., 2010) that 145
often entail succession processes (Royer et al., 2011) provide an exceptional experimental 146
frame to evaluate the effects die-off at FRR level and elucidate the main ecological drivers of 147
FRR at different time scales. 148
Here, we studied seasonal variations in excised FRR rates in a Scots pine (Pinus sylvestris L.) 149
and Holm-oak (Quercus ilex L.) Mediterranean mixed forest at Prades Mountains (northeastern 150
Spain). Scots pine exhibits a widely distribution range, occupying about one third of Northern 151
hemisphere (Critchfield & Little, 1966) and presents its southernmost limit in the 152
Mediterranean basin, concretely in the Iberian peninsula(Jalas & Suominen, 1976). In this 153
region P. sylvestris is often restricted to mountain areas and persists in isolated locations 154
facing with ecological conditions very different from those present in the main distribution 155
area (Ceballos & Ruiz de la Torre, 1971). In contrast, Holm-oak is a very common tree in the 156
western Mediterranean where finds its optimal conditions (Barbero et al., 1992), showing their 157
major populations in the Iberian peninsula (Blanco Castro et. al., 2005). The Scots pine 158
population in Prades is affected by drought-induced dieback (Martínez-Vilalta & Piñol, 2002; 159
Hereş et al., 2011) and it is slowly being replaced by the more drought-adapted Holm-oak 160
(Martínez-Vilalta et al., 2012; Vilà-Cabrera et al., 2012). A recent study of SR spatial patterns 161
done in the same area (Barba et al., 2013) shows an important effect of forest structure (i.e. 162
tree identity and basal area) and proximity to drought-affected trees, with highest SR rates in 163
sites close to dead pines and Holm oaks. There are several non-exclusive possible reasons 164
explaining such high SR values under Holm-oaks and under areas available for colonization: 165
high FRR rates, high fine root productivity or major fine root biomass, major root exudation 166
processes and consequently elevated rhizomicrobial activity or finally high quantities of dead 167
plant tissues and elevated bacterial activity associated. 168
We applied a root excision methodology "in situ" and developed a procedure using an open 169
system (Licor 6400, Lincoln, US) to measure FRR rates directly excluding a great part of 170
mycorrhizal respiration and a significant portion of rhizomicrobial respiration (Burton & 171
Pregitzer, 2003). 172
Thus, the aims of this study were: (1) to study the seasonal variation in FRR associated to the 173
different stages of drought-induced tree replacement, considering non-defoliated pines, 174
5
defoliated pines, dead pines and Holm-oaks; (2) to analyze their sensibility to environmental 175
factors as soil temperature (ST) and water content (SWC); (3) to evaluate the seasonal coupling 176
between FRR and tree assimilation in both coexisting species and in pines with different 177
drought-induced stress grade. 178
Specifically, we aim to test the following hypothesis: (1) based on the results from Barba et al., 179
2013, we predict highest FRR rates in roots collected under dead pines than under Holm-oaks 180
as well as highest FRR under such both stages with respect to living pines. (2) we predict higher 181
FRR seasonality in Pines than in Holm-oaks since pines are less adapted to dry conditions and 182
their assimilation capacity will be drastically reduced during summer, as well as (3) FRR rates 183
will respond differently to dry conditions in pines with different grade of affectation by 184
drought, since more affected trees could be more reliant on carbon reserves (Galiano et al., 185
2012) and have higher sensitivity to summer drought (Poyatos et al., 2013). 186
Materials and Methods 187
Study area 188
The study site was carried out in a steep north facing hillside within the Titllar Valley at the 189
Poblet Natural Reserve (Prades Mountains) located on NE Spain (41˚ 19’ 58.05’’ N, 1˚ 0’ 52.26’’ 190
E, 1015 m asl). The climate is typically Mediterranean with a strong seasonality characterized 191
by summer drought, with mean annual rainfall of 700 mm, peaking in spring and autumn, and 192
minimal and maximal temperature of -2.5 and 28.7 ºC reached in January and July respectively 193
(Ninyerola et al., 2005). The substrate consists on a Palaeozoic base of schist that outcrops in a 194
44% of the soil surface. The soils are xerochreps with high stoniness and clay loam texture, and 195
have a mean deep of ca 40 cm. Organic horizons cover most of the soil surface with variable 196
thickness (Barba et al., 2013). 197
Holm-oak (Quercus ilex L.) is the most extended species at Prades Mountains, constituting 198
dense forest in lower areas, while Scots pine (Pinus sylvestris L.) appears on north hillsides and 199
become dominant at altitudes over 800 m asl (Gutiérrez, 1989). Several drought events since 200
1990s have been specially affecting Scots pine population (Martínez-Vilalta & Piñol, 2002). Our 201
study site is located on a mixed forest where Scots pine is gradually being replaced by the 202
more resistant to drought Holm oak. As a result of this replacement process there is a mixture 203
of healthy, defoliated and dead pines with Holm-oak growing in the understory. Pine stand 204
mortality in Titllar valley is 12% (Vilà-Cabrera et al., 2013) and the study is located in an 205
especially high mortality area (>20%) where more than 50% of alive pines are seriously 206
affected by defoliation (Jordi Martínez-Vilalta, unpublished data). Other species frequent are 207
Quercus cerrioides Willk. & Costa and Ilex aquifolium L., and at lesser extent Taxus baccata L., 208
Amelanchier ovalis Medik., Prunus mahaleb L., Sorbus aria (L.) Crantz, Sorbus torminalis (L.) 209
Crantz and Cistus laurifolius L.. A detailed stand structure is summarized on Appendix 1, Table 210
S1. 211
Root respiration 212
Roots were sampled on soil close to 28 individuals distributed in four tree categories 213
representing different stages of the species replacement process: non-defoliated pines (NDP), 214
defoliated pines (DP), dead pines (D) and Holm-oaks (HO). Individuals from the first three 215
categories had similar diameter at breast high (DBH, mean±sd= 43.78 ± 14.19 cm; lm, t-216
6
Student≈0, p>0.1), Holm-oaks were smaller (mean±sd=20.55±6.27 cm; lm, t-Student =8.59, 217
p=0.0005). Defoliated pines were defined as those with 50% or less of green leaves relative to 218
healthy canopies after visually identification (Galiano et al., 2010). The study was performed in 219
two seasons, in spring (22-24 of April) and early fall (30 September to October 2), before the 220
first fall rain when conditions were still quite dry. All trees (seven per category) were sampled 221
once per day in two consecutive days and the sampling time (morning-afternoon) was 222
randomly chosen for each day and tree category. 223
Fine roots (<0.5 cm Ø) were removed from the upper soil layer (c.a. 20 cm deep). The protocol 224
used was essentially the same as described by Burton and Pregitzer (2003). First order roots of 225
each individual excluding dead pines were followed until fine roots were found. Under dead 226
pines we collected the first living-tree roots founded independently of its identity. We 227
minimized wounding and drying effects of root excision and transport by applying the minimal 228
number of cuts as possible and keeping samples in a damp cloth. Adhering soil and organic 229
debris were removed with a dry brush. Sample handling between excision and respiration 230
measures took less than 15 minutes, being mostly 5-10 minutes, a time period much shorter 231
than the four to six hours of constant respiration rate after excision described by some authors 232
(Burton et al., 2002; Bahn et al., 2006; Burton & Pregitzer, 2003). 233
FRR was measured using an open system Licor 6400 coupled to the insect respiration chamber 234
(6400-89 Insect respiration chamber, 25.31 cm3) that was characterized by having two infrared 235
gas analyzers (IRGAs) located in the sensor head, which measure CO2 and H2O concentrations 236
in the air coming from the sample and the reference chambers. The initial incoming CO2 237
concentration established has been demonstrated not have an effect over the measured 238
respiration rates (Bouma et al., 1997; Bryla et al., 2001; Burton & Pregitzer, 2002). Therefore in 239
order to reduce leak chance CO2 concentration was set to atmospheric levels (400 ppm) 240
instead of soil CO2 concentrations (c.a. 500 to 2500 ppm at 5 cm depth; J. Barba & J.C. Yuste, 241
unpublished data). Preventing root drying with an open system supposes a challenge since has 242
a limited humidity control of incoming air from Li 6400 and it is not possible to raise its relative 243
humidity (RH) over atmospheric RH. Root drying was avoided by lowering the air flux to 200 244
μmol/s and raising incoming-air RH over 80%. Such RH was reached by passing the air through 245
water before arriving to the sample chamber (Figure 1). System modifications were made 246
maintaining maximal measurement accuracy, i.e. shortening the circuit length and taking care 247
of tube junctions to avoid leaks. The measurement precision reached with a flow rate of 200 248
μmol/s and a mean root weight between 1-2 g were smaller than 5% even for very low 249
respiration rates (Appendix 2, “Configuration topics,” 2012). FRR was registered every minute 250
for 15 minutes until the equilibrium state was reached, being the minimal time required to 251
avoid overestimation due to the great quantities of CO2 diffusing from roots freshly removed 252
from soil (Appendix 1, FigureS1). Data processing includes (1) remove the dilution effect of 253
water on CO2 (Appendix 2, Eq. S1) since differences in air RH between reference and sample 254
were influenced by air pass through the inserted circuit, (2) refer respiration data to root dry 255
weight and (3) averaging both measures of FRR per tree in each season obtained on the two 256
consecutive sampling days. 257
7
Mean daily carbon assimilation rate 258
Sap flow were measured and subsequently conversed to mean daily carbon assimilation 259
through water use efficiency (WUE) values. WUE is defined as the ratio between CO2 260
assimilation (A) and transpiration water loss (T) (Lambers et al., 2008). 261
Photosynthesis was measured once per season between 10-13.00 am the day before root 262
sampling in three trees per category (HO, DP and NDP). Water use efficiency at leaf level 263
(WUEL) was calculated from assimilation and transpiration rates measured on leaves unfolded 264
the previous year (AL, TL) with a Licor 6400XT portable photosynthesis system and the standard 265
chamber (2×3cm, 6400-08 Clear-Bottom Chamber). In the case of pine needles a subsequent 266
estimation of leaf functional area was required. All measurements were done at ambient 267
conditions of CO2 (400 ppm), light (PAR=640-130 μmol/m2 s), temperature (16-21˚C) and RH 268
(48%). 269
Sap flow density was measured with handmade constant heat dissipation sensors (Granier, 270
1985) installed in 2010 (Poyatos et al., 2013). Proves length was 2 and 1 cm for pines and 271
Holm-oak respectively. Sensor pairs were separated 12 cm and covered with reflecting bubble 272
wrap. For detailed description on sensor signal corrections by natural temperature gradients, 273
sensor calibration, radial correction coefficients calculation and further knowledge on 274
employed methods see Poyatos et al. (2013). Whole-tree sap flow (JT) was calculated from sap 275
flow densities corrected by radial coefficients δC and referred to sapwood area (aS) (Equation 276
1). To obtain whole-tree daily mean sap flow (JT,dm), JT was firstly averaged per day including 277
only the active photosynthetic hours with irradiance higher than 11.62 W/m2; value calculated 278
averaging sun and shade light compensation points of Scots pine (Fernández and Tapias-279
Martín, 2004) and Holm-oak (Valladares et al., 2000) Iberian populations; and finally refereed 280
to 24h in order to account for daily variations and counteract the possible underestimation of 281
assimilation due to only have midday WUE values, especially in early fall. 282
Whole-tree daily mean assimilation rate (AT,dm) defined as the mean quantity of CO2 fixed by a 283
tree in one day, was calculated from WUEL and whole-tree daily mean sap flow (JT,dm) as a 284
measure of transpiration rate (Hu et al., 2010; Rascher et al., 2010) ( Equation 2). 285
AT,dm were calculated for all trees since one week before sampling season (Appendix 1, Figure 286
S2). Due to sensor failures in early fall there were no data from three Holm-oak, one DP and 287
one NDP trees as well as various trees with missing assimilation data in certain days. 288
We accounted for a possible lag between assimilation and FRR, by averaging the values of the 289
assimilation from two to six days, including the days of root sampling. The final assimilation 290
variable was constituted by the mean assimilation of the 2 sampling days (Assim_m2) in spring 291
and of the 6 days including the sampling days (Asim_m6) in early fall (Appendix 1, Table S2). 292
Missing data in the assimilation variable were accounted by averaging assimilation of all trees 293
in both seasons. 294
Equation 2
Equation 1
8
Ancillary data 295
Competition between trees was evaluated through Hegyi index (Hegyi, 1974) calculated for a 5 296
meter radio (Appendix 3, Eq.S3). Soil temperature (ST) was measured in the first layer of soil at 297
roughly 10 cm deep, on the vicinity of each tree at the time of root extraction. Once per 298
sampling season soil samples around each tree were collected with a soil core to a depth of 5, 299
10 or 15 cm. Soil water content (SWC) was measured gravimetrically, weighting the soil before 300
and after drying at 105˚C for 24 hours and expressed as percentage of volumetric soil water 301
content (SWCv) (Appendix 3, Eq.S4). Meteorological variables, soil moisture and sap flow were 302
calculated as 15 min average of data that were registered every 30 seconds by a data 303
acquisition system (CR1000 datalogger and AM16/32 multiplexers, Campbell Scientific Inc., 304
Logan, UT, USA). SWCv was monitored in the upper 30 cm of soil using six frequency domain 305
reflectometers (TDRs, CS616, Campbell Scientific Inc.) randomly distributed within the study 306
area. Further detailed information about the system is specified in Poyatos et al. (2013). 307
Data analysis 308
Statistical analyses and data treatment were carried out with R Statistical Software 2.15.3 (R 309
Development Core Team, 2013). Differences between environmental conditions among 310
seasons were tested by a non parametric Kruskal-Wallys test. To test overall differences in all 311
measured variables between treatments (season and tree category-NDP, DP, D, HO) and to 312
account for repeated measures in time we used linear mixed effect models (lme; Pinheiro et 313
al., 2013) with tree as random factor. Constant air temperature and RH inside sampler 314
chamber along tree categories and days in each season also were verified through an lme-315
model. DBH or Hegyi index comparisons along tree categories were done with general linear 316
models (lm). To test linear correlations between continuous variables (FRR, ST, SWC and AT,dm) 317
we used the Pearson or Spearman-rank test. Analysis of FRR were applied to two data bases, 318
one with data of all tree categories and the other with data from living trees (excluding dead 319
pines) and with assimilation data. The best model explaining FRR was obtained by ANOVA 320
comparison between lme-models by the method of maximal likelihood (ML) (Cayuela, 2012). 321
Model assumptions were tested and fulfilled for all fitted models. Hegyi index (lm) and 322
assimilation (lm, lme) were square root transformed and SWC (lme) was log transformed to 323
achieve normal distribution. All variables managed with their units and symbols are 324
summarized in the Appendix 1 Table S3. 325
Results 326
Ancillary data 327
Hegyi competition index was higher for Holm-oak (2.74 ± 1.67 sd) than for defoliated and non-328
defoliated pines (1.26 ± 0.83 sd; lm, t-Student≈-2.42, p<0.05), while dead pines show 329
intermediate values (1.55 ± 0.68 sd; lm, t-Student=-1.75, p=0.09). 330
Daily temperature oscillations were similar for both seasons but average temperature was 10 331
ºC higher in early fall than spring (Figure 2, Table 1). SWC was relatively low in both seasons 332
(<0.2 cm3/cm3) being extremely low during early fall (Table 1). Moreover both seasons exhibit 333
significant daily vapour pressure deficit (VPD) oscillations, which were slightly more extremes 334
in early fall (Kruskal-Wallis, Figure 2 & Table 1). Daytime ST measured under each tree was 335
9
consistent with mean air temperatures (Table 2). Values of SWC gravimetrically measured 336
under each tree were much lower than the values obtained from the TDRs (Table 1 & Table 2). 337
No differences in air RH and temperature measuring conditions among tree classes were 338
observed along each sampling season (lme, L.ratio≈0.54, p>0.1). 339
FRR under tree categories 340
ST and SWC were inversely correlated (Spearman, rho=-0.42, p=0.0017) and both exhibited 341
significant differences between seasons but no between tree categories; only SWC showed 342
slight tendency to lower values under dead pines (lme, t-Student=1.72, p=0.09) (Table 2). 343
Within each season ST and SWC were not correlated (Spearman, p>0.1). 344
Total FRR was higher in early fall than spring (lme, L.Ratio=12.96, p=0.0003) and the same 345
pattern was observed in both seasons (lme, L.Ratio=1.08, p=0.78) (Table 3 & Appendix 1, 346
Figure S4): FRR was significantly higher under living pines (defoliated and non-defoliated) than 347
under Holm-oak (lme, t-Student≈-3.02, p<0.01), while under dead pines FRR showed 348
intermediate values between living pines and Holm-oaks (lme, t-Student≈-1.77, p≤0.1). 349
FRR response to ST was constant within each tree categories (Figure 3) exhibiting a positive 350
correlation (Spearman, rho=0.42, p=0.002), although this relationship was not significant in 351
any season when considering the overall pool of trees (Spearman, spring: rho=0.01, p-352
value=0.96; early fall: rho=0.21, p-value=0.31). Conversely there was no direct sensibility of 353
FRR to SWC neither along seasons nor within tree categories (lme, t-354
Student=0.57/L.Ratio=0.18, p>0.1) (Figure 4). 355
The best lme-model explaining FRR variability only contained ST and tree category as 356
explicative variables (AIC=89.85, p=0.01) (Appendix 1, Table S4). Model parameters and 357
graphical description are showed in Table 4 (M1) and Figure 3. 358
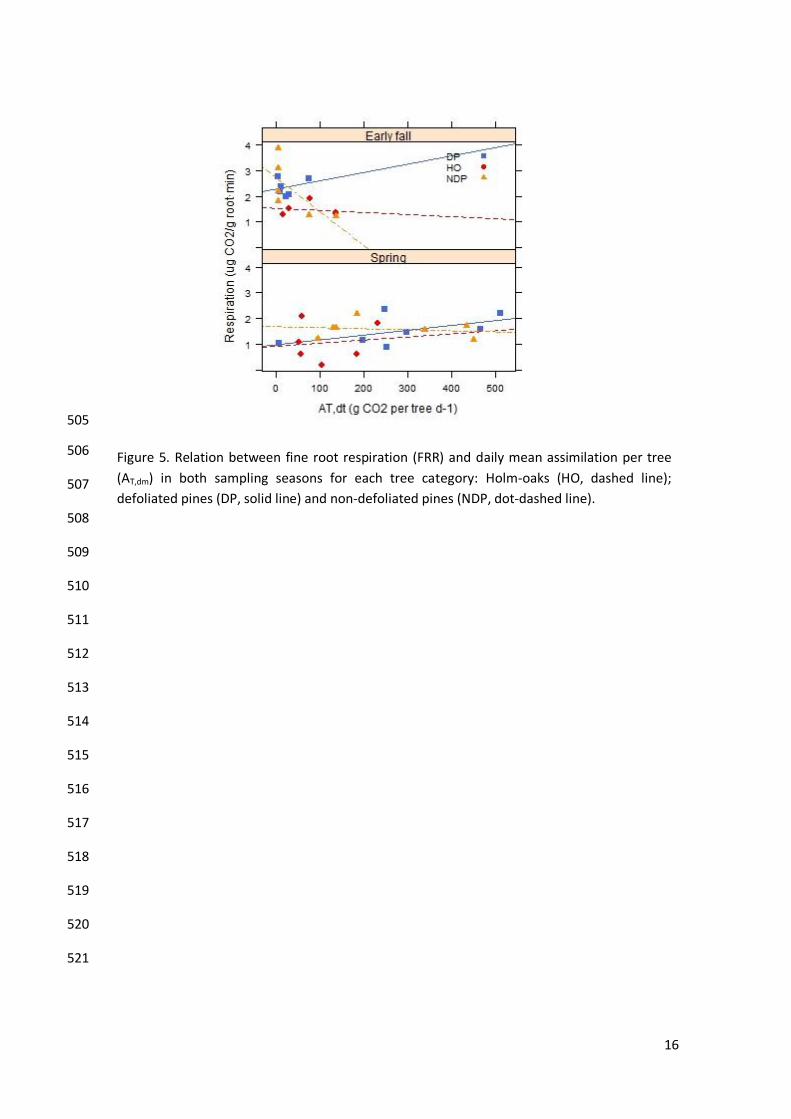
FRR and daily mean assimilation 359
WUE in pines were strongly reduced from spring (8.05 ± 2.32) to early fall (4.41 ± 1.92 mmol 360
CO2/mol H2O) while Holm-oak increased their WUE from 6.69 ± 3.73 to 10.35 ± 2.38 mmol 361
CO2/mol H2O (lme, L.Ratio=8.49, p=0.01) being greater than for pines in early fall (lm, F=6.75, 362
p=0.05). Both living pine categories shared similar assimilation behaviour along seasons, 363
showing a steep decline from spring mean values of 255.43 ± 57.82 to early fall with 35.61 ± 364
18.15 g CO2/day·tree (lme, L.Ratio=8.8, p<0.05). Conversely, Holm-oaks maintained constant 365
assimilation rate in both seasons of roughly 99.49 ± 22.59 g·CO2/day·tree, assimilating less 366
than pines in spring (lme, t-Student=2.36, p=0.03) but slightly more in early fall (lme, t-367
Student=1.95, p=0.06) (Appendix 1, Table S6). Assimilation and SWC were positively correlated 368
in spring (Spearman, rho=0.51, p<0.05) and not in early fall (Spearman, rho=-0.24, p=0.29) 369
(Appendix 1, Figure S3) 370
The best lme-model explaining FRR variability includes tree category and the interaction 371
between assimilation and ST as explicative factors (AIC=76.52, p<0.01) and neither Season nor 372
SWC had enough explicative power in the model (lme, ML, p>0.1) (Appendix 1, Table S5). FRR 373
response to assimilation depends on the temperature and was constant in all categories 374
following the same pattern described previously (Table 4, M2 & Figure 5). 375
10
Discussion 376
Die-off impact on canopy 377
FRR under Holm-oaks was ca. 35% lower than under living pines while pine die-off tended to 378
decrease FRR in 20% with respect to living pines (Table 3). This pattern was consistent in both 379
sampling seasons (Table 3 & Appendix 1 Figure S4). Results partially differed from previous 380
observations of SR made in spring 2010 (Barba et al., 2013) where soil CO2 fluxes were highest 381
under dead pines and Holm-oaks. It could be that a higher FR biomass Holm-oaks trees may 382
have counteracted the observed differences in FRR between pines and Holm-oaks but not 383
differences in FR biomass were observed by Barba et al. (2013). This disagreement, therefore, 384
suggest that in general FRR under pines was contributing more to total SR than FRR under 385
Holm-oak, and that the high SR observed in spring under Holm-oak and dead pines with 386
respect to SR under living pines (Barba et al., 2013) could be explained from the activity of 387
other plant derived CO2 sources (Kuzyakov & Gavrichkova, 2010), i.e mycorrhizal, 388
rhizomicrobial and from microbial respiration of plant dead tissues. 389
The trend to decrease FRR from living to dead pines and Holm-oak (Table 3 & Appendix 1 390
Figure S4) was accompanied by increases in the Hegyi index. Considering the higher values of 391
competition index for dead trees with respect to living ones and the similar FRR values 392
between FR under dead pines and Holm-oaks, our results points to a recent Holm-oak root 393
colonization under dead trees. Such recent Holm-oak roots colonization of dead pines gaps 394
was also suggested by a current work in the area that shows a convergence of bacterial 395
communities under dead pines and Holm-oaks (Curiel Yuste et al., 2012). It is, therefore, likely 396
that the observed aerial colonization of dead pine gaps was associated with a belowground 397
colonization by FR of colonizers Holm-oaks, profiting from the lack of competition for 398
resources under dead pine individuals. 399
Seasonal variation in FRR and sensibility to environmental factors and tree 400
assimilation 401
FRR changed seasonally but unexpectedly the FRR values registered in the growing season 402
(spring) when both biotic and abiotic conditions were more optimal for FRR, were 30% lower 403
than in early fall when SWC was extremely low and pine assimilation were close to 0 (Table 3). 404
For example, values of FRR during the growing season in another pine species range between 405
1.92-22.21 μg CO2/groot·min at ST from 5 to 20 ºC respectively in Pinus resinosa Ait. (Burton & 406
Pregitzer, 2003) or between mean values of 15.93-25.92 μg CO2/groot in Pinus taeda L. (Drake et 407
al., 2008), being in all cases higher than the mean value of 1.55 ± 0.17 μg CO2/groot obtained for 408
defoliated and non-defoliated individuals of Pinus sylvestris in spring at ST of 9 ºC. The low 409
productivity that characterize the Mediterranean forests with respect to more productive 410
temperate forest could partially explain the low values of FRR under pines obtained with 411
respect to FRR of pines from temperate climatic zones. Data of excised FRR were neither found 412
for Holm-oaks nor for other trees typically found in Mediterranean or semiarid ecosystems. 413
Soil temperature was the variable that better explained FRR when considering data from both 414
seasons together (Table4). Soil temperature affected positively, and similarly, to FRR under all 415
four ecotypes under study (Figure 3). However, the within-season variability in FRR were not 416
explained by temperature, accordingly to preceding works pointing to temperature as an 417
11
important factor conditioning FRR but highlighting the importance of other drivers such as 418
substrate availability (Pregitzer et al., 2000; Atkin et al., 2000; Atkin & Tjoelker, 2003; Burton & 419
Pregitzer, 2003; Atkin et al., 2005). Moreover SWC did not seem to exert any direct control 420
over the seasonal and/or the spatial variability of FRR (Figure 4). Experimental studies showed 421
a marked decrease of FRR with low SWC (Bryla et al., 2001, Burton & Pregitzer, 2003) and 422
reductions of SWC during summer drought usually entail a significant reduction in SR 423
attributed to some extent to reductions in root-rhizosphere respiration, at least in perennial 424
species (Irvine et al., 2005; Nikolova et al., 2008; Ruehr et al., 2012). Knowing the importance 425
of water for the functioning of Mediterranean soils, which are deeply conditioned by summer 426
drought conditions (Tang et al. 2005; Misson et al. 2006; Curiel Yuste et al. 2007), it is possible 427
that the drought effect was reflected in a reduction in FR population/biomass (senescence of 428
FR) as were previously evidenced in Holm-oaks (Claramunt Lopez, 1999), rather than in the 429
FRR´s. A lower FR population during summer drought could have maintained the relatively 430
high metabolic rates observed because trees are able to passively move water from tissues 431
located in moister soil layers to tissues from layers with low water potential (upper layers) in a 432
well-known process called hydraulic lifting (Caldwell et al., 1998). However, this are only 433
speculations and future studies should take into account both FR population dynamics and 434
hydraulic lift to understand the relative role of FR in total SR. 435
Assimilation was an important factor determining FRR, significantly improving the AIC scores of 436
the abiotic model and having a positive effect on FRR (Table 4). However we found a partial 437
decoupling between FRR and assimilation during early fall when trees, and especially pines, 438
presented extremely low assimilation rates (resulting from sap flow interruption at SWC values 439
under 11%; see Poyatos et al., 2013). Other SR studies on semiarid coniferous or mixed forests 440
show high correlation of FRR with gross primary productivity (GPP) or photosynthetic active 441
radiation (PAR) during the growing season which decreased during the dry period (Irvine et al., 442
2005;Irvine et al., 2008; Vargas et al., 2010; Martin et al., 2012). FRR-assimilation decoupling 443
during drought indicates, therefore, that FRR during those periods was probably fuelled by 444
stored carbon as observed in recent studies (Czimczik et al., 2006; Schuur & Trumbore, 2006; 445
Lynch et al., 2013). 446
447
448
449
450
451
452
453
454
455
456
12
Tables and Graphics 457
458
CO2
Scrubber
Air in
Air
Flow
Control Pump
CO2
Flow
Control
Liquid CO2
Sample chamber
Cooling coil
Reference
chamber
Water bottle
Flow meter
EXTERNAL CIRCUIT
LICOR 6400
SENSOR HEAD
(IRGAs)
7
6
5
2
3
4
Condensation
bottles
1
459 460
461
462
463
464
465
466
467
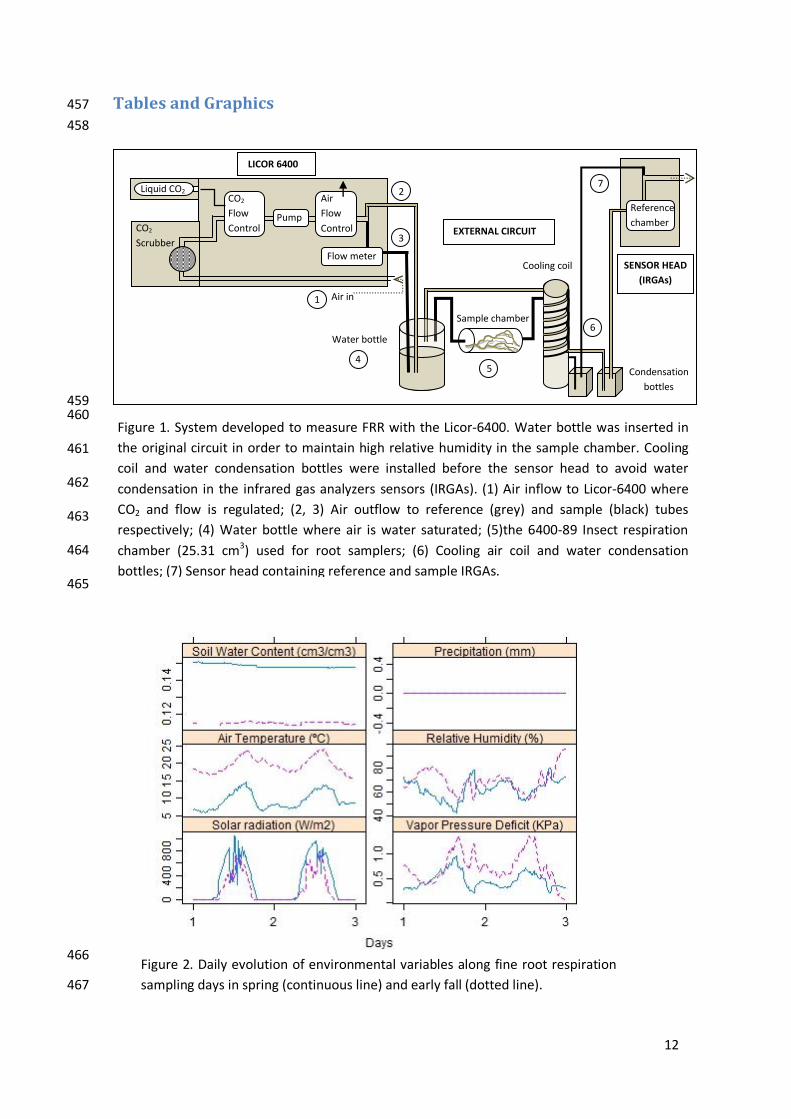
Figure 1. System developed to measure FRR with the Licor-6400. Water bottle was inserted in
the original circuit in order to maintain high relative humidity in the sample chamber. Cooling
coil and water condensation bottles were installed before the sensor head to avoid water
condensation in the infrared gas analyzers sensors (IRGAs). (1) Air inflow to Licor-6400 where
CO2 and flow is regulated; (2, 3) Air outflow to reference (grey) and sample (black) tubes
respectively; (4) Water bottle where air is water saturated; (5)the 6400-89 Insect respiration
chamber (25.31 cm3) used for root samplers; (6) Cooling air coil and water condensation
bottles; (7) Sensor head containing reference and sample IRGAs.
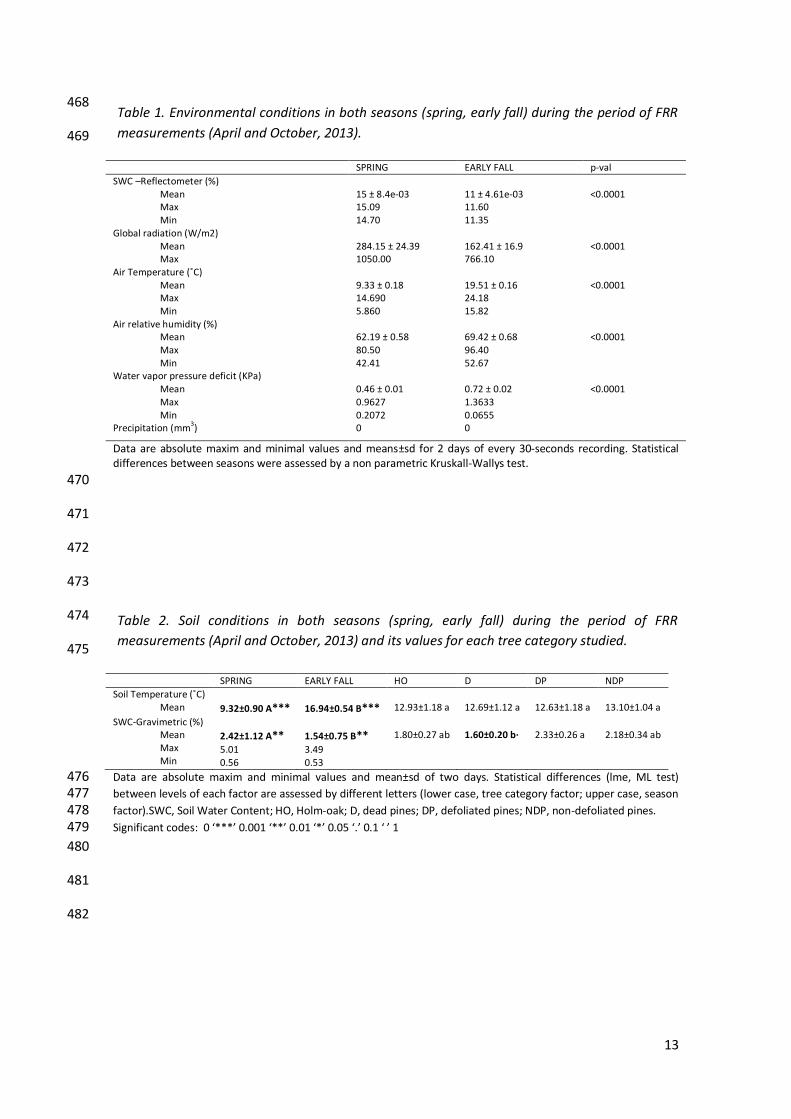
Figure 2. Daily evolution of environmental variables along fine root respiration
sampling days in spring (continuous line) and early fall (dotted line).
13
468
469
SPRING EARLY FALL p-val
SWC –Reflectometer (%) Mean Max Min
15 ± 8.4e-03 15.09 14.70
11 ± 4.61e-03 11.60 11.35
<0.0001
Global radiation (W/m2) Mean Max
284.15 ± 24.39 1050.00
162.41 ± 16.9 766.10
<0.0001
Air Temperature (˚C) Mean Max Min
9.33 ± 0.18 14.690 5.860
19.51 ± 0.16 24.18 15.82
<0.0001
Air relative humidity (%) Mean Max Min
62.19 ± 0.58 80.50 42.41
69.42 ± 0.68 96.40 52.67
<0.0001
Water vapor pressure deficit (KPa) Mean Max Min
0.46 ± 0.01 0.9627 0.2072
0.72 ± 0.02 1.3633 0.0655
<0.0001
Precipitation (mm3) 0 0
Data are absolute maxim and minimal values and means±sd for 2 days of every 30-seconds recording. Statistical differences between seasons were assessed by a non parametric Kruskall-Wallys test.
470
471
472
473
474
475
SPRING EARLY FALL HO D DP NDP
Soil Temperature (˚C) Mean
9.32±0.90 A***
16.94±0.54 B***
12.93±1.18 a
12.69±1.12 a
12.63±1.18 a
13.10±1.04 a
SWC-Gravimetric (%) Mean Max Min
2.42±1.12 A**
5.01 0.56
1.54±0.75 B**
3.49 0.53
1.80±0.27 ab
1.60±0.20 b·
2.33±0.26 a
2.18±0.34 ab
Data are absolute maxim and minimal values and mean±sd of two days. Statistical differences (lme, ML test) 476 between levels of each factor are assessed by different letters (lower case, tree category factor; upper case, season 477 factor).SWC, Soil Water Content; HO, Holm-oak; D, dead pines; DP, defoliated pines; NDP, non-defoliated pines. 478 Significant codes: 0 ‘***’ 0.001 ‘**’ 0.01 ‘*’ 0.05 ‘.’ 0.1 ‘ ’ 1 479
480
481
482
Table 1. Environmental conditions in both seasons (spring, early fall) during the period of FRR
measurements (April and October, 2013).
Table 2. Soil conditions in both seasons (spring, early fall) during the period of FRR
measurements (April and October, 2013) and its values for each tree category studied.
14
483
484
485
486
487
488
489
490
491
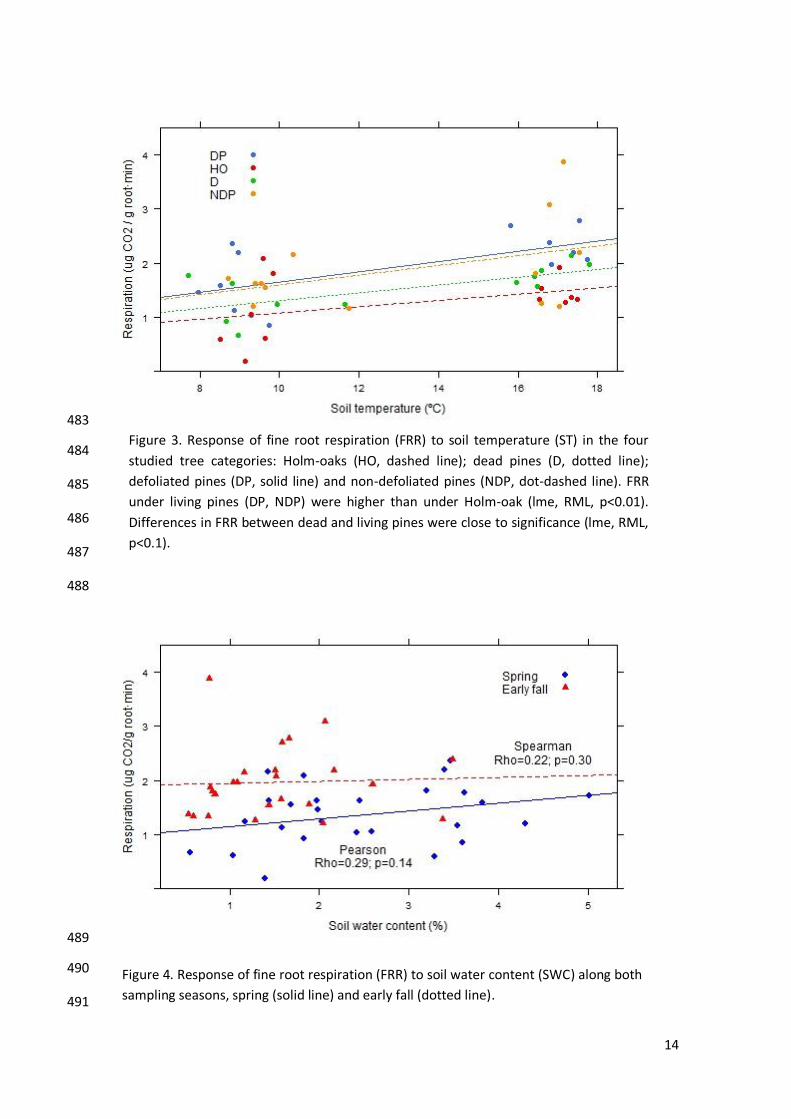
Figure 3. Response of fine root respiration (FRR) to soil temperature (ST) in the four
studied tree categories: Holm-oaks (HO, dashed line); dead pines (D, dotted line);
defoliated pines (DP, solid line) and non-defoliated pines (NDP, dot-dashed line). FRR
under living pines (DP, NDP) were higher than under Holm-oak (lme, RML, p<0.01).
Differences in FRR between dead and living pines were close to significance (lme, RML,
p<0.1).
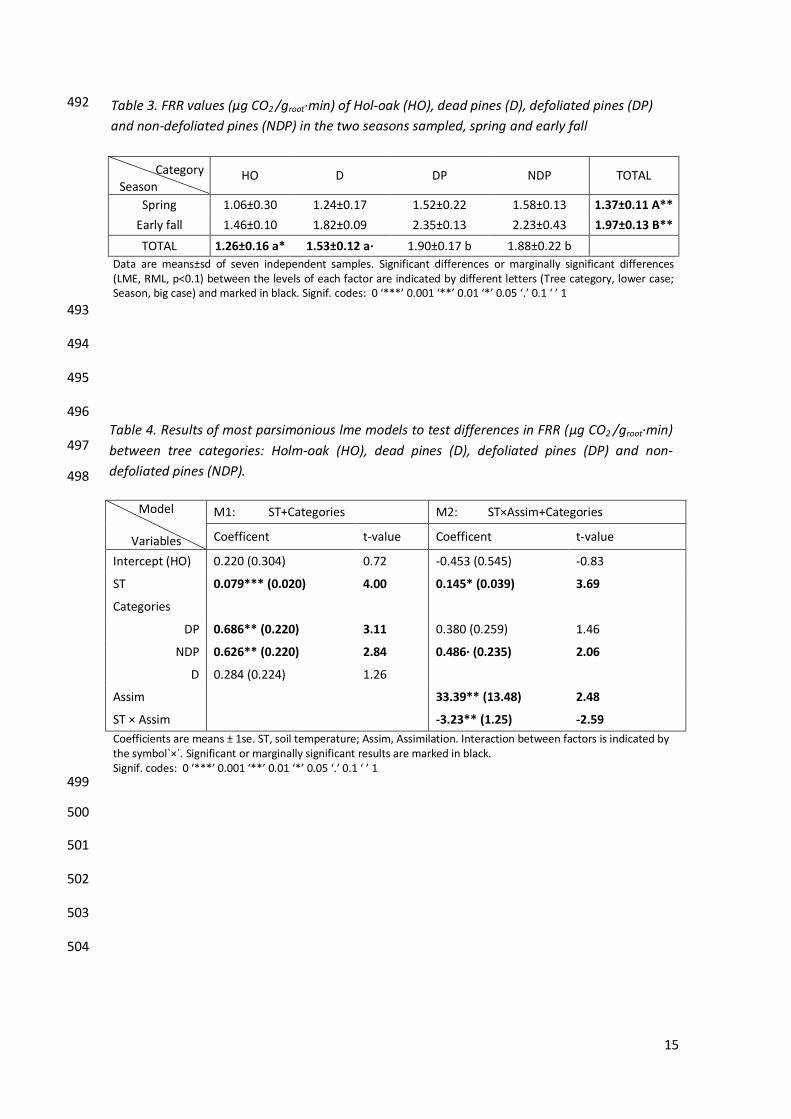
Figure 4. Response of fine root respiration (FRR) to soil water content (SWC) along both
sampling seasons, spring (solid line) and early fall (dotted line).
15
492
493
494
495
496
497
498
Model
Variables
M1: ST+Categories M2: ST×Assim+Categories
Coefficent t-value Coefficent t-value
Intercept (HO) 0.220 (0.304) 0.72 -0.453 (0.545) -0.83
ST 0.079*** (0.020) 4.00 0.145* (0.039) 3.69
Categories
DP 0.686** (0.220) 3.11 0.380 (0.259) 1.46
NDP 0.626** (0.220) 2.84 0.486· (0.235) 2.06
D 0.284 (0.224) 1.26
Assim 33.39** (13.48) 2.48
ST × Assim -3.23** (1.25) -2.59
Coefficients are means ± 1se. ST, soil temperature; Assim, Assimilation. Interaction between factors is indicated by the symbol`×´. Significant or marginally significant results are marked in black. Signif. codes: 0 ‘***’ 0.001 ‘**’ 0.01 ‘*’ 0.05 ‘.’ 0.1 ‘ ’ 1 499
500
501
502
503
504
Category
Season HO D DP NDP TOTAL
Spring 1.06±0.30 1.24±0.17 1.52±0.22 1.58±0.13 1.37±0.11 A**
Early fall 1.46±0.10 1.82±0.09 2.35±0.13 2.23±0.43 1.97±0.13 B**
TOTAL 1.26±0.16 a* 1.53±0.12 a· 1.90±0.17 b 1.88±0.22 b
Data are means±sd of seven independent samples. Significant differences or marginally significant differences (LME, RML, p<0.1) between the levels of each factor are indicated by different letters (Tree category, lower case; Season, big case) and marked in black. Signif. codes: 0 ‘***’ 0.001 ‘**’ 0.01 ‘*’ 0.05 ‘.’ 0.1 ‘ ’ 1
Table 3. FRR values (μg CO2 /groot·min) of Hol-oak (HO), dead pines (D), defoliated pines (DP)
and non-defoliated pines (NDP) in the two seasons sampled, spring and early fall
Table 4. Results of most parsimonious lme models to test differences in FRR (μg CO2 /groot·min)
between tree categories: Holm-oak (HO), dead pines (D), defoliated pines (DP) and non-
defoliated pines (NDP).
16
505
506
507
508
509
510
511
512
513
514
515
516
517
518
519
520
521
Figure 5. Relation between fine root respiration (FRR) and daily mean assimilation per tree
(AT,dm) in both sampling seasons for each tree category: Holm-oaks (HO, dashed line);
defoliated pines (DP, solid line) and non-defoliated pines (NDP, dot-dashed line).
17
References 522
Atkin OK, Tjoelker MG (2003) Thermal acclimation and the dynamic response of plant respiration to 523 temperature. Trends in plant science, 8, 343–51. 524
Atkin OK, Edwards EJ, Loveys BR (2000) Response of root respiration to changes in temperature and its 525 relevance to global warming. New Physiologist, 147, 141–154. 526
Atkin OK, Bruhn D, Hurry VM, Tjoelker MG (2005) The hot and the cold: unravelling the variable 527 response of plant respiration to temperature. Functional Plant Biology, 32, 87. 528
Bahn M, Knapp M, Garajova Z, Pfahringer N, Cernusca A (2006) Root respiration in temperate mountain 529 grasslands differing in land use. Global Change Biology, 12, 995–1006. 530
Bahn M, Schmitt M, Siegwolf R, Richter A, Brüggemann N (2009) Does photosynthesis affect grassland 531 soil-respired CO2 and its carbon isotope composition on a diurnal timescale? The New phytologist, 532 182, 451–60. 533
Barba J, Curiel Yuste J, Martínez-Vilalta J, Lloret F (2013) Drought-induced tree species replacement is 534 reflected in the spatial variability of soil respiration in a mixed Mediterranean forest. Forest 535 Ecology and Management, 306, 79–87. 536
Barbero M, Loisel L, Quezel P (1992) Biogeography, ecology and history of Mediterranean quercus ilex 537 ecosystems. Vegetatio, 100, 19–34. 538
Blanco Castro E, et. al. (2005) Los bosques ibéricos: una interpretación geobotánica, Vol. 0 (eds Costa 539 Tenorio M, Morla Juaristi C, Sainz Ollero H). Editorial Planeta Mexicana Sa De cv. 540
Bouma TJ, Nielsen KL, Eissenstat DM, Lynch JP (1997) Estimating respiration of roots in soil : 541 Interactions with soil CO 2 , soil temperature and soil water content. Plant and Soil, 195, 221–232. 542
Bryla DR, Bouma TJ, Hartmond U, Eissenstat DM (2001) Influence of temperature and soil drying on 543 respiration of individual roots in citrus : integrating greenhouse observations into a predictive 544 model for the field. Plant, Cell and Environment, 24, 781–790. 545
Burton AJ, Pregitzer KS (2002) Measurement carbon dioxide concentration does not affect root 546 respiration of nine tree species in the field. Tree physiology, 22, 67–72. 547
Burton AJ, Pregitzer KS (2003) Field measurements of root respiration indicate little to no seasonal 548 temperature acclimation for sugar maple and red pine. Tree physiology, 23, 273–80. 549
Burton AJ, Pregitzer KS, Ruess RW, Hendrick RL, Allen MF (2002) Root respiration in North American 550 forests : effects of nitrogen concentration and temperature across biomes. Ecosystems Ecology, 551 131, 559–568. 552
Caldwell MM, Dawson TE, Richards JH (1998) Hydraulic lift: consequences of water efflux from the roots 553 of plants. Oecologia, 113, 151–161. 554
Cayuela L (2012) Modelos lineales mixtos en R. Área de Biodiversidad y Conservación, Universidad Rey 555 Juan Carlos. 556
Ceballos L, Ruiz de la Torre J (1971) Árboles y arbustos de la España peninsular. Serv. Publ. E.T.S.I. 557 Montes. 558
18
Claramunt Lopez B (1999) Dinamica de las raíces finas de minirizotrones. UNIV. BARCELONA. 559
Critchfield WB, Little EL (1966) Geographic Distribution of the Pines of the World. US Department of 560 Agriculture, Washington. 561
Curiel Yuste J, Barba J, Fernández-Gonzalez JA, Fernández-López M, Mattana S, Nolis P, Lloret F (2012) 562 Changes in soil bacterial community triggered by drought-induced gap succession preceded 563 changes in soil C stocks and quality. 2, 3016–3031. 564
Czimczik CI, Trumbore SE, Carbone MS, Winston GC (2006) Changing sources of soil respiration with 565 time since fire in a boreal forest. Global Change Biology, 12, 957–971. 566
Drake JE, Stoy PC, Jackson RB, DeLucia EH (2008) Fine-root respiration in a loblolly pine (Pinus taeda L.) 567 forest exposed to elevated CO2 and N fertilization. Plant, cell & environment, 31, 1663–72. 568
Fahey TJ, Tierney GL, Fitzhugh RD, Wilson GF, Siccama TG (2005) Soil respiration and soil carbon balance 569 in a northern hardwood forest ecosystem. Canadian Journal of Forest Research. 570
Fernández M, Tapias Martín R (2004) Influencia de la intensidad luminosa sobre la tasa fotosintética de 571 plantas de una savia de pinos españoles. Cuad. Soc. Esp. Cienc. For, 20, 73–78. 572
Galiano L, Martı J, Lloret F (2010) Drought-Induced Multifactor Decline of Scots Pine in the Pyrenees and 573 Potential Vegetation Change by the Expansion of Co-occurring Oak Species. Ecosystems, 13, 978–574 991. 575
Galiano L, Martínez-vilalta J, Sabaté S, Lloret F (2012) Determinants of drought effects on crown 576 condition and their relationship with depletion of carbon reserves in a Mediterranean holm oak 577 forest. Tree physiology, 32, 478–489. 578
Gomez-Casanovas N, Matamala R, Cook DR, Gonzalez-Meler MA (2012) Net ecosystem exchange 579 modifies the relationship between the autotrophic and heterotrophic components of soil 580 respiration with abiotic factors in prairie grasslands. Global Change Biology, 18, 2532–2545. 581
Gonzalez-Meler MA, Taneva L (2005) Integrated Effects of Atmospheric CO2 Concentration on Plant and 582 Ecosystem Respiration. In: Plant Respiration. Advances in Photosynthesis and Respiration Volume 583 18, Vol. 18 (eds Lambers H, Ribas-Carbo M), pp. 225–240. Springer-Verlag, Berlin/Heidelberg. 584
Granier A (1985) A new method of sap flow measurement in tree stems. Annales des sciences forestières 585 [0003-4312], 42, 193 –200. 586
Gutiérrez E (1989) Dendroclimatological study of Pinus sylvestris L. in southern Catalonia (Spain). Tree-587 Ring Bulletin, 49, 1–9. 588
Hanson PJ, Edwards NT, Garten CT, Andrews JA (2000) Separating root and soil microbial contributions 589 to soil respiration : A review of methods and observations. Biogeochemistry, 48, 115–146. 590
Hegyi F (1974) A simulation model for managing jack-pine stands, Growth mod edn. Stockholm, Sweden. 591
Hereş A-M, Martínez-Vilalta J, Claramunt López B (2011) Growth patterns in relation to drought-induced 592 mortality at two Scots pine (Pinus sylvestris L.) sites in NE Iberian Peninsula. Trees, 26, 621–630. 593
Högber P, Nyberg G, Taylor AFS, Ekblad A, Högberg MN, Read DJ, Ottosson-Löfvenius M (2001) Large-594 scale forest girdling shows that current photosynthesis drives soil respiration. Nature, 411, 789–595 792. 596
19
Hopkins F, Gonzalez-Meler MA, Flower CE, Lynch DJ, Czimczik C, Tang J, Subke J (2013) Ecosystem-level 597 controls on root-rhizosphere respiration. New Physiologist, 199, 339–351. 598
Horwath WR, Pregitzer KS, Paul EA (1994) 14C Allocation in tree-soil systems. Tree physiology, 14, 1163–599 76. 600
Hu J, Moore DJP, Riveros-iregui DA, Burns SP, Monson RK (2010) Modeling whole-tree carbon 601 assimilation rate using observed transpiration rates and needle sugar carbon isotope ratios. New 602 Physiologist, 185, 1000–1015. 603
Irvine J, Law BE, Kurpius MR (2005) Coupling of canopy gas exchange with root and rhizosphere 604 respiration in a semi-arid forest. Biogeochemistry, 73, 271–282. 605
Irvine J, Law BE, Martin JG, Vickers D (2008) Interannual variation in soil CO 2 efflux and the response of 606 root respiration to climate and canopy gas exchange in mature ponderosa pine. Global Change 607 Biology, 14, 2848–2859. 608
Jalas J, Suominen J (1976) Atlas Florae Europaeae: Distribution of Vascular Plants in Europe. Societas 609 Biologica Fennica Vanamo, Helsinki. 610
Janssens IA, Sampson DA, Curiel Yuste J, Carrara A, Ceulemans R (2002) The carbon cost of fine root 611 turnover in a Scots pine forest. Forest Ecology and Management, 168, 231–240. 612
Kuzyakov Y, Gavrichkova O (2010) Time lag between photosynthesis and carbon dioxide efflux from soil: 613 a review of mechanisms and controls. Global Change Biology, 16, 3386–3406. 614
Lambers H, Chapin IFS, Chapin FS, Pons TL (2008) Plant physiological ecology, Springer edn. 615
LI-COR (2012) Configuration topics. In: Using the LI-6400/Version 6, pp. 16–55,16–62. Lincoln, Nebraska 616 (U.S&Canada). 617
Lynch DJ, Matamala R, Iversen CM, Norby RJ, Gonzalez-Meler MA (2013) Stored carbon partly fuels fine-618 root respiration but is not used for production of new fine roots. The New phytologist, 199, 420–619 30. 620
Martin JG, Phillips CL, Schmidt A, Irvine J, Law BE (2012) High-frequency analysis of the complex linkage 621 between soil CO(2) fluxes, photosynthesis and environmental variables. Tree physiology, 32, 49–622 64. 623
Martínez-Vilalta J, Piñol J (2002) Drought-induced mortality and hydraulic architecture in pine 624 populations of the NE Iberian Peninsula. Forest Ecology and Management, 161, 247–256. 625
Martínez-Vilalta J, Lloret F, Breshears DD (2012) Drought-induced forest decline: causes, scope and 626 implications. Biology letters, 8, 689–91. 627
Nikolova PS, Raspe S, Andersen CP, Mainiero R, Blaschke H, Matyssek R, Häberle K-H (2008) Effects of 628 the extreme drought in 2003 on soil respiration in a mixed forest. European Journal of Forest 629 Research, 128, 87–98. 630
Ninyerola M, Pons X, Roure J (2005) Atlas Climático Digital de la Península Ibérica. Metodología y 631 aplicaciones en bioclimatología y geobotánica. Universidad Autónoma de Barcelona, Bellaterra. 632
Pinheiro J, Bates D, DebRoy S, Sarkar D, (2013) RDCT (2013) nlme: Linear and Nonlinear Mixed Effects 633 Models. R package. 634
20
Poyatos R, Aguade D, Galiano L, Mencuccini M, Martínez-Vilalta J (2013) Drought-induced defoliation 635 and long periods of near-zero gas exchange play a key role in accentuating metabolic decline of 636 Scots pine. New Physiologist, 200, 388–401. 637
Pregitzer KS, Laskowski MJ, Burton AJ, Lessard C, Zak DR (1998) Variation in sugar maple root respiration 638 with root diameter and soil depth. Tree physiology, 18, 665–670. 639
Pregitzer KS, King JS, Burton AJ, Brown SE (2000) Responses of tree fine roots to temperature. New 640 Physiologist, 147, 105–115. 641
R Development Core Team (2013) R: A language and environment for statistical computing. 642
Rascher KG, Máguas C, Werner C (2010) On the use of phloem sap δ13C as an indicator of canopy carbon 643 discrimination. Tree physiology, 30, 1499–514. 644
Ruehr NK, Buchmann N (2009) Soil respiration fluxes in a temperate mixed forest: seasonality and 645 temperature sensitivities differ among microbial and root-rhizosphere respiration. Tree 646 physiology, 30, 165–76. 647
Ruehr NK, Martin JG, Law BE (2012) Effects of water availability on carbon and water exchange in a 648 young ponderosa pine forest: Above- and belowground responses. Agricultural and Forest 649 Meteorology, 164, 136–148. 650
Schlesinger WH, Andrews JA (2000) Soil respiration and the global carbon cycle. Biogeochemistry, 48, 7–651 20. 652
Schuur EAG, Trumbore SE (2006) Partitioning sources of soil respiration in boreal black spruce forest 653 using radiocarbon. Global Change Biology, 12, 165–176. 654
Steinmann K, Siegwolf RTW, Saurer M, Körner C (2004) Carbon fluxes to the soil in a mature temperate 655 forest assessed by 13C isotope tracing. Oecologia, 141, 489–501. 656
Subke J-A, Inglima I, Francesca Cotrufo M (2006) Trends and methodological impacts in soil CO2 efflux 657 partitioning: A metaanalytical review. Global Change Biology, 12, 921–943. 658
Trueman RJ, Gonzalez-Meler MA (2005) Accelerated belowground C cycling in a managed agriforest 659 ecosystem exposed to elevated carbon dioxide concentrations. Global Change Biology, 11, 1258–660 1271. 661
Valladares F, Martínez-Ferri E, Balaguer L, Perez-Corona E, Manrique E (2000) Low leaf-level response to 662 light and nutrients in Mediterranean evergreen oaks : a conservative resource-use strategy ? 663 New Physiologist, 148, 79–91. 664
Vargas R, Allen MF (2008) Environmental controls and the influence of vegetation type, fine roots and 665 rhizomorphs on diel and seasonal variation in soil respiration. The New phytologist, 179, 460–71. 666
Vargas R, Detto M, Baldocchi DD, Allen MF (2010) Multiscale analysis of temporal variability of soil CO 2 667 production as influenced by weather and vegetation. Global Change Biology, 16, 1589–1605. 668
Vilà-Cabrera A, Martínez-Vilalta J, Galiano L, Retana J (2013) Patterns of Forest Decline and 669 Regeneration Across Scots Pine Populations. Ecosystems, 16, 323–335. 670
Vogt K (1991) Carbon budgets of temperate forest ecosystems. Tree physiology, 9, 69–86. 671

1
APPENDIX .............................................................................................................................................. 2 1
APPENDIX 1. TABLES AND GRAPHICS ............................................................................................................ 2 2
APPENDIX 2. MEASUREMENT PRECISION ....................................................................................................... 6 3
APPENDIX 3. EQUATIONS .......................................................................................................................... 6 4
5
6
7
8
9
10
11
12
13
14
15
16
17
18
19
20
21
22
23
24
25
26

2
Appendix 27
Appendix 1. Tables and graphics 28
29
Density (stems/Ha)
DBH (cm) Basal area (m2/Ha)
Normal diameter (cm)
Ocupacion (% BAsp/ BAtotal)
Pinus sylvestris 184±20 26.98±13.61 13.18±1.66 40.90±2.59 35.87
Quercus ilex 1636±441 11.16±4.51 18.63±3.93 48.44±5.17 50.70
Quercus sp. 165±194 15.20±5.42 3.37±3.83 17.20±11.58 9.18
Ilex aquifolium 189±24 7.87±3.03 1.04±0.26 11.43±1.44 2.84
Others 57±20 12.72±5.88 0.52±0.54 6.96±4.23 1.42
Variables were measured in three circular plots of 15 m radio in November 2012 (Paola Beltrán,Ferran Colomer&Eva Pereira). Data are mean±sd. DBH, diameter at breast height; BA, basal area.
30
31
32
Season Assim_m2 Assim_m3 Assim_m5 Assim_m6
Spring 0.42· 0.39 0.37 0.31 Early fall -0.24 -0.41 -0.47 · -0.51· Data are Rho values from the non parametric Spearman's rank correlation test. Assim_m2, mean assimilation of two FRR sampling days; Assim_m3, mean assimilation of two FRR sampling days and one day before; Assim_m5 and Assim_m6, include three and four days before respectively. Alternative hypothesis: true rho is not equal to 0. Significant results are in bold and marginal significance (0.05>p<0.1) is expressed by`·´
33
34
35
SIMBOL DESCRIPTION UNITS
Rr Root respiration μg CO2 /groot·min
CO2 CO2 differential μmol CO2/mol
F Air flow μmol/s AL Assimilation rate per unit leaf area μmol/m2·s AT Whole tree assimilation rate mmol CO2/s AT,dm Daily mean assimilation per tree g CO2/d JT Instantaneous (15 min means) whole tree sap flow dm
3 H2O/s
JT,dm Day-time averaged whole tree sap flow (86400 s) dm3 H2O/day
δc Instantaneous (15 min means) sap flow per unit sapwood dm3 H2O/m
2·s
WUEL Water use efficiency at leave level mmol CO2/mol H2O aS Tree basal area cm
2
aL Tree leaf area m2
TL Leaf transpiration rate mmol H2O/m2·s
mr Root mass g DBH Tree diameter at breast height cm Dt, i Distance between trees m ST Soil temperature ˚C SWC Soil water content % (cm3 H2O/cm3 soil)
36
Table S2. FRR correlations with different daily mean assimilation variables for the two sampled
seasons (spring, early fall).
Table S1. Stand characteristics of high-hill area of Titllar valley including the study area.
Table S3. Abbreviations and units list of measured variables and parameters managed in this study.
3
37
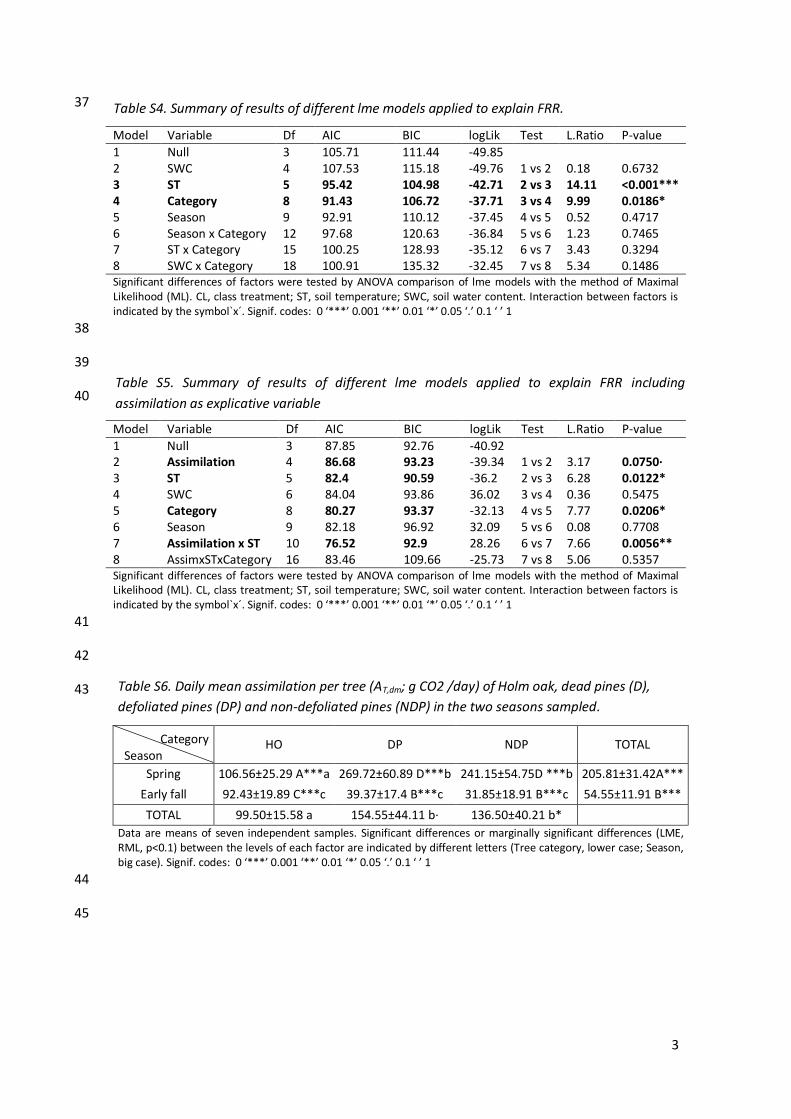
Model Variable Df AIC BIC logLik Test L.Ratio P-value
1 Null 3 105.71 111.44 -49.85 2 SWC 4 107.53 115.18 -49.76 1 vs 2 0.18 0.6732 3 ST 5 95.42 104.98 -42.71 2 vs 3 14.11 <0.001*** 4 Category 8 91.43 106.72 -37.71 3 vs 4 9.99 0.0186* 5 Season 9 92.91 110.12 -37.45 4 vs 5 0.52 0.4717 6 Season x Category 12 97.68 120.63 -36.84 5 vs 6 1.23 0.7465 7 ST x Category 15 100.25 128.93 -35.12 6 vs 7 3.43 0.3294 8 SWC x Category 18 100.91 135.32 -32.45 7 vs 8 5.34 0.1486 Significant differences of factors were tested by ANOVA comparison of lme models with the method of Maximal Likelihood (ML). CL, class treatment; ST, soil temperature; SWC, soil water content. Interaction between factors is indicated by the symbol`x´. Signif. codes: 0 ‘***’ 0.001 ‘**’ 0.01 ‘*’ 0.05 ‘.’ 0.1 ‘ ’ 1
38
39
40
Model Variable Df AIC BIC logLik Test L.Ratio P-value
1 Null 3 87.85 92.76 -40.92 2 Assimilation 4 86.68 93.23 -39.34 1 vs 2 3.17 0.0750· 3 ST 5 82.4 90.59 -36.2 2 vs 3 6.28 0.0122* 4 SWC 6 84.04 93.86 36.02 3 vs 4 0.36 0.5475 5 Category 8 80.27 93.37 -32.13 4 vs 5 7.77 0.0206* 6 Season 9 82.18 96.92 32.09 5 vs 6 0.08 0.7708 7 Assimilation x ST 10 76.52 92.9 28.26 6 vs 7 7.66 0.0056** 8 AssimxSTxCategory 16 83.46 109.66 -25.73 7 vs 8 5.06 0.5357 Significant differences of factors were tested by ANOVA comparison of lme models with the method of Maximal Likelihood (ML). CL, class treatment; ST, soil temperature; SWC, soil water content. Interaction between factors is indicated by the symbol`x´. Signif. codes: 0 ‘***’ 0.001 ‘**’ 0.01 ‘*’ 0.05 ‘.’ 0.1 ‘ ’ 1
41
42
43
44
45
Category Season
HO DP NDP TOTAL
Spring 106.56±25.29 A***a 269.72±60.89 D***b 241.15±54.75D ***b 205.81±31.42A***
Early fall 92.43±19.89 C***c 39.37±17.4 B***c 31.85±18.91 B***c 54.55±11.91 B***
TOTAL 99.50±15.58 a 154.55±44.11 b· 136.50±40.21 b*
Data are means of seven independent samples. Significant differences or marginally significant differences (LME, RML, p<0.1) between the levels of each factor are indicated by different letters (Tree category, lower case; Season, big case). Signif. codes: 0 ‘***’ 0.001 ‘**’ 0.01 ‘*’ 0.05 ‘.’ 0.1 ‘ ’ 1
Table S5. Summary of results of different lme models applied to explain FRR including
assimilation as explicative variable
Table S4. Summary of results of different lme models applied to explain FRR.
Table S6. Daily mean assimilation per tree (AT,dm; g CO2 /day) of Holm oak, dead pines (D),
defoliated pines (DP) and non-defoliated pines (NDP) in the two seasons sampled.
4
46
47
48
49
50
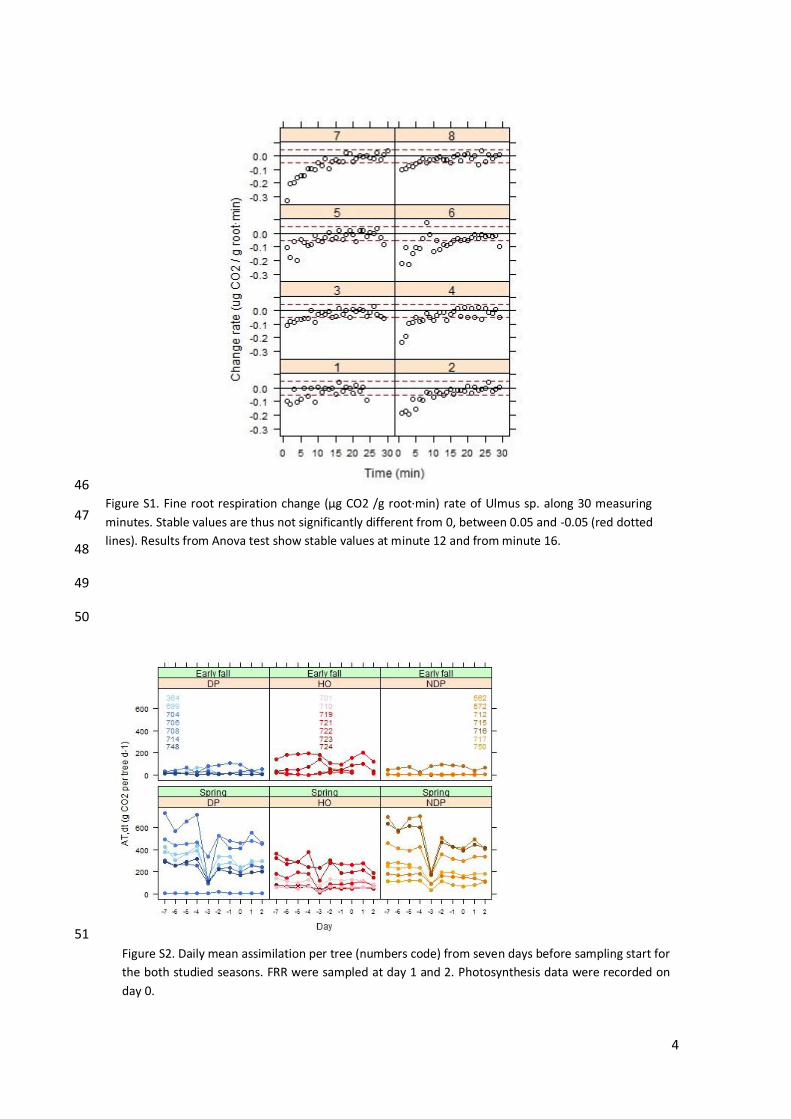
51
Figure S1. Fine root respiration change (μg CO2 /g root·min) rate of Ulmus sp. along 30 measuring
minutes. Stable values are thus not significantly different from 0, between 0.05 and -0.05 (red dotted
lines). Results from Anova test show stable values at minute 12 and from minute 16.
Figure S2. Daily mean assimilation per tree (numbers code) from seven days before sampling start for
the both studied seasons. FRR were sampled at day 1 and 2. Photosynthesis data were recorded on
day 0.
5
52
53
54
55
56
57
58
59
60
61
62
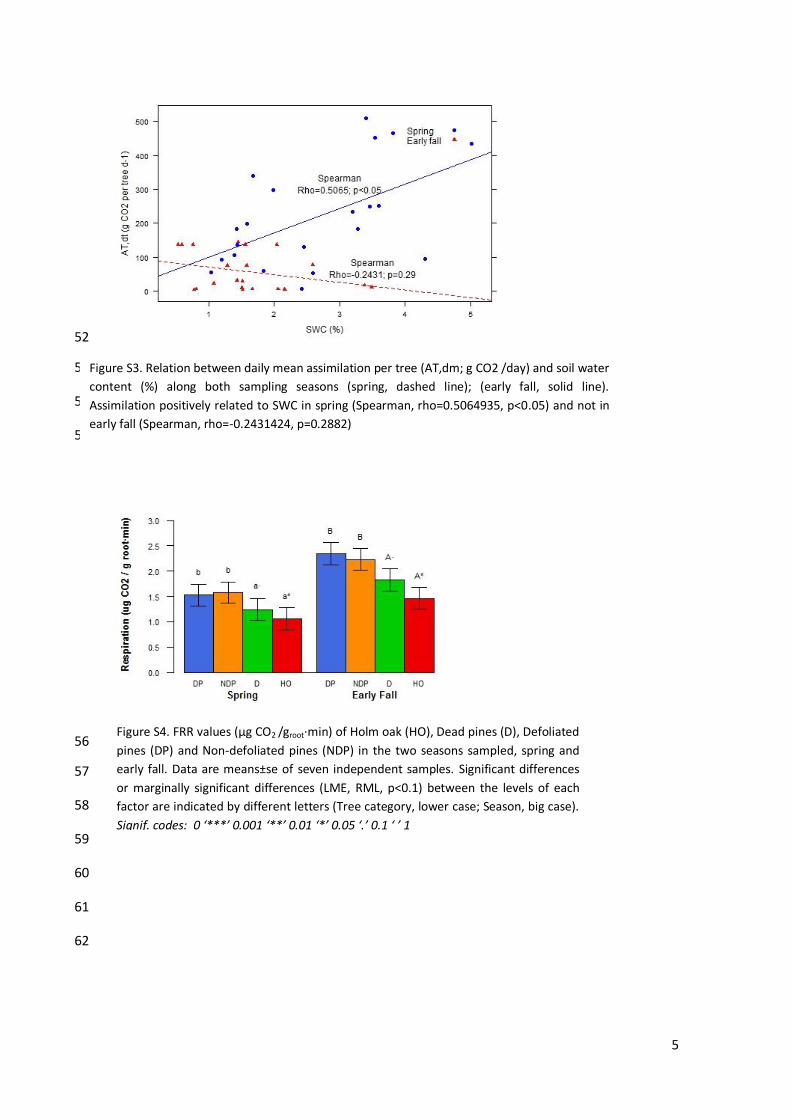
Figure S3. Relation between daily mean assimilation per tree (AT,dm; g CO2 /day) and soil water
content (%) along both sampling seasons (spring, dashed line); (early fall, solid line).
Assimilation positively related to SWC in spring (Spearman, rho=0.5064935, p<0.05) and not in
early fall (Spearman, rho=-0.2431424, p=0.2882)
Figure S4. FRR values (μg CO2 /groot·min) of Holm oak (HO), Dead pines (D), Defoliated
pines (DP) and Non-defoliated pines (NDP) in the two seasons sampled, spring and
early fall. Data are means±se of seven independent samples. Significant differences
or marginally significant differences (LME, RML, p<0.1) between the levels of each
factor are indicated by different letters (Tree category, lower case; Season, big case).
Signif. codes: 0 ‘***’ 0.001 ‘**’ 0.01 ‘*’ 0.05 ‘.’ 0.1 ‘ ’ 1
6
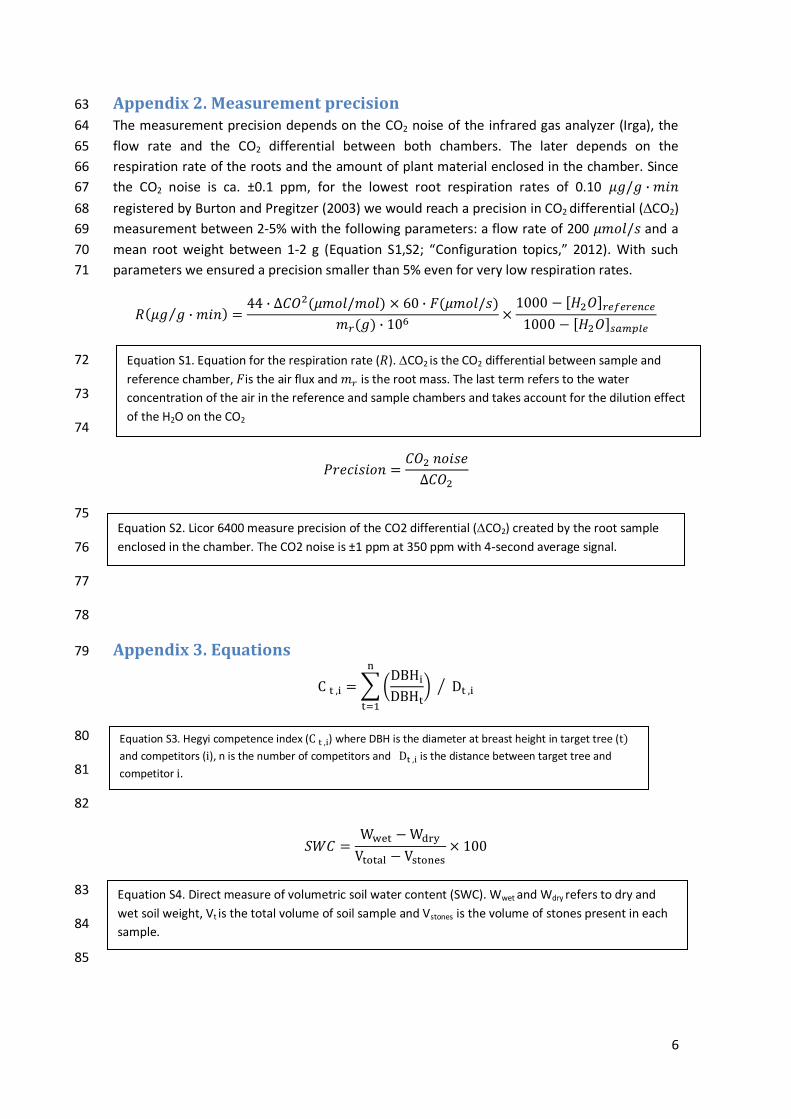
Appendix 2. Measurement precision 63
The measurement precision depends on the CO2 noise of the infrared gas analyzer (Irga), the 64
flow rate and the CO2 differential between both chambers. The later depends on the 65
respiration rate of the roots and the amount of plant material enclosed in the chamber. Since 66
the CO2 noise is ca. ±0.1 ppm, for the lowest root respiration rates of 0.10 67
registered by Burton and Pregitzer (2003) we would reach a precision in CO2 differential (CO2) 68
measurement between 2-5% with the following parameters: a flow rate of 200 and a 69
mean root weight between 1-2 g (Equation S1,S2; “Configuration topics,” 2012). With such 70
parameters we ensured a precision smaller than 5% even for very low respiration rates. 71
72
73
74
75
Root respiration was registered every minute for 15 minutes long. This measuring time was 76
77
78
Appendix 3. Equations 79
80
81
82
83
84
85
Equation S1. Equation for the respiration rate ( ). CO2 is the CO2 differential between sample and
reference chamber, is the air flux and is the root mass. The last term refers to the water
concentration of the air in the reference and sample chambers and takes account for the dilution effect
of the H2O on the CO2
Equation S2. Licor 6400 measure precision of the CO2 differential (CO2) created by the root sample
enclosed in the chamber. The CO2 noise is ±1 ppm at 350 ppm with 4-second average signal.
Equation S3. Hegyi competence index ( ) where DBH is the diameter at breast height in target tree (t)
and competitors (i), n is the number of competitors and is the distance between target tree and
competitor i.
Equation S4. Direct measure of volumetric soil water content (SWC). Wwet and Wdry refers to dry and
wet soil weight, Vt is the total volume of soil sample and Vstones is the volume of stones present in each
sample.


