Embed Size (px)
Citation preview

Dual Credit and Exam-Based Courses in U.S. Public High Schools: 2010–11First Look
NCES 2013–001 U.S. DEPARTMENT OF EDUCATION

Dual Credit and Exam-Based Courses in U.S. Public High Schools: 2010–11 First Look
FEBRUARY 2013
Nina Thomas Stephanie Marken Lucinda Gray Laurie Lewis Westat
John Ralph Program Director National Center for Education Statistics
NCES 2013-001 U.S. DEPARTMENT OF EDUCATION

U.S. Department of Education Arne Duncan Secretary
Institute of Education Sciences John Q. Easton Director
National Center for Education Statistics Jack Buckley Commissioner
Early Childhood, International, and Crosscutting Studies Division Chris Chapman Acting Associate Commissioner
The National Center for Education Statistics (NCES) is the primary federal entity for collecting, analyzing, and reporting data related to education in the United States and other nations. It fulfills a congressional mandate to collect, collate, analyze, and report full and complete statistics on the condition of education in the United States; conduct and publish reports and specialized analyses of the meaning and significance of such statistics; assist state and local education agencies in improving their statistical systems; and review and report on education activities in foreign countries.
NCES activities are designed to address high-priority education data needs; provide consistent, reliable, complete, and accurate indicators of education status and trends; and report timely, useful, and high-quality data to the U.S. Department of Education, the Congress, the states, other education policymakers, practitioners, data users, and the general public. Unless specifically noted, all information contained herein is in the public domain.
We strive to make our products available in a variety of formats and in language that is appropriate to a variety of audiences. You, as our customer, are the best judge of our success in communicating information effectively. If you have any comments or suggestions about this or any other NCES product or report, we would like to hear from you. Please direct your comments to
NCES, IES, U.S. Department of Education 1990 K Street NW Washington, DC 20006-5651
February 2013
The NCES Home Page address is http://nces.ed.gov. The NCES Publications and Products address is http://nces.ed.gov/pubsearch.
This publication is only available online. To download, view, and print the report as a PDF file, go to the NCES Publications and Products address shown above.
This report was prepared in part under Contract No. ED-04-C0-0059/0025 with Westat. Mention of trade names, commercial products, or organizations does not imply endorsement by the U.S. Government.
Suggested Citation
Thomas, N., Marken, S., Gray, L., and Lewis, L. (2013). Dual Credit and Exam-Based Courses in U.S. Public High Schools: 2010–11 (NCES 2013-001). U.S. Department of Education. Washington, DC: National Center for Education Statistics. Retrieved [date] from http://nces.ed.gov/pubsearch.
Content Contact
John Ralph (202) 502-7441 [email protected]

iii
Acknowledgments
The authors would like to recognize the respondents from public high schools who provided data on dual credit and exam-based courses upon which the report is based and the data requesters from the Office of Elementary and Secondary Education, U.S. Department of Education.

iv
Contents
Page
Acknowledgments ....................................................................................................................... iii
List of Tables .............................................................................................................................. v
Introduction ................................................................................................................................. 1
Selected Findings ........................................................................................................................ 3
Tables .......................................................................................................................................... 5
References ................................................................................................................................... 21
Appendix A: Standard Error Tables ............................................................................................ A-1
Appendix B: Technical Notes ..................................................................................................... B-1
Appendix C: Questionnaire ......................................................................................................... C-1

v
List of Tables
Table Page
1. Percentage of public high schools with students enrolled in dual credit courses, Advanced Placement (AP) or International Baccalaureate (IB) courses, and AP courses eligible for dual credit without the AP exam, by school characteristics: School year 2010–11 ................................................................................................. 6
2. Percentage distribution of public high schools reporting whether students were enrolled in dual credit and/or Advanced Placement (AP) or International Baccalaureate (IB) courses, by school characteristics: School year 2010–11 ........... 7
3. Total enrollments of public high school students in dual credit courses, Advanced Placement (AP) or International Baccalaureate (IB) courses, and AP courses eligible for dual credit without the AP exam, by school characteristics: School year 2010–11 ................................................................................................. 8
4. Percentage of public high schools with students enrolled in dual credit courses, by dual credit course focus and school characteristics: School year 2010–11 .......... 9
5. Percentage of all public high schools with students enrolled in dual credit courses taught through distance education or at various locations, by course focus and school characteristics: School year 2010–11 ............................................ 10
6. Number of high school student enrollments in dual credit courses with an academic focus or a career and technical/vocational focus, by distance education or course location and school characteristics: School year 2010–11......................... 11
7. Percentage of public high schools with students enrolled in dual credit courses reporting that their school has established requirements that students must meet to enroll in dual credit courses, and for those schools, the percentage indicating various types of requirements, by school characteristics: School year 2010–11 ....... 12
8. Percentage of public high schools with students enrolled in dual credit courses indicating that transportation was needed for dual credit courses, and of these schools, percentage indicating which sources were responsible for students’ transportation costs to dual credit courses, by school characteristics: School year 2010–11 ................................................................................................. 13
9. Percentage of public high schools with students enrolled in dual credit courses reporting that some students earned various types of credentials from a postsecondary institution by taking dual credit courses, by school characteristics: School year 2010–11 ........................................................................ 14
10. Percentage of public high schools with students enrolled in dual credit courses, and among those schools, percentage with students enrolled in various types of dual credit courses, by school characteristics: School year 2010–11 ........................ 15

vi
Table Page
11. Percentage of public high schools with students enrolled in dual credit courses indicating how students are awarded postsecondary credit, by dual credit course focus and school characteristics: School year 2010–11 ............................................ 16
12. Percentage of public high schools with students enrolled in dual credit courses indicating whether most students (and their parents) generally paid out of pocket for various dual credit course expenses, by dual credit course focus and school characteristics: School year 2010–11 ........................................................................ 17
13. Percentage of public high schools with students enrolled in dual credit courses indicating whether the school or district paid for various dual credit course expenses for any students, by dual credit course focus and school characteristics: School year 2010–11 ........................................................................ 18
14. Percentage distribution of public high schools with students enrolled in dual credit courses taught at locations for secondary school students indicating who the instructors were for the dual credit courses, by dual credit course focus and school characteristics: School year 2010–11 ............................................................. 19
15. Percentage distribution of public high schools with students enrolled in dual credit courses taught on the campus of a postsecondary institution indicating the most common student composition, by dual credit course focus and school characteristics: School year 2010–11 ........................................................................ 20
Appendix A Tables
1a. Standard errors for the percentage of public high schools with students enrolled in dual credit courses, Advanced Placement (AP) or International Baccalaureate (IB) courses, and AP courses eligible for dual credit without the AP exam, by school characteristics: School year 2010–11 ........................................................ A-2
2a. Standard errors for the percentage distribution of public high schools reporting whether students were enrolled in dual credit and/or Advanced Placement (AP) or International Baccalaureate (IB) courses, by school characteristics: School year 2010–11 ............................................................................................................. A-3
3a. Standard errors for the total enrollments of public high school students in dual credit courses, Advanced Placement (AP) or International Baccalaureate (IB) courses, and AP courses eligible for dual credit without the AP exam, by school characteristics: School year 2010–11 ........................................................................ A-4
4a. Standard errors for the percentage of public high schools with students enrolled in dual credit courses, by dual credit course focus and school characteristics: School year 2010–11 ................................................................................................. A-5
5a. Standard errors for the percentage of all public high schools with students enrolled in dual credit courses taught through distance education or at various locations, by course focus and school characteristics: School year 2010–11 ............ A-6

vii
Table Page
6a. Standard errors for the number of high school student enrollments in dual credit courses with an academic focus or a career and technical/vocational focus, by distance education or course location and school characteristics: School year 2010–11 ..................................................................................................................... A-7
7a. Standard errors for the percentage of public high schools with students enrolled in dual credit courses reporting that their school has established requirements that students must meet to enroll in dual credit courses, and for those schools, the percentage indicating various types of requirements, by school characteristics: School year 2010–11 ........................................................................ A-8
8a. Standard errors for the percentage of public high schools with students enrolled in dual credit courses indicating that transportation was needed for dual credit courses, and of these schools, percentage indicating which sources were responsible for students’ transportation costs to dual credit courses, by school characteristics: School year 2010–11 ........................................................................ A-9
9a. Standard errors for the percentage of public high schools with students enrolled in dual credit courses reporting that some students earned various types of credentials from a postsecondary institution by taking dual credit courses, by school characteristics: School year 2010–11 ........................................................ A-10
10a. Standard errors for the percentage of public high schools with students enrolled in dual credit courses, and among those schools, percentage with students enrolled in various types of dual credit courses, by school characteristics: School year 2010–11 ................................................................................................. A-11
11a. Standard errors for the percentage of public high schools with students enrolled in dual credit courses indicating how students are awarded postsecondary credit, by dual credit course focus and school characteristics: School year 2010–11 .......... A-12
12a. Standard errors for the percentage of public high schools with students enrolled in dual credit courses indicating whether most students (and their parents) generally paid out of pocket for various dual credit course expenses, by dual credit course focus and school characteristics: School year 2010–11 ....................... A-13
13a. Standard errors for the percentage of public high schools with students enrolled in dual credit courses indicating whether the school or district paid for various dual credit course expenses for any students, by dual credit course focus and school characteristics: School year 2010–11 ............................................................. A-14
14a. Standard errors for the percentage distribution of public high schools with students enrolled in dual credit courses taught at locations for secondary school students indicating who the instructors were for the dual credit courses, by dual credit course focus and school characteristics: School year 2010–11 ....................... A-15
viii
Table Page
15a. Standard errors for the percentage distribution of public high schools with students enrolled in dual credit courses taught on the campus of a postsecondary institution indicating the most common student composition, by dual credit course focus and school characteristics: School year 2010–11 ................................. A-16
Appendix B Table
B-1. Number and percentage of responding public high schools in the study sample, and estimated number and percentage of public high schools the sample represents, by school characteristics: School year 2010–11 ...................................... B-3

1
Introduction
This report provides nationally representative data on the prevalence and characteristics of dual credit and exam-based courses in public high schools. For this survey, dual credit is defined as a course or program where high school students can earn both high school and postsecondary credits for the same courses; exam-based courses are Advanced Placement (AP) and International Baccalaureate (IB) courses.1 The National Center for Education Statistics (NCES) previously collected data on dual credit and exam-based courses for the 2002–03 school year from high schools (Waits, Setzer, and Lewis 2005; Kleiner and Lewis 2005). To gather current data on dual credit and dual enrollment, NCES fielded an updated survey of public high schools on dual credit and a complementary survey of postsecondary institutions on dual enrollment.2 The study presented in this report collected information from public high schools with grade 11 or 12 about dual credit and exam-based courses for high school students in the 2010–11 school year.
Specifically, the survey covered the following:
• Whether any students at the high school took AP or IB courses during the 12-month 2010–11 school year,3
and if so, the total number of enrollments in these courses;
• Whether any students at the high school took AP courses for which they could earn dual credit without taking the AP exam, and if so, the total number of enrollments in these courses;
• Whether students at the high school took any courses for which they could earn dual credit with any postsecondary institution during the 12-month 2010–11 school year;
• Whether the high school reported any established requirements that students must meet in order to enroll in dual credit courses, and if so, the specific types of requirements;
• Whether students at the high school earned certificates,4 associate’s degrees, or bachelor’s degrees from a postsecondary institution during the 12-month 2010–11 school year by taking dual credit courses;
• Whether students at the high school took any courses for dual credit with an academic focus or with a career and technical/vocational focus5 during the 12-month 2010–11 school year;
• The total number of high school enrollments during the 12-month 2010–11 school year in dual credit courses taught primarily through distance education, taught at locations for secondary school students,6 and taught on the campus of a postsecondary institution, by course focus (academic or career and technical/vocational);
• Whether dual credit courses taught at locations for secondary school students were taught by high school or postsecondary instructors, by course focus;
• The most common student composition (i.e., high school students only or high school and postsecondary students) for dual credit courses taught on the campus of a postsecondary institution, by course focus;
1 The following definitions of AP and IB courses were included in the survey: Advanced Placement (AP) courses are defined as courses that follow the content and curricular goals developed and published by the College Board. International Baccalaureate (IB) courses compose a liberal arts curriculum that leads to a diploma and meets the requirements established by the International Baccalaureate program. 2 For results from the postsecondary dual enrollment survey, see Dual Enrollment of High school Students at Postsecondary Institutions: 2010–11 (NCES 2013-002). 3 Respondents were provided the following explanation about the reporting time period in the instructions section of the survey: The time frame for this survey is the 12-month 2010–11 school year. This includes courses during the summer of 2010 or the summer of 2011, depending upon how records are kept at your school. 4 Certificate refers to a postsecondary certificate or diploma that normally requires 1 to 2 years of study to complete, such as pharmacy technician or automotive technology. 5 The following examples of courses with an academic focus were included in the survey: English, math, science, history, and foreign languages. The following examples of courses with a career and technical/vocational focus were included in the survey: business, computer technology, automotive technology, and health care (e.g., nursing). 6 In the instructions section of the survey, respondents were given the following instructions for locations for secondary school students: include high school campus(es) and locations such as career centers run by the public school system.
2
• Whether students were awarded postsecondary credit immediately upon completion of courses, and whether students were offered “credit in escrow,” 7 by course focus;
• The types of expenses generally paid out of pocket by students and their parents for dual credit courses during the 12-month 2010–11 school year, by course focus;
• Whether the high school or district paid any of various types of expenses for dual credit courses taken by any of the school’s students during the 12-month 2010–11 school year, by course focus; and
• The sources responsible for the high school students’ transportation costs for participation in dual credit courses during the 12-month 2010–11 school year.
NCES, in the Institute of Education Sciences, conducted this survey in fall 2011 using the Fast Response Survey System (FRSS). FRSS is a survey system designed to collect small amounts of issue-oriented data from a nationally representative sample of districts, schools, or teachers with minimal burden on respondents and within a relatively short period of time. The survey was mailed to approximately 1,500 public high schools with grade 11 or 12 in the 50 states and the District of Columbia. The unweighted survey response rate was 91 percent and the weighted response rate using the initial base weights was also 91 percent. The survey weights were adjusted for questionnaire nonresponse and the data were then weighted to yield national estimates that represent all eligible public high schools in the United States.
Because the purpose of this report is to introduce new NCES data from the survey through the presentation of tables containing descriptive information, only selected national findings are presented. These findings have been chosen to demonstrate the range of information available from the FRSS study rather than to discuss all of the data collected; they are not meant to emphasize any particular issue. Readers are cautioned not to make causal inferences about the data presented here. The findings are based on self-reported data from public high schools.
Many of the variables examined are related to one another, and complex interactions and relationships have not been explored. Tables of standard error estimates are provided in appendix A. See the technical notes (appendix B) for detailed information about the survey methodology. The questionnaire is located in appendix C.
7 The following explanation of credit in escrow was included in the survey: students must enroll in a specific postsecondary institution after high school graduation in order to receive the credit.

3
Selected Findings
This section presents selected findings on dual credit and exam-based courses (AP or IB) based on self-reported data from public high schools for the 12-month 2010–11 school year. Findings are calculated based on different populations (e.g., all public high schools or only those with dual credit courses) and presented in groups that reflect these populations.
Findings based on all public high schools:
• During the 2010–11 school year, 82 percent of high schools reported that students were enrolled in dual credit courses and 69 percent reported enrollments in AP or IB courses (table 1).
• Fifty-nine percent of high schools reported enrollments in both dual credit and AP or IB courses (table 2). • High schools reported approximately 2 million enrollments in dual credit courses and about 3.5 million
enrollments in AP or IB courses (table 3).8 • About three-quarters (76 percent) of all high schools reported that students took dual credit courses with
an academic focus, and about half (49 percent) of all high schools reported that students took dual credit courses with a career and technical/vocational focus (table 4).
• About half (51 percent) of all high schools reported that students took dual credit courses with an academic focus and about a third (34 percent) reported that students took dual credit courses with a career and technical/vocational focus, at locations for secondary school students (table 5).
• High schools reported about 1.4 million enrollments for dual credit courses with an academic focus, and about 601,500 enrollments for dual credit courses with a career and technical/vocational focus (table 6).
Findings based on public high schools with students enrolled in dual credit courses:
• Among high schools with students enrolled in dual credit courses, 63 percent reported having established requirements that students must meet to take dual credit courses (table 7).
• Among high schools with students enrolled in any dual credit courses, 57 percent reported that transportation was needed for at least some of the dual credit courses (table 8). These schools reported that the following sources were responsible for the transportation costs: parents/students (86 percent), the school/district (31 percent), and the state (5 percent).9
• Among high schools with students enrolled in dual credit courses, 14 percent reported that some students earned postsecondary certificates and 7 percent reported that some students earned associate’s degrees during the 2010–11 school year by taking dual credit courses (table 9).
• Among the high schools with students enrolled in dual credit courses, 62 percent reported that students took dual credit courses with an academic focus taught at locations for secondary school students and 42 percent reported that students took dual credit courses with a career and technical/vocational focus taught at these locations (table 10).
Findings based on public high schools with students enrolled in dual credit courses with (1) an academic focus; or (2) a career and technical/vocational focus:
• Among high schools with students enrolled dual credit courses with an academic focus, 93 percent reported that students were awarded postsecondary credit immediately upon completion of courses (table 11). Among high schools with students enrolled in dual credit courses with a career and technical/vocational focus, 85 percent reported that students were awarded postsecondary credit immediately upon completion of courses.
8 High schools were instructed to count a student for each relevant course in which he or she was enrolled. Therefore, course enrollments may include duplicated counts of students. 9 Schools could report that more than one source was responsible for transportation costs.

4
• When high schools with students enrolled in dual credit courses with an academic focus were asked whether most students (and their parents) generally paid out of pocket for these courses, 45 percent reported that students paid full or partial tuition, 46 percent reported that students paid fees, and 47 percent reported that students paid for books (table 12). When high schools with students taking dual credit courses with a career and technical/vocational focus were asked the same question, 28 percent reported that students paid full or partial tuition, 34 percent reported that students paid fees, and 31 percent reported that students paid for books.
• High schools with students enrolled in dual credit courses with an academic focus reported that the school or district paid the following expenses for at least some students taking these courses: full or partial tuition (43 percent), fees (33 percent), and books (44 percent) (table 13). Similarly, high schools with students taking dual credit courses with a career and technical/vocational focus reported that the school or district paid the following expenses for at least some students for these courses: full or partial tuition (43 percent), fees (34 percent), and books (44 percent).
Findings based on public high schools with students enrolled in dual credit courses with an academic or career and technical/vocational focus taught (1) at locations for secondary school students; or (2) on the campus of a postsecondary institution:
• Of the high schools with students enrolled in dual credit courses with an academic focus taught at locations for secondary school students, 61 percent reported these courses were taught solely by high school instructors (table 14). For schools with students in dual credit courses with a career and technical/vocational focus taught at locations for secondary school students, 67 percent reported these courses were taught by high school instructors only.
• Among the high schools with students enrolled in dual credit courses with an academic focus taught on a postsecondary campus, 69 percent reported that both high school and postsecondary students were enrolled in these courses (table 15). For the high schools with students enrolled in dual credit courses with a career and technical/vocational focus taught on a postsecondary campus, 62 percent reported that both high school and postsecondary students were enrolled in the courses.

5
Tables

6
Table 1. Percentage of public high schools with students enrolled in dual credit courses, Advanced Placement (AP) or International Baccalaureate courses (IB), and AP courses eligible for dual credit without the AP exam, by school characteristics: School year 2010–11
School characteristic Dual credit courses1
Advanced Placement or International
Baccalaureate courses1
Advanced Placement courses eligible
for dual credit without the AP exam2
All public high schools ...................................................................... 82 69 8
Enrollment size Less than 500 ........................................................................................ 78 43 4 500 to 1,199 .......................................................................................... 87 87 10 1,200 or more ....................................................................................... 86 98 14
Community type City ....................................................................................................... 72 79 10 Suburban ............................................................................................... 78 89 11 Town .................................................................................................... 90 75 11 Rural ..................................................................................................... 86 55 5
Region Northeast .............................................................................................. 77 89 12 Southeast .............................................................................................. 86 75 6 Central .................................................................................................. 85 52 6 West ..................................................................................................... 80 70 9
Percent combined enrollment of Black and other races/ethnicities3 Less than 6 percent ............................................................................... 91 58 6 6 to 20 percent ...................................................................................... 84 72 8 21 to 49 percent .................................................................................... 81 74 9 50 percent or more ................................................................................ 75 72 9
1 Includes AP courses eligible for dual credit without taking the AP exam. 2 The percentage of high schools with AP courses eligible for dual credit without taking the AP exam is a subset of the percentage of high schools with dual credit courses and a subset of the percentage of high schools with AP or IB courses. 3 Other races/ethnicities include Hispanic, Asian, Native Hawaiian/Pacific Islander, American Indian/Alaska Native, and students of two or more races. SOURCE: U.S. Department of Education, National Center for Education Statistics, Fast Response Survey System (FRSS), “Dual Credit and Exam-Based Courses,” FRSS 104, 2011.

7
Table 2. Percentage distribution of public high schools reporting whether students were enrolled in dual credit and/or Advanced Placement (AP) or International Baccalaureate (IB) courses, by school characteristics: School year 2010–11
School characteristic Dual credit
courses only
Advanced Placement or International
Baccalaureate courses only
Both dual credit courses and
Advanced Placement or International
Baccalaureate courses
No dual credit, and no Advanced
Placement or International
Baccalaureate courses
All public high schools ...................................................... 24 11 59 7
Enrollment size Less than 500 ........................................................................ 43 9 34 14 500 to 1,199 .......................................................................... 11 11 76 2! 1,200 or more ....................................................................... 2! 14 84 ‡
Community type City ....................................................................................... 8 15 64 13 Suburban ............................................................................... 6 17 72 5! Town .................................................................................... 21 6! 69 4! Rural ..................................................................................... 39 8 47 6
Region Northeast .............................................................................. 7 19 70 3! Southeast .............................................................................. 19 9 67 5 Central .................................................................................. 38 6 47 10 West ..................................................................................... 22 12 58 8
Percent combined enrollment of Black and other races/ethnicities1
Less than 6 percent ............................................................... 39 5 52 4! 6 to 20 percent ...................................................................... 22 9 63 7 21 to 49 percent .................................................................... 20 12 62 7 50 percent or more ................................................................ 17 15 57 10
! Interpret data with caution; the coefficient of variation is greater than or equal to 30 percent. ‡ Reporting standards not met. The coefficient of variation for this estimate is 50 percent or greater or the sample size is less than 3. 1 Other races/ethnicities include Hispanic, Asian, Native Hawaiian/Pacific Islander, American Indian/Alaska Native, and students of two or more races. NOTE: Detail may not sum to totals because of rounding. SOURCE: U.S. Department of Education, National Center for Education Statistics, Fast Response Survey System (FRSS), “Dual Credit and Exam-Based Courses,” FRSS 104, 2011.

8
Table 3. Total enrollments of public high school students in dual credit courses, Advanced Placement (AP) or International Baccalaureate (IB) courses, and AP courses eligible for dual credit without the AP exam, by school characteristics: School year 2010–11
School characteristic Enrollments in
dual credit courses1
Enrollments in Advanced Placement
or International Baccalaureate
courses1
Enrollments in Advanced Placement
courses eligible for dual credit
without the AP exam2
All public high schools ........................................................................ 2,036,700 3,457,100 153,300
Enrollment size Less than 500 .......................................................................................... 365,100 130,900 9,400! 500 to 1,199 ............................................................................................ 599,100 796,400 44,900 1,200 or more ......................................................................................... 1,072,500 2,529,900 99,000
Community type City ......................................................................................................... 482,000 1,055,400 54,700 Suburban ................................................................................................. 565,800 1,601,700 59,200 Town ...................................................................................................... 357,000 266,600 13,400 Rural ....................................................................................................... 631,900 533,500 26,000
Region Northeast ................................................................................................ 300,500 658,900 33,200 Southeast ................................................................................................ 396,200 822,000 19,600 Central .................................................................................................... 551,800 602,900 33,100 West ....................................................................................................... 788,200 1,373,400 67,500
Percent combined enrollment of Black and other races/ethnicities3 Less than 6 percent ................................................................................. 339,400 199,000 9,600! 6 to 20 percent ........................................................................................ 617,500 831,800 48,900 21 to 49 percent ...................................................................................... 513,200 1,111,200 34,900 50 percent or more .................................................................................. 566,600 1,315,200 59,800
! Interpret data with caution; the coefficient of variation is greater than or equal to 30 percent. 1 Includes enrollments in AP courses eligible for dual credit without taking the AP exam. 2 The enrollment for AP courses eligible for dual credit without taking the AP exam is a subset of the enrollment for dual credit courses and a subset of the enrollment for AP or IB courses. 3 Other races/ethnicities include Hispanic, Asian, Native Hawaiian/Pacific Islander, American Indian/Alaska Native, and students of two or more races. NOTE: Enrollments may include duplicated counts of students (each student was counted for each relevant course in which he/she was enrolled). Detail may not sum to totals because of rounding. SOURCE: U.S. Department of Education, National Center for Education Statistics, Fast Response Survey System (FRSS), “Dual Credit and Exam-Based Courses,” FRSS 104, 2011.

9 Table 4. Percentage of public high schools with students enrolled in dual credit courses, by dual credit course focus and school
characteristics: School year 2010–11
School characteristic
High schools with any students taking dual
credit courses1
High schools with students enrolled in dual credit courses with an academic focus
High schools with students enrolled in dual credit courses with a career
and technical/vocational focus
Percent based on all high schools1
Percent based on high schools with students enrolled in dual credit courses2
Percent based on all high schools1
Percent based on high schools with students enrolled in dual credit courses2
All public high schools ...................................................................... 82 76 93 49 59
Enrollment size Less than 500 ........................................................................................ 78 73 94 42 54 500 to 1,199 .......................................................................................... 87 81 94 52 60 1,200 or more ....................................................................................... 86 78 91 58 67
Community type City ....................................................................................................... 72 67 92 46 64 Suburban ............................................................................................... 78 69 89 44 57 Town .................................................................................................... 90 86 96 63 70 Rural ..................................................................................................... 86 80 94 47 55
Region Northeast .............................................................................................. 77 74 96 36 46 Southeast .............................................................................................. 86 80 92 49 56 Central .................................................................................................. 85 79 93 54 64 West ..................................................................................................... 80 73 92 50 63
Percent combined enrollment of Black and other races/ethnicities3 Less than 6 percent ............................................................................... 91 86 95 51 56 6 to 20 percent ...................................................................................... 84 81 96 54 64 21 to 49 percent .................................................................................... 81 75 92 47 58 50 percent or more ................................................................................ 75 67 89 44 59
1 Percentages are based on all public high schools. 2 Percentages are based on the 82 percent of public high schools with students enrolled in dual credit courses during the 12-month 2010–11 school year. 3 Other races/ethnicities include Hispanic, Asian, Native Hawaiian/Pacific Islander, American Indian/Alaska Native, and students of two or more races. NOTE: The following examples of courses with an academic focus were included in the survey: English, math, science, history, and foreign languages. The following examples of courses with a career and technical/vocational focus were included in the survey: business, computer technology, automotive technology, and health care (e.g., nursing). High schools could have both dual credit courses with an academic focus and dual credit courses with a career and technical/vocational focus. SOURCE: U.S. Department of Education, National Center for Education Statistics, Fast Response Survey System (FRSS), “Dual Credit and Exam-Based Courses,” FRSS 104, 2011.

10 Table 5. Percentage of all public high schools with students enrolled in dual credit courses taught through distance education or at
various locations, by course focus and school characteristics: School year 2010–11
School characteristic
Academic focus Career and technical/vocational focus
Taught primarily through distance
education
Taught at locations for secondary
school students1
Taught on the campus of a
postsecondary institution
Taught primarily through distance
education
Taught at locations for secondary
school students1
Taught on the campus of a
postsecondary institution
All public high schools ..................................................................... 28 51 43 7 34 21
Enrollment size Less than 500 ....................................................................................... 36 46 34 9 26 17 500 to 1,199 ......................................................................................... 23 56 51 6 38 22 1,200 or more ...................................................................................... 16 55 51 5 44 26
Community type City ...................................................................................................... 15 43 46 3! 32 24 Suburban .............................................................................................. 13 45 48 5 33 18 Town ................................................................................................... 28 65 52 9 48 25 Rural .................................................................................................... 38 53 37 9 32 19
Region Northeast ............................................................................................. 10 53 39 ‡ 28 8 Southeast ............................................................................................. 31 50 49 9 33 26 Central ................................................................................................. 28 55 42 8 39 22 West .................................................................................................... 33 47 41 9 34 23
Percent combined enrollment of Black and other races/ethnicities2 Less than 6 percent .............................................................................. 31 65 37 9 39 16 6 to 20 percent ..................................................................................... 28 56 50 9 38 24 21 to 49 percent ................................................................................... 28 51 41 5 33 22 50 percent or more ............................................................................... 24 37 43 5 28 21
! Interpret data with caution; the coefficient of variation is greater than or equal to 30 percent. ‡ Reporting standards not met. The coefficient of variation for this estimate is 50 percent or greater or the sample size is less than 3. 1 In the instructions section of the survey, respondents were given the following instructions for locations for secondary school students: include high school campus(es) and locations such as career centers run by the public school system. 2 Other races/ethnicities include Hispanic, Asian, Native Hawaiian/Pacific Islander, American Indian/Alaska Native, and students of two or more races. NOTE: Percentages are based on all public high schools. The following examples of courses with an academic focus were included in the survey: English, math, science, history, and foreign languages. The following examples of courses with a career and technical/vocational focus were included in the survey: business, computer technology, automotive technology, and health care (e.g., nursing). High schools could have both dual credit courses with an academic focus and dual credit courses with a career and technical/vocational focus. SOURCE: U.S. Department of Education, National Center for Education Statistics, Fast Response Survey System (FRSS), “Dual Credit and Exam-Based Courses,” FRSS 104, 2011.

11 Table 6. Number of high school student enrollments in dual credit courses with an academic focus or a career and technical/vocational
focus, by distance education or course location and school characteristics: School year 2010–11
School characteristic
Academic focus Career and technical/vocational focus
Total
Taught primarily
through distance
education
Taught at locations for
secondary school
students1
Taught on the campus of a
postsecondary institution Total
Taught primarily
through distance
education
Taught at locations for
secondary school
students1
Taught on the campus of a
postsecondary institution
All public high schools ......................................... 1,435,200 98,700 1,046,500 290,000 601,500 15,600 515,900 70,000
Enrollment size Less than 500 ........................................................... 283,600 49,000 147,100 87,500! 81,600 5,500 61,200 14,800 500 to 1,199 ............................................................. 435,700 27,200 321,100 87,400 163,500 6,700! 130,600 26,100 1,200 or more .......................................................... 716,000 22,600 578,300 115,100 356,500 3,400 324,100 29,100
Community type City .......................................................................... 326,100 9,300 244,700 72,200 155,800 1,600! 135,300 18,900 Suburban .................................................................. 414,700 12,800! 330,000 71,900 151,100 2,400! 134,700 14,000 Town ....................................................................... 241,100 16,800! 181,800 42,600 116,000 2,100! 99,000 14,900 Rural ........................................................................ 453,300 59,900 290,000 103,400! 178,700 9,500! 146,900 22,300
Region Northeast ................................................................. 250,600 3,600! 218,000 29,000 50,000 ‡ 48,400 1,400 Southeast ................................................................. 296,700 28,900 155,300 112,500! 99,400 7,200! 70,400 21,800 Central ..................................................................... 381,100 23,700 307,600 49,800 170,700 3,600! 150,300 16,800 West ........................................................................ 506,800 42,500 365,600 98,700 281,400 4,600 246,800 30,000
Percent combined enrollment of Black and other races/ethnicities2
Less than 6 percent .................................................. 249,200 23,300 200,100 25,800 90,200 6,600! 72,800 10,900 6 to 20 percent ......................................................... 445,000 22,200 340,100 82,700 172,600 3,800! 150,800 18,000 21 to 49 percent ....................................................... 358,700 22,200 235,700 100,900! 154,400 2,100! 134,600 17,700 50 percent or more ................................................... 382,300 31,000 270,600 80,700 184,300 3,100! 157,800 23,400
! Interpret data with caution; the coefficient of variation is greater than or equal to 30 percent. ‡ Reporting standards not met. The coefficient of variation for this estimate is 50 percent or greater or the sample size is less than 3. 1 In the instructions section of the survey, respondents were given the following instructions for locations for secondary school students: include high school campus(es) and locations such as career centers run by the public school system. 2 Other races/ethnicities include Hispanic, Asian, Native Hawaiian/Pacific Islander, American Indian/Alaska Native, and students of two or more races.
NOTE: The following examples of courses with an academic focus were included in the survey: English, math, science, history, and foreign languages. The following examples of courses with a career and technical/vocational focus were included in the survey: business, computer technology, automotive technology, and health care (e.g., nursing). Enrollments may include duplicated counts of students (each student was counted for each relevant course in which he/she was enrolled). Detail may not sum to totals because of rounding. High schools could have both dual credit courses with an academic focus and dual credit courses with a career and technical/vocational focus. SOURCE: U.S. Department of Education, National Center for Education Statistics, Fast Response Survey System (FRSS), “Dual Credit and Exam-Based Courses,” FRSS 104, 2011.

12 Table 7. Percentage of public high schools with students enrolled in dual credit courses reporting that their school has established
requirements that students must meet to enroll in dual credit courses, and for those schools, the percentage indicating various types of requirements, by school characteristics: School year 2010–11
School characteristic
School has established
requirements for enrolling
in dual credit
courses1
Requirements for enrolling in dual credit courses2
Teacher recommen-
dation
School administrator
or guidance counselor approval Grade level
Minimum GPA
Minimum high school
class rank
Satisfactory high school attendance
record
Minimum score on a
standardized test
Passing college
placement test
Other requirement3
All public high schools ............................. 63 46 77 81 49 5 36 36 43 12
Enrollment size Less than 500 ............................................. 63 49 81 85 48 6 39 43 50 12 500 to 1,199 ............................................... 66 46 78 80 52 7 36 33 34 10 1,200 or more ............................................. 60 41 71 77 46 2! 29 28 43 16
Community type City ............................................................ 66 47 77 80 47 5! 42 30 46 11 Suburban .................................................... 62 45 74 76 50 ‡ 38 29 36 13 Town .......................................................... 70 47 74 87 47 10! 35 31 41 17 Rural .......................................................... 61 46 80 82 50 5 33 44 45 11
Region Northeast ................................................... 72 62 72 77 46 5! 39 6! 24 17 Southeast ................................................... 63 45 86 85 67 4! 41 53 44 6! Central ....................................................... 59 39 72 84 50 10 33 50 43 9 West ........................................................... 64 43 79 79 35 ‡ 32 28 54 18
Percent combined enrollment of Black and other races/ethnicities4
Less than 6 percent .................................... 58 48 75 83 52 7! 29 45 40 12 6 to 20 percent ........................................... 69 46 78 84 47 5! 37 36 38 9 21 to 49 percent ......................................... 59 41 72 77 51 4! 36 37 45 13 50 percent or more ..................................... 66 48 83 81 47 5! 40 30 49 15
! Interpret data with caution; the coefficient of variation is greater than or equal to 30 percent. ‡ Reporting standards not met. The coefficient of variation for this estimate is 50 percent or greater or the sample size is less than 3. 1 Percentages are based on the 82 percent of public high schools with students enrolled in dual credit courses during the 12-month 2010–11 school year. 2 Percentages are based on the public high schools with students enrolled in dual credit courses that have established requirements students must meet to enroll in these courses. Of the 82 percent of public high schools with students enrolled in dual credit courses during the 12-month 2010–11 school year, 63 percent have established requirements to enroll in these courses. 3 Examples of other requirements reported include a prerequisite course and a writing sample. 4 Other races/ethnicities include Hispanic, Asian, Native Hawaiian/Pacific Islander, American Indian/Alaska Native, and students of two or more races. NOTE: Requirements exclude any state or specific postsecondary entrance requirements. Response options in the questionnaire were “yes,” “no,” and “don’t know.” SOURCE: U.S. Department of Education, National Center for Education Statistics, Fast Response Survey System (FRSS), “Dual Credit and Exam-Based Courses,” FRSS 104, 2011.

13
Table 8. Percentage of public high schools with students enrolled in dual credit courses indicating that transportation was needed for dual credit courses, and of these schools, percentage indicating which sources were responsible for students’ transportation costs to dual credit courses, by school characteristics: School year 2010–11
School characteristic
Transportation needed for any
dual credit course1
Source responsible for cost2
The school/ district The state
Postsecondary institution
Parents/ students
All public high schools ......................................... 57 31 5 2! 86
Enrollment size Less than 500 ........................................................... 52 33 6! ‡ 84 500 to 1,199 ............................................................. 60 30 6 ‡ 86 1,200 or more .......................................................... 63 28 3! 2! 90
Community type City .......................................................................... 68 31 6! ‡ 88 Suburban .................................................................. 64 27 2! ‡ 88 Town ....................................................................... 54 30 4! ‡ 88 Rural ........................................................................ 52 32 6! ‡ 84
Region Northeast ................................................................. 51 33 ‡ # 81 Southeast ................................................................. 61 32 6! ‡ 83 Central ..................................................................... 58 30 ‡ # 90 West ........................................................................ 57 29 7! 4! 87
Percent combined enrollment of Black and other races/ethnicities3
Less than 6 percent .................................................. 49 35 ‡ # 82 6 to 20 percent ......................................................... 61 24 3! # 95 21 to 49 percent ....................................................... 57 28 8! ‡ 87 50 percent or more ................................................... 61 36 6! 5! 80
# Rounds to zero. ! Interpret data with caution; the coefficient of variation is greater than or equal to 30 percent. ‡ Reporting standards not met. The coefficient of variation for this estimate is 50 percent or greater or the sample size is less than 3. 1 Percentages are based on the 82 percent of public high schools with students enrolled in dual credit courses during the 12-month 2010–11 school year. 2 Percentages are based on the public high schools with students needing transportation to dual credit courses. Of the 82 percent of public high schools with students enrolled in dual credit courses during the 12-month 2010-11 school year, 57 percent needed transportation. Percentages do not sum to 100 because schools could indicate that more than one source was responsible for transportation costs and could indicate “other” as a source. 3 Other races/ethnicities include Hispanic, Asian, Native Hawaiian/Pacific Islander, American Indian/Alaska Native, and students of two or more races. SOURCE: U.S. Department of Education, National Center for Education Statistics, Fast Response Survey System (FRSS), “Dual Credit and Exam-Based Courses,” FRSS 104, 2011.

14
Table 9. Percentage of public high schools with students enrolled in dual credit courses reporting that some students earned various types of credentials from a postsecondary institution by taking dual credit courses, by school characteristics: School year 2010–11
School characteristic Certificate1 Associate’s degree Bachelor’s degree
All public high schools ...................................................................... 14 7 1!
Enrollment size Less than 500 ........................................................................................ 9 5 ‡ 500 to 1,199 .......................................................................................... 17 8 ‡ 1,200 or more ....................................................................................... 19 11 1!
Community type City ....................................................................................................... 18 8 ‡ Suburban ............................................................................................... 17 9 2! Town .................................................................................................... 14 7 # Rural ..................................................................................................... 12 7 ‡
Region Northeast .............................................................................................. 6 3! 3! Southeast .............................................................................................. 21 11 ‡ Central .................................................................................................. 11 4 # West ..................................................................................................... 17 10 ‡
Percent combined enrollment of Black and other races/ethnicities2 Less than 6 percent ............................................................................... 10 3! ‡ 6 to 20 percent ...................................................................................... 16 12 1! 21 to 49 percent .................................................................................... 16 11 ‡ 50 percent or more ................................................................................ 16 5 ‡
# Rounds to zero. ! Interpret data with caution; the coefficient of variation is greater than or equal to 30 percent. ‡ Reporting standards not met. The coefficient of variation for this estimate is 50 percent or greater or the sample size is less than 3. 1 Certificate refers to a postsecondary certificate or diploma that normally requires 1 to 2 years of study to complete, such as pharmacy technician or automotive technology. 2 Other races/ethnicities include Hispanic, Asian, Native Hawaiian/Pacific Islander, American Indian/Alaska Native, and students of two or more races. NOTE: Percentages are based on the 82 percent of public high schools with students enrolled in dual credit courses during the 12-month 2010–11 school year. SOURCE: U.S. Department of Education, National Center for Education Statistics, Fast Response Survey System (FRSS), “Dual Credit and Exam-Based Courses,” FRSS 104, 2011.

15
Table 10. Percentage of public high schools with students enrolled in dual credit courses, and among those schools, percentage with students enrolled in various types of dual credit courses, by school characteristics: School year 2010–11
School characteristic
High schools with any students
enrolled in dual credit courses1
Academic focus2 Career and technical/vocational focus2
Taught primarily through distance
education
Taught at locations for
secondary school students3
Taught on the campus of a
postsecondary institution
Taught primarily through distance
education
Taught at locations for
secondary school students3
Taught on the campus of a
postsecondary institution
All public high schools .......................................... 82 33 62 52 9 42 25
Enrollment size Less than 500 ........................................................... 78 47 59 43 11 34 22 500 to 1,199 ............................................................. 87 27 65 59 7 44 26 1,200 or more .......................................................... 86 19 64 59 6 51 30
Community type City ........................................................................... 72 21 59 63 4! 44 33 Suburban ................................................................... 78 17 58 62 6 42 24 Town ........................................................................ 90 31 72 58 10 53 28 Rural ........................................................................ 86 45 62 43 11 37 23
Region Northeast ................................................................. 77 13 69 50 ‡ 36 11 Southeast ................................................................. 86 36 58 57 10 38 30 Central ..................................................................... 85 34 65 50 9 46 26 West ........................................................................ 80 42 59 52 11 43 29
Percent combined enrollment of Black and other races/ethnicities4
Less than 6 percent .................................................. 91 34 72 41 10 43 18 6 to 20 percent .......................................................... 84 33 66 59 11 45 28 21 to 49 percent ........................................................ 81 35 62 50 6 41 27 50 percent or more .................................................... 75 32 50 58 7 38 29
! Interpret data with caution; the coefficient of variation is greater than or equal to 30 percent. ‡ Reporting standards not met. The coefficient of variation for this estimate is 50 percent or greater or the sample size is less than 3. 1 Percentages are based on all public high schools. 2 Percentages are based on the 82 percent of public high schools with students enrolled in dual credit courses during the 12-month 2010–11 school year. 3 In the instructions section of the survey, respondents were given the following instructions for locations for secondary school students: include high school campus(es) and locations such as career centers run by the public school system. 4 Other races/ethnicities include Hispanic, Asian, Native Hawaiian/Pacific Islander, American Indian/Alaska Native, and students of two or more races.
NOTE: The following examples of courses with an academic focus were included in the survey: English, math, science, history, and foreign languages. The following examples of courses with a career and technical/vocational focus were included in the survey: business, computer technology, automotive technology, and health care (e.g., nursing). High schools could have both dual credit courses with an academic focus and dual credit courses with a career and technical/vocational focus. SOURCE: U.S. Department of Education, National Center for Education Statistics, Fast Response Survey System (FRSS), “Dual Credit and Exam-Based Courses,” FRSS 104, 2011.

16
Table 11. Percentage of public high schools with students enrolled in dual credit courses indicating how students are awarded postsecondary credit, by dual credit course focus and school characteristics: School year 2010–11
School characteristic
Academic focus1 Career and technical/
vocational focus2
Immediately upon
completion of courses
Credit in escrow
Immediately upon
completion of courses
Credit in escrow
All public high schools ..................................................................... 93 8 85 20
Enrollment size Less than 500 ....................................................................................... 97 4! 91 14 500 to 1,199 ......................................................................................... 93 8 83 22 1,200 or more ...................................................................................... 87 15 79 25
Community type City ...................................................................................................... 85 14 81 19 Suburban .............................................................................................. 89 13 79 26 Town ................................................................................................... 96 3! 90 16 Rural .................................................................................................... 97 6 87 19
Region Northeast ............................................................................................. 84 16 81 27 Southeast ............................................................................................. 92 9 86 20 Central ................................................................................................. 97 6 86 21 West .................................................................................................... 95 5 85 16
Percent combined enrollment of Black and other races/ethnicities3 Less than 6 percent .............................................................................. 97 5! 90 18 6 to 20 percent ..................................................................................... 93 11 85 22 21 to 49 percent ................................................................................... 93 7 84 17 50 percent or more ............................................................................... 90 10 82 22
! Interpret data with caution; the coefficient of variation is greater than or equal to 30 percent. 1 Percentages are based on the 76 percent of public high schools with students enrolled in dual credit courses with an academic focus during the 12-month 2010–11 school year. 2 Percentages are based on the 49 percent of public high schools with students enrolled in dual credit courses with a career and technical/vocational focus during the 12-month 2010–11 school year. 3 Other races/ethnicities include Hispanic, Asian, Native Hawaiian/Pacific Islander, American Indian/Alaska Native, and students of two or more races. NOTE: The following examples of courses with an academic focus were included in the survey: English, math, science, history, and foreign languages. The following examples of courses with a career and technical/vocational focus were included in the survey: business, computer technology, automotive technology, and health care (e.g., nursing). High schools could have both dual credit courses with an academic focus and dual credit courses with a career and technical/vocational focus. Percentages do not sum to 100 because schools could choose more than one category of postsecondary credit award or could choose a response of “other.” SOURCE: U.S. Department of Education, National Center for Education Statistics, Fast Response Survey System (FRSS), “Dual Credit and Exam-Based Courses,” FRSS 104, 2011.

17
Table 12. Percentage of public high schools with students enrolled in dual credit courses indicating whether most students (and their parents) generally paid out of pocket for various dual credit course expenses, by dual credit course focus and school characteristics: School year 2010–11
School characteristic
Academic focus1 Career and technical/
vocational focus2
Tuition (full or partial) Fees Books
Tuition (full or partial) Fees Books
All public high schools ..................................................................... 45 46 47 28 34 31
Enrollment size Less than 500 ....................................................................................... 44 45 45 25 33 31 500 to 1,199 ......................................................................................... 48 47 51 32 33 31 1,200 or more ...................................................................................... 42 47 45 28 38 31
Community type City ...................................................................................................... 25 28 37 22 29 26 Suburban .............................................................................................. 48 54 49 35 43 33 Town ................................................................................................... 43 48 50 27 34 33 Rural .................................................................................................... 50 48 48 28 33 31
Region Northeast ............................................................................................. 58 47 44 56 41 29 Southeast ............................................................................................. 37 41 41 20 34 28 Central ................................................................................................. 50 45 46 27 33 31 West .................................................................................................... 38 50 53 24 34 34
Percent combined enrollment of Black and other races/ethnicities3 Less than 6 percent .............................................................................. 55 42 40 36 35 26 6 to 20 percent ..................................................................................... 52 58 57 30 38 39 21 to 49 percent ................................................................................... 49 56 52 32 42 37 50 percent or more ............................................................................... 24 29 38 16 24 22
1 Percentages are based on the 76 percent of public high schools with students enrolled in dual credit courses with an academic focus during the 12-month 2010–11 school year. 2 Percentages are based on the 49 percent of public high schools with students enrolled in dual credit courses with a career and technical/vocational focus during the 12-month 2010–11 school year. 3 Other races/ethnicities include Hispanic, Asian, Native Hawaiian/Pacific Islander, American Indian/Alaska Native, and students of two or more races. NOTE: The following examples of courses with an academic focus were included in the survey: English, math, science, history, and foreign languages. The following examples of courses with a career and technical/vocational focus were included in the survey: business, computer technology, automotive technology, and health care (e.g., nursing). High schools could have both dual credit courses with an academic focus and dual credit courses with a career and technical/vocational focus. SOURCE: U.S. Department of Education, National Center for Education Statistics, Fast Response Survey System (FRSS), “Dual Credit and Exam-Based Courses,” FRSS 104, 2011.

18
Table 13. Percentage of public high schools with students enrolled in dual credit courses indicating whether the school or district paid for various dual credit course expenses for any students, by dual credit course focus and school characteristics: School year 2010–11
School characteristic
Academic focus1 Career and technical/
vocational focus2
Tuition (full or partial) Fees Books
Tuition (full or partial) Fees Books
All public high schools ..................................................................... 43 33 44 43 34 44
Enrollment size Less than 500 ....................................................................................... 42 36 45 43 33 42 500 to 1,199 ......................................................................................... 47 32 40 46 38 45 1,200 or more ...................................................................................... 38 31 47 40 32 48
Community type City ...................................................................................................... 47 42 51 41 41 53 Suburban .............................................................................................. 42 30 43 39 28 45 Town ................................................................................................... 41 32 39 45 35 40 Rural .................................................................................................... 42 33 44 45 34 42
Region Northeast ............................................................................................. 30 21 40 20 16 42 Southeast ............................................................................................. 41 33 46 45 34 45 Central ................................................................................................. 47 36 45 53 40 46 West .................................................................................................... 46 37 44 40 35 44
Percent combined enrollment of Black and other races/ethnicities3 Less than 6 percent .............................................................................. 41 31 46 45 31 42 6 to 20 percent ..................................................................................... 40 29 41 45 37 44 21 to 49 percent ................................................................................... 40 29 40 42 30 42 50 percent or more ............................................................................... 48 43 49 41 37 49
1 Percentages are based on the 76 percent of public high schools with students enrolled in dual credit courses with an academic focus during the 12-month 2010–11 school year. 2 Percentages are based on the 49 percent of public high schools with students enrolled in dual credit courses with a career and technical/vocational focus during the 12-month 2010–11 school year. 3 Other races/ethnicities include Hispanic, Asian, Native Hawaiian/Pacific Islander, American Indian/Alaska Native, and students of two or more races. NOTE: The following examples of courses with an academic focus were included in the survey: English, math, science, history, and foreign languages. The following examples of courses with a career and technical/vocational focus were included in the survey: business, computer technology, automotive technology, and health care (e.g., nursing). High schools could have both dual credit courses with an academic focus and dual credit courses with a career and technical/vocational focus. SOURCE: U.S. Department of Education, National Center for Education Statistics, Fast Response Survey System (FRSS), “Dual Credit and Exam-Based Courses,” FRSS 104, 2011.

19 Table 14. Percentage distribution of public high schools with students enrolled in dual credit courses taught at locations for secondary
school students indicating who the instructors were for the dual credit courses, by dual credit course focus and school characteristics: School year 2010–11
School characteristic
Academic focus1 Career and technical/vocational focus2
High school instructors only
Postsecondary instructors only
Both high school and postsecondary
instructors High school
instructors only Postsecondary
instructors only
Both high school and postsecondary
instructors
All public high schools ..................................................................... 61 11 28 67 14 19
Enrollment size Less than 500 ....................................................................................... 62 15 23 71 17 12 500 to 1,199 ......................................................................................... 54 8 38 62 14 24 1,200 or more ...................................................................................... 68 9 23 67 10 22
Community type City ...................................................................................................... 56 15 28 58 14! 28 Suburban .............................................................................................. 74 8 18 77 6! 17 Town ................................................................................................... 63 9! 28 66 19 15 Rural .................................................................................................... 57 12 31 66 15 19
Region Northeast ............................................................................................. 78 5! 17 86 ‡ 11! Southeast ............................................................................................. 52 13 35 48 29 23 Central ................................................................................................. 68 7! 25 70 10 20 West .................................................................................................... 51 18 31 69 12 19
Percent combined enrollment of Black and other races/ethnicities3 Less than 6 percent .............................................................................. 74 6! 20 75 8! 17 6 to 20 percent ..................................................................................... 62 12 26 66 14 20 21 to 49 percent ................................................................................... 60 14 26 72 13 15 50 percent or more ............................................................................... 45 15 40 54 21 25
! Interpret data with caution; the coefficient of variation is greater than or equal to 30 percent. ‡ Reporting standards not met. The coefficient of variation for this estimate is 50 percent or greater or the sample size is less than 3. 1 Percentages are based on the 51 percent of public high schools with students enrolled in dual credit courses with an academic focus taught at locations for secondary school students during the 12-month 2010–11 school year. 2 Percentages are based on the 34 percent of public high schools with students enrolled in dual credit courses with a career and technical/vocational focus taught at locations for secondary school students during the 12-month 2010–11 school year. 3 Other races/ethnicities include Hispanic, Asian, Native Hawaiian/Pacific Islander, American Indian/Alaska Native, and students of two or more races. NOTE: The following examples of courses with an academic focus were included in the survey: English, math, science, history, and foreign languages. The following examples of courses with a career and technical/vocational focus were included in the survey: business, computer technology, automotive technology, and health care (e.g., nursing). High schools could have both dual credit courses with an academic focus and dual credit courses with a career and technical/vocational focus. In the instructions section of the survey, respondents were given the following instructions for locations for secondary school students: include high school campus(es) and locations such as career centers run by the public school system. Detail may not sum to totals because of rounding. SOURCE: U.S. Department of Education, National Center for Education Statistics, Fast Response Survey System (FRSS), “Dual Credit and Exam-Based Courses,” FRSS 104, 2011.

20
Table 15. Percentage distribution of public high schools with students enrolled in dual credit courses taught on the campus of a postsecondary institution indicating the most common student composition, by dual credit course focus and school characteristics: School year 2010–11
School characteristic
Academic focus1 Career and technical/
vocational focus2
High school students only
High school and
postsecondary students
High school students only
High school and
postsecondary students
All public high schools ...................................................................... 31 69 38 62
Enrollment size Less than 500 ........................................................................................ 31 69 44 56 500 to 1,199 .......................................................................................... 31 69 29 71 1,200 or more ....................................................................................... 31 69 39 61
Community type City ....................................................................................................... 37 63 36 64 Suburban ............................................................................................... 28 72 38 62 Town .................................................................................................... 29 71 26 74 Rural ..................................................................................................... 31 69 43 57
Region Northeast .............................................................................................. 33 67 19! 81 Southeast .............................................................................................. 36 64 37 63 Central .................................................................................................. 23 77 39 61 West ..................................................................................................... 33 67 41 59
Percent combined enrollment of Black and other races/ethnicities3 Less than 6 percent ............................................................................... 28 72 53 47 6 to 20 percent ...................................................................................... 29 71 32 68 21 to 49 percent .................................................................................... 30 70 35 65 50 percent or more ................................................................................ 35 65 37 63
! Interpret data with caution; the coefficient of variation is greater than or equal to 30 percent. 1 Percentages are based on the 43 percent of public high schools with students enrolled in dual credit courses with an academic focus taught on the campus of a postsecondary institution during the 12-month 2010–11 school year. 2 Percentages are based on the 21 percent of public high schools with students enrolled in dual credit courses with a career and technical/vocational focus taught on the campus of a postsecondary institution during the 12-month 2010–11 school year. 3 Other races/ethnicities include Hispanic, Asian, Native Hawaiian/Pacific Islander, American Indian/Alaska Native, and students of two or more races. NOTE: The following examples of courses with an academic focus were included in the survey: English, math, science, history, and foreign languages. The following examples of courses with a career and technical/vocational focus were included in the survey: business, computer technology, automotive technology, and health care (e.g., nursing). High schools could have both dual credit courses with an academic focus and dual credit courses with a career and technical/vocational focus. SOURCE: U.S. Department of Education, National Center for Education Statistics, Fast Response Survey System (FRSS), “Dual Credit and Exam-Based Courses,” FRSS 104, 2011.

21
References
Kalton, G. (1983). Compensating for Missing Survey Data. Survey Research Center, Institute for Social Research: University of Michigan, 65–104.
Kleiner, B., and Lewis, L. (2005). Dual Enrollment of High School Students at Postsecondary Institutions: 2002–03 (NCES 2005-008). U.S. Department of Education. Washington, DC: National Center for Education Statistics. [Available at: http://nces.ed.gov/pubsearch/pubsinfo.asp?pubid=2009045]
Levy, P., and Lemeshow, S. (1991). Sampling of Populations. New York: J. Wiley & Sons.
Waits, T., Setzer, J.C., and Lewis, L. (2005). Dual Credit and Exam-Based Courses in U.S. Public High Schools: 2002–03 (NCES 2005-009). U.S. Department of Education. Washington, DC: National Center for Education Statistics.
[Available at: http://ies.ed.gov/pubsearch/pubsinfo.asp?pubid=2009031]

A-1
Appendix A
Standard Error Tables

A-2
Table 1a. Standard errors for the percentage of public high schools with students enrolled in dual credit courses, Advanced Placement (AP) or International Baccalaureate (IB) courses, and AP courses eligible for dual credit without the AP exam, by school characteristics: School year 2010–11
School characteristic Dual credit courses
Advanced Placement or International
Baccalaureate courses
Advanced Placement courses eligible
for dual credit without the AP exam
All public high schools ...................................................................... 1.4 1.2 0.8
Enrollment size Less than 500 ........................................................................................ 2.5 2.3 1.1 500 to 1,199 .......................................................................................... 1.6 1.8 1.4 1,200 or more ....................................................................................... 1.5 0.6 1.5
Community type City ....................................................................................................... 3.4 3.1 1.9 Suburban ............................................................................................... 2.5 2.4 1.6 Town .................................................................................................... 2.7 3.6 2.4 Rural ..................................................................................................... 1.9 2.1 1.0
Region Northeast .............................................................................................. 3.2 2.3 2.4 Southeast .............................................................................................. 2.3 2.5 1.6 Central .................................................................................................. 2.3 2.7 1.1 West ..................................................................................................... 2.6 2.4 1.5
Percent combined enrollment of Black and other races/ethnicities Less than 6 percent ............................................................................... 2.2 3.2 1.6 6 to 20 percent ...................................................................................... 2.6 2.9 1.3 21 to 49 percent .................................................................................... 2.7 3.0 1.6 50 percent or more ................................................................................ 2.9 2.3 1.4
SOURCE: U.S. Department of Education, National Center for Education Statistics, Fast Response Survey System (FRSS), “Dual Credit and Exam-Based Courses,” FRSS 104, 2011.

A-3
Table 2a. Standard errors for the percentage distribution of public high schools reporting whether students were enrolled in dual credit and/or Advanced Placement (AP) or International Baccalaureate (IB) courses, by school characteristics: School year 2010–11
School characteristic Dual credit
courses only
Advanced Placement or International
Baccalaureate courses only
Both dual credit courses and
Advanced Placement or International
Baccalaureate courses
No dual credit, and no Advanced
Placement or International
Baccalaureate courses
All public high schools ...................................................... 1.3 0.9 1.3 1.0
Enrollment size
Less than 500 ........................................................................ 2.5 1.5 2.3 2.1 500 to 1,199 .......................................................................... 1.6 1.5 2.0 0.7 1,200 or more ....................................................................... 0.6 1.4 1.5 †
Community type City ....................................................................................... 2.3 2.0 3.6 2.8 Suburban ............................................................................... 1.6 2.1 2.5 1.8 Town .................................................................................... 3.5 1.8 4.1 2.0 Rural ..................................................................................... 2.2 1.4 2.2 1.3
Region Northeast .............................................................................. 2.0 2.7 3.5 1.5 Southeast .............................................................................. 2.5 1.7 2.7 1.5 Central .................................................................................. 2.8 1.3 2.5 2.0 West ..................................................................................... 2.5 2.0 2.6 2.0
Percent combined enrollment of Black and other races/ethnicities
Less than 6 percent ............................................................... 3.3 1.6 3.3 1.4 6 to 20 percent ...................................................................... 2.8 1.8 3.2 1.8 21 to 49 percent .................................................................... 3.1 2.0 3.0 1.9 50 percent or more ................................................................ 2.4 1.9 2.5 2.2
† Not applicable. SOURCE: U.S. Department of Education, National Center for Education Statistics, Fast Response Survey System (FRSS), “Dual Credit and Exam-Based Courses,” FRSS 104, 2011.

A-4
Table 3a. Standard errors for the total enrollments of public high school students in dual credit courses, Advanced Placement (AP) or International Baccalaureate (IB) courses, and AP courses eligible for dual credit without the AP exam, by school characteristics: School year 2010–11
School characteristic Enrollments in
dual credit courses
Enrollments in Advanced Placement
or International Baccalaureate
courses
Enrollments in Advanced Placement
courses eligible for dual credit
without the AP exam
All public high schools ........................................................................ 101,140 108,100 23,290
Enrollment size Less than 500 .......................................................................................... 47,650 12,970 3,190 500 to 1,199 ............................................................................................ 51,160 60,670 11,610 1,200 or more ......................................................................................... 64,310 88,700 19,490
Community type City ......................................................................................................... 51,310 73,520 13,700 Suburban ................................................................................................. 55,050 119,030 12,930 Town ...................................................................................................... 44,940 29,480 3,750 Rural ....................................................................................................... 57,540 42,900 6,890
Region Northeast ................................................................................................ 32,550 59,870 9,940 Southeast ................................................................................................ 47,810 78,810 5,680 Central .................................................................................................... 45,890 55,360 9,080 West ....................................................................................................... 71,450 81,720 14,850
Percent combined enrollment of Black and other races/ethnicities Less than 6 percent ................................................................................. 36,160 25,350 3,110 6 to 20 percent ........................................................................................ 55,600 55,510 12,000 21 to 49 percent ...................................................................................... 54,300 65,530 7,350 50 percent or more .................................................................................. 50,540 72,350 14,190
SOURCE: U.S. Department of Education, National Center for Education Statistics, Fast Response Survey System (FRSS), “Dual Credit and Exam-Based Courses,” FRSS 104, 2011.

A-5
A-5
Table 4a. Standard errors for the percentage of public high schools with students enrolled in dual credit courses, by dual credit course focus and school characteristics: School year 2010–11
School characteristic
High schools with any students taking dual
credit courses
High schools with students enrolled in dual credit courses with an academic focus
High schools with students enrolled in dual credit courses with a career
and technical/vocational focus
Percent based on all high schools
Percent based on high schools with students enrolled in dual credit courses
Percent based on all high schools
Percent based on high schools with students enrolled in dual credit courses
All public high schools ...................................................................... 1.4 1.6 0.9 1.4 1.5
Enrollment size Less than 500 ........................................................................................ 2.5 2.8 1.5 2.5 3.0 500 to 1,199 .......................................................................................... 1.6 1.9 1.2 2.2 2.4 1,200 or more ....................................................................................... 1.5 1.8 1.5 2.2 2.3
Community type City ....................................................................................................... 3.4 3.8 2.3 3.4 3.9 Suburban ............................................................................................... 2.5 2.5 2.4 2.5 2.7 Town .................................................................................................... 2.7 2.7 1.4 3.7 3.6 Rural ..................................................................................................... 1.9 2.0 1.2 2.2 2.4
Region Northeast .............................................................................................. 3.2 3.2 1.5 3.7 4.1 Southeast .............................................................................................. 2.3 2.5 1.9 2.8 2.8 Central .................................................................................................. 2.3 2.7 1.6 2.9 3.1 West ..................................................................................................... 2.6 2.7 1.6 2.8 3.1
Percent combined enrollment of Black and other races/ethnicities Less than 6 percent ............................................................................... 2.2 2.6 1.6 3.4 3.3 6 to 20 percent ...................................................................................... 2.6 2.6 1.3 3.1 3.0 21 to 49 percent .................................................................................... 2.7 2.8 1.6 2.6 2.8 50 percent or more ................................................................................ 2.9 2.8 1.9 2.7 3.0
SOURCE: U.S. Department of Education, National Center for Education Statistics, Fast Response Survey System (FRSS), “Dual Credit and Exam-Based Courses,” FRSS 104, 2011.

A-6
A-6
Table 5a. Standard errors for the percentage of all public high schools with students enrolled in dual credit courses taught through distance education or at various locations, by course focus and school characteristics: School year 2010–11
School characteristic
Academic focus Career and technical/vocational focus
Taught primarily through distance
education
Taught at locations for secondary
school students
Taught on the campus of a
postsecondary institution
Taught primarily through distance
education
Taught at locations for secondary
school students
Taught on the campus of a
postsecondary institution
All public high schools ..................................................................... 1.3 1.7 1.6 0.8 1.3 1.2
Enrollment size Less than 500 ....................................................................................... 2.5 2.7 2.6 1.6 2.2 2.2 500 to 1,199 ......................................................................................... 2.1 2.7 2.7 1.2 2.3 2.1 1,200 or more ...................................................................................... 1.7 2.3 2.3 0.9 2.0 1.9
Community type City ...................................................................................................... 2.4 3.3 3.4 1.0 2.9 2.7 Suburban .............................................................................................. 1.9 2.7 2.7 1.4 2.4 2.3 Town ................................................................................................... 3.0 4.1 4.1 2.0 3.9 2.9 Rural .................................................................................................... 2.3 2.4 2.3 1.5 2.1 1.9
Region Northeast ............................................................................................. 1.9 3.4 3.4 † 3.3 1.8 Southeast ............................................................................................. 2.9 3.0 3.3 1.8 2.7 2.6 Central ................................................................................................. 2.8 3.3 3.2 1.6 2.7 2.2 West .................................................................................................... 2.8 2.7 3.1 1.6 2.2 2.3
Percent combined enrollment of Black and other races/ethnicities Less than 6 percent .............................................................................. 3.4 3.7 3.1 2.1 3.1 2.6 6 to 20 percent ..................................................................................... 2.9 2.7 3.2 1.9 2.6 2.7 21 to 49 percent ................................................................................... 3.0 3.1 2.8 1.2 2.1 2.3 50 percent or more ............................................................................... 2.8 2.8 2.6 1.5 2.4 2.2
† Not applicable. SOURCE: U.S. Department of Education, National Center for Education Statistics, Fast Response Survey System (FRSS), “Dual Credit and Exam-Based Courses,” FRSS 104, 2011.

A-7
A-7
Table 6a. Standard errors for the number of high school student enrollments in dual credit courses with an academic focus or a career and technical/vocational focus, by distance education or course location and school characteristics: School year 2010–11
School characteristic
Academic focus Career and technical/vocational focus
Total
Taught primarily
through distance
education
Taught at locations for
secondary school students
Taught on the campus of a
postsecondary institution Total
Taught primarily
through distance
education
Taught at locations for
secondary school students
Taught on the campus of a
postsecondary institution
All public high schools ......................................... 80,780 12,780 61,340 43,410 47,490 3,340 45,590 6,730
Enrollment size Less than 500 ........................................................... 44,000 9,430 15,990 38,570 10,530 1,610 9,070 2,930 500 to 1,199 ............................................................. 39,340 5,940 34,500 14,930 22,400 2,810 20,600 4,890 1,200 or more .......................................................... 45,970 4,800 44,970 11,420 39,880 900 39,450 4,150
Community type City .......................................................................... 37,050 2,720 30,290 16,340 27,820 770 26,740 4,270 Suburban .................................................................. 43,870 3,910 39,620 12,700 20,510 780 19,710 2,890 Town ....................................................................... 34,730 5,660 29,780 6,020 19,230 760 17,980 3,020 Rural ........................................................................ 47,100 9,510 25,870 32,870 28,580 3,120 26,420 4,200
Region Northeast ................................................................. 26,720 1,090 25,640 8,470 9,420 † 9,380 410 Southeast ................................................................. 45,090 6,690 20,960 38,530 12,610 2,910 11,090 3,870 Central ..................................................................... 34,590 5,500 31,960 5,740 25,020 1,190 24,390 2,920 West ........................................................................ 48,190 6,420 41,270 16,500 38,740 1,070 37,860 5,260
Percent combined enrollment of Black and other races/ethnicities
Less than 6 percent .................................................. 28,510 5,020 25,390 3,580 13,600 2,960 11,200 2,830 6 to 20 percent ......................................................... 41,960 4,010 37,580 19,200 27,350 1,280 27,070 4,050 21 to 49 percent ....................................................... 47,240 3,720 23,170 36,660 22,230 640 21,890 3,330 50 percent or more ................................................... 36,600 7,770 31,100 13,060 26,960 1,090 26,120 4,310
† Not applicable. SOURCE: U.S. Department of Education, National Center for Education Statistics, Fast Response Survey System (FRSS), “Dual Credit and Exam-Based Courses,” FRSS 104, 2011.

A-8
A-8
Table 7a. Standard errors for the percentage of public high schools with students enrolled in dual credit courses reporting that their school has established requirements that students must meet to enroll in dual credit courses, and for those schools, the percentage indicating various types of requirements, by school characteristics: School year 2010–11
School characteristic
School has established
requirements for enrolling
in dual credit
courses
Requirements for enrolling in dual credit courses
Teacher recommen-
dation
School administrator
or guidance counselor approval Grade level
Minimum GPA
Minimum high school
class rank
Satisfactory high school attendance
record
Minimum score on a
standardized test
Passing college
placement test
Other requirement
All public high schools ............................. 1.7 2.0 1.6 1.7 2.1 1.0 2.3 2.1 2.2 1.4
Enrollment size Less than 500 ............................................. 3.1 3.6 3.1 2.9 4.2 1.8 4.3 4.0 4.0 2.8 500 to 1,199 ............................................... 2.4 3.6 2.6 2.8 3.7 1.9 3.2 3.0 3.2 2.0 1,200 or more ............................................. 2.4 3.0 2.7 2.6 3.0 0.9 2.6 3.0 3.0 2.1
Community type City ............................................................ 3.6 4.6 3.5 3.9 4.2 2.1 4.8 4.2 4.3 2.8 Suburban .................................................... 3.3 4.3 2.9 3.9 3.8 † 4.0 3.3 3.7 2.6 Town .......................................................... 4.1 5.1 3.6 3.4 5.4 3.2 5.0 5.2 5.0 4.2 Rural .......................................................... 2.9 3.1 2.7 2.7 3.6 1.3 3.7 3.2 3.5 2.1
Region Northeast ................................................... 3.4 4.4 3.6 3.9 4.5 2.2 4.3 2.4 3.9 3.4 Southeast ................................................... 3.0 4.1 2.4 3.1 3.8 1.6 4.1 4.1 4.0 2.0 Central ....................................................... 3.1 3.4 3.7 3.4 4.5 2.7 4.2 4.3 4.3 2.5 West ........................................................... 3.4 3.5 3.0 3.1 3.8 † 4.4 3.5 4.1 3.1
Percent combined enrollment of Black and other races/ethnicities
Less than 6 percent .................................... 3.8 4.4 3.7 3.3 4.4 2.7 4.5 5.0 4.4 3.0 6 to 20 percent ........................................... 3.1 4.4 3.0 3.2 4.4 1.6 3.8 3.4 3.9 2.0 21 to 49 percent ......................................... 3.2 4.4 3.7 3.9 4.2 2.0 4.2 4.3 4.4 2.7 50 percent or more ..................................... 3.5 3.7 2.3 3.5 3.8 1.8 4.2 3.5 4.1 3.1
† Not applicable. SOURCE: U.S. Department of Education, National Center for Education Statistics, Fast Response Survey System (FRSS), “Dual Credit and Exam-Based Courses,” FRSS 104, 2011.

A-9
Table 8a. Standard errors for the percentage of public high schools with students enrolled in dual credit courses indicating that transportation was needed for dual credit courses, and of these schools, percentage indicating which sources were responsible for students’ transportation costs to dual credit courses, by school characteristics: School year 2010–11
School characteristic
Transportation needed for any
dual credit course
Source responsible for cost
The school/ district The state
Postsecondary institution
Parents/ students
All public high schools ......................................... 1.5 1.9 1.0 0.6 1.5
Enrollment size Less than 500 ........................................................... 3.0 4.1 2.0 † 3.2 500 to 1,199 ............................................................. 2.5 3.2 1.5 † 2.5 1,200 or more .......................................................... 2.4 2.5 1.0 0.8 1.8
Community type City .......................................................................... 3.3 4.2 2.4 † 3.0 Suburban .................................................................. 3.0 3.4 1.0 † 2.5 Town ....................................................................... 3.8 5.3 2.0 † 3.6 Rural ........................................................................ 2.6 3.4 1.7 † 2.8
Region Northeast ................................................................. 3.6 5.3 † † 4.2 Southeast ................................................................. 3.0 3.9 2.3 † 3.1 Central ..................................................................... 3.3 3.8 † † 2.4 West ........................................................................ 3.2 3.9 2.2 1.8 2.9
Percent combined enrollment of Black and other races/ethnicities
Less than 6 percent .................................................. 3.6 4.8 † † 3.6 6 to 20 percent ......................................................... 3.2 3.1 1.0 † 1.6 21 to 49 percent ....................................................... 3.2 3.9 2.8 † 3.1 50 percent or more ................................................... 2.9 3.8 2.2 2.0 3.7
† Not applicable. SOURCE: U.S. Department of Education, National Center for Education Statistics, Fast Response Survey System (FRSS), “Dual Credit and Exam-Based Courses,” FRSS 104, 2011.

A-10
Table 9a. Standard errors for the percentage of public high schools with students enrolled in dual credit courses reporting that some students earned various types of credentials from a postsecondary institution by taking dual credit courses, by school characteristics: School year 2010–11
School characteristic Certificate Associate’s degree Bachelor’s degree
All public high schools ................................................................... 1.1 0.9 0.2
Enrollment size Less than 500 ..................................................................................... 1.9 1.4 † 500 to 1,199 ....................................................................................... 1.8 1.4 † 1,200 or more .................................................................................... 1.8 1.4 0.5
Community type City .................................................................................................... 3.1 2.3 † Suburban ............................................................................................ 2.3 1.8 0.7 Town ................................................................................................. 2.8 1.8 † Rural .................................................................................................. 1.6 1.2 †
Region Northeast ........................................................................................... 1.5 1.2 1.1 Southeast ........................................................................................... 2.3 2.3 † Central ............................................................................................... 1.9 1.1 † West .................................................................................................. 2.0 1.6 †
Percent combined enrollment of Black and other races/ethnicities Less than 6 percent ............................................................................ 2.0 1.2 † 6 to 20 percent ................................................................................... 2.0 2.1 0.5 21 to 49 percent ................................................................................. 2.3 2.2 † 50 percent or more ............................................................................. 2.6 1.3 †
† Not applicable. SOURCE: U.S. Department of Education, National Center for Education Statistics, Fast Response Survey System (FRSS), “Dual Credit and Exam-Based Courses,” FRSS 104, 2011.

A-11
Table 10a. Standard errors for the percentage of public high schools with students enrolled in dual credit courses, and among those schools, percentage with students enrolled in various types of dual credit courses, by school characteristics: School year 2010–11
School characteristic
High schools with any students
enrolled in dual credit courses
Academic focus Career and technical/vocational focus
Taught primarily through distance
education
Taught at locations for
secondary school students
Taught on the campus of a
postsecondary institution
Taught primarily through distance
education
Taught at locations for
secondary school students
Taught on the campus of a
postsecondary institution
All public high schools .......................................... 1.4 1.5 1.8 1.7 1.0 1.5 1.4
Enrollment size Less than 500 ........................................................... 2.5 2.7 2.8 3.1 2.0 2.7 2.7 500 to 1,199 ............................................................. 1.6 2.3 2.7 2.9 1.4 2.5 2.4 1,200 or more ........................................................... 1.5 2.0 2.6 2.4 1.0 2.3 2.2
Community type City ........................................................................... 3.4 3.1 3.5 3.5 1.4 3.7 3.5 Suburban ................................................................... 2.5 2.4 3.4 3.2 1.7 2.9 2.8 Town ........................................................................ 2.7 3.3 3.9 4.3 2.2 4.0 3.1 Rural ........................................................................ 1.9 2.5 2.7 2.5 1.7 2.4 2.1
Region Northeast ................................................................. 3.2 2.5 3.7 3.8 † 3.8 2.2 Southeast ................................................................. 2.3 3.2 3.4 3.5 2.1 3.0 2.8 Central ..................................................................... 2.3 3.1 3.4 3.5 1.9 3.0 2.5 West ........................................................................ 2.6 3.1 3.2 3.4 2.0 2.7 2.8
Percent combined enrollment of Black and other races/ethnicities
Less than 6 percent ................................................... 2.2 3.6 3.4 3.3 2.3 3.1 2.8 6 to 20 percent .......................................................... 2.6 3.3 2.8 3.4 2.2 2.8 3.1 21 to 49 percent ........................................................ 2.7 3.3 3.5 3.1 1.4 2.6 2.7 50 percent or more .................................................... 2.9 3.3 3.4 2.9 2.0 3.0 2.8
† Not applicable. SOURCE: U.S. Department of Education, National Center for Education Statistics, Fast Response Survey System (FRSS), “Dual Credit and Exam-Based Courses,” FRSS 104, 2011.

A-12
Table 11a. Standard errors for the percentage of public high schools with students enrolled in dual credit courses indicating how students are awarded postsecondary credit, by dual credit course focus and school characteristics: School year 2010–11
School characteristic
Academic focus Career and technical/
vocational focus
Immediately upon
completion of courses
Credit in escrow
Immediately upon
completion of courses
Credit in escrow
All public high schools ..................................................................... 0.7 0.9 1.3 1.7
Enrollment size Less than 500 ....................................................................................... 1.1 1.3 2.3 2.9 500 to 1,199 ......................................................................................... 1.3 1.5 2.2 2.8 1,200 or more ...................................................................................... 1.6 1.7 2.6 2.6
Community type City ...................................................................................................... 2.8 2.6 3.7 3.5 Suburban .............................................................................................. 1.9 2.1 3.7 4.1 Town ................................................................................................... 1.3 1.1 2.3 2.7 Rural .................................................................................................... 1.0 1.2 2.0 2.6
Region Northeast ............................................................................................. 2.6 2.7 3.9 4.7 Southeast ............................................................................................. 1.9 2.1 2.9 3.7 Central ................................................................................................. 1.1 1.5 2.3 2.8 West .................................................................................................... 1.1 1.2 2.3 2.4
Percent combined enrollment of Black and other races/ethnicities Less than 6 percent .............................................................................. 1.2 1.5 2.2 3.3 6 to 20 percent ..................................................................................... 1.5 1.9 2.8 3.5 21 to 49 percent ................................................................................... 1.5 1.6 2.5 2.6 50 percent or more ............................................................................... 1.8 1.8 3.0 3.4
SOURCE: U.S. Department of Education, National Center for Education Statistics, Fast Response Survey System (FRSS), “Dual Credit and Exam-Based Courses,” FRSS 104, 2011.

A-13
Table 12a. Standard errors for the percentage of public high schools with students enrolled in dual credit courses indicating whether most students (and their parents) generally paid out of pocket for various dual credit course expenses, by dual credit course focus and school characteristics: School year 2010–11
School characteristic
Academic focus Career and technical/
vocational focus
Tuition (full or partial) Fees Books
Tuition (full or partial) Fees Books
All public high schools ..................................................................... 1.7 1.5 1.6 1.9 1.9 2.0
Enrollment size Less than 500 ....................................................................................... 3.4 3.1 3.2 3.6 3.8 3.8 500 to 1,199 ......................................................................................... 2.7 2.7 2.4 3.1 3.1 3.1 1,200 or more ...................................................................................... 2.3 2.3 2.4 2.3 2.6 2.7
Community type City ...................................................................................................... 3.2 3.6 3.5 3.8 4.0 4.1 Suburban .............................................................................................. 3.3 2.9 3.8 3.3 3.8 4.2 Town ................................................................................................... 4.7 4.1 4.0 3.4 4.9 4.2 Rural .................................................................................................... 3.0 2.8 2.9 3.1 3.2 3.3
Region Northeast ............................................................................................. 3.9 4.1 3.8 5.6 5.9 4.5 Southeast ............................................................................................. 3.8 3.4 3.0 3.0 4.0 4.1 Central ................................................................................................. 3.3 3.0 3.3 3.6 4.0 3.9 West .................................................................................................... 3.3 3.4 3.3 3.1 3.2 3.4
Percent combined enrollment of Black and other races/ethnicities Less than 6 percent .............................................................................. 3.9 3.6 3.5 4.8 4.6 4.3 6 to 20 percent ..................................................................................... 3.5 3.3 3.5 3.9 3.9 4.1 21 to 49 percent ................................................................................... 3.5 2.8 3.8 3.8 3.8 3.7 50 percent or more ............................................................................... 2.7 3.1 2.9 2.6 3.3 3.3
SOURCE: U.S. Department of Education, National Center for Education Statistics, Fast Response Survey System (FRSS), “Dual Credit and Exam-Based Courses,” FRSS 104, 2011.

A-14
Table 13a. Standard errors for the percentage of public high schools with students enrolled in dual credit courses indicating whether the school or district paid for various dual credit course expenses for any students, by dual credit course focus and school characteristics: School year 2010–11
School characteristic
Academic focus Career and technical/
vocational focus
Tuition (full or partial) Fees Books
Tuition (full or partial) Fees Books
All public high schools ..................................................................... 1.8 1.6 1.6 2.0 2.0 2.0
Enrollment size Less than 500 ....................................................................................... 3.2 2.8 3.1 4.1 3.8 3.9 500 to 1,199 ......................................................................................... 2.8 2.6 2.6 3.4 3.3 3.3 1,200 or more ...................................................................................... 2.2 2.2 2.4 2.6 2.4 2.5
Community type City ...................................................................................................... 4.4 4.2 3.5 5.0 5.0 4.8 Suburban .............................................................................................. 3.0 3.3 3.4 4.1 3.3 4.2 Town ................................................................................................... 4.9 4.2 4.2 5.7 5.3 4.5 Rural .................................................................................................... 2.9 2.6 2.8 3.2 3.1 3.3
Region Northeast ............................................................................................. 3.5 3.1 3.5 4.2 3.7 5.4 Southeast ............................................................................................. 3.6 3.0 3.3 3.9 3.5 4.0 Central ................................................................................................. 3.3 2.8 3.1 3.8 3.4 3.6 West .................................................................................................... 3.7 3.4 2.9 3.6 3.7 3.4
Percent combined enrollment of Black and other races/ethnicities Less than 6 percent .............................................................................. 3.4 3.2 3.7 4.6 3.8 4.7 6 to 20 percent ..................................................................................... 3.5 3.1 3.2 4.1 3.7 4.2 21 to 49 percent ................................................................................... 3.4 2.9 3.8 4.2 3.7 3.7 50 percent or more ............................................................................... 3.5 3.4 3.0 3.7 3.7 4.3
SOURCE: U.S. Department of Education, National Center for Education Statistics, Fast Response Survey System (FRSS), “Dual Credit and Exam-Based Courses,” FRSS 104, 2011.

A-15
Table 14a. Standard errors for the percentage distribution of public high schools with students enrolled in dual credit courses taught at locations for secondary school students indicating who the instructors were for the dual credit courses, by dual credit course focus and school characteristics: School year 2010–11
School characteristic
Academic focus Career and technical/vocational focus
High school instructors only
Postsecondary instructors only
Both high school and postsecondary
instructors High school
instructors only Postsecondary
instructors only
Both high school and postsecondary
instructors
All public high schools ..................................................................... 2.1 1.5 1.9 2.2 1.7 1.9
Enrollment size Less than 500 ....................................................................................... 3.8 3.1 3.6 4.7 3.9 3.1 500 to 1,199 ......................................................................................... 2.9 1.7 3.1 3.9 3.0 3.3 1,200 or more ...................................................................................... 2.4 1.5 2.4 3.4 2.1 3.0
Community type City ...................................................................................................... 4.7 3.9 4.1 5.7 4.9 4.5 Suburban .............................................................................................. 3.6 2.1 3.1 4.1 2.0 3.9 Town ................................................................................................... 5.2 2.9 4.6 5.5 4.4 3.9 Rural .................................................................................................... 3.0 2.2 3.2 3.8 2.9 2.8
Region Northeast ............................................................................................. 3.7 2.0 3.2 4.4 † 3.9 Southeast ............................................................................................. 4.4 3.1 4.1 5.3 4.9 3.6 Central ................................................................................................. 4.1 2.2 3.8 4.3 2.8 3.6 West .................................................................................................... 3.6 3.3 3.3 4.3 2.8 3.3
Percent combined enrollment of Black and other races/ethnicities Less than 6 percent .............................................................................. 3.7 2.2 3.4 4.8 2.8 3.7 6 to 20 percent ..................................................................................... 3.8 2.7 3.5 4.4 3.5 3.6 21 to 49 percent ................................................................................... 3.9 2.7 3.5 4.4 3.4 3.5 50 percent or more ............................................................................... 4.0 3.5 4.2 5.4 4.6 3.9
† Not applicable. SOURCE: U.S. Department of Education, National Center for Education Statistics, Fast Response Survey System (FRSS), “Dual Credit and Exam-Based Courses,” FRSS 104, 2011.

A-16
Table 15a. Standard errors for the percentage distribution of public high schools with students enrolled in dual credit courses taught on the campus of a postsecondary institution indicating the most common student composition, by dual credit course focus and school characteristics: School year 2010–11
School characteristic
Academic focus Career and technical/
vocational focus
High school students only
High school and
postsecondary students
High school students only
High school and
postsecondary students
All public high schools ...................................................................... 2.1 2.1 3.2 3.2
Enrollment size Less than 500 ........................................................................................ 4.2 4.2 6.5 6.5 500 to 1,199 .......................................................................................... 3.5 3.5 4.9 4.9 1,200 or more ....................................................................................... 2.8 2.8 4.0 4.0
Community type City ....................................................................................................... 4.6 4.6 6.3 6.3 Suburban ............................................................................................... 4.2 4.2 8.1 8.1 Town .................................................................................................... 4.0 4.0 6.3 6.3 Rural ..................................................................................................... 3.3 3.3 5.2 5.2
Region Northeast .............................................................................................. 4.7 4.7 8.8 8.8 Southeast .............................................................................................. 4.1 4.1 6.2 6.2 Central .................................................................................................. 3.1 3.1 6.1 6.1 West ..................................................................................................... 4.0 4.0 5.3 5.3
Percent combined enrollment of Black and other races/ethnicities Less than 6 percent ............................................................................... 4.7 4.7 8.9 8.9 6 to 20 percent ...................................................................................... 3.7 3.7 5.2 5.2 21 to 49 percent .................................................................................... 4.0 4.0 6.0 6.0 50 percent or more ................................................................................ 3.9 3.9 5.8 5.8
SOURCE: U.S. Department of Education, National Center for Education Statistics, Fast Response Survey System (FRSS), “Dual Credit and Exam-Based Courses,” FRSS 104, 2011.

B-1
Appendix B
Technical Notes

B-2
Technical Notes
Fast Response Survey System
The Fast Response Survey System (FRSS) was established in 1975 by the National Center for Education Statistics (NCES), U.S. Department of Education. FRSS is designed to collect issue-oriented data within a relatively short time frame. FRSS collects data from state education agencies, local education agencies, public and private elementary and secondary schools, public school teachers, and public libraries. To ensure minimal burden on respondents, the surveys are generally limited to three pages of questions, with a response burden of about 30 minutes per respondent. Sample sizes are relatively small (usually about 1,200 to 1,800 respondents per survey) so that data collection can be completed quickly. Data are weighted to produce national estimates of the sampled education sector. The sample size permits limited breakouts by analysis variables. However, as the number of categories within any single analysis variable increases, the sample size within categories decreases, which results in larger sampling errors for the breakouts by analysis variables.
Sample Design
The sample for the FRSS survey of Dual Credit and Exam-Based Courses consisted of approximately 1,500 regular public high schools in the 50 states and the District of Columbia. The nationally representative sample was selected from the 2009–10 NCES Common Core of Data (CCD) Public School Universe file, which was the most current file available at the time of selection. The sampling frame included 18,921 regular high schools. For purposes of this study, “regular” high schools included schools with a grade 11 or 12, including charter schools. Excluded from the sampling frame were schools with a highest grade lower than 11, along with special education, vocational, and alternative/other schools, and schools outside the 50 states and the District of Columbia.
The public school sampling frame was stratified by enrollment size (less than 300, 300 to 499, 500 to 999, 1,000 to 1,499, and 1,500 or more) and percent combined enrollment of Black, Hispanic, Asian/Pacific Islander, and American Indian/Alaska Native students (missing, less than 6 percent, 6 to 20 percent, 21 to 49 percent, and 50 percent or more) to create 25 primary strata. Within each of the strata, schools were sorted by community type (city, suburban, town, rural) and region (Northeast, Southeast, Central, West) prior to selection to induce additional implicit stratification. These variables are defined in more detail in the “Definitions of Analysis Variables” section of this report. Within each primary stratum, schools were selected systematically at rates that depended on the enrollment size class of the school.
Data Collection and Response Rates
Questionnaires and cover letters were mailed to the principal of each sampled school in September 2011. The letter stated the purpose of the study and requested that the questionnaire be completed by the person most knowledgeable about dual credit and exam-based courses in the school, often the school’s lead guidance counselor or director of school guidance counselors. Respondents were offered the option of completing the survey via the Web. Telephone follow-up for survey nonresponse and data clarification was initiated in October 2011 and completed in February 2012.
Of the approximately 1,500 public high schools in the sample, approximately 50 were found to be ineligible because the school was closed, did not have grade 11 or 12, or did not meet some other criteria for inclusion in the sample (e.g., was an alternative school). For the eligible schools, an unweighted response rate of 91 percent was obtained for this survey (about 1,320 responding schools divided by the approximately 1,450 eligible

B-3
schools in the sample). The corresponding weighted response rate using the initial base weights was 91 percent (table B-1). Of the schools that completed the survey, 66 percent completed it via the Web, 33 percent completed it by paper (sent by mail, fax, or e-mail), and 2 percent completed it by telephone. The final weighted count of responding schools in the survey after nonresponse adjustment represents the estimated universe of eligible public high schools in the 50 states and the District of Columbia—approximately 17,800 schools (table B-1).1
Table B-1. Number and percentage of responding public high schools in the study sample, and estimated number and percentage of public high schools the sample represents, by school characteristics: School year 2010–11
School characteristic Respondent sample (unweighted) National estimate (weighted)1
Number Percent Number Percent
All public high schools ....................................................... 1,320 100 17,800 100
Enrollment size Less than 500 ............................................................................ 360 28 8,300 47 500 to 1,199 .............................................................................. 420 32 5,000 28 1,200 or more ........................................................................... 540 41 4,500 25
Community type City ........................................................................................... 270 21 3,300 18 Suburban ................................................................................... 360 27 3,600 20 Town ......................................................................................... 190 15 2,600 15 Rural ......................................................................................... 500 38 8,400 47
Region Northeast .................................................................................. 240 18 2,900 16 Southeast .................................................................................. 330 25 4,100 23 Central ...................................................................................... 340 26 5,300 29 West .......................................................................................... 410 31 5,600 31
Percent combined enrollment of Black and other races/ethnicities2
Less than 6 percent ................................................................... 240 18 4,000 22 6 to 20 percent .......................................................................... 340 26 4,500 25 21 to 49 percent ........................................................................ 330 25 3,900 22 50 percent or more .................................................................... 410 31 5,400 31
1 Weighted count of responding high schools using the final nonresponse-adjusted weights. The weighted count is an estimate of the number of eligible schools in the study universe (see text for definition of the types of schools included in the study). 2 Other races/ethnicities include Hispanic, Asian, Native Hawaiian/Pacific Islander, American Indian/Alaska Native, and students of two or more races. NOTE: Detail may not sum to totals because of rounding. SOURCE: U.S. Department of Education, National Center for Education Statistics, Fast Response Survey System (FRSS), “Dual Credit and Exam-Based Courses,” FRSS 104, 2011.
Imputation for Item Nonresponse
Cases with missing data were recontacted by telephone to collect the missing information. However for cases in which this data retrieval was unsuccessful, missing data were imputed. Although item nonresponse was very low (less than 1 percent for any item), missing data were imputed for the 23 items with a response rate of less than 100 percent. The missing items included both numerical data such as enrollments in dual credit courses taught via distance education with an academic course focus, as well as categorical data, such as whether 1 For more details about the development of survey weights, see the section of this report on sampling errors.

B-4
students earned a postsecondary certificate by taking dual credit courses. The missing categorical data were imputed using a “hot-deck” approach to obtain a “donor” school from which the imputed values were derived. Under the hot-deck approach, a donor school that matched selected characteristics of the school with missing data (the recipient school) was identified (Kalton 1983). The matching characteristics included enrollment size, community type, region, percent eligible for free or reduced-price lunch, and percent combined enrollment of Black, Hispanic, Asian/Pacific Islander, and American Indian/Alaska Native students. In addition, other relevant questionnaire items were used to form appropriate imputation groupings. Once a donor was found, it was used to derive the imputed values for the school with missing data. For categorical items, the imputed value was simply the corresponding value from the donor school. For enrollment items, the imputed value was calculated by taking the donor’s response for that item and dividing that number by the total number of students enrolled in the donor school. This ratio was then multiplied by the total number of students enrolled in the recipient school to provide an imputed value.
Data Reliability
Although the school survey on dual credit and exam-based courses was designed to account for sampling error and to minimize nonsampling error, estimates produced from the data collected are subject to both types of error. Sampling error occurs because the data are collected from a sample rather than a census of the population, and nonsampling errors are errors made during the collection and processing of the data.
Sampling Errors
The responses were weighted to produce national estimates (table B-1). The weights were designed to reflect the probabilities of selection of the sampled schools and were adjusted for differential unit (questionnaire) nonresponse. The nonresponse weighting adjustments were made within classes defined by sampling stratum, community type, and region. Within the final weighting classes, the base weights (i.e., the reciprocal of schools’ probabilities of selection) of the responding high schools were inflated by the inverse of the weighted response rate for the class. The findings in this report are estimates based on the sample selected and, consequently, are subject to sampling variability. Jackknife replication was used to estimate the sampling variability of the estimates and to test for statistically significant differences between estimates.
Because the data from the FRSS school survey on dual credit and exam-based courses were collected using a complex sampling design, the variances of the estimates from this survey (e.g., estimates of proportions) are typically different from what would be expected from data collected with a simple random sample. Not taking the complex sample design into account can lead to an under- or overestimation of the standard errors associated with such estimates. To generate accurate standard errors for the estimates in this report, standard errors were computed using a technique known as jackknife replication (Levy and Lemeshow 1991). As with any replication method, jackknife replication involves constructing a number of subsamples (replicates) from the full sample and computing the statistic of interest for each replicate. The mean square error of the replicate estimates around the full sample estimate provides an estimate of the variance of the statistic. To construct the replications, 100 stratified subsamples of the full sample were created and then dropped one at a time to define 100 jackknife replicates. A computer program (WesVar) was used to calculate the estimates of standard errors.
The standard error is a measure of the variability of an estimate due to sampling. It indicates the variability of a sample estimate that would be obtained from all possible samples of a given design and size. Standard errors are used as a measure of the precision expected from a particular sample. If all possible samples were surveyed under similar conditions, intervals of 1.96 standard errors below to 1.96 standard errors above a particular statistic would include the true population parameter being estimated in about 95 percent of the samples. This is a 95 percent confidence interval. For example, the estimated percent of public high schools with students enrolled in dual credit courses is 82 percent, and the standard error is 1.4 percent (tables 1 and 1a). The 95 percent confidence interval for the statistic extends from [82 – (1.4 x 1.96)] to [82 + (1.4 x 1.96)], or from
B-5
79.3 to 84.7 percent. The 1.96 is the appropriate percentile from a standard normal distribution corresponding to a two-sided statistical test at the p < .05 significance level (where .05 indicates the 5 percent of all possible samples that would be outside the range of the confidence interval).
Comparisons can be tested for statistical significance at the p < .05 level using Student’s t-statistic to ensure that the differences are larger than those that might be expected due to sampling variation. Student’s t values are computed to test the difference between estimates with the following formula:
22
21
21
sese
EEt+
−=
where E1 and E2 are the estimates to be compared and se1 and se2 are their corresponding standard errors.
Nonsampling Errors
Nonsampling error is the term used to describe variations in the estimates that may be caused by population coverage limitations and data collection, processing, and reporting procedures. The sources of nonsampling errors are typically problems like unit and item nonresponse, differences in respondents’ interpretations of the meaning of questions, response differences related to the particular time the survey was conducted, and mistakes made during data preparation. It is difficult to identify and estimate either the amount of nonsampling error or the bias caused by this error. To minimize the potential for nonsampling error, this study used a variety of procedures, including a pretest of the questionnaire with guidance counselors or other school-level personnel considered to be the most knowledgeable about dual credit and exam-based courses in the school. The pretest provided the opportunity to check for consistency of interpretation of questions and definitions and to eliminate ambiguous items. The questionnaire and instructions were also extensively reviewed by NCES and the data requester at the Office of Elementary and Secondary Education (OESE), U.S. Department of Education. In addition, extensive editing of the questionnaire responses was conducted to check the data for accuracy and consistency. Cases with missing or inconsistent items were recontacted by telephone to resolve problems. Data entered for all surveys received by mail, fax, or telephone were verified to ensure accuracy.
Definitions of Analysis Variables
Many of the school characteristics, described below, may be related to each other. For example, school enrollment size and community type are related, with city schools typically being larger than rural schools. Other relationships between these analysis variables may exist. However, this First Look report focuses on national estimates and bivariate relationships between the analysis variables and questionnaire variables rather than more complex analyses.
Enrollment size—This variable indicates the total number of students enrolled in the school based on data from the 2009–10 CCD Public School Universe file. The variable was collapsed into the following three categories:
Less than 500 students 500 to 1,199 students 1,200 or more students
Community type—This variable indicates the type of community in which the school is located, as defined in the 2009–10 CCD Public School Universe file. These codes are based on the location of school buildings. The urban-centric locale codes are assigned through a methodology developed by the U.S. Census Bureau’s

B-6
Population Division in 2005. This classification system has four major locale categories—city, suburban, town, and rural—each of which is subdivided into three subcategories. This variable was based on the 12-category urban-centric locale variable from CCD and collapsed into the four categories below.
City—Territory inside an urbanized area and inside a principal city
Suburban—Territory outside a principal city and inside an urbanized area
Town—Territory inside an urban cluster
Rural—Territory outside an urbanized area and outside an urban cluster
Region—This variable classifies schools into one of the four geographic regions used by the Bureau of Economic Analysis of the U.S. Department of Commerce. Data were obtained from the 2009–10 CCD Public School Universe file. The geographic regions are as follows:
Northeast—Connecticut, Delaware, District of Columbia, Maine, Maryland, Massachusetts, New Hampshire, New Jersey, New York, Pennsylvania, Rhode Island, and Vermont
Southeast—Alabama, Arkansas, Florida, Georgia, Kentucky, Louisiana, Mississippi, North Carolina, South Carolina, Tennessee, Virginia, and West Virginia
Central—Illinois, Indiana, Iowa, Kansas, Michigan, Minnesota, Missouri, Nebraska, North Dakota, Ohio, South Dakota, and Wisconsin
West—Alaska, Arizona, California, Colorado, Hawaii, Idaho, Montana, Nevada, New Mexico, Oklahoma, Oregon, Texas, Utah, Washington, and Wyoming
Percent combined enrollment of Black and other races/ethnicities—This variable indicates the percentage of students enrolled in the school whose race or ethnicity is classified as one of the categories below based on data in the 2009–10 CCD Public School Universe file.
• American Indian/Alaska Native
• Asian
• Black
• Hawaiian Native/Pacific Islander
• Hispanic
• Two or more races
The variable was collapsed into the following four categories:
Less than 6 percent 6 to 20 percent 21 to 49 percent 50 percent or more

B-7
Contact Information
For more information about the survey, contact John Ralph, Early Childhood, International, and Crosscutting Studies Division, National Center for Education Statistics, Institute of Education Sciences, U.S. Department of Education, 1990 K Street NW, Washington, DC 20006; e-mail: [email protected]; telephone: (202) 502-7441.

C-1
Appendix C
Questionnaire
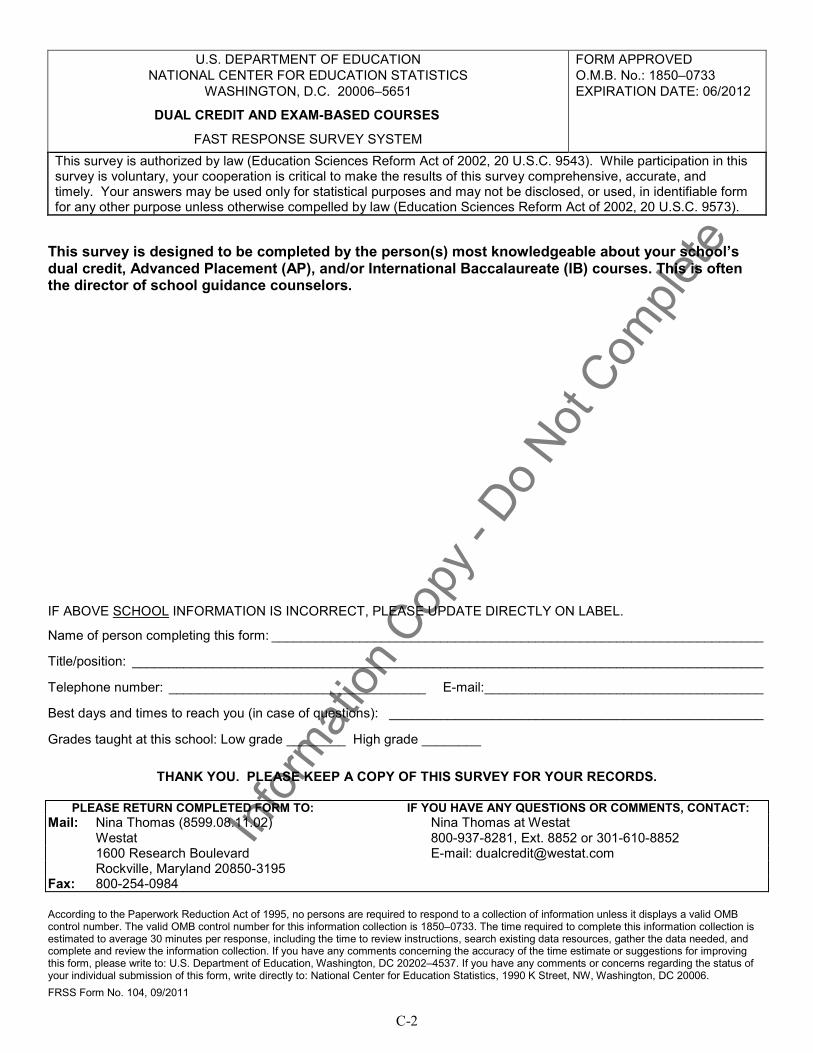
C-2
Infor
mation
Cop
y - D
o Not
Comple
te
U.S. DEPARTMENT OF EDUCATION NATIONAL CENTER FOR EDUCATION STATISTICS
WASHINGTON, D.C. 20006–5651
DUAL CREDIT AND EXAM-BASED COURSES
FAST RESPONSE SURVEY SYSTEM
FORM APPROVED O.M.B. No.: 1850–0733 EXPIRATION DATE: 06/2012
This survey is authorized by law (Education Sciences Reform Act of 2002, 20 U.S.C. 9543). While participation in this survey is voluntary, your cooperation is critical to make the results of this survey comprehensive, accurate, and timely. Your answers may be used only for statistical purposes and may not be disclosed, or used, in identifiable form for any other purpose unless otherwise compelled by law (Education Sciences Reform Act of 2002, 20 U.S.C. 9573).
This survey is designed to be completed by the person(s) most knowledgeable about your school’s dual credit, Advanced Placement (AP), and/or International Baccalaureate (IB) courses. This is often the director of school guidance counselors.
IF ABOVE SCHOOL INFORMATION IS INCORRECT, PLEASE UPDATE DIRECTLY ON LABEL.
Name of person completing this form: ___________________________________________________________________
Title/position: ______________________________________________________________________________________
Telephone number: ___________________________________ E-mail: ______________________________________
Best days and times to reach you (in case of questions): ___________________________________________________
Grades taught at this school: Low grade ________ High grade ________
THANK YOU. PLEASE KEEP A COPY OF THIS SURVEY FOR YOUR RECORDS.
PLEASE RETURN COMPLETED FORM TO: Mail: Nina Thomas (8599.08.11.02) Westat 1600 Research Boulevard Rockville, Maryland 20850-3195 Fax: 800-254-0984
IF YOU HAVE ANY QUESTIONS OR COMMENTS, CONTACT: Nina Thomas at Westat 800-937-8281, Ext. 8852 or 301-610-8852 E-mail: [email protected]
According to the Paperwork Reduction Act of 1995, no persons are required to respond to a collection of information unless it displays a valid OMB control number. The valid OMB control number for this information collection is 1850–0733. The time required to complete this information collection is estimated to average 30 minutes per response, including the time to review instructions, search existing data resources, gather the data needed, and complete and review the information collection. If you have any comments concerning the accuracy of the time estimate or suggestions for improving this form, please write to: U.S. Department of Education, Washington, DC 20202–4537. If you have any comments or concerns regarding the status of your individual submission of this form, write directly to: National Center for Education Statistics, 1990 K Street, NW, Washington, DC 20006. FRSS Form No. 104, 09/2011

C-3
Infor
mation
Cop
y - D
o Not
Comple
te
Definitions and Instructions Page
Please use the definitions and instructions below when completing the survey.
Advanced Placement (AP) courses are defined as courses that follow the content and curricular goals developed and published by the College Board. A qualifying score on an AP exam may give the student college credit or advanced standing in a college in the subject area in which the course/exam was taken. Include all students who took AP courses, regardless of whether they planned to take the AP exam.
International Baccalaureate (IB) courses compose a liberal arts curriculum that leads to a diploma and meets the requirements established by the International Baccalaureate program. Students must meet all requirements and pass examinations in each subject area in order to receive the IB diploma. In some schools, students who are not seeking the IB diploma are allowed to take individual IB courses. Include all students who took IB courses, regardless of whether they were seeking the IB diploma.
Dual credit is defined for this survey as a course or program where high school students can earn both high school and postsecondary credits for the same courses. The postsecondary or dual credit options must either be legislated by your state or have an articulated or formal written agreement between your school/district and a postsecondary institution. For purposes of this survey:
1. Credits may be earned (a) immediately upon course completion or (b) “in escrow,” meaning that students must enroll in a specific postsecondary institution after high school graduation in order to receive the credit.
2. Include students from your school taking any of the following types of dual credit courses:
• Dual credit courses taught primarily through distance education, defined as courses taught through audio, video, or Internet or other computer technologies where the students and teachers are separated by location. Include courses that have a teacher or assistant in the room who monitors but gives little or no instruction to the students.
• Dual credit courses taught at locations for secondary school students, including high school campus(es) and locations such as career centers run by the public school system.
• Dual credit courses taught on the campus of a postsecondary institution, including public and private 2- or 4-year colleges or universities, community colleges, and technical or vocational schools.
3. Dual credit courses might include:
• Courses with an academic focus, such as English, math, science, history, and foreign languages.
• Courses with a career and technical/vocational focus, such as business, computer technology, automotive technology, and health care (e.g., nursing).
4. When answering Part II of the survey (Courses for Dual Credit), include AP courses for which students can earn dual credit without taking the AP exam. Exclude all other AP and IB courses from Part II.
Enrollments may include duplicated counts of students; that is, a student should be counted for each relevant course in which he/she was enrolled.
The time frame for this survey is the 12-month 2010–11 school year. This includes courses during the summer of 2010 or the summer of 2011, depending upon how records are kept at your school.

C-4
Infor
mation
Cop
y - D
o Not
Comple
te
Before you answer the questions, please read the definitions and instructions page.
I. Advanced Placement and International Baccalaureate Courses
1. During the 12-month 2010–11 school year, did any of your students take Advanced Placement (AP) or International Baccalaureate (IB) courses? (See definitions and instructions page.)
Yes ........ 1 No .......... 2 (Skip to question 5.)
2. During the 12-month 2010–11 school year, what was the total number of enrollments in AP and IB courses for your students? (Enrollments may include duplicated counts of students; that is, a student should be counted for each relevant course in which he/she was enrolled.)
__________ Enrollments
3. During the 12-month 2010–11 school year, did any of your students take any AP courses for which they could earn dual credit without taking the AP exam?
Yes ........ 1 No .......... 2 (Skip to question 5.)
4. Of the enrollments reported in question 2, what was the total number of enrollments in AP courses for which students could earn dual credit without taking the AP exam? (Enrollments may include duplicated counts of students.)
__________ Enrollments
II. Courses for Dual Credit
5. During the 12-month 2010–11 school year, did your students take any courses for which they could earn dual credit with any postsecondary institution? (See definitions and instructions page.)
Yes ..... 1 (Continue with question 6.) No ...... 2 (Stop. Complete respondent section on front and return survey.)
6. Not including any state or specific postsecondary entrance requirements, has your school established any requirements that students must meet in order to enroll in courses for dual credit?
Yes ..... 1 (Continue with question 7.) No ...... 2 (Skip to question 8.)
7. Has your school established any of the following requirements that students must meet in order to enroll in courses for dual credit? (Indicate yes, no, or don’t know for each item. Indicate yes if an item is required for at least one dual credit course.)
Yes No Don’t know
a. Teacher recommendation ............................................................................................................. 1 2 3 b. School administrator or guidance counselor approval .................................................................. 1 2 3 c. Grade level (for example, only juniors and seniors are allowed to take courses for dual credit) . 1 2 3 d. Minimum GPA ............................................................................................................................... 1 2 3 e. Minimum high school class rank ................................................................................................... 1 2 3 f. Satisfactory high school attendance record .................................................................................. 1 2 3 g. Minimum score on a standardized test, such as the SAT or ACT ................................................ 1 2 3 h. Passing a college placement test given by a postsecondary institution ....................................... 1 2 3 i. Other (specify) _______________________________________________________________ 1 2 3
8. During the 12-month 2010–11 school year, did any of your students earn the following from a postsecondary institution by taking dual credit courses? (Indicate yes or no for each item.)
Yes No a. Certificate (a postsecondary certificate or diploma that normally requires 1–2 years
of study to complete, such as pharmacy technician or automotive technology) ................ 1 2 b. Associate’s degree ............................................................................................................. 1 2 c. Bachelor’s degree .............................................................................................................. 1 2

C-5
Infor
mation
Cop
y - D
o Not
Comple
te
II. Courses for Dual Credit (continued) Please answer the following questions about courses for dual credit with an academic focus and those with a career and technical/vocational focus. See information about course focus in item 3 on definitions and instructions page.
Courses for dual credit taught during the 12-month 2010–11 school year
Course focus
Academic
Career and technical/ vocational
9. During the 12-month 2010–11 school year, did your students take any courses for dual credit with an academic focus or with a career and technical/vocational focus, as defined in item 3 on the definitions and instructions page? (Circle yes or no. If “No” is circled for a course focus, leave questions 10–15 blank for that column.) .......................... Yes No Yes No
10. During the 12-month 2010–11 school year, what was the total number of high school enrollments for each of the following types of dual credit courses?
(See information about types of dual credit courses in item 2 on the definitions and instructions page. Enrollments may include duplicated counts of students; that is, a student should be counted for each relevant course in which he/she was enrolled. Include only students from your school. Enter “0” for none.)
Number of dual credit
enrollments
Number of dual credit
enrollments
a. Enrollments in courses taught primarily through distance education ..................... a.______ a.______
b. Enrollments in courses taught at locations for secondary school students (e.g., high school campus or career center), excluding distance education .......................... b.______ b.______
c. Enrollments in courses taught on the campus of a postsecondary institution, excluding distance education ........................................................................................ c.______ c.______
11. Which of the following best describes the instructors of the courses for dual credit that were taught at locations for secondary school students (e.g., high school campus or career center), excluding distance education? (Circle one.)
NA = Not applicable: no courses with this focus taught at secondary school locations...... NA NA
1 = High school instructors only (instructors primarily employed by the school district) .. 1 1
2 = Postsecondary instructors only (instructors primarily employed by a postsecondary institution)........................................................................................... 2 2
3 = Both high school and postsecondary instructors ....................................................... 3 3
12. What was the most common student composition for the courses for dual credit taught on the campus of a postsecondary institution, excluding distance education? (Circle one.)
NA = Not applicable: no courses with this focus taught on postsecondary campus ........... NA NA
1 = Only high school students .......................................................................................... 1 1
2 = High school and postsecondary students .................................................................. 2 2
13. Were students awarded postsecondary credit immediately upon completion of courses? Were students offered “credit in escrow,” meaning that they must enroll in a specific postsecondary institution after high school graduation in order to receive the credit? (Circle yes or no for each item.)
a. Immediately upon completion of courses ...................................................................... Yes No Yes No
b. Credit in escrow............................................................................................................. Yes No Yes No
c. Other (specify) _______________________________________________________ Yes No Yes No

C-6
Infor
mation
Co
Academic
Career and technical/ vocational
14. During the 12-month 2010–11 school year, did most of your students (and their parents) generally pay out of pocket for each of the following dual credit course expenses? (Circle yes or no for each item.)
a. Tuition (full or partial) .................................................................................................... Yes No Yes No
b. Fees .............................................................................................................................. Yes No Yes No
c. Books ........................................................................................................................... Yes No Yes No
15. During the 12-month 2010–11 school year, did your school or district pay any of the following expenses for dual credit courses taken by any of your students? (Circle yes or no for each item.)
a. Tuition (full or partial) .................................................................................................... Yes No Yes No
b. Fees .............................................................................................................................. Yes No Yes No
c. Books ........................................................................................................................... Yes No Yes No
16. During the 12-month 2010–11 school year, which source(s) were responsible for your students’ transportation costs for participation in the dual credit course(s)? (Indicate yes or no for each item.)
If no transportation was needed for any dual credit course (e.g., students took all courses at the high school campus or online) check here and leave the rest of this question blank.
Yes No a. Your school/district ............................................................................................................. 1 2 b. The state ............................................................................................................................ 1 2 c. Postsecondary institution ................................................................................................... 1 2 d. Parents/students ................................................................................................................ 1 2 e. py
-
Some other source(s) (specify) 1 2
Do Not
Comple
te
Courses for dual credit taught during the 12-month 2010–11 school year
Course focus
Thank you. Please keep a copy for your records.