Embed Size (px)
Citation preview

Page 2 Source: Company, www.dynamiclevels.com
Firstsource Solutions Limited
Company Overview and Stock price ……………………………………….……3
Product Overview……………………………………………………………….….…..4
Clients…..…………….…………………………………………………………………….9
Industry Outlook………………………………………....……….………….….…..10
Digital India………………………………..…………….………….….………………11
Highlight for FY 2015-16……………………………………………………………12
Company Financials………………………………………………………………….14
Peer Comparison & Ratios….………………………………………….……..…..17
Shareholding Pattern…………………………………………..……………....…. 18
Investment Rationale………………………………………...………….......…....19
Disclaimer………………………………………………………………………………..20

Page 3 Source: Company, www.dynamiclevels.com
Company’s Overview and Stock Price
Firstsource delivers innovative, value-added business process management services across the customer lifecycle. Company offers a inclusive suite of business process management services through a widespread domain knowledge, internal competencies and strategic alliances backed by leading-edge technologies. They focus on
Telecommunications & Media,
Banking & Financial Services,
Insurance,
Healthcare
Publishing verticals have enabled them to extend business benefits beyond cost arbitrage. Their endeavor is to deliver value-added services in Customer Management, Data Processing and Collections to build long-term partnerships with their clients and end-customers. They leverage well-tuned processes and innovative Intellectual Property-based products to simplify complex business processes. It’s a commitment that is reflected in their value proposition.
Product Overview
First Customer Intelligence
Company Overview
EXCHANGE SYMBOL FSL
Current Price * (Rs.) 38.30
Face Value (Rs.) 10.00
52 Week High (Rs.) (01-Dec-15) 45.90
52 Week Low (Rs.) (24-Aug-15) 24.20
Life Time high (Rs.) (15-May-07) 93.20
Life Time low (Rs.) (29-Dec-11) 5.55
Average Daily Movement [ADM] 1.48
Average Volume [20 days] 2819575
1 Month Return (%) 7.13
P/E Ratio (x) 9.74
Book Value 31.10
Market Cap (Cr) 2583.01
% of Promoter holding pledged 0.00
COMPANY PROFILE OF FSL, NSE, INDIA
Date of Incorporation 6-Dec-01
Date of Listing 22-Feb-07
Management
Name Designation
Sanjiv Goenka Chairman
Y H Malegam Ind.& Non Exe.Director
V K Sharma Ind.& Non Exe.Director
Charles Miller Smith Ind.& Non Exe.Director
Pradip Roy Ind.& Non Exe.Director
Donald W Layden Jr. Ind.& Non Exe.Director
Grace Koshie Independent Women Director
Rajesh Subramaniam Managing Director & CEO
Shashwat Goenka Non Exe.Non Ind.Director
Subrata Talukdar Non Exe.Non Ind.Director
Pradip Kumar Khaitan Non Exe.Non Ind.Director
Registered Office Address
5th Floor, Paradigm `B' Wing,Mindspace, Link Road, Malad
(West),400064,Mumbai,Maharashtra,India
Website
http://www.firstsource.com
Below is a weekly chart of Firstsource Solution which shows
that stock has gained momentum from Rs. 28 levels and
recently made high of Rs. 43.35. Stock has corrected from Rs.
43.35 and has come to a support of Rs. 38.50.

Page 4 Source: Company, www.dynamiclevels.com
First Chat
First Smartomation
First Resolve
First WF Suite
First Customer Intelligence As multi-communication channels like web, mobile and social media evolve, enterprises need to integrate these with the traditional customer communication channels and automate the data capture & analysis in order to deliver high-impact customer intelligence. First Customer Intelligence (FCI) helps clients in reducing cost to serve and customer effort, improving customer experience and increasing revenues by providing actionable insights across products, processes, channels, web strategy and agent performance. These are drawn from an in-depth, real-time analysis of customer interactions on voice and non-voice customer service channels. Powered by Firstsource’s Customer Insight Framework, FCI measures customer sentiment, emotions and behavior across multiple communication channels at an early stage in the interaction. These findings are further strengthened by performing competition analysis to provide actionable insights. FCI can also be deployed for tests campaigns, product launches, market hypothesis as well as customer profiling through trigger-based measurement processes. FCI has inbuilt algorithms and can be integrated with clients’ customer relationship management (CRM) systems.
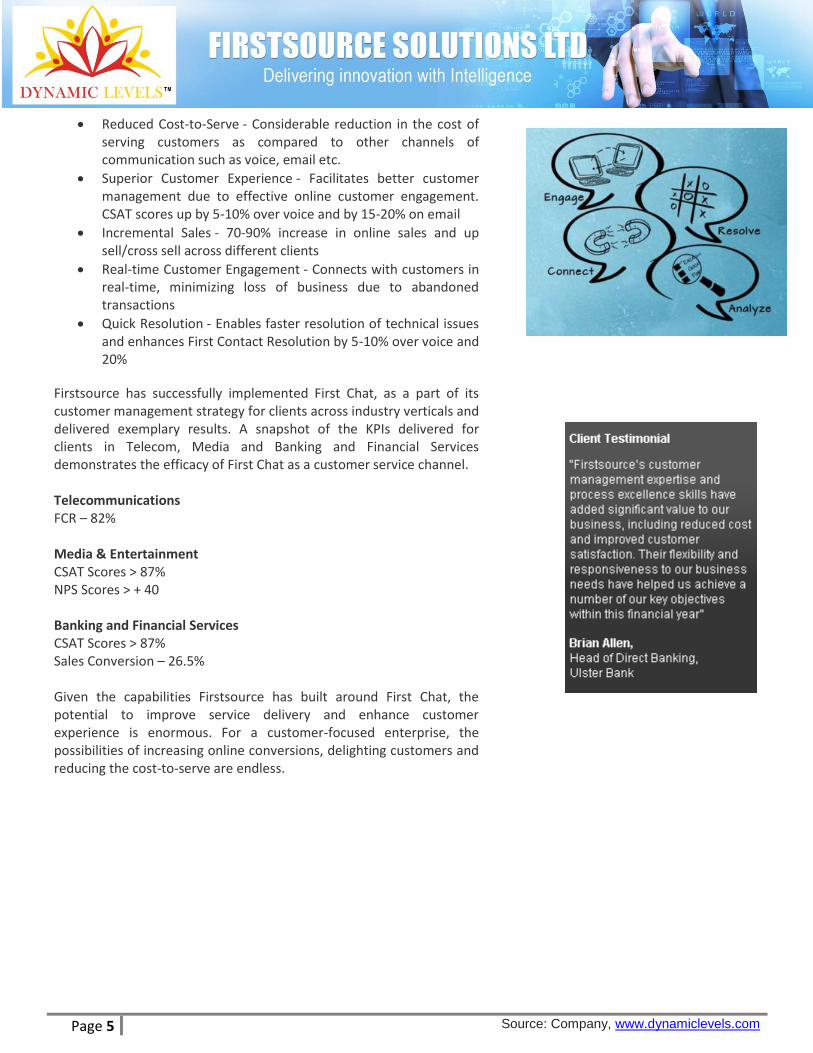
First Chat First Chat - Adding a human touch to the online customer experience First Chat is an online customer engagement product from Firstsource that employs an effective approach to improve the customer experience. First Chat enables real-time, person-to-person communication through live chat, adding a human touch to the web experience. It helps in turning online visitors into customers and empowers customers to self-serve efficiently. First Chat uses intelligent business rules to deliver proactive chat invitations at an appropriate time to engage customers online. It has multi-media compatibility that combines text, graphics and video to resolve customer queries efficiently. First Chat delivers cross-platform chats on desktops, mobiles and tablets, for maximum flexibility. First Chat can be deployed across online sales, customer service, technical support, account management, collections, saves and retentions with significant return on investment. It delivers significant benefits for the enterprise while enhancing customer experience:
The name “First Customer Intelligence” and
tagline “Actionable Insights from Customer
Interactions” has been applied for before
the Trade Mark Registry, in India.
Page 5 Source: Company, www.dynamiclevels.com
Reduced Cost-to-Serve - Considerable reduction in the cost of serving customers as compared to other channels of communication such as voice, email etc.
Superior Customer Experience - Facilitates better customer management due to effective online customer engagement. CSAT scores up by 5-10% over voice and by 15-20% on email
Incremental Sales - 70-90% increase in online sales and up sell/cross sell across different clients
Real-time Customer Engagement - Connects with customers in real-time, minimizing loss of business due to abandoned transactions
Quick Resolution - Enables faster resolution of technical issues and enhances First Contact Resolution by 5-10% over voice and 20%
Firstsource has successfully implemented First Chat, as a part of its customer management strategy for clients across industry verticals and delivered exemplary results. A snapshot of the KPIs delivered for clients in Telecom, Media and Banking and Financial Services demonstrates the efficacy of First Chat as a customer service channel. Telecommunications FCR – 82% Media & Entertainment CSAT Scores > 87% NPS Scores > + 40 Banking and Financial Services CSAT Scores > 87% Sales Conversion – 26.5% Given the capabilities Firstsource has built around First Chat, the potential to improve service delivery and enhance customer experience is enormous. For a customer-focused enterprise, the possibilities of increasing online conversions, delighting customers and reducing the cost-to-serve are endless.

Page 6 Source: Company, www.dynamiclevels.com
First Smartomation Contact center agents often need to access data or information associated with multiple products and services from disparate systems, sources, knowledge bases and databases which don’t necessarily talk to each other. This leads to a complex customer management scenario where a contact center agent needs to search across different systems for the required information. The agent has to toggle between screens and manually enter data, which makes it error-prone. It leads to longer First Call Resolution (FCR) and Average
Handling Time (AHT). As a result, agent productivity is hampered creating a less-than-perfect customer experience. Firstsource addresses this challenge by using a proprietary process automation tool called First Smartomation.
First Smartomation uses non-invasive technology to integrate diverse applications on their native platforms. It then provides a unified, user-friendly interface to the agent that simplifies the process. First Smartomation boosts agent productivity, increases accuracy and enhances customer experience. First Smartomation uses the following intuitive framework to increase process efficiency and productivity:
Business benefits of First Smartomation include:
Increased cost efficiencies by 10-15% for voice; 25-30% for
back-office
Enhanced customer experience due to lowered AHT and
improved FCR
Improved agent productivity and optimum use of resources
Increased process compliance
Increased accuracy and better quality of output
First Smartomation delivered the
following metrics for a US Telecom Major
200% Increase in Productivity
67% Cost Reduction
100% Data Accuracy
30% Reduction in Training Time
Page 7 Source: Company, www.dynamiclevels.com
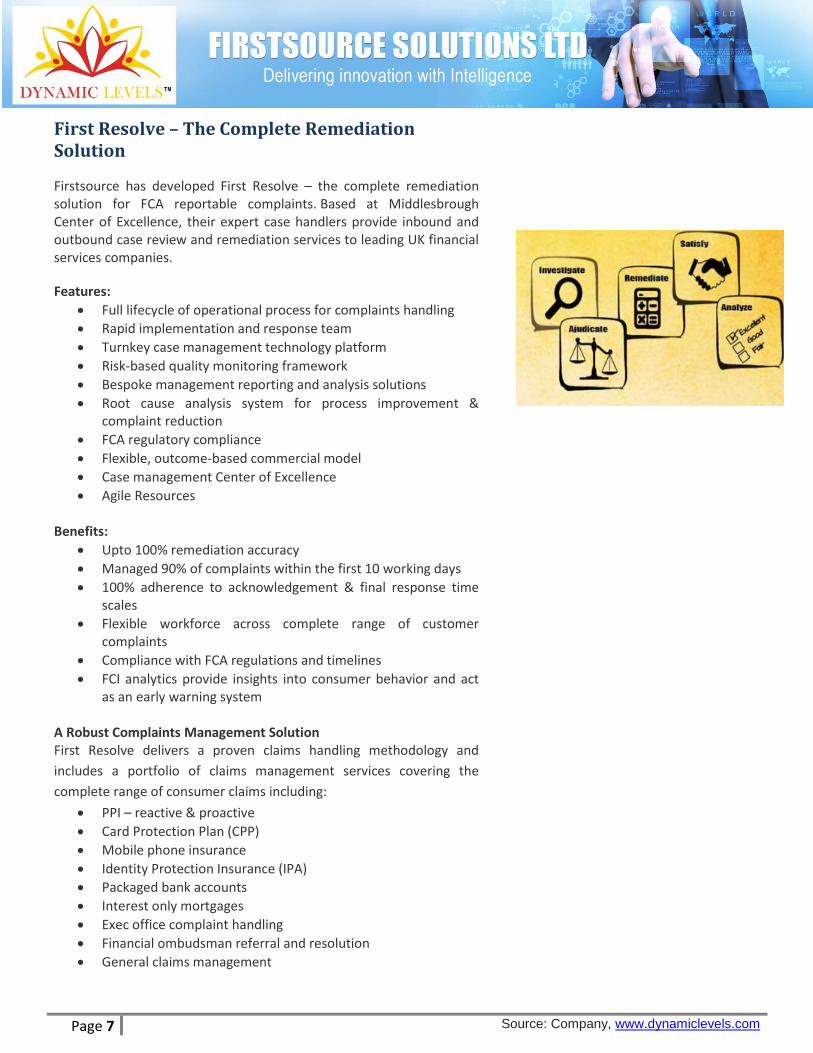
First Resolve – The Complete Remediation Solution
Firstsource has developed First Resolve – the complete remediation solution for FCA reportable complaints. Based at Middlesbrough Center of Excellence, their expert case handlers provide inbound and outbound case review and remediation services to leading UK financial services companies.
Features:
Full lifecycle of operational process for complaints handling
Rapid implementation and response team
Turnkey case management technology platform
Risk-based quality monitoring framework
Bespoke management reporting and analysis solutions
Root cause analysis system for process improvement & complaint reduction
FCA regulatory compliance
Flexible, outcome-based commercial model
Case management Center of Excellence
Agile Resources Benefits:
Upto 100% remediation accuracy
Managed 90% of complaints within the first 10 working days
100% adherence to acknowledgement & final response time scales
Flexible workforce across complete range of customer complaints
Compliance with FCA regulations and timelines
FCI analytics provide insights into consumer behavior and act as an early warning system
A Robust Complaints Management Solution First Resolve delivers a proven claims handling methodology and
includes a portfolio of claims management services covering the
complete range of consumer claims including:
PPI – reactive & proactive
Card Protection Plan (CPP)
Mobile phone insurance
Identity Protection Insurance (IPA)
Packaged bank accounts
Interest only mortgages
Exec office complaint handling
Financial ombudsman referral and resolution
General claims management

Page 8 Source: Company, www.dynamiclevels.com
First WF Suite
One of the biggest challenges for organizations and their contact centers is managing workforce costs, which account for 55-60 per cent of their operational expenditure. Effectively managing workforce centric processes like scheduling, evaluation and training can help in cost control and agent performance. First WF Suite - The Workforce Management Product Suite from Firstsource helps in devising the right strategies for contact centers and building robust WFM capabilities. First WF Suite also enables an end-to-end Workforce Management practice, apart from providing consulting services to improve efficiency and contain costs. Consulting Services: Involves inspecting the client's existing WFM practice, identifying the problems impacting the performance of the business from a Workforce Management standpoint and developing a WFM strategy to improve efficiency and reduce operational costs. Managed Services: Firstsource helps organizations to manage their end-to-end WFM practice such as forecasting, resource planning, staffing and scheduling, real-time adherence, operations analytics, process design and re-engineering. Capability Development: Firstsource WFM Academy provides effective, coherent and focused training in the field of Workforce Management, around the areas of forecasting, planning and reporting. Further it helps clients in identifying the right tools, provides training resources on advanced tools and helps in implementing processes.
Firstsource offers First WF Suite as a customized product offering comprising:
Consulting
Managed Services
WFM Capability Development
Page 9 Source: Company, www.dynamiclevels.com
Clients
FSL Ltd is a leading business process management company, providing
customer-centric business process services. Their network of delivery
centres encompasses
India,
Philippines,
Sri Lanka
UK
US
FSL leverage their ‘Right-shore’ delivery model to serve organisations
in the
Banking and Financial Services
Insurance,
Healthcare,
Telecommunications & Media,
Publishing sectors
They assimilated best-of-breed processes, developed intellectual
property, adopted cuttingedge technology, ensured on-time delivery
and invested in quality services to confirm maximum customer
satisfaction. This helped their clients to reduce operational costs,
record process improvements and more importantly, focus on their
core competence.
FSL Limited Top Clients
Healthcare
5 of the top 10 health insurance/managed care companies in
the US
700+ hospitals in the US
Telecom and Media
2 of the top 10 US telecom companies
1 of the top 3 mobile service providers in the UK
Largest pay TV operator in the UK Largest pay TV operator in
Australia
3 of the Top 5 mobile service providers in India
Largest Telecom Company in Sri Lanka
One of the world’s largest Media & Entertainment
conglomerates
UK’s largest News & Broadcasting company
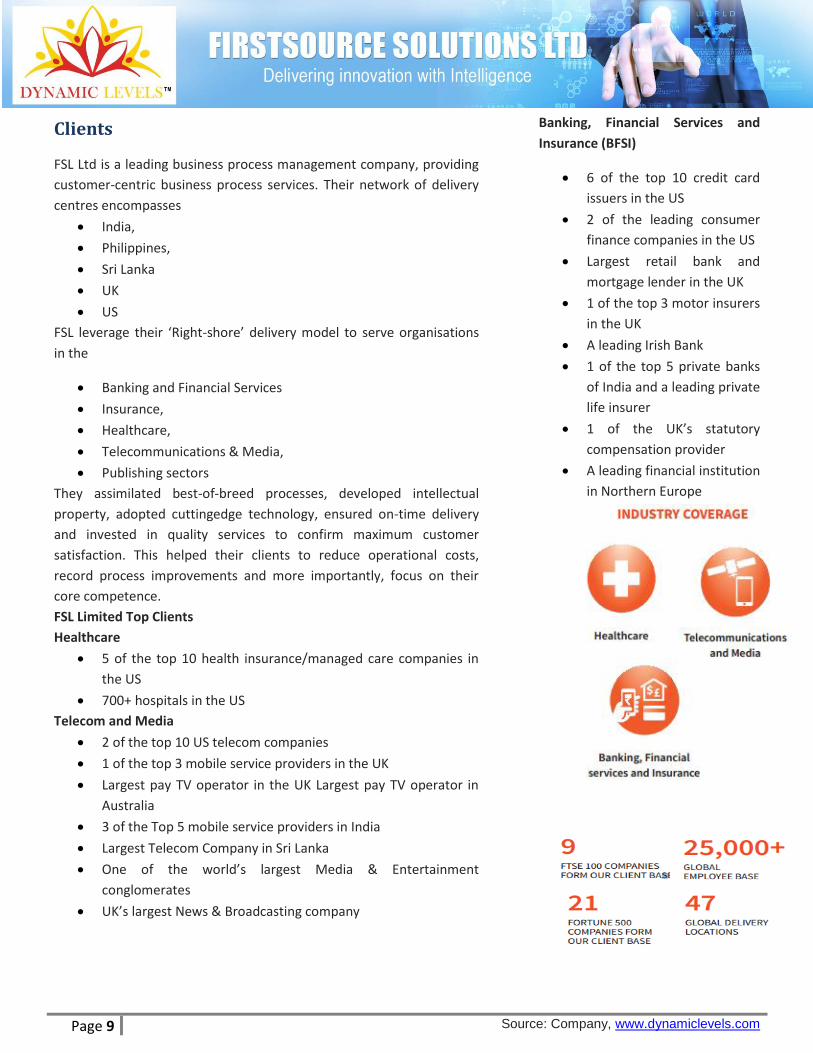
Banking, Financial Services and
Insurance (BFSI)
6 of the top 10 credit card
issuers in the US
2 of the leading consumer
finance companies in the US
Largest retail bank and
mortgage lender in the UK
1 of the top 3 motor insurers
in the UK
A leading Irish Bank
1 of the top 5 private banks
of India and a leading private
life insurer
1 of the UK’s statutory
compensation provider
A leading financial institution
in Northern Europe

Page 10 Source: Company, www.dynamiclevels.com
Industry Outlook
Introduction
Market Size and Position India is the world's largest sourcing destination for the information technology (IT) industry, accounting for approximately 67 per cent of the US$ 124-130 billion market. The industry employs about 10 million workforces. More importantly, the industry has led the economic transformation of the country and altered the perception of India in the global economy. Cost effective India's cost competitiveness in providing IT services, which is approximately 3-4 times cheaper than the US, continues to be the mainstay of its Unique Selling Proposition (USP) in the global sourcing market. However, India is also gaining prominence in terms of intellectual capital with several global IT firms setting up their innovation centres in India. Creating Demand The IT industry has also created significant demand in the Indian education sector, especially for engineering and computer science. The Indian IT and ITeS industry is divided into four major segments – IT services, Business Process Management (BPM), software products and engineering services, and hardware.
Valuation till 2015-16
The IT-BPM sector which is currently valued at US$ 143 billion is
expected to grow at a Compound Annual Growth Rate (CAGR) of 8.3
per cent year-on-year to US$ 143 billion for 2015-16. The sector is
expected to contribute 9.5 per cent of India’s Gross Domestic Product
(GDP) and more than 45 per cent in total services export in 2015-16.
Expectation
The Indian IT sector is expected soft but steady growth in FY 2017 in
constant currency terms. The sector is also expected triple its current
annual revenue to reach US$ 350 billion by FY 2025, as per National
Association of Software and Services Companies (NASSCOM). India, the
fourth largest base for new businesses in the world and home to over
3,100 tech start-ups, is set to increase its base to 11,500 tech start-ups
by 2020, as per a report by NASSCOM and Zinnov Management
Consulting Pvt Ltd.
India’s internet economy is expected to
touch Rs 10 trillion (US$ 146.72 billion)
by 2018, accounting for 5 per cent of the
country’s GDP, according to a report by
the Boston Consulting Group (BCG) and
Internet and Mobile Association of India
(IAMAI) and smartphones grew to 160
million.
Investments Indian IT's core competencies and
strengths have attracted significant
investments from major countries. The
computer software and hardware sector
in India attracted cumulative Foreign
Direct Investment (FDI) inflows worth
US$ 20.42 billion between April 2000
and December 2015, according to data
released by the Department of Industrial
Policy and Promotion (DIPP).
Indian start-ups are expected to receive
funding worth US$ 5 billion by the end of
2015, a 125 per cent increase in a year,
according to a report by IT Industry
association NASSCOM.
Having proven its capabilities in
delivering both on-shore and off-shore
services to global clients, emerging
technologies now offer an entire new
gamut of opportunities for top IT firms in
India. Social, Mobility, Analytics and
Cloud (SMAC) are collectively expected
to offer a US$ 1 trillion opportunity.
Cloud represents the largest opportunity
under SMAC, increasing at a CAGR of
approximately 30 per cent to around
US$ 650-700 billion by 2020.

Page 11 Source: Company, www.dynamiclevels.com
Digital India
The Digital India program is centred on three key vision areas:
Digital Infrastructure as a Core Utility to Every Citizen
Governance and Services on Demand
Digital Empowerment of Citizens
Digital Infrastructure as a Utility to Every Citizen
Availability of high speed internet as a core utility for delivery
of services to citizens
Cradle to grave digital identity that is unique, lifelong, online
and authenticable to every citizen
Mobile phone & bank account enabling citizen participation in
digital & financial space
Easy access to a Common Service Centre
Shareable private space on a public cloud
Safe and secure cyber-space
Governance & Services on Demand
Seamlessly integrated services across departments or
jurisdictions
Availability of services in real time from online & mobile
platforms
All citizen entitlements to be portable and available on the
cloud
Digitally transformed services for improving ease of doing
business
Making financial transactions electronic & cashless
Leveraging Geospatial Information Systems (GIS) for decision
support systems & development
Digital Empowerment of Citizens
Universal digital literacy
Universally accessible digital resources
Availability of digital resources / services in Indian languages
Collaborative digital platforms for participative governance
Citizens not required to physically submit Govt. documents /
certificates

Page 12 Source: Company, www.dynamiclevels.com
Highlights for FY2015-16
Acquisition:
Firstsource has entered into a Definitive Agreement with ISGN in
January 2016, a leading full service provider of mortgage technology
and services, to acquire its BPO division. This strategic acquisition helps
Firstsource penetrate into the growing US mortgage BPO market,
provides Firstsource with marquee customers, and offers significant
potential opportunities for cross-selling of services.
Business Wins:
FSL ltd signed a large transformational deal with one of UK’s
largest retail banks. The transformational nature of this deal
involves significant elements of process re-engineering and
automation.
FSL Ltd Signed a 3 year contract extension with giffgaff, the
Mobile network provider in UK. The contract signifies a
renewed commitment to providing excellent member
management services for the network provider.
FSL Ltd partnered with Synexus, world’s leading Site
Management Organisation (SMO) to enhance the patient
experience throughout the clinical trial process. This win marks
Firstsource’s entry into the UK’s healthcare industry.
Firstsource forayed into the E-commerce space in India with a
new contract win with one of the top e-commerce player.
Firstsource will provide Inbound Customer Service for this
client.
Partnerships:
Firstsource investment into Analytics in partnership with
NanoBi continues to strengthen its capabilities to provide
valuable insights to clients it serves.
Fisrtsource partnered with WorkFlex, the industry leader in
Intelligent Intraday AutomationTM for contact centers, to
boost intraday performance through real-time alerting.
Firstsource partnered with Ulster University – the second
largest university in UK - to give Firstsource employees an
opportunity to earn a degree in Customer Contact
Management. Awards and Accolades:

Page 13 Source: Company, www.dynamiclevels.com
Won Outsource Contact Centre of the Year at the Welsh
Contact Centre Awards. The win recognizes Firstsource as a top
employer in the industry and reflects the unmatched career
development and training opportunities it offers its people.
Received the ‘Innovation in Outsourcing’ award for its
partnership with giffgaff at the National Outsourcing
Association’s (NOA) Awards 2015.
Won 2 awards at the UK Customer Experience
Awards 2015:
With NOW TV, the ‘Business Change or Transformation -
Transformation at the Heart’ category. NOW TV is an Online
Television service powered and owned by Sky.
The Silver Award with giffgaff in the ‘Technology and Telecoms
- Amazing Customer Experience’ category.
Awarded 4th Runner-up for its corporate film on Diversity &
Inclusion at the Learning & Organisation Development (L&OD)
2016 Corporate Film Awards
Credit Rating
CRISIL (A Standard & Poors Company) upgraded the company’s Short-
Term Rating from A2 to A2+ Stable and assigned the Long Term Rating
of A-
Instrument Category Earlier Rating Rating After Upgrade
Long Term CRISIL A- / Stable
Short Term CRISIL A2 CRISIL A2+
Corporate Credit Rating
CCR BBB+ Withdrawn (due to assignment of Long Term
Rating)
CARE has upgraded the company rating from CARE A- to CARE A (Long-term Bank Facilities) and from CARE A2+ to CARE A1 (Short-term Bank Facilities).
CARE has upgraded the company’s
commercial paper rating from CARE A2+
to CARE A1
Facilities / Instrument Earlier Rating Rating After Upgrade
Short-term Bank Facilities
CARE A2+ CARE A1
Long-term Bank Facilities
CARE A- CARE A

Page 14 Source: Company, www.dynamiclevels.com
Company Financials
In Cr March-16 March-15 March-14 Growth
Annual Annual Annual FY15-FY16 FY14-FY15
Net Sales/Income from operations 3174.69 3003.38 3127.02 5.70% -3.95%
Other Operating Income 55.60 31.27 -21.15
Total Income From Operations 3230.29 3034.65 3105.88
Employees Cost 2172.17 2017.15 2129.41 7.69% -5.27%
Depreciation 66.20 72.18 75.70
Other Expenses 653.30 636.74 614.35
Total Expenditure 2891.67 2726.07 2819.45 6.07% -3.31%
Operating Profit 338.62 308.58 286.42 9.73% 7.74%
Other Income 9.44 6.52 2.00
P/L Before Int., Excpt. Items & Tax 348.06 315.10 288.43
Interest 52.44 71.09 85.15 -26.23% -16.51%
P/L Before Tax 295.62 244.02 203.28
Tax 30.22 9.54 10.09
PAT 265.41 234.48 193.19 13.19% 21.37%
Minority Interest -0.44 -0.16 -0.23
Net Profit/(Loss) For the Period 264.97 234.32 192.96 13.08% 21.43%
Equity Share Capital 673.32 666.29 659.74
Reserves 1751.77 1422.33 1431.69
EPS (Rs.) [After Extraordinary items] 3.96 3.53 2.93 12.18% 20.48%
Operating Profit Margin 10.67% 10.27%
Net Profit Margin 8.35% 7.80%
Income from Operations has shown significant jump from F15-FY16 comparing that to FY14-FY15.
Company has maintained its Operating profit margin in line with Nasscom expectation of 10%-11% steady growth.
Company’s Net Operating Profit margin has not shown any significant change in FY16 comparison with FY15.
Company’s interest cost has gone down drastically from Rs. 71.09 to Rs. 52.44 drop of 26.23% this is a good sign.
Page 15 Source: Company, www.dynamiclevels.com
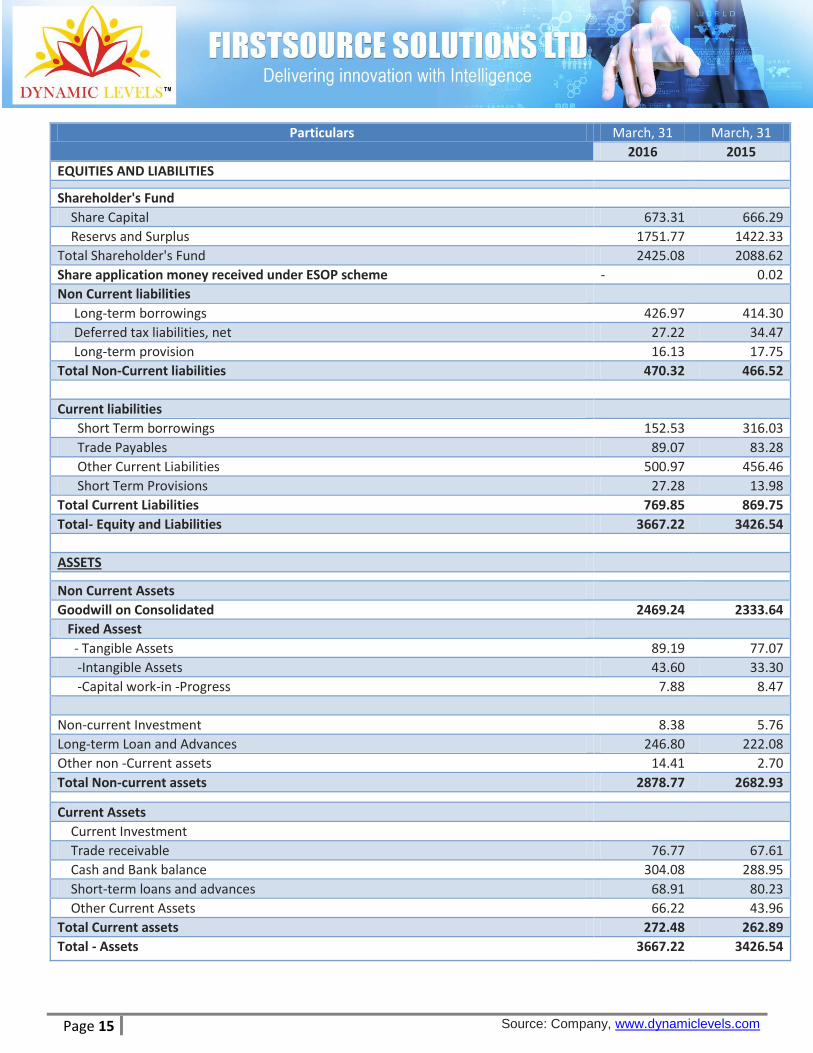
Particulars March, 31 March, 31
2016 2015
EQUITIES AND LIABILITIES
Shareholder's Fund
Share Capital 673.31 666.29
Reservs and Surplus 1751.77 1422.33
Total Shareholder's Fund 2425.08 2088.62
Share application money received under ESOP scheme - 0.02
Non Current liabilities
Long-term borrowings 426.97 414.30
Deferred tax liabilities, net 27.22 34.47
Long-term provision 16.13 17.75
Total Non-Current liabilities 470.32 466.52
Current liabilities
Short Term borrowings 152.53 316.03
Trade Payables 89.07 83.28
Other Current Liabilities 500.97 456.46
Short Term Provisions 27.28 13.98
Total Current Liabilities 769.85 869.75
Total- Equity and Liabilities 3667.22 3426.54
ASSETS
Non Current Assets
Goodwill on Consolidated 2469.24 2333.64
Fixed Assest
- Tangible Assets 89.19 77.07
-Intangible Assets 43.60 33.30
-Capital work-in -Progress 7.88 8.47
Non-current Investment 8.38 5.76
Long-term Loan and Advances 246.80 222.08
Other non -Current assets 14.41 2.70
Total Non-current assets 2878.77 2682.93
Current Assets
Current Investment
Trade receivable 76.77 67.61
Cash and Bank balance 304.08 288.95
Short-term loans and advances 68.91 80.23
Other Current Assets 66.22 43.96
Total Current assets 272.48 262.89
Total - Assets 3667.22 3426.54
Page 16 Source: Company, www.dynamiclevels.com
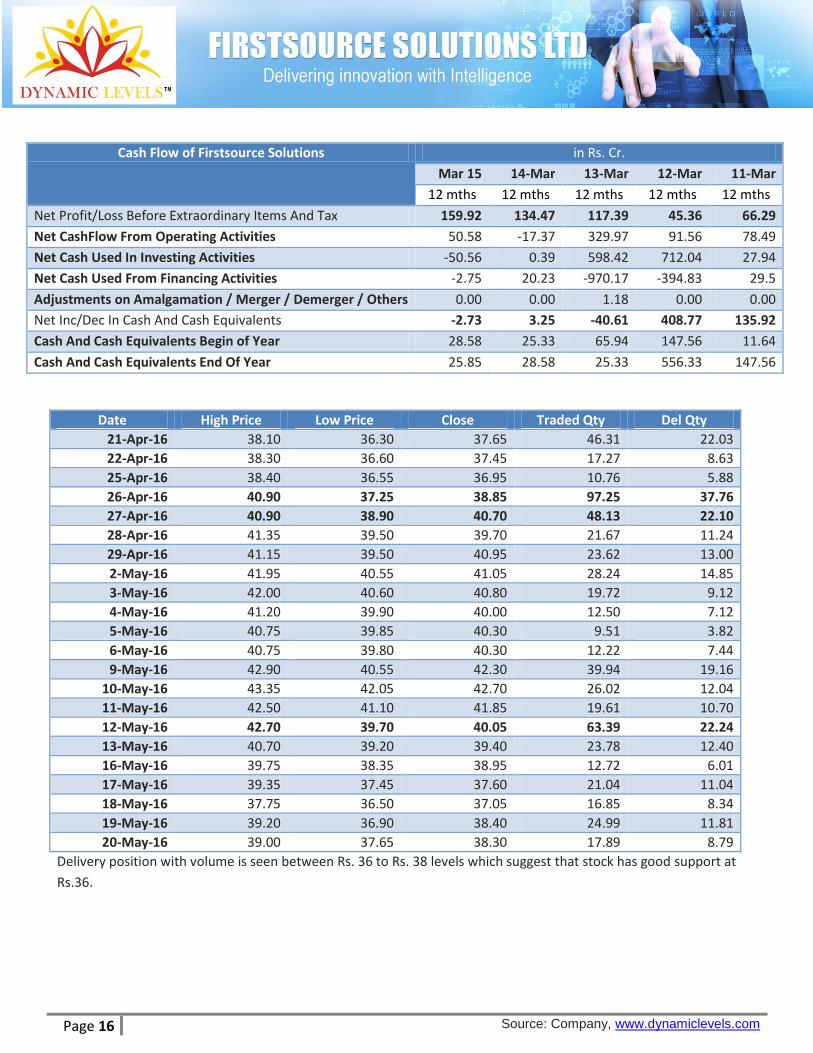
Cash Flow of Firstsource Solutions in Rs. Cr.
Mar 15 14-Mar 13-Mar 12-Mar 11-Mar
12 mths 12 mths 12 mths 12 mths 12 mths
Net Profit/Loss Before Extraordinary Items And Tax 159.92 134.47 117.39 45.36 66.29
Net CashFlow From Operating Activities 50.58 -17.37 329.97 91.56 78.49
Net Cash Used In Investing Activities -50.56 0.39 598.42 712.04 27.94
Net Cash Used From Financing Activities -2.75 20.23 -970.17 -394.83 29.5
Adjustments on Amalgamation / Merger / Demerger / Others 0.00 0.00 1.18 0.00 0.00
Net Inc/Dec In Cash And Cash Equivalents -2.73 3.25 -40.61 408.77 135.92
Cash And Cash Equivalents Begin of Year 28.58 25.33 65.94 147.56 11.64
Cash And Cash Equivalents End Of Year 25.85 28.58 25.33 556.33 147.56
Date High Price Low Price Close Traded Qty Del Qty
21-Apr-16 38.10 36.30 37.65 46.31 22.03
22-Apr-16 38.30 36.60 37.45 17.27 8.63
25-Apr-16 38.40 36.55 36.95 10.76 5.88
26-Apr-16 40.90 37.25 38.85 97.25 37.76
27-Apr-16 40.90 38.90 40.70 48.13 22.10
28-Apr-16 41.35 39.50 39.70 21.67 11.24
29-Apr-16 41.15 39.50 40.95 23.62 13.00
2-May-16 41.95 40.55 41.05 28.24 14.85
3-May-16 42.00 40.60 40.80 19.72 9.12
4-May-16 41.20 39.90 40.00 12.50 7.12
5-May-16 40.75 39.85 40.30 9.51 3.82
6-May-16 40.75 39.80 40.30 12.22 7.44
9-May-16 42.90 40.55 42.30 39.94 19.16
10-May-16 43.35 42.05 42.70 26.02 12.04
11-May-16 42.50 41.10 41.85 19.61 10.70
12-May-16 42.70 39.70 40.05 63.39 22.24
13-May-16 40.70 39.20 39.40 23.78 12.40
16-May-16 39.75 38.35 38.95 12.72 6.01
17-May-16 39.35 37.45 37.60 21.04 11.04
18-May-16 37.75 36.50 37.05 16.85 8.34
19-May-16 39.20 36.90 38.40 24.99 11.81
20-May-16 39.00 37.65 38.30 17.89 8.79
Delivery position with volume is seen between Rs. 36 to Rs. 38 levels which suggest that stock has good support at
Rs.36.
Page 17 Source: Company, www.dynamiclevels.com
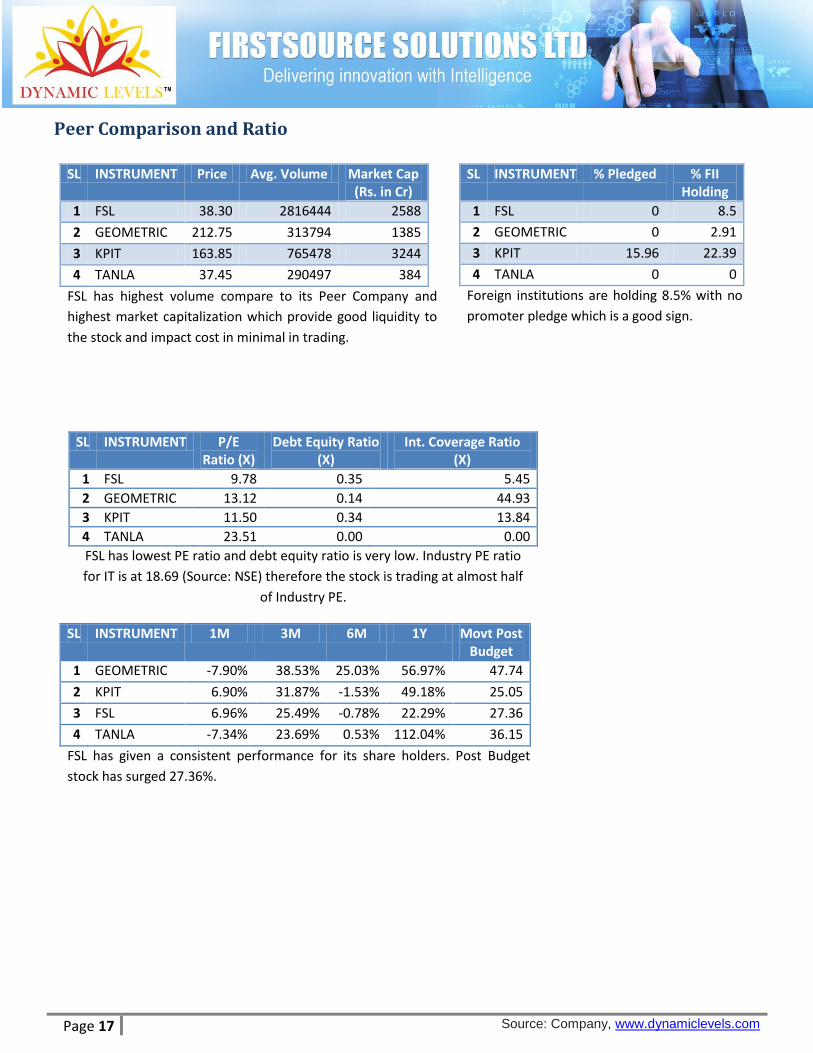
Peer Comparison and Ratio
SL INSTRUMENT Price Avg. Volume Market Cap (Rs. in Cr)
1 FSL 38.30 2816444 2588
2 GEOMETRIC 212.75 313794 1385
3 KPIT 163.85 765478 3244
4 TANLA 37.45 290497 384
FSL has highest volume compare to its Peer Company and
highest market capitalization which provide good liquidity to
the stock and impact cost in minimal in trading.
SL INSTRUMENT P/E Ratio (X)
Debt Equity Ratio (X)
Int. Coverage Ratio (X)
1 FSL 9.78 0.35 5.45
2 GEOMETRIC 13.12 0.14 44.93
3 KPIT 11.50 0.34 13.84
4 TANLA 23.51 0.00 0.00
FSL has lowest PE ratio and debt equity ratio is very low. Industry PE ratio
for IT is at 18.69 (Source: NSE) therefore the stock is trading at almost half
of Industry PE.
SL INSTRUMENT % Pledged % FII Holding
1 FSL 0 8.5
2 GEOMETRIC 0 2.91
3 KPIT 15.96 22.39
4 TANLA 0 0
Foreign institutions are holding 8.5% with no
promoter pledge which is a good sign.
SL INSTRUMENT 1M 3M 6M 1Y Movt Post Budget
1 GEOMETRIC -7.90% 38.53% 25.03% 56.97% 47.74
2 KPIT 6.90% 31.87% -1.53% 49.18% 25.05
3 FSL 6.96% 25.49% -0.78% 22.29% 27.36
4 TANLA -7.34% 23.69% 0.53% 112.04% 36.15
FSL has given a consistent performance for its share holders. Post Budget
stock has surged 27.36%.
Page 18 Source: Company, www.dynamiclevels.com
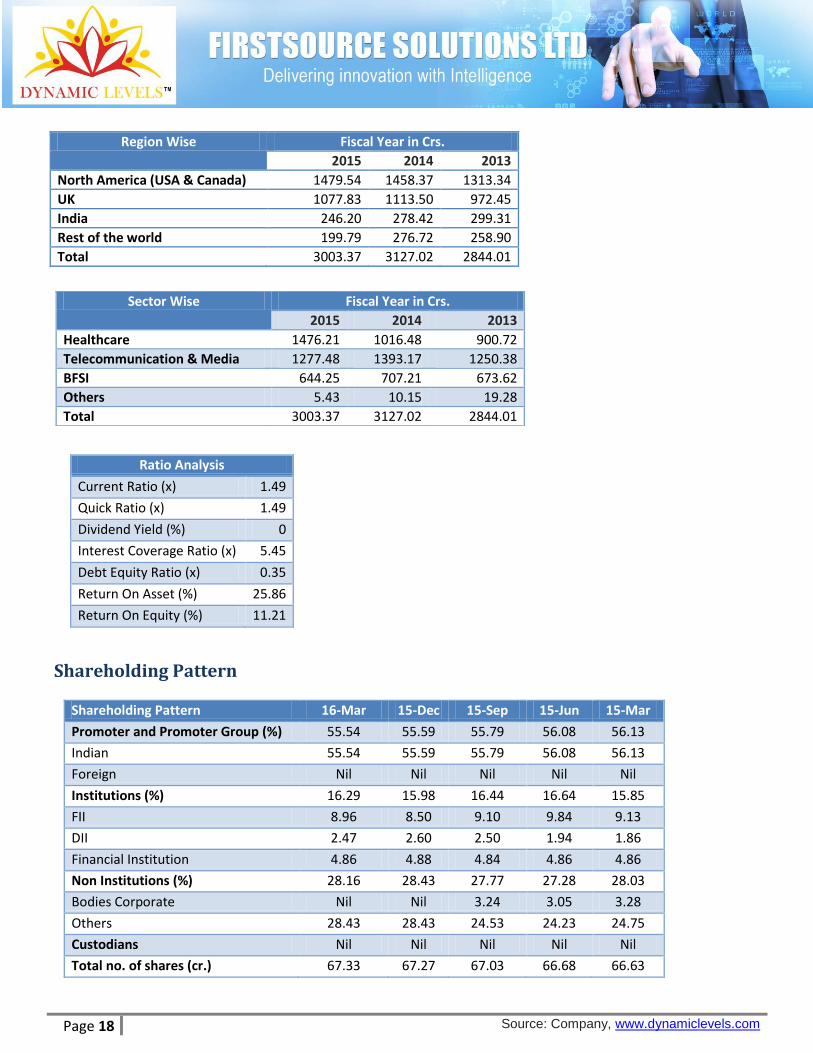
Shareholding Pattern
Shareholding Pattern 16-Mar 15-Dec 15-Sep 15-Jun 15-Mar
Promoter and Promoter Group (%) 55.54 55.59 55.79 56.08 56.13
Indian 55.54 55.59 55.79 56.08 56.13
Foreign Nil Nil Nil Nil Nil
Institutions (%) 16.29 15.98 16.44 16.64 15.85
FII 8.96 8.50 9.10 9.84 9.13
DII 2.47 2.60 2.50 1.94 1.86
Financial Institution 4.86 4.88 4.84 4.86 4.86
Non Institutions (%) 28.16 28.43 27.77 27.28 28.03
Bodies Corporate Nil Nil 3.24 3.05 3.28
Others 28.43 28.43 24.53 24.23 24.75
Custodians Nil Nil Nil Nil Nil
Total no. of shares (cr.) 67.33 67.27 67.03 66.68 66.63
Ratio Analysis
Current Ratio (x) 1.49
Quick Ratio (x) 1.49
Dividend Yield (%) 0
Interest Coverage Ratio (x) 5.45
Debt Equity Ratio (x) 0.35
Return On Asset (%) 25.86
Return On Equity (%) 11.21
Sector Wise Fiscal Year in Crs.
2015 2014 2013
Healthcare 1476.21 1016.48 900.72
Telecommunication & Media 1277.48 1393.17 1250.38
BFSI 644.25 707.21 673.62
Others 5.43 10.15 19.28
Total 3003.37 3127.02 2844.01
Region Wise Fiscal Year in Crs.
2015 2014 2013
North America (USA & Canada) 1479.54 1458.37 1313.34
UK 1077.83 1113.50 972.45
India 246.20 278.42 299.31
Rest of the world 199.79 276.72 258.90
Total 3003.37 3127.02 2844.01
Page 19 Source: Company, www.dynamiclevels.com
Investment Rationale
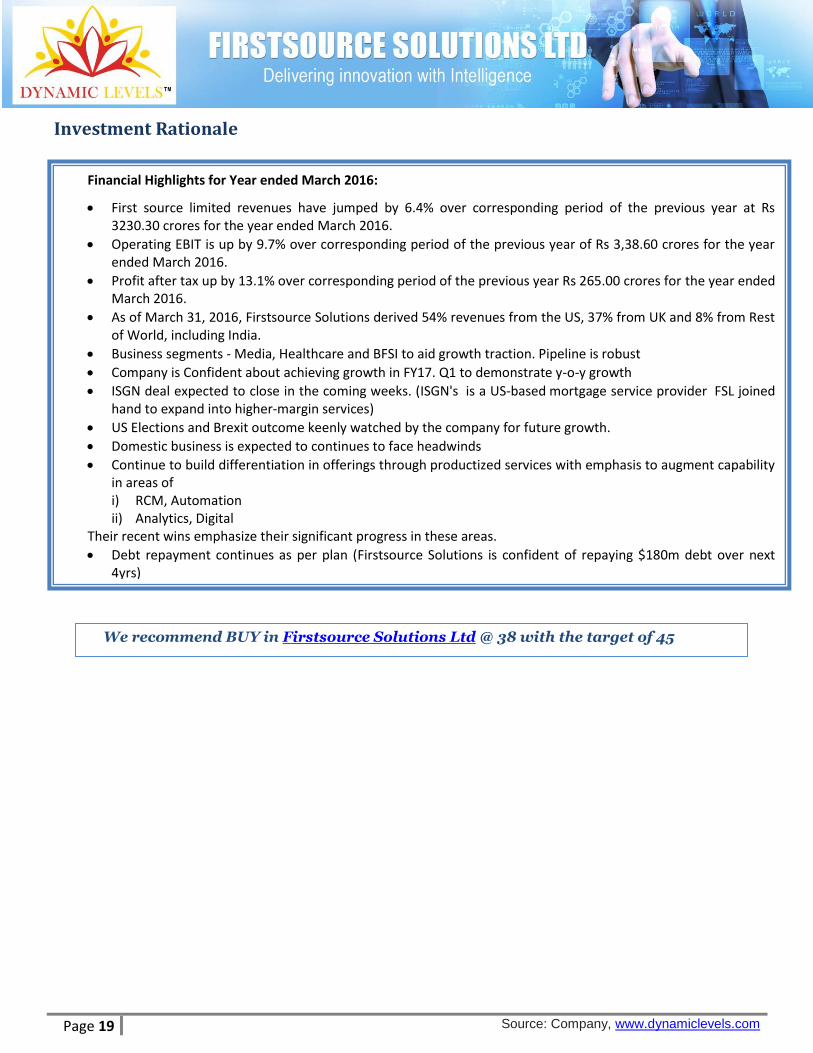
Financial Highlights for Year ended March 2016:
First source limited revenues have jumped by 6.4% over corresponding period of the previous year at Rs 3230.30 crores for the year ended March 2016.
Operating EBIT is up by 9.7% over corresponding period of the previous year of Rs 3,38.60 crores for the year ended March 2016.
Profit after tax up by 13.1% over corresponding period of the previous year Rs 265.00 crores for the year ended March 2016.
As of March 31, 2016, Firstsource Solutions derived 54% revenues from the US, 37% from UK and 8% from Rest of World, including India.
Business segments - Media, Healthcare and BFSI to aid growth traction. Pipeline is robust
Company is Confident about achieving growth in FY17. Q1 to demonstrate y-o-y growth
ISGN deal expected to close in the coming weeks. (ISGN's is a US-based mortgage service provider FSL joined hand to expand into higher-margin services)
US Elections and Brexit outcome keenly watched by the company for future growth.
Domestic business is expected to continues to face headwinds
Continue to build differentiation in offerings through productized services with emphasis to augment capability in areas of i) RCM, Automation ii) Analytics, Digital
Their recent wins emphasize their significant progress in these areas.
Debt repayment continues as per plan (Firstsource Solutions is confident of repaying $180m debt over next 4yrs)
We recommend BUY in Firstsource Solutions Ltd @ 38 with the target of 45

Page 20 Source: Company, www.dynamiclevels.com
Disclaimer: Research Disclaimer and Disclosure inter-alia as required under Securities and Exchange Board of India (Research Analysts) Regulations, 2014. Dynamic Equities Pvt. Ltd. is a member of National Stock Exchange of India Ltd. (NSEIL), Bombay Stock Exchange Ltd (BSE), Multi Stock Exchange of India Ltd (MCX-SX) and also a depository participant with National Securities Depository Ltd (NSDL) and Central Depository Services Ltd.(CDSL). Dynamic is engaged in the business of Stock Broking, Depository Services, Investment Advisory Services and Portfolio Management Services. Dynamic Equities Pvt. Ltd. is holding company of Dynamic Commodities Pvt. Ltd. , a member of Multi Commodities Exchange (MCX) & National Commodity & Derivatives Exchange Ltd.(NCDEX). We hereby declare that our activities were neither suspended nor we have defaulted with any stock exchange authority with whom we are registered. SEBI, Exchanges and Depositories have conducted the routine inspection and based on their observations have issued advise letters or levied minor penalty on for certain operational deviations. Answers to the Best of the knowledge and belief of Dynamic/ its Associates/ Research Analyst who prepared this report
DYANMIC/its Associates/ Research Analyst/ his Relative have any financial interest in the subject company? No
DYANMIC/its Associates/ Research Analyst/ his Relative have actual/beneficial ownership of one per cent or more securities of the subject company? No
DYANMIC/its Associates/ Research Analyst/ his Relative have any other material conflict of interest at the time of publication of the research report or at the time of public appearance? No
DYANMIC/its Associates/ Research Analyst/ his Relative have received any compensation from the subject company in the past twelve months? No
DYANMIC/its Associates/ Research Analyst/ his Relative have managed or co-managed public offering of securities for the subject company in the past twelve months? No
DYANMIC/its Associates/ Research Analyst/ his Relative have received any compensation for investment banking or merchant banking or brokerage services from the subject company in the past twelve months? No
DYANMIC/its Associates/ Research Analyst/ his Relative have received any compensation for products or services other than investment banking or merchant banking or brokerage services from the subject company in the past twelve months? No
DYANMIC/its Associates/ Research Analyst/ his Relative have received any compensation or other benefits from the Subject Company or third party in connection with the research report? No
DYANMIC/its Associates/ Research Analyst/ his Relative have served as an officer, director or employee of the subject company? No
DYANMIC/its Associates/ Research Analyst/ his Relative have been engaged in market making activity for the subject company? No
General Disclaimer: - This Research Report (hereinafter called “Report”) is meant solely for use by the recipient and is not for circulation. This Report does not constitute a personal recommendation or take into account the particular investment objectives, financial situations, or needs of individual clients. The recommendations, if any, made herein are expression of views and/or opinions and should not be deemed or construed to be neither advice for the purpose of purchase or sale of any security, derivatives or any other security through Dynamic nor any solicitation or offering of any investment /trading opportunity on behalf of the issuer(s) of the respective security (ies) referred to herein. These information / opinions / views are not meant to serve as a professional investment guide for the readers. No action is solicited based upon the information provided herein. Recipients of this Report should rely on information/data arising out of their own investigations. Readers are advised to seek independent professional advice and arrive at an informed trading/investment decision before executing any trades or making any investments. This Report has been prepared on the basis of publicly available information, internally developed data and other sources believed by Dynamic to be reliable. Dynamic or its directors, employees, affiliates or representatives do not assume any responsibility for, or warrant the accuracy, completeness, adequacy and reliability of such information / opinions / views. While due care has been taken to ensure that the disclosures and opinions given are fair and reasonable, none of the directors, employees, affiliates or representatives of Dynamic shall be liable for any direct, indirect, special, incidental, consequential, punitive or exemplary damages, including loss profits arising in any way whatsoever from the information / opinions / views contained in this Report. The price and value of the investments referred to in this Report and the income from them may go down as well as up, and investors may realize losses on any investments. Past performance is not a guide for future performance. Dynamic levels do not provide tax advice to its clients, and all investors are strongly advised to consult with their tax advisers regarding taxation aspects of any potential investment. Opinions expressed are our current opinions as of the date appearing on this Research only. We do not undertake to advise you as to any change of our views expressed in this Report. User should keep this risk in mind and not hold dynamic levels, its employees and associates responsible for any losses, damages of any type whatsoever. Dynamic and its associates or employees may; (a) from time to time, have long or short positions in, and buy or sell the investments in/ security of company (ies) mentioned herein and it may not be construed as potential conflict of interest with respect to any recommendation and related information and opinions. Without limiting any of the foregoing, in no event shall Dynamic and its associates or employees or any third party involved in, or related to computing or compiling the information have any liability for any damages of any kind. We and our affiliates/associates, officers, directors, and employees, Research Analyst(including relatives) worldwide may: (a) from time to time, have long or short positions in, and buy or sell the securities thereof, of company (ies) mentioned herein or (b) be engaged in any other transaction involving such securities and earn brokerage or other compensation or act as a market maker in the financial instruments of the subject company/company (ies) discussed herein or act as advisor to such company (ies) or have other potential/material conflict of interest with respect to any recommendation and related information and opinions at the time of publication of Research Report. Dynamic may have proprietary long/short position in the above mentioned scrip(s) and therefore may be considered as interested. The views provided herein are general in nature and does not consider risk appetite or investment objective of particular investor; readers are requested to take independent professional advice before investing. This should not be construed as invitation or solicitation to do business with Dynamic. Dynamic Equities Pvt. Ltd. are also engaged in Proprietary Trading apart from Client Business.
https://www.dynamiclevels.com/en/disclaimer