1
All countries f o s si l fu e l e m i s s i o n s 1 7 5 0 t o 2 0 1 3 & 3 p o s s i b le f utu r e C a r b o n C o n tr a c o n- rat e s f o r 1 . 5 t o 2 . 0 ° C DEBIT - The extent to which a country is above the Global Per Capita Average of Fossil Fuel Consumption CREDIT - The extent to which a country is below the Global Per Capita Average of Fossil Fuel Consumption TOTAL GLOBAL CARBON BUDGET INDIA 0 GtC 2 GtC 4 GtC 6 GtC 8 GtC 10 GtC 12 GtC 14 GtC China USA India FSU Germany LUC UK Canada Australia Brazil Japan France Italy 1750 1800 1850 1900 1950 2000 2035 2070 <2.0° (66%) <1.5° (50%) <2.0° (50%) Per Capita emissions over time compared to global average Shares of budgets for 1.5° & 2.0° C on the basis of equal per capita shares Carbon debit accumulated to 2013, measured gross in Gigatonnes of Carbon (Gt C). FUTURE PATHWAYS for 1.5° C & 2.0° C Tonnes Carbon Per Capita 0 tC 1 tC 2 tC 3 tC 4 tC 5 tC 6 tC for 1.5 °C 50% for 2.0°C 50% G L O B A L P E R C API T A A V E R A G E 1750 1800 1850 1900 1950 2000 2050 2100 for 2.0°C 50% for 2.0° C 66% Megatonnes Carbon Per Annum for 2.0° C 66% INDIA PER CAPITA A V E R A G E U S A P E R C A P I T A A V E R A G E gross per capita ... 123 Gt C 50% odds of <1.5° C ... 242 Gt C 66% odds of <2.0° C ... 326 Gt C 50% odds of <2.0° C ... approximation of country INDC Draſt Explanatory Notes and References at: - hp://www.gci.org.uk/Documents/Blueprint.pdf draft documentation hp://www.gci.org.uk/images/GLOBAL_PAST-FUTURE-CO2.pdf hp://www.gci.org.uk/images/GLOBAL_PAST-FUTURE-CO2.png 0.0 Gt C 0.5 Gt C 1.0 Gt C 1.5 Gt C 2.0 Gt C 2.5 Gt C 3.0 Gt C 3,500 Mt C I ND I A S H A R E INDIA ACTUAL E M ISSIO NS C R E D I T 6 2 G t C for 1.5 °C 50%

e C ar b Per Capita emissions over time compared to global ... · 0 GtC 2 JapanGtC 4 GtC 6 GtC 8 GtC 10 GtC 12 GtC 14 GtC China USA India FSU Germany LUC UK Canada Australia Brazil

  • Upload
    others

  • View
    27

  • Download
    0

Embed Size (px)

Citation preview

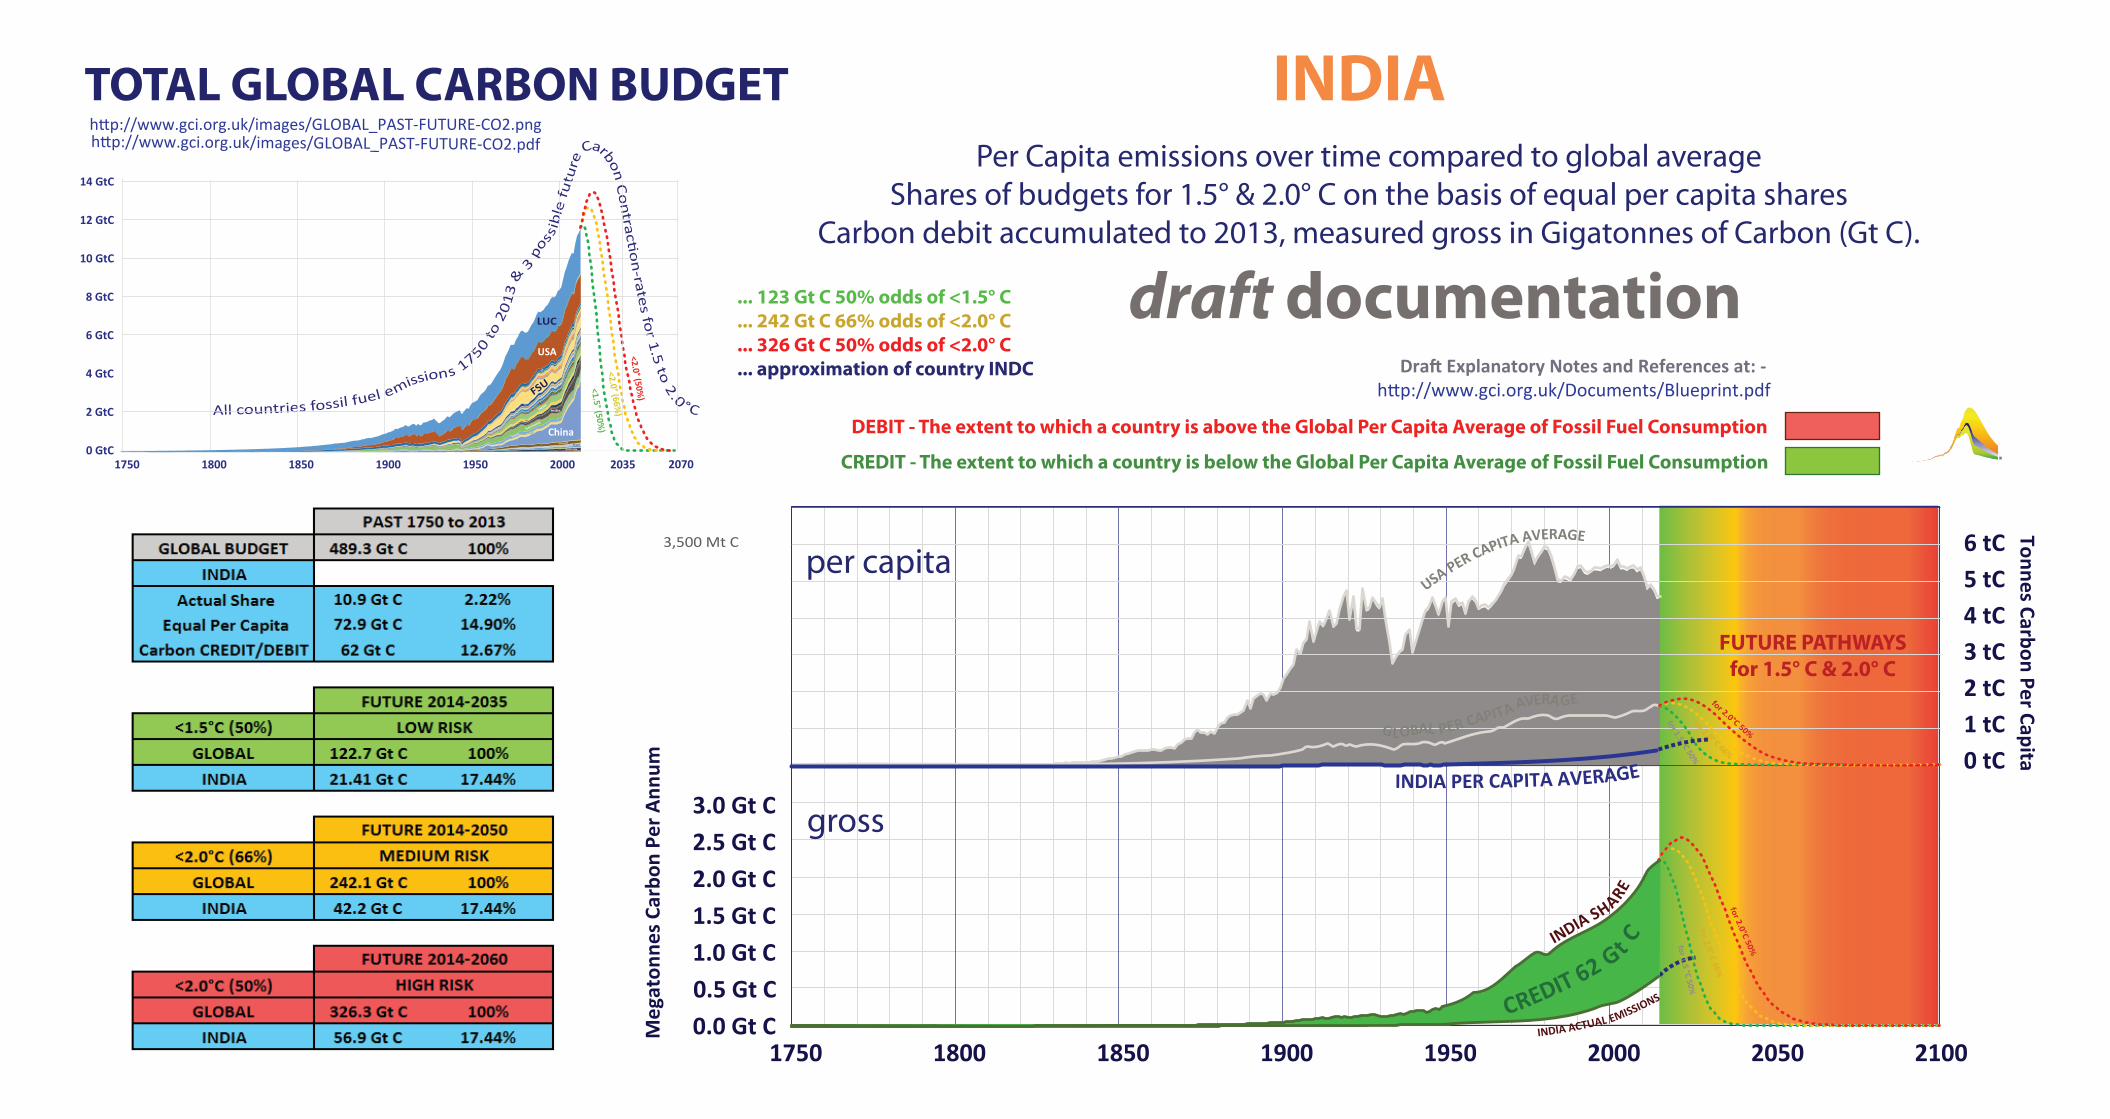
All countries fossil fuel emissions 1750 to

201

3 &

3

poss

ible

futu

re Carbon C

on

tractio

n-rates fo

r 1.5 to 2.0°CDEBIT - The extent to which a country is above the Global Per Capita Average of Fossil Fuel Consumption

CREDIT - The extent to which a country is below the Global Per Capita Average of Fossil Fuel Consumption

TOTAL GLOBAL CARBON BUDGET INDIA

0 GtC

2 GtC

4 GtC

6 GtC

8 GtC

10 GtC

12 GtC

14 GtC

China

USA

India

FSU

Germany

LUC

UK

Canada

Australia

BrazilBelgium

Japan

France

Austria

Belarus

Bulgaria

Chile

Egypt

Italy

Poland

Argentina

1750 1800 1850 1900 1950 2000 2035 2070

<2.0° (66%)

<1.5° (50%)

<2.0° (50%)

Per Capita emissions over time compared to global averageShares of budgets for 1.5° & 2.0° C on the basis of equal per capita shares

Carbon debit accumulated to 2013, measured gross in Gigatonnes of Carbon (Gt C).

FUTURE PATHWAYSfor 1.5° C & 2.0° C

Tonnes Carbon Per Capita 0 tC 1 tC 2 tC 3 tC 4 tC 5 tC 6 tC

for 1.5 °C 50%

for 2.0°C 50% GLOBAL PER CAPITA AVERA GE

1750 1800 1850 1900 1950 2000 2050 2100

for 2.0°C 50%

for 2.0° C 66%

Meg

aton

nes C

arbo

n Pe

r Ann

um

for 2.0° C 66%

INDIA PER CAPITA AVERAGE

USA PER CAPITA AVERAGE

gross

per capita

... 123 Gt C 50% odds of <1.5° C

... 242 Gt C 66% odds of <2.0° C

... 326 Gt C 50% odds of <2.0° C

... approximation of country INDC Draft Explanatory Notes and References at: - http://www.gci.org.uk/Documents/Blueprint.pdf

draft documentation

http://www.gci.org.uk/images/GLOBAL_PAST-FUTURE-CO2.pdfhttp://www.gci.org.uk/images/GLOBAL_PAST-FUTURE-CO2.png

0.0 Gt C0.5 Gt C1.0 Gt C1.5 Gt C2.0 Gt C2.5 Gt C3.0 Gt C

3,500 Mt C

INDIA SHARE

INDIA ACTUAL EMISSIONS

CREDIT 62 Gt C for 1.5 °C 50%