Embed Size (px)
Citation preview
E-SAR P-band System PerformanceRalf Horn, Rolf Scheiber, Bernd Gabler, Markus LimbachMicrowaves & Radar Institute, German Aerospace Center (DLR), Germany
AbstractDLR’s experimental airborne SAR E-SAR is well-known in Europe and beyond. It is a versatile system operatingin four major radar frequency bands, one of them being the P-band starting at 300MHz. While the DLR is success-fully operating the P-band E-SAR under operational conditions for a couple of years now after having finished thedevelopment of a new antenna, not much has been published so far about the performance of the system. In thispaper the design of the P-band radar sub-system is reviewed and results of a performance analysis are presented.
1 IntroductionSynthetic Aperture Radar in comparison to standard ra-dar systems offers the possibility to obtain high resolu-tion even at low frequencies (fc<1GHz). Special signalprocessing algorithms are available to process rangebandwidths of 20 to 30% of the centre frequency andmore. Existent antenna technology allows the design ofantennas which feature large bandwidths and good ra-diometric and polarimetric performance the same time.The frequency band designations (P, L, S, C, X) ofWorld War II are still the most commonly used. Ac-cording to that “P” stands for the frequency range 300- 1000MHz (or 30 - 100cm wavelength) [1].The low end of the P-band (300 - 400MHz) in particu-lar is very attractive for several reasons:
a) Minimum RF interference from external radiotransmitters. The frequency range above 400MHzis clustered with numerous broadcasting transmit-ters creating serious problems in normal SAR oper-ation. RF interference degrades image qualitydramatically as we have experienced and in the
majority of the cases filtering the RFI did not suc-ceed.
b) Simple radar design. RF components are availablefor building a simple wideband SAR RF front-end.Standard AD-conversion with 6 or 8bits per samplecan be employed.
Application specific benefits:
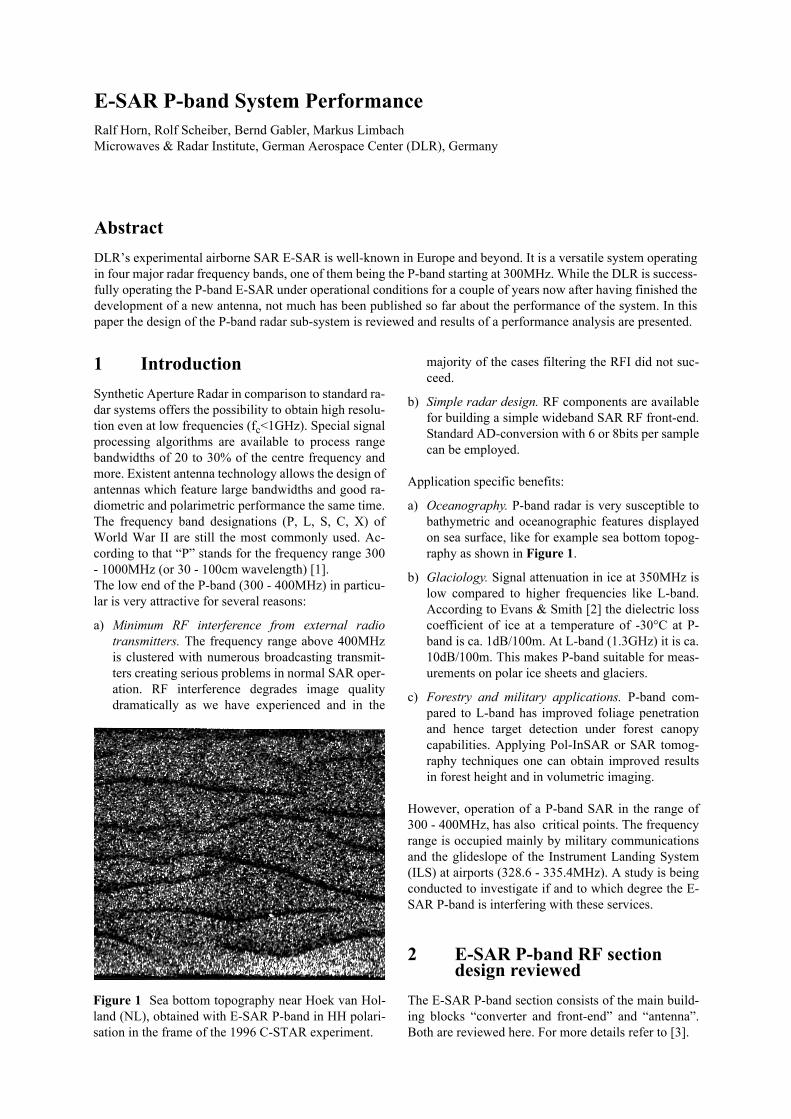
a) Oceanography. P-band radar is very susceptible tobathymetric and oceanographic features displayedon sea surface, like for example sea bottom topog-raphy as shown in Figure 1.
b) Glaciology. Signal attenuation in ice at 350MHz islow compared to higher frequencies like L-band.According to Evans & Smith [2] the dielectric losscoefficient of ice at a temperature of -30°C at P-band is ca. 1dB/100m. At L-band (1.3GHz) it is ca.10dB/100m. This makes P-band suitable for meas-urements on polar ice sheets and glaciers.
c) Forestry and military applications. P-band com-pared to L-band has improved foliage penetrationand hence target detection under forest canopycapabilities. Applying Pol-InSAR or SAR tomog-raphy techniques one can obtain improved resultsin forest height and in volumetric imaging.
However, operation of a P-band SAR in the range of300 - 400MHz, has also critical points. The frequencyrange is occupied mainly by military communicationsand the glideslope of the Instrument Landing System(ILS) at airports (328.6 - 335.4MHz). A study is beingconducted to investigate if and to which degree the E-SAR P-band is interfering with these services.
2 E-SAR P-band RF section design reviewed
The E-SAR P-band section consists of the main build-ing blocks “converter and front-end” and “antenna”.Both are reviewed here. For more details refer to [3].
Figure 1 Sea bottom topography near Hoek van Hol-land (NL), obtained with E-SAR P-band in HH polari-sation in the frame of the 1996 C-STAR experiment.
2.1 P-band converter and front-end
In E-SAR the radar signal is a down-chirped pulse with100MHz maximum bandwidth and 5µs pulse length.The centre frequency is 300MHz. The signal chirpsfrom 350MHz to 250MHz, which is overlapping withthe desired P-band frequency range. Neither directtransmission nor direct conversion are possible. Theworkaround is to first up-convert the radar chirp into L-band (fc = 1.3GHz) and then down-convert to 350MHzcentre frequency. For down-conversion a programma-ble phase-locked-oscillator is used, so that the P-bandcentre frequency is adjustable from 350MHz to370MHz. The P-band front-end has a classical design (Figure 3).A solid state amplifier generates 1kW of transmit peakpower. A passive circulator separates transmit and re-ceive paths. A PIN switch is used to switch antenna po-larisation pulse-to-pulse. The isolation of the switch isbetter than 60dB. The front-end is designed to handle10% duty cycle at a maximum PRF of 12kHz.
2.2 Antenna characteristics
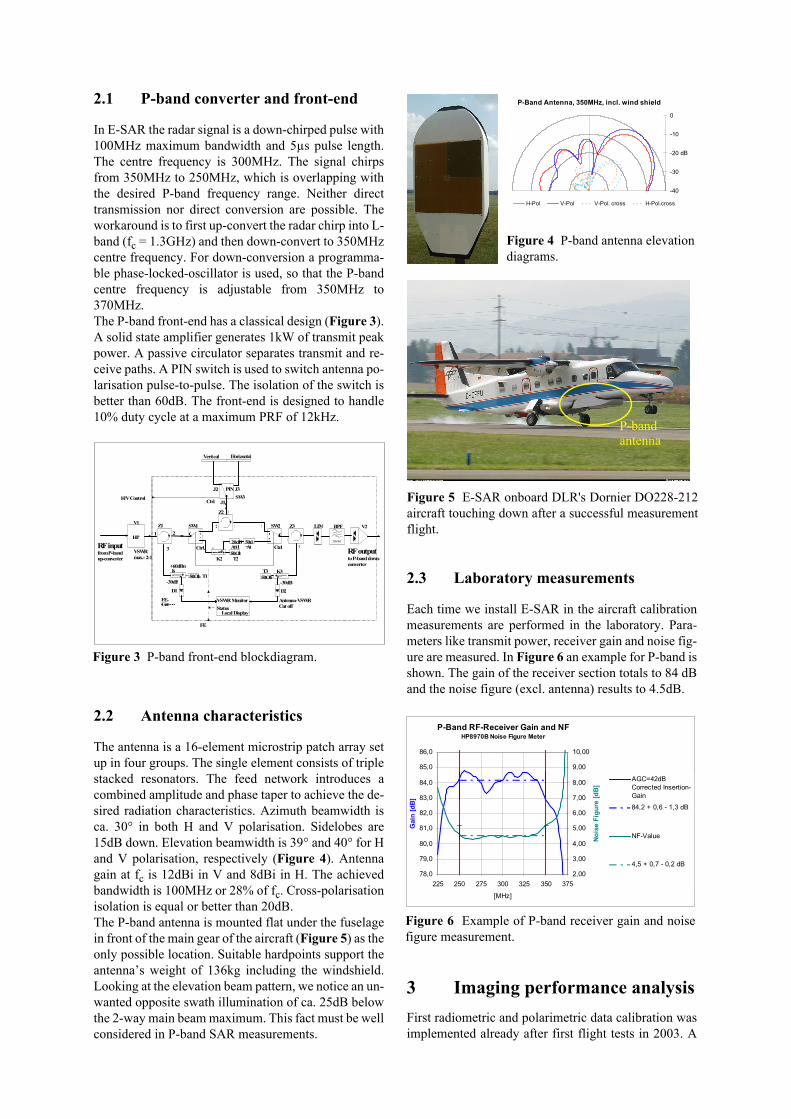
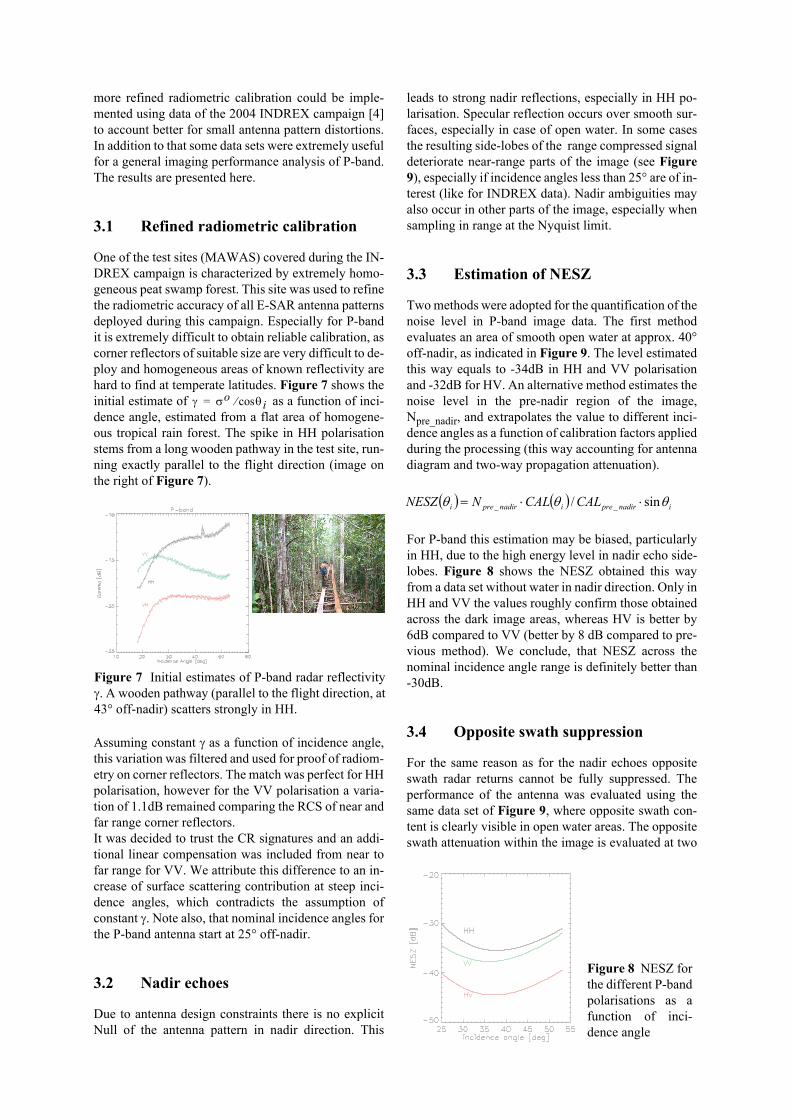
The antenna is a 16-element microstrip patch array setup in four groups. The single element consists of triplestacked resonators. The feed network introduces acombined amplitude and phase taper to achieve the de-sired radiation characteristics. Azimuth beamwidth isca. 30° in both H and V polarisation. Sidelobes are15dB down. Elevation beamwidth is 39° and 40° for Hand V polarisation, respectively (Figure 4). Antennagain at fc is 12dBi in V and 8dBi in H. The achievedbandwidth is 100MHz or 28% of fc. Cross-polarisationisolation is equal or better than 20dB.The P-band antenna is mounted flat under the fuselagein front of the main gear of the aircraft (Figure 5) as theonly possible location. Suitable hardpoints support theantenna’s weight of 136kg including the windshield.Looking at the elevation beam pattern, we notice an un-wanted opposite swath illumination of ca. 25dB belowthe 2-way main beam maximum. This fact must be wellconsidered in P-band SAR measurements.
2.3 Laboratory measurements
Each time we install E-SAR in the aircraft calibrationmeasurements are performed in the laboratory. Para-meters like transmit power, receiver gain and noise fig-ure are measured. In Figure 6 an example for P-band isshown. The gain of the receiver section totals to 84 dBand the noise figure (excl. antenna) results to 4.5dB.
3 Imaging performance analysisFirst radiometric and polarimetric data calibration wasimplemented already after first flight tests in 2003. A
-30dB 50Oh
50dB
20dB
LIM SW1 SW2 1
3
C C21 1
2
K2 T2
Att1 AtCtrl. Ctrl
2
HP
V1 V2
RF output to P-band down-converter
350/100
BPF
Vertical Horizontal
PIN
J1
J2 SW3
Ctrl.
Z2
13
2
50OhT3
-30dB
K3
VSWR max.: 2:1
Z1 1
3
2 Z3
+60dBm
-30dB
K1 50Oh T1
FE
D2 D1
FE-VSWRCut
Antenna-VSWR Cut off
VSWR Monitor Status
Local Display
J3
H/V Control
RF input from P-band up-converter
Figure 3 P-band front-end blockdiagram.
P-Band Antenna, 350MHz, incl. wind shield
-40
-30
-20
-10
0
dB
H-Pol V-Pol V-Pol. cross H-Pol.cross
Figure 4 P-band antenna elevationdiagrams.
Figure 5 E-SAR onboard DLR's Dornier DO228-212aircraft touching down after a successful measurementflight.
P-bandantenna
P-Band RF-Receiver Gain and NFHP8970B Noise Figure Meter
78,0
79,0
80,0
81,0
82,0
83,0
84,0
85,0
86,0
225 250 275 300 325 350 375
[MHz]
Gai
n [d
B]
2,00
3,00
4,00
5,00
6,00
7,00
8,00
9,00
10,00
Noi
se F
igur
e [d
B]
AGC=42dBCorrected Insertion-Gain
84,2 + 0,6 - 1,3 dB
NF-Value
4,5 + 0,7 - 0,2 dB
Figure 6 Example of P-band receiver gain and noisefigure measurement.
more refined radiometric calibration could be imple-mented using data of the 2004 INDREX campaign [4]to account better for small antenna pattern distortions.In addition to that some data sets were extremely usefulfor a general imaging performance analysis of P-band.The results are presented here.
3.1 Refined radiometric calibration
One of the test sites (MAWAS) covered during the IN-DREX campaign is characterized by extremely homo-geneous peat swamp forest. This site was used to refinethe radiometric accuracy of all E-SAR antenna patternsdeployed during this campaign. Especially for P-bandit is extremely difficult to obtain reliable calibration, ascorner reflectors of suitable size are very difficult to de-ploy and homogeneous areas of known reflectivity arehard to find at temperate latitudes. Figure 7 shows theinitial estimate of as a function of inci-dence angle, estimated from a flat area of homogene-ous tropical rain forest. The spike in HH polarisationstems from a long wooden pathway in the test site, run-ning exactly parallel to the flight direction (image onthe right of Figure 7).
Assuming constant γ as a function of incidence angle,this variation was filtered and used for proof of radiom-etry on corner reflectors. The match was perfect for HHpolarisation, however for the VV polarisation a varia-tion of 1.1dB remained comparing the RCS of near andfar range corner reflectors.It was decided to trust the CR signatures and an addi-tional linear compensation was included from near tofar range for VV. We attribute this difference to an in-crease of surface scattering contribution at steep inci-dence angles, which contradicts the assumption ofconstant γ. Note also, that nominal incidence angles forthe P-band antenna start at 25° off-nadir.
3.2 Nadir echoes
Due to antenna design constraints there is no explicitNull of the antenna pattern in nadir direction. This
leads to strong nadir reflections, especially in HH po-larisation. Specular reflection occurs over smooth sur-faces, especially in case of open water. In some casesthe resulting side-lobes of the range compressed signaldeteriorate near-range parts of the image (see Figure9), especially if incidence angles less than 25° are of in-terest (like for INDREX data). Nadir ambiguities mayalso occur in other parts of the image, especially whensampling in range at the Nyquist limit.
3.3 Estimation of NESZ
Two methods were adopted for the quantification of thenoise level in P-band image data. The first methodevaluates an area of smooth open water at approx. 40°off-nadir, as indicated in Figure 9. The level estimatedthis way equals to -34dB in HH and VV polarisationand -32dB for HV. An alternative method estimates thenoise level in the pre-nadir region of the image,Npre_nadir, and extrapolates the value to different inci-dence angles as a function of calibration factors appliedduring the processing (this way accounting for antennadiagram and two-way propagation attenuation).
For P-band this estimation may be biased, particularlyin HH, due to the high energy level in nadir echo side-lobes. Figure 8 shows the NESZ obtained this wayfrom a data set without water in nadir direction. Only inHH and VV the values roughly confirm those obtainedacross the dark image areas, whereas HV is better by6dB compared to VV (better by 8 dB compared to pre-vious method). We conclude, that NESZ across thenominal incidence angle range is definitely better than-30dB.
3.4 Opposite swath suppression
For the same reason as for the nadir echoes oppositeswath radar returns cannot be fully suppressed. Theperformance of the antenna was evaluated using thesame data set of Figure 9, where opposite swath con-tent is clearly visible in open water areas. The oppositeswath attenuation within the image is evaluated at two
γ σo θicos⁄=
Figure 7 Initial estimates of P-band radar reflectivityγ. A wooden pathway (parallel to the flight direction, at43° off-nadir) scatters strongly in HH.
( ) ( ) inadirpreinadirprei CALCALNNESZ θθθ sin/ __ ⋅⋅=
Figure 8 NESZ forthe different P-bandpolarisations as afunction of inci-dence angle
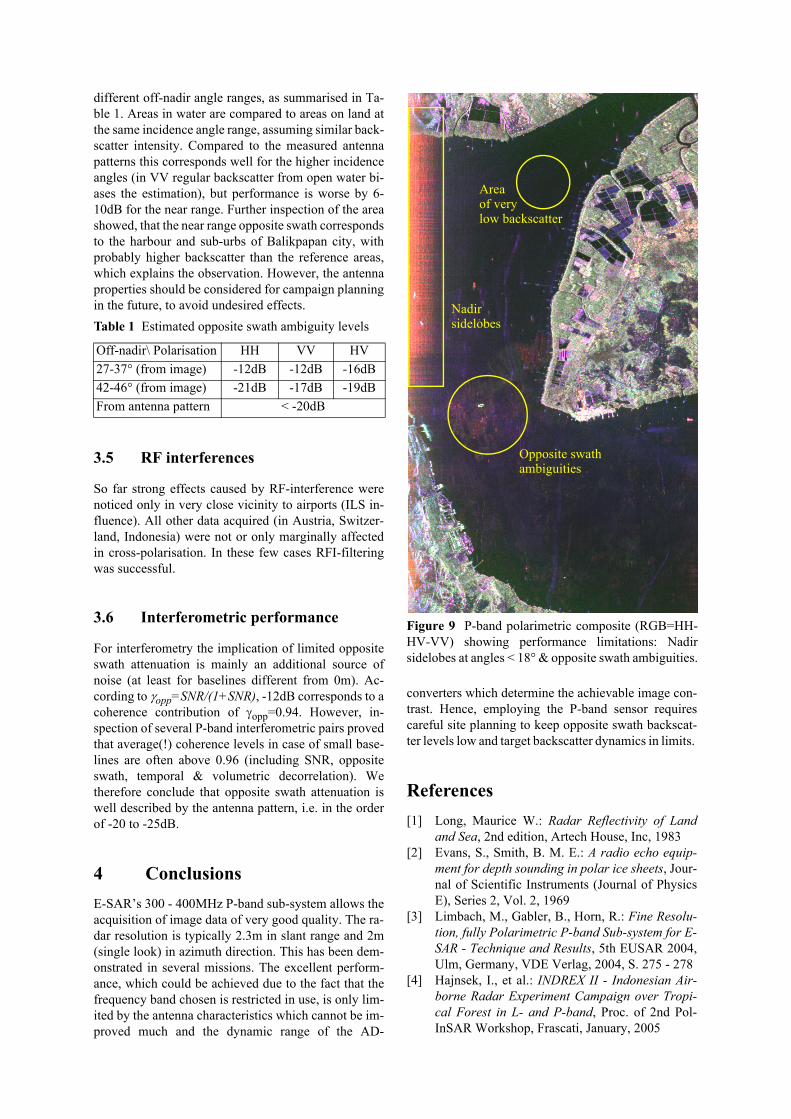
different off-nadir angle ranges, as summarised in Ta-ble 1. Areas in water are compared to areas on land atthe same incidence angle range, assuming similar back-scatter intensity. Compared to the measured antennapatterns this corresponds well for the higher incidenceangles (in VV regular backscatter from open water bi-ases the estimation), but performance is worse by 6-10dB for the near range. Further inspection of the areashowed, that the near range opposite swath correspondsto the harbour and sub-urbs of Balikpapan city, withprobably higher backscatter than the reference areas,which explains the observation. However, the antennaproperties should be considered for campaign planningin the future, to avoid undesired effects.
3.5 RF interferences
So far strong effects caused by RF-interference werenoticed only in very close vicinity to airports (ILS in-fluence). All other data acquired (in Austria, Switzer-land, Indonesia) were not or only marginally affectedin cross-polarisation. In these few cases RFI-filteringwas successful.
3.6 Interferometric performance
For interferometry the implication of limited oppositeswath attenuation is mainly an additional source ofnoise (at least for baselines different from 0m). Ac-cording to γopp=SNR/(1+SNR), -12dB corresponds to acoherence contribution of γopp=0.94. However, in-spection of several P-band interferometric pairs provedthat average(!) coherence levels in case of small base-lines are often above 0.96 (including SNR, oppositeswath, temporal & volumetric decorrelation). Wetherefore conclude that opposite swath attenuation iswell described by the antenna pattern, i.e. in the orderof -20 to -25dB.
4 ConclusionsE-SAR’s 300 - 400MHz P-band sub-system allows theacquisition of image data of very good quality. The ra-dar resolution is typically 2.3m in slant range and 2m(single look) in azimuth direction. This has been dem-onstrated in several missions. The excellent perform-ance, which could be achieved due to the fact that thefrequency band chosen is restricted in use, is only lim-ited by the antenna characteristics which cannot be im-proved much and the dynamic range of the AD-
converters which determine the achievable image con-trast. Hence, employing the P-band sensor requirescareful site planning to keep opposite swath backscat-ter levels low and target backscatter dynamics in limits.
References[1] Long, Maurice W.: Radar Reflectivity of Land
and Sea, 2nd edition, Artech House, Inc, 1983[2] Evans, S., Smith, B. M. E.: A radio echo equip-
ment for depth sounding in polar ice sheets, Jour-nal of Scientific Instruments (Journal of PhysicsE), Series 2, Vol. 2, 1969
[3] Limbach, M., Gabler, B., Horn, R.: Fine Resolu-tion, fully Polarimetric P-band Sub-system for E-SAR - Technique and Results, 5th EUSAR 2004,Ulm, Germany, VDE Verlag, 2004, S. 275 - 278
[4] Hajnsek, I., et al.: INDREX II - Indonesian Air-borne Radar Experiment Campaign over Tropi-cal Forest in L- and P-band, Proc. of 2nd Pol-InSAR Workshop, Frascati, January, 2005
Table 1 Estimated opposite swath ambiguity levels
Off-nadir\ Polarisation HH VV HV27-37° (from image) -12dB -12dB -16dB42-46° (from image) -21dB -17dB -19dBFrom antenna pattern < -20dB
Figure 9 P-band polarimetric composite (RGB=HH-HV-VV) showing performance limitations: Nadirsidelobes at angles < 18° & opposite swath ambiguities.
Nadirsidelobes
Opposite swathambiguities
Areaof verylow backscatter