Embed Size (px)
Citation preview

Braz. Arch. Biol. Technol. v.61: e18160536 2018
1
Vol.61: e18160536, 2018 http://dx.doi.org/10.1590/1678-4324-2018160536
ISSN 1678-4324 Online Edition
BRAZILIAN ARCHIVES OF BIOLOGY AND TECHNOLOGY
A N I N T E R N A T I O N A L J O U R N A L
Early and Accurate Model of Malignant Lung Nodule Detection System with Less False Positives
Senthilkumar Krishnamurthy 1*, Ganesh Narasimhan2, Umamaheswari Rengasamy3 1Rajalakshmi Institute of Technology - Electronics and Communication, Kuthambakam, Chennai, Tamilnadu, India. 2Saveetha University - Saveetha Engineering College, Electronics and Communication, Chennai, Tamil Nadu, India. 3Velammal Engineering College - Electrical and Electronics, Velammal, Tamil Nadu, India
.
ABSTRACT
The objective of this work is to identify the malignant lung nodules accurately and early with less false positives.
‘Nodule’ is the 3mm to 30mm diameter size tissue clusters present inside the lung parenchyma region. Segmenting
such a small nodules from consecutive CT scan slices are a challenging task. In our work Auto-seed clustering based
segmentation technique is used to segment all the possible nodule candidates. Efficient shape and texture features
(2D and 3D) were computed to eliminate the false nodule candidates. The change in centroid position of nodule
candidates from consecutive slices was used as a measure to remove the vessels. The two-stage classifier is used in
this work to classify the malignant and benign nodules. First stage rule-based classifier producing 100 % sensitivity,
but with high false positive of 12.5 per patient scan. The BPN based ANN classifier is used as the second-stage
classifier which reduces a false positive to 2.26 per patient scan with a reasonable sensitivity of 88.8%. The Rate of
Nodule Growth (RNG) was computed in our work to measure the nodules growth between the two scans of the same
patient taken at different time interval. Finally, the nodule growth predictive measure was modeled through the
features such as compactness (CO), mass deficit (MD), mass excess (ME) and isotropic factor(IF). The developed
model results show that the nodules which have low CO, low IF, high MD and high ME values might have the potential
to grow in future.
Keywords: Lung cancer, 3-D Image Segmentation, 3-D image features, Volume growth, Lung nodule classifier.
*Author for correspondence: [email protected]
Human and Animal Health

Krishnamurthy, S et al.
Braz. Arch. Biol. Technol. v.61: e18160536 2018
2
INTRODUCTION
Worldwide lung cancer causes maximum cancer deaths than any other cancer1. Lung cancer
diagnosis is also critical compared to other cancer diagnosis procedure2. The radiologist first
analyzes the CT scan on the patient and suggest for one another CT scan, if any symptom of lung
cancer is spotted. Physicians will not recommend for biopsy unless they found the reasonable
evidence from the CT scan. This procedure of wait and watch approach makes the lung cancer
diagnosis time critical. Nodule is a 3mm to 30mm roughly round tissue clusters exists inside the
lung parenchyma region. These nodules are the primary indicator of lung cancer. Visualizing
these nodules in 3D and measuring the growth of it from earlier and a later scan of the same
patient makes the lung cancer diagnosis efficient. This work is concentrating on developing a
mathematical model to predict the nodules which have the potential to grow in future.
Many works carried out in the field of lung nodule classifications. The computer-aided approach
for detecting lung nodule consist of three fundamental steps: 1.Lung nodule candidate
segmentation3,4,5, 2.Nodule feature extraction6,7,8, and 3.Malignant nodule classification9,10.
Later some work on lung nodule growth was reported in the literature. W.J.Kostis et al11,
developed 3-D methods for the segmentation and characterization of nodules imaged using CT.
A volumetric growth characterization was formulated in this work, and this was the first such a
nodule growth based system reported for clinical use. Yuanjie Zheng et al12 applied a 2D graph-
cut algorithm on the three-dimensional lung and tumor datasets. This method eliminates the
possible volume variations of the nodule and estimates the tumor growth accurately. M
Hasegawa et al13 computed a volume doubling time (VDT) based on the exponential model using
follow-up CT images. All the above works concentrating on measuring the nodule growth
accurately, but not much on predicting the nodule growth from earlier CT scan. In this work, we
are proposing a structural model to predict the nodules growing nature from earlier CT scan.
MATERIALS AND METHODS
Database
VOLCANO and LIDC are the two open source databases used for this work14,15. 34
patient cases from VOLCANO database and ten patient CT scan images from LIDC
database are used in this work. For each patient in VOLCANO database, an earlier and
follow-up scan CT images are available. The CT scans were taken using GE Medical
and Philips CT scanners with different X-ray tube current and exposure. The time span
between the scans is not specified for the VOLCANO database; however, information
on nodule location is available. A total of 2646 cross sections of CT images from 44
cases were analyzed in this work. Totally 48 nodules are suspected to be malignant in
this database by radiologists.
Auto-Seed Clustering Based Lung Nodule Segmentation
Segmenting a lung nodule from the lung parenchyma region is a complex task as the size, shape
and the position of the nodules are differs much. Well-circumscribed, juxta-pleural, pleural tail
and vascularized are the four types of nodules present in the lung parenchyma region.
Segmenting all these nodules with the common algorithm is a challenging task. We already
carried out some works on segmenting these nodules using threshold, region grow, and level set
evolution methods16,17,18,19. In this work, we are using the concept of data clustering to segment
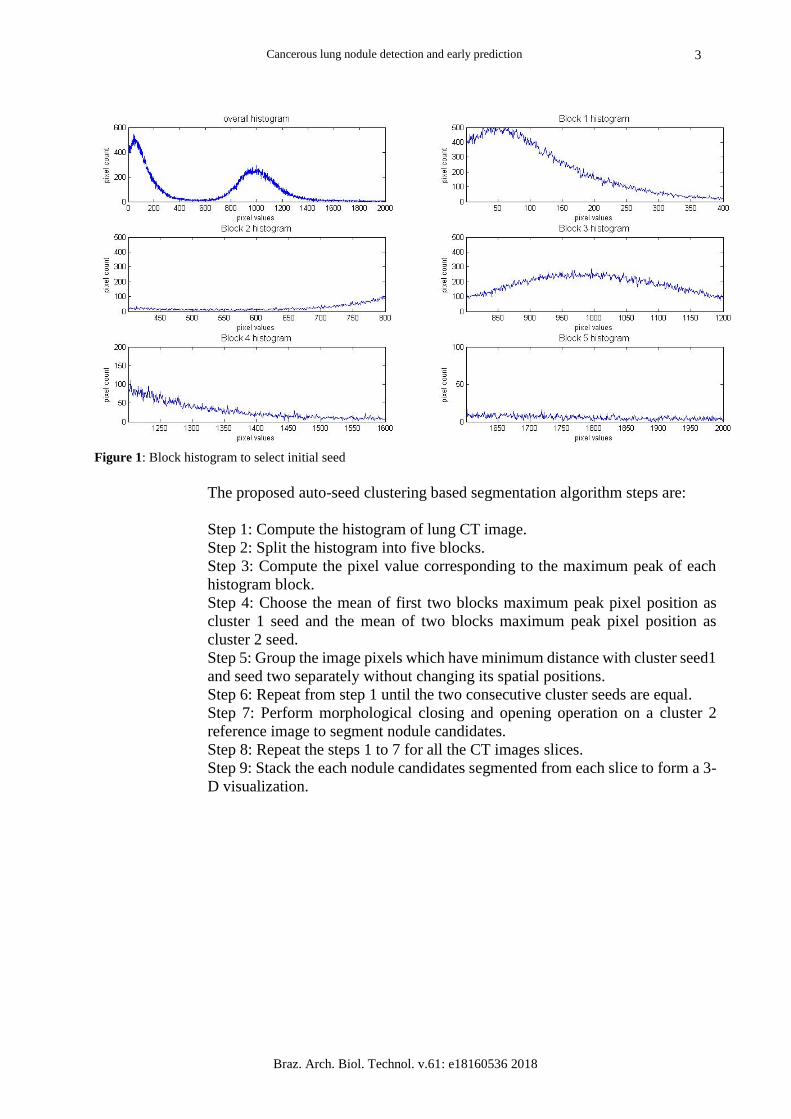
those nodules from each slice of CT scan. Block histogram processing is carried out in this work
as shown in the figure1 to choose the initial cluster seed automatically. In this research 3-D
segmentation of nodules achieved by consecutive 2-D segmentation of nodule structure from
each CT scan image.
Cancerous lung nodule detection and early prediction
Braz. Arch. Biol. Technol. v.61: e18160536 2018
3
Figure 1: Block histogram to select initial seed
The proposed auto-seed clustering based segmentation algorithm steps are:
Step 1: Compute the histogram of lung CT image.
Step 2: Split the histogram into five blocks.
Step 3: Compute the pixel value corresponding to the maximum peak of each
histogram block.
Step 4: Choose the mean of first two blocks maximum peak pixel position as
cluster 1 seed and the mean of two blocks maximum peak pixel position as
cluster 2 seed.
Step 5: Group the image pixels which have minimum distance with cluster seed1
and seed two separately without changing its spatial positions.
Step 6: Repeat from step 1 until the two consecutive cluster seeds are equal.
Step 7: Perform morphological closing and opening operation on a cluster 2
reference image to segment nodule candidates.
Step 8: Repeat the steps 1 to 7 for all the CT images slices.
Step 9: Stack the each nodule candidates segmented from each slice to form a 3-
D visualization.

Krishnamurthy, S et al.
Braz. Arch. Biol. Technol. v.61: e18160536 2018
4
Figure 2. (a) Original CT 2-D slice, (b) cluster-2 seed mask, (c) cluster-1 seed mask, (d) Lung mask with juxta nodule
hole, (e) Segmented nodule candidates, (f) 3-D visualization of one segmented nodule.
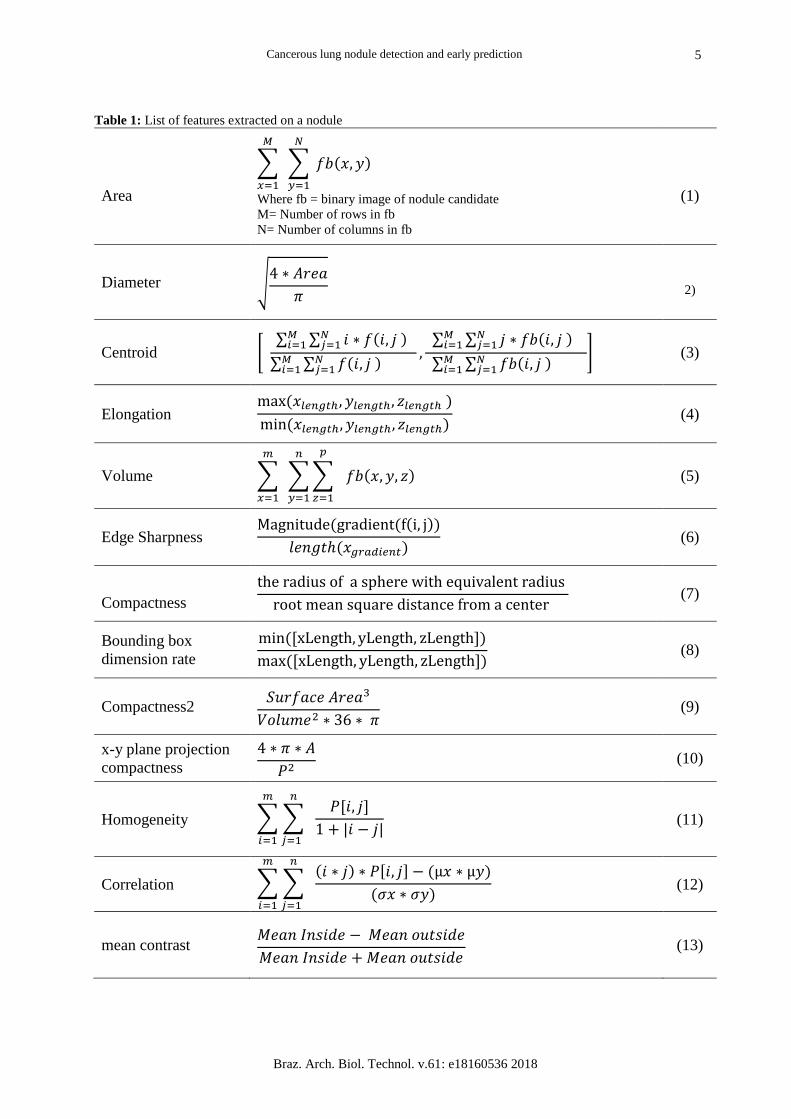
Nodule Feature Extraction
Most of the segmented nodule candidates are not malignant. To classify the
malignant and benign nodules, different shape, and texture based features are
extracted on the segmented nodule candidates20, 21. The quantitative features
must give a discriminative value for malignant and benign nodules. In this work
shape and texture features are computed in both 2D and 3D planes of nodule
candidates. All the shape features are extracted from the binary version of
nodules and the texture features are obtained from the original DICOM version
of the nodule portion.
The probability of lung nodule being benign increases with the regularity in its
shape across consecutive CT slices. The more regular the shape of the nodule,
the more likely it is benign. In this work, the variation in shape features in the
consecutive slices are quantitatively modeled through the features such as a
change in centroid, change in area and change in equivalent diameter of the
nodule. Edge sharpness is also one another measure which helps to discriminate
malignant nodules from benign as the benign nodules have smooth edges.
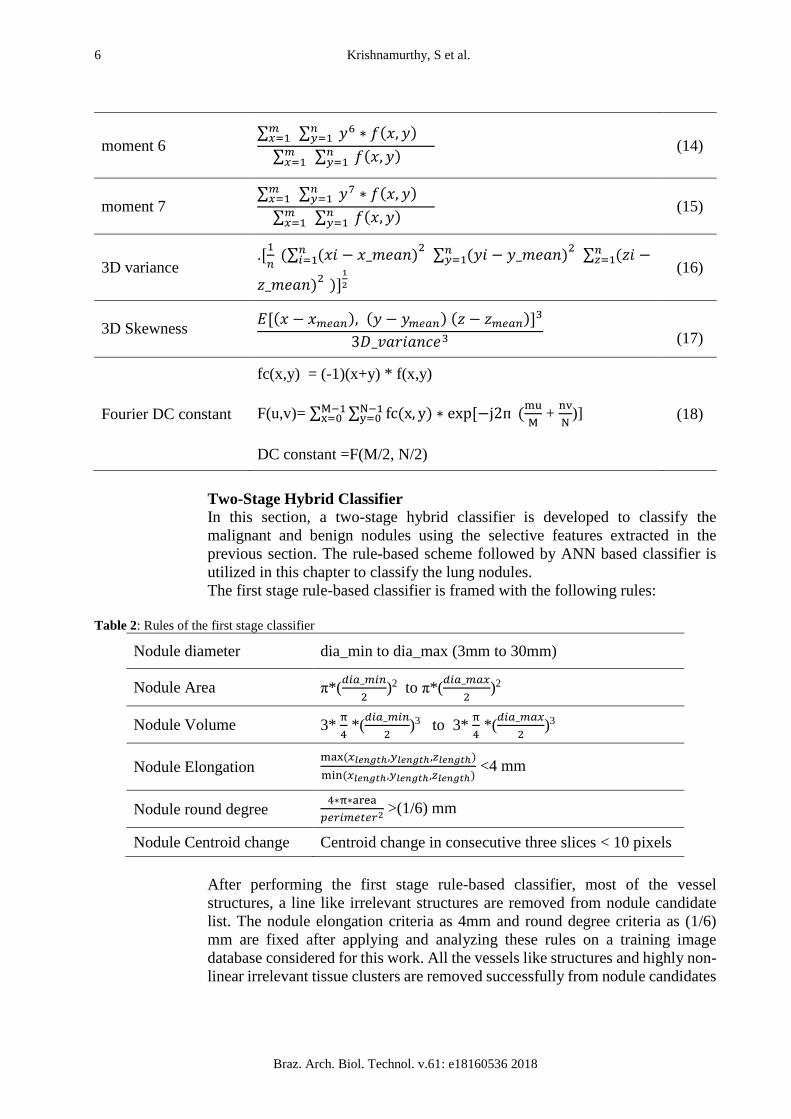
Frequency domain feature of DC constant is also computed in this work, which
is used to identify the calcifications. As the calcifications are uniform throughout
its region, the DC constant value of it is on the higher side, and also the
calcifications have a higher value of homogeneity and autocorrelation due to its
uniform surface nature. The expressions for the features used in this work are
tabulated in Table 1.
Cancerous lung nodule detection and early prediction
Braz. Arch. Biol. Technol. v.61: e18160536 2018
5
Table 1: List of features extracted on a nodule
Area
∑
𝑀
𝑥=1
∑ 𝑓𝑏(𝑥, 𝑦)
𝑁
𝑦=1
Where fb = binary image of nodule candidate
M= Number of rows in fb
N= Number of columns in fb
(1)
Diameter √4 ∗ 𝐴𝑟𝑒𝑎
𝜋
2)
Centroid [ ∑ ∑ 𝑖 ∗ 𝑓(𝑖, 𝑗 ) 𝑁
𝑗=1𝑀𝑖=1
∑ ∑ 𝑓(𝑖, 𝑗 ) 𝑁𝑗=1
𝑀𝑖=1
,∑ ∑ 𝑗 ∗ 𝑓𝑏(𝑖, 𝑗 ) 𝑁
𝑗=1𝑀𝑖=1
∑ ∑ 𝑓𝑏(𝑖, 𝑗 ) 𝑁𝑗=1
𝑀𝑖=1
] (3)
Elongation max (𝑥𝑙𝑒𝑛𝑔𝑡ℎ, 𝑦𝑙𝑒𝑛𝑔𝑡ℎ, 𝑧𝑙𝑒𝑛𝑔𝑡ℎ )
min (𝑥𝑙𝑒𝑛𝑔𝑡ℎ, 𝑦𝑙𝑒𝑛𝑔𝑡ℎ, 𝑧𝑙𝑒𝑛𝑔𝑡ℎ) (4)
Volume ∑
𝑚
𝑥=1
∑ ∑
𝑝
𝑧=1
𝑓𝑏(𝑥, 𝑦, 𝑧)
𝑛
𝑦=1
(5)
Edge Sharpness Magnitude(gradient(f(i, j))
𝑙𝑒𝑛𝑔𝑡ℎ(𝑥𝑔𝑟𝑎𝑑𝑖𝑒𝑛𝑡) (6)
Compactness
the radius of a sphere with equivalent radius
root mean square distance from a center (7)
Bounding box
dimension rate
min([xLength, yLength, zLength])
max([xLength, yLength, zLength]) (8)
Compactness2 𝑆𝑢𝑟𝑓𝑎𝑐𝑒 𝐴𝑟𝑒𝑎3
𝑉𝑜𝑙𝑢𝑚𝑒2 ∗ 36 ∗ 𝜋 (9)
x-y plane projection
compactness
4 ∗ 𝜋 ∗ 𝐴
𝑃2 (10)
Homogeneity ∑ ∑
𝑛
𝑗=1
𝑃[𝑖, 𝑗]
1 + |𝑖 − 𝑗|
𝑚
𝑖=1
(11)
Correlation ∑ ∑
𝑛
𝑗=1
(𝑖 ∗ 𝑗) ∗ 𝑃[𝑖, 𝑗] − (µ𝑥 ∗ µ𝑦)
(𝜎𝑥 ∗ 𝜎𝑦)
𝑚
𝑖=1
(12)
mean contrast 𝑀𝑒𝑎𝑛 𝐼𝑛𝑠𝑖𝑑𝑒 − 𝑀𝑒𝑎𝑛 𝑜𝑢𝑡𝑠𝑖𝑑𝑒
𝑀𝑒𝑎𝑛 𝐼𝑛𝑠𝑖𝑑𝑒 + 𝑀𝑒𝑎𝑛 𝑜𝑢𝑡𝑠𝑖𝑑𝑒 (13)
Krishnamurthy, S et al.
Braz. Arch. Biol. Technol. v.61: e18160536 2018
6
moment 6 ∑ 𝑚
𝑥=1 ∑ 𝑦6 ∗ 𝑓(𝑥, 𝑦) 𝑛𝑦=1
∑ 𝑚𝑥=1 ∑ 𝑓(𝑥, 𝑦) 𝑛
𝑦=1
(14)
moment 7 ∑ 𝑚
𝑥=1 ∑ 𝑦7 ∗ 𝑓(𝑥, 𝑦) 𝑛𝑦=1
∑ 𝑚𝑥=1 ∑ 𝑓(𝑥, 𝑦) 𝑛
𝑦=1
(15)
3D variance .[
1
𝑛 (∑ (𝑥𝑖 − 𝑥_𝑚𝑒𝑎𝑛)𝑛
𝑖=12 ∑ (𝑦𝑖 − 𝑦_𝑚𝑒𝑎𝑛)𝑛
𝑦=12 ∑ (𝑧𝑖 −𝑛
𝑧=1
𝑧_𝑚𝑒𝑎𝑛)2 )]1
2 (16)
3D Skewness 𝐸[(𝑥 − 𝑥𝑚𝑒𝑎𝑛), (𝑦 − 𝑦𝑚𝑒𝑎𝑛) (𝑧 − 𝑧𝑚𝑒𝑎𝑛)]3
3𝐷_𝑣𝑎𝑟𝑖𝑎𝑛𝑐𝑒3
(17)
Fourier DC constant
fc(x,y) = (-1)(x+y) * f(x,y)
F(u,v)= ∑ ∑ fc(x, y) ∗ exp[−j2ᴨN−1y=0
M−1x=0 (
mu
M +
nv
N)]
DC constant =F(M/2, N/2)
(18)
Two-Stage Hybrid Classifier
In this section, a two-stage hybrid classifier is developed to classify the
malignant and benign nodules using the selective features extracted in the
previous section. The rule-based scheme followed by ANN based classifier is
utilized in this chapter to classify the lung nodules.
The first stage rule-based classifier is framed with the following rules:
Table 2: Rules of the first stage classifier
Nodule diameter dia_min to dia_max (3mm to 30mm)
Nodule Area π*(𝑑𝑖𝑎_𝑚𝑖𝑛
2)2 to π*(
𝑑𝑖𝑎_𝑚𝑎𝑥
2)2
Nodule Volume 3* π
4 *(
𝑑𝑖𝑎_𝑚𝑖𝑛
2)3 to 3*
π
4 *(
𝑑𝑖𝑎_𝑚𝑎𝑥
2)3
Nodule Elongation max (𝑥𝑙𝑒𝑛𝑔𝑡ℎ,𝑦𝑙𝑒𝑛𝑔𝑡ℎ,𝑧𝑙𝑒𝑛𝑔𝑡ℎ)
min (𝑥𝑙𝑒𝑛𝑔𝑡ℎ,𝑦𝑙𝑒𝑛𝑔𝑡ℎ ,𝑧𝑙𝑒𝑛𝑔𝑡ℎ) <4 mm
Nodule round degree 4∗π∗area
𝑝𝑒𝑟𝑖𝑚𝑒𝑡𝑒𝑟2 >(1/6) mm
Nodule Centroid change Centroid change in consecutive three slices < 10 pixels
After performing the first stage rule-based classifier, most of the vessel
structures, a line like irrelevant structures are removed from nodule candidate
list. The nodule elongation criteria as 4mm and round degree criteria as (1/6)
mm are fixed after applying and analyzing these rules on a training image
database considered for this work. All the vessels like structures and highly non-
linear irrelevant tissue clusters are removed successfully from nodule candidates
Cancerous lung nodule detection and early prediction
Braz. Arch. Biol. Technol. v.61: e18160536 2018
7
group, but still more non-nodule and benign tissue clusters exist in the output of
the first stage of classifier.
All the shape and texture features are calculated on the nodule candidates
remained after the first stage of classifier. As the radiologist report on training
dataset is available, the correlation analysis is performed for each feature
variable against the target (malignant or benign). The correlation coefficient
between each feature and the target is computed. From the correlation matrix,
the features which have high correlation coefficient are picked as input features
to the ANN classifier. Finally, a hybrid input feature vector is formed with
twelve features (diameter, edge sharpness, circularity, compactness, bounding
box dimension rate, compactness2, x-y plane projection compactness, mean
contrast, moment 6, moment 7, 3D variance and 3D skewness).
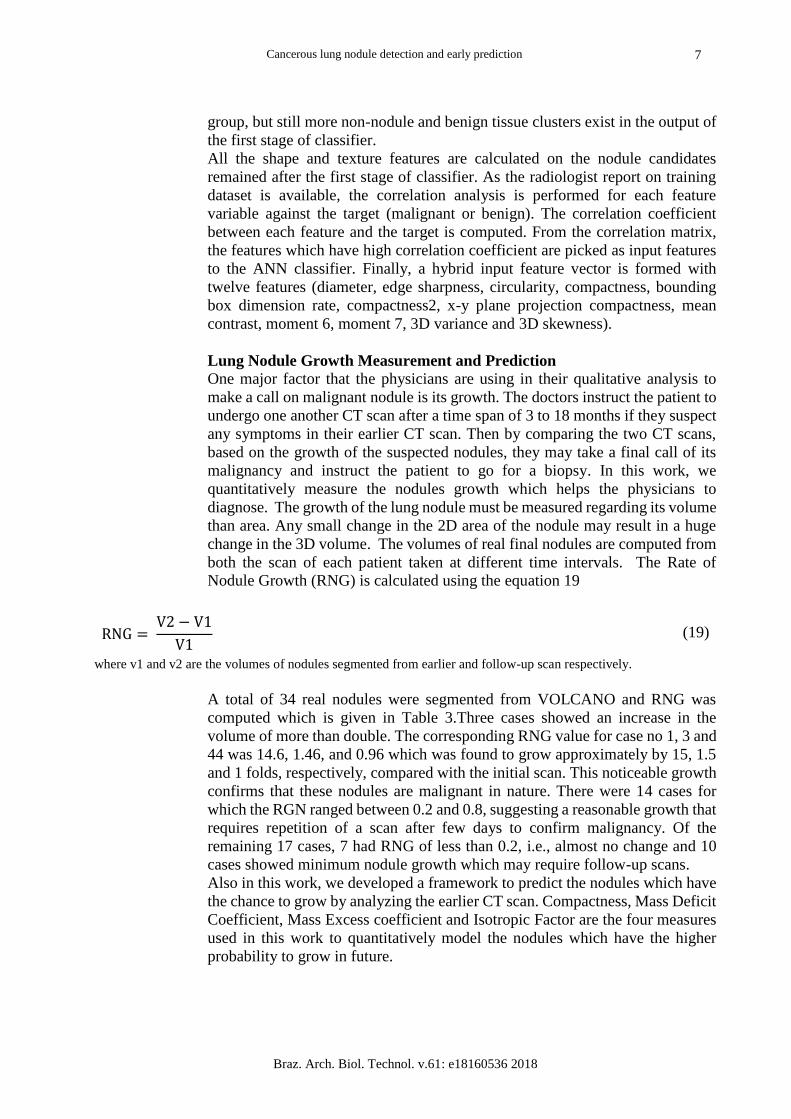
Lung Nodule Growth Measurement and Prediction
One major factor that the physicians are using in their qualitative analysis to
make a call on malignant nodule is its growth. The doctors instruct the patient to
undergo one another CT scan after a time span of 3 to 18 months if they suspect
any symptoms in their earlier CT scan. Then by comparing the two CT scans,
based on the growth of the suspected nodules, they may take a final call of its
malignancy and instruct the patient to go for a biopsy. In this work, we
quantitatively measure the nodules growth which helps the physicians to
diagnose. The growth of the lung nodule must be measured regarding its volume
than area. Any small change in the 2D area of the nodule may result in a huge
change in the 3D volume. The volumes of real final nodules are computed from
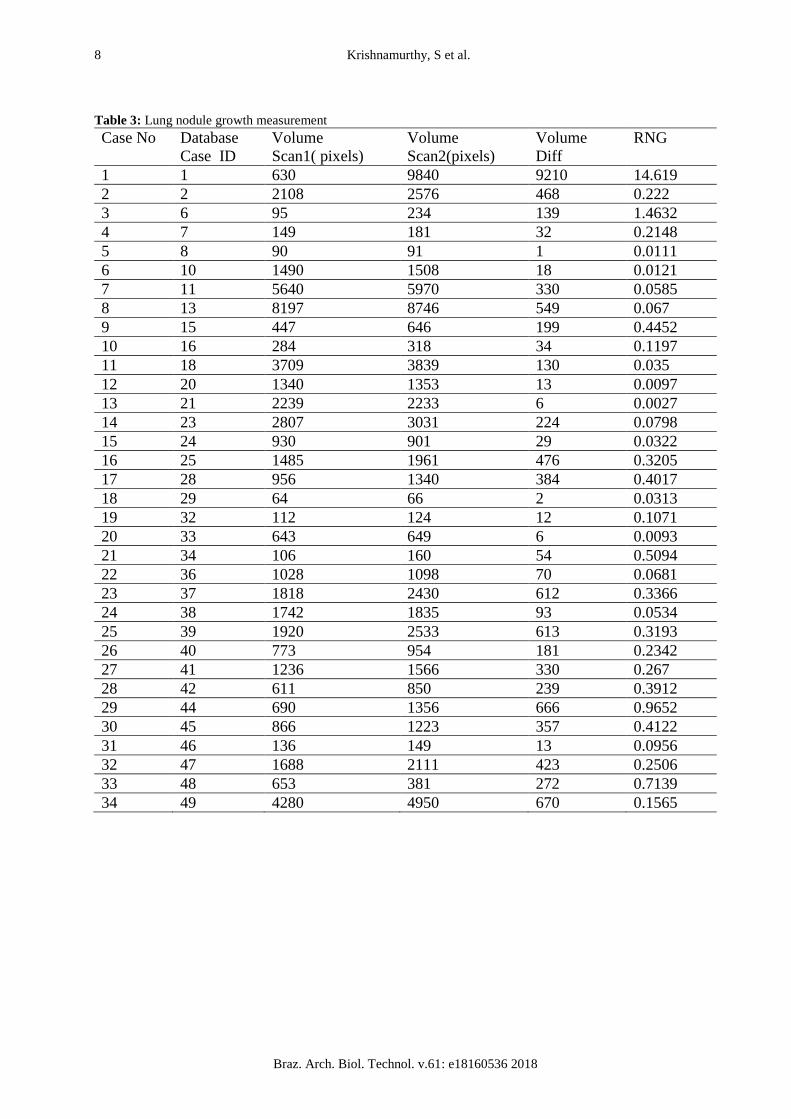
both the scan of each patient taken at different time intervals. The Rate of
Nodule Growth (RNG) is calculated using the equation 19
RNG = V2 − V1
V1 (19)
where v1 and v2 are the volumes of nodules segmented from earlier and follow-up scan respectively.
A total of 34 real nodules were segmented from VOLCANO and RNG was
computed which is given in Table 3.Three cases showed an increase in the
volume of more than double. The corresponding RNG value for case no 1, 3 and
44 was 14.6, 1.46, and 0.96 which was found to grow approximately by 15, 1.5
and 1 folds, respectively, compared with the initial scan. This noticeable growth
confirms that these nodules are malignant in nature. There were 14 cases for
which the RGN ranged between 0.2 and 0.8, suggesting a reasonable growth that
requires repetition of a scan after few days to confirm malignancy. Of the
remaining 17 cases, 7 had RNG of less than 0.2, i.e., almost no change and 10
cases showed minimum nodule growth which may require follow-up scans.
Also in this work, we developed a framework to predict the nodules which have
the chance to grow by analyzing the earlier CT scan. Compactness, Mass Deficit
Coefficient, Mass Excess coefficient and Isotropic Factor are the four measures
used in this work to quantitatively model the nodules which have the higher
probability to grow in future.
Krishnamurthy, S et al.
Braz. Arch. Biol. Technol. v.61: e18160536 2018
8
Table 3: Lung nodule growth measurement
Case No Database
Case ID
Volume
Scan1( pixels)
Volume
Scan2(pixels)
Volume
Diff
RNG
1 1 630 9840 9210 14.619
2 2 2108 2576 468 0.222
3 6 95 234 139 1.4632
4 7 149 181 32 0.2148
5 8 90 91 1 0.0111
6 10 1490 1508 18 0.0121
7 11 5640 5970 330 0.0585
8 13 8197 8746 549 0.067
9 15 447 646 199 0.4452
10 16 284 318 34 0.1197
11 18 3709 3839 130 0.035
12 20 1340 1353 13 0.0097
13 21 2239 2233 6 0.0027
14 23 2807 3031 224 0.0798
15 24 930 901 29 0.0322
16 25 1485 1961 476 0.3205
17 28 956 1340 384 0.4017
18 29 64 66 2 0.0313
19 32 112 124 12 0.1071
20 33 643 649 6 0.0093
21 34 106 160 54 0.5094
22 36 1028 1098 70 0.0681
23 37 1818 2430 612 0.3366
24 38 1742 1835 93 0.0534
25 39 1920 2533 613 0.3193
26 40 773 954 181 0.2342
27 41 1236 1566 330 0.267
28 42 611 850 239 0.3912
29 44 690 1356 666 0.9652
30 45 866 1223 357 0.4122
31 46 136 149 13 0.0956
32 47 1688 2111 423 0.2506
33 48 653 381 272 0.7139
34 49 4280 4950 670 0.1565

Cancerous lung nodule detection and early prediction
Braz. Arch. Biol. Technol. v.61: e18160536 2018
9
Table 4: Nodule growth predictor features
Feature Template figure Equation
Mass Deficit (MD)
MD = Sc − A
Sc
Mass Excess(ME)
ME = A − Si
Si
Compactness(CO)
CO = 4 ∗ π ∗ A
P2
Isotropic Factor(IF)
IF = Rm
RM
RESULTS AND DISCUSSION
In this work 24 patient lung CT scan series from VOLCANO database and five
patient cases from LIDC database are used as a training image set. VOLCANO
cases contain 25 to CT image slices per scan as an average, and LIDC scans have
120 to 280 CT slices per scan. In this work, a total of 1450 CT cross-sectional
images (slices) is used for training.
The auto-seed clustering based segmentation discussed before was effectively
applied on all these 1450 CT slice images to segment all the possible nodule
candidates. For juxta-nodule, the morphological closing is performed to close
the juxta-pleural hole present in the parenchyma region after applying the
segmentation process. The juxta-pleural nodule segmentation case is shown in
figure 3.
The nodule candidates segmented from these 1450 CT slices are applied to the
rule-based classifier (first stage classifier). The nodule candidates, which are not
satisfying the rules mentioned in Table 2 are eliminated. The training database

Krishnamurthy, S et al.
Braz. Arch. Biol. Technol. v.61: e18160536 2018
10
set used in this work contains 32 malignant nodules. The first stage of classifier
output preserving all the 32 nodules, which marked in radiologist report. Along
with these 32 nodules, 362 other nodules also remained in the output of the rule-
based classifier. Hence, the True Positive (TP) (the nodules detected which
matched with radiologist report) at the output of classifier first stage is 32, and
the False Positive (FP) (the nodules detected, which not matched with radiologist
report) is 362. As all the nodules marked by the radiologists report are detected,
the False Negative (FN) is zero. The performance of the first stage rule-based
classifier is shown in Table 5.
Table 5. Performance measure of the first stage of classifier
Statistic Formula Value
Sensitivity TP
TP + FN 100%
False Positive FP/scan 12.48
Artificial Neural Network based the second stage of classifier is used to reduce
the false positive. The input feature matrix size for an ANN is 12 x 394, where
12 is the total number of finalized features and 394(362+32) is the number of
nodule candidates remained at the output of the rule-based classifier. The target
matrix of size 2 x 394 is framed with the help of radiologist findings. The target
output of [0 1] and [1 0] is fixed for benign and malignant nodules respectively.
The BPN based ANN classifier is trained towards the minimum error. The
trained net input and output weights are saved for testing new datasets.
10 cases of VOLCANO and 5 cases of LIDC are tested using the parameters of
trained classifier. This testing set contains 18 malignant nodules. Total of 975
cross-sectional CT images are present in the testing database. After the
segmentation process, all the suspected nodule candidates are applied under the
rule based classifier. Total of 204 nodule candidates remained at the output of
the rule-based classifier. The 12 features discussed previously are computed for
each nodule and the feature vector of size 12x283 is applied to a trained ANN
system. The benign nodules feature vector are converged very near to [0 1], and
the malignant nodules are to [1 0]. The output of our designed lung nodule
detection system is compared with the radiologist report. Algorithm developed
in this work correctly detected 16 malignant nodules out of 18 and missed to
detect 2, with a TP of 16 and FN of 2. This algorithm successfully eliminated
170 nodule candidates and wrongly identified 34 nodule candidates as a
malignant nodule. Therefore, the TN is 170; FP is 34; and the FP per patient scan
is 2.26. The overall performance measure of the developed algorithm is given in
Table 6.
The nodules from VOLCANO database are analyzed further for its growth
measurement and prediction, as this database have two CT scan series for each
patient which taken at different time intervals. In this work, the nodule growth
is predicted using four measures: compactness (CO), mass excess (ME), the
mass deficit (MD) and isotropic factor (IF). These values are computed for 34
patient cases. The nodules which had larger growth having CO < 0.4, IF < 0.4,
MD > 0.3 and ME > 0.6. The nodules which had average growth having CO in

Cancerous lung nodule detection and early prediction
Braz. Arch. Biol. Technol. v.61: e18160536 2018
11
between 0.4 to 0.6, IF in between 0.5 to 0.75, MD in between 0.2 to 0.4 and ME
in between 0.2 to 0.5. Finally, the nodules which had very minimum or no
growth have the CO > 0.6, IF > 0.7, MD and ME < 0.2. Therefore, the nodules
which have low CO, low IF, high MD and high ME values might have the
potential to grow.
Table 6. Statistical results
Statistic Formula Value
Sensitivity 𝑇𝑃
𝑇𝑃 + 𝐹𝑁 88.8%
Specificity 𝑇𝑁
𝑇𝑁 + 𝐹𝑃 83.3%
FP/patient scan Total FP / Number of patient scan 2.26
Disease prevalence 𝑇𝑃 + 𝐹𝑁
𝑇𝑃 + 𝐹𝑁 + 𝑇𝑁 + 𝐹𝑃 8.1%
CONCLUSION
An efficient and automatic lung nodule detection system was successfully
implemented in this work. Auto-seed clustering based segmentation was carried
out in this work to segment all possible nodule candidates. Block histogram
processing technique was used in this study to initialize and update the cluster
seed value automatically. After analyzing many shape and texture features, six
features were used to form the rules for the first stage of classifier. Other twelve
features were computed on the nodules passing through the first stage of
classifier. The BPN-ANN network was used as the second stage of the classifier
to classify the malignant and benign nodules. This algorithm proposed in this
paper produced a false positive of 2.26 per patient scan with a reasonable
sensitivity of 88.8%. The nodules growing nature was modeled in this work
using four shape measures. In future, this work can be extended by modeling the
nodule growth prediction algorithm, more accurately by training and testing with
more patient cases.
REFERENCES 1. Torre, L.A., Bray, F., Siegel, R.L., Ferlay, J., Lortet Tieulent, J. and Jemal, A., 2015. Global
cancer statistics, 2012. CA: CA Cancer J Clin, 65(2), pp.87-108.
2. Chheang, S. and Brown, K., 2013, June. Lung cancer staging: clinical and radiologic
perspectives. Semin Intervent Rad, Thieme Medical Publishers, 30(2),pp. 099-113.
3. Armato, S.G. and Sensakovic, W.F., 2004. Automated lung segmentation for thoracic CT:
impact on computer-aided diagnosis1. Acad Radiol, 11(9), pp.1011-1021.
4. Leader, J.K., Zheng, B., Rogers, R.M., Sciurba, F.C., Perez, A., Chapman, B.E., Patel, S.,
Fuhrman, C.R. and Gur, D., 2003. Automated lung segmentation in X-ray computed
tomography: development and evaluation of a heuristic threshold-based scheme1. Acad
Radiol, 10(11), pp.1224-1236.
5. Dehmeshki, J., Amin, H., Valdivieso, M. and Ye, X., 2008. Segmentation of pulmonary
nodules in thoracic CT scans: a region growing approach. IEEE T Med Imaging, 27(4),
pp.467-480

Krishnamurthy, S et al.
Braz. Arch. Biol. Technol. v.61: e18160536 2018
12
6. Mehtre, B.M., Kankanhalli, M.S. and Lee, W.F., 1997. Shape measures for content based
image retrieval: a comparison. Inform Process Manag, 33(3), pp.319-337
7. Han, F., Wang, H., Zhang, G., Han, H., Song, B., Li, L., Moore, W., Lu, H., Zhao, H. and
Liang, Z., 2015. Texture feature analysis for computer-aided diagnosis on pulmonary
nodules. J Digit Imaging, 28(1), pp.99-115.
8. Choi, W.J. and Choi, T.S., 2014. Automated pulmonary nodule detection based on three-
dimensional shape-based feature descriptor. Comput Meth Prog Bio, 113(1), pp.37-54.
9. Shen, W., Zhou, M., Yang, F., Yang, C. and Tian, J., 2015, June. Multi-scale convolutional
neural networks for lung nodule classification. In International Conference on Information
Processing in Medical Imaging (pp. 588-599). Springer International Publishing.
10. Chan, H.P., Sahiner, B., Hadjiyski, L., Zhou, C. and Petrick, N., The Regents Of The
University Of Michigan Technology Management Office, 2003. Lung nodule detection and
classification. U.S. Patent Application 10/504,197.
11. Kostis, W.J., Reeves, A.P., Yankelevitz, D.F. and Henschke, C.I., 2003. Three-dimensional
segmentation and growth-rate estimation of small pulmonary nodules in helical CT images.
IEEE T Med Imaging, 22(10), pp.1259-1274.
12. Zheng, Y., Steiner, K., Bauer, T., Yu, J., Shen, D. and Kambhamettu, C., 2007, October.
Lung nodule growth analysis from 3D CT data with a coupled segmentation and registration
framework. In 2007 IEEE 11th International Conference on Computer Vision (pp. 1-8).
IEEE.
13. Hasegawa, M., Sone, S., Takashima, S., Li, F., Yang, Z.G., Maruyama, Y. and Watanabe, T.,
2000. Growth rate of small lung cancers detected on mass CT screening. Brit J Radiol,
73(876), pp.1252-1259.
14. Armato III, S.G., McLennan, G., Bidaut, L., McNitt-Gray, M.F., Meyer, C.R., Reeves, A.P.,
Zhao, B., Aberle, D.R., Henschke, C.I., Hoffman, E.A. and Kazerooni, E.A., 2011. The lung
image database consortium (LIDC) and image database resource initiative (IDRI): a
completed reference database of lung nodules on CT scans. Med Phys, 38(2), pp.915-931.
15. Reeves, A.P., Jirapatnakul, A.C., Biancardi, A.M., Apanasovich, T.V., Schaefer, C.,
Bowden, J.J., Kietzmann, M., Korn, R., Dillmann, M., Li, Q. and Wang, J., 2009, September.
The VOLCANO’09 challenge: Preliminary results. In Second international workshop of
pulmonary image analysis (pp. 353-364).
16. Kumar, T.S. and Ganesh, E.N., 2013. Proposed technique for accurate
detection/segmentation of lung nodules using spline wavelet techniques. Int. J. Biomed. Sci,
9(1), pp.9-17.
17. Krishnamurthy, S., Narasimhan, G. and Rengasamy, U., 2016. Three-dimensional lung
nodule segmentation and shape variance analysis to detect lung cancer with reduced false
positives. P I Mech Eng H, 230(1), pp.58-70.
18. SenthilKumar Krishnamurthy, Ganesh Narasimhan, Umamaheswari Rengasamy. (in press)
“Lung nodule growth measurement and prediction using auto cluster seed k-means
morphological segmentation and shape variance analysis”, Int J Biomed Eng Technol.
19. Reed, T.R. and Dubuf, J.H., 1993. A review of recent texture segmentation and feature
extraction techniques. CVGIP: Image understanding, 57(3), pp.359-372.
20. Zhang, D. and Lu, G., 2004. Review of shape representation and description techniques.
Pattern recognition, 37(1), pp.1-19.
21. Mukundan, R. and Ramakrishnan, K.R., Moment functions in image analysis: theory and
applications (Vol. 100). Singapore: World Scientific, 1998.
Received: June 26, 2016;
Accepted: October 14, 2016