Embed Size (px)
Citation preview
International Journal of Scientific & Engineering Research, Volume 6, Issue 12, December-2015 ISSN 2229-5518
IJSER © 2015
http://www.ijser.org
A Survey on Lung Nodule Detection in CT-Images
Minu George, Gopika S
Abstract- Early detection of lung cancer nodules can helps the doctors to treat patients and keep them alive. One of the effective
methods to detect the lung cancer is using Computed Tomography (CT) images. With the advancement of medical technology Comput-
er Aided Detection Schemes (CAD) are developed. It provides higher accuracy and performance rate. Here the lung CT images are
taken as input, based on the algorithm it helps the doctors to perform image analysis. This paper focuses a study concerning automatic
detection of lung cancer nodules by region growing method. Threat pixel identification together with region growing method is used for
segmentation.
Index Terms—Computer Aided Detection (CAD), Preprocessing, Region Growing Method, Threat Pixel Identification,
—————————— ——————————
1. INTRODUCTION 2. LITERATURE SURVEY
ung cancer is the abnormal growth of uncontrolled cells
and is considered as one of the major cause of cancer
death. With the advancement of medical technology, many
medical image processing techniques like X-Ray, CT and MRI
are commonly used. The studies show that early prediction of
lung cancer will decrease the mortality rate. According to
World Health Organization (WHO), 7.6 millions of deaths oc-
cur per year due to lung cancer. Lung nodules are small mass-
es of tissue with round or oval shaped white shadows present
in the lung. Human body is composed of many cells. When
cells grow uncontrollably outside the lung, tumor is generat-
ed.
Image segmentation is an important task of image processing.
Its main purpose is to detect and diagnose death threatening
diseases. The main goal of segmentation is to change the rep-
resentation of an image, which is more meaningful and easy to
understand. Every pixel in an image is associated with a label
and pixels with same label shows similar behavior. The vari-
ous techniques used are histogram based technique, edge
based technique, region based technique, and hybrid tech-
nique. The hybrid technique that combines the features of both
edge based and region based methods.
The CAD scheme helps to enhance the CT images, tumor clas-
sification, and image segmentation. In order to improve the
efficiency of CAD scheme many algorithm have been devel-
oped. Some of the methods are described in the below section.
K. Haris [1] introduced hybrid image segmentation using wa-
tershed and fast region merging. A hybrid multi-dimensional
image segmentation method that combines edge and region
based technique with the help of morphological algorithm of a
watershed method. The commonly used technique that deals
with image segmentation problem is categorized below.
Histogram based Technique [1]: The image composed of large
number of constant intensity objects that are arranged in a
well separated background. Histogram is represented on the
basis of a probability density function. This method strictly
follows small noise variance; few and nearly equal size regions
etc.
Edge based Technique [1]: The edges are grouped into many
contours that indicate the boundaries of image objects. To ex-
tract the candidate edges, thresholding or Laplacian magni-
tude function is used. The candidate edge pixels are combined
by non-maximum suppression and are grouped by histerisis
thresholding.
Region based Technique [1]: Regions are represented as con-
nected set of pixels that satisfies homogeneity property. The
input image is assigned to a set of homogeneous primitive
regions. By using iterative merging method, similar regions
are merged based on decision rule. As in the case of splitting
technique, the whole image is taken as one rectangular region.
If a heterogeneous region comes, then the image is sub-
L
————————————————
Minu George is currently pursuing master’s degree program in Computer Science and Information System, Rajagiri School of Engineering and Tech-nology, Kochi, Kerala, India. E-mail: [email protected] Gopika S is currently working as an Asst. Professor in the Dept. of Computer Science and Engineering, Rajagiri School of Engineering and Technology, Kochi, Kerala, India.
632
IJSER
International Journal of Scientific & Engineering Research Volume 6, Issue 12, December-2015 ISSN 2229-5518
IJSER © 2015
http://www.ijser.org
divided in to four rectangular segments and process ends
when all region becomes homogeneous.Finally merging pro-
cess is done for unifying the resulting similar neighbouring
region.
Hybrid Technique [1]: Combines the features of both edge
and region based methods.The image is initially segmented by
region based split and merge technique. It is used to eliminate
the ridges and troughs on the basis of similarity and dissimi-
larity measures. The edge and region based techniques can be
integrated through morphological watershed transform. It is
successful in segmenting certain classes of images and also
provides interactive user guidance. Initial step is the noise
corruption method, and is applied to the input image pre-
serves the edges well. The second stage provides noise sup-
pression. Here the gradient magnitude is taken as input to the
watershed detection algorithm, and then the initial image is
divided into large number of primitive regions. Because of the
high sensitivity of the watershed algorithm, over segmentation
occur. It is reduced by thresholding the gradient magnitude of
the watershed transform. The partitioned images are repre-
sented using Region Adjacency Graph (RAG).
Initial Segmentation using Watershed [1]: The initial image is
partitioned into primitive regions using image gradient mag-
nitude. The algorithm consists of two steps: sorting and flood-
ing. In the first step, the pixel values are sorted based on the
increasing order of their intensity values. A hash table is used
for storing the image. In the flooding process, pixels are
fetched based on the increasing order of intensity values. Each
pixel is associated with a label.
W.M Wells, W.E.L Grimson [2] introduced medical image pro-
cessing techniques like Chest Radiography, Computed Tomog-
raphy and Magnetic Resonance Imaging. An adaptive segmen-
tation method uses tissue intensity properties and intensity in-
homogenities for the correction of MR images. The main ad-
vantage is that excellent discrimination and spatial resolution
of the soft tissues. Tissue segmentation is done by statistical
classification methods with the help of morphological image
processing. Expectation maximization algorithm allows accu-
rate segmentation of tissue types for the better visualization of
magnetic resonance imaging. This paper introduces a new
method called adaptive segmentation that contains knowledge
of soft tissues and intensities for the segmentation of MRI im-
ages. It provides accurate segmentation of tissue type and bet-
ter visualization of MRI Images.Develops intra and inter-scan
MRI intensities with the help of a varying factor gain field that
doubles the intensity of images. The value of gain field is
known, and then it is easy to find out the tissue class with the
help of a conventional intensity segmenter to the corrected
images. If the tissue classes are known, gain field is calculated
by analyzing the predicted and observed intensities.
Kenji Suzuki [3] introduced a lung image processing technique
for suppressing ribs in chest radiographs with the help of a
neural network called Massive Training Artificial Neural Net-
work (MTANN). When ribs or clavicles overlapped with lung
nodules present in the chest radiographs, it is very difficult for
the radiologists to detect such overlapped nodules. MTANN is
a highly non-linear filter which is used for suppressing the
ribs and clavicles present in the chest radiographs. The
MTANN is processed by number of input images with corre-
sponding teaching pixels. Linear output backward propaga-
tion algorithm is used. When the training processes are over,
the output of MTANN is similar to the teaching images. The
chest radiographs are used as input images and corresponding
dual energy images are used as the teaching images.When
ribs’ having various frequencies multi-resolution composi-
tion/decomposition technique is used. Single MTANN is diffi-
cult to suppress the ribs and clavicles having various fre-
quencies. Training requires much time, so it is very difficult to
train the MTANN using huge sub-region. To overcome this
multi-resolution decomposition/composition technique is in-
troduced. The multi-resolution decomposition process con-
verts high resolution image into different resolution images. A
medium resolution image is obtained from a high resolution
image by using down sampling and averaging. The inverse
procedure is done in multi-resolution composition technique.
Yongbum Lee, Takeshi Hara [4] proposed an automatic detec-
tion of pulmonary nodules using fuzzy rule system on the
basis of template matching technique on genetic algorithm
(GA). It is used for detecting the nodules within the lung area.
Genetic Algorithm is used to find out the accurate position in
the observed image and select an apt template image from
reference patterns for fast template matching. A conventional
template matching technique was also used to detect the nod-
ules existing on the lung wall area based on Lung Wall Tem-
plate Matching (LWTM) process. Genetic Algorithm Template
Matching is used to determine the correct position and select
template image from the reference images for template match-
ing.
Hyoungseop Kim, Seiji Mori [5] proposed a three step seg-
mentation process for the analysis of lung image. If Ground
Glass Opacity (GGO) is large, then it is helpful for the doctors
to extract the features. Region of Interest (ROI) is extracted to
segment the lung area. Preprocessing is done for better seg-
mentation. Based on that calculate mean value, standard devi-
ation, and semi interquatile range.
Kanazawa [6] introduced a computer aided diagnosis system
for lung cancer detection based on helical CT images. This
633
IJSER
International Journal of Scientific & Engineering Research Volume 6, Issue 12, December-2015 ISSN 2229-5518
IJSER © 2015
http://www.ijser.org
method includes two stages: analysis stage and diagnosis
stage. In the analysis stage, preprocessing is done and extracts
the lung area from the input image. Next step is to extract the
tumor regions and blood vessels that exhibit maximum CT
values in the lung region. In the diagnosis stage, certain diag-
nosis rules are generated, based on these rules identify the
tumor regions.
Analysis phase (lung extraction): The lung field surrounded
by air and its CT values are less inside lung area. Extraction
mechanism is based on a thresholding algorithm. This thresh-
olding technique eliminates the lung boundary with high CT
values. So a correction process is necessary for retaining such
lost parts.The procedure is listed below.
(1) The original image is converted to binary image using
thresholding algorithm.
(2) Calculate the curvature of binary image, and arrange each
pixel into three types, that is concave point, convex point or
smooth point.
(3) Connect between two points Pi and Qi where Pi and Qi are
the pixels from the concave point Ai and An.
(4) Connect between A and B and if the ray P2 or Q2 covers
the lung boundary within the distance d, where P2 and Q2 are
the pixels away from the convex point A.
Extraction of Pulmonary Blood Vessel Features: The lung
region is separated by segmentation process using the fuzzy
clustering method. The artifact values present in helical CT
images are termed as the beam hardening effect and partial
volume effect. These values affects the segmentation results,
therefore, artifact values are cancelled. The procedure for the
extraction of the blood vessel region is listed below:
(1) Apply smoothing operation to the extracted lung region,
and subtract the smoothed image from the original lung im-
age.
(2) Apply fuzzy clustering method to the pixel values inside
the lung area. The lung area is divided into two classes. First
class is the air, and the second class is the blood vessels and
tumors.
(3) Apply the weighted-gray distance transformation function
to the segmented image.
(4) Apply the threshold algorithm to the transformed image to
exclude the pixels lower than a threshold value.
(5) Apply inverse distance transformation operation.
Feature Analysis: Analyze the features of the diagnosis rules.
Distinguish the tumors and blood vessels based on some fea-
tures like shape, the gray values and their positions. Calculate
the following six features Area, Circularity, Thickness, Vari-
ance of values, Position, Gray level.
Diagnosis phase: This section describes the diagnosis rules to
detect the suspicious regions based on six features. Following
diagnostic medical knowledge techniques are used.
Knowledge 1: The lung cancer shape is generally spherical,
and it looks like a circle. The shape of blood vessels is horizon-
tally oblong.
Knowledge 2: Blood vessels becomes smaller as its position is
nearer to the lung wall,
Knowledge 3: The periphery blood vessels are little small and
seen in the helical CT image.
Knowledge 4: The blood vessel values are higher than the lung
cancer running vertically in helical CT images.
Knowledge 5: The gray values of each pixel are in uniform.
Penedo [7] introduced a computer aided diagnosis system for
neural network based approach. The Artificial Neural Net-
work (ANN) identifies the defective region present in a low
resolution image. Curvature peaks for all pixels are given as
input to the second ANN. Small size tumors are identified
here. The network architecture contains one input layer, two
hidden layers and one output layer. Hidden layers that are
used for the detection of SNA’s.The input layer consists of
neurons. The hidden layers are composed of neurons, and
generate outputs through a sigmoid activation function. The
output is generated by means of a sigmoid activation function.
Okada k [8] proposed a robust method for multi-joint segmen-
tation and solution fitting which extends mean shift analysis
based on linear space theory. Ellipsoidal geometrical structure
of the pulmonary nodule in CT was used for finding location,
boundary approximations, volume etc. Robustness is one of
the main issues represented here. A recent study suggested
that the intensity distribution is irregular, are more likely to be
malignant than the original ones.
Osman [9] introduced lung nodule diagnosis using 3D tem-
plate matching. Templates are actually used for finding the
structures that exhibit similar behavior of the nodules. To de-
tect anatomical landmarks in the particular area attenuation-
based template matching approach is used. The surface trans-
formation was done to align nodules in the Computer Tomog-
raphy (CT) scan.
Ozekes S, Osman O [10] introduced Genetic Cellular Neural
Network (GCNN). The ROI values ranges from +1 or -1 were
assigned to each voxel. The Genetic Algorithm (GA) was used
to determine the target position on the observed image and to
select adequate template image from several reference pat-
terns for quick template matching.Detection combined nor-
malized cross-correlation based on genetic optimization and a
Bayesian post-classification.
Yang Song [11] proposed a multi stage model for tumor and
lymph node detection. This method automatically detects the
634
IJSER
International Journal of Scientific & Engineering Research Volume 6, Issue 12, December-2015 ISSN 2229-5518
IJSER © 2015
http://www.ijser.org
tumors and abnormal lymph nodes on the basis of low level
intensity and neighborhood features. Support Vector Machine
(SVM) classifiers are used here. Conditional Random Field
(CRF) is based on unary level contextual and spatial features.
Next phase is relabeling the detected tumors.
Xujiong Ye [12] introduced shape based computer aided detec-
tion of lung nodules in thoracic CT images. It is used for de-
tecting both solid nodules and GGO nodules. Segment the
lung region using fuzzy thresholding technique. Next step is
to calculate the volumetric shape index. Former map is based
on local Gaussian and mean curvatures. Conjunction of shape
index and dot features provides good structure for the initial
nodule candidates.
S. Shaik Parveen [13] introduced the lung cancer nodule detec-
tion technique using automatic region growing method.
Threat pixel identification together with region growing
method is used for segmenting the defective region. Region
growing method starts with a single pixel and is considered as
the seed pixel. Based on the properties like model, intensity
and shape neighboring pixels are added. Based on the prob-
lem domain seed pixel selection is done.
3. METHODOLOGY
Data Collection:
A publically available LIDC database is used here. It contains
CT images of malignant and bengin users.
Preprocessing:
Preprocessing is the method to increase the quality of images.
PSNR findings, Medain filter, erosion, dilation etc are the pre-
processing methods. The lung CT images are initially prepro-
cessed in-order to remove the noise.
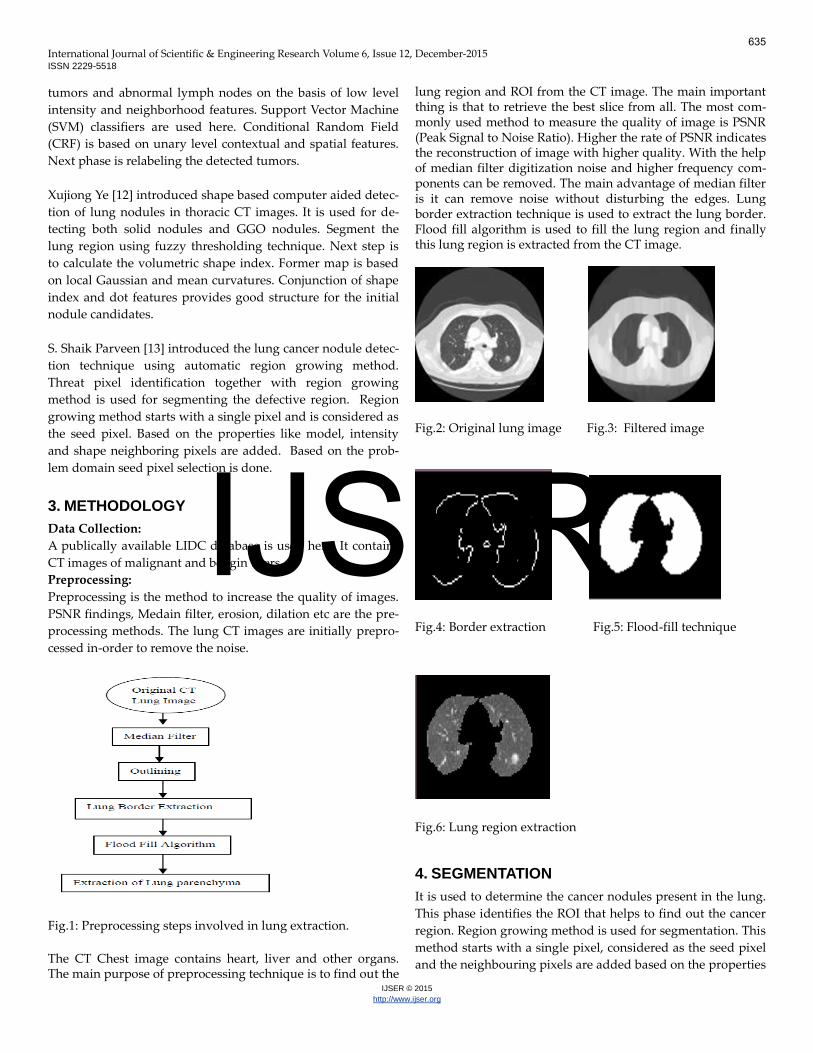
Fig.1: Preprocessing steps involved in lung extraction.
The CT Chest image contains heart, liver and other organs. The main purpose of preprocessing technique is to find out the
lung region and ROI from the CT image. The main important thing is that to retrieve the best slice from all. The most com-monly used method to measure the quality of image is PSNR (Peak Signal to Noise Ratio). Higher the rate of PSNR indicates the reconstruction of image with higher quality. With the help of median filter digitization noise and higher frequency com-ponents can be removed. The main advantage of median filter is it can remove noise without disturbing the edges. Lung border extraction technique is used to extract the lung border. Flood fill algorithm is used to fill the lung region and finally this lung region is extracted from the CT image.
Fig.2: Original lung image Fig.3: Filtered image
Fig.4: Border extraction Fig.5: Flood-fill technique
Fig.6: Lung region extraction
4. SEGMENTATION
It is used to determine the cancer nodules present in the lung.
This phase identifies the ROI that helps to find out the cancer
region. Region growing method is used for segmentation. This
method starts with a single pixel, considered as the seed pixel
and the neighbouring pixels are added based on the properties
635
IJSER
International Journal of Scientific & Engineering Research Volume 6, Issue 12, December-2015 ISSN 2229-5518
IJSER © 2015
http://www.ijser.org
like shape, model, intensity, texture etc. Based on the problem
domain selection of seed pixel occur.
5. THREAT PIXEL IDENTIFICATION Threat pixels are generated by thresholding the preprocessed
image and it is determined by histogram analysis. The follow-
ing are the steps for threat pixel identification.
Step 1: Compute histogram and accumulated histogram.
Step 2: Find out the location of peaks by histogram gradient
changes.
Step 3: Selection of threat threshold candidates.
Step 4: Mark the pixel (u, v) as candidate of threat pixel.
Step 5: If p (u, v) > Tt (Threat threshold as Tt)
Step 6: Pixel at (u, v) is considered as threat pixel.
6. REGION GROWING METHOD This method consists of group of pixels with uniform intensi-
ties. Collection of known points is considered as seed pixel.
The threat pixel considered as seed point. Each set of algo-
rithm involves the addition of one pixel in the set. Immediate
neighbours are determined and index is calculated.
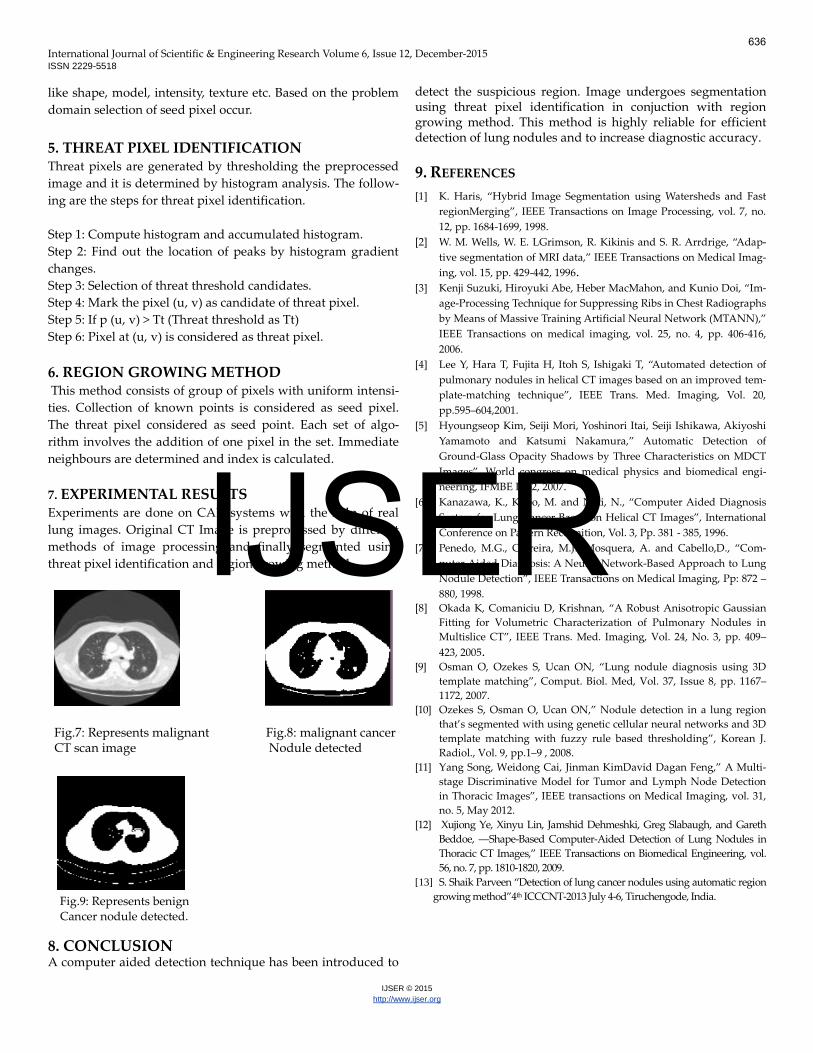
7. EXPERIMENTAL RESULTS
Experiments are done on CAD systems with the help of real
lung images. Original CT Image is preprocessed by different
methods of image processing and finally segmented using
threat pixel identification and region growing method.
Fig.7: Represents malignant Fig.8: malignant cancer CT scan image Nodule detected Fig.9: Represents benign Cancer nodule detected.
8. CONCLUSION A computer aided detection technique has been introduced to
detect the suspicious region. Image undergoes segmentation using threat pixel identification in conjuction with region growing method. This method is highly reliable for efficient detection of lung nodules and to increase diagnostic accuracy.
9. REFERENCES
[1] K. Haris, “Hybrid Image Segmentation using Watersheds and Fast
regionMerging”, IEEE Transactions on Image Processing, vol. 7, no.
12, pp. 1684-1699, 1998.
[2] W. M. Wells, W. E. LGrimson, R. Kikinis and S. R. Arrdrige, “Adap-
tive segmentation of MRI data,” IEEE Transactions on Medical Imag-
ing, vol. 15, pp. 429-442, 1996. [3] Kenji Suzuki, Hiroyuki Abe, Heber MacMahon, and Kunio Doi, “Im-
age-Processing Technique for Suppressing Ribs in Chest Radiographs
by Means of Massive Training Artificial Neural Network (MTANN),”
IEEE Transactions on medical imaging, vol. 25, no. 4, pp. 406-416,
2006.
[4] Lee Y, Hara T, Fujita H, Itoh S, Ishigaki T, “Automated detection of
pulmonary nodules in helical CT images based on an improved tem-
plate-matching technique”, IEEE Trans. Med. Imaging, Vol. 20,
pp.595–604,2001.
[5] Hyoungseop Kim, Seiji Mori, Yoshinori Itai, Seiji Ishikawa, Akiyoshi
Yamamoto and Katsumi Nakamura,” Automatic Detection of
Ground-Glass Opacity Shadows by Three Characteristics on MDCT
Images”, World congress on medical physics and biomedical engi-
neering, IFMBE Pro2, 2007.
[6] Kanazawa, K., Kubo, M. and Niki, N., “Computer Aided Diagnosis
System for Lung Cancer Based on Helical CT Images”, International
Conference on Pattern Recognition, Vol. 3, Pp. 381 - 385, 1996.
[7] Penedo, M.G., Carreira, M.J., Mosquera, A. and Cabello,D., “Com-
puter-Aided Diagnosis: A Neural-Network-Based Approach to Lung
Nodule Detection”, IEEE Transactions on Medical Imaging, Pp: 872 –
880, 1998.
[8] Okada K, Comaniciu D, Krishnan, “A Robust Anisotropic Gaussian
Fitting for Volumetric Characterization of Pulmonary Nodules in
Multislice CT”, IEEE Trans. Med. Imaging, Vol. 24, No. 3, pp. 409–
423, 2005. [9] Osman O, Ozekes S, Ucan ON, “Lung nodule diagnosis using 3D
template matching”, Comput. Biol. Med, Vol. 37, Issue 8, pp. 1167–
1172, 2007.
[10] Ozekes S, Osman O, Ucan ON,” Nodule detection in a lung region
that’s segmented with using genetic cellular neural networks and 3D
template matching with fuzzy rule based thresholding”, Korean J.
Radiol., Vol. 9, pp.1–9 , 2008.
[11] Yang Song, Weidong Cai, Jinman KimDavid Dagan Feng,” A Multi-
stage Discriminative Model for Tumor and Lymph Node Detection
in Thoracic Images”, IEEE transactions on Medical Imaging, vol. 31,
no. 5, May 2012.
[12] Xujiong Ye, Xinyu Lin, Jamshid Dehmeshki, Greg Slabaugh, and Gareth
Beddoe, ―Shape-Based Computer-Aided Detection of Lung Nodules in
Thoracic CT Images,” IEEE Transactions on Biomedical Engineering, vol.
56, no. 7, pp. 1810-1820, 2009.
[13] S. Shaik Parveen “Detection of lung cancer nodules using automatic region
growing method”4th ICCCNT-2013 July 4-6, Tiruchengode, India.
636
IJSER