Embed Size (px)
Citation preview

EARNINGS PRESS RELEASE AND
SUPPLEMENTAL INFORMATION
Second Quarter Ended June 30, 2013
Conference Call Information: Tuesday, July 30, 2013
3:00 p.m. Eastern Time / 12:00 p.m. Pacific Time Number: (888) 724-9493 or (913) 312-1456
Confirmation Code: 7393551
385 EAST COLORADO BOULEVARD, SUITE 299 PASADENA, CALIFORNIA 91101
PROPRIETARY MATERIALS © 2013 Alexandria Real Estate Equities, Inc.
ALEXANDRIA TECHNOLOGY SQUARE ® –
CAMBRIDGE ALEXANDRIA CENTER
™ FOR LIFE
SCIENCE – NEW YORK CITY
ALEXANDRIA CENTER™
FOR SCIENCE AND TECHNOLOGY – MISSION BAY

ALEXANDRIA REAL ESTATE EQUITIES, INC.
June 30, 2013
ALEXANDRIA REAL ESTATE EQUITIES, INC. ALL RIGHTS RESERVED © 2013 i
Table of Contents
Page
EARNINGS PRESS RELEASE
Second Quarter Ended June 30, 2013, Financial and Operating Results ......................................................................................................................................................................... 1 Guidance .......................................................................................................................................................................................................................................................................... 3
Earnings Call Information ................................................................................................................................................................................................................................................ 4
Consolidated Statements of Income ................................................................................................................................................................................................................................ 5 Consolidated Balance Sheets .......................................................................................................................................................................................................................................... 6
Funds From Operations and Adjusted Funds From Operations ....................................................................................................................................................................................... 7
SUPPLEMENTAL INFORMATION
Company Profile ............................................................................................................................................................................................................................................................. 9
Company and Investor Information ................................................................................................................................................................................................................................ 10 Financial and Asset Base Highlights ............................................................................................................................................................................................................................... 11
Core Operating Metrics Core Operating Metrics .................................................................................................................................................................................................................................................... 13
Summary of Same Property Comparisons ....................................................................................................................................................................................................................... 14
Same Property Performance Historical Results ............................................................................................................................................................................................................... 15 Summary of Leasing Activity ......................................................................................................................................................................................................................................... 16
Summary of Lease Expirations ....................................................................................................................................................................................................................................... 17
Summary of Properties and Occupancy .......................................................................................................................................................................................................................... 18 Top 20 Client Tenants and Client Tenant Mix ................................................................................................................................................................................................................ 19
Property Listing ............................................................................................................................................................................................................................................................... 20
Value-Added Opportunities and External Growth
Summary of Investments in Real Estate .......................................................................................................................................................................................................................... 24
Summary of Capital Expenditures .................................................................................................................................................................................................................................. 25 All Active Development Projects in North America ....................................................................................................................................................................................................... 26
All Active Redevelopment Projects in North America .................................................................................................................................................................................................... 28
Future Value-Added Projects in North America ............................................................................................................................................................................................................. 31 Summary of Real Estate Investment in Asia ................................................................................................................................................................................................................... 43
Balance Sheet Credit Metrics ................................................................................................................................................................................................................................................................. 45
Summary of Debt ............................................................................................................................................................................................................................................................ 46
Assets Held for Sale and Summary of Real Estate Sales ................................................................................................................................................................................................. 48
Definitions and Other Information
Definitions and Other Information .................................................................................................................................................................................................................................. 50
This document includes “forward-looking statements” within the meaning of Section 27A of the Securities Act of 1933, as amended, and Section 21E of the Securities Exchange Act of 1934, as amended. You can identify the forward-looking statements by their use of forward-looking words, such as “believes,” “expects,”
“may,” “will,” “should,” “seeks,” “intends,” “plans,” “estimates,” or “anticipates,” or the negative of those words or similar words. These forward-looking statements
are based on our current expectations, beliefs, projections, future plans and strategies, anticipated events or trends and similar expressions concerning matters that are not historical facts, as well as a number of assumptions concerning future events. These statements are subject to risks, uncertainties, assumptions and other important
factors that could cause actual results to differ materially from the results discussed in the forward-looking statements. Factors that might cause such a difference
include, without limitation, our failure to obtain capital (debt, construction financing, and/or equity) or refinance debt maturities, increased interest rates and operating costs, adverse economic or real estate developments in our markets, our failure to successfully complete and lease our existing space held for redevelopment and new
properties acquired for that purpose and any properties undergoing development, our failure to successfully operate or lease acquired properties, decreased rental rates
or increased vacancy rates or failure to renew or replace expiring leases, defaults on or non-renewal of leases by client tenants, general and local economic conditions, and other risks and uncertainties detailed in our filings with the Securities and Exchange Commission (“SEC”). Accordingly, you are cautioned not to place undue
reliance on such forward-looking statements. All forward-looking statements are made as of July 29, 2013, the date this document was first made available on our website, and we assume no obligation to update this information and expressly disclaim any obligation to update or revise any forward-looking statements, whether as a
result of new information, future events, or otherwise. For more discussion relating to risks and uncertainties that could cause actual results to differ materially from
those anticipated in our forward-looking statements, and risks to our business in general, please refer to our SEC filings, including our most recent annual report on Form 10-K and any subsequent quarterly reports on Form 10-Q. Note that certain figures are rounded throughout this document, which may impact footing and/or
crossfooting of totals and subtotals.
This document is not an offer to sell or solicitation to buy securities of Alexandria Real Estate Equities, Inc. Any offers to sell or solicitations to buy
securities of Alexandria Real Estate Equities, Inc. shall be made only by means of a prospectus approved for that purpose. Unless otherwise indicated, the
“Company,” “Alexandria,” “we,” “us,” and “our” refer to Alexandria Real Estate Equities, Inc. and its consolidated subsidiaries.

EARNINGS PRESS RELEASE
SECOND QUARTER ENDED JUNE 30, 2013
FINANCIAL AND
OPERATING RESULTS

ALEXANDRIA REAL ESTATE EQUITIES, INC.
ALL RIGHTS RESERVED © 2013 1
Contact: Joel S. Marcus
Chairman, Chief Executive Officer, & Founder
Alexandria Real Estate Equities, Inc.
(626) 578-9693
Alexandria Real Estate Equities, Inc.
Reports
Second Quarter Ended June 30, 2013
Financial and Operating Results
FFO Per Share – Diluted, as Adjusted, of $1.07 for 2Q13
AFFO Per Share – Diluted of $1.00 for 2Q13
EPS Per Share − Diluted of $0.38 for 2Q13
Total Revenues of $154.2 Million for 2Q13
NOI of $107.9 Million for 2Q13
Continued Solid Life Science Space Demand in Key Cluster Submarkets
PASADENA, CA. – July 29, 2013 – Alexandria Real Estate Equities, Inc. (NYSE: ARE) today announced financial and operating results for the second
quarter ended June 30, 2013.
Second quarter ended June 30, 2013, highlights
Results
Funds from operations (“FFO”) attributable to Alexandria Real Estate Equities, Inc.’s (“Alexandria’s”) common stockholders – diluted, as adjusted:
$71.6 million, or $1.07 per share, for 2Q13 compared to $65.8 million, or $1.07 per share, for 2Q12
$141.6 million, or $2.18 per share, for YTD 2Q13 compared to $132.0 million, or $2.14 per share, for YTD 2Q12
Adjusted funds from operations (“AFFO”) attributable to Alexandria’s common stockholders – diluted:
$66.8 million, or $1.00 per share, for 2Q13 compared to $64.0 million, or $1.04 per share, for 2Q12
$134.7 million, or $2.07 per share, for YTD 2Q13 compared to $126.4 million, or $2.05 per share, for YTD 2Q12
Net income attributable to Alexandria’s common stockholders – diluted:
$25.5 million, or $0.38 per share, for 2Q13 compared to $17.6 million, or $0.29 per share, for 2Q12
$47.9 million, or $0.74 per share, for YTD 2Q13 compared to $36.0 million, or $0.58 per share, for YTD 2Q12
Core operating metrics
Total revenues from continuing operations:
$154.2 million for 2Q13, up 5.9%, compared to $145.6 million for 2Q12
$304.6 million YTD 2Q13, up 8.3%, compared to $281.3 million for YTD 2Q12
Net operating income (“NOI”) from continuing operations:
$107.9 million for 2Q13, up 4.3%, compared to $103.5 million for 2Q12
$213.1 million for YTD 2Q13, up 7.2%, compared to $198.7 million for YTD 2Q12
Same property NOI performance:
7.2% and 3.2% increases on a cash and GAAP basis, respectively, for 2Q13 compared to 2Q12
8.3% and 2.0% increases on a cash and GAAP basis, respectively, for YTD 2Q13 compared to YTD 2Q12
Leasing activity solid during the three months ended June 30, 2013:
Executed 66 leases for 768,000 rentable square feet (“RSF”), including 270,000 RSF of development and redevelopment space
Rental rate increase of 6.7% and 12.7% on a cash and GAAP basis, respectively, on renewed/re-leased space
Key life science space leasing:
Investment-grade entity leased 121,632 RSF at 430 East 29th Street development in the Greater NYC market
Illumina, Inc. leased 97,702 RSF at 499 Illinois Street development in the San Francisco Bay Area market
Sarepta Therapeutics, Inc. leased 46,376 RSF at 215 First Street in the Greater Boston market
Eli Lilly and Company leased 27,950 RSF at 620 Professional Drive in the Suburban Washington, D.C. market
Nominal remaining expiring leases in 2013 of 410,254 RSF, or 3% of total operating RSF
Occupancy for North American Properties, as of June 30, 2013:
94.6% for operating properties and 92.9% for operating and redevelopment properties, up 40 bps and 110 bps, respectively, since March 31, 2013
Operating margins remained steady at 70% for 2Q13 and YTD 2Q13
Investment-grade client tenants represented 46% of total annualized base rent (“ABR”)

ALEXANDRIA REAL ESTATE EQUITIES, INC.
June 30, 2013
ALEXANDRIA REAL ESTATE EQUITIES, INC.
ALL RIGHTS RESERVED © 2013 2
Second Quarter Ended June 30, 2013
Financial and Operating Results
Core operating metrics (continued)
Investment-grade client tenants represented 72% of ABR from our top 10 client tenants
Contractual annual rent escalations in 95% of our leases
Balance sheet
Completed in 2Q13 secondary offering of 7.6 million shares of common stock at a price of $73.50 per share. The net proceeds of $535.5 million were used to repay outstanding balances under our unsecured senior line of credit.
Completed in 2Q13 $500 million 3.90% 10-year unsecured senior notes payable offering. Net proceeds of $495.3 million were used to reduce outstanding variable rate bank debt, including a $150 million partial repayment of our $750 million 2016 Unsecured Senior Bank Term Loan and to increase our available
cash balance. In connection with the partial repayment of our 2016 Unsecured Senior Bank Term Loan, we recognized a loss on the early extinguishment of debt related to the write-off of unamortized loan fees totaling $0.6 million, or $0.01 per share.
Liquidity of $1.8 billion, including $1.5 billion available under our unsecured senior line of credit and $302.2 million in cash and cash equivalents as of
June 30, 2013.
Closed in 2Q13 secured construction loan, with aggregate commitments of $36 million at a rate of LIBOR + 1.40%, for 100% pre-leased development project
at 269 East Grand Avenue in the San Francisco Bay Area market.
Net debt to EBITDA of 6.6x for the twelve months ended June 30, 2013.
Fixed charge coverage ratio of 2.7x for the twelve months ended June 30, 2013.
Unhedged variable rate debt totaling 11% of total consolidated debt as of June 30, 2013.
Completed in 2Q13 $22.5 million of real estate property sales, at a gain of $1.0 million, as follows:
$4.4 million of non-strategic income producing assets at a gain of $0.2 million
$18.1 million of non-income-producing land at a gain of $0.8 million
Subsequent events
Ariad Pharmaceuticals, Inc. expansion
On July 3, 2013, Ariad Pharmaceuticals, Inc. executed an LOI to lease an additional 139,374 RSF for a 15 year term at our 75/125 Binney Street
development in the Cambridge submarket of Greater Boston. An amendment to their lease is under negotiation to increase their lease to 383,497 RSF, or 99% of the
total RSF of the project.
Sale of land parcel at 1600 Owens Street
On July 8, 2013, we executed a purchase and sale agreement to dispose of our land parcel at 1600 Owens Street in the Mission Bay submarket of the San
Francisco Bay Area for an aggregate sales price of $55.2 million, inclusive of certain parking spaces. Ownership of the parcel was strategically important to the buyer
and we will earn a fee to manage the construction of the building. This sale is expected to close in December 2013.
Acquisition of 10121/10151 Barnes Canyon Road
On July 5, 2013, we acquired 10121/10151 Barnes Canyon Road, an approximate 116,000 RSF office property located in the Sorrento Mesa submarket of
San Diego, for a total purchase price of $13.1 million. The acquisition will be funded in two installments: i) $5.4 million to be funded in August, 2013 (which will earn
a 7% return until the next payment is made), and ii) $7.7 million to be funded no later than October 2014. The property is currently 100% occupied with leases that expire in 2014 and 2015. We intend to convert the existing office space into laboratory space through redevelopment when the space becomes available. Initial
stabilized yields will be provided in the future upon commencement of the redevelopment.
Unsecured senior bank loan financings
On July 26, 2013, we amended our $600 million 2016 Unsecured Senior Bank Term Loan to reduce our interest rate on outstanding borrowings. We did not extend the maturity of this loan as we expect to repay the loan over the next one to three years. In addition, we expect to complete amendments to our $1.5 billion
unsecured senior line of credit and our $600 million 2017 Unsecured Senior Bank Term Loan in the third quarter of 2013 to reduce our interest rate on outstanding borrowings, extend the maturity dates and amend certain financial covenants. The commitments available for each facility will not change.
Maturity Date (including extensions) Applicable Rate Facility Fee
Facility
Status
Prior/
Current
Extended/
Proposed
Prior/
Current
Extended/
Proposed
Prior/
Current
Extended/
Proposed
$600 million 2016 Unsecured Senior Bank Term Loan Complete June 2016 July 2016 L +1.75% L +1.20% N/A N/A
$600 million 2017 Unsecured Senior Bank Term Loan In Progress January 2017 January 2019 L +1.50% L +1.20% N/A N/A $1.5 billion unsecured senior line of credit In Progress April 2017 January 2019 L +1.20% L +1.10% 0.25% 0.20%

ALEXANDRIA REAL ESTATE EQUITIES, INC.
June 30, 2013
ALEXANDRIA REAL ESTATE EQUITIES, INC.
ALL RIGHTS RESERVED © 2013 3
Guidance
Based on our current view of existing market conditions and certain current assumptions, we have updated guidance for earnings per share attributable to
Alexandria’s common stockholders – diluted and FFO per share attributable to Alexandria’s common stockholders – diluted for the year ended December 31, 2013, as
set forth in the table below. The table below provides a reconciliation of FFO per share, a non-GAAP measure, to earnings per share, the most directly comparable GAAP measure, as well as other key assumptions included in our guidance for the year ended December 31, 2013. To the extent our full year earnings guidance is
updated during the year, we will provide additional disclosure supporting reasons for any significant changes to such guidance.
Guidance for the Year Ended December 31, 2013 Reported on July 29, 2013 Reported on May 13, 2013
Earnings per share attributable to Alexandria’s common stockholders – diluted $1.53 to $1.63
$1.50 to $1.60
Depreciation and amortization $2.76 to $2.86
$2.80 to $2.90
(Gain) loss on sale of real estate $(0.01) $0.01 Other $(0.01) $(0.01)
FFO per share attributable to Alexandria’s common stockholders – diluted $4.32 to $4.42 $4.35 to $4.45
Add back: actual 2Q13 per share loss on early extinguishment of debt (1) $0.01 N/A Add back: projected 3Q13 per share loss on early extinguishment of debt (1) $0.02 N/A
FFO per share attributable to Alexandria’s common stockholders - diluted, as adjusted $4.35 to $4.45 $4.35 to $4.45
Key projection assumptions:
Same property NOI growth – cash basis 5% to 7% 5% to 7%
Same property NOI growth – GAAP basis 1% to 3% 1% to 3%
Rental rate steps on lease renewals and re-leasing of space – cash basis 3% to 5% 1% to 3%
Rental rate steps on lease renewals and re-leasing of space – GAAP basis 11% to 13% 7% to 12%
Occupancy percentage for all operating properties at December 31, 2013 94.3% to 94.7% 94.3% to 94.7%
Straight-line rents $24 to $26 million $24 to $26 million
Amortization of above and below market leases $3 to $4 million $3 to $4 million General and administrative expenses $48 to $51 million $48 to $51 million
Capitalization of interest $51 to $57 million $51 to $57 million Interest expense, net $71 to $81 million $71 to $81 million
Net debt to adjusted EBITDA for the annualized three months ended December 31, 2013 6.5x 6.5x
Fixed charge coverage ratio for the annualized three months ended December 31, 2013 3.0x 3.0x Non-income-producing land as a percentage of gross real estate by December 31, 2013 15% to 17% 15% to 17%
(1) Represents loss on early extinguishment of debt related to the write-off of unamortized loan fees of $0.01 per share as a result of the $150 million partial repayment of our 2016 Unsecured Senior Bank Term Loan during the three months ended June 30, 2013, and the estimated loss on early extinguishment of debt
related to the write-off of unamortized loan fees of $0.02 per share as a result of amendments of our 2016 Unsecured Senior Bank Term Loan, 2017 Unsecured
Senior Bank Term Loan, and $1.5 billion unsecured senior line of credit which we expect to complete in the third quarter of 2013.
We expect that our principal liquidity needs for the year ended December 31, 2013, will be satisfied by the following multiple sources of capital as shown in
the table below. There can be no assurance that our sources and uses of capital will not be materially higher or lower than these expectations.
Reported on
July 29, 2013
Reported on
May 13, 2013
Sources and Uses of Capital for the Year Ended December 31, 2013 (in millions) Completed Projected Total Total
Sources of capital:
Net cash provided by operating activities less dividends $ 66 $ 64 - 84 $ 130 - 150 $ 130 - 150
Non-income-producing land sales 18 131 - 171 (1) 149 - 189 149 - 189 Income producing asset sales 129 0 - 5 129 - 134 125 - 138
Secured construction loan borrowings 26 19 - 39 45 - 65 45 - 55
Unsecured senior notes payable 500 − 500 350 - 450 Common stock offering 536 − 536 415 - 490
Available cash and borrowings on unsecured senior line of credit (2) − 324 - 369 324 - 369 −
Total sources of capital $ 1,275 $ 538 - 668 $ 1,813 - 1,943 $ 1,214 - 1,472
Uses of capital:
Development, redevelopment, and construction $ 253 $ 346 - 376 $ 599 - 629 $ 617 - 667
Seller financing of asset sales 39 − 39 39 Acquisitions:
Completed/in process acquisitions 13 64 77 −
Additional acquisitions − 123 - 223 123 - 223 200 - 300
Secured notes payable repayments 32 5 37 37
Unsecured senior bank term loan repayment 150 − 150 125 - 175
Excess cash retained from issuance of unsecured senior notes payable/ pay down of unsecured senior line of credit
788 − 788 196 - 254
Total uses of capital $ 1,275 $ 538 - 668 $ 1,813 - 1,943 $ 1,214 - 1,472
(1) See Balance Sheet section of our Supplemental Package for additional information.
(2) We had $302.2 million in cash and cash equivalents as of June 30, 2013.
The key assumptions behind the sources and uses of capital in the table are a favorable capital market environment and performance of our core operations
in areas such as delivery of current and future development and redevelopment projects, leasing activity, and renewals. Our expected sources and uses of capital are subject to a number of variables and uncertainties, including those discussed under the “Forward-looking statements” section under Part I, the “Risk Factors” section
under Item 1A, and the “Management’s Discussion and Analysis of Financial Condition and Results of Operations” section under Item 7, of our annual report on Form
10-K for the year ended December 31, 2012. We expect to update our forecast of sources and uses of capital on a quarterly basis.

ALEXANDRIA REAL ESTATE EQUITIES, INC.
June 30, 2013
ALEXANDRIA REAL ESTATE EQUITIES, INC.
ALL RIGHTS RESERVED © 2013 4
Earnings Call Information
We will host a conference call on Tuesday, July 30, 2013, at 3:00 p.m. Eastern Time (“ET”)/12:00 p.m. noon Pacific Time (“PT”) that is open to the general
public to discuss our financial and operating results for the three months ended June 30, 2013. To participate in this conference call, dial (888) 724-9493 or
(913) 312-1456 and confirmation code 7393551, shortly before 3:00 p.m. ET/12:00 p.m. noon PT. The audio web cast can be accessed at: www.are.com, in the “For Investors” section. A replay of the call will be available for a limited time from 6:00 p.m. ET/3:00 p.m. PT on Tuesday, July 30, 2013. The replay number is
(888) 203-1112 or (719) 457-0820 and the confirmation code is 7393551.
Additionally, a copy of this Earnings Press Release and Supplemental Information for the second quarter ended June 30, 2013, is available in the “For
Investors” section of our website at www.are.com, or by following this link: http://www.are.com/fs/2013q2.pdf.
About the Company
Alexandria Real Estate Equities, Inc. (NYSE: ARE), a self-administered and self-managed investment-grade REIT, is the largest and leading REIT focused principally on owning, operating, developing, redeveloping, and acquiring high-quality, sustainable real estate for the broad and diverse life science industry. Founded
in 1994, Alexandria was the first REIT to identify and pursue the laboratory niche and has since had the first-mover advantage in the core life science cluster locations
including Greater Boston, the San Francisco Bay Area, San Diego, New York City, Seattle, Suburban Washington, D.C., and Research Triangle Park. Alexandria’s high-credit client tenants span the life science industry, including renowned academic and medical institutions, multinational pharmaceutical companies, public and
private biotechnology entities, United States government research agencies, medical device companies, industrial biotech companies, venture capital firms, and life
science product and service companies. As the recognized real estate partner of the life science industry, Alexandria has a superior track record in driving client tenant productivity, collaboration, and innovation through its best-in-class laboratory and office space adjacent to leading academic medical research centers, unparalleled life
science real estate expertise and services, and a longstanding and expansive network in the life science community. We believe these advantages result in higher
occupancy levels, longer lease terms, higher rental income, higher returns, and greater long-term asset value. For additional information on Alexandria, please visit www.are.com.
***********
This press release includes “forward-looking statements” within the meaning of Section 27A of the Securities Act of 1933, as amended, and Section 21E of
the Securities Exchange Act of 1934, as amended. Such forward-looking statements include, without limitation, statements regarding our 2013 earnings per share
attributable to Alexandria’s common stockholders − diluted, 2013 FFO per share attributable to Alexandria’s common stockholders − diluted, NOI and our projected
sources and uses of capital for the year ended December 31, 2013. These forward-looking statements are based on our current expectations, beliefs, projections, future plans, strategies, anticipated events, trends, and similar expressions concerning matters that are not historical facts, as well as a number of assumptions concerning
future events. These statements are subject to risks, uncertainties, assumptions and other important factors that could cause actual results to differ materially from the
results discussed in the forward-looking statements. Factors that might cause such a difference include, without limitation, our failure to obtain capital (debt, construction financing, and/or equity) or refinance debt maturities, increased interest rates and operating costs, adverse economic or real estate developments in our
markets, our failure to successfully complete and lease our existing space held for redevelopment and new properties acquired for that purpose and any properties
undergoing development, our failure to successfully operate or lease acquired properties, decreased rental rates or increased vacancy rates or failure to renew or replace expiring leases, defaults on or non-renewal of leases by client tenants, general and local economic conditions, and other risks and uncertainties detailed in our filings
with the SEC. Accordingly, you are cautioned not to place undue reliance on such forward-looking statements. All forward-looking statements are made as of the date
of this press release, and we assume no obligation to update this information and expressly disclaim any obligation to update or revise any forward-looking statements, whether as a result of new information, future events, or otherwise. For more discussion relating to risks and uncertainties that could cause actual results to differ
materially from those anticipated in our forward-looking statements, and risks to our business in general, please refer to our SEC filings, including our most recent
annual report on Form 10-K and any subsequent quarterly reports on Form 10-Q.

ALEXANDRIA REAL ESTATE EQUITIES, INC.
June 30, 2013
ALEXANDRIA REAL ESTATE EQUITIES, INC.
ALL RIGHTS RESERVED © 2013 5
Consolidated Statements of Income
(In thousands, except per share amounts) (Unaudited)
Three Months Ended Six Months Ended
6/30/13 3/31/13 12/31/12 9/30/12 6/30/12 6/30/13 6/30/12
Revenues:
Rental $ 114,743 $ 111,776 $ 112,048 $ 106,216 $ 104,329 $ 226,519 $ 205,530
Tenant recoveries 35,923 35,611 35,721 34,006 31,881 71,534 63,763 Other income 3,569 2,993 3,785 2,628 9,383 6,562 12,011
Total revenues 154,235 150,380 151,554 142,850 145,593 304,615 281,304
Expenses:
Rental operations 46,323 45,224 46,176 44,203 42,102 91,547 82,555
General and administrative 12,472 11,648 12,635 12,470 12,298 24,120 22,655 Interest 15,978 18,020 17,941 17,092 17,922 33,998 34,148
Depreciation and amortization 46,580 46,065 47,515 46,584 50,741 92,645 92,527
Impairment of land parcel − − 2,050 − − − − Loss on early extinguishment of debt 560 − − − 1,602 560 2,225
Total expenses 121,913 120,957 126,317 120,349 124,665 242,870 234,110
Income from continuing operations 32,322 29,423 25,237 22,501 20,928 61,745 47,194
Income (loss) from discontinued operations: Income from discontinued operations before
impairment of real estate 243 814 5,171 5,603 4,713 1,057 9,358
Impairment of real estate − − (1,601 ) (9,799 ) − − −
Income (loss) from discontinued operations, net 243 814 3,570 (4,196 ) 4,713 1,057 9,358
Gain on sale of land parcel 772 − − − − 772 1,864
Net income 33,337 30,237 28,807 18,305 25,641 63,574 58,416
Net income attributable to noncontrolling interests 980 982 1,012 828 851 1,962 1,562
Dividends on preferred stock 6,471 6,471 6,471 6,471 6,903 12,942 14,386 Preferred stock redemption charge − − − − − − 5,978
Net income attributable to unvested restricted stock
awards 403
342 324
360 271
745
506
Net income attributable to Alexandria’s common stockholders $ 25,483 $ 22,442 $ 21,000 $ 10,646 $ 17,616
$ 47,925
$ 35,984
Earnings per share attributable to Alexandria’s
common stockholders – basic and diluted:
Continuing operations $ 0.38 $ 0.35 $ 0.27 $ 0.24 $ 0.21 $ 0.72 $ 0.43
Discontinued operations, net − 0.01 0.06 (0.07 ) 0.08 0.02 0.15
Earnings per share – basic and diluted $ 0.38 $ 0.36 $ 0.33 $ 0.17 $ 0.29 $ 0.74 $ 0.58
Weighted average shares of common stock outstanding for calculating earnings per share attributable to
Alexandria’s common stockholders:
– Basic 66,973 63,161 63,092 62,364 61,663 65,078 61,586 – Diluted 66,973 63,161 63,092 62,364 61,664 65,078 61,586

ALEXANDRIA REAL ESTATE EQUITIES, INC.
June 30, 2013
ALEXANDRIA REAL ESTATE EQUITIES, INC.
ALL RIGHTS RESERVED © 2013 6
Consolidated Balance Sheets
(In thousands) (Unaudited)
June 30, March 31, December 31, September 30, June 30,
2013 2013 2012 2012 2012
Assets
Investments in real estate, net $ 6,453,379 $ 6,375,182 $ 6,424,578 $ 6,300,027 $ 6,208,354 Cash and cash equivalents 302,205 87,001 140,971 94,904 80,937
Restricted cash 30,914 30,008 39,947 44,863 41,897
Tenant receivables 7,577 9,261 8,449 10,124 6,143 Deferred rent 177,507 170,100 170,396 160,914 155,295
Deferred leasing and financing costs, net 164,362 159,872 160,048 152,021 151,355
Investments 122,605 123,543 115,048 107,808 104,454 Other assets 120,740 135,952 90,679 94,356 93,304
Total assets $ 7,379,289 $ 7,090,919 $ 7,150,116 $ 6,965,017 $ 6,841,739
Liabilities, Noncontrolling Interests, and Equity
Secured notes payable $ 711,029 $ 730,714 $ 716,144 $ 719,350 $ 719,977 Unsecured senior notes payable 1,048,395 549,816 549,805 549,794 549,783
Unsecured senior line of credit − 554,000 566,000 413,000 379,000
Unsecured senior bank term loans 1,200,000 1,350,000 1,350,000 1,350,000 1,350,000
Accounts payable, accrued expenses, and tenant security deposits 368,249 367,153 423,708 376,785 348,037
Dividends payable 52,141 43,955 41,401 39,468 38,357
Total liabilities 3,379,814 3,595,638 3,647,058 3,448,397 3,385,154
Commitments and contingencies
Redeemable noncontrolling interests 14,505 14,534 14,564 15,610 15,817
Alexandria Real Estate Equities, Inc.’s stockholders’ equity: Series D Cumulative Convertible Preferred Stock 250,000 250,000 250,000 250,000 250,000
Series E Cumulative Redeemable Preferred Stock 130,000 130,000 130,000 130,000 130,000
Common stock 710 633 632 632 622 Additional paid-in capital 3,596,477 3,075,860 3,086,052 3,094,987 3,053,269
Accumulated other comprehensive loss (39,565 ) (22,890 ) (24,833 ) (19,729 ) (37,370 )
Alexandria’s stockholders’ equity 3,937,622 3,433,603 3,441,851 3,455,890 3,396,521
Noncontrolling interests 47,348 47,144 46,643 45,120 44,247
Total equity 3,984,970 3,480,747 3,488,494 3,501,010 3,440,768
Total liabilities, noncontrolling interests, and equity $ 7,379,289 $ 7,090,919 $ 7,150,116 $ 6,965,017 $ 6,841,739

ALEXANDRIA REAL ESTATE EQUITIES, INC.
June 30, 2013
ALEXANDRIA REAL ESTATE EQUITIES, INC.
ALL RIGHTS RESERVED © 2013 7
Funds From Operations and Adjusted Funds From Operations
(In thousands, except per share amounts)
(Unaudited)
The following table presents a reconciliation of net income attributable to Alexandria’s common stockholders − basic, the most directly comparable financial measure presented in
accordance with GAAP, to FFO attributable to Alexandria’s common stockholders − diluted, FFO attributable to Alexandria’s common stockholders – diluted, as adjusted, and AFFO
attributable to Alexandria’s common stockholders – diluted, for the periods below:
Three Months Ended Six Months Ended
6/30/13 3/31/13 12/31/12 9/30/12 6/30/12 6/30/13 6/30/12
Net income attributable to Alexandria’s common stockholders – basic $ 25,483 $ 22,442 $ 21,000 $ 10,646 $ 17,616 $ 47,925 $ 35,984
Depreciation and amortization 46,580 46,995 48,072 48,173 52,355 93,575 95,760
Loss (gain) on sale of real estate (219 ) 340 − (1,562 ) (2 ) 121 (2 )
Impairment of real estate − − 1,601 9,799 − − −
Gain on sale of land parcel (772 ) − − − − (772 ) (1,864 )
Amount attributable to noncontrolling interests/unvested restricted stock awards:
Net income 1,383 1,324 1,336 1,188 1,122 2,707 2,068
FFO (1,437 ) (1,064 ) (1,109 ) (1,148 ) (1,133 ) (2,501 ) (2,305 )
FFO attributable to Alexandria’s common stockholders – basic 71,018 70,037 70,900 67,096 69,958 141,055 129,641
Assumed conversion of 8.00% Unsecured Senior Convertible Notes 5 5 5 5 6 10 11
FFO attributable to Alexandria’s common stockholders – diluted 71,023 72 70,042 70,905 67,101 69,964 141,065 129,652
Realized gain on equity investment primarily related to one non-tenant life science
entity − − − − (5,811 ) − (5,811 )
Impairment of land parcel − − 2,050 − − − −
Loss on early extinguishment of debt 560 − − − 1,602 560 2,225
Preferred stock redemption charge − − − − − − 5,978
Allocation to unvested restricted stock awards (12 ) − (19 ) − 35 (12 ) (20 )
FFO attributable to Alexandria’s common stockholders – diluted, as adjusted 71,571 70,042 72,936 67,101 65,790 141,613 132,024
Non-revenue-enhancing capital expenditures:
Maintenance building improvements (337 ) (596 ) (329 ) (935 ) (594 ) (933 ) (804 )
Tenant improvements and leasing commissions (2,990 ) (882 ) (3,170 ) (1,844 ) (2,148 ) (3,872 ) (4,167 )
Straight-line rent revenue (8,239 ) (6,198 ) (9,240 ) (5,225 ) (5,195 ) (14,437 ) (13,991 )
Straight-line rent expense on ground leases 539 538 471 201 1,207 1,077 2,613
Capitalized income from development projects 9 22 45 50 72 31 550
Amortization of acquired above and below market leases (830 ) (830 ) (844 ) (778 ) (778 ) (1,660 ) (1,578 )
Amortization of loan fees 2,427 2,386 2,505 2,470 2,214 4,813 4,857
Amortization of debt premiums/discounts 115 115 110 112 110 230 289
Stock compensation 4,463 3,349 3,748 3,845 3,274 7,812 6,567
Allocation to unvested restricted stock awards 50 19 63 19 15 69 48
AFFO attributable to Alexandria’s common stockholders – diluted $ 66,778 $ 67,965 $ 66,295 $ 65,016 $ 63,967 $ 134,743 $ 126,408
The following table presents a reconciliation of net income per share attributable to Alexandria’s common stockholders − basic, to FFO per share attributable to Alexandria’s
common stockholders − diluted, FFO per share attributable to Alexandria’s common stockholders – diluted, as adjusted, and AFFO per share attributable to Alexandria’s common stockholders
– diluted, for the periods below. For the computation of the weighted average shares used to compute the per share information, refer to the “Definitions and Other Information” section in our
supplemental information:
Three Months Ended Six Months Ended
6/30/13 3/31/13 12/31/12 9/30/12 6/30/12 6/30/13 6/30/12
Net income per share attributable to Alexandria’s common stockholders – basic $0.38 $0.36 $0.33 $0.17 $0.29 $0.74 $0.58
Depreciation and amortization 0.69 0.74 0.76 0.78 0.84 1.43 1.56
Loss (gain) on sale of real estate − 0.01 − (0.03) − 0.01 −
Impairment of real estate − − 0.03 0.16 − − −
Gain on sale of land parcel (0.01) − − − − (0.01) (0.03)
Amount attributable to noncontrolling interests/unvested restricted stock awards:
Net income 0.02 0.02 0.02 0.02 0.02 0.04 0.03
FFO (0.02) (0.02) (0.02) (0.02) (0.02) (0.04) (0.04)
FFO per share attributable to Alexandria’s common stockholders – basic 1.06 1.11 1.12 1.08 1.13 2.17 2.11
Assumed conversion of 8.00% Unsecured Senior Convertible Notes − − − − − − −
FFO per share attributable to Alexandria’s common stockholders – diluted 1.06 1.11 1.12 1.08 1.13 2.17 2.11
Realized gain on equity investment primarily related to one non-tenant life science
entity − − − − (0.09) − (0.09)
Impairment of land parcel − − 0.04 − − − −
Loss on early extinguishment of debt 0.01 − − − 0.03 0.01 0.03
Preferred stock redemption charge − − − − − − 0.10
Allocation to unvested restricted stock awards − − − − − − −
FFO per share attributable to Alexandria’s common stockholders – diluted, as
adjusted 1.07 1.11 1.16 1.08 1.07 2.18 2.14
Non-revenue-enhancing capital expenditures:
Maintenance building improvements (0.01) (0.01) (0.01) (0.01) (0.01) (0.01) (0.01)
Tenant improvements and leasing commissions (0.04) (0.01) (0.05) (0.03) (0.03) (0.06) (0.07)
Straight-line rent revenue (0.12) (0.10) (0.15) (0.08) (0.08) (0.22) (0.23)
Straight-line rent expense on ground leases 0.01 0.01 0.01 − 0.02 0.02 0.04
Amortization of acquired above and below market leases (0.01) (0.01) (0.01) (0.01) (0.01) (0.03) (0.03)
Amortization of loan fees 0.03 0.04 0.04 0.03 0.03 0.07 0.09
Stock compensation 0.07 0.05 0.06 0.06 0.05 0.12 0.11
Allocation to unvested restricted stock awards − − − − − − −
Other − − − − − − 0.01
AFFO per share attributable to Alexandria’s common stockholders – diluted $1.00 $1.08 $1.05 $1.04 $1.04 $2.07 $2.05

SUPPLEMENTAL INFORMATION

ALEXANDRIA REAL ESTATE EQUITIES, INC.
June 30, 2013
ALEXANDRIA REAL ESTATE EQUITIES, INC. ALL RIGHTS RESERVED © 2013 9
Company Profile
The Company
Alexandria Real Estate Equities, Inc. (NYSE: ARE), a self-administered and self-managed investment-grade real estate investment trust (“REIT”), is the
largest and leading REIT focused principally on owning, operating, developing, redeveloping, and acquiring high-quality, sustainable real estate for the broad and
diverse life science industry. Founded in 1994, Alexandria was the first REIT to identify and pursue the laboratory niche and has since had the first-mover advantage in the core life science cluster locations including Greater Boston, the San Francisco Bay Area, San Diego, New York City, Seattle, Suburban Washington, D.C., and
Research Triangle Park. Alexandria’s high-credit client tenants span the life science industry, including renowned academic and medical institutions, multinational
pharmaceutical companies, public and private biotechnology entities, United States government research agencies, medical device companies, industrial biotech companies, venture capital firms, and life science product and service companies. As the recognized real estate partner of the life science industry, Alexandria has a
superior track record in driving client tenant productivity, collaboration, and innovation through its best-in-class laboratory and office space adjacent to leading academic medical research centers, unparalleled life science real estate expertise and services, and longstanding and expansive network in the life science community.
We believe these advantages result in higher occupancy levels, longer lease terms, higher rental income, higher returns, and greater long-term asset value. For
additional information on Alexandria, please visit www.are.com.
Unique Niche Strategy
Alexandria’s primary business objective is to maximize stockholder value by providing its stockholders with the greatest possible total return and long-term
asset value based on a multifaceted platform of internal and external growth. The key elements to our strategy include our consistent focus on high-quality assets and
operations in the top life science cluster locations with our properties located adjacent to life science entities, driving growth and technological advances within each
cluster. These adjacency locations are characterized by high barriers to entry for new landlords, high barriers to exit for client tenants, and limited supply of available
space. They represent highly desirable locations for tenancy by life science entities because of the close proximity to concentrations of specialized skills, knowledge,
institutions, and related businesses. Alexandria’s strategy also includes drawing upon our deep and broad life science and real estate relationships in order to attract new and leading life science client tenants and value-added real estate. Alexandria was founded in 1994 by Jerry M. Sudarsky and Joel S. Marcus. Alexandria
executed its initial public offering in 1997 and received its investment-grade ratings in 2011.
Management
Alexandria’s executive and senior management team is highly experienced in the REIT industry (uniquely with life science and real estate development, construction, operations, ownership, and expertise) and is the most accomplished team focused on providing high-quality, environmentally sustainable real estate,
technical infrastructure, and unique expertise to the broad and diverse life science industry. Our deep and talented team has decades of life science industry experience.
Our management team also includes highly experienced regional market directors averaging over 21 years of real estate experience, including approximately 11 years with Alexandria. We believe that our expertise, experience, reputation, and key life science relationships provide Alexandria significant competitive advantages in
attracting new business opportunities.
Client Tenant Base
The quality, diversity, breadth, and depth of our significant relationships with our life science client tenants provide Alexandria with solid and stable cash flows. Investment-grade client tenants represented 46% of Alexandria’s total annualized base rent as of June 30, 2013. Additionally, investment-grade client tenants
represented 72% of Alexandria's top 10 client tenants by annualized base rent as of June 30, 2013. As of June 30, 2013, our multinational pharmaceutical client tenants
represented approximately 26.1% of our annualized base rent, led by Bristol-Myers Squibb Company, Eli Lilly and Company, GlaxoSmithKline plc, Novartis AG, Pfizer Inc., and Roche; revenue producing life science product and service, medical device, and industrial biotech companies represented approximately 22.1%, led by
Illumina, Inc., Laboratory Corporation of America Holdings, Monsanto Company, and Quest Diagnostics Incorporated; non-profit, renowned medical and research
institutions, and government agencies represented approximately 17.6% and included Fred Hutchinson Cancer Research Center, Massachusetts Institute of Technology, The Regents of the University of California, Sanford-Burnham Medical Research Institute, The Scripps Research Institute, the United States Government, and
University of Washington; public biotechnology companies represented approximately 17.1% and included Amgen Inc., Biogen Idec Inc., Celgene Corporation, Gilead
Sciences, Inc., and Onyx Pharmaceuticals, Inc.; private biotechnology companies represented approximately 13.0% and included high-quality, leading-edge companies with blue-chip venture and institutional investors, including Constellation Pharmaceuticals, Inc., FibroGen, Inc., and FORMA Therapeutics, Inc.; and the remaining
approximately 4.1% consisted of traditional office client tenants. Alexandria’s strong life science underwriting skills, long-term life science industry relationships, and
sophisticated management with both real estate and life science operating expertise positively distinguish Alexandria from all other publicly traded real estate investment trusts and real estate companies.
Executive/Senior Management
Joel S. Marcus Chairman, Chief Executive Officer, & Founder Thomas J. Andrews EVP – Regional Market Director-Greater Boston
Dean A. Shigenaga Chief Financial Officer, EVP, & Treasurer Daniel J. Ryan EVP – Regional Market Director-San Diego & Strategic Stephen A. Richardson Chief Operating Officer & Regional Market Director- Operations
San Francisco Bay Area John J. Cox SVP – Regional Market Director-Seattle
Peter M. Moglia Chief Investment Officer John H. Cunningham SVP – Regional Market Director-NY & Strategic Operations
Jennifer J. Banks SVP, General Counsel, & Corporate Secretary Larry J. Diamond SVP – Regional Market Director-Mid Atlantic
Marc E. Binda SVP – Finance Vincent R. Ciruzzi SVP – Construction & Development Andres R. Gavinet Chief Accounting Officer

ALEXANDRIA REAL ESTATE EQUITIES, INC.
June 30, 2013
ALEXANDRIA REAL ESTATE EQUITIES, INC. ALL RIGHTS RESERVED © 2013 10
Company Information
Corporate Headquarters Trading Symbols Information Requests
385 East Colorado Boulevard, Suite 299 New York Stock Exchange Phone: (626) 396-4828 Pasadena, California 91101 Common stock: ARE E-mail: [email protected]
Series E preferred stock: ARE–E Web: www.are.com
Summary Data
Cluster Markets
Total Properties
Total Rentable
Square Feet
Greater Boston, San Francisco Bay Area, San Diego, Greater NYC, Suburban Washington, D.C., Seattle,
Research Triangle Park, Canada, India, and China
173 17.0 million
Common Stock Data
2Q13 1Q13 4Q12 3Q12 2Q12
High/low trading price $ 78.43/61.20 $ 73.51/69.77 $ 74.59/64.09 $ 77.10/70.97 $ 76.50/67.40 Closing stock price, average for period $ 70.68 $ 71.98 $ 69.88 $ 73.65 $ 71.67
Closing stock price, at the end of the quarter $ 65.72 $ 70.98 $ 69.32 $ 73.52 $ 72.72
Dividend per share – quarter/annualized $ 0.65/2.60 $ 0.60/2.40 $ 0.56/2.24 $ 0.53/2.12 $ 0.51/2.04 Closing dividend yield – annualized 4.0% 3.4% 3.2% 2.9% 2.8%
Common shares outstanding, at the end of the quarter (in thousands) 70,997 63,317 63,245 63,161 62,250
Closing market value of outstanding common shares (in thousands) $ 4,665,948 $ 4,494,262 $ 4,384,119 $ 4,643,610 $ 4,526,818 Total market capitalization (in thousands) $ 8,005,581 $ 8,066,072 $ 7,953,348 $ 8,064,386 $ 7,912,286
Investor Information
Equity Research Coverage
Alexandria is currently covered by the following research analysts. This list may not be complete and is subject to change as firms initiate or discontinue
coverage of our company. Please note that any opinions, estimates, or forecasts regarding our historical or predicted performance made by these analysts are theirs
alone and do not represent opinions, forecasts, or predictions of Alexandria or its management. Alexandria does not by its reference below or distribution imply its endorsement of or concurrence with such information, conclusions, or recommendations. Interested persons may obtain copies of analysts’ reports on their own as we
do not distribute these reports. Several of these firms may from time-to-time own our stock and/or hold other long or short positions in our stock, and may provide
compensated services to us.
Argus Research Group, Inc. Evercore Partners RBC Capital Markets
William Eddleman, Jr. (212) 425-7500 Sheila McGrath (212) 497-0882 Michael Carroll (440) 715-2649 Nathan Crossett (212) 497-0870 Rich Moore (440) 715-2646
Bank of America Merrill Lynch Green Street Advisors, Inc. Robert W. Baird & Company James Feldman (646) 855-5808 Jeff Theiler (949) 640-8780 David Rodgers (216) 737-7341
Jeffrey Spector (646) 855-1363 John Hornbeak (949) 640-8780 Mathew R. Spencer (414) 298-5053
Stephen Sihelnik (646) 855-1829
Barclays Capital Inc. International Strategy & Investment Group Inc. Standard & Poor’s
Ross L. Smotrich (212) 526-2306 George Auerbach (212) 446-9459 Roy Shepard (212) 438-1947 Michael R. Lewis (212) 526-3098 Steve Sakwa (212) 446-9462
Gwen Clark (212) 446-5611
Citigroup Global Markets Inc. JMP Securities – JMP Group, Inc. UBS Financial Services Inc.
Michael Bilerman (212) 816-1383 William C. Marks (415) 835-8944 Ross Nussbaum (212) 713-2484
Quentin Velleley (212) 816-6981 Whitney Stevenson (415) 835-8948 Gabriel Hilmoe (212) 713-3876 Emmanuel Korchman (212) 816-1382 Weina Hou (212) 713-4057
Cowen and Company, LLC J.P. Morgan Securities LLC James Sullivan (646) 562-1380 Anthony Paolone (212) 622-6682
Tom Catherwood (646) 562-1382 Joseph Dazio (212) 622-6416
Rating Agencies
Moody’s Investors Service Rating Standard & Poor’s Rating
Philip Kibel (212) 553-4569 Baa2 George Skoufis (212) 438-2608 BBB- Maria Maslovsky (212) 553-4831 Stable Outlook Jaime Gitler (212) 438-5049 Stable Outlook

ALEXANDRIA REAL ESTATE EQUITIES, INC.
June 30, 2013
ALEXANDRIA REAL ESTATE EQUITIES, INC. ALL RIGHTS RESERVED © 2013 11
Financial and Asset Base Highlights
(Dollars in thousands, except per share amounts)
(Unaudited)
Three Months Ended (unless stated otherwise)
Key Credit Metrics 6/30/13 3/31/13 12/31/12 9/30/12 6/30/12
Unencumbered NOI as a percentage of total NOI 70% 68% 71% 72% 72%
Percentage outstanding on unsecured senior line of credit at end of period 0% 37% 38% 28% 25% Net debt to gross assets at end of period 33% 39% 38% 38% 38%
Net debt to Adjusted EBITDA – quarter annualized 6.6x 7.8x 7.3x 7.6x 7.1x Net debt to Adjusted EBITDA – trailing 12 months 6.6x 7.7x 7.6x 7.5x 7.5x
Fixed charge coverage ratio – quarter annualized 2.8x 2.7x 2.8x 2.5x 2.6x
Fixed charge coverage ratio – trailing 12 months 2.7x 2.7x 2.6x 2.6x 2.7x Interest coverage ratio – quarter annualized 3.4x 3.3x 3.4x 3.1x 3.2x
Dividend payout ratio (common stock) 65% 55% 49% 50% 49%
Selected Balance Sheet Information – at end of period
Gross investments in real estate $7,331,578 $7,225,073 $7,299,613 $7,154,359 $7,030,723
Total assets $7,379.289 $7,090,919 $7,150,116 $6,965,017 $6,841,739 Total unsecured debt $2,248,395 $2,453,816 $2,465,805 $2,312,794 $2,278,783
Total debt $2,959,424 $3,184,530 $3,181,949 $3,032,114 $2,998,760
Net debt $2,626,305 $3,067,521 $3,001,031 $2,892,377 $2,875,926 Total liabilities $3,379,814 $3,595,638 $3,647,058 $3,448,397 $3,385,154
Common shares outstanding (in thousands) 70,997 63,317 63,245 63,161 62,250
Total market capitalization $8,005,581 $8,066,072 $7,953,348 $8,064,386 $7,912,286
Operating Data
Total revenues $ 154,235 $ 150,380 $ 151,554 $ 142,850 $ 145,593 Rental operations $ 46,323 $ 45,224 $ 46,176 $ 44,203 $ 42,102
Operating margins 70% 70% 70% 69% 71%
General and administrative expense as a percentage of total revenues 8.1% 7.7% 8.3% 8.7% 8.4% Capitalized interest $ 15,690 $ 14,021 $ 14,897 $ 16,763 $ 15,825
Weighted average interest rate used for capitalization during period 4.13% 3.97% 4.10% 4.35% 4.41%
Adjusted EBITDA – quarter annualized $ 399,708 $ 395,764 $ 408,876 $ 382,608 $ 403,168 Adjusted EBITDA – trailing 12 months $ 396,739 $ 397,606 $ 393,124 $ 385,393 $ 384,033
Adjusted EBITDA margins – quarter annualized 65% 66% 67% 67% 69%
Net Income, FFO, and AFFO
Net income attributable to Alexandria’s common stockholders – diluted $ 25,483 $ 22,442 $ 21,000 $ 10,646 (1) $ 17,616
FFO attributable to Alexandria’s common stockholders – diluted $ 71,023 $ 70,042 $ 70,905 $ 67,101 $ 69,964
FFO attributable to Alexandria’s common stockholders – diluted, as adjusted $ 71,571 $ 70,042 $ 72,936 $ 67,101 $ 65,790
AFFO attributable to Alexandria’s common stockholders – diluted $ 66,778 $ 67,965 $ 66,295 $ 65,016 $ 63,967
Per Share Data
Earnings per share – diluted $ 0.38 $ 0.36 $ 0.33 $ 0.17 (1) $ 0.29
FFO per share – diluted $ 1.06 $ 1.11 $ 1.12 $ 1.08 $ 1.13 FFO per share – diluted, as adjusted $ 1.07 $ 1.11 $ 1.16 $ 1.08 $ 1.07
AFFO per share – diluted $ 1.00 $ 1.08 $ 1.05 $ 1.04 $ 1.04
Asset Base Statistics – at end of period
Number of properties 173 174 179 178 183
Rentable square feet 17,035,097 17,075,268 17,521,772 17,101,966 17,385,572 Occupancy of operating properties 93.3% 93.0% 93.4% 93.0% 92.9%
Occupancy of operating and redevelopment properties 91.2% 90.1% 89.8% 88.3% 86.9%
Leasing Activity and Same Property Performance
Leasing activity – rentable square feet 767,935 702,901 677,781 732,094 959,295
Leasing activity – change in average new rental rates over expiring rates – cash basis 6.7% 5.9% (2.9%) (2.9%) (0.8%)
Leasing activity – change in average new rental rates over expiring rates – GAAP basis 12.7% 12.7% 2.6% 7.6% 5.8%
Same property – change in NOI over comparable quarter from prior year – cash basis 7.2% 8.8% 6.3% 4.3% 1.6%
Same property – change in NOI over comparable quarter from prior year – GAAP basis 3.2% 0.4% 0.7% (0.9%) (0.2%)
(1) Net income attributable to Alexandria’s common stockholders – diluted excluding $9.8 million, or $0.16 per share, impairment of real estate, was $20.4 million, or $0.33 per share.

CORE OPERATING METRICS

ALEXANDRIA REAL ESTATE EQUITIES, INC.
June 30, 2013
ALEXANDRIA REAL ESTATE EQUITIES, INC. ALL RIGHTS RESERVED © 2013 13
Core Operating Metrics
(Unaudited)
Quarterly percentage change in same property NOI
Percentage change in rental rates on renewed/re-leased space
Occupancy percentage
Solid leasing capabilities – rentable square feet leased (in thousands)
-1%
1%
3%
5%
7%
9%
2Q
01
2Q
02
2Q
03
2Q
04
2Q
05
2Q
06
2Q
07
2Q
08
2Q
09
2Q
10
2Q
11
2Q
12
2Q
13
GAAP Cash
-5%
0%
5%
10%
15%
2000 2001 2002 2003 2004 2005 2006 2007 2008 2009 2010 2011 2012 YTD 2Q13
GAAP Cash
30%
40%
50%
60%
70%
80%
90%
100%
2000 2001 2002 2003 2004 2005 2006 2007 2008 2009 2010 2011 2012 2Q13
Operating properties Operating and redevelopment properties
Average operating properties: 94.8% Average operating and redevelopment properties: 89.0%
845 942 926 785
1,146
1,519 1,588 1,583
2,161 1,864
2,744
3,407 3,281
1,471
0
500
1,000
1,500
2,000
2,500
3,000
3,500
4,000
2000 2001 2002 2003 2004 2005 2006 2007 2008 2009 2010 2011 2012 YTD 2Q13

ALEXANDRIA REAL ESTATE EQUITIES, INC.
June 30, 2013
ALEXANDRIA REAL ESTATE EQUITIES, INC. ALL RIGHTS RESERVED © 2013 14
Summary of Same Property Comparisons
(Dollars in thousands)
(Unaudited)
Three Months Ended Six Months Ended Same property data June 30, 2013 June 30, 2013
Percentage change in net operating income – cash basis 7.2% 8.3%
Percentage change in net operating income – GAAP basis 3.2% 2.0% Number of properties 137 135
Rentable square feet 11,182,003 11,032,453
Occupancy − current period 93.4% 93.1% Occupancy − same period prior year 92.5% 92.5%
The following table presents a comparison of the components of same property and non-same property NOI for the three months and six months ended June 30, 2013, compared to the three months and six months ended June 30, 2012, and a reconciliation of NOI to income from continuing operations, the most directly
comparable GAAP financial measure:
Three Months Ended June 30, Six Months Ended June 30, Revenues: 2013 2012 % Change 2013 2012 % Change
Rental – same properties $ 96,605 $ 92,794 4.1% $ 190,681 $ 185,022 3.1% Rental – non-same properties 18,138 11,535 57.2 35,838 20,508 74.8
Total rental – GAAP basis 114,743 104,329 10.0 226,519 205,530 10.2 Tenant recoveries – same properties 29,830 29,282 1.9 60,087 58,034 3.5 Tenant recoveries – non-same properties 6,093 2,599 134.4 11,447 5,729 99.8
Total tenant recoveries 35,923 31,881 12.7 71,534 63,763 12.2 Other income – same properties 203 24 745.8 323 82 293.9 Other income – non-same properties 3,366 9,359 (64.0) 6,239 11,929 (47.7)
Total other income 3,569 9,383 (62.0) 6,562 12,011 (45.4) Total revenues – same properties 126,638 122,100 3.7 251,091 243,138 3.3
Total revenues – non-same properties 27,597 23,493 17.5 53,524 38,166 40.2
Total revenues 154,235 145,593 5.9 304,615 281,304 8.3
Expenses: Rental operations – same properties 39,143 37,291 5.0 78,234 73,672 6.2 Rental operations – non-same properties 7,180 4,811 49.2 13,313 8,883 49.9
Total rental operations 46,323 42,102 10.0 91,547 82,555 10.9 Net operating income:
NOI – same properties 87,495 84,809 3.2 172,857 169,466 2.0 NOI – non-same properties 20,417 18,682 9.3 40,211 29,283 37.3
Total NOI – GAAP basis 107,912
103,491 4.3 213,068 198,749 7.2 Other expenses:
General and administrative 12,472 12,298 1.4 24,120 22,655 6.5 Interest 15,978 17,922 (10.8) 33,998 34,148 (0.4) Depreciation and amortization 46,580 50,741 (8.2) 92,645 92,527 0.1 Loss on early extinguishment of debt 560 1,602 (65.0) 560 2,225 (74.8)
Total other expenses 75,590 82,563 (8.4) 151,323 151,555 (0.2) Income from continuing operations $ 32,322 $ 20,928 54.4% $ 61,745 $ 47,194 30.8%
NOI – same properties – GAAP basis $ 87,495 $ 84,809 3.2% $ 172,857 $ 169,466 2.0% Less: straight-line rent adjustments (1,807 ) (4,897 ) (63.1) (2,306 ) (11,952 ) (80.7)
NOI – same properties – cash basis $ 85,688 $ 79,912 7.2% $ 170,551 $ 157,514 8.3%
The following table reconciles same properties to total properties for the six months ended June 30, 2013:
Development – active Properties Development – deliveries since January 1, 2012 Properties Properties
225 Binney Street 1 259 East Grand Avenue 1 Development – active 6
499 Illinois Street 1 400/450 East Jamie Court 2 Redevelopment – active 7
269 East Grand Avenue 1 Canada 1 (1) Development – deliveries 6 430 East 29th Street 1 4755 Nexus Center Drive 1 Redevelopment – deliveries 9
75/125 Binney Street 1 5200 Illumina Way 1 (1)
360 Longwood Avenue (JV) 1 6 Development/Redevelopment – Asia 7 (2)
6 Redevelopment – deliveries since January 1, 2012 Redevelopment – active 10300 Campus Point Drive 1 Acquisitions in North America since January 1, 2012
9800 Medical Center Drive 3 20 Walkup Drive 1 6 Davis Drive 1
1616 Eastlake Avenue 1 11119 North Torrey Pines Road 1 285 Bear Hill Road 1 3530/3550 John Hopkins Court 2 Properties held for sale 2
343 Oyster Point Boulevard 1 620 Professional Drive 1 Total properties excluded from same 38
4757 Nexus Center Drive 1 6275 Nancy Ridge Drive 1 properties
7 1551 Eastlake Avenue 1 400 Technology Square 1 Same properties 135
9 Total consolidated and unconsolidated
properties as of June 30, 2013 173
(1) These properties each represent multiple buildings, a portion of which are included in our same property results. As a result, 26,426 RSF and 127,373 RSF for
Canada and 5200 Illumina Way, respectively, have been excluded from our same property results. (2) Property count in Asia includes one development delivery, one property acquired since January 1, 2012, and five active development and redevelopment
properties.

ALEXANDRIA REAL ESTATE EQUITIES, INC.
June 30, 2013
ALEXANDRIA REAL ESTATE EQUITIES, INC. ALL RIGHTS RESERVED © 2013 15
Same Property Performance Historical Results
(Unaudited)
The charts below provide two alternative calculations of same property performance in comparison to our historical same property performance. Our reported same property
performance has been based upon a pool of operating assets and completed developed and redeveloped assets to the extent that those assets were operating for the entirety of the comparable
same property period presented. The alternative calculations presented below include 1) same property performance for the operating portfolio excluding assets that were recently developed or
redeveloped and 2) the same property performance for the operating portfolio including those assets that were either under active redevelopment or previously completed redevelopments. From
2008 through 2012, our same property performance was generally consistent in each of the three calculations. For the six months ended June 30, 2013, same property performance including
redevelopment properties, as shown in the table, would have been meaningfully higher than our traditional method of reporting same property performance. Same property performance
including redevelopment properties will, from time to time, have significant growth in net operating income as a result of the completion of the conversion of non-laboratory space (with lower
net operating income) to laboratory space (with higher net operating income) through redevelopment. We believe our traditional method of reporting same property performance is a more
useful presentation since it excludes the potential significant increases in performance as a result of completion of significant redevelopment projects.
Percentage change in same property NOI over preceding period - cash basis
2009 2010 2011 2012 YTD 2Q13
4.7% 1.5% 4.1% 3.5% 8.3%
3.6% 1.3% 4.0% 2.0% 6.7%
4.6% (1.1%) 6.4% 1.5% 10.6%
(2.0%)
0.0%
2.0%
4.0%
6.0%
8.0%
10.0%
12.0%
Percentage change in same property NOI over preceding period - GAAP basis
2009 2010 2011 2012 YTD 2Q13
2.8% 0.4% (0.6%) (0.5%) 2.0%
2.1% 0.7% (0.4%) (1.4%) 2.0%
4.6% (0.2%) 2.1% 0.9% 8.9%
(2.0%)
0.0%
2.0%
4.0%
6.0%
8.0%
10.0%
12.0%
NOI Included in All Comparative Periods
Operating Recently Completed Properties Under Active
Legend Properties Developments Redevelopments Development Redevelopment
Same Property Data As Reported Yes Yes (1) Yes (1) No No
Same Property Operating Portfolio Yes No No No No
Same Property Data Including Redevelopments Yes No Yes No Yes
(1) Recently delivered developments and redevelopments are included in the same property data in the periods after their completion only if the property was operating during the entire
same property periods. For example, projects completed in 2010 are included in 2012 vs. 2011 same property performance. Additionally, projects completed in 2011 are excluded
from the 2012 vs. 2011 same property performance but included in the six months ended June 30, 2013, vs. six months ended June 30, 2012, same property performance.

ALEXANDRIA REAL ESTATE EQUITIES, INC.
June 30, 2013
ALEXANDRIA REAL ESTATE EQUITIES, INC. ALL RIGHTS RESERVED © 2013 16
Summary of Leasing Activity
(Unaudited)
Three Months Ended Six Months Ended Year Ended June 30, 2013 June 30, 2013 December 31, 2012
Leasing activity: Cash GAAP Cash GAAP Cash GAAP
Renewed/re-leased space
Rental rate changes 6.7% 12.7% 6.5% 12.7% (2.0%) 5.2% New rates $33.22 $33.61 $32.65 $33.00 $29.86 $30.36
Expiring rates $31.12 $29.82 $30.66 $29.28 $30.47 $28.87 Rentable square footage 331,043 486,924 1,475,403
Number of leases 33 50 102
TI’s/lease commissions per square foot $9.03 $7.95 $6.22 Average lease terms 4.8 years 4.1 years 4.7 years
Developed/redeveloped/previously vacant space leased New rates $46.73 $54.11 $49.04 $53.24 $30.66 $32.56
Rentable square footage 436,892 983,912 1,805,693
Number of leases 33 58 85 TI’s/lease commissions per square foot $31.40 $18.12 $11.02
Average lease terms 11.2 years 10.7 years 9.0 years
Leasing activity summary:
Totals (1)
New rates $40.91 $45.27 $43.62 $46.54 $30.30 $31.57 Rentable square footage 767,935 1,470,836 3,281,096
Number of leases 66 108 187
TI’s/lease commissions per square foot $21.76 $14.75 $8.87 Average lease terms 8.4 years 8.6 years 7.1 years
Lease expirations Expiring rates $31.15 $29.86 $31.44 $29.42 $30.03 $27.65
Rentable square footage 440,712 747,722 2,350,348
Number of leases 50 81 162
(1) Excludes 10 month-to-month leases for 37,011 RSF at June 30, 2013.
During the three months ended June 30, 2013, we granted tenant concessions/free rent averaging approximately 1.8 months with respect to the 767,935 RSF
leased. During the six months ended June 30, 2013, we granted tenant concessions/free rent averaging approximately 1.8 months with respect to the 1,470,836 RSF
leased.
Lease Structure June 30, 2013
Percentage of triple net leases 94%
Percentage of leases containing annual rent escalations 95%
Percentage of leases providing for the recapture of capital expenditures
92%
The following chart presents our total RSF leased (in thousands) by development/redevelopment/previously vacant space and renewed/re-leased space:
1,254 1,188 1,778 1,822
1,475
487
907 676
966
1,585 1,806
984
0
500
1,000
1,500
2,000
2,500
3,000
3,500
4,000
2008 2009 2010 2011 2012 YTD 6/30/13
2,744
1,864 2,161
3,407 3,281
1,471
Renewed/Re-Leased Space
Leased
Developed/Redeveloped/Previously Vacant Space Leased

ALEXANDRIA REAL ESTATE EQUITIES, INC.
June 30, 2013
ALEXANDRIA REAL ESTATE EQUITIES, INC. ALL RIGHTS RESERVED © 2013 17
Summary of Lease Expirations
(Unaudited)
Year of Lease Expiration
Number of Leases Expiring
RSF of Expiring Leases Percentage of
Aggregate Total RSF Annualized Base Rent of
Expiring Leases (per RSF)
2013 43 (1) 410,254 (1) 3.0% $31.83
2014 102 1,176,749 8.6% $28.93 2015 77 1,411,738 10.3% $32.45
2016 66 1,413,108 10.3% $30.38
2017 64 1,585,740 11.5% $30.67 2018 36 1,296,499 9.4% $39.48
2019 24 690,566 5.0% $32.83
2020 17 789,909 5.8% $39.93 2021 20 828,009 6.0% $37.02
2022 16 567,703 4.1% $29.32
Thereafter 29 2,318,276 16.9% $39.73
Annualized 2013 RSF of Expiring Leases Base Rent of
Negotiating/ Targeted for Remaining Expiring Leases
Market Leased Anticipating Redevelopment Expiring Leases Total (per RSF)
Greater Boston 47,160 21,396 – 33,620 102,176 $ 38.04 San Francisco Bay Area 12,313 16,818 – 36,003 65,134 22.13
San Diego – – – 34,013 34,013 29.51
Greater NYC – – – – – – Suburban Washington, D.C. – 114,568 (2) – 54,352 168,920 34.53
Seattle – 1,350 – 9,574 10,924 27.46
Research Triangle Park – 16,587 – 1,603 18,190 25.24 Canada – – – – – –
Non-cluster markets – 3,508 – 1,000 4,508 12.35
Asia – 4,069 – 2,320 6,389 12.00 (3)
Total 59,473 178,296 – 172,485 410,254 (1) $ 31.83
Percentage of expiring leases 15 % 43 % – % 42 % 100 %
Annualized
2014 RSF of Expiring Leases Base Rent of
Negotiating/ Targeted for Remaining Expiring Leases
Market Leased Anticipating Redevelopment Expiring Leases Total (per RSF)
Greater Boston – 87,516 – 237,327 324,843 $ 38.03
San Francisco Bay Area 19,291 31,760 – 280,164 331,215 27.08 San Diego – – – 52,153 52,153 23.25
Greater NYC – 48,281 – 42,487 90,768 38.65
Suburban Washington, D.C. – 8,319 85,297 (4) 74,017 167,633 19.18 Seattle – 13,401 – 9,571 22,972 43.57
Research Triangle Park – 10,527 – 45,812 56,339 22.91
Canada – – – 81,870 81,870 21.51 Non-cluster markets – – – 22,407 22,407 18.35
Asia – 15,760 – 10,789 26,549 11.89 (3)
Total 19,291 215,564 85,297 856,597 1,176,749 $ 28.93
Percentage of expiring leases 2 % 18 % 7 % 73 % 100 %
(1) Excludes 10 month-to-month leases for approximately 37,011 RSF. (2) Includes approximately 55,000 RSF at 5 Research Court. We expect the tenant to extend their lease beyond their 2013 lease expiration date. This
property consists of non-laboratory space and upon rollover will likely undergo conversion into laboratory space through redevelopment subsequent to
the final lease expiration.
(3) Expirations relate to two properties with an average investment of $101 per RSF.
(4) Represents projects containing approximately 60,000 RSF and 25,000 RSF at 930 Clopper Road and 1500 East Gude Drive, respectively, which we
expect to convert from non-laboratory space to laboratory space through redevelopment.

ALEXANDRIA REAL ESTATE EQUITIES, INC.
June 30, 2013
ALEXANDRIA REAL ESTATE EQUITIES, INC. ALL RIGHTS RESERVED © 2013 18
Summary of Properties and Occupancy
(Unaudited)
Summary of properties
Rentable Square Feet Number of Annualized Base Rent Market Operating Development Redevelopment Total % Total Properties (dollars in thousands) Greater Boston 3,093,019 691,487 26,270 3,810,776 22% 36 $ 119,616
27% San Francisco Bay Area 2,504,258 330,030 36,473 2,870,761 17 26 95,849
22
San Diego 2,575,382 − 68,423 2,643,805 16 33 84,267
20
Greater NYC 494,656 419,806 − 914,462 5 6 32,048
7 Suburban Washington,
D.C.
2,088,291 − 67,055 2,155,346 13 29 43,627
10 Seattle 720,496 − 26,020 746,516 4 10 29,170
7 Research Triangle Park 941,807 − − 941,807 6 14
18,764
4 Canada 1,103,507 − − 1,103,507 7 5 9,397
2 Non-cluster markets 61,002 − − 61,002 − 2 609
−
North America 13,582,418 1,441,323 224,241 15,247,982 90 161 433,347
99 Asia 617,602 618,976 85,728 1,322,306 8 9 4,736
1 Continuing operations 14,200,020 2,060,299 309,969 16,570,288 98 170 $ 438,083
100%
Discontinued operations 51,273 − − 51,273 − 2 −
Consolidated 14,251,293 2,060,299 309,969 16,621,561 98 172 $ 438,083
Greater Boston - unconsolidated − 413,536 − 413,536 2 1 Total consolidated and
unconsolidated 14,251,293 2,473,835 309,969 17,035,097 100% 173
Summary of occupancy percentages Operating Properties Operating and Redevelopment Properties
Market June 30, 2013 March 31, 2013 June 30, 2012 June 30, 2013 March 31, 2013 June 30, 2012
Greater Boston 95.5% 95.8% 93.1% 94.7% 93.5% 84.1%
San Francisco Bay Area 97.3 95.8 97.0 95.9 93.8 94.7
San Diego 94.2 93.4 95.5 91.7 91.0 85.5
Greater NYC 98.4 98.4 94.2 98.4 98.4 94.2
Suburban Washington, D.C. 92.3 90.8 90.1 89.4 88.0 86.3
Seattle 93.1 (1) 96.7 96.1 89.9 88.2 90.8
Research Triangle Park 91.4 (2) 93.6 95.5 91.4 93.6 95.5
Canada 96.8 94.7 92.7 96.8 94.7 92.7
Non-cluster markets 54.0 54.0 51.4 54.0 54.0 51.4
North America 94.6 94.2 93.9 92.9 91.8 88.4
Asia 68.1 67.1 67.4 59.8 57.7 55.0
Continuing operations 93.3% 93.0% 92.9% 91.2% 90.1% 86.9%
(1) Decrease primarily attributable to the delivery of 39,661 vacant RSF at our redevelopment project at 1551 Eastlake Avenue in the Lake Union submarket. Excluding this delivery, the occupancy percentage of operating properties was 98.5%.
(2) We anticipate an increase in occupancy during the fourth quarter of 2013.

ALEXANDRIA REAL ESTATE EQUITIES, INC.
June 30, 2013
ALEXANDRIA REAL ESTATE EQUITIES, INC. ALL RIGHTS RESERVED © 2013 19
Top 20 Client Tenants and Client Tenant Mix
(Dollars in thousands)
(Unaudited)
Top 20 client tenants
Client Tenant
Number of Leases
Remaining
Lease Term in Years (1)
Aggregate
Rentable Square Feet
Percentage of
Aggregate
Total Square Feet
Annualized Base Rent
Percentage of
Aggregate
Annualized Base Rent
Investment-Grade
Client Tenants
Education/ Research
Fitch Rating
Moody’s Rating
S&P Rating
1 Novartis AG 13 3.7 635,917 3.8% $ 31,993 7.3% AA Aa3 AA- −
2 Illumina, Inc. 1 18.3 497,078 3.0 19,531 4.5 − − − − 3 Bristol-Myers Squibb Company 6 4.6 419,624 2.5 15,840 3.6 A- A2 A+ −
4 Eli Lilly and Company 6 9.7 290,132 1.7 15,563 3.6 A A2 AA- −
5 FibroGen, Inc. 1 10.4 234,249 1.4 14,197 3.3 − − − − 6 Roche 3 4.8 348,918 2.1 13,867 3.2 AA A1 AA −
7 United States Government 9 4.8 332,578 2.0 13,119 3.0 AAA Aaa AA+ −
8 GlaxoSmithKline plc 5 6.1 208,394 1.3 10,187 2.3 A+ A1 A+ − 9 Celgene Corporation 3 8.1 250,586 1.5 9,340 2.1 − Baa2 BBB+ −
10 Onyx Pharmaceuticals, Inc. 2 9.0 228,373 1.4 8,498 1.9 − − − −
11 Massachusetts Institute of Technology 4 3.8 185,403 1.1 8,496 1.9 − Aaa AAA 12 NYU-Neuroscience Translational
Research Institute 2 10.5 86,756 0.5 8,012 1.8 − Aa3 AA- 13 The Regents of the University of
California 3 8.2 188,654 1.1 7,787 1.8 AA Aa1 AA 14 Alnylam Pharmaceuticals, Inc. 1 3.3 129,424 0.8 6,081 1.4 − − − −
15 Gilead Sciences, Inc. 1 7.0 109,969 0.7 5,824 1.3 − Baa1 A- − 16 Pfizer Inc. 2 5.7 116,518 0.7 5,502 1.3 A+ A1 AA −
17 The Scripps Research Institute 2 3.4 101,775 0.6 5,200 1.2 AA- Aa3 − 18 Theravance, Inc. (2) 2 6.9 130,342 0.8 4,895 1.1 − − − − 19 Infinity Pharmaceuticals, Inc. 2 1.6 68,020 0.4 4,423 1.0 − − − −
20 Quest Diagnostics Incorporated 1 3.5 248,186 1.5 4,341 1.0 BBB+ Baa2 BBB+ −
Total/weighted average top 20 69 7.3 4,810,896 28.9% $ 212,696 48.6%
(1) Represents remaining lease term in years based on percentage of aggregate annualized base rent in effect as of June 30, 2013. (2) As of April 25, 2013, GlaxoSmithKline plc owned approximately 27% of the outstanding stock of Theravance, Inc.
Client tenant mix by annualized base rent
Investment-Grade Client Tenants
Represent 46% of Alexandria’s
Total Annualized Base Rent at 2Q13
Multinational Pharmaceutical
Institutional: University,
Non-Profit, and Government
Life Science Product and Service,
Medical Device, and Industrial Biotech Biotechnology: Public & Private
Astellas Pharma Inc.
AstraZeneca PLC
Bayer AG
Bristol-Myers Squibb Company
Eisai Co., Ltd.
Eli Lilly and Company
Genomics Institute of the Novartis
Research Foundation
GlaxoSmithKline plc
Novartis AG
Pfizer Inc.
Roche
Sanofi
Shire plc
UCB S.A.
California Institute of Technology
Dana-Farber Cancer Institute, Inc.
Duke University
Environmental Protection Agency
Fred Hutchinson Cancer Research
Center
Massachusetts Institute of Technology
National Institutes of Health
NYU-Neuroscience Translational
Research Institute
Sanford-Burnham Medical Research
Institute
Stanford University
The Regents of the University of California
The Scripps Research Institute
UMass Memorial Health Care, Inc.
UNC Health Care System
United States Government
University of Washington
Aramco Services Company, Inc.
Canon U.S. Life Sciences, Inc.
Covance Inc.
DSM N.V.
Fluidigm Corporation
Illumina, Inc.
Laboratory Corporation of America
Holdings
Life Technologies Corporation
Monsanto Company
Qiagen N.V.
Quest Diagnostics Incorporated
Sapphire Energy, Inc.
Thermo Fisher Scientific, Inc.
Alnylam Pharmaceuticals, Inc.
Amgen Inc.
ARIAD Pharmaceuticals, Inc.
Biogen Idec Inc.
Celgene Corporation
Constellation Pharmaceuticals, Inc.
Epizyme, Inc.
Fate Therapeutics, Inc.
FibroGen, Inc.
FORMA Therapeutics, Inc.
Gilead Sciences, Inc.
Infinity Pharmaceuticals, Inc.
Kadmon Corporation, LLC
Medicago Inc.
Nektar Therapeutics
Onyx Pharmaceuticals, Inc.
Proteostasis Therapeutics, Inc.
Quanticel Pharmaceuticals, Inc.
Theravance, Inc.
Warp Drive Bio, LLC

ALEXANDRIA REAL ESTATE EQUITIES, INC.
June 30, 2013
ALEXANDRIA REAL ESTATE EQUITIES, INC. ALL RIGHTS RESERVED © 2013 20
Property Listing (Dollars in thousands)
(Unaudited)
Submarket
Occupancy Percentage
Rentable Square Feet Number of Annualized Operating and
Address Operating Development Redevelopment Total Properties Base Rent Operating Redevelopment
Greater Boston
100 Technology Square Cambridge/Inner Suburbs 255,441 − − 255,441 1 $ 17,369 100.0% 100.0%
200 Technology Square Cambridge/Inner Suburbs 177,101 − − 177,101 1 10,569 100.0 100.0
300 Technology Square Cambridge/Inner Suburbs 175,609 − − 175,609 1 8,611 100.0 100.0
400 Technology Square Cambridge/Inner Suburbs 212,124 − − 212,124 1 9,928 85.7 85.7
500 Technology Square Cambridge/Inner Suburbs 184,207 − − 184,207 1 10,159 100.0 100.0
600 Technology Square Cambridge/Inner Suburbs 128,224 − − 128,224 1 4,474 99.6 99.6
700 Technology Square Cambridge/Inner Suburbs 48,930 − − 48,930 1 1,584 82.4 82.4
161 First Street Cambridge/Inner Suburbs 46,356 − − 46,356 1 2,083 100.0 100.0
167 Sidney Street Cambridge/Inner Suburbs 26,589 − − 26,589 1 1,392 100.0 100.0
215 First Street Cambridge/Inner Suburbs 366,719 − − 366,719 1 11,038 89.5 89.5
225 Binney Street Cambridge/Inner Suburbs − 305,212 − 305,212 1 − N/A N/A
75/125 Binney Street Cambridge/Inner Suburbs − 386,275 − 386,275 1 − N/A N/A
300 Third Street Cambridge/Inner Suburbs 131,963 − − 131,963 1 6,534 100.0 100.0
480 Arsenal Street Cambridge/Inner Suburbs 140,744 − − 140,744 1 4,644 100.0 100.0
500 Arsenal Street Cambridge/Inner Suburbs 93,516 − − 93,516 1 3,402 100.0 100.0
780/790 Memorial Drive Cambridge/Inner Suburbs 99,350 − − 99,350 2 6,674 100.0 100.0
79/96 Charlestown Navy Yard Cambridge/Inner Suburbs 25,309 − − 25,309 1 620 100.0 100.0
99 Erie Street Cambridge/Inner Suburbs 27,960 − − 27,960 1 1,143 100.0 100.0
100 Beaver Street Route 128 82,330 − − 82,330 1 1,949 85.7 85.7
285 Bear Hill Road Route 128 − − 26,270 26,270 1 − N/A −
19 Presidential Way Route 128 128,325 − − 128,325 1 3,398 100.0 100.0
29 Hartwell Avenue Route 128 59,000 − − 59,000 1 2,049 100.0 100.0
3 Preston Court Route 128 30,123 − − 30,123 1 395 44.4 44.4
35 Hartwell Avenue Route 128 46,700 − − 46,700 1 1,650 100.0 100.0
35 Wiggins Avenue Route 128 48,640 − − 48,640 1 878 100.0 100.0
44 Hartwell Avenue Route 128 26,828 − − 26,828 1 − − −
45/47 Wiggins Avenue Route 128 38,000 − − 38,000 1 1,114 100.0 100.0
60 Westview Street Route 128 40,200 − − 40,200 1 1,147 100.0 100.0
6/8 Preston Court Route 128 54,391 − − 54,391 1 752 100.0 100.0
111 Forbes Boulevard Route 495/Worcester 58,280 − − 58,280 1 544 100.0 100.0
130 Forbes Boulevard Route 495/Worcester 97,566 − − 97,566 1 871 100.0 100.0
20 Walkup Drive Route 495/Worcester 91,045 − − 91,045 1 649 100.0 100.0
30 Bearfoot Road Route 495/Worcester 60,759 − − 60,759 1 2,765 100.0 100.0
306 Belmont Street Route 495/Worcester 78,916 − − 78,916 1 1,139 100.0 100.0
350 Plantation Street Route 495/Worcester 11,774 − − 11,774 1 92 42.5 42.5
Greater Boston 3,093,019 691,487 26,270 3,810,776 36 $ 119,616 95.5% 94.7%
San Francisco Bay Area
1500 Owens Street Mission Bay 158,267 − − 158,267 1 $ 7,029 97.8% 97.8%
1700 Owens Street Mission Bay 157,340 − − 157,340 1 9,102 99.9 99.9
455 Mission Bay Boulevard South Mission Bay 210,398 − − 210,398 1 8,241 97.8 97.8
409/499 Illinois Street Mission Bay 234,249 222,780 − 457,029 2 14,197 100.0 100.0
249/259 East Grand Avenue South San Francisco 300,119 − − 300,119 2 11,473 100.0 100.0
269 East Grand Avenue South San Francisco − 107,250 − 107,250 1 − N/A N/A
341/343 Oyster Point Boulevard South San Francisco 71,487 − 36,473 107,960 2 1,740 100.0 66.2
400/450 East Jamie Court South San Francisco 163,035 − − 163,035 2 5,249 100.0 100.0
500 Forbes Boulevard South San Francisco 155,685 − − 155,685 1 5,540 100.0 100.0
600/630/650 Gateway Boulevard South San Francisco 150,960 − − 150,960 3 3,762 91.0 91.0
681 Gateway Boulevard South San Francisco 126,971 − − 126,971 1 6,161 100.0 100.0
7000 Shoreline Court South San Francisco 136,395 − − 136,395 1 4,252 99.7 99.7
901/951 Gateway Boulevard South San Francisco 170,244 − − 170,244 2 5,276 88.3 88.3
2425 Garcia Avenue &
2400/2450 Bayshore Parkway Peninsula
98,964 − − 98,964 1 3,035 88.2 88.2
2625/2627/2631 Hanover Street Peninsula 32,074 − − 32,074 1 872 65.7 65.7
3165 Porter Drive Peninsula 91,644 − − 91,644 1 3,884 100.0 100.0
3350 West Bayshore Road Peninsula 60,000 − − 60,000 1 1,817 100.0 100.0
75/125 Shoreway Road Peninsula 82,815 − − 82,815 1 1,996 100.0 100.0
849/863 Mitten Road &
866 Malcolm Road Peninsula 103,611 − − 103,611 1 2,223
96.8 96.8
San Francisco Bay Area 2,504,258 330,030 36,473 2,870,761 26 $ 95,849 97.3% 95.9%

ALEXANDRIA REAL ESTATE EQUITIES, INC.
June 30, 2013
ALEXANDRIA REAL ESTATE EQUITIES, INC. ALL RIGHTS RESERVED © 2013 21
Property Listing (Dollars in thousands)
(Unaudited)
Occupancy Percentage
Rentable Square Feet Number of Annualized Operating and
Address
Submarket
Operating Development Redevelopment Total Properties Base Rent Operating Redevelopment
San Diego
10931/10933 North Torrey Pines Rd Torrey Pines 96,641 − − 96,641 1 $ 3,084 95.7% 95.7%
10975 North Torrey Pines Road Torrey Pines 44,733 − − 44,733 1 1,595 100.0 100.0
11119 North Torrey Pines Road Torrey Pines 72,506 − − 72,506 1 1,577 63.5 63.5
3010 Science Park Road Torrey Pines 74,557 − − 74,557 1 3,215 100.0 100.0
3115/3215 Merryfield Row Torrey Pines 158,645 − − 158,645 2 7,125 100.0 100.0
3530/3550 John Hopkins Court &
3535/3565 General Atomics Court
Torrey Pines
241,191 − − 241,191 4 7,815 96.3 96.3
10300 Campus Point Drive University Town Center 449,759 − − 449,759 1 15,783 96.1 96.1
4755/4757/4767 Nexus Center Drive University Town Center 110,535 − 68,423 178,958 3 4,252 100.0 61.8
5200 Illumina Way University Town Center 497,078 − − 497,078 1 19,531 100.0 100.0
9363/9373/9393 Towne Centre Drive University Town Center 138,578 − − 138,578 3 3,559 95.3 95.3
9880 Campus Point Drive University Town Center 71,510 − − 71,510 1 2,774 100.0 100.0
5810/5820 Nancy Ridge Drive Sorrento Mesa 87,298 − − 87,298 1 1,204 55.2 55.2
5871 Oberlin Drive Sorrento Mesa 33,817 − − 33,817 1 973 100.0 100.0
6138/6150 Nancy Ridge Drive Sorrento Mesa 56,698 − − 56,698 1 1,586 100.0 100.0
6175/6225/6275 Nancy Ridge Drive Sorrento Mesa 105,812 − − 105,812 3 1,202 55.5 55.5
7330 Carroll Road Sorrento Mesa 66,244 − − 66,244 1 2,341 100.0 100.0
10505 Roselle Street &
3770 Tansy Street
Sorrento Valley
33,013 − − 33,013 2 1,001 100.0 100.0
11025/11035/11045 Roselle Street Sorrento Valley 66,442 − − 66,442 3 1,621 100.0 100.0
3985 Sorrento Valley Boulevard Sorrento Valley 60,545 − − 60,545 1 1,534 100.0 100.0
13112 Evening Creek Drive I-15 Corridor 109,780 − − 109,780 1 2,495 100.0 100.0
San Diego 2,575,382 − 68,423 2,643,805 33 $ 84,267 94.2% 91.7%
Greater NYC
430/450 East 29th Street Manhattan 309,141 419,806 − 728,947 2 $ 25,481 99.8% 99.8%
100 Phillips Parkway Bergen County 78,501 − − 78,501 1 2,213 90.8 90.8
102 Witmer Road Pennsylvania 50,000 − − 50,000 1 3,345 100.0 100.0
5100 Campus Drive Pennsylvania 21,859 − − 21,859 1 274 100.0 100.0
701 Veterans Circle Pennsylvania 35,155 − − 35,155 1 735 100.0 100.0
Greater NYC 494,656 419,806 − 914,462 6 $ 32,048 98.4% 98.4%
Suburban Washington, D.C.
12301 Parklawn Drive Rockville 49,185 − − 49,185 1 $ 1,169 100.0% 100.0%
1330 Piccard Drive Rockville 131,511 − − 131,511 1 2,877 94.0 94.0
1405 Research Boulevard Rockville 71,669 − − 71,669 1 2,119 100.0 100.0
1500/1550 East Gude Drive (1) Rockville 90,489 − − 90,489 2 1,511 90.5 90.5
14920 Broschart Road Rockville 48,500 − − 48,500 1 1,073 100.0 100.0
15010 Broschart Road Rockville 38,203 − − 38,203 1 741 85.8 85.8
5 Research Court Rockville 54,906 − − 54,906 1 1,425 100.0 100.0
5 Research Place Rockville 63,852 − − 63,852 1 2,364 100.0 100.0
9800 Medical Center Drive Rockville 214,531 − 67,055 281,586 4 7,354 90.0 68.6
9920 Medical Center Drive Rockville 58,733 − − 58,733 1 455 100.0 100.0
1300 Quince Orchard Road Gaithersburg 54,874 − − 54,874 1 997 100.0 100.0
16020 Industrial Drive Gaithersburg 71,000 − − 71,000 1 1,048 100.0 100.0
19/20/22 Firstfield Road Gaithersburg 132,639 − − 132,639 3 3,103 93.6 93.6
401 Professional Drive Gaithersburg 63,154 − − 63,154 1 1,063 88.7 88.7
620 Professional Drive Gaithersburg 27,950 − − 27,950 1 495 100.0 100.0
708 Quince Orchard Road Gaithersburg 49,624 − − 49,624 1 1,145 99.3 99.3
9 West Watkins Mill Road Gaithersburg 92,449 − − 92,449 1 2,766 100.0 100.0
910 Clopper Road Gaithersburg 180,650 − − 180,650 1 3,343 91.3 91.3
930/940 Clopper Road (2) Gaithersburg 104,302 − − 104,302 2 1,654 93.4 93.4
950 Wind River Lane Gaithersburg 50,000 − − 50,000 1 1,082 100.0 100.0
8000/9000/10000 Virginia Manor Rd Beltsville 191,884 − − 191,884 1 1,502 58.8 58.8
14225 Newbrook Drive Northern Virginia 248,186 − − 248,186 1 4,341 100.0 100.0
Suburban Washington, D.C.
2,088,291 − 67,055 2,155,346 29 $ 43,627 92.3% 89.4%
(1) Includes 25,000 RSF of non-laboratory space, which we intend to convert into laboratory space through redevelopment in 2014.
(2) Includes 60,000 RSF of non-laboratory space, which we intend to convert into laboratory space through redevelopment in 2014.

ALEXANDRIA REAL ESTATE EQUITIES, INC.
June 30, 2013
ALEXANDRIA REAL ESTATE EQUITIES, INC. ALL RIGHTS RESERVED © 2013 22
Property Listing (Dollars in thousands)
(Unaudited)
Submarket
Occupancy Percentage
Rentable Square Feet Number of Annualized Operating and
Address Operating Development Redevelopment Total Properties Base Rent Operating Redevelopment
Seattle
1201/1208 Eastlake Avenue Lake Union 203,369 − − 203,369 2 $ 8,748 100.0% 100.0%
1551 Eastlake Avenue Lake Union 117,482 − − 117,482 1 2,322 66.2 66.2
1600 Fairview Avenue Lake Union 27,991 − − 27,991 1 1,569 100.0 100.0
1616 Eastlake Avenue Lake Union 142,688 − 26,020 168,708 1 6,083 96.8 81.9
199 East Blaine Street Lake Union 115,084 − − 115,084 1 6,163 100.0 100.0
219 Terry Avenue North Lake Union 30,961 − − 30,961 1 1,490 99.2 99.2
3000/3018 Western Avenue Elliott Bay 47,746 − − 47,746 1 1,839 100.0 100.0
410 West Harrison Street &
410 Elliott Avenue West Elliott Bay
35,175 − − 35,175
2 956 85.2 85.2
Seattle 720,496 − 26,020 746,516 10 $ 29,170 93.1% 89.9%
Research Triangle Park
100 Capitola Drive Research Triangle Park 65,965 − − 65,965 1 $ 1,065 100.0% 100.0%
108/110/112/114 Alexander Drive Research Triangle Park 158,417 − − 158,417 1 4,996 100.0 100.0
2525 East NC Highway 54 Research Triangle Park 81,580 − − 81,580 1 1,673 100.0 100.0
5 Triangle Drive Research Triangle Park 32,120 − − 32,120 1 824 100.0 100.0
601 Keystone Park Drive Research Triangle Park 77,395 − − 77,395 1 1,309 100.0 100.0
6101 Quadrangle Drive Research Triangle Park 30,122 − − 30,122 1 445 79.1 79.1
7 Triangle Drive Research Triangle Park 96,626 − − 96,626 1 3,157 100.0 100.0
7010/7020/7030 Kit Creek Road Research Triangle Park 133,654 − − 133,654 3 1,707 70.0 70.0
800/801 Capitola Drive Research Triangle Park 120,905 − − 120,905 2 1,912 87.6 87.6
6 Davis Drive Research Triangle Park 100,000 − − 100,000 1 1,062 100.0 100.0
555 Heritage Drive Palm Beach 45,023 − − 45,023 1 614 55.9 55.9
Research Triangle Park 941,807 − − 941,807 14 $ 18,764 91.4% 91.4%
Canada
Canada 46,032 − − 46,032 1 $ 1,823 100.0% 100.0%
Canada 66,000 − − 66,000 1 1,193 100.0 100.0
Canada 142,935 − − 142,935 1 3,259 92.8 92.8
Canada 68,000 − − 68,000 1 3,122 100.0 100.0
Canada (1) 780,540 − − 780,540 1 − N/A N/A
Total Canada
1,103,507 − − 1,103,507 5 $ 9,397 96.8% 96.8%
Non-cluster markets 61,002 − − 61,002 2 $ 609 54.0% 54.0%
North America 13,582,418 1,441,323 224,241 15,247,982 161 $ 433,347 94.6% 92.9%
Asia 617,602 618,976 85,728 1,322,306 9 $ 4,736 68.1% 59.8%
Continuing operations 14,200,020 2,060,299 309,969 16,570,288 170 $ 438,083 93.3% 91.2%
Properties “held for sale” 51,273 − − 51,273 2
Total consolidated 14,251,293 2,060,299 309,969 16,621,561 172
Greater Boston
Investment in unconsolidated JV –
360 Longwood Avenue Longwood − 413,536 − 413,536 1
Total consolidated and unconsolidated 14,251,293 2,473,835 309,969 17,035,097 173
(1) Represents land and improvements subject to a ground lease with a client tenant.

VALUE-ADDED OPPORTUNITIES AND EXTERNAL GROWTH

ALEXANDRIA REAL ESTATE EQUITIES, INC.
June 30, 2013
ALEXANDRIA REAL ESTATE EQUITIES, INC. ALL RIGHTS RESERVED © 2013 24
Summary of Investments in Real Estate
(Dollars in thousands, except per square foot amounts)
(Unaudited)
Summary of investments in real estate
June 30, 2013 March 31, 2013
Book Value Square Feet
Cost per Square
Foot Book Value Square Feet
Cost per
Square Foot
Rental properties:
Land (related to rental properties) $ 512,915 $ 516,957 Buildings and building improvements 5,006,987 4,955,207
Other improvements 166,894 163,864
Rental properties 5,686,796 14,251,293 $ 399 5,636,028 14,168,626 $ 398 Less: accumulated depreciation (878,199) (849,891)
Rental properties, net 4,808,597 4,786,137
Construction in progress (“CIP”)/current value-added projects:
Active development in North America 673,461 1,441,323 467 579,273 1,441,323 402
Investment in unconsolidated JV 33,838 (1) 413,536 (1) 30,730 413,536 (1) Active redevelopment in North America 104,994 224,241 468 141,470 331,380 427
Active development and redevelopment in Asia 98,949 704,704 140 101,357 718,119 141
Generic infrastructure/building improvement projects in North America 53,333 (2) 62,869
964,575 2,783,804 346 915,699 2,904,358 315
Subtotal 5,773,172 17,035,097 339 5,701,836 17,072,984 334
Land/future value-added projects: Land undergoing predevelopment activities (CIP) in North America (3) 313,498 1,917,667 163 305,300 1,917,667 159
Land held for future development in North America 211,292 3,531,843 60 238,933 3,792,181 63
Land held for future development /undergoing predevelopment activities (CIP) in Asia 79,105 6,828,864
12 83,735 6,828,864 12
Land subject to sale negotiations 76,312 458,724 166 45,378 399,888 113
680,207 12,737,098 53 673,346 12,938,600 52
Investments in real estate, net 6,453,379 29,772,195 $ 217 6,375,182 30,011,584 $ 212
Add: accumulated depreciation 878,199 849,891
Gross investments in real estate (3) $ 7,331,578 29,772,195 $ 7,225,073 30,011,584
(1) The book value for this unconsolidated joint venture represents our equity investment in the project. The gross investment in real estate at the joint venture level
was approximately $408 and $359 per square foot as of June 30, 2013, and March 31, 2013, respectively.
(2) Represents the book value associated with approximately 96,372 square feet at four projects undergoing construction of generic laboratory improvements, of which approximately 81% was leased, but not delivered, as of June 30, 2013.
(3) In addition to assets included in our gross investment in real estate, we hold options/rights for parcels supporting the future ground-up development of approximately 420,000 RSF in Alexandria CenterTM for Life Science - New York City related to an option under our ground lease. Also, our asset base contains
additional embedded development opportunities aggregating approximately 715,000 RSF which represents additional development and expansion rights related to
existing rental properties.
Non-income-producing real estate assets as a percentage of gross investments in real estate
5% 7% 5% 4% 3%
11% 9% 8% 7%
5%
14% 9%
11% 12% 13%
0%
10%
20%
30%
40%
12/31/2009 12/31/2010 12/31/2011 12/31/2012 6/30/2013 12/31/2013 (Projected)
Predevelopment Land held for future development
Active development/redevelopment
30%
Projected
25% 24% 23% 21%
15-17%

ALEXANDRIA REAL ESTATE EQUITIES, INC.
June 30, 2013
ALEXANDRIA REAL ESTATE EQUITIES, INC. ALL RIGHTS RESERVED © 2013 25
Summary of Capital Expenditures
(Dollars in thousands, except per square foot amounts)
(Unaudited)
Projected
Projected construction spending
Six Months Ended
December 31, 2013 Thereafter
Development projects – North America $ 202,148 $ 340,612 Redevelopment projects – North America 27,562 10,451
Development and redevelopment projects – Asia 14,185 37,798
Future value-added construction projects 41,237 (1) TBD
Total development and redevelopment projects 285,132 388,861
Value-added predevelopment (2) 43,024 (3) TBD Generic infrastructure/building improvement projects in North America (4) 29,534 TBD
Maintenance building improvements 3,549 TBD
Total construction spending $ 361,239 $ 388,861
Guidance range for development, redevelopment, and construction for the six months ended December 31, 2013 $346,000 - $376,000 (5)
(1) Includes future value-added projects, including among others, 3033 Science Park Road, and remaining construction costs related to certain value-added projects
recently transferred into rental properties upon substantial completion. The recently completed projects include certain spaces, generally less than 10% of the project, that may require additional construction prior to occupancy. For example, this includes our recently delivered redevelopments at 400 Technology Square,
1551 Eastlake Avenue, and 10300 Campus Point Drive which generally have 15,000 to 30,000 RSF of value added activities to complete in connection with the
lease-up of the space. (2) Refer to the land undergoing predevelopment activities (additional CIP) section in the definition of future value-added projects. (3) Includes traditional preconstruction costs plus predevelopment costs related to: i) approximately $16 million related to site and infrastructure costs for the 1.2
million RSF related to 50 Binney Street, 100 Binney Street and the 228,000 RSF of residential at the Alexandria Center™ at Kendall Square, including utility access and roads, installation of storm drain lines, infiltration systems, water lines, traffic lighting/signals, streets, and sidewalks, and ii) approximately $5 million related to the design, permitting, and construction of the building foundation for a new residential building adjacent to the 75/125 Binney Street development project at the Alexandria Center™ at Kendall Square. Site and infrastructure costs related to 75/125 Binney Street and 225 Binney Street are included in our estimate of cost at completion and initial stabilized yields for each project.
(4) Includes, among others, generic infrastructure building improvement projects in North America, including 2625/2627/2631 Hanover Street, 7030 Kit Creek Road, 1300 Quince Orchard Boulevard, 44 Hartwell Avenue, 215 First Street, and 300 Technology Square.
(5) The estimated development, redevelopment and construction amounts for the six months ended December 31, 2013 represent the mid-point of our guidance for total spending. Our guidance provides a range for the total construction spending for 2013 primarily to accommodate timing of construction activity.
Historical construction spending
Six Months Ended
June 30, 2013
Development projects – North America $ 152,955
Redevelopment projects – North America 53,779
Development and redevelopment projects – Asia 4,461
Total development and redevelopment projects 211,195
Value-added predevelopment (1) 28,194
Generic infrastructure/building improvement projects in North America (2) 13,197
Total construction spending $ 252,586
(1) Includes traditional preconstruction costs plus predevelopment costs related to the 1.2 million RSF related to 50 Binney Street, 100 Binney Street and the 228,000
RSF of residential at the Alexandria Center™ at Kendall Square including: i) site and infrastructure costs for, including utility access and roads, installation of storm drain lines, infiltration systems, water lines, traffic lighting/signals, streets, and sidewalks, ii) building design, and iii) other related project costs including capitalized interest.
(2) Includes revenue-enhancing projects and amounts shown in the table below related to non-revenue-enhancing capital expenditures.
The table below shows the average per square foot of property-related non-revenue-enhancing capital expenditures, tenant improvements, and leasing
costs (excluding capital expenditures and tenant improvements that are recoverable from client tenants, revenue-enhancing, or related to properties that have
undergone redevelopment).
Six Months Ended
June 30, 2013
Non-revenue enhancing capital expenditures (1) $ 933
Square feet in asset base 14,010,754 Non-revenue enhancing capital expenditures per square foot $ 0.07
Tenant improvements and leasing costs:
Re-tenanted space (2) Tenant improvements and leasing costs $ 2,231
Re-tenanted square feet 132,585
Per square foot $ 16.83 Renewal space
Tenant improvements and leasing costs $ 1,641 Renewal square feet 354,339
Per square foot $ 4.63
(1) Includes, among other costs, capital expenditures such as roof and HVAC system replacements.
(2) Excludes space that has undergone redevelopment before re-tenanting.

ALEXANDRIA REAL ESTATE EQUITIES, INC.
June 30, 2013
ALEXANDRIA REAL ESTATE EQUITIES, INC. ALL RIGHTS RESERVED © 2013 26
All Active Development Projects in North America (Dollars in thousands, except per square foot amounts)
(Unaudited)
Leased Status Initial
Property/Market – Submarket
Leased Negotiating Total Leased/Negotiating Project Occupancy Stabilization
CIP RSF RSF % RSF % RSF % Start Date Date Date Client Tenants
Consolidated development projects in North America
75/125 Binney Street/Greater Boston – Cambridge 386,275 244,123 63% 139,374 (1) 36% 383,497 99% 1Q13 1Q15 2015 ARIAD
Pharmaceuticals, Inc.
225 Binney Street/Greater Boston – Cambridge 305,212 305,212 100% – –% 305,212 100% 4Q11 Oct 2013 Oct 2013 Biogen Idec Inc.
499 Illinois Street/San Francisco Bay Area – Mission Bay 222,780 97,702 44% 64,848 (2) 29% 162,550 73% 2Q11 2Q14 2014 Illumina, Inc.
269 East Grand Avenue/San Francisco Bay Area – So. San Francisco 107,250 107,250 100% – –% 107,250 100% 1Q13 4Q14 2014 Onyx Pharmaceuticals,
Inc.
430 East 29th Street/Greater NYC – Manhattan 419,806 182,448 44% 52,257 12% 234,705 56% 4Q12 Dec 2013 2015 Roche/Investment-
grade entity
Consolidated development projects in North America 1,441,323 936,735 65% 256,479 18% 1,193,214 83%
Unconsolidated joint venture 360 Longwood Avenue/Greater Boston – Longwood 413,536 154,100 37% 70,000 17% 224,100 54% 2Q12 4Q14 2016 Dana-Farber Cancer
Institute, Inc.
Total/weighted average 1,854,859 1,090,835 59% 326,479 17% 1,417,314 76%
Investment
Cost To Complete
2013 2014 and Thereafter Initial Stabilized
Property/Market – Submarket
CIP
Construction
Loans
Internal
Funding
Construction
Loans
Internal
Funding
Total at
Completion
Cost
Per RSF
Yield (unlevered)
Average
Cash Yield Cash GAAP
Consolidated development projects in North America
75/125 Binney Street/Greater Boston – Cambridge $ 123,218 $ 57,173 $ – $ 171,048 $ – $ 351,439 (3) $ 910 8.0% 8.2% 9.1%
225 Binney Street/Greater Boston – Cambridge $ 145,172 $ − $ 35,101 $ − $ − $ 180,273 $ 591 7.5% 8.1% 8.1%
499 Illinois Street/San Francisco Bay Area – Mission Bay $ 116,776 $ − $ 14,033 $ − $ 22,400 $ 153,209 $ 688 6.4% 7.2% 7.3%
269 East Grand Avenue/San Francisco Bay Area – So. San Francisco $ 9,626 $ 1,572 $ 5,674 $ 34,428 $ – $ 51,300 $ 478 8.1% 9.3% 9.3%
430 East 29th Street/Greater NYC – Manhattan $ 278,669 $ − $ 75,035 $ − $ 109,541 $ 463,245 $ 1,103 6.6% 6.5% 7.1%
Consolidated development projects in North America $ 673,461 $ 58,745 $ 129,843 $ 205,476 $ 131,941 $ 1,199,466
Property/Market – Submarket
CIP
Construction
Loans and
JV Capital
Internal
Funding
Construction
Loans and
JV Capital
Internal
Funding
Total at
Completion
Unconsolidated joint venture
100% of JV: 360 Longwood Avenue/Greater Boston – Longwood $ 168,776 $ 38,934 $ 13,560 $ 125,535 $ 3,195 $ 350,000 $ 846 8.3% 8.9% 9.3%
Less: Funding from Secured Construction Loans and JV Partner Capital (4) $ (134,938) $ (38,934) $ – $ (125,535) $ – $ (299,407)
ARE investment in 360 Longwood Avenue (27.5% interest) $ 33,838 $ – $ 13,560 $ – $ 3,195 $ 50,593
Total ARE investment $ 707,299 $ 58,745 $ 143,403 $ 205,476 $ 135,136 $ 1,250,059
Total 2013 and Thereafter $ 202,148 $ 340,612
(1) ARIAD Pharmaceuticals, Inc. executed an LOI at 75/125 Binney Street for 139,374 RSF of expansion space. An amendment to their lease is in process to increase their RSF to 383,497, or 99%, of the development.
(2) Includes 30,000 RSF subject to an executed LOI and lease negotiations. The remaining 34,848 RSF is under negotiation.
(3) We expect to close a construction loan financing in the third quarter of 2013 to provide funding for 65% of the total cost at completion.
(4) Includes non-recourse secured construction loan of approximately $213.2 million, at a rate of L+3.75% with a floor of 5.25%, of which approximately $75.0 million was drawn as of June 30, 2013.

ALEXANDRIA REAL ESTATE EQUITIES, INC.
June 30, 2013
ALEXANDRIA REAL ESTATE EQUITIES, INC. ALL RIGHTS RESERVED © 2013 27
All Active Development Projects in North America
Property 75/125 Binney Street 225 Binney Street 499 Illinois Street
Submarket/Market Cambridge/Greater Boston Cambridge/Greater Boston Mission Bay/San Francisco Bay Area
RSF 386,275 305,212 222,780
Photograph/
Rendering
Property 269 East Grand Avenue 430 East 29th Street 360 Longwood Avenue
Submarket/Market South San Francisco/San Francisco Bay Area New York City/Greater New York Cambridge/Greater Boston
RSF 107,250 419,806 413,536
Photograph/
Rendering

ALEXANDRIA REAL ESTATE EQUITIES, INC.
June 30, 2013
ALEXANDRIA REAL ESTATE EQUITIES, INC. ALL RIGHTS RESERVED © 2013 28
All Active Redevelopment Projects in North America
(Dollars in thousands, except per square foot amounts)
(Unaudited)
All project information, including rentable square feet; investment; Initial Stabilized Yields; Average Cash Yields; and project start, occupancy and stabilization dates, relates to the discrete portion of each property undergoing active
redevelopment. A redevelopment project does not necessarily represent the entire property or the entire vacant portion of a property.
Project RSF Leased Status
In Leased Negotiating Total Leased/Negotiating Former Use After
Property/Market − Submarket Service CIP Total RSF % RSF % RSF % Use Conversion Client Tenants
285 Bear Hill Road/
Greater Boston – Route 128
–
26,270 26,270 26,270
100%
– –% 26,270 100%
Office/
Manufacturing Laboratory
Intelligent Medical Devices, Inc.
343 Oyster Point/
San Francisco Bay Area – South San Francisco
17,507 36,473 53,980 42,445
79%
– –% 42,445 79%
Office
Laboratory
Calithera BioSciences, Inc.;
CytomX Therapeutics, Inc.
4757 Nexus Center Drive/
San Diego – University Town Center
–
68,423 (1) 68,423 68,423
100%
– –% 68,423 100%
Office/R&D/
Manufacturing/
Warehouse
Laboratory
Genomatica, Inc.
9800 Medical Center Drive/
Suburban Washington, D.C. – Rockville
8,001
67,055 75,056 75,056
100%
– –% 75,056 100%
Office/
Laboratory Laboratory
National Institutes of Health
1616 Eastlake Avenue/Seattle – Lake Union 40,756 26,020 66,776 40,756 61% – –% 40,756 61% Office Laboratory Infectious Disease Research Institute
Total/weighted average 66,264 224,241 290,505 252,950 87% – –% 252,950 87%
Investment
June 30, 2013 To Complete Initial Stabilized Initial
Property/Market − Submarket
In
Service CIP 2013
2014 and
Thereafter
Total at
Completion
Cost
Per RSF
Yield (unlevered) Average
Cash Yield
Project
Start Date
Occupancy
Date
Stabilization
Date Cash GAAP
285 Bear Hill Road/Greater Boston – Route 128 $ – $ 5,173 $ 4,023 $ – $ 9,196 $ 350 8.4% 8.8% 9.2% 4Q11 3Q13 3Q13
343 Oyster Point/
San Francisco Bay Area – South San Francisco
$ 5,222
$ 9,882 $ 1,317
$ 918 $ 17,339
$ 321 9.6% 9.8% 10.1%
1Q12 3Q13 4Q13
4757 Nexus Center Drive/
San Diego – University Town Center
$ –
$ 10,619 $ 18,694
$ 5,516 $ 34,829
$ 509 7.6% 7.8% 8.5% 4Q12 4Q13 4Q13 (1)
9800 Medical Center Drive/
Suburban Washington, D.C. – Rockville
$ 8,275
$ 69,279 $ 3,150
$ – $ 80,704
$ 1,075 (2) 5.4% 5.4% 5.4%
3Q09 1Q13 3Q13
1616 Eastlake Avenue/Seattle – Lake Union $ 23,380 $ 10,041 $ 378 $ 4,017 $ 37,816 $ 566 8.4% 8.6% 9.4% 4Q12 2Q13 2014
Total/weighted average $ 36,877 $ 104,994 $ 27,562 $ 10,451 $ 179,884
(1) We expect to deliver 54,102 RSF, or 79% of the total project, to Genomatica, Inc. in the fourth quarter of 2013. Genomatica, Inc. is contractually required to lease the remaining 14,411 RSF 18 to 24 months following the delivery of the initial 54,102
rentable square foot space.
(2) Our multi-tenant four building property at 9800 Medical Center Drive contains an aggregate of 281,586 RSF. Our total cash investment in the entire four building property upon completion of the redevelopment will approximate $580 per square foot.
Our total expected cash investment for the four building property of approximately $580 per square foot includes our expected total investment at completion related to the 75,056 rentable square foot redevelopment of approximately $1,075 per square
foot.

ALEXANDRIA REAL ESTATE EQUITIES, INC.
June 30, 2013
ALEXANDRIA REAL ESTATE EQUITIES, INC. ALL RIGHTS RESERVED © 2013 29
All Active Redevelopment Projects in North America
Property 285 Bear Hill Road 343 Oyster Point Boulevard 4757 Nexus Center Drive
Submarket/Market Route 128/Greater Boston South San Francisco/San Francisco Bay Area University Town Center/San Diego
RSF 26,270 53,980 68,423
Photograph/ Rendering
Year Acquired/ Built
Acquired in 2011 Built in 2000 Acquired in 1998
Redevelopment
Opportunity Identified at Acquisition
Yes N/A Yes
Former Use Office/Manufacturing Office Manufacturing/Warehouse/Office/R&D
Use After Conversion
Laboratory Laboratory Laboratory
Projected GAAP NOI per RSF
$31 $31 $40
Projected Redevelopment Budget per RSF
$197 $135 $470
Key Tenants Intelligent Medical Devices, Inc. Calithera Biosciences, Inc.; CytomX Therapeutics, Inc. Genomatica, Inc.
Other Key
Attributes
Conversion of office/manufacturing space through
redevelopment. This portion of the building was originally
developed by prior owner as office/manufacturing space in
1999.
Conversion of office space through redevelopment. This
portion of the building was originally developed primarily
as office in 2000.
Campus has approximately 50,000 of additional
developable square feet to accommodate growth by
Genomatica, Inc. and other client tenants.

ALEXANDRIA REAL ESTATE EQUITIES, INC.
June 30, 2013
ALEXANDRIA REAL ESTATE EQUITIES, INC. ALL RIGHTS RESERVED © 2013 30
All Active Redevelopment Projects in North America
Property 9800 Medical Center Drive 1616 Eastlake Avenue
Submarket/Market Rockville/Suburban Washington, D.C. Lake Union/Seattle
RSF 75,056 66,776
Photograph/
Rendering
Year Acquired/
Built Acquired in 2004 Built in 2003
Redevelopment
Opportunity Identified
at Acquisition
Yes N/A
Former Use Office/Laboratory Office
Use After
Conversion Laboratory Laboratory
Projected GAAP
NOI per RSF $58 $49
Projected
Redevelopment
Budget per RSF
$525 $132
Key Tenants National Institutes of Health Infectious Disease Research Institute
Other Key
Attributes
NIH initially leased space at the campus in 2005. Expansion into the redevelopment
space extends their tenancy at property to a total term of approximately 23 years.
Conversion of office space through redevelopment.
This portion of the building was originally developed as office space in 2003.

ALEXANDRIA REAL ESTATE EQUITIES, INC.
June 30, 2013
ALEXANDRIA REAL ESTATE EQUITIES, INC. ALL RIGHTS RESERVED © 2013 31
Future Value-Added Projects in North America
Future Redevelopment in North America
(Unaudited)
Land Undergoing Predevelopment Activities
(Additional CIP)
Land Held for Future Development
Total
Market: Property - Submarket
Book Value
(in thousands)
Rentable
Square Feet
Cost per
Square Foot
Book Value
(in thousands)
Rentable
Square Feet
Cost per
Square Foot
Book Value
(in thousands)
Rentable
Square Feet
Cost per
Square Foot
Greater Boston:
Alexandria Center™ at Kendall Square - Lab/Office - Cambridge/Inner Suburbs
$ 258,442
974,264 ¤ $ 265 $ – – $ – $ 258,442
974,264 $ 265
Alexandria Center™ at Kendall Square - Residential
- Cambridge/Inner Suburbs
1,956 78,000 25 3,413 150,000 23 5,369 228,000 24
Subtotal - Alexandria Center™ at Kendall Square 260,398 1,052,264 247 3,413 150,000 23 263,811 1,202,264 219
Technology Square - Cambridge/Inner Suburbs – – – 7,721 100,000 77 7,721 100,000 77
Greater Boston $ 260,398 1,052,264 $ 247 $ 11,134 250,000 $ 45 $ 271,532 1,302,264 $ 209
San Francisco Bay Area:
Grand Ave - South San Francisco $ – – $ – $ 42,853 397,132 $ 108 $ 42,853 397,132 $ 108 Rozzi/Eccles - South San Francisco – – – 72,864 514,307 142 72,864 514,307 142
San Francisco Bay Area $ – – $ – $ 115,717 911,439 $ 127 $ 115,717 911,439 $ 127
San Diego: Science Park Road - Torrey Pines $ 16,635 176,500 $ 94 $ – – $ – $ 16,635 176,500 $ 94
5200 Illumina Way - University Town Center 14,719 392,983 37 – – – 14,719 392,983 37
10300 Campus Point - University Town Center 3,992 140,000 29 – – – 3,992 140,000 29 Executive Drive - University Town Center 3,995 49,920 80 – – – 3,995 49,920 80
San Diego $ 39,341 759,403 $ 52 $ – – $ – $ 39,341 759,403 $ 52
Suburban Washington D.C.:
Medical Center Drive - Rockville $ – – $ – $ 7,548 321,721 $ 23 $ 7,548 321,721 $ 23
Research Boulevard - Rockville – – – 6,905 347,000 20 6,905 347,000 20 Firstfield Road - Gaithersburg – – – 4,052 95,000 43 4,052 95,000 43
Suburban Washington D.C. $ – – $ – $ 18,505 763,721 $ 24 $ 18,505 763,721 $ 24
Seattle: Dexter/Terry Ave - Lake Union $ – – $ – $ 18,747 232,300 $ 81 $ 18,747 232,300 $ 81
Eastlake Ave - Lake Union 13,759 106,000 130 15,248 160,266 95 29,007 266,266 109
Seattle $ 13,759 106,000 $ 130 $ 33,995 392,566 $ 87 $ 47,754 498,566 $ 96
Other Markets $ – – $ – $ 31,941 1,214,117 $ 26 $ 31,941 1,214,117 $ 26
Future value-added projects in North America $ 313,498 1,917,667 $ 163 $ 211,292 3,531,843 $ 60 $ 524,790 5,449,510 $ 96

ALEXANDRIA REAL ESTATE EQUITIES, INC.
June 30, 2013
ALEXANDRIA REAL ESTATE EQUITIES, INC. ALL RIGHTS RESERVED © 2013 32
Future Value-Added Projects in North America
Land Undergoing Predevelopment Activities or Held for Future Development
Overview of Greater Boston Market

ALEXANDRIA REAL ESTATE EQUITIES, INC.
June 30, 2013
ALEXANDRIA REAL ESTATE EQUITIES, INC. ALL RIGHTS RESERVED © 2013 33
Future Value-Added Projects in North America
Land Undergoing Predevelopment Activities or Held for Future Development in Greater Boston Market
Operating/Development/Redevelopment Project Future Value-Added Project
Property Alexandria Center™ at Kendall Square
Submarket/Market Cambridge/Greater Boston
Aerial
Background
Alexandria received final approval from the City of Cambridge to develop the Alexandria Center™ at Kendall Square, a fully-integrated life science campus featuring four world-
class laboratory/office facilities, high-quality amenities, and green space. Alexandria’s entitlement efforts resulted in an increase of 1.1 million developable square feet over the
original entitlements in place at acquisition.
Update 4Q11: Commenced development of a build-to-suit for Biogen Idec Inc. at 225 Binney Street
1Q13: Commenced development of build-to-suit for ARIAD Pharmaceuticals, Inc. at 75/125 Binney Street
Near-Term
Opportunity
Laboratory ground-up development projects at 50 and 100 Binney Street aggregating approximately 1.0 million RSF plus 228,000 RSF of residential; subject to market
conditions, we expect to commence development of these opportunities over the next one to three years and we may consider financing these projects with joint venture capital.
We believe the estimated investment, excluding land, to develop laboratory buildings, with an underground parking garage, on these parcels ranges from $660 to $825 per square
foot.
161 FIRST STREET
46,356 RSF
215 FIRST STREET
366,719 RSF
300 THIRD STREET
131,963 RSF
100 BINNEY STREET
416,788 RSF
50 BINNEY STREET
540,521 RSF
225 BINNEY STREET
305,212 RSF
75/125 BINNEY STREET
386,275 RSF

ALEXANDRIA REAL ESTATE EQUITIES, INC.
June 30, 2013
ALEXANDRIA REAL ESTATE EQUITIES, INC. ALL RIGHTS RESERVED © 2013 34
Future Value-Added Projects in North America
Land Undergoing Predevelopment Activities
Overview of San Diego Market

ALEXANDRIA REAL ESTATE EQUITIES, INC.
June 30, 2013
ALEXANDRIA REAL ESTATE EQUITIES, INC. ALL RIGHTS RESERVED © 2013 35
Future Value-Added Projects in North America
Land Undergoing Predevelopment Activities in San Diego Market
Operating/Development/Redevelopment Project Future Value-Added Project
Property 10300 Campus Point Drive 5200 Illumina Way
Submarket/Market University Town Center/San Diego University Town Center/San Diego
Aerial
Background 10300 Campus Point Drive is Alexandria’s flagship 449,759 rentable square foot,
multi-tenant campus in University Town Center.
Alexandria owns and operates the headquarters campus of Illumina, Inc., the leading
developer, manufacturer, and marketer of life science tools and integrated systems for
large-scale analysis of genetic variation and function with a YE12 market capitalization
of $6.9 billion.
Update
4Q10: Acquired as a manufacturing facility and began redeveloping it into a
state-of-the-art laboratory property
3Q12: Completed redevelopment of 10300 Campus Point Drive, a 96% leased
project with leading tenants including Eli Lilly and Company, Celgene
Corporation, Covance Inc., and the Regents of the University of California
4Q10: Acquired world-class campus from Biogen Idec Inc.
4Q10: Leased entire 3 building campus to Illumina, Inc.
4Q12: Completed development of fourth building with 127,373 RSF for Illumina,
Inc.
1Q13: Completed development of fifth building with 23,124 RSF for Illumina, Inc.
Near-Term
Opportunity
Ground-up development projects aggregating approximately 140,000 RSF; subject to
market conditions, we expect to commence development of these opportunities over
the next one to three years. We believe the estimated investment, excluding land, to
develop laboratory buildings on these parcels ranges from $450 to $500 per square
foot.
Future ground-up development projects for two buildings (building 6 and 7)
aggregating 392,983 RSF; subject to market conditions, we expect to commence
development of these opportunities over the next one to three years. We believe the
estimated investment, excluding land, to develop laboratory buildings on these parcels
ranges from $450 to $500 per square foot. Additionally, the site supports an above
ground parking garage which Illumina, Inc. may elect to lease at a similar return to the
Company as a new building.
PARKING STRUCTURE
BUILDING
196,491 RSF
BUILDING
196,492 RSF
BUILDING
23,124 RSF
BUILDING
127,373 RSF
BUILDING
171,340 RSF
BUILDING
159,272 RSF
BUILDING
15,696 RSF
BUILDING
70,000 RSF
10300 CAMPUS POINT DRIVE
449,759 RSF
PARKING STRUCTURE
PARKING STRUCTURE
BUILDING
70,000 RSF

ALEXANDRIA REAL ESTATE EQUITIES, INC.
June 30, 2013
ALEXANDRIA REAL ESTATE EQUITIES, INC. ALL RIGHTS RESERVED © 2013 36
Future Value-Added Projects in North America
Land Undergoing Predevelopment Activities in San Diego Market
Operating/Development/Redevelopment Project Future Value-Added Project
Property 3013/3033 Science Park Road
Submarket/Market Torrey Pines/San Diego
Aerial
Background ARE Spectrum is Alexandria's 335,145 rentable square foot, multi-tenant campus located in Torrey Pines. The existing operating laboratory properties are fully leased to the
Scripps Research Institute and Sapphire Energy, Inc.
Update 2Q12 - Acquired the 3013/3033 Science Park Road sites with a short-term lease in-place.
2013 - Commenced predevelopment activities to design future laboratory product in a highly desirable and dense lab market.
Near-Term
Opportunity
Ground-up development and possible redevelopment opportunities aggregating 176,500 RSF for either multi-tenant use or a large campus user. Subject to market conditions, we
expect to commence construction of these opportunities over the next one to three years. We believe the estimated investment, excluding land, to construct laboratory buildings on
these parcels ranges from $350 to $500 per square foot.
3115 MERRYFIELD ROW
3125 MERRYFIELD ROW
3013 SCIENCE PARK ROAD
3033 SCIENCE PARK ROAD
PARKING STRUCTURE

ALEXANDRIA REAL ESTATE EQUITIES, INC.
June 30, 2013
ALEXANDRIA REAL ESTATE EQUITIES, INC. ALL RIGHTS RESERVED © 2013 37
Future Value-Added Projects in North America
Land Undergoing Predevelopment Activities or Held for Future Development
Overview of Seattle Market

ALEXANDRIA REAL ESTATE EQUITIES, INC.
June 30, 2013
ALEXANDRIA REAL ESTATE EQUITIES, INC. ALL RIGHTS RESERVED © 2013 38
Future Value-Added Projects in North America
Land Undergoing Predevelopment Activities or Held for Future Development in Seattle Market
Operating/Development/Redevelopment Project Future Value-Added Project
Property Dexter/Terry Avenue and Eastlake Avenue
Submarket/Market Lake Union/Seattle
Aerial
Background Alexandria’s Dexter/Terry Avenue and Eastlake Avenue assets are located at Lake Union, home to numerous highly renowned medical research institutions, including the Fred
Hutchinson Cancer Research Center and the University of Washington.
Update
2010: Completed 115,084 rentable square foot build-to-suit for Gilead Sciences, Inc.
2011: Commenced redevelopment of 117,482 square foot project at 1551 Eastlake Avenue
2012: Commenced redevelopment of 66,776 square foot project at 1616 Eastlake Avenue
2012: Sold two assets to residential developers for an average sales price per square foot of approximately $72
2014: Sale of 810 Dexter Avenue North is expected to close in the next two to three quarters
Near-Term
Opportunity
Build-to suit opportunities, as well as expansion opportunities related to existing client tenants. Subject to market conditions, we expect to monetize these land sites through
dispositions or commencement of development over the next one to three years. We believe the estimated investment, excluding land, to develop laboratory buildings on these
parcels ranges from $375 to $550 per square foot.
1165 EASTLAKE AVENUE EAST
106,000 RSF
810 DEXTER AVENUE NORTH
150,000 RSF
400/416/430 DEXTER AVENUE NORTH
186,300 RSF
124 TERRY AVENUE NORTH
46,000 RSF
1208 EASTLAKE AVENUE EAST
97,366 RSF
199 EAST BLAINE STREET
115,084 RSF
1150/1166 EASTLAKE AVENUE EAST
160,266 RSF
1551 EASTLAKE AVENUE EAST
117,482 RSF
1616 EASTLAKE AVENUE EAST AVE
168,708 RSF
1201 EASTLAKE AVENUE EAST
106,003 RSF

ALEXANDRIA REAL ESTATE EQUITIES, INC.
June 30, 2013
ALEXANDRIA REAL ESTATE EQUITIES, INC. ALL RIGHTS RESERVED © 2013 39
Future Value-Added Projects in North America
Land Held for Future Development
Overview of San Francisco Bay Area Market

ALEXANDRIA REAL ESTATE EQUITIES, INC.
June 30, 2013
ALEXANDRIA REAL ESTATE EQUITIES, INC. ALL RIGHTS RESERVED © 2013 40
Future Value-Added Projects in North America
Land Held for Future Development in San Francisco Market
Operating/Development/Redevelopment Project Future Value-Added Project
Property East Grand Avenue
Submarket/Market South San Francisco/San Francisco Bay Area
Aerial
Background Alexandria owns and operates the headquarters campus of Onyx Pharmaceuticals, Inc., the cutting-edge global commercial-stage oncology company.
Update
2010: Completed development of 249 East Grand Avenue, 100% leased to Onyx Pharmaceuticals, Inc.
4Q12: Completed development of 259 East Grand Avenue, 100% leased to Onyx Pharmaceuticals, Inc.
1Q13: Commenced construction on 269 East Grand Avenue, 100% pre-leased to Onyx Pharmaceuticals, Inc.
Near-Term
Opportunity
Ground-up development projects aggregating 121,632 RSF on the Onyx campus; subject to market conditions. We believe the estimated investment, excluding land, to develop
a laboratory building on this parcel ranges from $375 to $430 per square foot. This site supports an above ground parking garage which Onyx may elect to lease at a similar
return to the Company as a new building. Additionally, we also have approximately 790,000 RSF of future opportunities at other sites in South San Francisco.
259 EAST GRAND AVENUE
170,618 RSF
249 EAST GRAND AVENUE
129,501 RSF
269 EAST GRAND AVENUE
107,250 RSF
PARKING STRUCTURE
279 EAST GRAND AVENUE
121,632 RSF

ALEXANDRIA REAL ESTATE EQUITIES, INC.
June 30, 2013
ALEXANDRIA REAL ESTATE EQUITIES, INC. ALL RIGHTS RESERVED © 2013 41
Future Value-Added Projects in North America
Land Undergoing Predevelopment Activities or Held for Future Development
Overview of Suburban Washington, D.C. Market

ALEXANDRIA REAL ESTATE EQUITIES, INC.
June 30, 2013
ALEXANDRIA REAL ESTATE EQUITIES, INC. ALL RIGHTS RESERVED © 2013 42
Future Value-Added Projects in North America
Land Undergoing Predevelopment Activities or Held for Future Development in Washington, D.C. Market
Operating/Development/Redevelopment Project Future Value-Added Project
Property 9800 Medical Center Drive
Submarket/
Market Rockville/Suburban Washington, D.C.
Aerial
Background Alexandria's 9800 Medical Center Drive campus is located in the heart of the Shady Grove Life Sciences Center.
Update 2013: Alexandria expects to complete redevelopment of 75,056 RSF; 100% pre-leased to National Institutes of Health for 15 years
2013: Upon completion of the redevelopment, the National Institutes of Health will occupy approximately 135,000 RSF, or 48% of the campus
Near-Term
Opportunity
Future development projects for expansion opportunities of 260,721 RSF at 9800 Medical Center Drive plus 408,000 RSF at other well-located sites in Rockville. We are not
likely to commence ground-up development in the near-term given current market conditions.
BUILDING
43,380 RSF
PARKING STRUCTURE
BUILDING
58,326 RSF
BUILDING
123,501 RSF
BUILDING
56,379 RSF
BUILDING
161,921
BUILDING
98,800 RSF
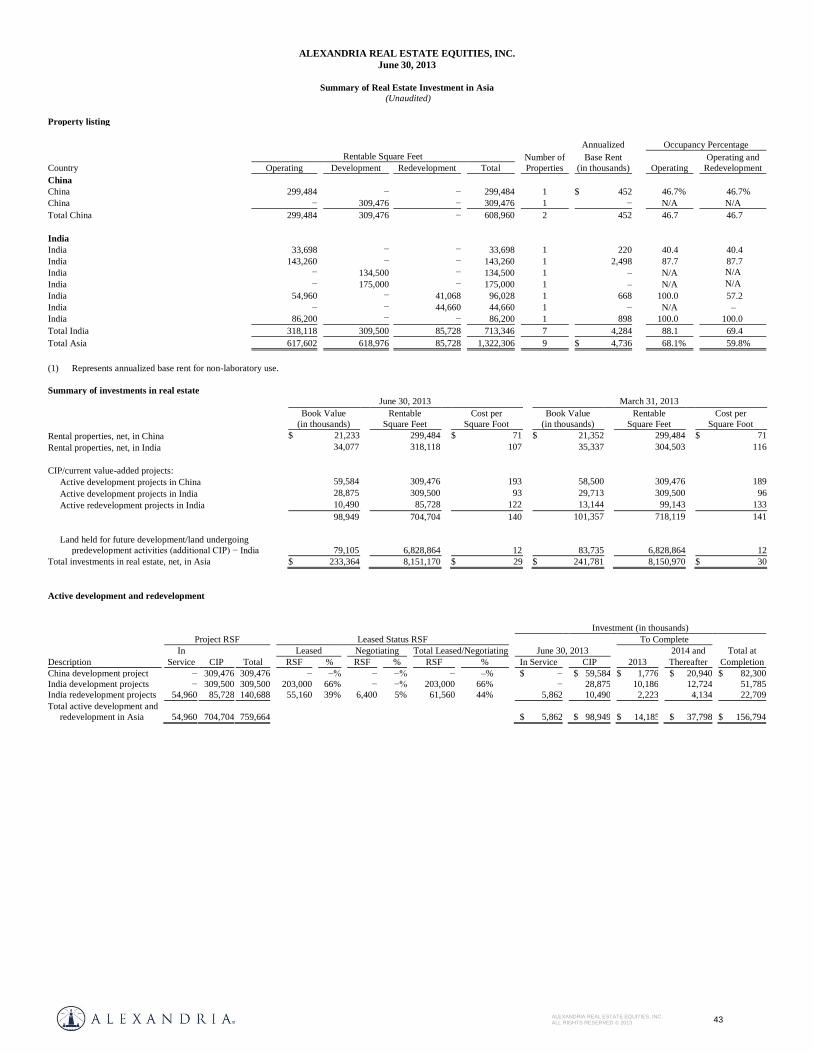
ALEXANDRIA REAL ESTATE EQUITIES, INC.
June 30, 2013
ALEXANDRIA REAL ESTATE EQUITIES, INC. ALL RIGHTS RESERVED © 2013 43
Summary of Real Estate Investment in Asia
(Unaudited)
Property listing
Annualized Occupancy Percentage
Country
Rentable Square Feet
Number of
Properties
Base Rent
(in thousands) Operating
Operating and
Redevelopment Operating Development Redevelopment Total
China
China 299,484 − − 299,484 1 $ 452 46.7% 46.7%
China − 309,476 − 309,476 1 − N/A N/A
Total China 299,484 309,476 − 608,960 2 452 46.7 46.7
India
India 33,698 − − 33,698 1 220 40.4 40.4
India 143,260 − − 143,260 1 2,498 87.7 87.7
India − 134,500 − 134,500 1 – N/A N/A
India − 175,000 − 175,000 1 – N/A N/A
India 54,960 − 41,068 96,028 1 668 100.0 57.2
India − − 44,660 44,660 1 − N/A –
India 86,200 − − 86,200 1 898 100.0 100.0
Total India 318,118 309,500 85,728 713,346 7 4,284 88.1 69.4
Total Asia 617,602 618,976 85,728 1,322,306 9 $ 4,736 68.1% 59.8%
(1) Represents annualized base rent for non-laboratory use.
Summary of investments in real estate
June 30, 2013 March 31, 2013
Book Value
(in thousands)
Rentable
Square Feet
Cost per
Square Foot
Book Value
(in thousands)
Rentable
Square Feet
Cost per
Square Foot
Rental properties, net, in China $ 21,233 299,484 $ 71 $ 21,352 299,484 $ 71
Rental properties, net, in India 34,077 318,118 107 35,337 304,503 116
CIP/current value-added projects:
Active development projects in China 59,584 309,476 193 58,500 309,476 189
Active development projects in India 28,875 309,500 93 29,713 309,500 96
Active redevelopment projects in India 10,490 85,728 122 13,144 99,143 133
98,949 704,704 140 101,357 718,119 141
Land held for future development/land undergoing
predevelopment activities (additional CIP) − India 79,105
6,828,864
12
83,735
6,828,864
12
Total investments in real estate, net, in Asia $ 233,364 8,151,170 $ 29 $ 241,781 8,150,970 $ 30
Active development and redevelopment
Investment (in thousands)
Description
Project RSF
Leased Status RSF
To Complete
In Leased Negotiating Total Leased/Negotiating June 30, 2013 2014 and Total at
Service CIP Total RSF % RSF % RSF % In Service CIP 2013 Thereafter Completion
China development project − 309,476 309,476 − −% − −% − –% $ − $ 59,584 $ 1,776 $ 20,940 $ 82,300
India development projects − 309,500 309,500 203,000 66% − −% 203,000 66% − 28,875 10,186 12,724 51,785
India redevelopment projects 54,960 85,728 140,688 55,160 39% 6,400 5% 61,560 44% 5,862 10,490 2,223 4,134 22,709
Total active development and
redevelopment in Asia
54,960 704,704 759,664
$ 5,862 $ 98,949 $ 14,185 $ 37,798 $ 156,794

BALANCE SHEET

ALEXANDRIA REAL ESTATE EQUITIES, INC.
June 30, 2013
ALEXANDRIA REAL ESTATE EQUITIES, INC. ALL RIGHTS RESERVED © 2013 45
Credit Metrics
(Unaudited)
Net Debt/Adjusted EBITDA Net Debt to Gross Assets (Excluding Cash and Restricted Cash)
Fixed Charge Coverage Ratio Interest Coverage Ratio
Unencumbered NOI as a % of Total NOI Unencumbered Assets Gross Book Value as a % of Gross Assets
Liquidity Unhedged Variable Rate Debt as a % of Total Debt
(1) Periods represent quarter annualized metrics. We believe key credit metrics for the three months ended June 30, 2013, annualized, reflect the completion of many development and
redevelopment projects and are indicative of the Company’s current operating trends.
(2) Certain encumbered properties under redevelopment were completed just prior to or during the three months ended June 30, 2013, including 400 Technology Square, 9800 Medical Center
Drive, and 259 East Grand Avenue. The additional lease commencements generated incremental encumbered NOI relative to the existing base of unencumbered NOI and resulted in a
decrease in our ratio of unencumbered NOI as a percentage of total NOI. We expect the ratio of unencumbered NOI to increase by 12%-to-14% in the first quarter of 2014 when the $211
million secured loan related to our properties at Alexandria Technology Square matures and is refinanced with the issuance of unsecured notes payable.
7.4x 7.1x
7.6x
6.6x
2010 2011 2012 2Q13 (1)
39% 37% 38%
33%
12/31/2010 12/31/2011 12/31/2012 6/30/2013
2.2x
2.7x 2.6x 2.8x
2010 2011 2012 2Q13 (1)
2.7x
3.4x 3.2x
3.4x
2010 2011 2012 2Q13 (1)
60%
69% 72% 70% (2)
2010 2011 2012 2Q13 (1)
74% 78% 77% 79%
12/31/2010 12/31/2011 12/31/2012 6/30/2013
Availability
Under 2017
Unsecured
Senior Line
of Credit
$1,500
$0
$200
$400
$600
$800
$1,000
$1,200
$1,400
$1,600
$1,800
$2,000
Fixed
Rate/
Hedged
Variable
Rate Debt
89%
Unhedged
Variable
Rate Debt
11% Cash and Cash Equivalents $302
(in m
illi
ons)
2Q13 (1)

ALEXANDRIA REAL ESTATE EQUITIES, INC.
June 30, 2013
ALEXANDRIA REAL ESTATE EQUITIES, INC. ALL RIGHTS RESERVED © 2013 46
Summary of Debt (Dollars in thousands)
(Unaudited)
Fixed rate/hedged and unhedged variable rate debt
Fixed Rate/Hedged
Variable Rate
Unhedged
Variable Rate
Total
Consolidated
Percentage of
Total
Weighted Average
Interest Rate at
End of Period (1)
Weighted Average
Remaining Term
(including extension
options, in years)
Secured notes payable, net $ 591,623 $ 119,406 $ 711,029 24.0% 5.48% 2.7
Unsecured senior notes payable, net 1,048,395 – 1,048,395 35.4 4.29 9.3
$1.5 billion unsecured senior line of credit – – – – 1.39 3.8
2016 Unsecured Senior Bank Term Loan 400,000 200,000 600,000 20.3 2.24 3.0
2017 Unsecured Senior Bank Term Loan 600,000 – 600,000 20.3 3.93 3.6
Total debt / weighted average $ 2,640,018 $ 319,406 $ 2,959,424 100.0% 4.09% 5.3
Percentage of total debt 89% 11% 100%
(1) Represents the weighted average contractual interest rate as of the end of the period plus the impact of debt premiums/discounts and our interest rate swap agreements. The effective
interest rate excludes bank fees and amortization of loan fees.
Debt maturities
Weighted
Average
Interest
Rate (1)
Maturity
Date (2)
Remaining for the Period Ending December 31,
Debt
Stated Rate 2013 2014 2015 2016 2017 Thereafter Total
Secured notes payable
Greater Boston 5.26% 5.59% 4/1/14 $ 1,945 $ 208,683 $ – $ – $ – $ – $ 210,628
Suburban Washington, D.C. 2.18 2.18 4/20/14 (3) – 76,000 – – – – 76,000
San Diego 6.05 4.88 7/1/14 59 6,458 – – – – 6,517
San Diego 5.39 4.00 11/1/14 74 7,495 – – – – 7,569
Seattle 6.00 6.00 11/18/14 120 240 – – – – 360
Suburban Washington, D.C. 5.64 4.50 6/1/15 54 138 5,788 – – – 5,980
Greater Boston, San Francisco Bay Area,
and San Diego
5.73 5.73
1/1/16 814 1,713 1,816 75,501 – – 79,844
Greater Boston, San Diego, and Greater
NYC
5.82 5.82
4/1/16 438 931 988 29,389 – – 31,746
San Francisco Bay Area 6.35 6.35 8/1/16 1,149 2,487 2,652 126,715 – – 133,003
San Francisco Bay Area LIBOR+1.50 1.70 7/1/17 (4) – – 43,046 – – – 43,046
San Diego, Suburban Washington, D.C.,
and Seattle
7.75 7.75
4/1/20 685 1,453 1,570 1,696 1,832 108,469 115,705
San Francisco Bay Area 6.50 6.50 6/1/37 – 17 18 19 20 773 847
Average/Total 5.42% 5.48 5,338 305,615 55,878 233,320 1,852 109,242 711,245
$1.5 billion unsecured senior line
of credit (6)
LIBOR+1.20% (5) 1.39 4/30/17 – – – – – – –
2016 Unsecured Senior Bank Term Loan (6) LIBOR+1.75% 2.24 6/30/16 (3) – – – 600,000 – – 600,000
2017 Unsecured Senior Bank Term Loan (6) LIBOR+1.50% 3.93 1/31/17 (3) – – – – 600,000 – 600,000
Unsecured senior notes payable 4.60% 4.61 4/1/22 – 250 ¤ – – – 550,000 550,250
Unsecured senior notes payable 3.90% 3.94 6/15/23 – – ¤ – – – 500,000 500,000
Average/Subtotal 4.09 5,338 305,865 55,878 833,320 601,852 1,159,242 2,961,495
Unamortized discounts – (294) (200) (139) (177) (184) (1,077) (2,071)
Average/Total 4.09% $ 5,044 $ 305,665 $ 55,739 $ 833,143 $ 601,668 $ 1,158,165 $ 2,959,424
Balloon payments $ – $ 297,330 $ 48,774 $ 830,029 $ 600,000 $ 654,352 $ 2,430,485
Principal amortization 5,044 8,335 6,965 3,114 1,668 503,813 528,939
Total consolidated debt $ 5,044 $ 305,665 $ 55,739 $ 833,143 $ 601,668 $ 1,158,165 $ 2,959,424
Fixed rate/hedged variable rate debt $ 4,924 $ 229,425 $ 12,693 $ 633,143 $ 601,668 $ 1,158,165 $ 2,640,018
Unhedged variable rate debt 120 76,240 43,046 200,000 – – 319,406
Total consolidated debt $ 5,044 $ 305,665 $ 55,739 $ 833,143 $ 601,668 $ 1,158,165 $ 2,959,424
(1) Represents the weighted average contractual interest rate as of the end of the period plus the impact of debt premiums/discounts and our interest rate swap agreements. The weighted
average interest rate excludes bank fees and amortization of loan fees.
(2) Includes any extension options that we control.
(3) This loan may be prepaid without any prepayment penalty.
(4) We have two, one year options to extend the stated maturity date of July 1, 2015
(5) In addition to the stated rate, we are subject to an annual facility fee of 0.25%.
(6) Does not reflect amendments completed or in progress subsequent to June 30, 2013, that will reduce our borrowing costs and/or extend our maturity as noted on page 2 of our
accompanying earnings press release.

ALEXANDRIA REAL ESTATE EQUITIES, INC.
June 30, 2013
ALEXANDRIA REAL ESTATE EQUITIES, INC. ALL RIGHTS RESERVED © 2013 47
Summary of Debt
(Dollars in thousands)
(Unaudited)
Debt covenants
Unsecured Senior Notes Payable
Unsecured Senior Line of Credit and
Unsecured Senior Bank Term Loans
Debt Covenant Ratios Requirement Actual (1) Current Requirement Actual (1)
Total Debt to Total Assets ≤ 60% 36% ≤ 60% 33%
Secured Debt to Total Assets ≤ 40% 9% ≤ 40% 8% Consolidated EBITDA to Interest Expense ≥ 1.50x 5.28x ≥ 1.50x 2.5x
Unencumbered Total Asset Value to Unsecured Debt ≥ 150% 284% N/A N/A
Unsecured Leverage Ratio N/A N/A ≤ 60% 37% Unsecured Interest Coverage Ratio N/A N/A ≥ 1.75x 7.2x
(1) Actual covenants are calculated pursuant to the specific terms as detailed in each agreement.
Summary of interest rate swap agreements
Interest Pay Fair Value as of Notional Amount in Effect as of
Transaction Date
Effective Date
Termination Date
Rate (1) June 30, 2013 June 30, 2013 December 31, 2013
December 2006 December 29, 2006 March 31, 2014 4.990% $ (1,804 ) $ 50,000 $ 50,000 October 2007 October 31, 2007 September 30, 2013 4.642% (563 ) 50,000 − December 2006 November 30, 2009 March 31, 2014 5.015% (2,721 ) 75,000 75,000 December 2006 November 30, 2009 March 31, 2014 5.023% (2,725 ) 75,000 75,000 December 2011 December 31, 2012 December 31, 2013 0.640% (553 ) 250,000 − December 2011 December 31, 2012 December 31, 2013 0.640% (553 ) 250,000 − December 2011 December 31, 2012 December 31, 2013 0.644% (279 ) 125,000 − December 2011 December 31, 2012 December 31, 2013 0.644% (279 ) 125,000 − December 2011 December 31, 2013 December 31, 2014 0.977% (1,536 ) − 250,000 December 2011 December 31, 2013 December 31, 2014 0.976% (1,534 ) − 250,000 Total $ (12,547 ) $ 1,000,000 $ 700,000
(1) In addition to the interest pay rate, borrowings outstanding under our unsecured senior bank term loans include an applicable margin ranging from 1.50% to 1.75% as of June 30, 2013.

ALEXANDRIA REAL ESTATE EQUITIES, INC.
June 30, 2013
ALEXANDRIA REAL ESTATE EQUITIES, INC. ALL RIGHTS RESERVED © 2013 48
Assets Held for Sale and Summary of Real Estate Sales
(Dollars in thousands)
(Unaudited)
Non-income-producing land sales
Description Sales Price
Completed
Land sold during the second quarter of 2013 $ 18,050
Projected
Land subject to purchase and sale agreement $ 55,000
Land subject to sale negotiations 30,000 Additional land sales 46,000 - 86,000
Total projected non-income producing land sales for the six months ended December 31, 2013 $ 131,000 - 171,000
Net assets of discontinued operations
Description June 30, 2013
Properties “held for sale,” net $ 4,180
Other assets 7
Total assets 4,187
Total liabilities (8)
Net assets of discontinued operations $ 4,179
Income from discontinued operations, net
Three Months Ended June 30, Six Months Ended June 30,
2013 2012 2013 2012
Total revenues $ 241 $ 8,831 $ 3,737 $ 18,138
Operating expenses 217 2,506 1,629 5,549
NOI from discontinued operations 24 6,325 2,108 12,589
Interest expense − − − − Depreciation expense − 1,614 930 3,233
(Gain) loss on sale of real estate (219) (2) 121 (2)
Income from discontinued operations, net $ 243 $ 4,713 $ 1,057 $ 9,358
Income-producing assets sold in second quarter
Property
Location
Date of
Purchase Date of Sale RSF
Annualized GAAP
NOI (1) Sales Price
Sales Price
per RSF
Gain
on Sale (2)
Unlevered
IRR
702 Electronic Drive Horsham, PA June 1998 April 2013 40,171 $ 438 $ 4,362 $ 109 $ 219 10.0%
(1) Annualized using actual year-to-date results as of the quarter ended prior to date of sale or June 30, 2013, whichever is earlier.
(2) Excludes impairment charges aggregating $2.1 million recognized during the year ended December 31, 2012.

DEFINITIONS AND OTHER INFORMATION

ALEXANDRIA REAL ESTATE EQUITIES, INC.
June 30, 2013
ALEXANDRIA REAL ESTATE EQUITIES, INC. ALL RIGHTS RESERVED © 2013 50
Definitions and Other Information
(Unaudited)
This section contains additional information for sections throughout this supplemental information package as well as explanations of certain non-GAAP financial measures and the reasons why we use these supplemental measures of performance. Additional detail can be found in our most recent annual report on Form
10-K and subsequent quarterly reports on Form 10-Q, as well as other documents filed with or furnished to the SEC from time to time.
Adjusted EBITDA and Adjusted EBITDA margins
EBITDA represents earnings before interest, taxes, depreciation, and amortization (“EBITDA”), a non-GAAP financial measure, and is used by us and others as a supplemental measure of performance. We use adjusted EBITDA (“Adjusted EBITDA”) and Adjusted EBITDA margins to assess the performance of our
core operations, for financial and operational decision making, and as a supplemental or additional means of evaluating period-to-period comparisons on a consistent basis. Adjusted EBITDA also serves as a proxy for a component of a financial covenant under certain of our debt obligations. Adjusted EBITDA is calculated as
EBITDA excluding net stock compensation expense, gains or losses on early extinguishment of debt, gains or losses on sales of real estate, gains or losses on sales of
land parcels, impairments of real estate, and impairments of land parcels. We believe Adjusted EBITDA and Adjusted EBITDA margins provide investors relevant and useful information because they permit investors to view income from our operations on an unleveraged basis before the effects of taxes, non-cash depreciation and
amortization, net stock compensation expense, gains or losses on early extinguishment of debt, gains or losses on sales of real estate, gains or losses on sales of land
parcels, impairments of real estate, and impairments of land parcels. By excluding interest expense and gains or losses on early extinguishment of debt, EBITDA, Adjusted EBITDA, and Adjusted EBITDA margins allow investors to measure our performance independent of our capital structure and indebtedness and, therefore,
allow for a more meaningful comparison of our performance to that of other companies, both in the real estate industry and in other industries. We believe that
excluding non-cash charges related to share -based compensation facilitates a comparison of our operations across periods and among other equity REITs without the
variances caused by different valuation methodologies, the volatility of the expense (which depends on market forces outside our control), and the assumptions and the
variety of award types that a company can use. We believe that adjusting for the effects of gains or losses on sales of real estate, gains or losses on sales of land parcels,
impairments of real estate, and impairments of land parcels provides useful information by excluding certain items that are not representative of our core operating results. These items are dependent upon historical costs, and are subject to judgmental inputs and the timing of our decisions. EBITDA, Adjusted EBITDA, and
Adjusted EBITDA margins have limitations as measures of our performance. EBITDA, Adjusted EBITDA, and Adjusted EBITDA margins do not reflect our historical
cash expenditures or future cash requirements for capital expenditures or contractual commitments. While EBITDA, Adjusted EBITDA, and Adjusted EBITDA margins are relevant and widely used measures of performance, they do not represent net income or cash flows from operations as defined by GAAP, and they should
not be considered as alternatives to those indicators in evaluating performance or liquidity. Further, our computation of EBITDA, Adjusted EBITDA, and Adjusted
EBITDA margins may not be comparable to similar measures reported by other companies.
The following table reconciles net income, the most directly comparable financial measure calculated and presented in accordance with GAAP, to EBITDA,
Adjusted EBITDA, and Adjusted EBITDA margins:
Three Months Ended Six Months Ended
(dollars in thousands) 6/30/13 3/31/13 12/31/12 9/30/12 6/30/12 6/30/13 6/30/12
Net income $ 33,337 $ 30,237 $ 28,807 $ 18,305 $ 25,641 $ 63,574 $ 58,416 Interest expense – continuing operations 15,978 18,020 17,941 17,092 17,922 33,998 34,148
Depreciation and amortization – continuing operations 46,580 46,065 47,515 46,584 50,741 92,645 92,527
Depreciation and amortization – discontinued operations − 930 557 1,589 1,614 930 3,233
EBITDA 95,895 95,252 94,820 83,570 95,918 191,147 188,324
Stock compensation expense 4,463 3,349 3,748 3,845 3,274 7,812 6,567
Loss on early extinguishment of debt 560 − − − 1,602 560 2,225 (Gain) loss on sale of real estate (219 ) 340 − (1,562 ) (2 ) 121 (2 )
Gain on sale of land parcel (772 ) − − − − (772 ) (1,864 )
Impairment of real estate − − 1,601 9,799 − − − Impairment of land parcel − − 2,050 − − − −
Adjusted EBITDA $ 99,927 $ 98,941 $ 102,219 $ 95,652 $ 100,792 $ 198,868 $ 195,250
Total revenues $ 154,235 $ 150,380 $ 151,554 $ 142,850 $ 145,593 $ 304,615 $ 281,304
Adjusted EBITDA margins 65% 66% 67% 67% 69% 65% 69%
Adjusted funds from operations
AFFO is a non-GAAP financial measure that we use as a supplemental measure of our performance. We compute AFFO by adding to or deducting from
FFO, as adjusted: (1) maintenance building improvements, and non-revenue-enhancing tenant improvements and leasing commissions (excludes development and
redevelopment expenditures); (2) effects of straight-line rent and straight-line rent on ground leases; (3) capitalized income from development projects; (4) amortization of acquired above and below market leases, loan fees, and debt premiums/discounts; (5) non-cash compensation expense; and (6) allocation of AFFO attributable to
unvested restricted stock awards.
We believe that AFFO is a useful supplemental performance measure because it further adjusts to: (1) deduct certain expenditures that, although capitalized
and classified in depreciation expense, do not enhance the revenue or cash flows of our properties; (2) eliminate the effect of straight-lining our rental income and
capitalizing income from development projects in order to reflect the actual amount of contractual rents due in the period presented; and (3) eliminate the effect of non-cash items that are not indicative of our core operations and do not actually reduce the amount of cash generated by our operations. We believe that eliminating the
effect of non-cash charges related to share-based compensation facilitates a comparison of our operations across periods and among other equity REITs without the
variances caused by different valuation methodologies, the volatility of the expense (which depends on market forces outside our control), and the assumptions and the variety of award types that a company can use. We believe that AFFO provides useful information by excluding certain items that are not representative of our core
operating results because such items are dependent upon historical costs or subject to judgmental valuation inputs and the timing of our decisions.

ALEXANDRIA REAL ESTATE EQUITIES, INC.
June 30, 2013
ALEXANDRIA REAL ESTATE EQUITIES, INC. ALL RIGHTS RESERVED © 2013 51
Definitions and Other Information
(Unaudited)
AFFO is not intended to represent cash flow for the period, and is intended only to provide an additional measure of performance. We believe that net income attributable to Alexandria’s common stockholders is the most directly comparable GAAP financial measure to AFFO. We believe that AFFO is a widely
recognized measure of the operations of equity REITs, and presenting AFFO will enable investors to assess our performance in comparison to other equity REITs.
However, other equity REITs may use different methodologies for calculating AFFO and, accordingly, our AFFO may not be comparable to AFFO calculated by other equity REITs. AFFO should not be considered as an alternative to net income (determined in accordance with GAAP) as an indication of financial performance, or to
cash flows from operating activities (determined in accordance with GAAP) as a measure of our liquidity, nor is it indicative of funds available to fund our cash needs,
including our ability to make distributions.
Annualized base rent
Annualized base rent means the annualized fixed base rental amount in effect as of the end of the period, related to our operating rentable square feet (using
rental revenue computed on a straight-line basis in accordance with GAAP).
Average cash yield
See definition of Initial Stabilized Yield (unlevered).
Capitalized interest
A key component of our business model is our value-added development and redevelopment projects. These programs are focused on providing high-
quality generic life science laboratory space to meet the real estate requirements of and are reusable by various life science industry client tenants. Upon completion, each value-added project is expected to generate significant revenues and cash flows. Our development and redevelopment projects are generally in locations that are
highly desirable to life science entities which we believe results in higher occupancy levels, longer lease terms, and higher rental income and returns. Development
projects consist of the ground-up development of generic life science laboratory facilities. Redevelopment projects consist of the permanent change in use of office, warehouse, and shell space into generic life science laboratory space. We also have certain significant value-added projects undergoing important and substantial
predevelopment activities to bring these assets to their intended use. These critical activities add significant value and are required for the construction of buildings.
The projects will provide high-quality facilities for the life science industry and are expected to generate significant revenue and cash flows for the Company. In accordance with GAAP, we capitalize project costs clearly related to the construction, development, and redevelopment as a cost of the project. Indirect project costs
such as construction administration, legal fees, and office costs that clearly relate to projects under construction, development, and redevelopment are also capitalized as
a cost of the project. We capitalize project costs only during periods in which activities necessary to prepare an asset for its intended use are in progress. We also capitalize interest cost as a cost of the project only during the period for which activities necessary to prepare an asset for its intended use are ongoing, provided that
expenditures for the asset have been made and interest cost is incurred. Additionally, should activities necessary to prepare an asset for its intended use cease, interest,
taxes, insurance, and certain other direct project costs related to these assets would be expensed as incurred.
Cash interest
Cash interest is equal to interest expense calculated in accordance with GAAP, plus capitalized interest, less amortization of loan fees, and amortization of
debt premiums/discounts.
Construction in progress/current value-added projects
Active development/active redevelopment projects
A key component of our business model is our value-added development and redevelopment projects. These programs are focused on providing high-
quality, generic, and reusable life science laboratory space to meet the real estate requirements of a wide range of clients in the life science industry. Upon completion, each value-added project is expected to generate significant revenues and cash flows. Our development and redevelopment projects are generally in locations that are
highly desirable to life science entities, which we believe results in higher occupancy levels, longer lease terms, and higher rental income and returns. Development
projects consist of the ground-up development of generic and reusable life science laboratory facilities. We generally will not commence new development projects for aboveground vertical construction of new life science laboratory space without first securing pre-leasing for such space except when there is significant market demand
for high-quality laboratory facilities. Redevelopment projects consist of the permanent change in use of office, warehouse, and shell space into generic life science
laboratory space.
Dividend payout ratio
Dividend payout ratio (common stock) is the ratio of the absolute dollar amount of dividends on our common stock (shares of common stock outstanding on
the respective record date multiplied by the related dividend per share) to FFO attributable to Alexandria’s common stockholders on a diluted basis, as adjusted.
Dividend yield
Dividend yield for the quarter represents the annualized quarter dividend divided by the closing common stock price at the end of the quarter.
EBITDA
See Adjusted EBITDA and Adjusted EBITDA margins

ALEXANDRIA REAL ESTATE EQUITIES, INC.
June 30, 2013
ALEXANDRIA REAL ESTATE EQUITIES, INC. ALL RIGHTS RESERVED © 2013 52
Definitions and Other Information
(Unaudited)
Fixed charge coverage ratio
The fixed charge coverage ratio is useful to investors as a supplemental measure of our ability to satisfy fixed financing obligations and preferred stock
dividends. The following table presents a reconciliation of interest expense, the most directly comparable GAAP financial measure to cash interest and fixed charges:
Three Months Ended
(dollars in thousands) 6/30/13 3/31/13 12/31/12 9/30/12 6/30/12 Adjusted EBITDA $ 99,927 $ 98,941 $ 102,219 $ 95,652 $ 100,792 Interest expense – continuing operations $ 15,978 $ 18,020 $ 17,941 $ 17,092 $ 17,922 Add: capitalized interest 15,690 14,021 14,897 16,763 15,825 Less: amortization of loan fees (2,427 ) (2,386 ) (2,505 ) (2,470 ) (2,214 ) Less: amortization of debt premium/discounts (123 ) (115 ) (110 ) (112 ) (110 )
Cash interest 29,118 29,540 30,223 31,273 31,423 Dividends on preferred stock 6,471 6,471 6,471 6,471 6,903 Fixed charges $ 35,589 $ 36,011 $ 36,694 $ 37,744 $ 38,326
Fixed charge coverage ratio – quarter annualized 2.8x 2.7x 2.8x 2.5x 2.6x Fixed charge coverage ratio – trailing 12 months 2.7x 2.7x 2.6x 2.6x 2.7x
Funds from operations and funds from operations, as adjusted
GAAP basis accounting for real estate assets utilizes historical cost accounting and assumes that real estate values diminish over time. In an effort to
overcome the difference between real estate values and historical cost accounting for real estate assets, the Board of Governors of the National Association of Real Estate Investment Trusts (“NAREIT”) established the measurement tool of FFO. Since its introduction, FFO has become a widely used non-GAAP financial measure
among equity REITs. We believe that FFO is helpful to investors as an additional measure of the performance of an equity REIT. Moreover, we believe that FFO, as
adjusted, is also helpful because it allows investors to compare our performance to the performance of other real estate companies between periods, and on a consistent basis, without having to account for differences caused by investment and disposition decisions, financing decisions, terms of securities, capital structures, and capital
market transactions. We compute FFO in accordance with standards established by the Board of Governors of NAREIT in its April 2002 White Paper and related
implementation guidance (“NAREIT White Paper”). The NAREIT White Paper defines FFO as net income (computed in accordance with GAAP), excluding gains (losses) from sales of depreciable real estate and land parcels and impairments of depreciable real estate (excluding land parcels), plus real estate related depreciation
and amortization, and after adjustments for unconsolidated partnerships and joint ventures. Impairments of real estate relate to decreases in the estimated fair value of
real estate due to changes in general market conditions and do not necessarily reflect the operating performance of the properties during the corresponding period. Impairments of real estate represent the non-cash write-down of assets when fair value over the recoverability period is less than the carrying value. We compute FFO,
as adjusted, as FFO calculated in accordance with the NAREIT White Paper, plus losses on early extinguishment of debt, preferred stock redemption charges, and
impairments of land parcels, less realized gain on equity investment primarily related to one non-tenant life science entity, and the amount of such items that is allocable to our unvested restricted stock awards. Our calculations of both FFO and FFO, as adjusted, may differ from those methodologies utilized by other equity REITs for
similar performance measurements, and, accordingly, may not be comparable to those of other equity REITs. Neither FFO nor FFO, as adjusted, should be considered
as an alternative to net income (determined in accordance with GAAP) as an indication of financial performance, or to cash flows from operating activities (determined in accordance with GAAP) as a measure of liquidity, nor are they indicative of the availability of funds for our cash needs, including funds available to make
distributions.
Future value-added projects
Land held for future development
All predevelopment efforts have been advanced to appropriate stages and no further predevelopment activities are ongoing and therefore, interest, property taxes, and other costs related to these assets are expensed as incurred. We generally will not commence new development projects for aboveground vertical
construction of new life science laboratory space without first securing pre-leasing for such space.
Land undergoing predevelopment activities (additional CIP)
Land undergoing predevelopment activities includes activities prior to commencement of vertical construction of aboveground building improvements and is classified as construction in progress. We generally will not commence ground-up development of any parcels undergoing predevelopment activities without first
securing pre-leasing for such space. If vertical aboveground construction is not initiated at completion of predevelopment activities, the land parcel will be classified as
land held for future development. Our objective with predevelopment is to reduce the time it takes to deliver projects to prospective client tenants. The largest project
included in land undergoing predevelopment consists of substantially all of our 1.2 million developable square feet at the Alexandria Center™ at Kendall Square in East
Cambridge, Massachusetts.
We are required to capitalize project costs, including interest, property taxes, insurance, and other costs directly related and essential to the development or
construction of a project during periods when activities necessary to prepare an asset for its intended use are in progress. Predevelopment costs generally include the
following activities prior to commencement of vertical construction:
Traditional preconstruction costs including entitlement, design, construction drawings, Building Information Modeling (3-D virtual modeling), budgeting,
sustainability and energy optimization reviews, permitting, and planning for all aspects of the project prior to vertical construction of aboveground building improvements including infrastructure, belowground site work, utility connections, land grading and egress and regress access points. Traditional
preconstruction costs also include interest, property taxes, and insurance.
Site and infrastructure construction costs including belowground site work, utility connections, land grading, drainage, egress and regress access points, foundation, and other costs to prepare the site for vertical construction of aboveground building improvements. For example, site and infrastructure costs for the
1.2 million RSF related to 50 Binney Street, 100 Binney Street, and 228,000 RSF of residential at the Alexandria Center™ at Kendall Square are classified as
preconstruction prior to commencement of vertical construction. Site and infrastructure costs related to 75/125 Binney Street and 225 Binney Street are included in our estimate of cost of completion and initial stabilized yields for each project.

ALEXANDRIA REAL ESTATE EQUITIES, INC.
June 30, 2013
ALEXANDRIA REAL ESTATE EQUITIES, INC. ALL RIGHTS RESERVED © 2013 53
Definitions and Other Information (Unaudited)
Gross assets
Gross assets are equal to total assets plus accumulated depreciation, less cash, cash equivalents, and restricted cash.
Initial stabilized yield (unlevered)
Initial Stabilized Yield is calculated as the quotient of the estimated amounts of NOI and our investment in the property at stabilization. Our Initial Stabilized Yield excludes the impact of leverage. Our cash rents related to our value-added projects are expected to increase over time and our Average Cash Yields are
expected, in general, to be greater than our Initial Stabilized Yields on a cash basis. Our estimates for initial cash and GAAP yields, and total costs at completion, represent our initial estimates at the commencement of the project. We expect to update this information upon completion of the project, or sooner if there are
significant changes to the expected project yields or costs.
Initial Stabilized Yield - cash basis: reflects cash rents at the date of stabilization and does not reflect contractual rent escalations beyond the stabilization
date.
Initial Stabilized Yield - GAAP basis: reflects cash rents, including contractual rent escalations and any rent concessions over the term of the lease, calculated on a straight-line basis.
Average Cash Yield reflects cash rents, including contractual rent escalations, over the term of the initial leases at stabilization, calculated on a straight-line
basis, but excludes any rent concessions.
Interest coverage ratio
Interest coverage ratio is the ratio of Adjusted EBITDA to cash interest. This ratio is useful to investors as an indicator of our ability to service our cash interest obligations. See fixed charge coverage ratio for calculation of cash interest. The following table summarizes the calculation of the interest coverage ratio:
Three Months Ended
(dollars in thousands) 6/30/13 3/31/13 12/31/12 9/30/12 6/30/12 Adjusted EBITDA $ 99,927 $ 98,941 $ 102,219 $ 95,652 $ 100,792 Cash interest $ 29,118 $ 29,540 $ 30,223 $ 31,273 $ 31,423 Interest coverage ratio – quarter annualized 3.4x 3.3x 3.4x 3.1x 3.2x Interest coverage ratio – trailing 12 months 3.3x 3.2x 3.2x 3.2x 3.3x
Net debt
Net debt is equal to the sum of total debt less cash, cash equivalents, and restricted cash.
NOI
NOI is a non-GAAP financial measure equal to income from continuing operations, the most directly comparable GAAP financial measure, plus loss (gain)
on early extinguishment of debt, impairment of land parcel, depreciation and amortization, interest expense, and general and administrative expense. We believe NOI provides useful information to investors regarding our financial condition and results of operations because it reflects primarily those income and expense items that are
incurred at the property level. Therefore, we believe NOI is a useful measure for evaluating the operating performance of our real estate assets. NOI on a cash basis is
NOI on a GAAP basis, adjusted to exclude the effect of straight-line rent adjustments required by GAAP. We believe that NOI on a cash basis is helpful to investors as an additional measure of operating performance because it eliminates straight-line rent adjustments to rental revenue.
Further, we believe NOI is useful to investors as a performance measure, because when compared across periods, NOI reflects the impact on operations from trends in occupancy rates, rental rates, and operating costs, providing perspective not immediately apparent from income from continuing operations. NOI excludes
certain components from income from continuing operations in order to provide results that are more closely related to the results of operations of our properties. For
example, interest expense is not necessarily linked to the operating performance of a real estate asset and is often incurred at the corporate level rather than at the property level. In addition, depreciation and amortization, because of historical cost accounting and useful life estimates, may distort operating performance at the
property level. Real estate impairments have been excluded in deriving NOI because we do not consider impairment losses to be property level operating expenses.
Real estate impairment losses relate to changes in the values of our assets and do not reflect the current operating performance with respect to related revenues or expenses. Our real estate impairments represent the write down in the value of the assets to the estimated fair value less cost to sell. These impairments result from
investing decisions and the deterioration in market conditions that adversely impact underlying real estate values. Our calculation of NOI also excludes charges
incurred from changes in certain financing decisions, such as losses on early extinguishment of debt, as these charges often relate to the timing of corporate strategy.
Property operating expenses that are included in determining NOI consist of costs that are related to our operating properties, such as utilities, repairs and maintenance,
rental expense related to ground leases, contracted services, such as janitorial, engineering, and landscaping, property taxes and insurance, and property level salaries.
General and administrative expenses consist primarily of accounting and corporate compensation, corporate insurance, professional fees, office rent, and office supplies that are incurred as part of corporate office management. NOI presented by us may not be comparable to NOI reported by other equity REITs that define NOI
differently. We believe that in order to facilitate a clear understanding of our operating results, NOI should be examined in conjunction with income from continuing
operations as presented in our condensed consolidated statements of income. NOI should not be considered as an alternative to income from continuing operations as an indication of our performance, or as an alternative to cash flows as a measure of liquidity, or our ability to make distributions.

ALEXANDRIA REAL ESTATE EQUITIES, INC.
June 30, 2013
ALEXANDRIA REAL ESTATE EQUITIES, INC. ALL RIGHTS RESERVED © 2013 54
Definitions and Other Information
(Unaudited)
Same property comparisons
As a result of changes within our total property portfolio, the financial data presented in the Summary of Same Property Comparisons shows significant
changes in revenue and expenses from period to period. In order to supplement an evaluation of our results of operations over a given period, we analyze the operating performance for all properties that were fully operating for the entire periods presented for the quarter periods (herein referred to as “Same Properties”) separate from
properties acquired subsequent to the first day in the first period presented, properties undergoing active development and active redevelopment, and corporate entities
(legal entities performing general and administrative functions), which are excluded from same property results (herein referred to as “Non-Same Properties”). Additionally, rental revenues from lease termination fees, if any, are excluded from the results of the Same Properties.
Total market capitalization
Total market capitalization is equal to the sum of outstanding shares of Series E Preferred Stock and common stock multiplied by the related closing price of each class at the end of each period presented, the liquidation value of the series D cumulative convertible preferred stock and total debt.
Unencumbered NOI as a percentage of total NOI
Unencumbered NOI as a percentage of total NOI is a non-GAAP financial measure that we believe is useful to investors as a performance measure of our
results of operations of our unencumbered real estate assets, as it reflects primarily those income and expense items that are incurred at the unencumbered property
level. We use unencumbered NOI as a percentage of total NOI in order to assess our compliance with our financial covenants under our debt obligations because the
measure serves as a proxy for a financial measure under such debt obligations. Unencumbered NOI is derived from assets classified in continuing operations which are
not subject to any mortgage, deed of trust, lien, or other security interest as of the period for which income is presented. Unencumbered NOI for periods prior to the three months ended June 30, 2013, has been reclassified to conform to current period presentation related to discontinued operations.
Three Months Ended Six Months Ended
(dollars in thousands) 6/30/13 3/31/13 12/31/12 9/30/12 6/30/12 6/30/13 6/30/12
Unencumbered NOI $ 75,225 $ 71,402 $ 74,680 $ 71,349 $ 74,823 $ 146,627 $ 141,022
Encumbered NOI 32,687 33,754 30,698 27,298 28,668 66,441 57,727
Total NOI from continuing operations $ 107,912 $ 105,156 $ 105,378 $ 98,647 $ 103,491 $ 213,068 $ 198,749
Unencumbered NOI as a percentage of total NOI 70% 68% 71% 72% 72% 69% 71%
Unlevered IRR
We believe Unlevered IRR is a useful supplemental performance measure used by investors to evaluate the performance of a specific real estate investment.
Unlevered IRR is the annualized implied discount rate calculated from the cash flows of a real estate asset over the holding period for such asset. Unlevered IRR
represents the return that equates the present value of all capital invested in a real estate asset to the present value of all cash flows generated by that real estate asset, or
the discount rate that provides a net present value of all cash flows related to a real estate asset to zero. Unlevered IRR is calculated based upon the actual timing of cash
flows, including among others i) the initial cash purchase price; ii) cash NOI (GAAP NOI excluding the impact of straight-line rents); iii) capital expenditures; iv)
leasing costs, and v) the net sales proceeds of each respective real estate asset. Losses incurred upon sale or non-cash impairment charges recognized during our ownership period are reflected in the unlevered IRR through the net sales proceeds of each real estate asset. The calculation of Unlevered IRR does not include general
and administrative costs of the Company or interest expense related to the Company’s financing costs, because they are not directly related or attributable to the
operations of the real estate asset.
Weighted average interest rate for capitalization
The weighted average interest rate for calculating capitalization of interest required pursuant to GAAP represents a weighted average rate based on the rates
applicable to borrowings outstanding during the period and includes the impact of our interest rate swap agreements, amortization of debt discounts/premiums,
amortization of loan fees, and other bank fees. A separate calculation is performed each month to determine our weighted average interest rate for capitalization for the month. The rate will vary each month due to changes in variable interest rates, outstanding debt balances, the proportion of variable rate debt to fixed rate debt, the
amount and terms of effective interest rate swap agreements, and the amount of loan fee amortization.
Weighted average shares for calculating FFO, FFO, as adjusted, and AFFO per share
Weighted average shares represent the weighted average of common shares outstanding during the period. The following calculation of weighted average shares was applied to arrive at FFO per share attributable to Alexandria’s common stockholders, FFO per share attributable to Alexandria’s common stockholders, as
adjusted, and AFFO per share attributable to Alexandria’s common stockholders:
Three Months Ended Six Months Ended
6/30/13 3/31/13 12/31/12 9/30/12 6/30/12 6/30/13 6/30/12
Weighted average shares of common stock outstanding for calculating FFO, FFO, as adjusted, and AFFO per share attributable to
Alexandria’s common stockholders – basic 66,972,892
63,161,319 63,091,781 62,364,210 61,663,367 65,077,635 61,585,587
Effect of assumed conversion and dilutive securities: Assumed conversion of 8.00% Unsecured Senior
Convertible Notes 6,146
6,146 6,146 6,087 6,087 6,146 6,087
Dilutive effect of stock options − − − − 173 − 667
Weighted average shares of common stock outstanding for calculating FFO, FFO, as adjusted, and AFFO per share attributable to
Alexandria’s common stockholders – diluted 66,979,038
63,167,465 63,097,927 62,370,297 61,669,627 65,083,781 61,592,341