Embed Size (px)
Citation preview
VAPOR PRESSURE DATA AND ANALYSIS FOR SELECTED HD DECOMPOSITION PRODUCTS: 1,4-THIOXANE,
DIVINYL SULFOXIDE, CHLOROETHYL ACETYLSULFIDE, AND 1,4-DITHIANE
ECBC-TR-1514
Ann Brozena
RESEARCH AND TECHNOLOGY DIRECTORATE
David E. Tevault
JOINT RESEARCH AND DEVELOPMENT, INC. Belcamp, MD 21017-1552
June 2018
Approved for public release: distribution unlimited.

Disclaimer
The findings in this report are not to be construed as an official Department of the Army position unless so designated by other authorizing documents.

i
REPORT DOCUMENTATION PAGE Form Approved
OMB No. 0704-0188 Public reporting burden for this collection of information is estimated to average 1 h per response, including the time for reviewing instructions, searching existing data sources, gathering and maintaining the data needed, and completing and reviewing this collection of information. Send comments regarding this burden estimate or any other aspect of this collection of information, including suggestions for reducing this burden to Department of Defense, Washington Headquarters Services, Directorate for Information Operations and Reports (0704-0188), 1215 Jefferson Davis Highway, Suite 1204, Arlington, VA 22202-4302. Respondents should be aware that notwithstanding any other provision of law, no person shall be subject to any penalty for failing to comply with a collection of information if it does not display a currently valid OMB control number. PLEASE DO NOT RETURN YOUR FORM TO THE ABOVE ADDRESS.
1. REPORT DATE (DD-MM-YYYY)
XX-06-2018 2. REPORT TYPE
Final 3. DATES COVERED (From - To)
Dec 2017 – May 2018
4. TITLE AND SUBTITLE
Vapor Pressure Data and Analysis for Selected HD Decomposition
Products: 1,4-Thioxane, Divinyl Sulfoxide, Chloroethyl Acetylsulfide, and
1,4-Dithiane
5a. CONTRACT NUMBER
5b. GRANT NUMBER
5c. PROGRAM ELEMENT NUMBER
6. AUTHOR(S)
Brozena, Ann (ECBC); and Tevault, David E. (JRAD)
5d. PROJECT NUMBER
CB Defense Technology Base Program 5e. TASK NUMBER
5f. WORK UNIT NUMBER
7. PERFORMING ORGANIZATION NAME(S) AND ADDRESS(ES)
Director, ECBC, ATTN: RDCB-DRC-P, APG, MD 21010-5424
Joint Research and Development (JRAD), Inc.; 4694 Millennium Drive,
Suite 105, Belcamp, MD 21017-1552
8. PERFORMING ORGANIZATION REPORT NUMBER
ECBC-TR-1514
9. SPONSORING / MONITORING AGENCY NAME(S) AND ADDRESS(ES)
Defense Threat Reduction Agency, 8725 John J. Kingman Road, MSC
6201, Fort Belvoir, VA 22060-6201
10. SPONSOR/MONITOR’S ACRONYM(S)
DTRA 11. SPONSOR/MONITOR’S REPORT NUMBER(S)
12. DISTRIBUTION / AVAILABILITY STATEMENT
Approved for public release: distribution unlimited.
13. SUPPLEMENTARY NOTES 14. ABSTRACT:
Recent work from our laboratory focused on the physical properties of chemical warfare agents and their surrogates,
precursors, and degradation products. This report documents vapor pressure data for four sulfur-containing
decomposition products from bis-(2-chloroethyl) sulfide (HD). These data were measured using an ASTM International
method that is based on differential scanning calorimetry (DSC). The data presented herein were used to determine
temperature–vapor pressure correlations. The fit constants were used to determine temperature-dependent
thermodynamic properties and to enable interpolation and limited extrapolation of the data. The new data are compared
to previous literature. In most cases, the agreement is good. In all cases, the DSC data expand the range of previously
reported measurements.
15. SUBJECT TERMS
Vapor pressure Antoine equation
Enthalpy of vaporization Volatility
Clausius–Clapeyron equation Entropy of vaporization
Chemical Abstracts Service (CAS) Divinyl sulfoxide (DVSO), CAS no. 1115-15-7
1,4-Dithiane (DTH), CAS no. 505-29-3 1,4-Thioxane (THX), CAS no. 15980-15-1
Chloroethyl acetylsulfide (CEAS), CAS no. 55847-36-4 Bis-(2-chloroethyl) sulfide (HD), CAS no. 505-60-2
16. SECURITY CLASSIFICATION OF:
17. LIMITATION OF ABSTRACT
18. NUMBER OF PAGES
19a. NAME OF RESPONSIBLE PERSON
Renu B. Rastogi a. REPORT b. ABSTRACT c. THIS PAGE 19b. TELEPHONE NUMBER (include area code)
U U U UU 34 (410) 436-7545 Standard Form 298 (Rev. 8-98)
Prescribed by ANSI Std. Z39.18

ii
Blank
iii
PREFACE
The work described in this report was authorized under the Chemical and
Biological Technology Base Program. The work was started in December 2017 and completed in
May 2018. The data reported here are contained in U.S. Army Edgewood Chemical Biological
Center (ECBC; Aberdeen Proving Ground, MD) notebooks 99-0095 and 06-0114.
The use of either trade or manufacturers’ names in this report does not constitute
an official endorsement of any commercial products. This report may not be cited for purposes of
advertisement.
This report has been approved for public release.
Acknowledgments
The ECBC Agent Chemistry Branch synthesized, purified, and analyzed divinyl
sulfoxide and chloroethyl acetylsulfide. Mrs. Helga Weller (ECBC) helped with reference
translation. The ECBC technical library personnel located and procured several references.

iv
Blank
v
CONTENTS
PREFACE ..............................................................................................................iii
1. INTRODUCTION ...................................................................................................1
2. EXPERIMENTAL PROCEDURES ........................................................................2
2.1 Materials and Method ........................................................................................2 2.2 Data Analysis .....................................................................................................2
3. RESULTS ................................................................................................................4
3.1 THX ...................................................................................................................4 3.2 DVSO .................................................................................................................7 3.3 CEAS .................................................................................................................9 3.4 DTH .................................................................................................................11
4. DISCUSSION ........................................................................................................14
5. CONCLUSIONS....................................................................................................18
LITERATURE CITED ..........................................................................................19
ACRONYMS AND ABBREVIATIONS ..............................................................23
vi
FIGURES
1. Structures and identification of title compounds .....................................................1 2. Vapor pressure data and Antoine equation correlations for THX ...........................6
3. Vapor pressure data and Antoine equation correlations for DVSO .........................8 4. Vapor pressure data and Antoine equation correlations for CEAS .......................10 5. Vapor pressure data and correlations for DTH ......................................................13 6. Calculated entropy of vaporization versus NBPt for selected compounds ............17 7. Vapor pressure comparison for title compounds and selected CWAs ...................18
TABLES
1. Sample Information for Title Compounds ...............................................................2 2. Experimental Vapor Pressure Data and Comparison to Calculated Values
for THX ....................................................................................................................5 3. Calculated Vapor Pressure, Volatility, and Enthalpy of Vaporization for
THX at Selected Temperatures ................................................................................6 4. Experimental Vapor Pressure Data and Comparison to Calculated Values
for DVSO .................................................................................................................7
5. Calculated Vapor Pressure, Volatility, and Enthalpy of Vaporization for
DVSO at Selected Temperatures .............................................................................8
6. Experimental Vapor Pressure Data and Comparison to Calculated Values
for CEAS ..................................................................................................................9 7. Calculated Vapor Pressure, Volatility, and Enthalpy of Vaporization for
CEAS at Selected Temperatures ............................................................................10
8. Experimental Vapor Pressure Data and Comparison to Calculated Values
for Solid-Phase DTH..............................................................................................11 9. Experimental Vapor Pressure Data and Comparison to Calculated Values
for Liquid-Phase DTH ...........................................................................................12 10. Calculated Vapor Pressure, Volatility, and Enthalpy of Volatilization for
Liquid- and Solid-Phase DTH at Selected Temperatures ......................................14 11. Entropies of Vaporization Calculated from Antoine Equation Constants
for Selected Compounds Studied at ECBC ...........................................................16

1
VAPOR PRESSURE DATA AND ANALYSIS FOR SELECTED
HD DECOMPOSITION PRODUCTS: 1,4-THIOXANE, DIVINYL SULFOXIDE,
CHLOROETHYL ACETYLSULFIDE, AND 1,4-DITHIANE
1. INTRODUCTION
The U.S. Army Edgewood Chemical Biological Center (ECBC; Aberdeen
Proving Ground, MD) has a long history of interest in the thermophysical properties of chemical
warfare agents (CWAs) and related compounds.1–8 Knowledge of the physical properties of
materials is critical for understanding their behavior in the environment as well as in the
laboratory. Vapor pressure is an important physical property for a wide variety of chemical
defense related applications, including evaluation of toxicological properties, estimation of
persistence, assessment of air filtration system efficiency, prediction of downwind time–
concentration profiles after dissemination, and generation of controlled challenge concentrations
for detector testing.
Recently, our laboratory investigated and documented the experimental vapor
pressures and thermodynamic properties that were derived from these data, which included
temperature correlations and temperature-dependent volatility and enthalpy of volatilization
(vaporization for liquids and sublimation for solids) for selected CWA and related precursors,
degradation products, and simulants.9–20 Our most recent report focused on exploring
correlations to allow extrapolation of high-temperature data to ambient temperature to facilitate
the accurate prediction of vapor pressure and related properties at practical untested conditions.21
This report documents vapor pressure measurements, correlations, and
thermodynamic properties that were derived from vapor pressure data for four organosulfur
CWA degradation products that are of interest to the chemical defense community because of
their structural similarity to bis-(2-chloroethyl) sulfide, which is commonly known as mustard
gas or HD. The measurements were performed using differential scanning calorimetry (DSC).
These four organosulfur compounds may serve as candidate testing surrogates or signature
compounds for HD. The structures, full names, and Chemical Abstracts Service (CAS) registry
numbers for the subject compounds are provided in Figure 1.
Figure 1. Structures and identification of title compounds.
1,4-Dithiane (DTH) 1,4-Thioxane (THX) Divinyl Sulfoxide (DVSO) Chloroethyl Acetylsulfide (CEAS)CAS No. 505-29-3 CAS No. 15980-15-1 CAS No. 1115-15-7 CAS No. 693-07-2 C4H8S2, MW = 120.24 C4H8SO, MW = 104.17 C4H6SO, MW = 102.15 C3H7SCl, MW = 110.61
2
2. EXPERIMENTAL PROCEDURES
2.1 Materials and Method
The source and purity of the materials studied are listed in Table 1.
Table 1. Sample Information for Title Compounds
Compound Purity
(%) Source
DTH 97 Aldrich
THX 98 Aldrich
DVSO 99 In-house
CEAS 99 In-house
A TA Instruments (New Castle, DE) model 910 DSC system with a 2200
controller was used for this work, and the measurements were carried out in accordance with
ASTM International method E1782, Standard Test Method for Determining Vapor Pressure by
Thermal Analysis.22 The method and instrumentation have been described in detail in a previous
publication.12
Other than a few distillation data points, literature vapor pressure data are not
available for CEAS, DVSO, THX, and liquid DTH. Literature data measured using three
complementary methods have been reported for (solid) DTH.
2.2 Data Analysis
Correlating vapor pressure data as a function of temperature to permit
interpolation within the experimental range and accurate extrapolation beyond the range can be
challenging due to the number of equations that are available for this purpose, inadequately
documented experimental work, poor data quality, or limited experimental range. High-quality
vapor pressure data that are measured over a wide range typically exhibit negative curvature on a
standard vapor pressure (P) plot (ln P vs reciprocal temperature), which corresponds to a
decreasing enthalpy of vaporization with increasing temperature. The commonly used Clausius–
Clapeyron correlation, eq 1, has no curvature due to the assumption of a constant enthalpy of
vaporization with temperature and is usually used to correlate data over narrow temperature
ranges for subsequent limited extrapolations. An Antoine fit, eq 2, can accommodate curvature
of the data but depending on range and quality, may exhibit thermodynamically prohibited
positive curvature rather than the expected negative curvature that is characteristic of high-
quality data. However, an Antoine fit may also produce excessive negative curvature depending
on data quality and range. As a result, correlations can improperly estimate vapor pressure at
untested conditions outside the experimental temperature range.
3
ln(P) = a – b/T (1)
ln(P) = a – b/(c + T) (2)
where P is vapor pressure in pascal; T is absolute temperature in kelvin; and a, b, and c are fit
constants.
Equation 3 gives the Antoine equation in another common units system (Torr-°C),
which is currently deemed obsolete by most journals.
log(p) = A – B/(C + t) (3)
where p is pressure in Torr; t is temperature in Celsius; and A, B, and C are fit constants.
Conversion of the constants from eq 2 to eq 3 may be accomplished using the
substitutions provided in eqs 4–6.13,21
A = [a – ln(101325/760)]/ln(10) (4)
B = b/ln(10) (5)
C = c + 273.15 (6)
The a and b constants are divided by ln(10) to convert from natural log to
log base 10, and the a constant requires the ln(101325/760) term to account for the different
pressure units.
A 2016 publication by Brozena et al. describes methodology to correlate vapor
pressure data using the Antoine equation, which is optimized using a least-squares method.23
This method also applies to the Clausius–Clapeyron equation, where the c constant is assigned a
value of 0.
The ability to accurately predict vapor pressure at ambient temperatures is of
particular concern when only high-temperature data are available. While correlating vapor
pressure data with the Antoine equation, Thomson found that, “In many cases which have been
studied C lies between 220 and 240 [c = –53 to –33 for pascal units]” and suggested using
C = 230 (c = –43) as a “good average value” for correlation of vapor pressure data “for organic
compounds which are liquid at room temperature”.24 Our data for more than 25 compounds that
were measured using complementary methods are consistent with Thomson’s observation. We
recently demonstrated that using the suggested c constant produces more accurate predictions of
ambient temperature vapor pressure than does extrapolating high-temperature data using an
unconstrained Antoine equation.21 As a result, we have adopted Thomson’s recommendation by
constraining the Antoine equation c constant to –43 in this report for compounds lacking data in
the ambient temperature range. The recommended equations are given in two common units
systems (Torr-°C and Pa-K).
4
The literature data for the title compounds are primarily reduced-pressure boiling
points, which we have typically found to be unreliable, especially at pressures below 500 Pa.
These values are included in the figures but were not used to determine the temperature–pressure
correlations.
Several thermodynamic properties can be calculated from the vapor pressure
correlation. The enthalpy of vaporization, ∆Hvap (J/mol), is calculated as shown in eq 7.
Hvap = b × R × [T/(c + T)]2 (7)
where b and c are eq 2 coefficients, and R is the gas constant (8.3144 J/mol K).
The saturation concentration, Csat (mg/m3), which is often referred to as volatility,
is calculated as a function of temperature according to eq 8.
Csat = P × MW/R × T (8)
where MW is molecular weight and R is 8.3144 Pa m3/mol K.
The entropy of vaporization, ∆Svap (J/mol K), is calculated according to eq 9 by
dividing the enthalpy of vaporization at the normal boiling point (NBPt) by the NBPt. Trouton’s
rule states that Svap should be near 21 cal/mol K (88 J/mol K).
Svap = Hvap/NBPt (9)
3. RESULTS
The experimental data, pressure–temperature correlations, comparisons to
literature data, and calculated properties for each of the title compounds are provided in the
sections that follow.
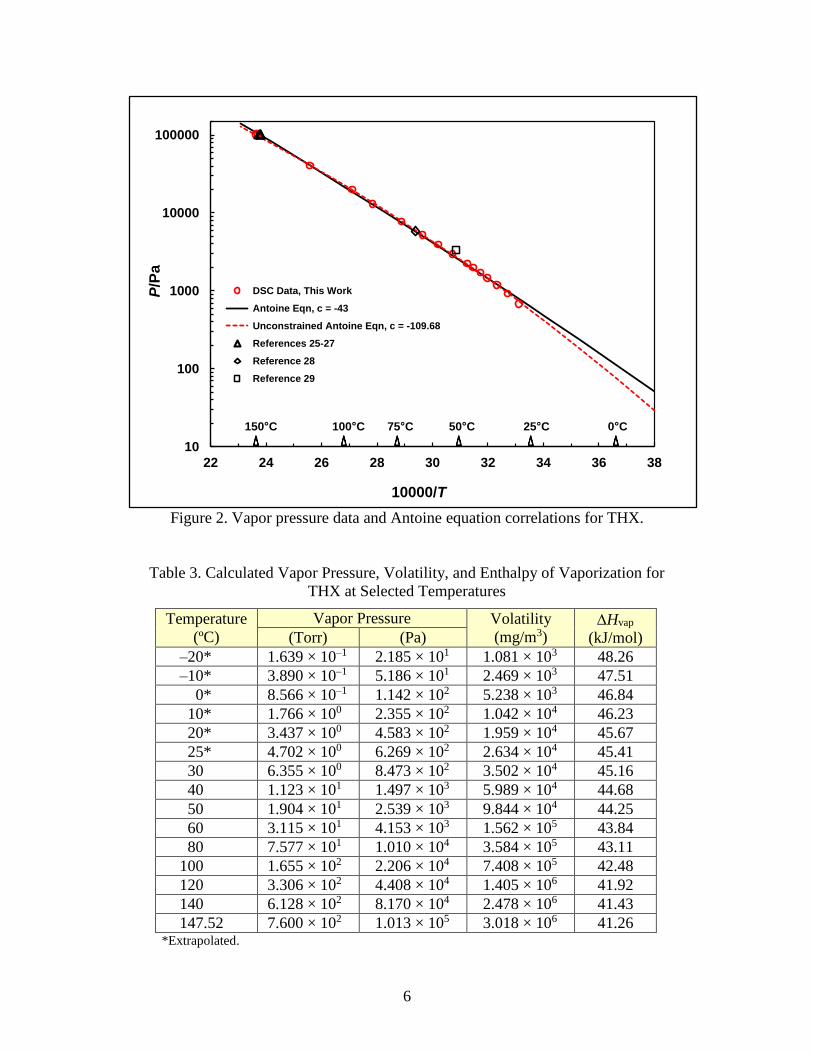
3.1 THX
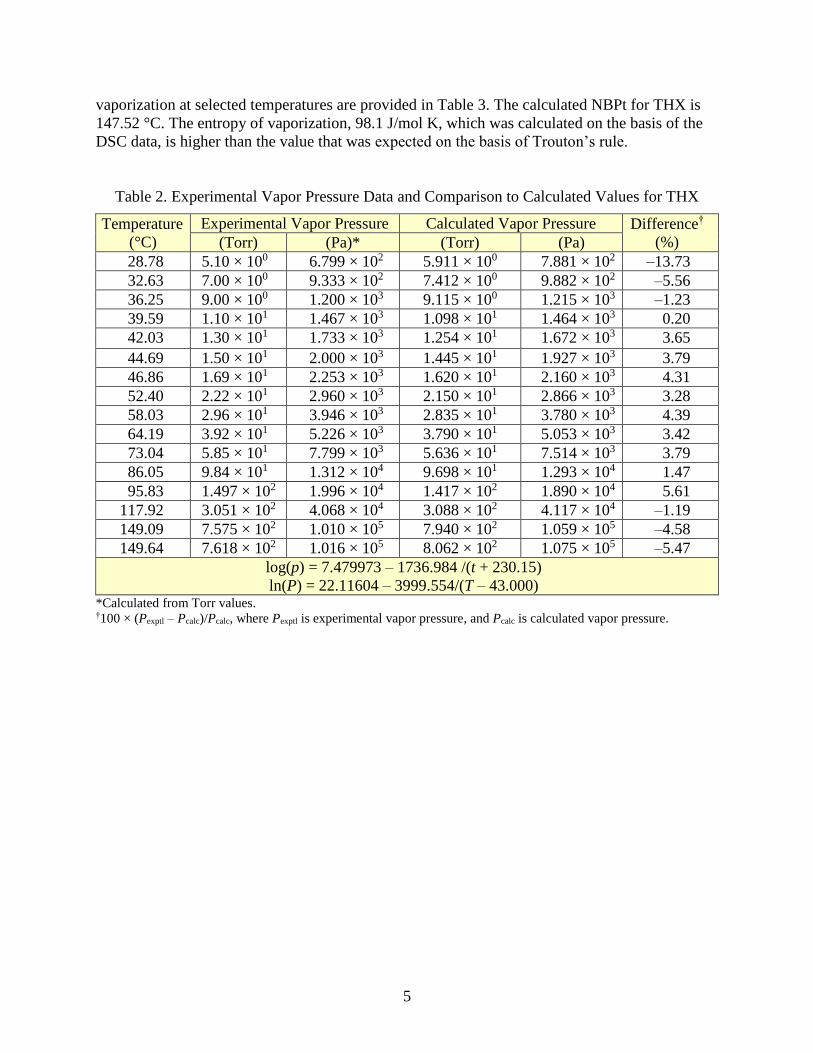
The 16 data points measured for THX using DSC at 28.80 to 149.60 °C are listed
in Table 2. The measurements covered a wide pressure range including atmospheric pressure.
The boiling endotherms were sharp with no indication of specimen degradation. Initial analysis
of the DSC data with an unconstrained Antoine equation resulted in a large negative
c constant that is characteristic of excessive negative curvature.21 As a result, the DSC data were
correlated using an Antoine equation with the c constant constrained to –43 in accordance with
Thomson’s recommendation.24 The resulting Antoine equation is given in Table 2, along with
the experimental data, the calculated values, and the percent difference at each experimental
temperature. The current experimental data, the Antoine correlation, and the literature data,
which include NBPts25–27 and reduced-pressure boiling points at 67 °C (44 Torr)28 and 51 °C
(25 Torr),29 are shown in Figure 2. The unconstrained Antoine fit with greater curvature is also
shown for comparison. Calculated values for THX vapor pressure, volatility, and enthalpy of
5
vaporization at selected temperatures are provided in Table 3. The calculated NBPt for THX is
147.52 °C. The entropy of vaporization, 98.1 J/mol K, which was calculated on the basis of the
DSC data, is higher than the value that was expected on the basis of Trouton’s rule.
Table 2. Experimental Vapor Pressure Data and Comparison to Calculated Values for THX
Temperature
(°C)
Experimental Vapor Pressure Calculated Vapor Pressure Difference†
(%) (Torr) (Pa)* (Torr) (Pa)
28.78 5.10 × 100 6.799 × 10² 5.911 × 100 7.881 × 10² –13.73
32.63 7.00 × 100 9.333 × 10² 7.412 × 100 9.882 × 10² –5.56
36.25 9.00 × 100 1.200 × 10³ 9.115 × 100 1.215 × 10³ –1.23
39.59 1.10 × 101 1.467 × 10³ 1.098 × 101 1.464 × 10³ 0.20
42.03 1.30 × 101 1.733 × 10³ 1.254 × 101 1.672 × 10³ 3.65
44.69 1.50 × 101 2.000 × 10³ 1.445 × 101 1.927 × 10³ 3.79
46.86 1.69 × 101 2.253 × 10³ 1.620 × 101 2.160 × 10³ 4.31
52.40 2.22 × 101 2.960 × 10³ 2.150 × 101 2.866 × 10³ 3.28
58.03 2.96 × 101 3.946 × 10³ 2.835 × 101 3.780 × 10³ 4.39
64.19 3.92 × 101 5.226 × 10³ 3.790 × 101 5.053 × 10³ 3.42
73.04 5.85 × 101 7.799 × 10³ 5.636 × 101 7.514 × 10³ 3.79
86.05 9.84 × 101 1.312 × 10⁴ 9.698 × 101 1.293 × 10⁴ 1.47
95.83 1.497 × 10² 1.996 × 10⁴ 1.417 × 10² 1.890 × 10⁴ 5.61
117.92 3.051 × 10² 4.068 × 10⁴ 3.088 × 10² 4.117 × 10⁴ –1.19
149.09 7.575 × 10² 1.010 × 10⁵ 7.940 × 10² 1.059 × 10⁵ –4.58
149.64 7.618 × 10² 1.016 × 10⁵ 8.062 × 10² 1.075 × 10⁵ –5.47
log(p) = 7.479973 – 1736.984 /(t + 230.15)
ln(P) = 22.11604 – 3999.554/(T – 43.000) *Calculated from Torr values. †100 × (Pexptl – Pcalc)/Pcalc, where Pexptl is experimental vapor pressure, and Pcalc is calculated vapor pressure.
6
Figure 2. Vapor pressure data and Antoine equation correlations for THX.
Table 3. Calculated Vapor Pressure, Volatility, and Enthalpy of Vaporization for
THX at Selected Temperatures
Temperature
(ºC)
Vapor Pressure Volatility
(mg/m3) Hvap
(kJ/mol) (Torr) (Pa)
–20* 1.639 × 10–1 2.185 × 101 1.081 × 10³ 48.26
–10* 3.890 × 10–1 5.186 × 101 2.469 × 10³ 47.51
0* 8.566 × 10–1 1.142 × 10² 5.238 × 10³ 46.84
10* 1.766 × 100 2.355 × 10² 1.042 × 10⁴ 46.23
20* 3.437 × 100 4.583 × 10² 1.959 × 10⁴ 45.67
25* 4.702 × 100 6.269 × 10² 2.634 × 10⁴ 45.41
30 6.355 × 100 8.473 × 10² 3.502 × 10⁴ 45.16
40 1.123 × 101 1.497 × 10³ 5.989 × 10⁴ 44.68
50 1.904 × 101 2.539 × 10³ 9.844 × 10⁴ 44.25
60 3.115 × 101 4.153 × 10³ 1.562 × 10⁵ 43.84
80 7.577 × 101 1.010 × 10⁴ 3.584 × 10⁵ 43.11
100 1.655 × 10² 2.206 × 10⁴ 7.408 × 10⁵ 42.48
120 3.306 × 10² 4.408 × 10⁴ 1.405 × 10⁶ 41.92
140 6.128 × 10² 8.170 × 10⁴ 2.478 × 10⁶ 41.43
147.52 7.600 × 10² 1.013 × 10⁵ 3.018 × 10⁶ 41.26 *Extrapolated.
10
100
1000
10000
100000
22 24 26 28 30 32 34 36 38
P/P
a
10000/T
DSC Data, This Work
Antoine Eqn, c = -43
Unconstrained Antoine Eqn, c = -109.68
References 25-27
Reference 28
Reference 29
150 C 100 C 75 C 50 C 25 C 0 C
7
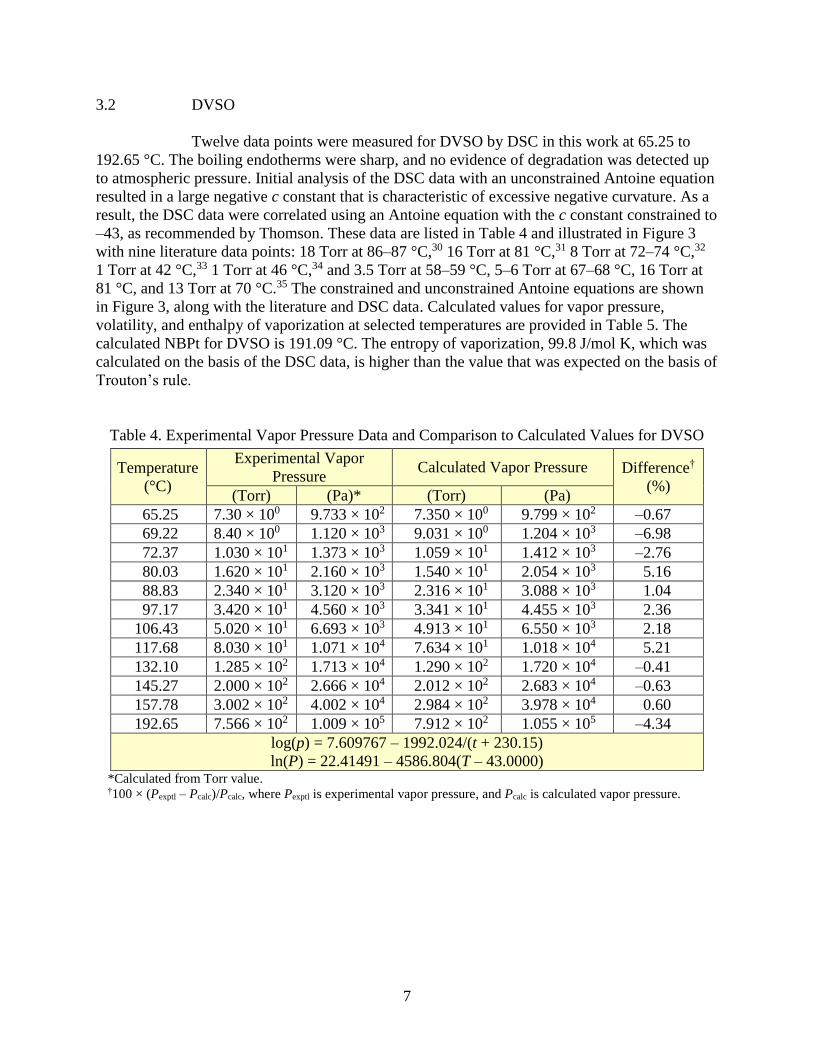
3.2 DVSO
Twelve data points were measured for DVSO by DSC in this work at 65.25 to
192.65 °C. The boiling endotherms were sharp, and no evidence of degradation was detected up
to atmospheric pressure. Initial analysis of the DSC data with an unconstrained Antoine equation
resulted in a large negative c constant that is characteristic of excessive negative curvature. As a
result, the DSC data were correlated using an Antoine equation with the c constant constrained to
–43, as recommended by Thomson. These data are listed in Table 4 and illustrated in Figure 3
with nine literature data points: 18 Torr at 86–87 °C,30 16 Torr at 81 °C,31 8 Torr at 72–74 °C,32
1 Torr at 42 °C,33 1 Torr at 46 °C,34 and 3.5 Torr at 58–59 °C, 5–6 Torr at 67–68 °C, 16 Torr at
81 °C, and 13 Torr at 70 °C.35 The constrained and unconstrained Antoine equations are shown
in Figure 3, along with the literature and DSC data. Calculated values for vapor pressure,
volatility, and enthalpy of vaporization at selected temperatures are provided in Table 5. The
calculated NBPt for DVSO is 191.09 °C. The entropy of vaporization, 99.8 J/mol K, which was
calculated on the basis of the DSC data, is higher than the value that was expected on the basis of
Trouton’s rule.
Table 4. Experimental Vapor Pressure Data and Comparison to Calculated Values for DVSO
Temperature
(°C)
Experimental Vapor
Pressure Calculated Vapor Pressure Difference†
(%) (Torr) (Pa)* (Torr) (Pa)
65.25 7.30 × 100 9.733 × 10² 7.350 × 100 9.799 × 10² –0.67
69.22 8.40 × 100 1.120 × 10³ 9.031 × 100 1.204 × 10³ –6.98
72.37 1.030 × 101 1.373 × 10³ 1.059 × 101 1.412 × 10³ –2.76
80.03 1.620 × 101 2.160 × 10³ 1.540 × 101 2.054 × 10³ 5.16
88.83 2.340 × 101 3.120 × 10³ 2.316 × 101 3.088 × 10³ 1.04
97.17 3.420 × 101 4.560 × 10³ 3.341 × 101 4.455 × 10³ 2.36
106.43 5.020 × 101 6.693 × 10³ 4.913 × 101 6.550 × 10³ 2.18
117.68 8.030 × 101 1.071 × 10⁴ 7.634 × 101 1.018 × 10⁴ 5.21
132.10 1.285 × 10² 1.713 × 10⁴ 1.290 × 10² 1.720 × 10⁴ –0.41
145.27 2.000 × 10² 2.666 × 10⁴ 2.012 × 10² 2.683 × 10⁴ –0.63
157.78 3.002 × 10² 4.002 × 10⁴ 2.984 × 10² 3.978 × 10⁴ 0.60
192.65 7.566 × 10² 1.009 × 10⁵ 7.912 × 10² 1.055 × 10⁵ –4.34
log(p) = 7.609767 – 1992.024/(t + 230.15)
ln(P) = 22.41491 – 4586.804(T – 43.0000) *Calculated from Torr value. †100 × (Pexptl – Pcalc)/Pcalc, where Pexptl is experimental vapor pressure, and Pcalc is calculated vapor pressure.
8
Figure 3. Vapor pressure data and Antoine equation correlations for DVSO.
Table 5. Calculated Vapor Pressure, Volatility, and Enthalpy of Vaporization for
DVSO at Selected Temperatures
Temperature
(°C)
Vapor Pressure Volatility
(mg/m3) Hvap
(kJ/mol)(Torr) (Pa)
–20* 1.351 × 10-2 1.801 × 100 8.743 × 101 55.34
–10* 3.642 × 10-2 4.855 × 100 2.267 × 10² 54.49
0* 9.004 × 10-2 1.200 × 101 5.400 × 10² 53.72
10* 2.065 × 10-1 2.753 × 101 1.194 × 10³ 53.02
20* 4.430 × 10-1 5.907 × 101 2.476 × 10³ 52.37
25* 6.346 × 10-1 8.461 × 101 3.487 × 10³ 52.07
30* 8.965 × 10-1 1.195 × 10² 4.844 × 10³ 51.79
40* 1.722 × 100 2.296 × 10² 9.007 × 10³ 51.24
50* 3.157 × 100 4.208 × 10² 1.600 × 10⁴ 50.74
60* 5.550 × 100 7.399 × 10² 2.729 × 10⁴ 50.28
80 1.538 × 101 2.051 × 10³ 7.134 × 10⁴ 49.44
100 3.768 × 101 5.023 × 10³ 1.654 × 10⁵ 48.72
120 8.331 × 101 1.111 × 10⁴ 3.471 × 10⁵ 48.08
140 1.691 × 10² 2.254 × 10⁴ 6.704 × 10⁵ 47.51
160 3.191 × 10² 4.255 × 10⁴ 1.207 × 10⁶ 47.01
180 5.662 × 10² 7.548 × 10⁴ 2.047 × 10⁶ 46.55
191.09 7.600 × 10² 1.013 × 10⁵ 2.682 × 10⁶ 46.32
*Extrapolated.
1
10
100
1000
10000
100000
20 22 24 26 28 30 32 34 36 38
P/P
a
10000/T
DSC Data, This Work
Antoine Eqn, c = -43
Reference 30
Reference 31
Reference 32
Reference 33
Reference 34
Reference 35
Unconstrained Antoine Eqn, c = -86.04
200 C 150 C 100 C 75 C 50 C 25 C 0 C
9
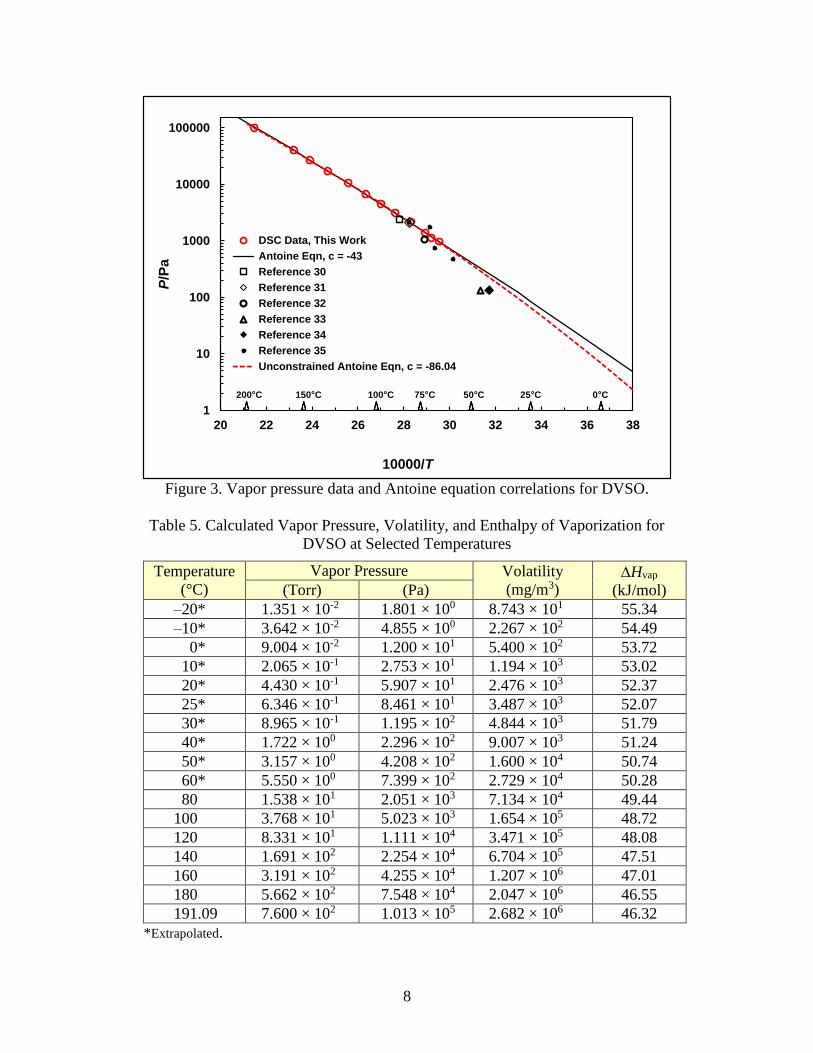
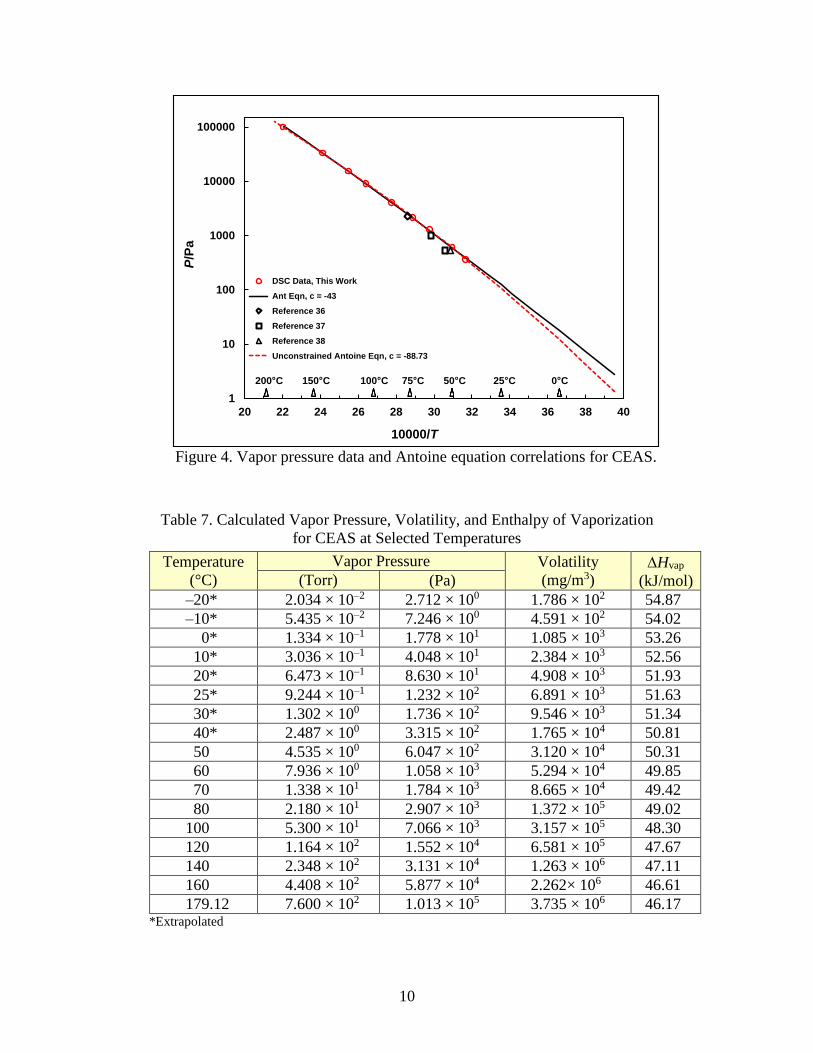
3.3 CEAS
The data in this report for CEAS consist of nine points measured by DSC at 42.86
to 181.00 ºC. The boiling endotherms were sharp over the range studied, and no indication of
decomposition was observed. Preliminary analysis of the DSC data produced an Antoine
equation with a large negative c constant that is characteristic of excessive negative curvature.
Accordingly, the Antoine c constant was constrained to –43, as recommended by Thomson.
These data are listed in Table 6, along with the recommended Antoine equation. The data are
plotted in Figure 4, along with the following four literature data points: 17 Torr at 76–76.5 °C,36
7.5 Torr at 62 °C and 4 Torr at 54 °C,37 and 4 Torr at 51 °C.38 Both the constrained and
unconstrained Antoine correlations are also shown in Figure 4. Calculated values for vapor
pressure, volatility, and enthalpy of vaporization at selected temperatures are provided in
Table 7. The calculated NBPt for CEAS is 179.12 °C. The entropy of vaporization of CEAS,
102.1 J/mol K, which was calculated on the basis of the DSC data, is higher than the value that
was expected on the basis of Trouton’s rule.
Table 6. Experimental Vapor Pressure Data and Comparison to Calculated Values for CEAS
Temperature
(°C)
Experimental Vapor
Pressure Calculated Vapor Pressure Difference†
(%) (Torr) (Pa)* (Torr) (Pa)
42.86 2.70 × 100 3.600 × 10² 2.966 × 100 3.955 × 10² –8.98
49.94 4.60 × 100 6.133 × 10² 4.520 × 100 6.026 × 10² 1.78
63.06 9.80 × 100 1.307 × 10³ 9.346 × 100 1.246 × 10³ 4.90
73.17 1.60 × 101 2.133 × 10³ 1.567 × 101 2.090 × 10³ 2.11
87.26 3.06 × 101 4.080 × 10³ 3.049 × 101 4.065 × 10³ 0.37
105.65 6.90 × 101 9.199 × 10³ 6.682 × 101 8.909 × 10³ 3.26
119.24 1.157 × 10² 1.543 × 10⁴ 1.132 × 10² 1.509 × 10⁴ 2.25
141.75 2.506 × 10² 3.341 × 10⁴ 2.488 × 10² 3.317 × 10⁴ 0.72
181.00 7.555 × 10² 1.007 × 10⁵ 7.995 × 10² 1.066 × 10⁵ –5.53
log(p) = 7.706491 – 1975.025/(t + 230.15)
ln(P) = 22.63762 – 4547.664/(T – 43.000) *Calculated from Torr value. †100 × (Pexptl – Pcalc)/Pcalc, where Pexptl is experimental vapor pressure, and Pcalc is calculated vapor pressure.
10
Figure 4. Vapor pressure data and Antoine equation correlations for CEAS.
Table 7. Calculated Vapor Pressure, Volatility, and Enthalpy of Vaporization
for CEAS at Selected Temperatures
Temperature
(°C)
Vapor Pressure Volatility
(mg/m3) Hvap
(kJ/mol)(Torr) (Pa)
–20* 2.034 × 10–2 2.712 × 100 1.786 × 10² 54.87
–10* 5.435 × 10–2 7.246 × 100 4.591 × 10² 54.02
0* 1.334 × 10–1 1.778 × 101 1.085 × 10³ 53.26
10* 3.036 × 10–1 4.048 × 101 2.384 × 10³ 52.56
20* 6.473 × 10–1 8.630 × 101 4.908 × 10³ 51.93
25* 9.244 × 10–1 1.232 × 10² 6.891 × 10³ 51.63
30* 1.302 × 100 1.736 × 10² 9.546 × 10³ 51.34
40* 2.487 × 100 3.315 × 10² 1.765 × 10⁴ 50.81
50 4.535 × 100 6.047 × 10² 3.120 × 10⁴ 50.31
60 7.936 × 100 1.058 × 10³ 5.294 × 10⁴ 49.85
70 1.338 × 101 1.784 × 10³ 8.665 × 10⁴ 49.42
80 2.180 × 101 2.907 × 10³ 1.372 × 10⁵ 49.02
100 5.300 × 101 7.066 × 10³ 3.157 × 10⁵ 48.30
120 1.164 × 10² 1.552 × 10⁴ 6.581 × 10⁵ 47.67
140 2.348 × 10² 3.131 × 10⁴ 1.263 × 10⁶ 47.11
160 4.408 × 10² 5.877 × 10⁴ 2.262× 10⁶ 46.61
179.12 7.600 × 10² 1.013 × 10⁵ 3.735 × 10⁶ 46.17 *Extrapolated
1
10
100
1000
10000
100000
20 22 24 26 28 30 32 34 36 38 40
P/P
a
10000/T
DSC Data, This Work
Ant Eqn, c = -43
Reference 36
Reference 37
Reference 38
Unconstrained Antoine Eqn, c = -88.73
200 C 150 C 100 C 75 C 50 C 25 C 0 C
11
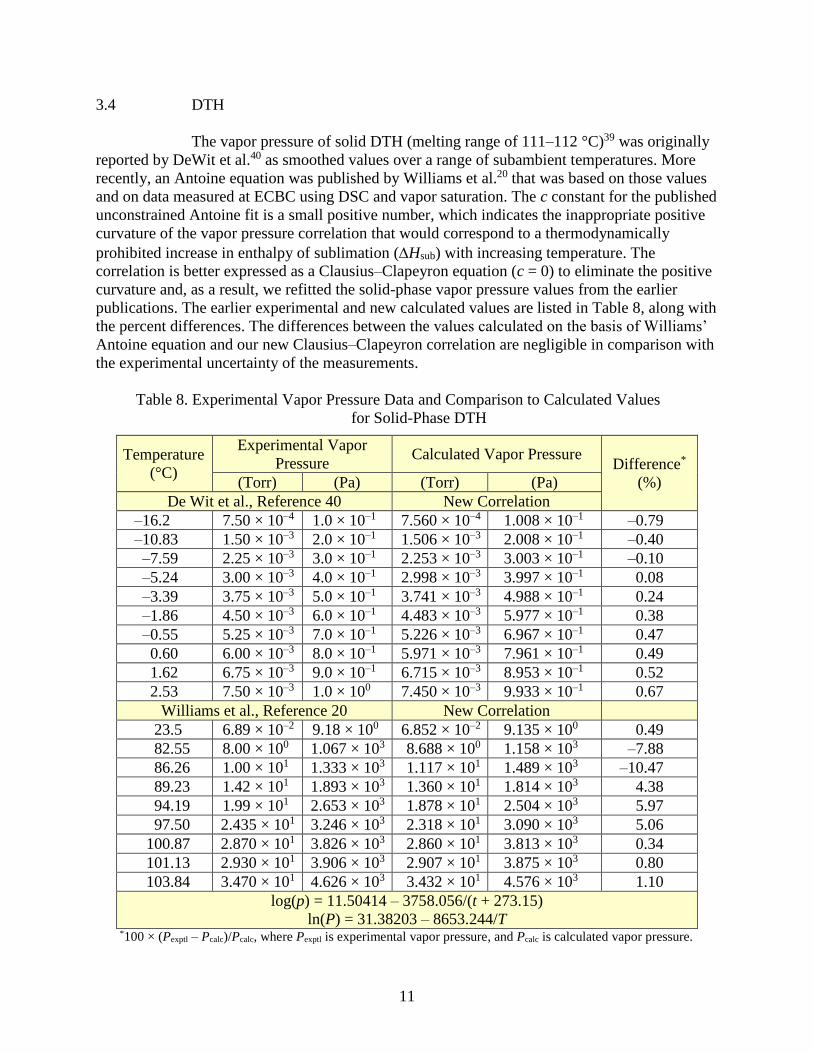
3.4 DTH
The vapor pressure of solid DTH (melting range of 111–112 °C)39 was originally
reported by DeWit et al.40 as smoothed values over a range of subambient temperatures. More
recently, an Antoine equation was published by Williams et al.20 that was based on those values
and on data measured at ECBC using DSC and vapor saturation. The c constant for the published
unconstrained Antoine fit is a small positive number, which indicates the inappropriate positive
curvature of the vapor pressure correlation that would correspond to a thermodynamically
prohibited increase in enthalpy of sublimation (Hsub) with increasing temperature. The
correlation is better expressed as a Clausius–Clapeyron equation (c = 0) to eliminate the positive
curvature and, as a result, we refitted the solid-phase vapor pressure values from the earlier
publications. The earlier experimental and new calculated values are listed in Table 8, along with
the percent differences. The differences between the values calculated on the basis of Williams’
Antoine equation and our new Clausius–Clapeyron correlation are negligible in comparison with
the experimental uncertainty of the measurements.
Table 8. Experimental Vapor Pressure Data and Comparison to Calculated Values
for Solid-Phase DTH
Temperature
(°C)
Experimental Vapor
Pressure Calculated Vapor Pressure
Difference*
(%) (Torr) (Pa) (Torr) (Pa)
De Wit et al., Reference 40 New Correlation
–16.2 7.50 × 10⁻⁴ 1.0 × 10⁻¹ 7.560 × 10⁻⁴ 1.008 × 10⁻¹ –0.79
–10.83 1.50 × 10⁻³ 2.0 × 10⁻¹ 1.506 × 10⁻³ 2.008 × 10⁻¹ –0.40
–7.59 2.25 × 10⁻³ 3.0 × 10⁻¹ 2.253 × 10⁻³ 3.003 × 10⁻¹ –0.10
–5.24 3.00 × 10⁻³ 4.0 × 10⁻¹ 2.998 × 10⁻³ 3.997 × 10⁻¹ 0.08
–3.39 3.75 × 10⁻³ 5.0 × 10⁻¹ 3.741 × 10⁻³ 4.988 × 10⁻¹ 0.24
–1.86 4.50 × 10⁻³ 6.0 × 10⁻¹ 4.483 × 10⁻³ 5.977 × 10⁻¹ 0.38
–0.55 5.25 × 10⁻³ 7.0 × 10⁻¹ 5.226 × 10⁻³ 6.967 × 10⁻¹ 0.47
0.60 6.00 × 10⁻³ 8.0 × 10⁻¹ 5.971 × 10⁻³ 7.961 × 10⁻¹ 0.49
1.62 6.75 × 10⁻³ 9.0 × 10⁻¹ 6.715 × 10⁻³ 8.953 × 10⁻¹ 0.52
2.53 7.50 × 10⁻³ 1.0 × 100 7.450 × 10⁻³ 9.933 × 10⁻¹ 0.67
Williams et al., Reference 20 New Correlation
23.5 6.89 × 10⁻² 9.18 × 100 6.852 × 10⁻² 9.135 × 100 0.49
82.55 8.00 × 100 1.067 × 10³ 8.688 × 100 1.158 × 10³ –7.88
86.26 1.00 × 101 1.333 × 10³ 1.117 × 101 1.489 × 10³ –10.47
89.23 1.42 × 101 1.893 × 10³ 1.360 × 101 1.814 × 10³ 4.38
94.19 1.99 × 101 2.653 × 10³ 1.878 × 101 2.504 × 10³ 5.97
97.50 2.435 × 101 3.246 × 10³ 2.318 × 101 3.090 × 10³ 5.06
100.87 2.870 × 101 3.826 × 10³ 2.860 × 101 3.813 × 10³ 0.34
101.13 2.930 × 101 3.906 × 10³ 2.907 × 101 3.875 × 10³ 0.80
103.84 3.470 × 101 4.626 × 10³ 3.432 × 101 4.576 × 10³ 1.10
log(p) = 11.50414 – 3758.056/(t + 273.15)
ln(P) = 31.38203 – 8653.244/T *100 × (Pexptl – Pcalc)/Pcalc, where Pexptl is experimental vapor pressure, and Pcalc is calculated vapor pressure.
12
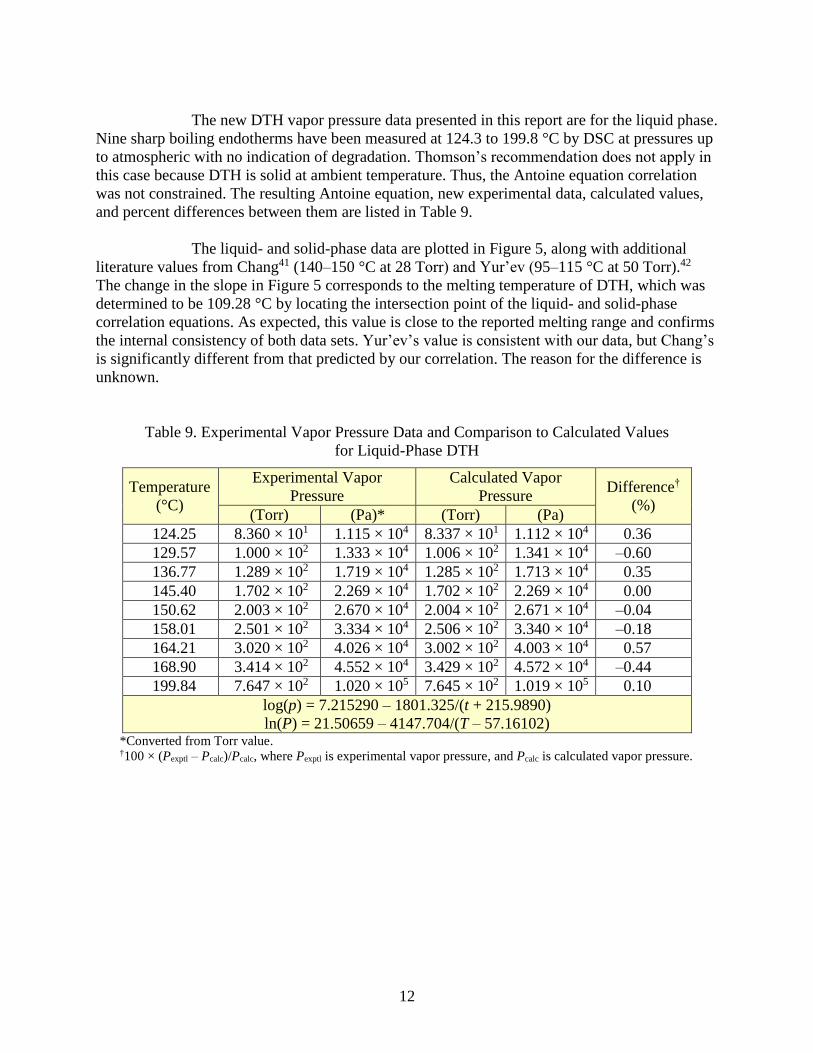
The new DTH vapor pressure data presented in this report are for the liquid phase.
Nine sharp boiling endotherms have been measured at 124.3 to 199.8 °C by DSC at pressures up
to atmospheric with no indication of degradation. Thomson’s recommendation does not apply in
this case because DTH is solid at ambient temperature. Thus, the Antoine equation correlation
was not constrained. The resulting Antoine equation, new experimental data, calculated values,
and percent differences between them are listed in Table 9.
The liquid- and solid-phase data are plotted in Figure 5, along with additional
literature values from Chang41 (140–150 °C at 28 Torr) and Yur’ev (95–115 °C at 50 Torr).42
The change in the slope in Figure 5 corresponds to the melting temperature of DTH, which was
determined to be 109.28 °C by locating the intersection point of the liquid- and solid-phase
correlation equations. As expected, this value is close to the reported melting range and confirms
the internal consistency of both data sets. Yur’ev’s value is consistent with our data, but Chang’s
is significantly different from that predicted by our correlation. The reason for the difference is
unknown.
Table 9. Experimental Vapor Pressure Data and Comparison to Calculated Values
for Liquid-Phase DTH
Temperature
(°C)
Experimental Vapor
Pressure
Calculated Vapor
Pressure Difference†
(%) (Torr) (Pa)* (Torr) (Pa)
124.25 8.360 × 101 1.115 × 10⁴ 8.337 × 101 1.112 × 10⁴ 0.36
129.57 1.000 × 10² 1.333 × 10⁴ 1.006 × 10² 1.341 × 10⁴ –0.60
136.77 1.289 × 10² 1.719 × 10⁴ 1.285 × 10² 1.713 × 10⁴ 0.35
145.40 1.702 × 10² 2.269 × 10⁴ 1.702 × 10² 2.269 × 10⁴ 0.00
150.62 2.003 × 10² 2.670 × 10⁴ 2.004 × 10² 2.671 × 10⁴ –0.04
158.01 2.501 × 10² 3.334 × 10⁴ 2.506 × 10² 3.340 × 10⁴ –0.18
164.21 3.020 × 10² 4.026 × 10⁴ 3.002 × 10² 4.003 × 10⁴ 0.57
168.90 3.414 × 10² 4.552 × 10⁴ 3.429 × 10² 4.572 × 10⁴ –0.44
199.84 7.647 × 10² 1.020 × 10⁵ 7.645 × 10² 1.019 × 10⁵ 0.10
log(p) = 7.215290 – 1801.325/(t + 215.9890)
ln(P) = 21.50659 – 4147.704/(T – 57.16102) *Converted from Torr value. †100 × (Pexptl – Pcalc)/Pcalc, where Pexptl is experimental vapor pressure, and Pcalc is calculated vapor pressure.

13
Figure 5. Vapor pressure data and correlations for DTH.
Table 10 provides a list of calculated vapor pressure, volatility, and enthalpy of
volatilization (i.e., vaporization for liquid and sublimation for solid) values for both solid and
liquid DTH at selected temperatures. Because the solid data are represented by a Clausius–
Clapeyron fit, the enthalpy of sublimation is constant over the temperature range. The calculated
NBPt for DTH is 199.59 °C. The enthalpy of fusion for DTH is 24.28 kJ/mol, which was
determined by calculating the difference in enthalpies of vaporization for liquid DTH and
sublimation for solid DTH at the melting temperature. The entropy of vaporization for DTH is
94.4 J/mol K, which was calculated on the basis of the liquid-phase DSC data and is slightly
higher than the value expected on the basis of Trouton’s rule.
0.01
0.1
1
10
100
1000
10000
100000
20 22 24 26 28 30 32 34 36 38 40 42
P/P
a
10000/T
DSC Data, Liquid
DSC Solid, Reference 20
Saturator, Reference 20
Reference 40
Reference 41
Reference 42
Antoine Eqn (Liquid)
Clausius-Clapeyron Eqn (Solid)
MPt
200 C 150 C 100 C 75 C 50 C 25 C 0 C -25 C

14
Table 10. Calculated Vapor Pressure, Volatility, and Enthalpy of Volatilization
for Liquid- and Solid-Phase DTH at Selected Temperatures
Temperature
(°C)
Vapor Pressure Volatility
(mg/m3)
Enthalpy of
Volatilization
(kJ/mol) (Torr) (Pa)
Solid-Phase DTH Hsub
–20* 4.560 × 10–4 6.079 × 10⁻² 3.473 × 100
71.95
–10 1.672 × 10⁻³ 2.228 × 10⁻¹ 1.225 × 101
0 5.571 × 10⁻³ 7.427 × 10⁻¹ 3.932 × 101
10 1.705 × 10⁻² 2.274 × 100 1.161 × 10²
20 4.837 × 10⁻² 6.449 × 100 3.181 × 10²
25 7.935 × 10⁻² 1.058 × 101 5.131 × 10²
30 1.281 × 10⁻¹ 1.707 × 101 8.144 × 10²
40 3.187 × 10⁻¹ 4.248 × 101 1.962 × 10³
50 7.494 × 10⁻¹ 9.991 × 101 4.470 × 10³
60 1.674 × 100 2.232 × 10² 9.686 × 10³
80 7.288 × 100 9.717 × 10² 3.979 × 10⁴
100 2.710 × 101 3.613 × 10³ 1.400 × 10⁵
109.28 4.756 × 101 6.341 × 10³ 2.398 × 10⁵
Liquid-Phase DTH Hvap
109.28 4.757 × 101 6.341 × 10³ 2.398 × 10⁵ 47.67
120 7.145 × 101 9.526 × 10³ 3.504 × 10⁵ 47.22
140 1.430 × 10² 1.906 × 10⁴ 6.672 × 10⁵ 46.45
160 2.657 × 10² 3.542 × 10⁴ 1.183 × 10⁶ 45.77
180 4.642 × 10² 6.184 × 10⁴ 1.973 × 10⁶ 45.16
199.59 7.600 × 10² 1.013 × 10⁵ 3.100 × 10⁶ 44.63 *Extrapolated
4. DISCUSSION
It is desirable to have vapor pressure data generated using complementary
methods over a wide range; however, that is not always possible for a number of reasons,
including sample instability, thermal degradation, and phase change within the experimental
range. The literature data for solid-phase DTH provide a good example of the benefit resulting
from the availability of complementary methods over a wide experimental range. Although the
new data in this report for THX, DVSO, and CEAS are limited to those obtained using DSC
only, the measurements for each compound covered a wide range of pressures (up to
atmospheric), and each data set is internally consistent. DSC data for liquid-phase DTH covers a
limited range due to its high melting point.
Because of the absence of reliable data in the ambient temperature range,
correlations of the new DSC data for THX, DVSO, and CEAS were calculated using a
constrained 3-parameter Antoine equation with Thomson’s suggested c constant of –43. Even
though the extrapolation to ambient temperature is relatively short for THX, the vapor pressure
calculated at 0 °C, based on the constrained Antoine equation (114.2 Pa), is about 50% higher
15
than the value calculated using the unconstrained equation (77.30 Pa). The constrained Antoine
equation for DVSO results in an extrapolated value (12.00 Pa) that is nearly twice that of the
unconstrained Antoine equation (6.84 Pa) at 0 °C. The constrained Antoine equation for CEAS
produces a value (17.78 Pa) that is about 40% higher than that of the unconstrained Antoine
equation (12.15 Pa) at 0 °C. These differences demonstrate the challenge that is attendant to the
extrapolation of vapor pressure data. Extrapolation beyond the experimental range should always
be done with caution, but we feel Thomson’s approach is preferred, when appropriate, over
either a Clausius–Clapeyron or unconstrained Antoine fit for predicting vapor pressure at
untested conditions.
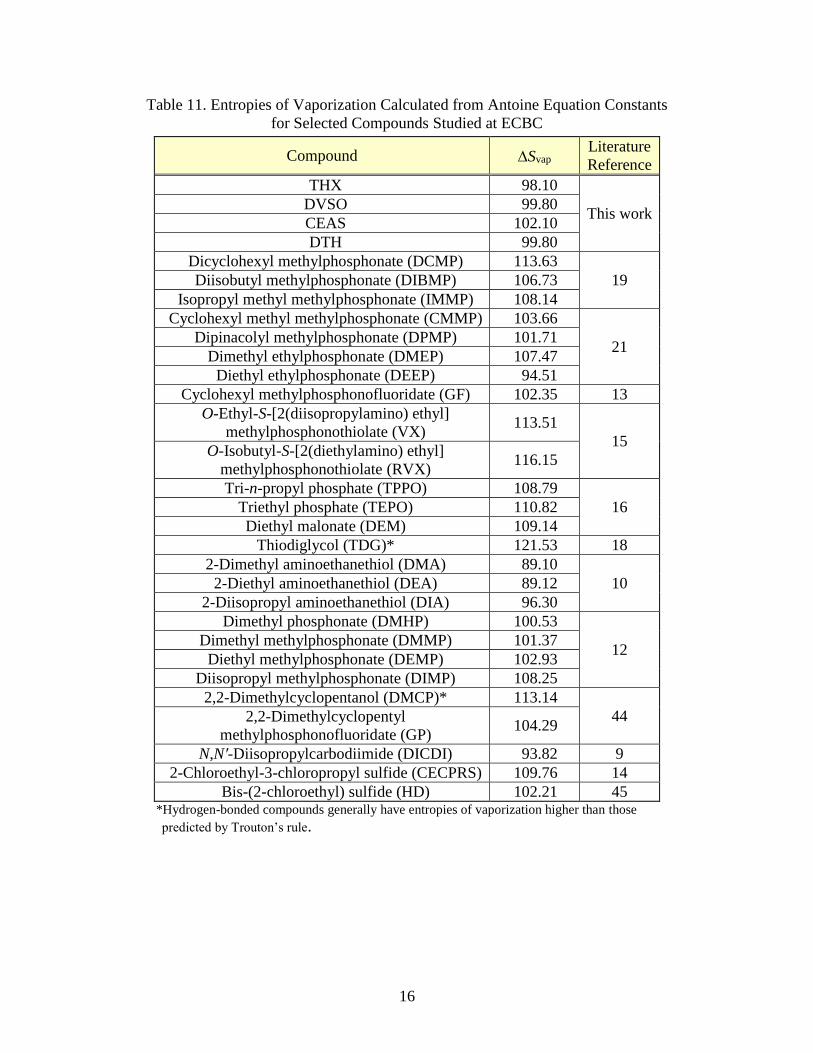
Trouton’s rule states that the Svap for many compounds is near 21 cal/mol K
(88 J/mol K). Notable exceptions include hydrogen-bonded species such as water and organic
alcohols and acids, which have Svap values greater than 90 J/mol K. Entropy of vaporization
values calculated from our data (Table 11) tend to be higher than those anticipated on the basis
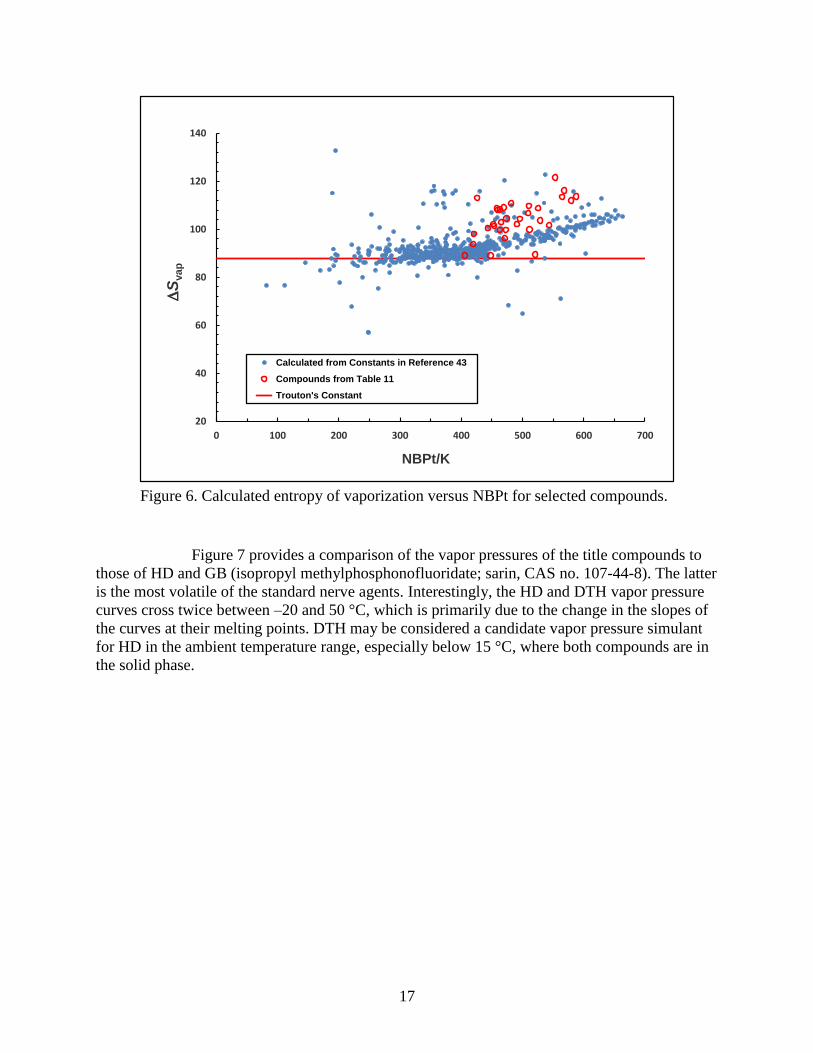
of Trouton’s rule. We calculated Svap values for 700 compounds by calculating NBPts and heats
of vaporization at the boiling points from the Antoine constants given in Yaws and Yang’s
compilation43 using eqs 2, 7, and 9 herein. The entropies of vaporization, as a function of boiling
point, which were calculated from our data and Yaws and Yang’s compilation, are shown in
Figure 6. Our analysis indicates that positive deviations from Trouton’s rule are more common
than are negative deviations. A clear trend to higher entropies of vaporization as NBPt and
molecular weight increased was observed. It is possible that other properties, such as compound
polarity and polarizability, may correlate with deviations from Trouton’s rule. This appears to be
a promising area for future investigation.
16
Table 11. Entropies of Vaporization Calculated from Antoine Equation Constants
for Selected Compounds Studied at ECBC
Compound SvapLiterature
Reference
THX 98.10
This work DVSO 99.80
CEAS 102.10
DTH 99.80
Dicyclohexyl methylphosphonate (DCMP) 113.63
19 Diisobutyl methylphosphonate (DIBMP) 106.73
Isopropyl methyl methylphosphonate (IMMP) 108.14
Cyclohexyl methyl methylphosphonate (CMMP) 103.66
21 Dipinacolyl methylphosphonate (DPMP) 101.71
Dimethyl ethylphosphonate (DMEP) 107.47
Diethyl ethylphosphonate (DEEP) 94.51
Cyclohexyl methylphosphonofluoridate (GF) 102.35 13
O-Ethyl-S-[2(diisopropylamino) ethyl]
methylphosphonothiolate (VX) 113.51
15 O-Isobutyl-S-[2(diethylamino) ethyl]
methylphosphonothiolate (RVX) 116.15
Tri-n-propyl phosphate (TPPO) 108.79
16 Triethyl phosphate (TEPO) 110.82
Diethyl malonate (DEM) 109.14
Thiodiglycol (TDG)* 121.53 18
2-Dimethyl aminoethanethiol (DMA) 89.10
10 2-Diethyl aminoethanethiol (DEA) 89.12
2-Diisopropyl aminoethanethiol (DIA) 96.30
Dimethyl phosphonate (DMHP) 100.53
12 Dimethyl methylphosphonate (DMMP) 101.37
Diethyl methylphosphonate (DEMP) 102.93
Diisopropyl methylphosphonate (DIMP) 108.25
2,2-Dimethylcyclopentanol (DMCP)* 113.14
44 2,2-Dimethylcyclopentyl
methylphosphonofluoridate (GP) 104.29
N,Nʹ-Diisopropylcarbodiimide (DICDI) 93.82 9
2-Chloroethyl-3-chloropropyl sulfide (CECPRS) 109.76 14
Bis-(2-chloroethyl) sulfide (HD) 102.21 45 *Hydrogen-bonded compounds generally have entropies of vaporization higher than those
predicted by Trouton’s rule.
17
Figure 6. Calculated entropy of vaporization versus NBPt for selected compounds.
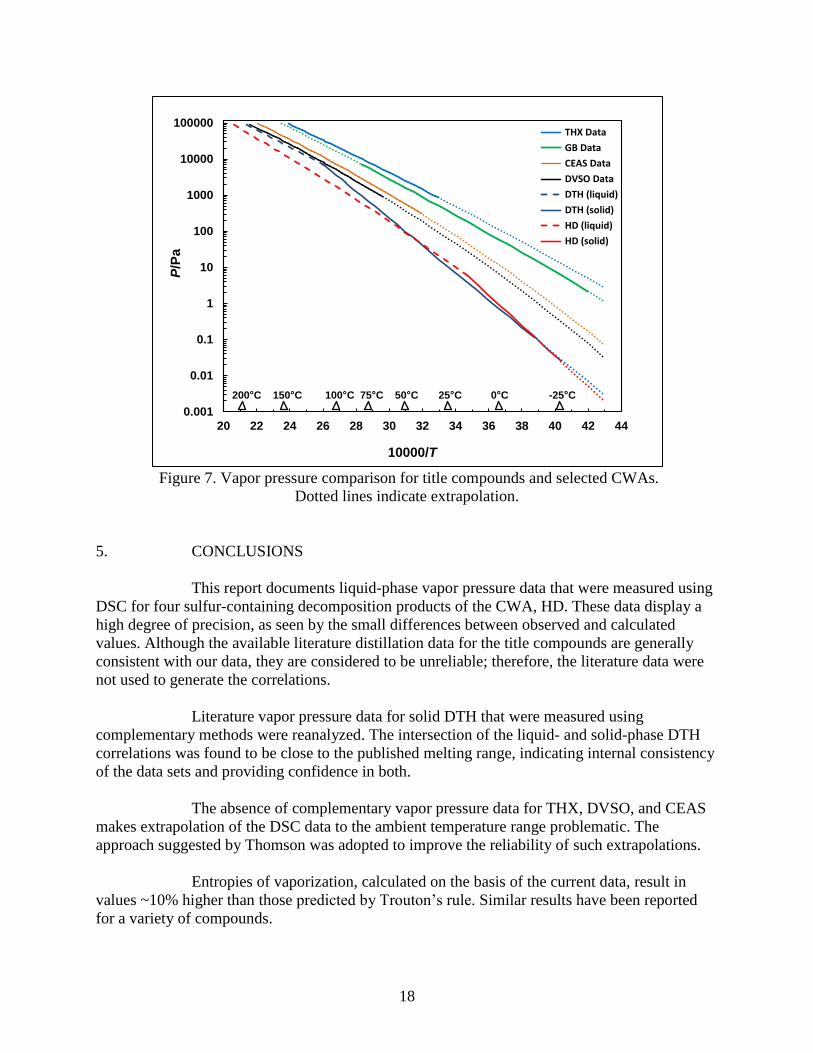
Figure 7 provides a comparison of the vapor pressures of the title compounds to
those of HD and GB (isopropyl methylphosphonofluoridate; sarin, CAS no. 107-44-8). The latter
is the most volatile of the standard nerve agents. Interestingly, the HD and DTH vapor pressure
curves cross twice between –20 and 50 °C, which is primarily due to the change in the slopes of
the curves at their melting points. DTH may be considered a candidate vapor pressure simulant
for HD in the ambient temperature range, especially below 15 °C, where both compounds are in
the solid phase.
20
40
60
80
100
120
140
0 100 200 300 400 500 600 700
S
vap
NBPt/K
Calculated from Constants in Reference 43
Compounds from Table 11
Trouton's Constant
18
Figure 7. Vapor pressure comparison for title compounds and selected CWAs.
Dotted lines indicate extrapolation.
5. CONCLUSIONS
This report documents liquid-phase vapor pressure data that were measured using
DSC for four sulfur-containing decomposition products of the CWA, HD. These data display a
high degree of precision, as seen by the small differences between observed and calculated
values. Although the available literature distillation data for the title compounds are generally
consistent with our data, they are considered to be unreliable; therefore, the literature data were
not used to generate the correlations.
Literature vapor pressure data for solid DTH that were measured using
complementary methods were reanalyzed. The intersection of the liquid- and solid-phase DTH
correlations was found to be close to the published melting range, indicating internal consistency
of the data sets and providing confidence in both.
The absence of complementary vapor pressure data for THX, DVSO, and CEAS
makes extrapolation of the DSC data to the ambient temperature range problematic. The
approach suggested by Thomson was adopted to improve the reliability of such extrapolations.
Entropies of vaporization, calculated on the basis of the current data, result in
values ~10% higher than those predicted by Trouton’s rule. Similar results have been reported
for a variety of compounds.
0.001
0.01
0.1
1
10
100
1000
10000
100000
20 22 24 26 28 30 32 34 36 38 40 42 44
P/P
a
10000/T
THX Data
GB Data
CEAS Data
DVSO Data
DTH (liquid)
DTH (solid)
HD (liquid)
HD (solid)
200 C 150 C 100 C 75 C 50 C 25 C 0 C -25 C

19
LITERATURE CITED
1. Felsing, W.A.; Hunting, C.A.; Fell, S.D. The Melting Point of Mustard Gas. J. Am. Chem.
Soc. 1948, 70 (5), 1966.
2. Harris, B.L. Physical Constants of MCE; Technical Data Memorandum Report 1094,
Chemical Warfare Service: Edgewood Arsenal, MD, 1945; UNCLASSIFIED Report
(ADB964103).
3. Belkin, F.; Brown, Jr., H.A. Vapor Pressure Measurement of Some Chemical Agents Using
Differential Thermal Analysis. Part I; EATR-4710; Chemical Laboratory, U.S. Army
Edgewood Arsenal: Aberdeen Proving Ground, MD, 1973; UNCLASSIFIED Report
(AD0525359).
4. Penski, E. Vapor Pressure Data Analysis Methodology, Statistics, and Applications;
CRDEC-TR-386; U.S. Army Chemical Research, Development and Engineering Center:
Aberdeen Proving Ground, MD, 1992; UNCLASSIFIED Report (ADA255090).
5. Zeffert, B.M.; Coulter, P.B.; Tannenbaum, H. Properties, Interaction, and Esterification of
Methylphosphonic Dihalides. J. Am. Chem. Soc. 1960, 82 (15), 3843–3847.
6. Report on Properties of War Gases, Volume 1, G-Agents; Chemical Corps Board: U.S.
Army Chemical Center, MD, 1956; UNCLASSIFIED Report (AD0108456).
7. Brozena, A.; Fielder, D. Vapor Pressure of Methylphosphonic Dichloride: A Compendium;
CRDC-SP-85012; U.S. Army Armament, Munitions and Chemical Command: Aberdeen
Proving Ground, MD, 1985; UNCLASSIFIED Report (ADA160613).
8. Belkin, F.; Brown, H.A., Jr. Vapor Pressure Measurement of Some Chemical Agents Using
Differential Thermal Analysis, Part III; EC-TR-75032; U.S. Army Edgewood Arsenal:
Aberdeen Proving Ground, MD, 1975; UNCLASSIFIED Report (ADA010666).
9. Brozena, A.; Williams, B.R.; Tevault, D.E. Vapor Pressure of N, Nʹ-Diisopropyl-
carbodiimide (DICDI); ECBC-TR-1352; U.S. Army Edgewood Chemical Biological
Center: Aberdeen Proving Ground, MD, 2016; UNCLASSIFIED Report (AD1003693).
10. Williams, B.R.; Hulet, M.S.; Brozena, A.; Miles, R.W., Jr.; Tevault, D.E. Vapor Pressure
of 2-Dialkyl Aminoethanethiols. J. Chem. Eng. Data 2013, 58 (6), 1679–1684.
11. Buchanan, J.H.; Buettner, L.C.; Tevault, D.E. Vapor Pressure of Solid Bis-(2-Chloroethyl)
Sulfide. J. Chem. Eng. Data 2006, 51 (4), 1331–1334.
12. Butrow, A.B.; Buchanan, J.H.; Tevault, D.E. Vapor Pressure of Organophosphorus Nerve
Agent Simulant Compounds. J. Chem. Eng. Data 2009, 54 (6), 1876–1883.
20
13. Tevault, D.E.; Buchanan, J.H.; Buettner, L.C.; Matson, K.L. Vapor Pressure of Cyclohexyl
Methylphosphonofluoridate (GF); ECBC-TR-304; U.S. Army Edgewood Chemical
Biological Center: Aberdeen Proving Ground, MD, 2009; UNCLASSIFIED Report
(ADA503835).
14. Abercrombie-Thomas, P.L.; Butrow, A.B.; Buchanan, J.H. Selected Physical Properties of
2-Chloroethyl-3-chloropropyl Sulfide (CECPRS); ECBC-TR-804; U.S. Army Edgewood
Chemical Biological Center: Aberdeen Proving Ground, MD, 2010; UNCLASSIFIED
Report (ADA531948).
15. Tevault, D.E.; Brozena, A.; Buchanan, J.H.; Abercrombie-Thomas, P.L.; Buettner, L.C.
Thermophysical Properties of VX and RVX. J. Chem. Eng. Data 2012, 57 (7), 1970−1977.
16. Brozena, A.; Buchanan, J.H.; Miles, R.W., Jr.; Williams, B.R.; Hulet, M.S. Vapor Pressure
of Triethyl and Tri‑n‑Propyl Phosphates and Diethyl Malonate. J. Chem. Eng. Data 2014,
59 (8), 2649−2659.
17. Tevault, D.E.; Buettner, L.C.; Crouse, K.L. Vapor Pressure of Methyl Salicylate and
n-Hexadecane; ECBC-TR-1184; U.S. Army Edgewood Chemical Biological Center:
Aberdeen Proving Ground, MD, 2014; UNCLASSIFIED Report (ADA592343).
18. Brozena, A.; Tevault, D.E.; Irwin, K. Vapor Pressure of Thiodiglycol. J. Chem. Eng. Data
2014, 59 (2), 307–311.
19. Brozena, A.; Buchanan, J.H.; Abercrombie-Thomas, P.L.; Sumpter, K.B.; Williams, B.R.;
Tevault, D.E. Vapor Pressure Data and Analysis for Selected Organophosphorus
Compounds: DIBMP, DCMP, IMMP, IMPA, EMPA, and MFPA; ECBC TR-1443; U.S.
Army Edgewood Chemical Biological Center: Aberdeen Proving Ground, MD, 2017;
UNCLASSIFIED Report (AD1031806).
20. Williams, B.R.; Butrow, A.B.; Samuels, A.C.; Miles, R.W., Jr.; Hulet, M. Vapor Pressure
of Solid 1,4-Dithiane. J. Chem. Eng. Data 2009, 54 (1), 60−63.
21. Brozena, A.; Abercrombie-Thomas, P.L.; Tevault, D.E. Vapor Pressure Data and Analysis
for Selected Organophosphorus Compounds, CMMP, DPMP, DMEP, and DEEP:
Extrapolation of High-Temperature Data; ECBC-TR-1507; U.S. Army Edgewood
Chemical Biological Center: Aberdeen Proving Ground, MD, 2018; UNCLASSIFIED
Report (AD1049398).
22. Standard Test Method for Determining Vapor Pressure by Thermal Analysis; ASTM
E1782; ASTM International: Conshohocken, PA, 2014.
23. Brozena, A.; Davidson, C.E.; Ben-David, A.; Schindler, B.; Tevault, D.E. Vapor Pressure
Data Analysis and Statistics; ECBC-TR-1422; U.S. Army Edgewood Chemical Biological
Center: Aberdeen Proving Ground, MD, 2016; UNCLASSIFIED Report (AD1022530).
24. Thomson, G.W. The Antoine Equation for Vapor-Pressure Data. Chem. Rev. 1946, 38,
1–39.
21
25. Richter, F.; Augustine, F.B.; Koft, E., Jr.; Reid, E.E. The Condensation of 2-Hydroxyethyl
Sulfides with Alcohols and Phenols. J. Am. Chem. Soc. 1952, 74 (16), 4076–4079.
26. Crossley, J.; Holt, A.; Walker, S. Dielectric Studies—III: Conformational Studies of
1,4-Dioxan, 1,4-Dithian and 1,4-Thioxan. Tetrahedron 1965, 21 (11), 3141–3149.
27. Clarke, H.T. The Relation between Residual Affinity and Chemical Constitution. Part III.
Some Heterocyclic Compounds. J. Chem. Soc. Trans. 1912, 101, 1788–1809.
28. Georgieff, K.K.; DuPre, A. Preparation and Infrared Spectra of Divinyl Sulfide, 2-Methyl-
1,3-thioxolane, and 1,4-Thioxane. Can. J. Chem. 1959, 37 (6), 1104–1108.
29. Movsumzade, M.M. Reaction of β,β'-Dihalodialkyl Ethers with Potassium Hydrosulfide.
Azerbaidzhanskii Khimicheskii Zhurnal, 1979, 86–90.
30. Alexander, J.R.; McCombie, H. The Reactions of Divinyl Sulphide, Sulphoxide, and
Sulphone. J. Chem. Soc. 1931, 1913–1918.
31. Price, C.C.; Bullitt, O.H., Jr. Hydrolysis and Oxidation of Mustard Gas and Related
Compounds in Aqueous Solution. J. Org. Chem. 1947, 12 (2), 238–248.
32. Ford-Moore, A.H. Some Derivatives of Ethane-1: 2-Dithiol and 2-Mercaptoethyl
Sulphoxides. J. Chem. Soc. 1949, 2126–2128.
33. Trofimov, B.A.; Gusarova, N.K.; Efremova, G.G.; Amosova, S.V.; Kletsko, F.P.; Vlasova,
N.N.; Voronkov, M.G. Divinyl Sulfoxide. I. Reaction of Divinyl Sulfoxide with Thiols.
Z. Org. Khim. 1980, 16, 2538–2543.
34. Trofimov, B.A.; Gusarova, N.K.; Efremova, G.G.; Istomina, S.N.; Amosova, S.V.;
Sinegovskaya, L.M.; Kozhevnikov, I.V. Tarabanko, V.E. Divinyl Sulfoxide. VI.
Oxidation of Divinyl Sulfide by Hydrogen Aqueous Peroxide. Z. Org. Khim. 1982, 18 (8),
1603–1609.
35. Lewin, L.N. Uber die Oxydation von Sulfiden mittels Benzoylhydroperoxide. J. Prakt.
Chem. 1930, 127 (1/4), 77–91.
36. Dawson, T.P. The Conversion of Certain Mercaptans into Acetates and Sulfides. J. Am.
Chem. Soc. 1947, 69 (5), 1211–1212.
37. Moggridge, R.C.G. The Nature of the 2-Chloroethyl Chlorovinyl Sulphide Isomers.
J. Chem. Soc. 1946, 1105–1108.
38. Brintzinger, H. Uber Alkylschwefelchloride und Halogenalkyl-Schwefelverbindungen.
Chem. Berichte-Recueil 1950, 83 (1), 87–90.
39. Whitaker, R.D.; Sisler, H.H. Reactions of Dinitrogen Tetroxide with Alicyclic Sulfides.
J. Org. Chem. 1960, 25 (6), 1038–1039.
22
40. De Wit, H.G.M.; Van Miltenburg, J.C.; De Kruif, C.G. Thermodynamic Properties of
Molecular Organic Crystals Containing Nitrogen, Oxygen, and Sulphur 1. Vapour
Pressures and Enthalpies of Sublimation. J. Chem. Thermodyn. 1983, 15 (7), 651–663.
41. Chang, K.T. Über Diäthylendisulfid. J. Chin. Chem. Soc. 1955, 2, 103–104.
42. Yur’ev, Y.K. α-Oxides and Synthesis of Compounds of the Thiophene Series. Z. Obshchei
Khimii 1952, 22, 2187–2189.
43. Yaws, C.L.; Yang, H.C. To Estimate Vapor Pressure Easily. Antoine Coefficients Relate
Vapor Pressure to Temperature for Almost 700 Major Organic Compounds. Hydrocarb.
Process. 1989, 68 (10), 65–68.
44. Abercrombie-Thomas, P.L.; Buchanan, J.H.; Brozena, A.; Tevault, D.E. Selected
Thermophysical Properties of 2,2-Dimethylcyclopentyl Methylphosphonofluoridate (GP)
and 2,2-Dimethylcyclopentanol (DMCP); ECBC-TR-1411; U.S. Army Edgewood
Chemical Biological Center: Aberdeen Proving Ground, MD, 2016; UNCLASSIFIED
Report (AD1018281).
45. Samuel, J.B.; Penski, E.C.; Callahan, J.J. Physical Properties of Standard Agents,
Candidate Agents, and Related Compounds at Several Temperatures; ARCSL-SP-83015;
U.S. Army Chemical Systems Laboratory: Aberdeen Proving Ground, MD, 1983;
UNCLASSIFIED Report (ADC033491).
23
ACRONYMS AND ABBREVIATIONS
Hsub enthalpy of sublimation
Hvap enthalpy of vaporization
Svap entropy of vaporization
CAS Chemical Abstracts Service
CEAS chloroethyl acetylsulfide
CECPRS 2-chloroethyl-3-chloropropyl sulfide
CMMP cyclohexyl methyl methylphosphonate
Csat saturation concentration or volatility
CWA chemical warfare agent
DCMP dicyclohexyl methylphosphonate
DEA 2-diethyl aminoethanethiol
DEEP diethyl ethylphosphonate
DEM diethyl malonate
DEMP diethyl methylphosphonate
DIA 2-diisopropyl aminoethanethiol
DIBMP diisobutyl methylphosphonate
DICDI N,Nʹ-diisopropylcarbodiimide
DIMP diisopropyl methylphosphonate
DMA 2-dimethyl aminoethanethiol
DMCP 2,2-dimethylcyclopentanol
DMEP dimethyl ethylphosphonate
DMHP dimethyl phosphonate
DMMP dimethyl methylphosphonate
DPMP dipinacolyl methylphosphonate
DSC differential scanning calorimetry
DTH 1,4-dithiane
DVSO divinyl sulfoxide
GB isopropyl methylphosphonofluoridate; sarin
GF cyclohexyl methylphosphonofluoridate
GP 2,2-dimethylcyclopentyl methylphosphonofluoridate
HD bis-(2-chloroethyl) sulfide, mustard gas
IMMP isopropyl methyl methylphosphonate
MW molecular weight
NBPt normal boiling point
P pressure (pascal)
p pressure (Torr)
Pcalc calculated vapor pressure
Pexptl experimental vapor pressure
R gas constant
RVX O-isobutyl-S-[2(diethylamino) ethyl] methylphosphonothiolate
T temperature (kelvin)
t temperature (Celsius)
TDG thiodiglycol
TEPO triethyl phosphate

24
THX 1,4-thioxane
TPPO tri-n-propyl phosphate
VX O-ethyl-S-[2(diisopropylamino) ethyl] methylphosphonothiolate
DISTRIBUTION LIST
The following individuals and organizations were provided with one Adobe
portable document format electronic version of this report:
U.S. Army Edgewood Chemical Biological
Center (ECBC)
Chemical Analysis and Physical Properties
Branch
RDBC-DRC-P
ATTN: Ellzy, M.
Brozena, A.
Defense Threat Reduction Agency
J9-CBS
ATTN: Vann, B.
Peacock-Clark, S.
Department of Homeland Security
DHS-S&T-RDP-CSAC
ATTN: Mearns, H.
Defense Technical Information Center
ATTN: DTIC OA
G-3 History Office
U.S. Army RDECOM
ATTN: Smart, J.
ECBC Technical Library
RDCB-DRB-BL
ATTN: Foppiano, S.
Stein, J.
Office of the Chief Counsel
AMSRD-CC
ATTN: Upchurch, V.
ECBC Rock Island
RDCB-DES
ATTN: Lee, K.
RDCB-DEM
ATTN: Grodecki, J.