Embed Size (px)
DESCRIPTION
p5
Citation preview

Sessional Work Book
Course Code: ECE 102Course Title: Basic Electrical Engineering SessionalCredits : 1.50
Department of Computer Science and EngineeringThe University of Asia Pacific

Contents:

Brief description of Apparatus

Safety Rules for this Laboratory

Laboratory Experiment #1
CONSTRUCTION & OPERATION OF SIMPLE ELECTRICAL CIRCUITS
Objective:
The experiment is to acquaint the students with some simple circuits and to make them familiar with diagram reading, drawing and wiring with the help of different types of switches SPST- Single pole single throw, SPDT- single pole double throw, DPST- Double pole single throw, DPDT- Double pole Double throw) that will be frequently encountered in different experiments.
Instructions:
Read the following procedure carefully and draw the circuit diagrams accordingly in the space allotted for each procedure and then implement it practically. Your report must contain neat diagrams of the circuits.
Apparatus:
1) Two lamp boards (220v, 100w)2) Two SPST, two SPDT and one DPDT switch.
Caution: 1. Don’t switch on the supply until your teacher has checked the circuit.2. Take care of the reading of the apparatus.3. Take care of any bare circuit element in energized condition.4. Put on shoes with good insulation.
Circuits with different types of switches:
1. Connect an electric lamp so that it may be operated from a 220v ac supply using an SPST switch.

2. Connect a lamp so that it may be operated independently by either of two SPST switches.
3. Connect two lamps so that either may be operated from a common source by its SPDT switch.
4. Connect two lamps so that both may be operated simultaneously from a common source by one SPST switch. Is it possible to do it in any other way? If possible, show both the diagrams and indicate the preferable one.

Sessional Report
Course Code: ECE 102Course Title: Basic Electrical EngineeringCredits: 1.50
Experiment Number: 1Experiment Name: Construction and operation of simple electrical circuits
Student Name: ________________________________Roll # : Registration # :Year/Semester: Group # :Experiment Date: Submission Date:
Answer the following questions:
1. In which setting light is dimmer? In which setting light is brighter? Explain why?
2. Draw a circuit so that a lamp may be operated independently by either of two SPDT switches from a 220v source.

Discussion:

Laboratory Experiment #2
VERIFICATION OF KIRCHHOFF’S VOLTAGE LAW (KVL)
Objective:
This experiment is intended to verify Kirchhoff’s voltage law (KVL) with the help of series circuits and hence derive equivalent resistance both experimentally and analytically.
Theory:
KVL states that around any closed circuit the algebraic sum of the voltage rises equals the algebraic sum of the voltage drops.
Apparatus:
Three Rheostats each rated at least 4 amps, 20 ohms One multimeter DC Voltage source
Procedure:
Connect three rheostats R1, R2 and R3 in series through a SPST switch to a DC power supply as shown in fig 1.
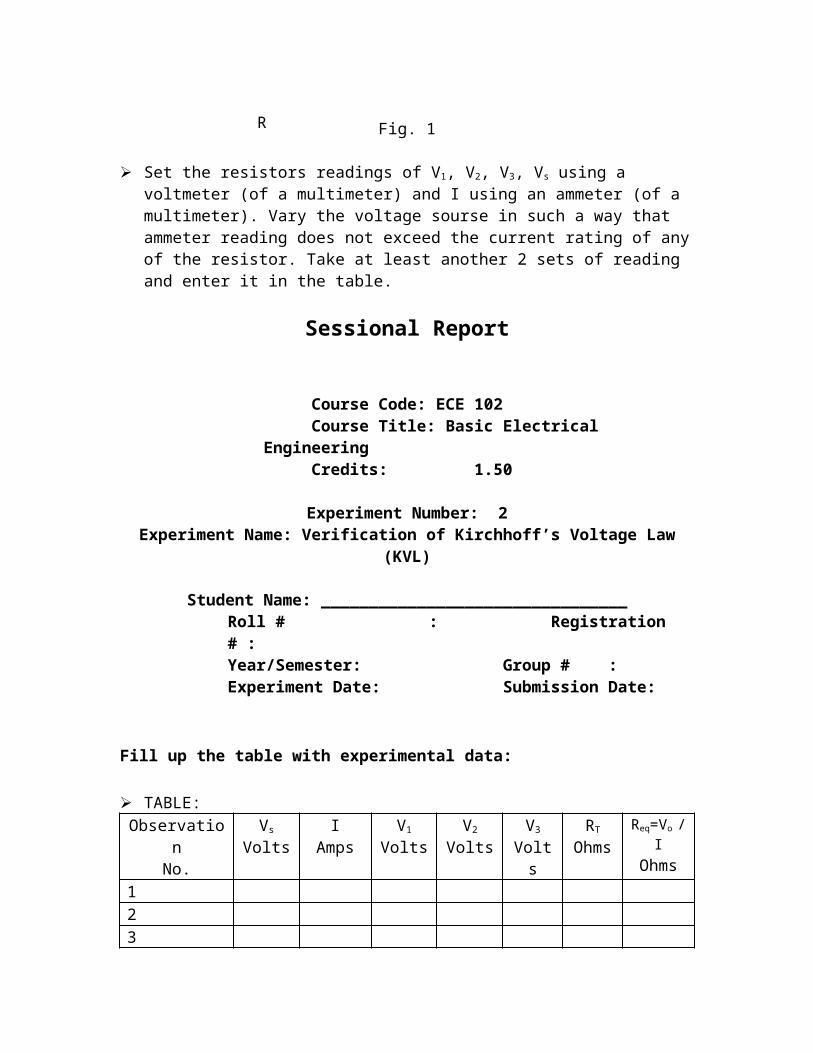
Fig. 1
Set the resistors readings of V1, V2, V3, Vs using a voltmeter (of a multimeter) and I using an ammeter (of a multimeter). Vary the voltage sourse in such a way that ammeter reading does not exceed the current rating of any of the resistor. Take at least another 2 sets of reading and enter it in the table.
R1
V3
V1 V2
R3
V
V
V
A
VR2
VSI
RT

Sessional Report
Course Code: ECE 102Course Title: Basic Electrical EngineeringCredits: 1.50
Experiment Number: 2Experiment Name: Verification of Kirchhoff’s Voltage Law (KVL)
Student Name: ________________________________Roll # : Registration # :Year/Semester: Group # :Experiment Date: Submission Date:
Fill up the table with experimental data:
TABLE:Observation
No.Vs
VoltsI
AmpsV1
VoltsV2
VoltsV3
VoltsRT
OhmsReq=Vo / I
Ohms123
Answer the following questions:
1. Verify KVL. (Vs = V1+V2+V3 )
2. Compare RT with experimentally obtained value Req
3. State the rules of connecting voltmeter and ammeters in the circuit.
4. Comment on the results obtained and discrepancies (if any).
Discussion:

Laboratory Experiment #3
VERIFICATION OF KIRCHHOFF’S CURRENT LAW (KCL)
Objective:
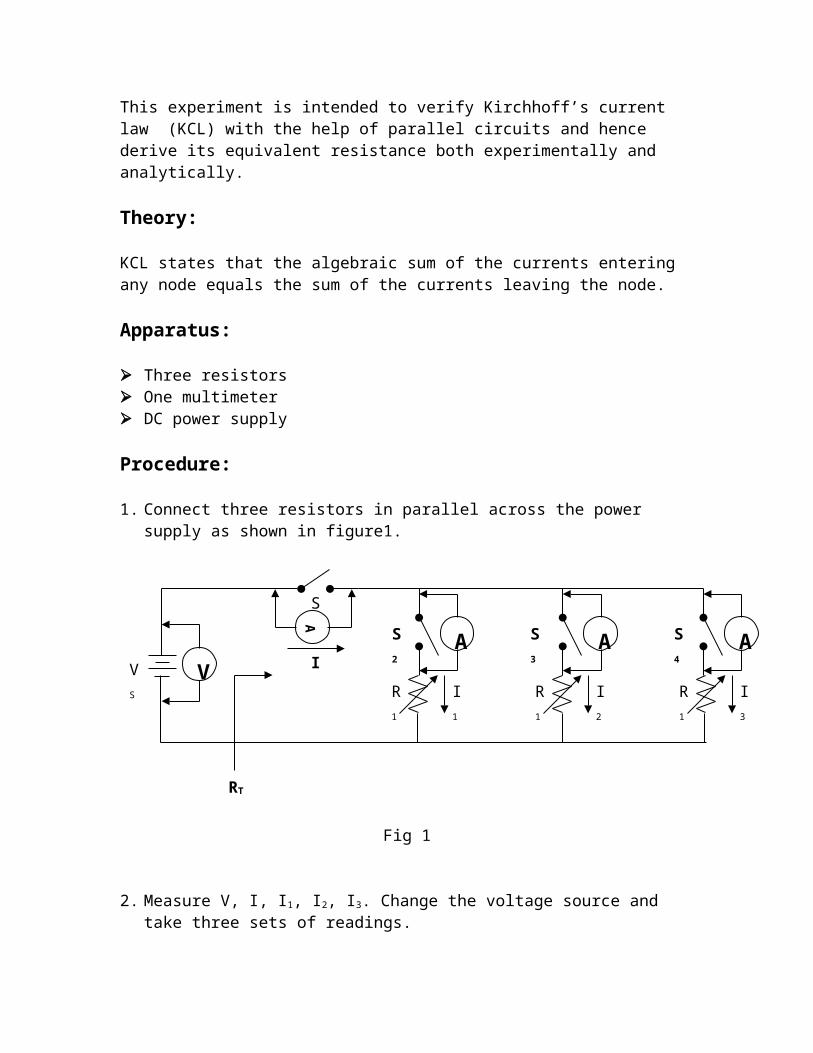
This experiment is intended to verify Kirchhoff’s current law (KCL) with the help of parallel circuits and hence derive its equivalent resistance both experimentally and analytically.
Theory:
KCL states that the algebraic sum of the currents entering any node equals the sum of the currents leaving the node.
Apparatus:
Three resistors One multimeter DC power supply
Procedure:
1. Connect three resistors in parallel across the power supply as shown in figure1.
Fig 1
2. Measure V, I, I1, I2, I3. Change the voltage source and take three sets of readings.
VA A A
S1
R1
I3R1
I2R1
I1
A
I
S3 S4S2
VS
RT
3. Find RT with the help of multimeter.
Sessional Report
Course Code: ECE 102Course Title: Basic Electrical EngineeringCredits: 1.50
Experiment Number: 3Experiment Name: Verification of Kirchhoff’s Current Law (KCL)
Student Name: ________________________________Roll # : Registration # :Year/Semester: Group # :Experiment Date: Submission Date:
Fill up the table with experimental data:
ObservationNo.
VS
VoltsI
AmpsI1
AmpsI2
AmpsI3
AmpsRT
OhmsReq = Vo/I
Ohms
Answer the following questions:
1.Verify KCL. (I=I1+I2+I3)
2. Compare RT with the calculated value of Req
3.Comment on the obtained results and discrepancies (if any).
Discussion:

Laboratory Experiment #4
VERIFICATION OF SUPERPOSITION THEOREM
Objective:
To verify experimentally the Superposition theorem which is an analytical technique of determining currents in a circuit with more than one emf source.
Theorem:
In a circuit (network) made up of linear elements (e.g. resistors) and containing two or more sources of emf, the current in any particular branch when all the emf sources are acting simultaneously may be found by considering the sources of emf to act one at a time, then finding the current in the specified branch due to each source and then superimposing, or adding algebraically, these component currents.
Note regarding Superposition theorem: While the current due to a particular source of emf is being found the other emf sources are rendered inactive and if any branch element is in series with those sources that remains intact.
Apparatus:
Two DC power supplies of suitable voltage and current ratings. Three rheostats of suitable ratings. One multimeter.
Procedure:
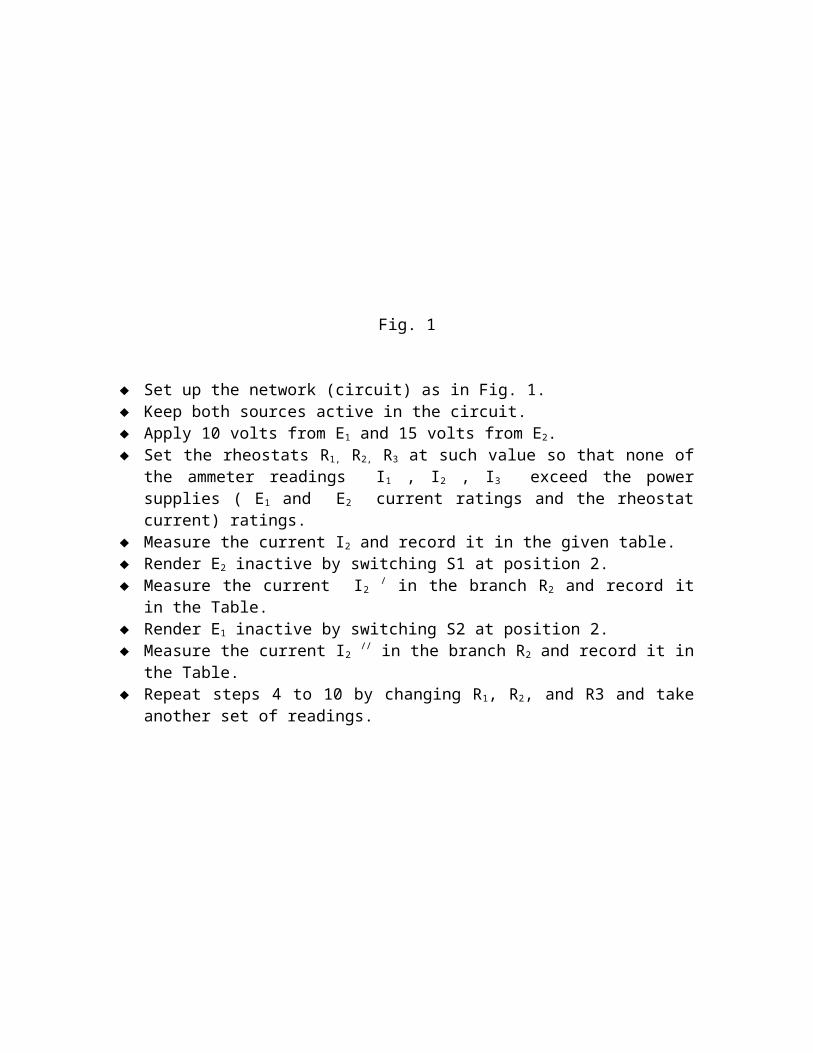
Fig. 1
Set up the network (circuit) as in Fig. 1.
S1
2
1 S2
2
1
S3
I
R1
R2
R3
E2
E1
A
Keep both sources active in the circuit. Apply 10 volts from E1 and 15 volts from E2. Set the rheostats R1, R2, R3 at such value so that none of the ammeter readings I1 , I2 ,
I3 exceed the power supplies ( E1 and E2 current ratings and the rheostat current) ratings.
Measure the current I2 and record it in the given table. Render E2 inactive by switching S1 at position 2. Measure the current I2 / in the branch R2 and record it in the Table. Render E1 inactive by switching S2 at position 2. Measure the current I2 // in the branch R2 and record it in the Table. Repeat steps 4 to 10 by changing R1, R2, and R3 and take another set of readings.

Sessional Report
Course Code: ECE 102Course Title: Basic Electrical EngineeringCredits: 1.50
Experiment Number: 4Experiment Name: Verification of Superposition Theorem
Student Name: ________________________________Roll # : Registration # :Year/Semester: Group # :Experiment Date: Submission Date:
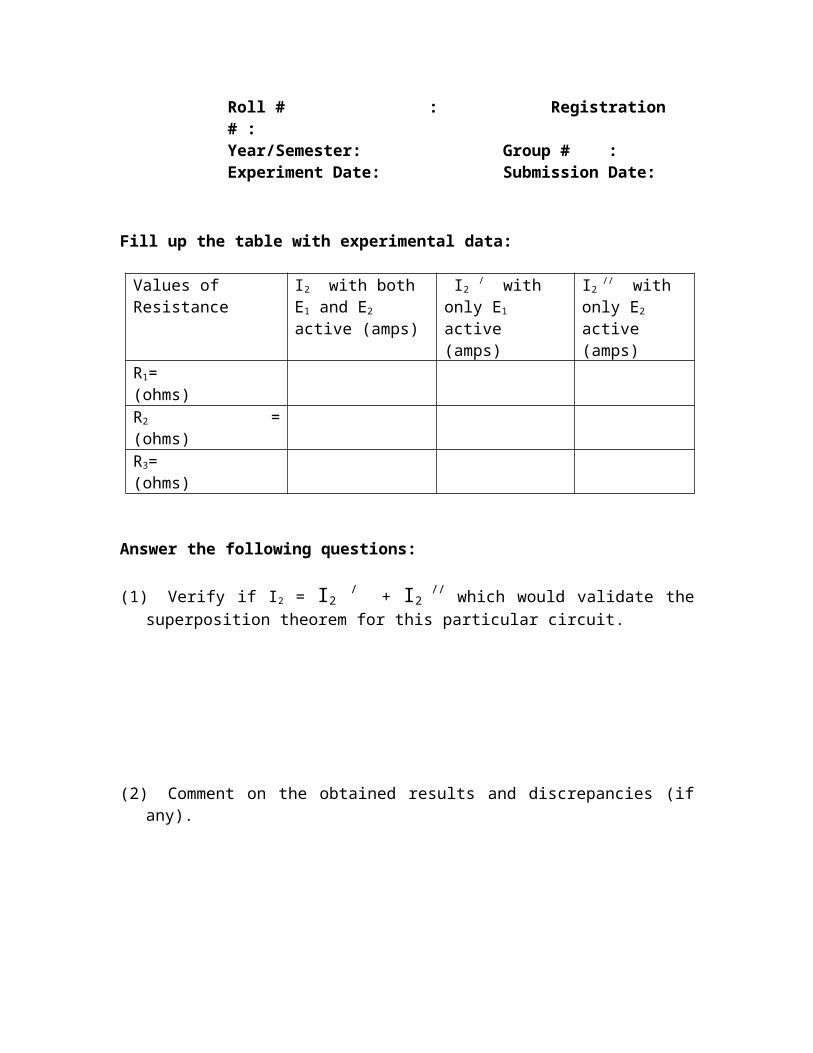
Fill up the table with experimental data:
Values of Resistance I2 with both E1 and E2 active (amps)
I2 / with only E1 active (amps)
I2 // with only E2
active (amps)
R1= (ohms)R2 = (ohms)R3= (ohms)
Answer the following questions:
(1) Verify if I2 = I2 / + I2 // which would validate the superposition theorem for this
particular circuit.
(2) Comment on the obtained results and discrepancies (if any).
Discussion:
Laboratory Experiment #5
VERIFICATION OF THEVENIN’S THEOREM
Objective:
To verify Thevenin's theorem with reference to a given circuit theoretically as well as experimentally. Introduction: It is often desirable in circuit analysis to study the effect of changing a particular branch element while all other branches and all the sources in the circuit remain unchanged. Thevenin’s theorem is a technique to this end and it reduces greatly the amount of computations which we have to do each time a change is made. Using Thevenin’s theorem the given circuit excepting the particular branch to be studied is reduced to the simplest equivalent circuit possible and then the branch to be changed is connected across the equivalent circuit.
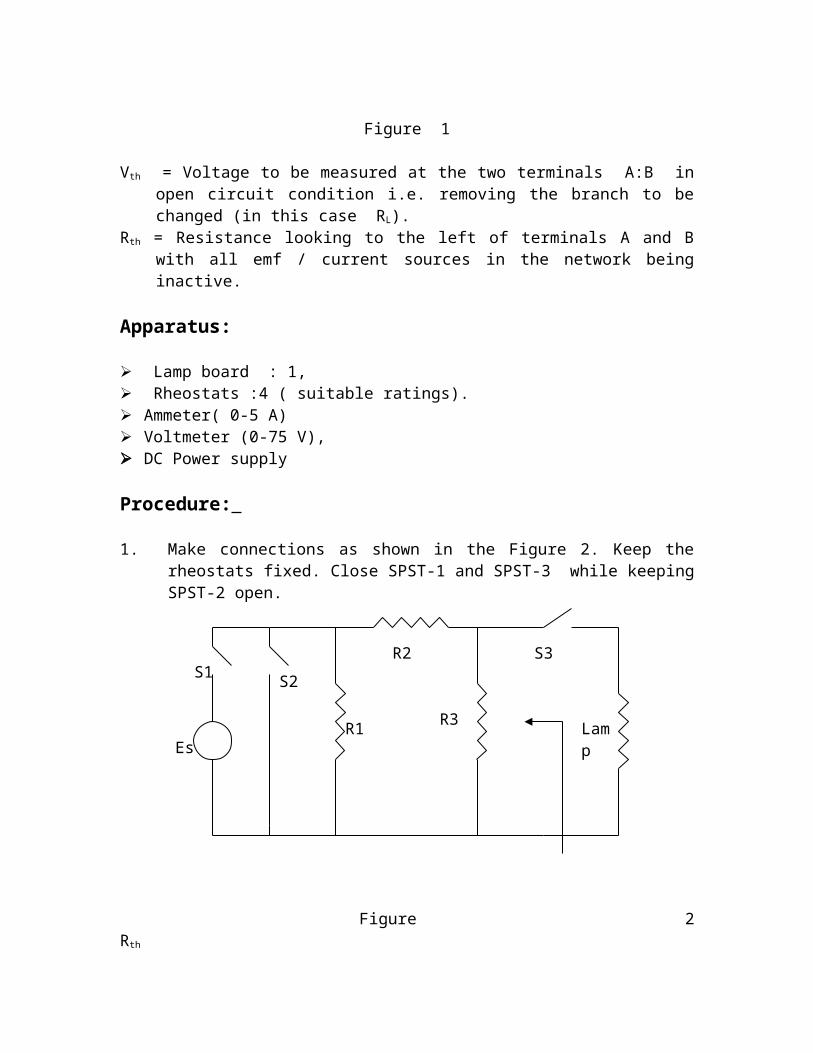
The Thevenin’s theorem states that any two terminal network consisting of linear elements and voltage / current sources can be replaced by a voltage source V th with a resistance Rth in series with it as in Fig.1 such that
~ RL
Figure 1
Vth = Voltage to be measured at the two terminals A:B in open circuit condition i.e. removing the branch to be changed (in this case RL).
Rth = Resistance looking to the left of terminals A and B with all emf / current sources in the network being inactive.
Apparatus:
Lamp board : 1,
A
B B
ILRth
Vth
A IL
Two terminal network RL

Rheostats :4 ( suitable ratings). Ammeter( 0-5 A) Voltmeter (0-75 V), DC Power supply
Procedure: 1. Make connections as shown in the Figure 2. Keep the rheostats fixed. Close
SPST-1 and SPST-3 while keeping SPST-2 open.
Figure 2 Rth
2. Applying ES = 30 volts measure the load voltage VL between A and B and load current IL for different number of lamps and record them in the Table - 1 given below.
3. Open SPST-3 and measure VAB which is then the open-circuit voltage at terminals AB.This is Vth.
4. Make connections as in Figure 3 i.e. remove the load (lamp board) and connect the power supply EX in place of it between terminals A and B. Note that the supply ES can be disconnected and used as EX. Close SPST-2 and SPST-3. Apply EX = 15 volts. Measure VAB and IX which will give Rth = VAB / IX.
S3
S2
R1
R2
R3 Ex
Ix
S1S3
S2
R1
R2
R3 LampEs
Figure: 3
5. Construct the circuit of Fig. 4 setting the power supply at V th volts and the rheostat at Rth ohms. Confirm these using a multimeter. Now measure the load current and terminal voltage for different combination of bulbs and note in on table 2 and also verify.
Fig. 4
Vth
Rth
RL

Sessional Report
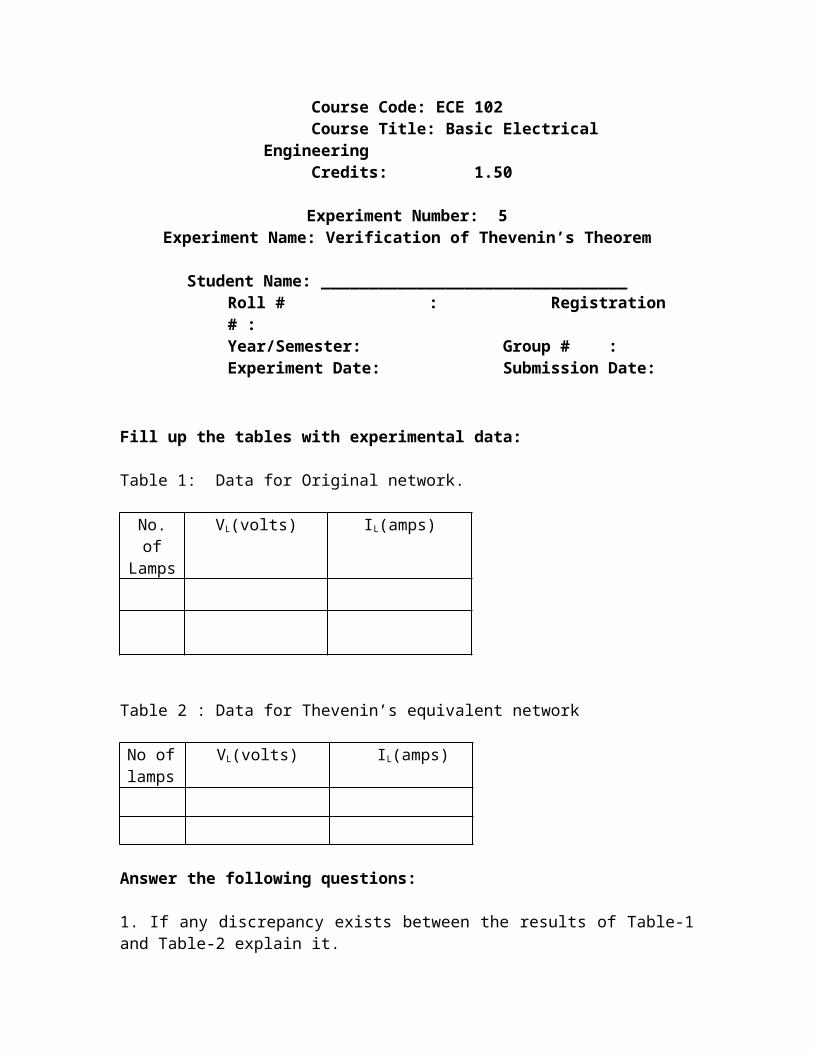
Course Code: ECE 102Course Title: Basic Electrical EngineeringCredits: 1.50
Experiment Number: 5Experiment Name: Verification of Thevenin’s Theorem
Student Name: ________________________________Roll # : Registration # :Year/Semester: Group # :Experiment Date: Submission Date:
Fill up the tables with experimental data:
Table 1: Data for Original network.
No. of Lamps
VL(volts) IL(amps)
Table 2 : Data for Thevenin’s equivalent network No of lamps
VL(volts) IL(amps)
Answer the following questions:
1. If any discrepancy exists between the results of Table-1 and Table-2 explain it.

2. Solve the circuit in the following figure applying Thevenin’s theorem theoretically. Use the values of R1, R2, R3 by a multi-meter. Use two lamps in parallel in the lamp-board. Compare your theoretical results with the corresponding ones in Tables 1 and 2.
S1S3
S2
R1
R2
R3 LampEs
Rth
Discussion:

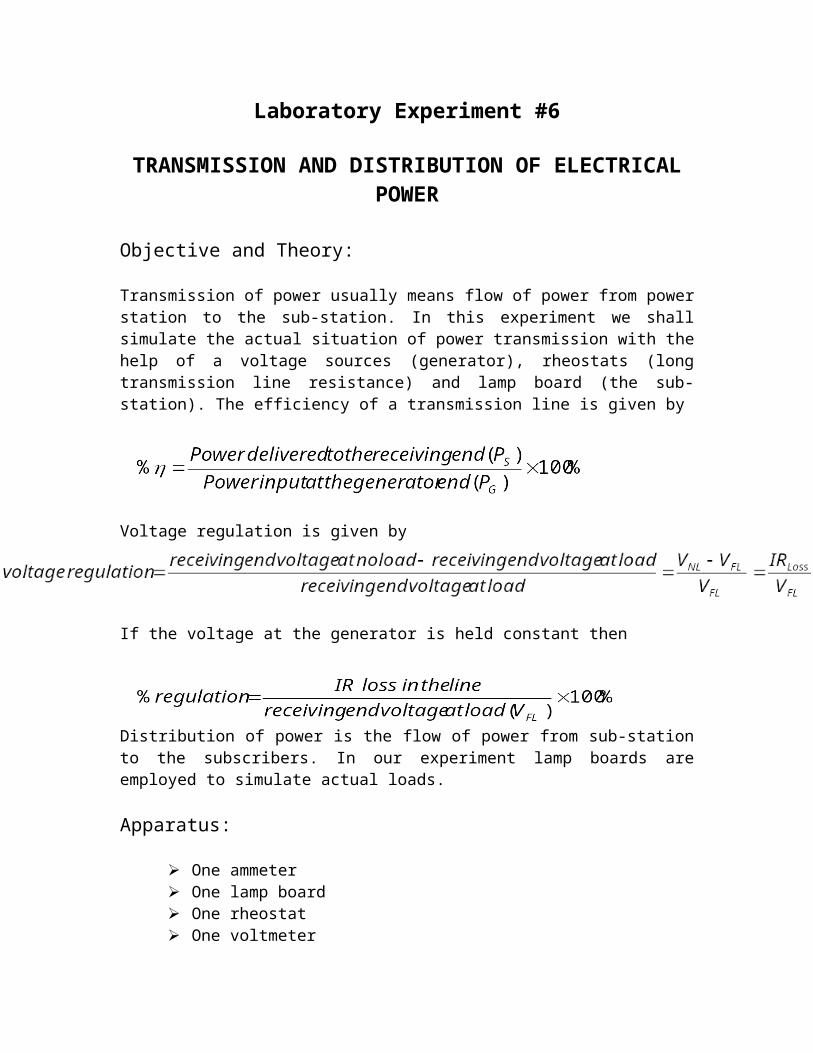
Laboratory Experiment #6
TRANSMISSION AND DISTRIBUTION OF ELECTRICAL POWER
Objective and Theory:
Transmission of power usually means flow of power from power station to the sub-station. In this experiment we shall simulate the actual situation of power transmission with the help of a voltage sources (generator), rheostats (long transmission line resistance) and lamp board (the sub-station). The efficiency of a transmission line is given by
Voltage regulation is given by
If the voltage at the generator is held constant then
Distribution of power is the flow of power from sub-station to the subscribers. In our experiment lamp boards are employed to simulate actual loads.
Apparatus:
One ammeter One lamp board One rheostat One voltmeter
Circuit Diagram:
VL
VR
VS
I

Sessional Report
Course Code: ECE 102Course Title: Basic Electrical EngineeringCredits: 1.50
Experiment Number: 6Experiment Name: Transmission and Distribution of electrical power
Student Name: ________________________________Roll # : Registration # :Year/Semester: Group # :Experiment Date: Submission Date:
Fill up the table with experimental data:
Resistance
VS VR I VL Power Input
Power at
load
Line loss
% eff % reg
1K2K3K
Answer the following questions:
1. Why high voltage transmission is used?
2. Plot the following curves for transmission of power.a. % efficiency vs. load resistanceb. loss vs. load resistancec. % regulation vs. load resistance
Graph paper

3. Why instead of transmitting maximum power, we want to transmit power at maximum efficiency?
Discussion:

Laboratory Experiment #7
STUDY OF OPERATION OF OSCILLOSCOPE AND FUNCTION GENERATOR
Objective:
To realize the operation of the oscilloscope, first we have to know the function of different knobs and buttons of it. Then we have to learn about the calibration of oscilloscope, measurement of time period, frequency and voltage of signal of different wave shapes. We can get different wave shapes by using Function Generator.
Apparatus:
1. Oscilloscope2. Function Generator3. DC Power Supply
Circuit Diagram:
Procedure:
1. Connect the apparatuses according to the diagram.2. Measure the peak-to-peak value (p-p) and time period of different signals generated
by Function Generator.3. Display steady voltage in channel 1 and sinusoidal signal in channel 2, add both and
see what happens if you change dc supply.
Function Generator
Ch.1 Ch.2DCPowerSupply
Sessional Report
Course Code: ECE 102Course Title: Basic Electrical EngineeringCredits: 1.50
Experiment Number: 7Experiment Name: Study of operation of oscilloscope and function generator
Student Name: ________________________________Roll # : Registration # :Year/Semester: Group # :Experiment Date: Submission Date:
Answer the following question:
1. Discuss what happens when you change the dc supply voltage level and explain why.
[N.B: You can go through the Handbook of the Oscilloscope to understand its operation in details.]
2. Draw the wave-shapes of the observed waves in the oscilloscope in your graph paper.

Graph paper

Discussion:

Laboratory Experiment #8
FAMILIARIZATION WITH ALTERNATING CURRENT (AC) WAVES
Objective:
To study ac (sinusoidal) wave forms and correlate them with practically measurable effective values. An understanding on a simple ac circuit is also expected to be developed in the experiment.
Introduction:
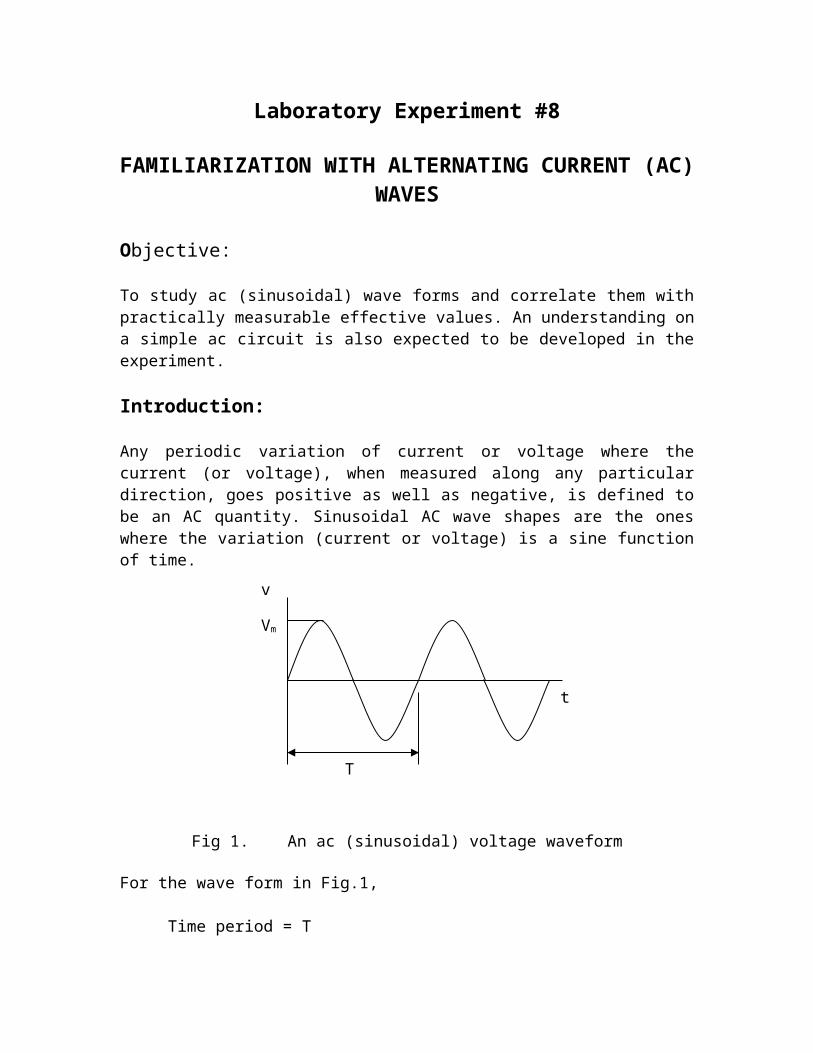
Any periodic variation of current or voltage where the current (or voltage), when measured along any particular direction, goes positive as well as negative, is defined to be an AC quantity. Sinusoidal AC wave shapes are the ones where the variation (current or voltage) is a sine function of time.
Fig 1. An ac (sinusoidal) voltage waveform
For the wave form in Fig.1,
Time period = TFrequency f = 1/T
Effective value:
Effective (rms) values of sinusoidal waveforms are given as:
(For sinusoidal wave)
v
Vm
t
T

(For sinusoidal wave)
These values are directly measured in ac voltmeter / ammeters and can be used in power calculation as:
Phase difference:
Fig 2. Two sinusoidal waves with phase difference
Phase difference between two ac sinusoidal waveforms is the difference in electrical angle between two identical points of the two waves. In fig. 2, the voltage and current equations are given as:
Impedance:
Relation between the voltage across and the current through any component of an ac circuit is given by impedance. For the voltage and current waveforms in Fig. 2, the corresponding impedance Z is given as:
Apparatus:
Oscilloscope Function generation Decade resistor Capacitor bank AC voltmeter AC ammeter SPST
v/i
t
T

Breadboard
Circuit diagram:
Procedure:
1. Connect the output of the function generator directly to channel 1 of the oscilloscope as shown in fig 1. Set the amplitude of the wave at 10V and the frequency at 1 kHz. Select sinusoidal wave shape.
10Vp-p
1 KHz Osc.Ch-1
+
_
Fig 1 Fig 2
10Vp-p
1 KHzOsc.Ch-1
1F
100 Osc.Ch-2

Sessional Report
Course Code: ECE 102Course Title: Basic Electrical EngineeringCredits: 1.50
Experiment Number: 8Experiment Name: Familiarization with alternating current (ac) waves
Student Name: ________________________________Roll # : Registration # :Year/Semester: Group # :Experiment Date: Submission Date:
Circuit diagram:
Answer the following question:
1. Sketch the wave shape observed on the oscilloscope. Determine the time period of the wave and calculate the frequency.
10Vp-p
1 KHz Osc.Ch-1
+
_
Fig 1 Fig 2
10Vp-p
1 KHzOsc.Ch-1
1F
100 Osc.Ch-2

2. Measure the voltage with an ac voltmeter.
3. Change the frequency to 500Hz and note what happens to the display of the wave.
4. Construct the circuit as shown in Fig. 2. Measure the input voltage with an ac voltmeter and the input current with an ac ammeter.
5. Observe the wave shapes of oscilloscope channels 1 and 2 simultaneously. Draw them.
Discussion: