Embed Size (px)
Citation preview
PUERTO RICO Economic Analysis Report
2020-2021
2
Table of Content
I. Introduction………………………………………………………………………………………………………….………….3
II. Overview of the Economy………………………………………………………………………………………………...5
III. Population…………..………………………………………………………………………………………………………….11
IV. Labor Force, Employment and Unemployment……..………………………………………………....…….27
V. Employment by Industry…………………..…………………………………………………………………………….37
VI. Business Employment Dynamics (BED)…………………..……………………………………………..………..44
VII. Occupational Employment Survey (OES)………………………………………………………………………….47
VIII. Occupational Skills & Research……………………………………………..………………………………………110
IX. Long Term Industry & Occupational Projections……………….………………………………...………..113
X. Weekly Claims for Unemployment Insurance Data & Characteristics of the Insured
Unemployed..……………………………………………………………………………………………………………....128
3
Introduction
Thirteen years have passed since the beginning of the longest recessionary period in the economic
history of Puerto Rico. This difficult period under recession, has been characterized by long-standing
and structural problems, seems endless, and a challenge to the labor market. Analyzing economic
projections year after year, the expected recovery seems to move away. Under that scenario, the
destructive impact of hurricanes Irma and María in September of 2017, multiple earthquakes mainly
in the southern region in the beginning of 2020, and the COVID-19 pandemic in 2020, aggravated the
crisis. In particular, Hurricane María produced an unprecedented damage to Puerto Rico, to the
people and to businesses. For the economy, that meant an increase in the gross national product
(GNP) in real terms of only 1.5% in fiscal year 2019, a decreasing trend since fiscal year 2013. In FY
2020 Puerto Rico’s real gross national product (GNP) decreased by 3.2%. At the same time, Hurricane
María aggravated the declining population levels since 2005. The population of Puerto Rico for 2020
reached 3,285,874, a decrease of 11.8% in terms of percent change 2010-2020.
In mid-March 2020, the government of Puerto Rico issued Executive Order number OE-2020-023 that
contemplated the closure of both the government and private companies. It then issued other
executive orders that were gradually opening and changing the measures to address the situation of
the COVID -19 pandemic. In September 25, 2020, Puerto Rico had positive COVID-19 cases of 23,357
(accumulated) with confirmed molecular tests; of 24,065 (accumulated) probable positive cases
according to serological tests; 648 (accumulated) death; and 339 hospitalized. In September 27,
2021, Puerto Rico had positive COVID-19 cases of 149,282 (accumulated) with confirmed molecular
tests; of 31,438 (accumulated) probable positive cases according to serological test; 3,133
(accumulated) death; and 173 hospitalized.
In FY 2021, the labor force was estimated in 1,057,000 persons, and represented a decrease of 20,000
persons or 1.9% when compared to FY 2020 (1,077,000). The seasonally adjusted number of
employed persons for FY 2021 reached a total of 965,000, 21,000 employees less than FY 2020
(986,000). In FY 2021, unemployed people (seasonally adjusted) totaled 92,000 and represented
1,000 unemployed more than in FY 2020 (91,000). The unemployment rate (seasonally adjusted) for
FY 2021 was 8.7%, 0.3 percentage points more than in 2020 (8.4%). It should be noted that in this
fiscal year self-employment reached the highest figure in the entire historical series of 173,000, which
only occurred during fiscal years 2006, 2007 and 2008, which reached the figure of 181,000, 192,0000
and 177,000, respectively.
4
The week ending on 4/4/20 was the week when more initial claims were reported in Puerto Rico
during the COVID-19 pandemic with 66,236 claims. The week ending 6/27/2020 was the week when
more reported continued claims with an insured unemployment rate of 229,039 claims and 26.75%,
respectively. For the most recent data, the week ending on 9/4/2021 initial claims reported 1,638
claims, continued claims of 35,635 and insured unemployment rate of 4.38%.
The highest insured unemployment rates in the week ending September 4 2021 were: Puerto Rico
(4.4), District of Columbia (4.2), California (3.1), New Jersey (3.0), Illinois (2.8), Nevada (2.8), New York
(2.8), Rhode Island (2.7), Hawaii (2.5), and Connecticut (2.2).
After Hurricanes Irma and María (almost 40,000 jobs were lost), and after multiple earthquakes and
now with the COVID-19 pandemic, a large number of jobs have been lost. However, we have
observed that after the recovery from Hurricanes Irma and Maria, unemployment declines again,
after the Earthquakes and COVID-19 pandemic, when analyzing major industry sectors. A nonfarm
payroll employment loss of 1.7% in fiscal year 2021 and 1.9% in fiscal year 2020, may be compared
with an increase of 1.9% in fiscal year 2019. For the FY 2021, only three major sector industries
showed growth in Mining, Logging & Construction, 8.6%, Manufacturing, 3.1%; and Trade,
Transportation and Utilities 0.8%. The number of 28,800 employees in Logging & Construction
industry in FY 2021 was the highest since FY 2013 with 33,700 employees. The number of 76,500
employees in the manufacturing industry in FY 2021 was the highest since FY 2013 with 78,700
employees. Otherwise, major sector industries showed the most significant loss: Information 14.9%;
Education & Health Services 5.6%, Leisure and Hospitality 5.3%; Other Services 5.4%; Financial
Activities 2.1%; Professional and Business Services 1.8%; and Government by 1.6%. In general,
nonfarm payroll employment in the private sector showed a decrease of 1.7% in fiscal year 2020.
This report shows an examination of Puerto Rico’s economy and workforce during FY 2020-2021.
Statistical data is from official sources such as, Puerto Rico Planning Board, US Census Bureau and the
Puerto Rico Department of Labor and Human Resources. The three main topics presented in this
report are: economy, demography and labor market. The first section presents the Economy section
with an analysis of principal economic variables such as: gross national product (GNP), gross domestic
product (GDP), personal income and personal consumption expenditures, among others. Finally, the
broader topic is the one related to the labor market, with an analysis of the labor force; employment
and unemployment; composition of employment by industry sector; Business Employment Dynamics
(BED), occupational employment data; in-demand skills; long-term industry and occupational
projections; and Weekly Claims for Unemployment Insurance Data & Characteristics of the Insured
Unemployed.
5
II. Overview of the Economy
A. Principal Macroeconomics Variables
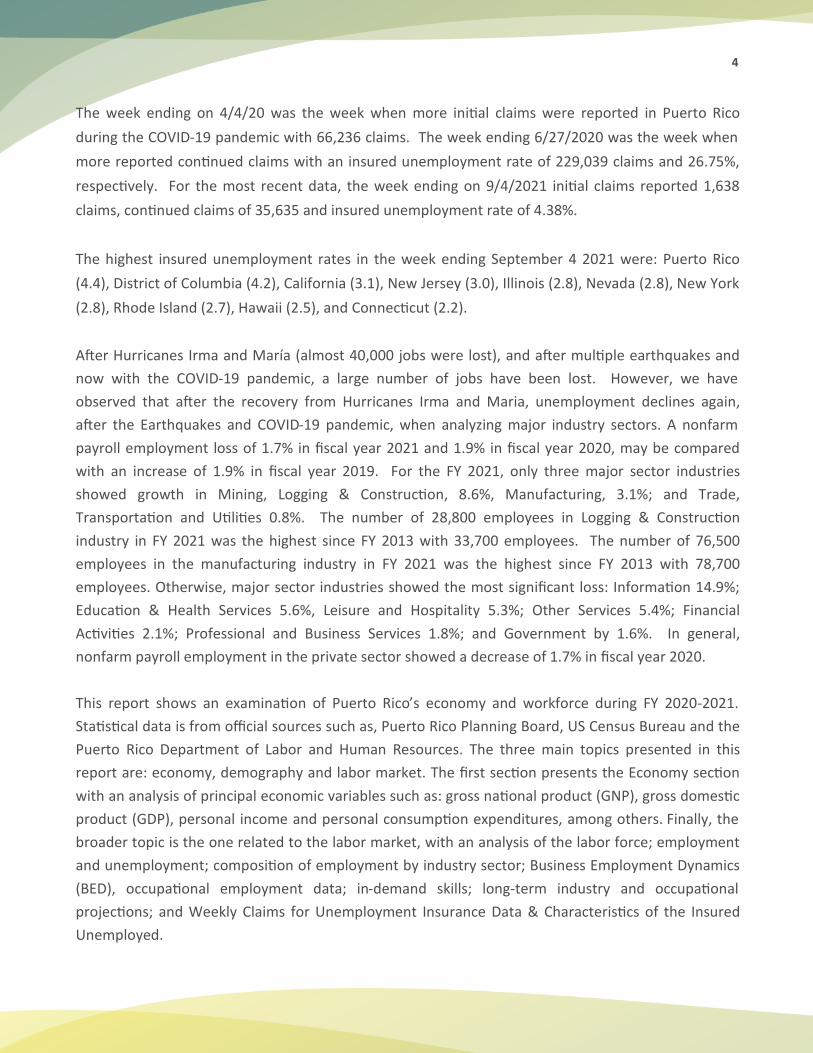
In FY 2020 Puerto Rico’s real gross national product (GNP) decreased by 3.2% (Figure 1), then a
downward trend was registered from FY 2006 to FY 2018, interrupted in FY 2012 and FY 2019, when
there was a slight increase of 0.5% and 1.8%, respectively. In terms of the aggregate demand, the
components that showed a decrease were: government consumption expenditure (0.3%), and
personal consumption expenditure (9.4%); and Otherwise, where a decrease was observed in
construction investment (37.3%); net sales to the rest of the world (15.7%); and gross domestic fixed
investment (22.1%).
Figure 1
Gross National Product - Constant Prices (millions of dollars - fiscal years)
Source: Puerto Rico Planning Board.
The gross domestic product (GDP), the output of goods and services produced by labor and property
located in Puerto Rico, showed a decrease of 1.7% in current prices for FY 2020 (Figure 2). This
variable has been recording falls in FY 2017 and FY 2018 fiscal years. The sectors of GDP that
registered a decrease in FY 2020 when compared with FY 2019 were: Utilities (19.5%); Agriculture
(11.4%); Government (9.3%); Management of Companies and Enterprises (8.8%); Transportation and
Warehousing (7.5%); Construction (3.7%); Professional, Scientific, and Technical Services (3.6%);
Retail Trade (3.6%); Other Services (3.1%); Mining (2.8%); Accommodation and Food Services (0.4%);
Real Estate and Rental (0.3%); and Wholesale Trade (0.1%). The Sectors that showed an increase
were: Finance and Insurance (18.3%); Art, Entertainment and Recreation (5.0%); Information (4.1%);
Educational Services (2.8%); Manufacturing (0.4%); Health Care and Social Services (0.3%); and
Administrative Services and Support (0.1%).
6,541.8 6,431.7 6,466.2 6,457.6 6,343.9 6,292.2 6,191.5 5,991.9 5,730.5 5,831.3 5,643.9
-3.6
-1.7
0.5
-0.1
-1.8
-0.8
-1.6
-3.2
-4.4
1.8
-3.2
-6.0
-5.0
-4.0
-3.0
-2.0
-1.0
0.0
1.0
2.0
3.0
5,000.0
5,200.0
5,400.0
5,600.0
5,800.0
6,000.0
6,200.0
6,400.0
6,600.0
6,800.0
2010 2011 2012 2013 2014 2015 2016 2017r 2018r 2019r 2020p
Percent Changein
mill
ions
of
dolla
rs
Fiscal Years
Constant Prices Percent Change
6
Figure 2 Gross Domestic Product - Current Prices
(millions of dollars - fiscal years)
Source: Puerto Rico Planning Board.
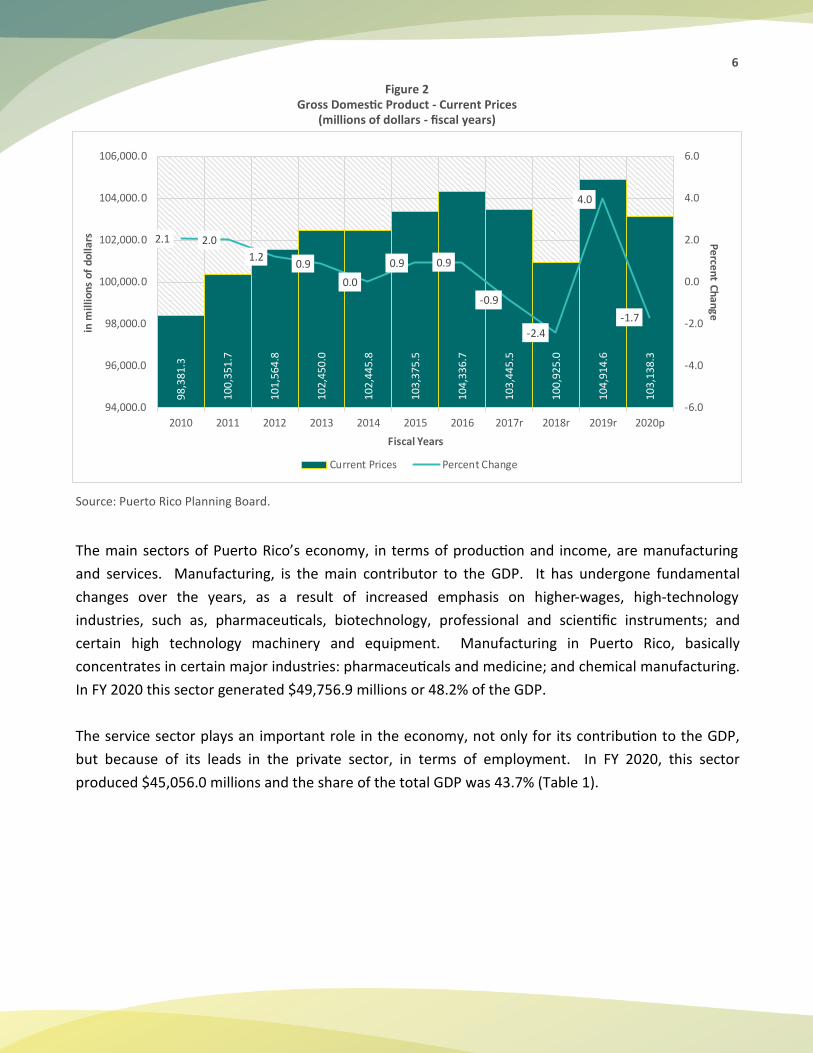
The main sectors of Puerto Rico’s economy, in terms of production and income, are manufacturing
and services. Manufacturing, is the main contributor to the GDP. It has undergone fundamental
changes over the years, as a result of increased emphasis on higher-wages, high-technology
industries, such as, pharmaceuticals, biotechnology, professional and scientific instruments; and
certain high technology machinery and equipment. Manufacturing in Puerto Rico, basically
concentrates in certain major industries: pharmaceuticals and medicine; and chemical manufacturing.
In FY 2020 this sector generated $49,756.9 millions or 48.2% of the GDP.
The service sector plays an important role in the economy, not only for its contribution to the GDP,
but because of its leads in the private sector, in terms of employment. In FY 2020, this sector
produced $45,056.0 millions and the share of the total GDP was 43.7% (Table 1).
98
,38
1.3
10
0,3
51
.7
10
1,5
64
.8
10
2,4
50
.0
10
2,4
45
.8
10
3,3
75
.5
10
4,3
36
.7
10
3,4
45
.5
10
0,9
25
.0
10
4,9
14
.6
10
3,1
38
.3
2.1 2.0
1.20.9
0.0
0.9 0.9
-0.9
-2.4
4.0
-1.7
-6.0
-4.0
-2.0
0.0
2.0
4.0
6.0
94,000.0
96,000.0
98,000.0
100,000.0
102,000.0
104,000.0
106,000.0
2010 2011 2012 2013 2014 2015 2016 2017r 2018r 2019r 2020p
Pe
rcen
t Ch
an
ge
in m
illi
on
s o
f d
oll
ars
Fiscal Years
Current Prices Percent Change
7
Table 1 Gross Domestic Product by Major Industrial Sector - Current Prices
(millions dollars - fiscal years)
r-revised figures P-preliminary figures Source: Puerto Rico Planning Board
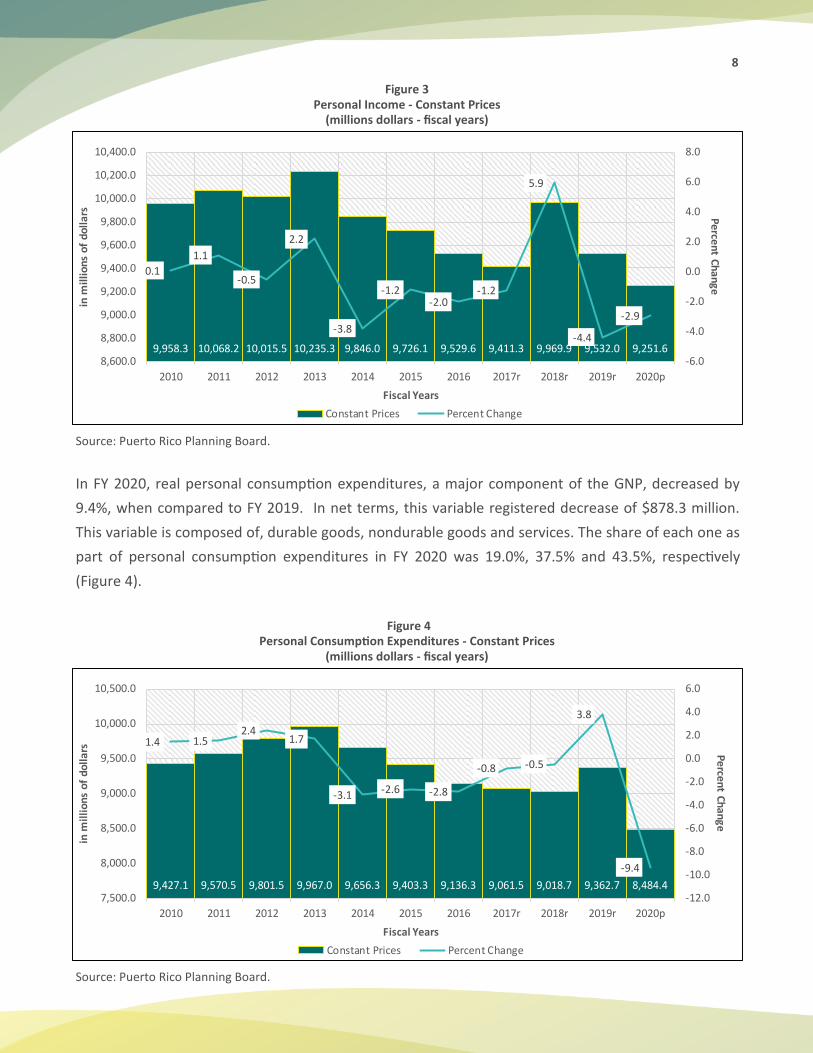
Personal income, in real terms, registered a decrease of 2.9% in FY 2020, reflecting a loss when
compared to FY 2019. This variable is composed of employee compensation, proprietor income and
transfer payments. The share of each one, as part of personal income in FY 2020 was 39.3%, 22.0%
and 45.5%, respectively (Figure 3).
Major Industry Fiscal Years
Difference Percent Change 2019r Percent 2020p Percent
Gross Domestic Product 104,914.6 / 103,138.3 / -1776.3 -1.7
Agriculture 719.6 0.7 637.4 0.6 -82.2 -11.4
Mining 43.0 0.0 41.8 0.0 -1.2 -2.8
Utilities 2,372.3 2.3 1,909.2 1.9 -463.1 -19.5
Construction 1,067.1 1.0 1,028.1 1.0 -39.0 -3.7
Manufacturing 49,581.1 47.3 49,756.9 48.2 175.8 0.4
Service (except Government) 44,721.7 42.6 45,056.0 43.7 334.3 0.7
Wholesalers Trade 2,771.4 2.6 2,769.1 2.7 -2.3 -0.1
Retail Trade 6,054.1 5.8 5,838.9 5.7 -215.2 -3.6
Transportation and Warehousing 1,371.4 1.3 1,269.0 1.2 -102.4 -7.5
Information 1,511.0 1.4 1,572.6 1.5 61.6 4.1
Finance and Insurance 4,022.5 3.8 4,758.6 4.6 736.1 18.3
Real Estate and Rental 17,154.4 16.4 17,100.0 16.6 -54.4 -0.3
Professional, Scientific, and Technical Services 2,503.2 2.4 2,412.7 2.3 -90.5 -3.6
Management of Companies and Enterprises 146.0 0.1 133.2 0.1 -12.8 -8.8
Administrative Services and Support 1,940.8 1.8 1,942.3 1.9 1.5 0.1
Educational Service 580.8 0.6 597.2 0.6 16.4 2.8
Health Care and Social Services 3,936.0 3.8 3,948.2 3.8 12.2 0.3
Art, Entertainment and Recreation 127.0 0.1 133.3 0.1 6.3 5.0
Accommodation and Food Services 2,157.7 2.1 2,149.3 2.1 -8.4 -0.4
Other Services 445.4 0.4 431.6 0.4 -13.8 -3.1
Government 5,861.1 5.6 5,318.4 5.2 -542.7 -9.3
Statistical discrepancy 548.9 0.5 -609.1 -0.6 -1158.0 -211.0
8
Figure 3 Personal Income - Constant Prices
(millions dollars - fiscal years)
Source: Puerto Rico Planning Board.
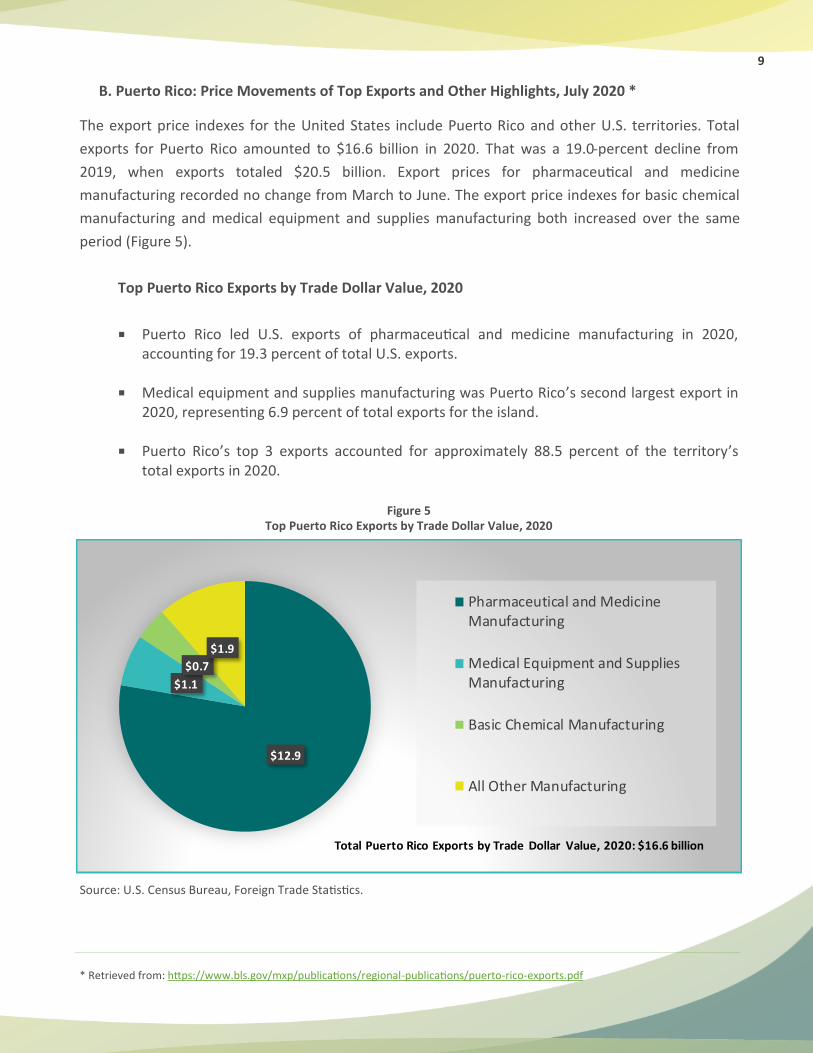
In FY 2020, real personal consumption expenditures, a major component of the GNP, decreased by
9.4%, when compared to FY 2019. In net terms, this variable registered decrease of $878.3 million.
This variable is composed of, durable goods, nondurable goods and services. The share of each one as
part of personal consumption expenditures in FY 2020 was 19.0%, 37.5% and 43.5%, respectively
(Figure 4).
Figure 4
Personal Consumption Expenditures - Constant Prices (millions dollars - fiscal years)
Source: Puerto Rico Planning Board.
9,958.3 10,068.2 10,015.5 10,235.3 9,846.0 9,726.1 9,529.6 9,411.3 9,969.9 9,532.0 9,251.6
0.1
1.1
-0.5
2.2
-3.8
-1.2-2.0
-1.2
5.9
-4.4
-2.9
-6.0
-4.0
-2.0
0.0
2.0
4.0
6.0
8.0
8,600.0
8,800.0
9,000.0
9,200.0
9,400.0
9,600.0
9,800.0
10,000.0
10,200.0
10,400.0
2010 2011 2012 2013 2014 2015 2016 2017r 2018r 2019r 2020p
Pe
rcen
t Ch
an
ge
in m
illi
on
s o
f d
oll
ars
Fiscal Years
Constant Prices Percent Change
9,427.1 9,570.5 9,801.5 9,967.0 9,656.3 9,403.3 9,136.3 9,061.5 9,018.7 9,362.7 8,484.4
1.4 1.52.4
1.7
-3.1 -2.6 -2.8
-0.8 -0.5
3.8
-9.4
-12.0
-10.0
-8.0
-6.0
-4.0
-2.0
0.0
2.0
4.0
6.0
7,500.0
8,000.0
8,500.0
9,000.0
9,500.0
10,000.0
10,500.0
2010 2011 2012 2013 2014 2015 2016 2017r 2018r 2019r 2020p
Pe
rcen
t Ch
an
ge
in m
illi
on
s o
f d
oll
ars
Fiscal Years
Constant Prices Percent Change
9
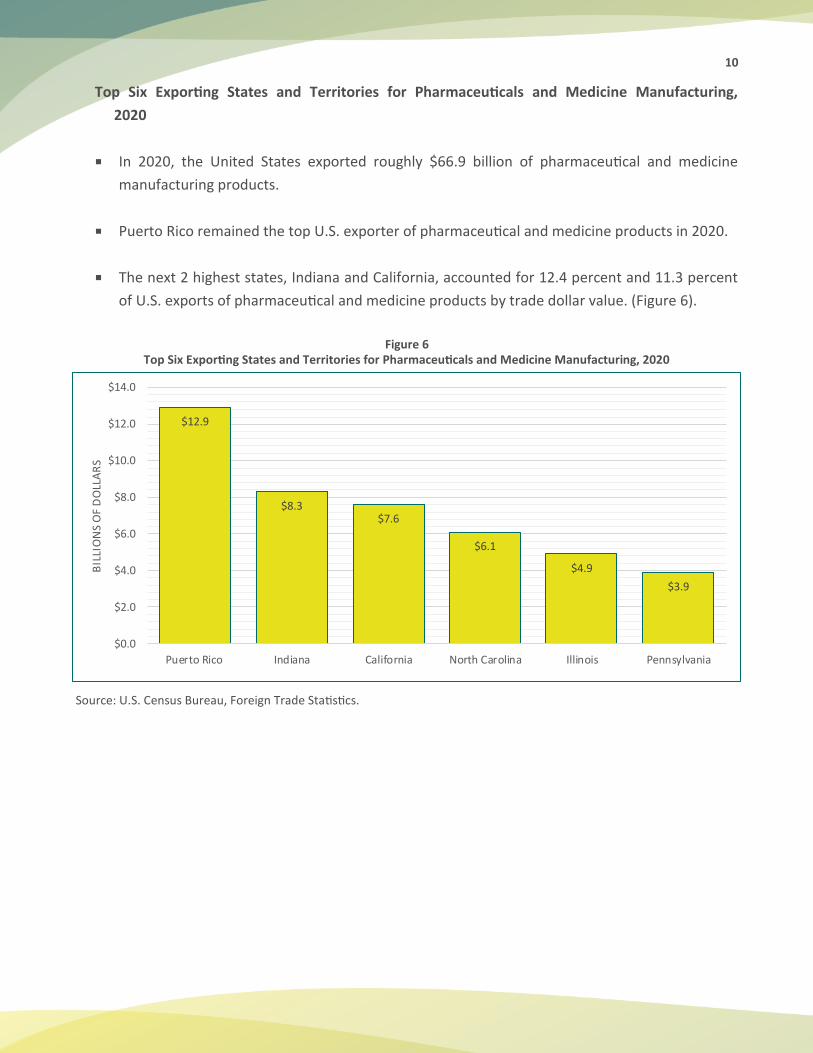
B. Puerto Rico: Price Movements of Top Exports and Other Highlights, July 2020 *
The export price indexes for the United States include Puerto Rico and other U.S. territories. Total
exports for Puerto Rico amounted to $16.6 billion in 2020. That was a 19.0-percent decline from
2019, when exports totaled $20.5 billion. Export prices for pharmaceutical and medicine
manufacturing recorded no change from March to June. The export price indexes for basic chemical
manufacturing and medical equipment and supplies manufacturing both increased over the same
period (Figure 5).
Top Puerto Rico Exports by Trade Dollar Value, 2020
Puerto Rico led U.S. exports of pharmaceutical and medicine manufacturing in 2020, accounting for 19.3 percent of total U.S. exports.
Medical equipment and supplies manufacturing was Puerto Rico’s second largest export in
2020, representing 6.9 percent of total exports for the island. Puerto Rico’s top 3 exports accounted for approximately 88.5 percent of the territory’s
total exports in 2020.
Figure 5 Top Puerto Rico Exports by Trade Dollar Value, 2020
Source: U.S. Census Bureau, Foreign Trade Statistics.
* Retrieved from: https://www.bls.gov/mxp/publications/regional-publications/puerto-rico-exports.pdf
$12.9
$1.1
$0.7
$1.9
Pharmaceutical and MedicineManufacturing
Medical Equipment and SuppliesManufacturing
Basic Chemical Manufacturing
All Other Manufacturing
Total Puerto Rico Exports by Trade Dollar Value, 2020: $16.6 billion
10
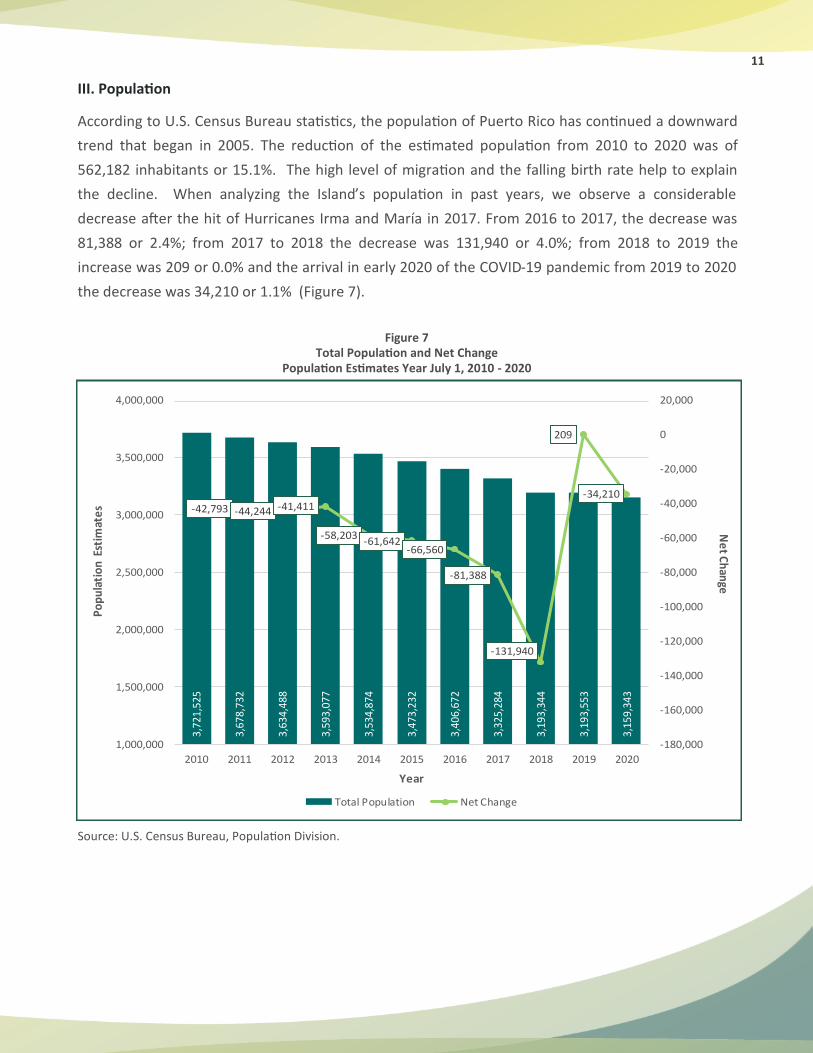
Top Six Exporting States and Territories for Pharmaceuticals and Medicine Manufacturing,
2020
In 2020, the United States exported roughly $66.9 billion of pharmaceutical and medicine
manufacturing products.
Puerto Rico remained the top U.S. exporter of pharmaceutical and medicine products in 2020.
The next 2 highest states, Indiana and California, accounted for 12.4 percent and 11.3 percent
of U.S. exports of pharmaceutical and medicine products by trade dollar value. (Figure 6).
Figure 6
Top Six Exporting States and Territories for Pharmaceuticals and Medicine Manufacturing, 2020
Source: U.S. Census Bureau, Foreign Trade Statistics.
$12.9
$8.3$7.6
$6.1
$4.9
$3.9
$0.0
$2.0
$4.0
$6.0
$8.0
$10.0
$12.0
$14.0
Puerto Rico Indiana California North Carolina Illinois Pennsylvania
BIL
LIO
NS
OF
DO
LLA
RS
11
III. Population
According to U.S. Census Bureau statistics, the population of Puerto Rico has continued a downward
trend that began in 2005. The reduction of the estimated population from 2010 to 2020 was of
562,182 inhabitants or 15.1%. The high level of migration and the falling birth rate help to explain
the decline. When analyzing the Island’s population in past years, we observe a considerable
decrease after the hit of Hurricanes Irma and María in 2017. From 2016 to 2017, the decrease was
81,388 or 2.4%; from 2017 to 2018 the decrease was 131,940 or 4.0%; from 2018 to 2019 the
increase was 209 or 0.0% and the arrival in early 2020 of the COVID-19 pandemic from 2019 to 2020
the decrease was 34,210 or 1.1% (Figure 7).
Figure 7 Total Population and Net Change
Population Estimates Year July 1, 2010 - 2020
Source: U.S. Census Bureau, Population Division.
3,72
1,52
5
3,67
8,73
2
3,63
4,48
8
3,59
3,07
7
3,53
4,87
4
3,47
3,23
2
3,40
6,67
2
3,32
5,28
4
3,19
3,34
4
3,19
3,55
3
3,15
9,34
3
-42,793 -44,244 -41,411
-58,203-61,642
-66,560
-81,388
-131,940
209
-34,210
-180,000
-160,000
-140,000
-120,000
-100,000
-80,000
-60,000
-40,000
-20,000
0
20,000
1,000,000
1,500,000
2,000,000
2,500,000
3,000,000
3,500,000
4,000,000
2010 2011 2012 2013 2014 2015 2016 2017 2018 2019 2020
Ne
t Ch
ange
Po
pu
lati
on
Est
imat
es
Year
Total Population Net Change
12
Table 2 Population by Local Workforce Development Areas (ALDL)
Population Estimates July 1, 2010 to 2020
Source: U.S. Census Bureau, Population Division.
Difference Difference
2010 2011 2012 2013 2014 2015 2016 2017 2018 2019 2020 (2010-2020) (2019-2020)
Bayamón - Comerío 228,440 225,099 221,493 217,889 213,283 208,732 203,620 197,775 188,893 187,845 185,050 -43,390 -2,795
Bayamón 207,649 204,469 200,996 197,491 193,080 188,769 183,967 178,496 170,326 169,185 166,499 -41,150 -2,686
Comerío 20,791 20,630 20,497 20,398 20,203 19,963 19,653 19,279 18,567 18,660 18,551 -2,240 -109
Caguas - Guayama 430,693 426,869 423,568 420,071 414,553 408,792 402,518 394,432 379,837 381,352 378,671 -52,022 -2,681
Aguas Buenas 28,655 28,337 28,056 27,787 27,355 26,927 26,416 25,828 24,803 24,843 24,598 -4,057 -245
Aibonito 25,874 25,537 25,204 24,881 24,455 24,040 23,594 23,055 22,125 22,107 21,844 -4,030 -263
Arroyo 19,573 19,432 19,244 19,069 18,818 18,530 18,221 17,817 17,159 17,224 17,091 -2,482 -133
Caguas 142,863 141,507 140,101 138,677 136,622 134,383 132,124 129,238 124,333 124,555 123,421 -19,442 -1,134
Cayey 48,111 47,671 47,225 46,769 46,126 45,471 44,815 43,897 42,323 42,431 42,165 -5,946 -266
Guayama 45,277 44,434 44,255 43,897 43,280 42,652 41,980 41,108 39,313 39,475 39,114 -6,163 -361
Gurabo 45,561 46,041 46,454 46,878 47,039 47,180 47,177 47,003 46,058 47,032 47,469 1,908 437
Trujillo Alto 74,779 73,910 73,029 72,113 70,858 69,609 68,191 66,486 63,723 63,685 62,969 -11,810 -716
Carolina 176,425 173,845 171,117 168,507 165,303 161,861 158,320 154,124 147,505 146,983 144,958 -31,467 -2,025
Guaynabo - Toa Baja 289,632 286,881 283,895 281,240 277,116 272,875 268,328 262,394 252,560 253,086 250,974 -38,658 -2,112
Cataño 28,091 27,641 27,192 26,783 26,237 25,629 25,046 24,318 23,231 23,109 22,788 -5,303 -321
Guaynabo 97,792 96,616 95,299 94,123 92,417 90,879 89,180 87,061 83,749 83,712 82,858 -14,934 -854
Toa Alta 74,282 74,537 74,669 74,824 74,616 74,348 73,900 73,068 71,025 72,041 72,215 -2,067 174
Toa Baja 89,467 88,087 86,735 85,510 83,846 82,019 80,202 77,947 74,555 74,224 73,113 -16,354 -1,111
La Montaña 164,745 163,492 162,112 160,873 158,824 156,598 154,192 150,996 145,386 145,898 144,814 -19,931 -1,084
Barranquitas 30,324 30,191 30,015 29,871 29,596 29,299 28,940 28,460 27,480 27,683 27,565 -2,759 -118
Cidra 43,483 43,167 42,776 42,458 41,862 41,231 40,606 39,728 38,235 38,301 38,015 -5,468 -286
Corozal 37,130 36,785 36,420 36,060 35,544 34,983 34,378 33,598 32,275 32,352 32,037 -5,093 -315
Naranjito 30,387 30,192 30,019 29,828 29,509 29,150 28,733 28,185 27,188 27,330 27,159 -3,228 -171
Orocovis 23,421 23,157 22,882 22,656 22,313 21,935 21,535 21,025 20,208 20,232 20,038 -3,383 -194
Manatí - Dorado 270,690 268,683 266,559 264,703 261,496 257,946 254,001 248,724 239,737 240,739 239,050 -31,640 -1,689
Barceloneta 24,827 24,820 24,806 24,832 24,770 24,614 24,449 24,161 23,462 23,737 23,756 -1,071 19
Ciales 18,753 18,467 18,204 17,977 17,689 17,353 17,017 16,584 15,888 15,833 15,618 -3,135 -215
Dorado 38,239 38,272 38,234 38,251 38,086 37,803 37,454 36,895 35,771 36,159 36,096 -2,143 -63
Florida 12,685 12,587 12,510 12,440 12,329 12,163 11,980 11,739 11,297 11,322 11,229 -1,456 -93
Manati 44,041 43,471 42,860 42,293 41,505 40,706 39,914 38,944 37,369 37,276 36,806 -7,235 -470
Morovis 32,651 32,587 32,481 32,371 32,123 31,860 31,517 31,033 30,039 30,329 30,340 -2,311 11
Vega Alta 39,946 39,811 39,625 39,500 39,072 38,659 38,009 37,063 35,793 36,066 35,863 -4,083 -203
Vega Baja 59,548 58,668 57,839 57,039 55,922 54,788 53,661 52,305 50,118 50,017 49,342 -10,206 -675
Mayagüez - Las Marías 98,662 96,738 94,797 93,029 90,735 88,542 86,297 83,742 79,894 79,413 77,989 -20,673 -1,424
Las Marías 9,869 9,679 9,501 9,341 9,109 8,875 8,660 8,386 7,966 7,915 7,730 -2,139 -185
Mayagüez 88,793 87,059 85,296 83,688 81,626 79,667 77,637 75,356 71,928 71,498 70,259 -18,534 -1,239
Noreste 240,437 238,438 236,585 234,561 231,249 227,566 223,605 218,696 210,521 211,127 209,482 -30,955 -1,645
Canóvanas 47,685 47,661 47,646 47,546 47,276 46,897 46,385 45,688 44,259 44,662 44,604 -3,081 -58
Ceiba 13,611 13,353 13,088 12,870 12,550 12,238 11,916 11,544 11,005 10,894 10,678 -2,933 -216
Culebra 1,820 1,812 1,813 1,815 1,813 1,808 1,793 1,769 1,713 1,714 1,720 -100 6
Fajardo 36,875 36,222 35,511 34,834 33,926 33,057 32,168 31,155 29,674 29,439 28,879 -7,996 -560
Loíza 30,017 29,525 29,012 28,548 27,934 27,240 26,612 25,845 24,676 24,535 24,154 -5,863 -381
Luquillo 20,055 19,908 19,735 19,531 19,288 18,962 18,637 18,256 17,588 17,645 17,495 -2,560 -150
Naguabo 26,774 26,839 26,865 26,896 26,781 26,631 26,462 26,144 25,410 25,779 25,858 -916 79
Rio Grande 54,295 53,882 53,700 53,355 52,612 51,781 50,813 49,645 47,850 48,068 47,762 -6,533 -306
Vieques 9,305 9,236 9,215 9,166 9,069 8,952 8,819 8,650 8,346 8,391 8,332 -973 -59
Local Area NamePopulation Estimate (as of July 1)
13
Table 2 (Cont.) Population by Municipalities
Population Estimates July 1, 2010 to 2020
Source: U.S. Census Bureau, Population Division.
Difference Difference
2010 2011 2012 2013 2014 2015 2016 2017 2018 2019 2020 (2010-2020) (2019-2020)
Noroeste 275,248 272,526 269,341 266,327 262,400 257,985 253,202 247,229 237,581 237,591 235,327 -39,921 -2,264
Aguada 41,913 41,531 41,102 40,706 40,131 39,546 38,899 38,018 36,610 36,664 36,343 -5,570 -321
Aguadilla 60,766 59,976 58,976 58,038 57,086 55,818 54,416 52,911 50,558 50,245 49,632 -11,134 -613
Añasco 29,265 29,096 28,851 28,621 28,319 27,948 27,561 26,981 26,038 26,177 26,016 -3,249 -161
Isabela 45,654 45,324 44,917 44,559 43,990 43,360 42,716 41,772 40,257 40,466 40,208 -5,446 -258
Moca 40,100 39,743 39,341 38,937 38,339 37,748 37,088 36,281 34,869 34,902 34,597 -5,503 -305
Rincón 15,203 15,094 14,979 14,868 14,726 14,559 14,354 14,081 13,606 13,644 13,561 -1,642 -83
San Sebastián 42,347 41,762 41,175 40,598 39,809 39,006 38,168 37,185 35,643 35,493 34,970 -7,377 -523
Norte Central - Arecibo 299,020 295,684 292,183 289,328 284,622 279,758 274,418 267,796 257,424 257,529 254,879 -44,141 -2,650
Adjuntas 19,472 19,297 19,116 19,021 18,795 18,568 18,306 17,935 17,282 17,332 17,213 -2,259 -119
Arecibo 96,222 95,012 93,839 92,957 91,239 89,628 87,806 85,421 82,094 81,999 81,090 -15,132 -909
Camuy 35,124 34,777 34,393 34,059 33,532 33,001 32,387 31,686 30,471 30,525 30,261 -4,863 -264
Hatillo 41,979 41,905 41,777 41,723 41,411 41,054 40,635 40,020 38,824 39,193 39,135 -2,844 -58
Jayuya 16,641 16,419 16,163 15,928 15,660 15,308 15,016 14,602 13,946 13,921 13,711 -2,930 -210
Lares 30,631 30,004 29,367 28,793 28,105 27,366 26,574 25,727 24,470 24,233 23,723 -6,908 -510
Quebradillas 25,895 25,695 25,490 25,291 24,943 24,579 24,173 23,655 22,823 22,922 22,732 -3,163 -190
Utuado 33,056 32,575 32,038 31,556 30,937 30,254 29,521 28,750 27,514 27,404 27,014 -6,042 -390
Ponce 165,723 162,618 159,312 156,393 153,003 149,043 144,499 139,894 133,156 131,964 128,858 -36,865 -3,106
San Juan 394,235 386,858 379,480 372,435 364,079 355,496 346,381 336,089 320,700 318,622 312,975 -81,260 -5,647
Sur Central 171,647 170,350 168,899 167,699 165,636 163,372 160,886 157,719 151,948 152,697 151,889 -19,758 -808
Coamo 40,576 40,569 40,467 40,411 40,158 39,879 39,480 38,956 37,836 38,319 38,424 -2,152 105
Juana Díaz 50,736 50,273 49,792 49,358 48,716 48,019 47,279 46,274 44,533 44,674 44,312 -6,424 -362
Salinas 31,042 30,761 30,410 30,177 29,739 29,293 28,808 28,245 27,095 27,095 26,945 -4,097 -150
Santa Isabel 23,290 23,200 23,093 23,006 22,759 22,514 22,219 21,785 21,041 21,200 21,126 -2,164 -74
Villalba 26,003 25,547 25,137 24,747 24,264 23,667 23,100 22,459 21,443 21,409 21,082 -4,921 -327
Sureste 247,805 245,884 243,804 242,011 238,957 235,759 232,296 227,710 219,692 220,591 219,224 -28,581 -1,367
Humacao 58,375 57,787 57,124 56,528 55,715 54,807 53,825 52,644 50,653 50,640 50,170 -8,205 -470
Juncos 40,349 40,296 40,238 40,237 39,937 39,708 39,425 38,902 37,713 38,151 38,165 -2,184 14
Las Piedras 38,714 38,768 38,726 38,715 38,545 38,307 38,049 37,580 36,508 36,983 37,043 -1,671 60
Maunabo 12,238 12,070 11,911 11,757 11,551 11,321 11,092 10,808 10,371 10,341 10,228 -2,010 -113
Patillas 19,225 18,956 18,702 18,478 18,157 17,793 17,422 16,974 16,288 16,237 16,035 -3,190 -202
San Lorenzo 41,023 40,640 40,260 39,922 39,324 38,746 38,118 37,279 35,901 35,967 35,667 -5,356 -300
Yabucoa 37,881 37,367 36,843 36,374 35,728 35,077 34,365 33,523 32,258 32,272 31,916 -5,965 -356
Suroeste 268,123 264,767 261,343 258,011 253,618 248,907 244,109 237,964 228,510 228,116 225,203 -42,920 -2,913
Cabo Rojo 50,971 50,803 50,648 50,545 50,165 49,778 49,348 48,610 47,113 47,464 47,352 -3,619 -112
Guánica 19,376 18,975 18,624 18,241 17,808 17,360 16,857 16,339 15,528 15,362 15,037 -4,339 -325
Guayanilla 21,523 21,184 20,831 20,512 20,068 19,589 19,126 18,542 17,732 17,640 17,360 -4,163 -280
Hormigueros 17,250 17,162 17,028 16,886 16,701 16,491 16,269 15,979 15,463 15,520 15,423 -1,827 -97
Lajas 25,704 25,386 25,113 24,791 24,383 23,908 23,431 22,863 22,001 21,981 21,677 -4,027 -304
Maricao 6,277 6,205 6,131 6,082 5,987 5,875 5,767 5,630 5,425 5,434 5,388 -889 -46
Penuelas 24,214 23,760 23,269 22,808 22,281 21,721 21,112 20,413 19,394 19,238 18,827 -5,387 -411
Sabana Grande 25,344 25,052 24,722 24,477 24,100 23,625 23,186 22,616 21,727 21,715 21,455 -3,889 -260
San German 35,626 35,193 34,717 34,161 33,572 32,954 32,338 31,476 30,251 30,193 29,796 -5,830 -397
Yauco 41,838 41,047 40,260 39,508 38,553 37,606 36,675 35,496 33,876 33,569 32,888 -8,950 -681
Local Area NamePopulation Estimate (as of July 1)
14
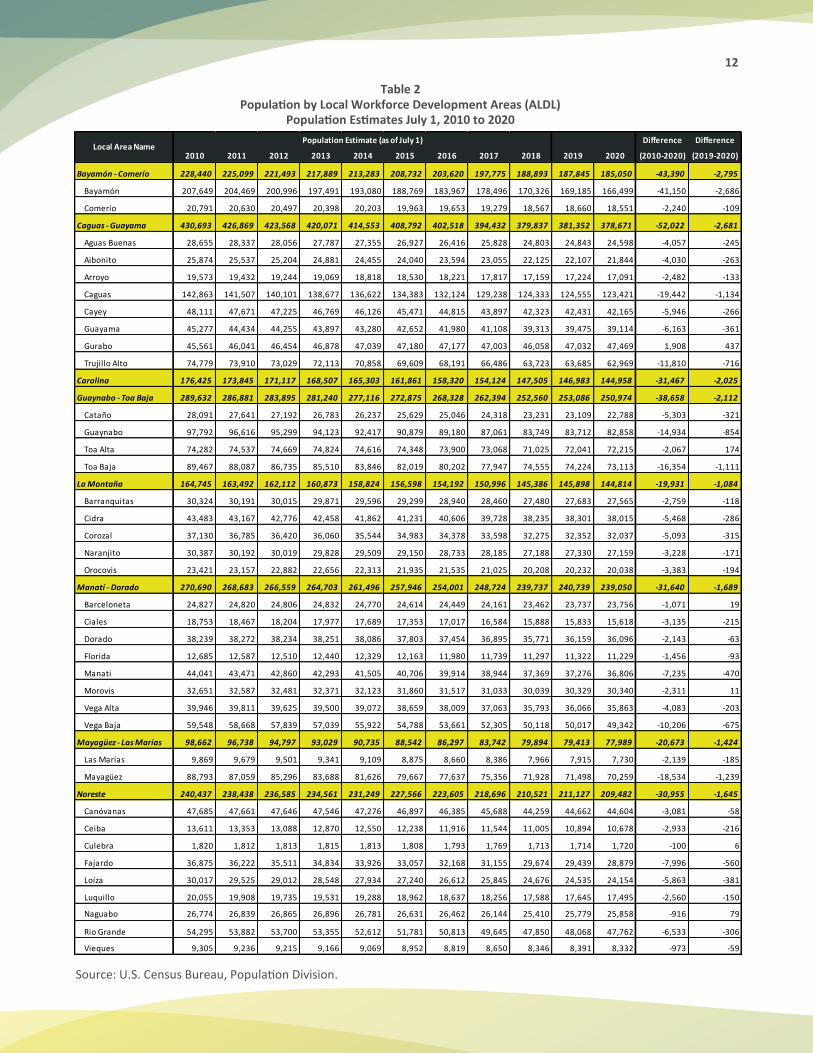
The Bayamón-Comerío area registered a reduction in the estimated population from 2010 to 2020
by 43,390 inhabitants or 19.0%. From 2019 to 2020 the loss was of 2,795 or 1.5% (Figure 8).
Figure 8 Population Estimates by Local Workforce Development Areas (ALDL), Bayamón-Comerío
July 1, 2010 to July 1, 2020
Source: U.S. Census Bureau, Population Division.
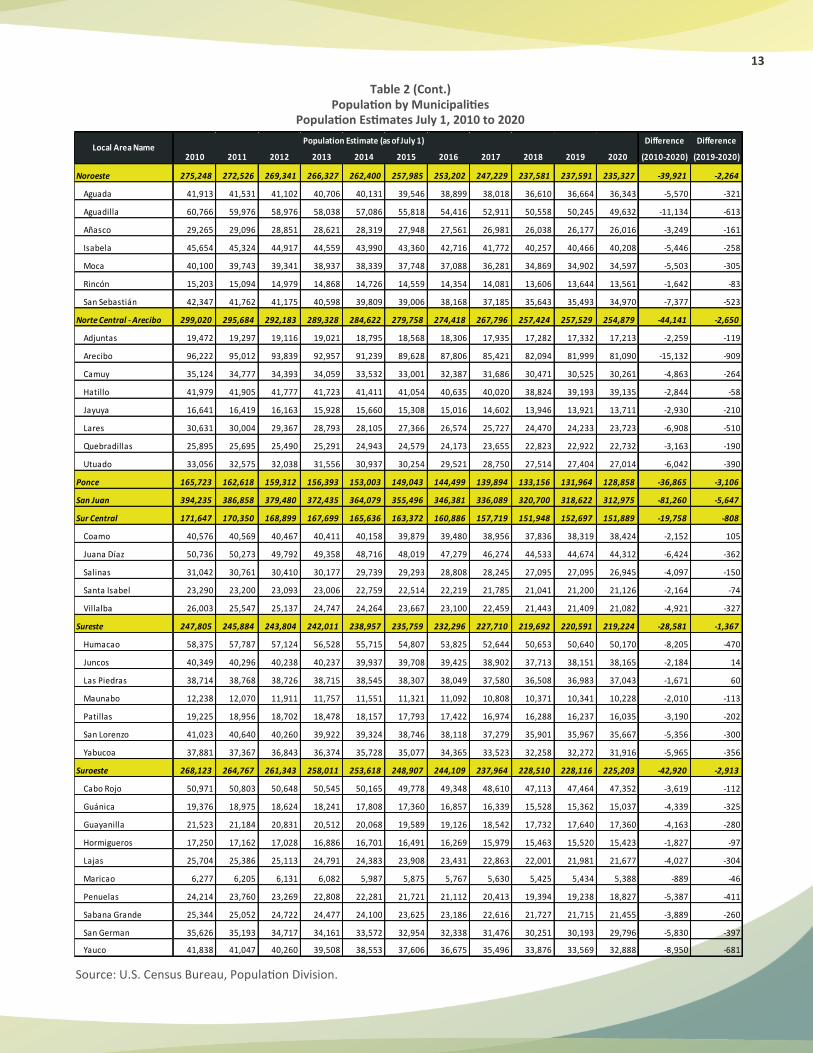
The Caguas-Guayama area presented a reduction in the estimated population from 2010 to 2020 of
52,022 inhabitants or 12.1%. From 2019 to 2020 the loss was of 2,681 or 0.7% was observed
(Figure 9).
Figure 9
Population Estimates by Local Workforce Development Areas (ALDL), Caguas-Guayama July 1, 2010 to July 1, 2020
Source: U.S. Census Bureau, Population Division.
228,440 225,099 221,493 217,889 213,283 208,732 203,620 197,775 188,893 187,845 185,050
-3,341 -3,606 -3,604-4,606 -4,551
-5,112-5,845
-8,882
-1,048
-2,795
-14,000
-12,000
-10,000
-8,000
-6,000
-4,000
-2,000
0
100,000
120,000
140,000
160,000
180,000
200,000
220,000
240,000
2010 2011 2012 2013 2014 2015 2016 2017 2018 2019 2020
An
nu
al Ne
t Ch
angeP
op
ula
tio
n E
stim
ate
s
Year
Population Estimates Annual Net Change
430,693 426,869 423,568 420,071 414,553 408,792 402,518 394,432 379,837 381,352 378,671
-3,824 -3,301 -3,497
-5,518 -5,761 -6,274-8,086
-14,595
1,515
-2,681
-18,000
-13,000
-8,000
-3,000
2,000
7,000
100,000
150,000
200,000
250,000
300,000
350,000
400,000
450,000
2010 2011 2012 2013 2014 2015 2016 2017 2018 2019 2020
An
nu
al Ne
t Ch
angeP
op
ula
tio
n E
stim
ate
s
Year
Population Estimates Annual Net Change
15
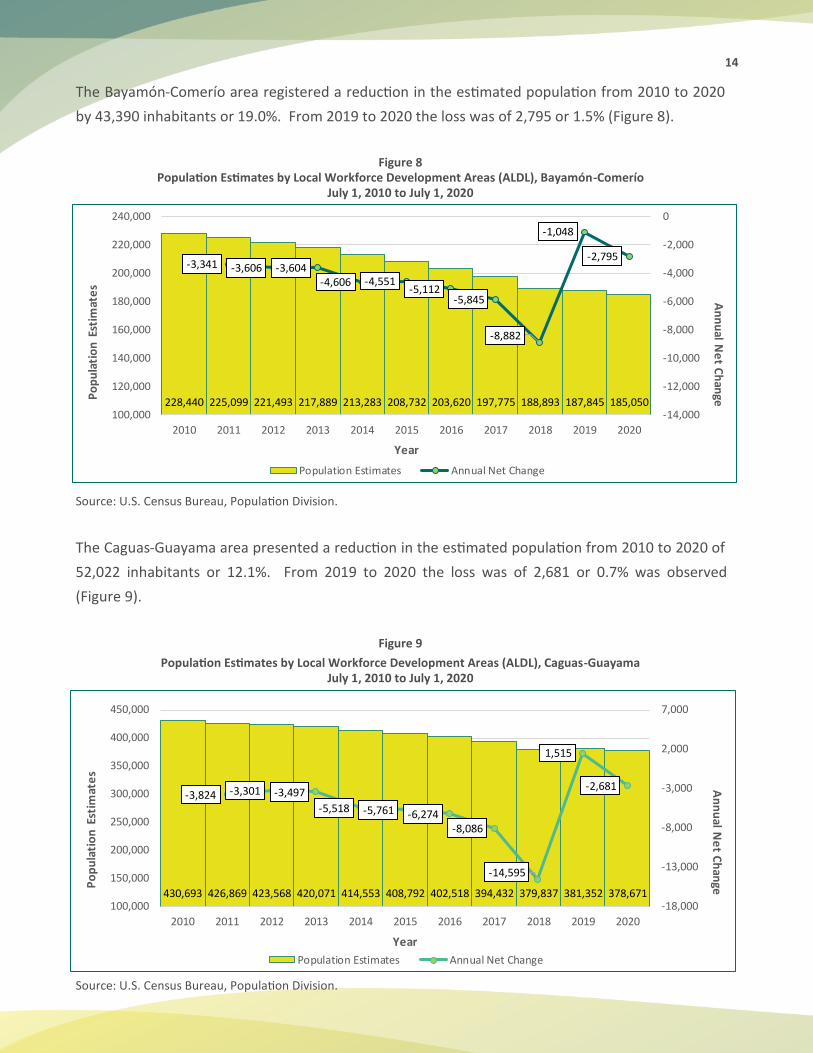
The Carolina area showed a drop in population from 2010 to 2020 of 31,467 inhabitants or 17.8%.
From 2019 to 2020 the loss was of 2,025 or 1.4% (Figure 10).
Figure 10 Population Estimates by Local Workforce Development Areas (ALDL), Carolina
July 1, 2010 to July 1, 2020
Source: U.S. Census Bureau, Population Division.
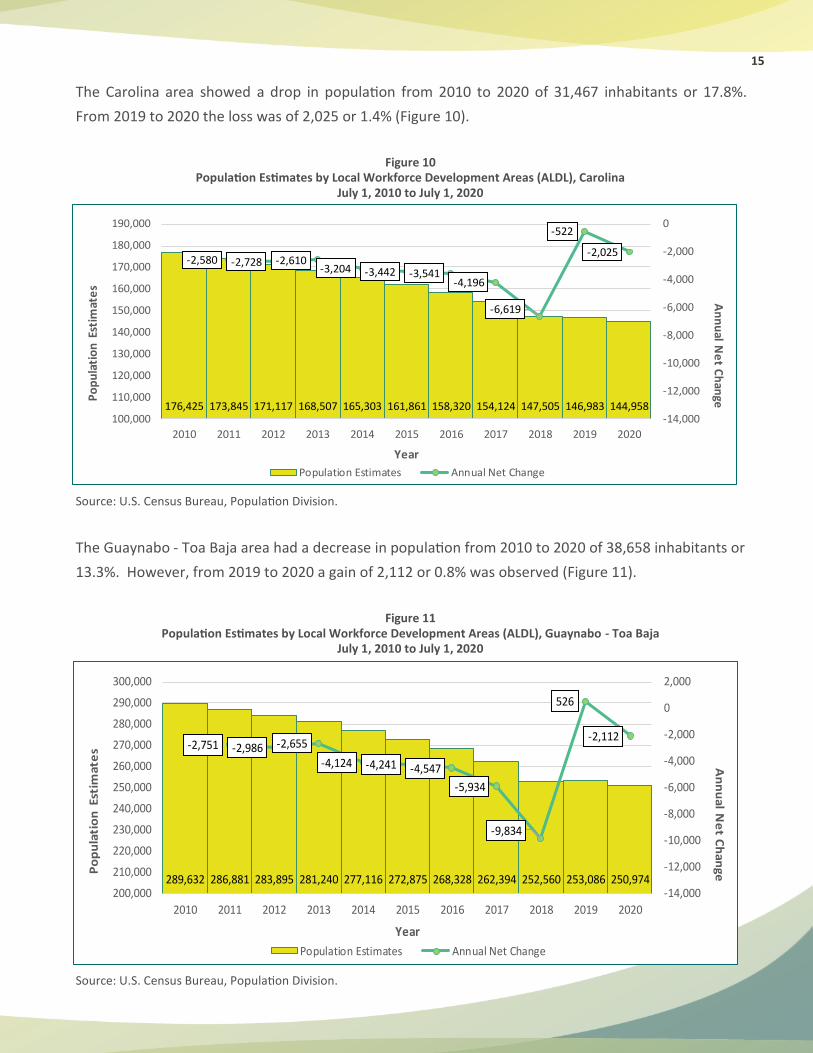
The Guaynabo - Toa Baja area had a decrease in population from 2010 to 2020 of 38,658 inhabitants or
13.3%. However, from 2019 to 2020 a gain of 2,112 or 0.8% was observed (Figure 11).
Figure 11 Population Estimates by Local Workforce Development Areas (ALDL), Guaynabo - Toa Baja
July 1, 2010 to July 1, 2020
Source: U.S. Census Bureau, Population Division.
176,425 173,845 171,117 168,507 165,303 161,861 158,320 154,124 147,505 146,983 144,958
-2,580 -2,728 -2,610-3,204 -3,442 -3,541
-4,196
-6,619
-522
-2,025
-14,000
-12,000
-10,000
-8,000
-6,000
-4,000
-2,000
0
100,000
110,000
120,000
130,000
140,000
150,000
160,000
170,000
180,000
190,000
2010 2011 2012 2013 2014 2015 2016 2017 2018 2019 2020
An
nu
al Ne
t Ch
angeP
op
ula
tio
n E
stim
ate
s
Year
Population Estimates Annual Net Change
289,632 286,881 283,895 281,240 277,116 272,875 268,328 262,394 252,560 253,086 250,974
-2,751 -2,986 -2,655
-4,124 -4,241 -4,547
-5,934
-9,834
526
-2,112
-14,000
-12,000
-10,000
-8,000
-6,000
-4,000
-2,000
0
2,000
200,000
210,000
220,000
230,000
240,000
250,000
260,000
270,000
280,000
290,000
300,000
2010 2011 2012 2013 2014 2015 2016 2017 2018 2019 2020
An
nu
al Ne
t Ch
angeP
op
ula
tio
n E
stim
ate
s
Year
Population Estimates Annual Net Change
16
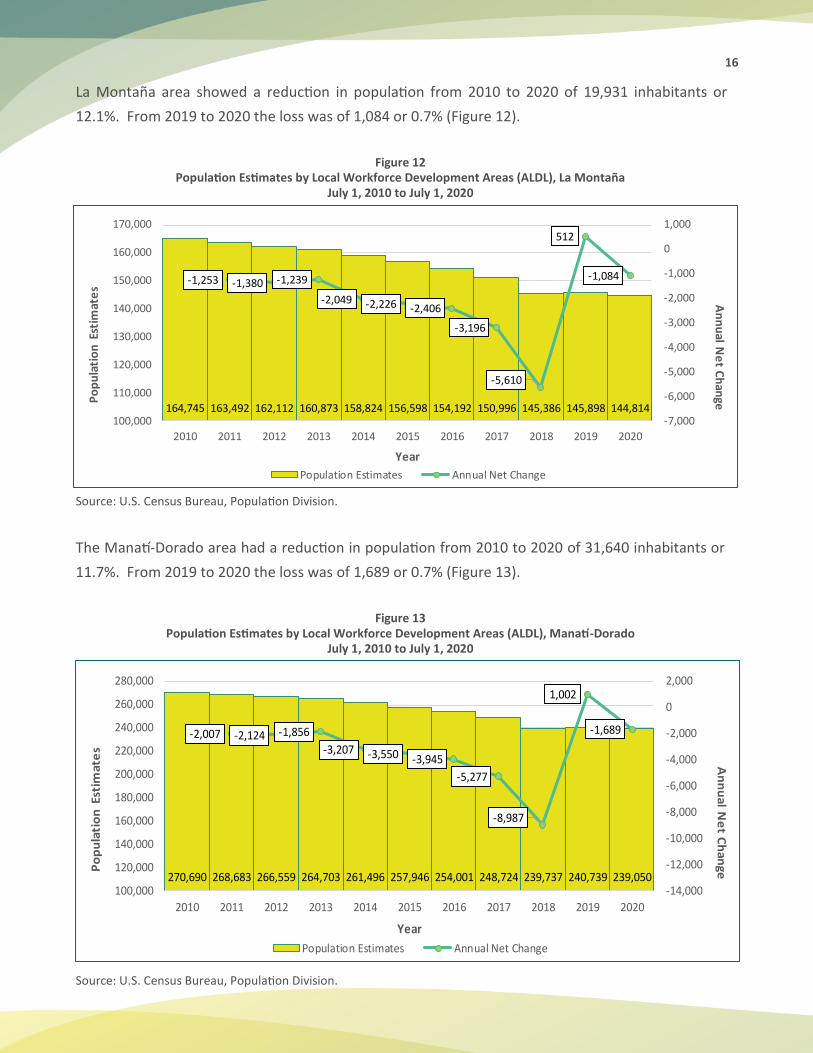
La Montaña area showed a reduction in population from 2010 to 2020 of 19,931 inhabitants or
12.1%. From 2019 to 2020 the loss was of 1,084 or 0.7% (Figure 12).
Figure 12 Population Estimates by Local Workforce Development Areas (ALDL), La Montaña
July 1, 2010 to July 1, 2020
Source: U.S. Census Bureau, Population Division.
The Manatí-Dorado area had a reduction in population from 2010 to 2020 of 31,640 inhabitants or
11.7%. From 2019 to 2020 the loss was of 1,689 or 0.7% (Figure 13).
Figure 13 Population Estimates by Local Workforce Development Areas (ALDL), Manatí-Dorado
July 1, 2010 to July 1, 2020
Source: U.S. Census Bureau, Population Division.
164,745 163,492 162,112 160,873 158,824 156,598 154,192 150,996 145,386 145,898 144,814
-1,253 -1,380 -1,239
-2,049 -2,226 -2,406
-3,196
-5,610
512
-1,084
-7,000
-6,000
-5,000
-4,000
-3,000
-2,000
-1,000
0
1,000
100,000
110,000
120,000
130,000
140,000
150,000
160,000
170,000
2010 2011 2012 2013 2014 2015 2016 2017 2018 2019 2020
An
nu
al Ne
t Ch
angeP
op
ula
tio
n E
stim
ate
s
Year
Population Estimates Annual Net Change
270,690 268,683 266,559 264,703 261,496 257,946 254,001 248,724 239,737 240,739 239,050
-2,007 -2,124 -1,856
-3,207 -3,550 -3,945
-5,277
-8,987
1,002
-1,689
-14,000
-12,000
-10,000
-8,000
-6,000
-4,000
-2,000
0
2,000
100,000
120,000
140,000
160,000
180,000
200,000
220,000
240,000
260,000
280,000
2010 2011 2012 2013 2014 2015 2016 2017 2018 2019 2020
An
nu
al Ne
t Ch
angeP
op
ula
tio
n E
stim
ate
s
Year
Population Estimates Annual Net Change
17
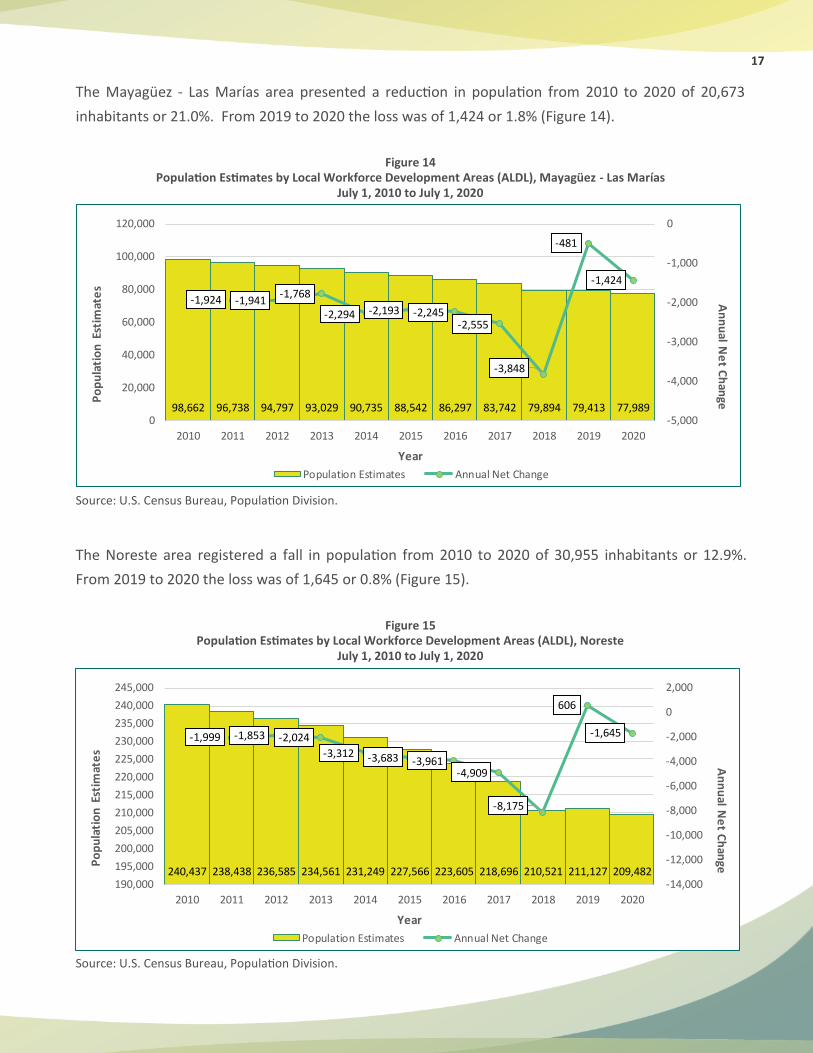
The Mayagüez - Las Marías area presented a reduction in population from 2010 to 2020 of 20,673
inhabitants or 21.0%. From 2019 to 2020 the loss was of 1,424 or 1.8% (Figure 14).
Figure 14 Population Estimates by Local Workforce Development Areas (ALDL), Mayagüez - Las Marías
July 1, 2010 to July 1, 2020
Source: U.S. Census Bureau, Population Division.
The Noreste area registered a fall in population from 2010 to 2020 of 30,955 inhabitants or 12.9%.
From 2019 to 2020 the loss was of 1,645 or 0.8% (Figure 15).
Figure 15 Population Estimates by Local Workforce Development Areas (ALDL), Noreste
July 1, 2010 to July 1, 2020
Source: U.S. Census Bureau, Population Division.
98,662 96,738 94,797 93,029 90,735 88,542 86,297 83,742 79,894 79,413 77,989
-1,924 -1,941-1,768
-2,294 -2,193 -2,245-2,555
-3,848
-481
-1,424
-5,000
-4,000
-3,000
-2,000
-1,000
0
0
20,000
40,000
60,000
80,000
100,000
120,000
2010 2011 2012 2013 2014 2015 2016 2017 2018 2019 2020
An
nu
al Ne
t Ch
angeP
op
ula
tio
n E
stim
ate
s
Year
Population Estimates Annual Net Change
240,437 238,438 236,585 234,561 231,249 227,566 223,605 218,696 210,521 211,127 209,482
-1,999 -1,853 -2,024
-3,312 -3,683 -3,961-4,909
-8,175
606
-1,645
-14,000
-12,000
-10,000
-8,000
-6,000
-4,000
-2,000
0
2,000
190,000
195,000
200,000
205,000
210,000
215,000
220,000
225,000
230,000
235,000
240,000
245,000
2010 2011 2012 2013 2014 2015 2016 2017 2018 2019 2020
An
nu
al Ne
t Ch
angeP
op
ula
tio
n E
stim
ate
s
Year
Population Estimates Annual Net Change
18
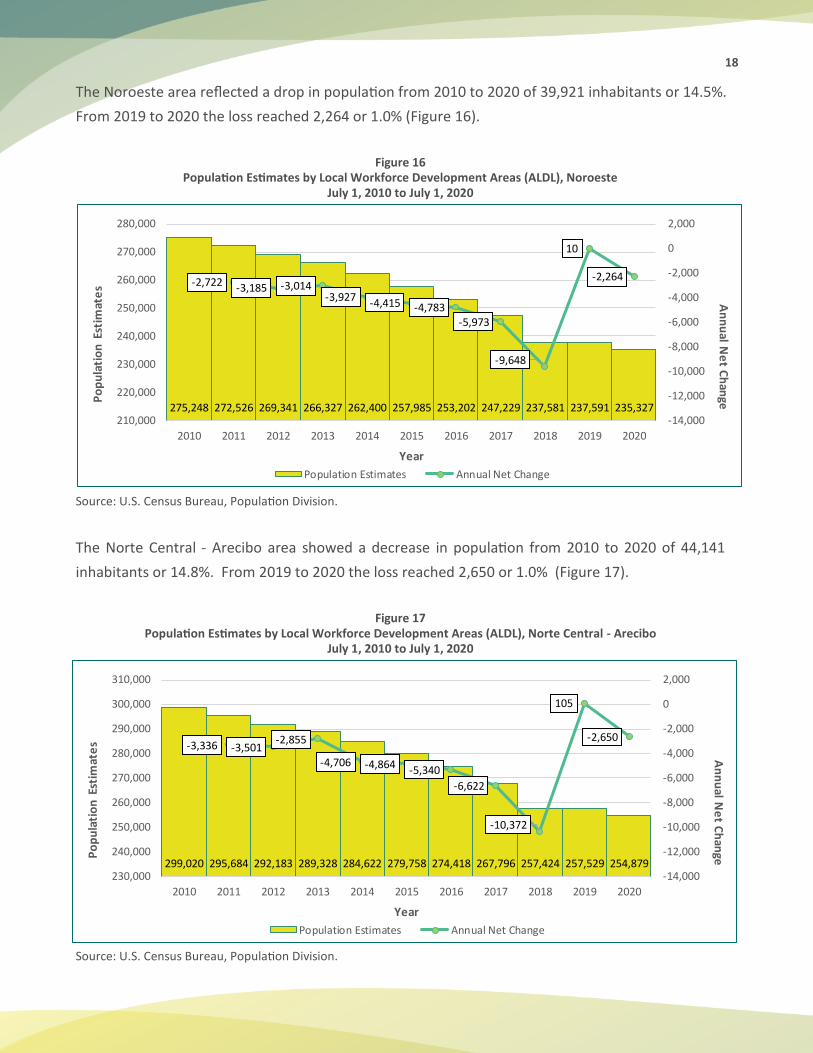
The Noroeste area reflected a drop in population from 2010 to 2020 of 39,921 inhabitants or 14.5%.
From 2019 to 2020 the loss reached 2,264 or 1.0% (Figure 16).
Figure 16 Population Estimates by Local Workforce Development Areas (ALDL), Noroeste
July 1, 2010 to July 1, 2020
Source: U.S. Census Bureau, Population Division.
The Norte Central - Arecibo area showed a decrease in population from 2010 to 2020 of 44,141
inhabitants or 14.8%. From 2019 to 2020 the loss reached 2,650 or 1.0% (Figure 17).
Figure 17 Population Estimates by Local Workforce Development Areas (ALDL), Norte Central - Arecibo
July 1, 2010 to July 1, 2020
Source: U.S. Census Bureau, Population Division.
275,248 272,526 269,341 266,327 262,400 257,985 253,202 247,229 237,581 237,591 235,327
-2,722 -3,185 -3,014-3,927
-4,415 -4,783-5,973
-9,648
10
-2,264
-14,000
-12,000
-10,000
-8,000
-6,000
-4,000
-2,000
0
2,000
210,000
220,000
230,000
240,000
250,000
260,000
270,000
280,000
2010 2011 2012 2013 2014 2015 2016 2017 2018 2019 2020
An
nu
al Ne
t Ch
angeP
op
ula
tio
n E
stim
ate
s
Year
Population Estimates Annual Net Change
299,020 295,684 292,183 289,328 284,622 279,758 274,418 267,796 257,424 257,529 254,879
-3,336 -3,501-2,855
-4,706 -4,864 -5,340
-6,622
-10,372
105
-2,650
-14,000
-12,000
-10,000
-8,000
-6,000
-4,000
-2,000
0
2,000
230,000
240,000
250,000
260,000
270,000
280,000
290,000
300,000
310,000
2010 2011 2012 2013 2014 2015 2016 2017 2018 2019 2020
An
nu
al Ne
t Ch
angeP
op
ula
tio
n E
stim
ate
s
Year
Population Estimates Annual Net Change
19
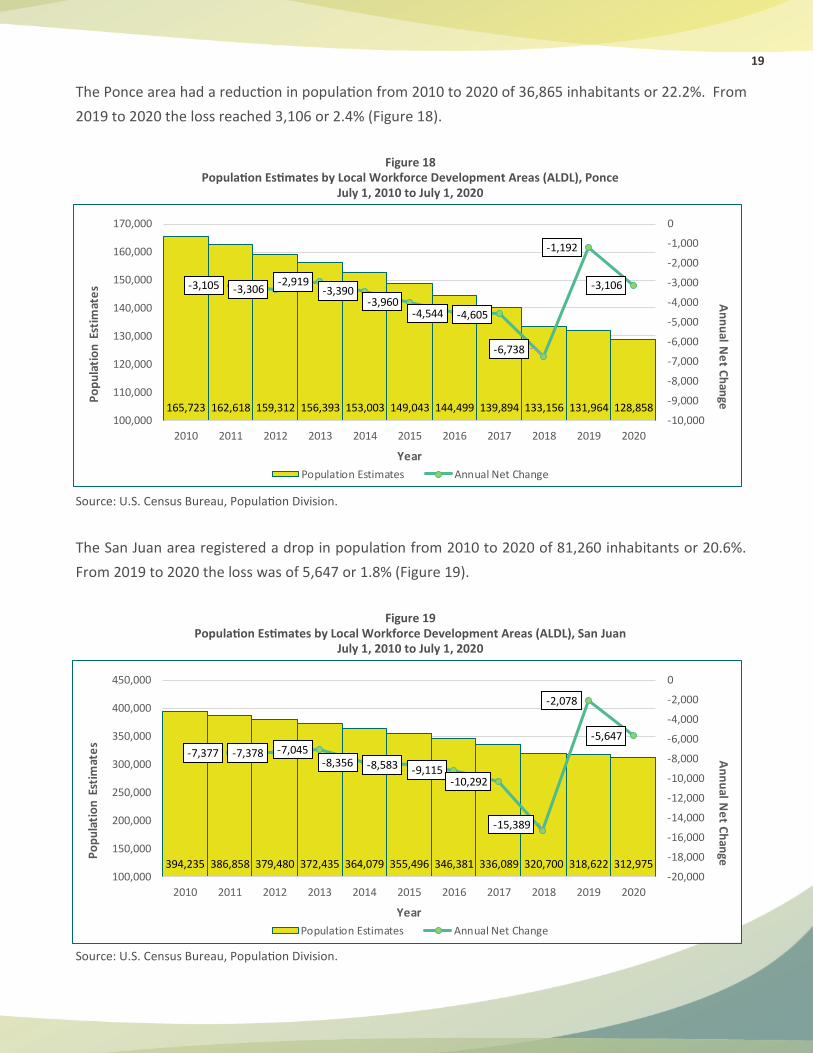
The Ponce area had a reduction in population from 2010 to 2020 of 36,865 inhabitants or 22.2%. From
2019 to 2020 the loss reached 3,106 or 2.4% (Figure 18).
Figure 18 Population Estimates by Local Workforce Development Areas (ALDL), Ponce
July 1, 2010 to July 1, 2020
Source: U.S. Census Bureau, Population Division.
The San Juan area registered a drop in population from 2010 to 2020 of 81,260 inhabitants or 20.6%.
From 2019 to 2020 the loss was of 5,647 or 1.8% (Figure 19).
Figure 19 Population Estimates by Local Workforce Development Areas (ALDL), San Juan
July 1, 2010 to July 1, 2020
Source: U.S. Census Bureau, Population Division.
165,723 162,618 159,312 156,393 153,003 149,043 144,499 139,894 133,156 131,964 128,858
-3,105 -3,306-2,919
-3,390-3,960
-4,544 -4,605
-6,738
-1,192
-3,106
-10,000
-9,000
-8,000
-7,000
-6,000
-5,000
-4,000
-3,000
-2,000
-1,000
0
100,000
110,000
120,000
130,000
140,000
150,000
160,000
170,000
2010 2011 2012 2013 2014 2015 2016 2017 2018 2019 2020
An
nu
al Ne
t Ch
angeP
op
ula
tio
n E
stim
ate
s
Year
Population Estimates Annual Net Change
394,235 386,858 379,480 372,435 364,079 355,496 346,381 336,089 320,700 318,622 312,975
-7,377 -7,378 -7,045-8,356 -8,583 -9,115
-10,292
-15,389
-2,078
-5,647
-20,000
-18,000
-16,000
-14,000
-12,000
-10,000
-8,000
-6,000
-4,000
-2,000
0
100,000
150,000
200,000
250,000
300,000
350,000
400,000
450,000
2010 2011 2012 2013 2014 2015 2016 2017 2018 2019 2020
An
nu
al Ne
t Ch
angeP
op
ula
tio
n E
stim
ate
s
Year
Population Estimates Annual Net Change
20
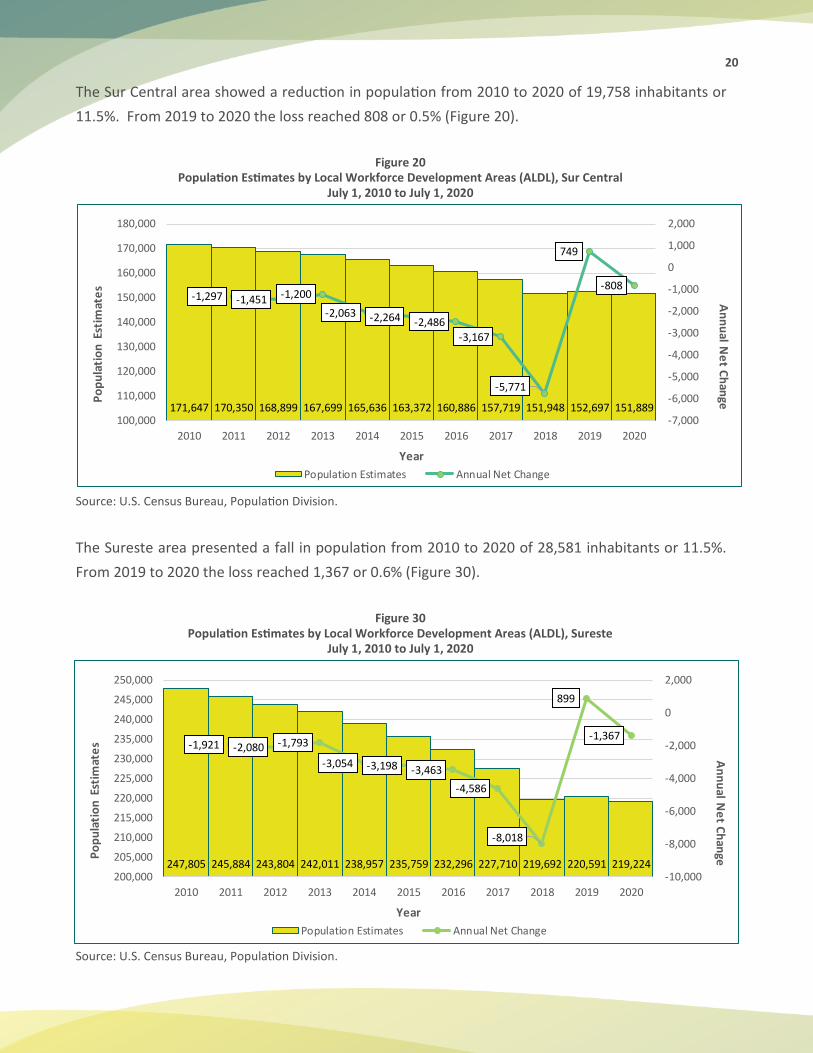
The Sur Central area showed a reduction in population from 2010 to 2020 of 19,758 inhabitants or
11.5%. From 2019 to 2020 the loss reached 808 or 0.5% (Figure 20).
Figure 20 Population Estimates by Local Workforce Development Areas (ALDL), Sur Central
July 1, 2010 to July 1, 2020
Source: U.S. Census Bureau, Population Division.
The Sureste area presented a fall in population from 2010 to 2020 of 28,581 inhabitants or 11.5%.
From 2019 to 2020 the loss reached 1,367 or 0.6% (Figure 30).
Figure 30 Population Estimates by Local Workforce Development Areas (ALDL), Sureste
July 1, 2010 to July 1, 2020
Source: U.S. Census Bureau, Population Division.
171,647 170,350 168,899 167,699 165,636 163,372 160,886 157,719 151,948 152,697 151,889
-1,297 -1,451 -1,200
-2,063 -2,264 -2,486-3,167
-5,771
749
-808
-7,000
-6,000
-5,000
-4,000
-3,000
-2,000
-1,000
0
1,000
2,000
100,000
110,000
120,000
130,000
140,000
150,000
160,000
170,000
180,000
2010 2011 2012 2013 2014 2015 2016 2017 2018 2019 2020
An
nu
al Ne
t Ch
angeP
op
ula
tio
n E
stim
ate
s
Year
Population Estimates Annual Net Change
247,805 245,884 243,804 242,011 238,957 235,759 232,296 227,710 219,692 220,591 219,224
-1,921 -2,080 -1,793
-3,054 -3,198 -3,463
-4,586
-8,018
899
-1,367
-10,000
-8,000
-6,000
-4,000
-2,000
0
2,000
200,000
205,000
210,000
215,000
220,000
225,000
230,000
235,000
240,000
245,000
250,000
2010 2011 2012 2013 2014 2015 2016 2017 2018 2019 2020
An
nu
al Ne
t Ch
angeP
op
ula
tio
n E
stim
ate
s
Year
Population Estimates Annual Net Change
21
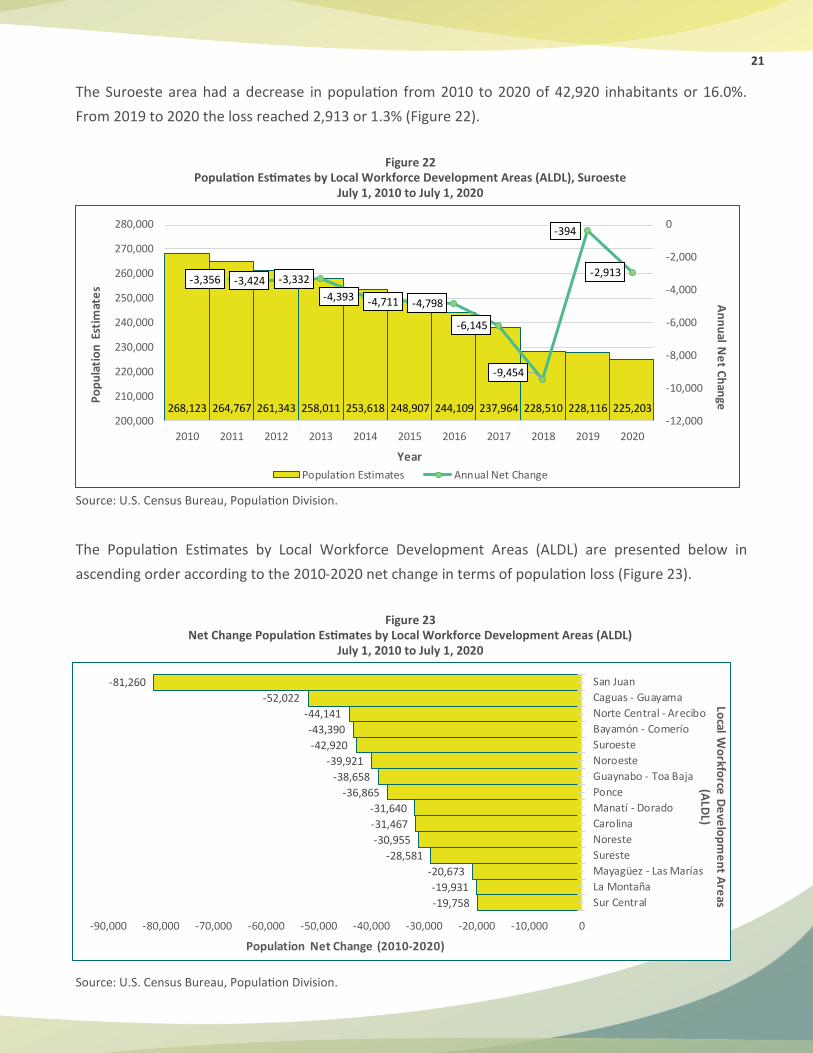
The Suroeste area had a decrease in population from 2010 to 2020 of 42,920 inhabitants or 16.0%.
From 2019 to 2020 the loss reached 2,913 or 1.3% (Figure 22).
Figure 22 Population Estimates by Local Workforce Development Areas (ALDL), Suroeste
July 1, 2010 to July 1, 2020
Source: U.S. Census Bureau, Population Division.
The Population Estimates by Local Workforce Development Areas (ALDL) are presented below in
ascending order according to the 2010-2020 net change in terms of population loss (Figure 23).
Figure 23 Net Change Population Estimates by Local Workforce Development Areas (ALDL)
July 1, 2010 to July 1, 2020
Source: U.S. Census Bureau, Population Division.
268,123 264,767 261,343 258,011 253,618 248,907 244,109 237,964 228,510 228,116 225,203
-3,356 -3,424 -3,332
-4,393 -4,711 -4,798
-6,145
-9,454
-394
-2,913
-12,000
-10,000
-8,000
-6,000
-4,000
-2,000
0
200,000
210,000
220,000
230,000
240,000
250,000
260,000
270,000
280,000
2010 2011 2012 2013 2014 2015 2016 2017 2018 2019 2020
An
nu
al Ne
t Ch
angeP
op
ula
tio
n E
stim
ate
s
Year
Population Estimates Annual Net Change
-19,758
-19,931
-20,673
-28,581
-30,955
-31,467
-31,640
-36,865
-38,658
-39,921
-42,920
-43,390
-44,141
-52,022
-81,260
-90,000 -80,000 -70,000 -60,000 -50,000 -40,000 -30,000 -20,000 -10,000 0
Sur Central
La Montaña
Mayagüez - Las Marías
Sureste
Noreste
Carolina
Manatí - Dorado
Ponce
Guaynabo - Toa Baja
Noroeste
Suroeste
Bayamón - Comerío
Norte Central - Arecibo
Caguas - Guayama
San Juan
Population Net Change (2010-2020)
Local W
orkfo
rce D
eve
lop
me
nt A
reas
(ALD
L)
22
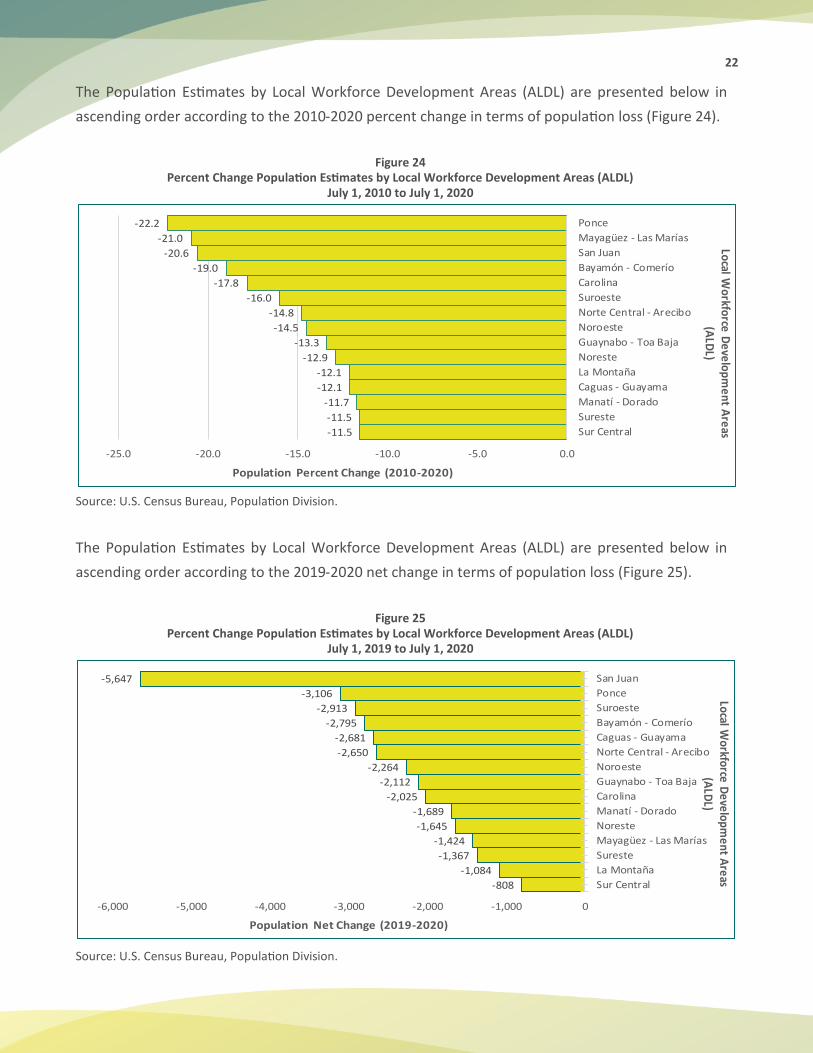
The Population Estimates by Local Workforce Development Areas (ALDL) are presented below in
ascending order according to the 2010-2020 percent change in terms of population loss (Figure 24).
Figure 24 Percent Change Population Estimates by Local Workforce Development Areas (ALDL)
July 1, 2010 to July 1, 2020
Source: U.S. Census Bureau, Population Division.
The Population Estimates by Local Workforce Development Areas (ALDL) are presented below in
ascending order according to the 2019-2020 net change in terms of population loss (Figure 25).
Figure 25 Percent Change Population Estimates by Local Workforce Development Areas (ALDL)
July 1, 2019 to July 1, 2020
Source: U.S. Census Bureau, Population Division.
-11.5
-11.5
-11.7
-12.1
-12.1
-12.9
-13.3
-14.5
-14.8
-16.0
-17.8
-19.0
-20.6
-21.0
-22.2
-25.0 -20.0 -15.0 -10.0 -5.0 0.0
Sur Central
Sureste
Manatí - Dorado
Caguas - Guayama
La Montaña
Noreste
Guaynabo - Toa Baja
Noroeste
Norte Central - Arecibo
Suroeste
Carolina
Bayamón - Comerío
San Juan
Mayagüez - Las Marías
Ponce
Population Percent Change (2010-2020)
Local W
orkfo
rce D
eve
lop
me
nt A
reas
(ALD
L)
-808
-1,084
-1,367
-1,424
-1,645
-1,689
-2,025
-2,112
-2,264
-2,650
-2,681
-2,795
-2,913
-3,106
-5,647
-6,000 -5,000 -4,000 -3,000 -2,000 -1,000 0
Sur Central
La Montaña
Sureste
Mayagüez - Las Marías
Noreste
Manatí - Dorado
Carolina
Guaynabo - Toa Baja
Noroeste
Norte Central - Arecibo
Caguas - Guayama
Bayamón - Comerío
Suroeste
Ponce
San Juan
Population Net Change (2019-2020)
Local Workforce D
evelopment A
reas (A
LDL)
23
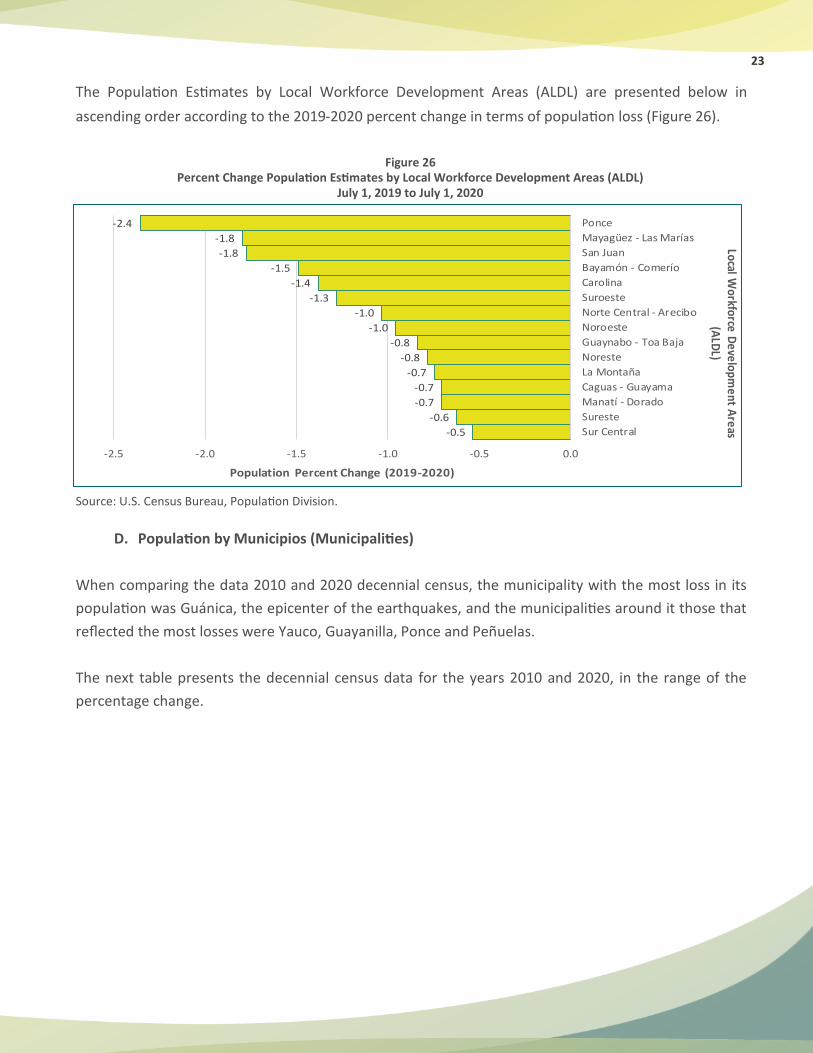
The Population Estimates by Local Workforce Development Areas (ALDL) are presented below in
ascending order according to the 2019-2020 percent change in terms of population loss (Figure 26).
Figure 26 Percent Change Population Estimates by Local Workforce Development Areas (ALDL)
July 1, 2019 to July 1, 2020
Source: U.S. Census Bureau, Population Division.
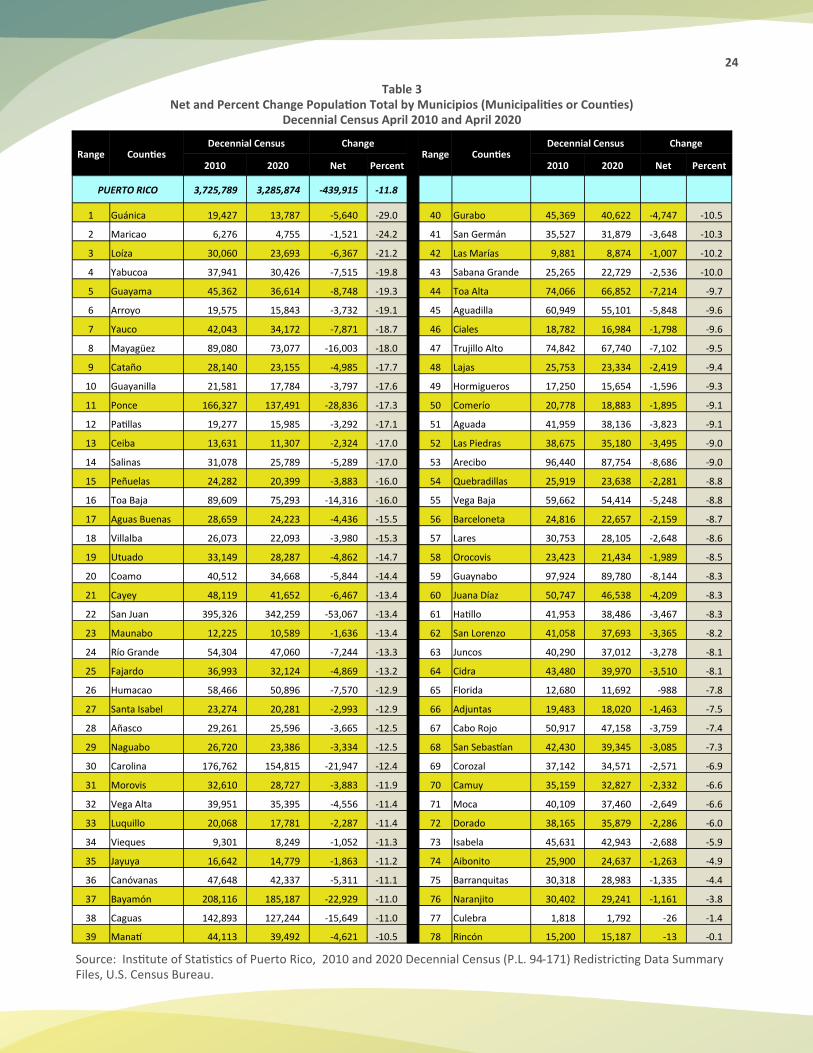
D. Population by Municipios (Municipalities)
When comparing the data 2010 and 2020 decennial census, the municipality with the most loss in its
population was Guánica, the epicenter of the earthquakes, and the municipalities around it those that
reflected the most losses were Yauco, Guayanilla, Ponce and Peñuelas.
The next table presents the decennial census data for the years 2010 and 2020, in the range of the
percentage change.
-0.5
-0.6
-0.7
-0.7
-0.7
-0.8
-0.8
-1.0
-1.0
-1.3
-1.4
-1.5
-1.8
-1.8
-2.4
-2.5 -2.0 -1.5 -1.0 -0.5 0.0
Sur Central
Sureste
Manatí - Dorado
Caguas - Guayama
La Montaña
Noreste
Guaynabo - Toa Baja
Noroeste
Norte Central - Arecibo
Suroeste
Carolina
Bayamón - Comerío
San Juan
Mayagüez - Las Marías
Ponce
Population Percent Change (2019-2020)
Local Workforce D
evelopment A
reas (A
LDL)
24
Table 3 Net and Percent Change Population Total by Municipios (Municipalities or Counties)
Decennial Census April 2010 and April 2020
Source: Institute of Statistics of Puerto Rico, 2010 and 2020 Decennial Census (P.L. 94-171) Redistricting Data Summary Files, U.S. Census Bureau.
Range Counties Decennial Census Change
Range Counties Decennial Census Change
2010 2020 Net Percent 2010 2020 Net Percent
PUERTO RICO 3,725,789 3,285,874 -439,915 -11.8
1 Guánica 19,427 13,787 -5,640 -29.0 40 Gurabo 45,369 40,622 -4,747 -10.5
2 Maricao 6,276 4,755 -1,521 -24.2 41 San Germán 35,527 31,879 -3,648 -10.3
3 Loíza 30,060 23,693 -6,367 -21.2 42 Las Marías 9,881 8,874 -1,007 -10.2
4 Yabucoa 37,941 30,426 -7,515 -19.8 43 Sabana Grande 25,265 22,729 -2,536 -10.0
5 Guayama 45,362 36,614 -8,748 -19.3 44 Toa Alta 74,066 66,852 -7,214 -9.7
6 Arroyo 19,575 15,843 -3,732 -19.1 45 Aguadilla 60,949 55,101 -5,848 -9.6
7 Yauco 42,043 34,172 -7,871 -18.7 46 Ciales 18,782 16,984 -1,798 -9.6
8 Mayagüez 89,080 73,077 -16,003 -18.0 47 Trujillo Alto 74,842 67,740 -7,102 -9.5
9 Cataño 28,140 23,155 -4,985 -17.7 48 Lajas 25,753 23,334 -2,419 -9.4
10 Guayanilla 21,581 17,784 -3,797 -17.6 49 Hormigueros 17,250 15,654 -1,596 -9.3
11 Ponce 166,327 137,491 -28,836 -17.3 50 Comerío 20,778 18,883 -1,895 -9.1
12 Patillas 19,277 15,985 -3,292 -17.1 51 Aguada 41,959 38,136 -3,823 -9.1
13 Ceiba 13,631 11,307 -2,324 -17.0 52 Las Piedras 38,675 35,180 -3,495 -9.0
14 Salinas 31,078 25,789 -5,289 -17.0 53 Arecibo 96,440 87,754 -8,686 -9.0
15 Peñuelas 24,282 20,399 -3,883 -16.0 54 Quebradillas 25,919 23,638 -2,281 -8.8
16 Toa Baja 89,609 75,293 -14,316 -16.0 55 Vega Baja 59,662 54,414 -5,248 -8.8
17 Aguas Buenas 28,659 24,223 -4,436 -15.5 56 Barceloneta 24,816 22,657 -2,159 -8.7
18 Villalba 26,073 22,093 -3,980 -15.3 57 Lares 30,753 28,105 -2,648 -8.6
19 Utuado 33,149 28,287 -4,862 -14.7 58 Orocovis 23,423 21,434 -1,989 -8.5
20 Coamo 40,512 34,668 -5,844 -14.4 59 Guaynabo 97,924 89,780 -8,144 -8.3
21 Cayey 48,119 41,652 -6,467 -13.4 60 Juana Díaz 50,747 46,538 -4,209 -8.3
22 San Juan 395,326 342,259 -53,067 -13.4 61 Hatillo 41,953 38,486 -3,467 -8.3
23 Maunabo 12,225 10,589 -1,636 -13.4 62 San Lorenzo 41,058 37,693 -3,365 -8.2
24 Río Grande 54,304 47,060 -7,244 -13.3 63 Juncos 40,290 37,012 -3,278 -8.1
25 Fajardo 36,993 32,124 -4,869 -13.2 64 Cidra 43,480 39,970 -3,510 -8.1
26 Humacao 58,466 50,896 -7,570 -12.9 65 Florida 12,680 11,692 -988 -7.8
27 Santa Isabel 23,274 20,281 -2,993 -12.9 66 Adjuntas 19,483 18,020 -1,463 -7.5
28 Añasco 29,261 25,596 -3,665 -12.5 67 Cabo Rojo 50,917 47,158 -3,759 -7.4
29 Naguabo 26,720 23,386 -3,334 -12.5 68 San Sebastían 42,430 39,345 -3,085 -7.3
30 Carolina 176,762 154,815 -21,947 -12.4 69 Corozal 37,142 34,571 -2,571 -6.9
31 Morovis 32,610 28,727 -3,883 -11.9 70 Camuy 35,159 32,827 -2,332 -6.6
32 Vega Alta 39,951 35,395 -4,556 -11.4 71 Moca 40,109 37,460 -2,649 -6.6
33 Luquillo 20,068 17,781 -2,287 -11.4 72 Dorado 38,165 35,879 -2,286 -6.0
34 Vieques 9,301 8,249 -1,052 -11.3 73 Isabela 45,631 42,943 -2,688 -5.9
35 Jayuya 16,642 14,779 -1,863 -11.2 74 Aibonito 25,900 24,637 -1,263 -4.9
36 Canóvanas 47,648 42,337 -5,311 -11.1 75 Barranquitas 30,318 28,983 -1,335 -4.4
37 Bayamón 208,116 185,187 -22,929 -11.0 76 Naranjito 30,402 29,241 -1,161 -3.8
38 Caguas 142,893 127,244 -15,649 -11.0 77 Culebra 1,818 1,792 -26 -1.4
39 Manatí 44,113 39,492 -4,621 -10.5 78 Rincón 15,200 15,187 -13 -0.1
25
Fi
gure
27
P
erc
en
t C
han
ge P
op
ula
tio
n T
ota
l B
y M
un
icip
aliti
es
De
cen
nia
l Ce
nsu
s A
pri
l 20
10
an
d A
pri
l 20
20
Pe
rce
nt
Ch
ange
20
10
-20
20
Sou
rce:
In
stitu
te o
f St
atisti
cs o
f P
uer
to R
ico
, 2
01
0 a
nd
20
20
Dec
enn
ial C
ensu
s (P
.L. 9
4-1
71
) R
edis
tric
tin
g D
ata
Sum
mar
y Fi
les,
U
.S. C
ensu
s B
ure
au.
Pe
rce
nt
Ch
ange
20
10
-20
20
26
Figu
re 2
8
Po
pu
lati
on
To
tal
By
Mu
nic
ipal
itie
s D
ece
nn
ial C
en
sus
Ap
ril 2
01
0 a
nd
Ap
ril 2
02
0
Po
pu
lati
on
20
20
342,259
- 100,000
99,000
- 50,000
49,999
- 30,000
29,999
- 20,000
19,999
- 1,792
27
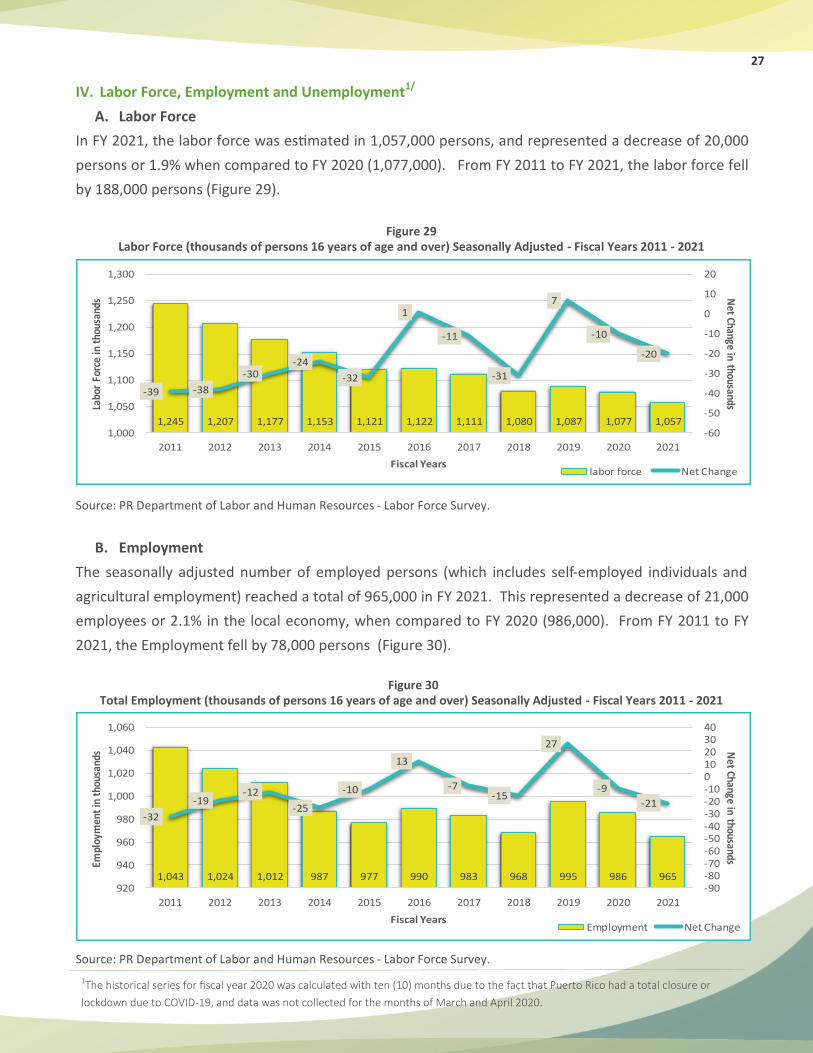
IV. Labor Force, Employment and Unemployment1/
A. Labor Force
In FY 2021, the labor force was estimated in 1,057,000 persons, and represented a decrease of 20,000
persons or 1.9% when compared to FY 2020 (1,077,000). From FY 2011 to FY 2021, the labor force fell
by 188,000 persons (Figure 29).
Figure 29 Labor Force (thousands of persons 16 years of age and over) Seasonally Adjusted - Fiscal Years 2011 - 2021
Source: PR Department of Labor and Human Resources - Labor Force Survey.
B. Employment
The seasonally adjusted number of employed persons (which includes self-employed individuals and
agricultural employment) reached a total of 965,000 in FY 2021. This represented a decrease of 21,000
employees or 2.1% in the local economy, when compared to FY 2020 (986,000). From FY 2011 to FY
2021, the Employment fell by 78,000 persons (Figure 30).
Figure 30
Total Employment (thousands of persons 16 years of age and over) Seasonally Adjusted - Fiscal Years 2011 - 2021
Source: PR Department of Labor and Human Resources - Labor Force Survey.
1The historical series for fiscal year 2020 was calculated with ten (10) months due to the fact that Puerto Rico had a total closure or
lockdown due to COVID-19, and data was not collected for the months of March and April 2020.
1,245 1,207 1,177 1,153 1,121 1,122 1,111 1,080 1,087 1,077 1,057
-39 -38
-30-24
-32
1
-11
-31
7
-10
-20
-60
-50
-40
-30
-20
-10
0
10
20
1,000
1,050
1,100
1,150
1,200
1,250
1,300
2011 2012 2013 2014 2015 2016 2017 2018 2019 2020 2021
Fiscal Years
Net Change in thousandsLa
bor
Forc
e in
tho
usan
ds
labor force Net Change
1,043 1,024 1,012 987 977 990 983 968 995 986 965
-32
-19-12
-25
-10
13
-7-15
27
-9
-21
-90-80-70-60-50-40-30-20-10010203040
920
940
960
980
1,000
1,020
1,040
1,060
2011 2012 2013 2014 2015 2016 2017 2018 2019 2020 2021
Fiscal Years
Net Change in thousands
Empl
oym
ent
in t
hous
ands
Employment Net Change
28
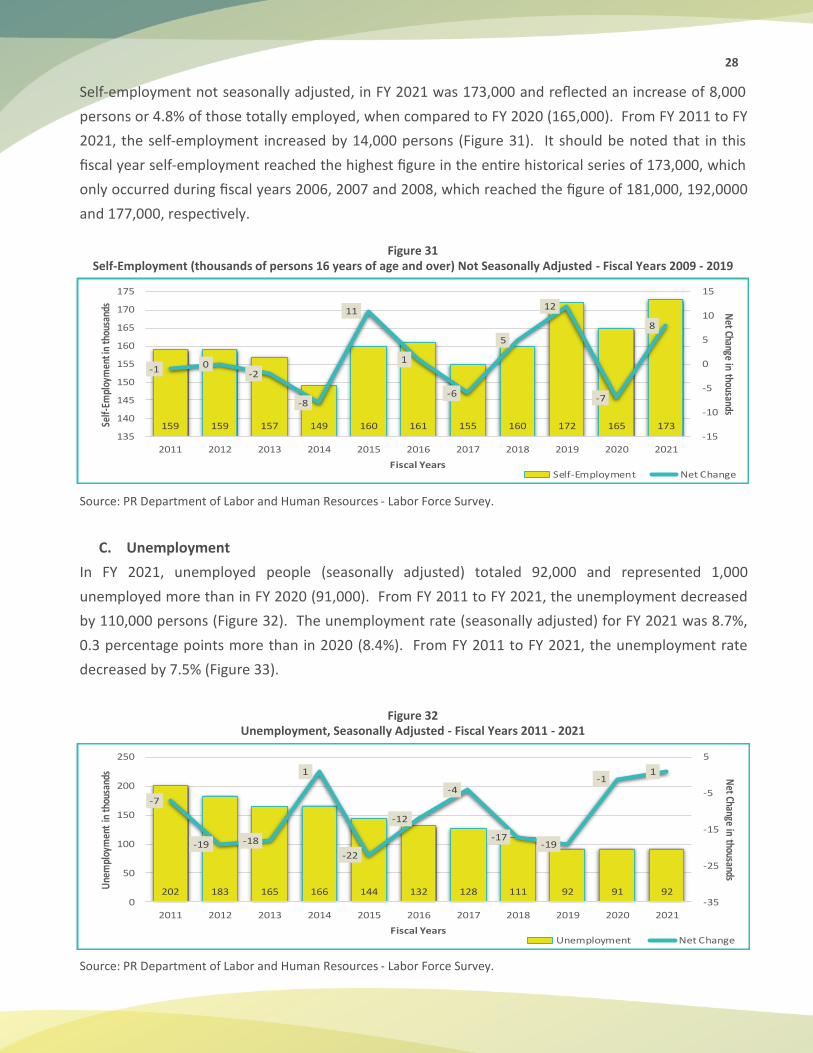
Self-employment not seasonally adjusted, in FY 2021 was 173,000 and reflected an increase of 8,000
persons or 4.8% of those totally employed, when compared to FY 2020 (165,000). From FY 2011 to FY
2021, the self-employment increased by 14,000 persons (Figure 31). It should be noted that in this
fiscal year self-employment reached the highest figure in the entire historical series of 173,000, which
only occurred during fiscal years 2006, 2007 and 2008, which reached the figure of 181,000, 192,0000
and 177,000, respectively.
Figure 31
Self-Employment (thousands of persons 16 years of age and over) Not Seasonally Adjusted - Fiscal Years 2009 - 2019
Source: PR Department of Labor and Human Resources - Labor Force Survey.
C. Unemployment
In FY 2021, unemployed people (seasonally adjusted) totaled 92,000 and represented 1,000
unemployed more than in FY 2020 (91,000). From FY 2011 to FY 2021, the unemployment decreased
by 110,000 persons (Figure 32). The unemployment rate (seasonally adjusted) for FY 2021 was 8.7%,
0.3 percentage points more than in 2020 (8.4%). From FY 2011 to FY 2021, the unemployment rate
decreased by 7.5% (Figure 33).
Figure 32 Unemployment, Seasonally Adjusted - Fiscal Years 2011 - 2021
Source: PR Department of Labor and Human Resources - Labor Force Survey.
159 159 157 149 160 161 155 160 172 165 173
-1 0-2
-8
11
1
-6
5
12
-7
8
-15
-10
-5
0
5
10
15
135
140
145
150
155
160
165
170
175
2011 2012 2013 2014 2015 2016 2017 2018 2019 2020 2021
Fiscal Years
Net Change in thousands
Self-
Empl
oym
ent i
n th
ousa
nds
Self-Employment Net Change
202 183 165 166 144 132 128 111 92 91 92
-7
-19 -18
1
-22
-12
-4
-17-19
-11
-35
-25
-15
-5
5
0
50
100
150
200
250
2011 2012 2013 2014 2015 2016 2017 2018 2019 2020 2021
Fiscal Years
Net Change in thousands
Une
mpl
oym
ent
in th
ousa
nds
Unemployment Net Change
29
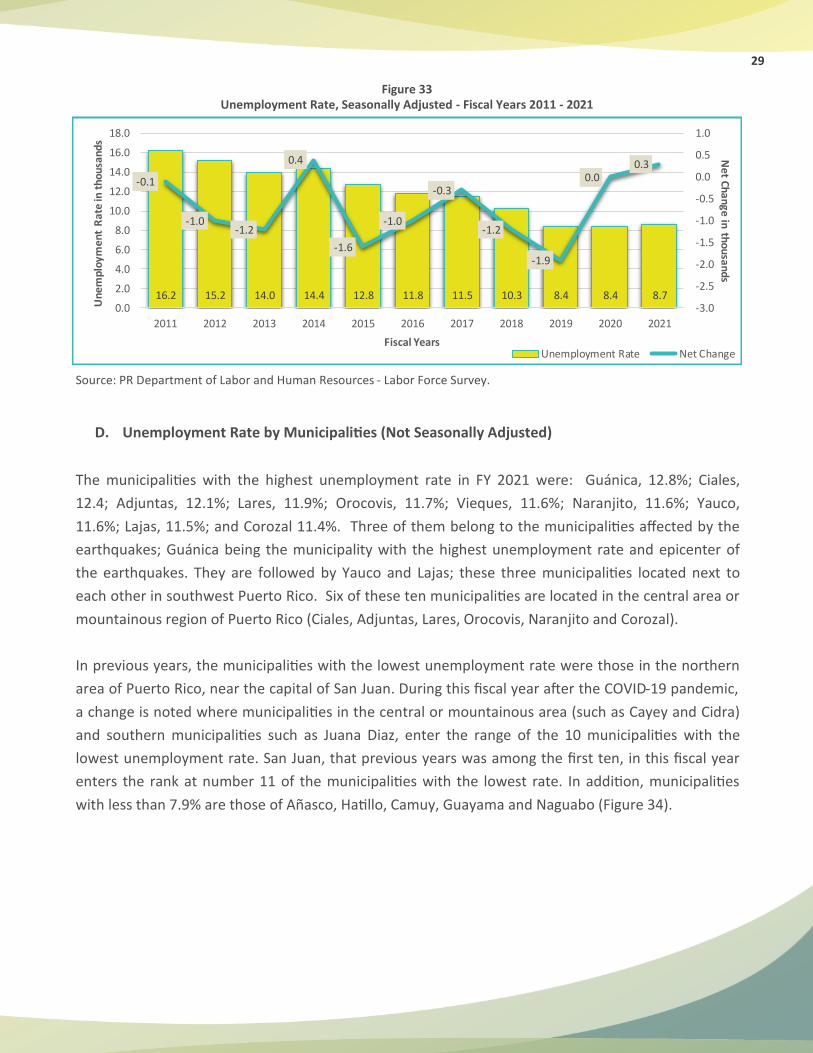
Figure 33 Unemployment Rate, Seasonally Adjusted - Fiscal Years 2011 - 2021
Source: PR Department of Labor and Human Resources - Labor Force Survey.
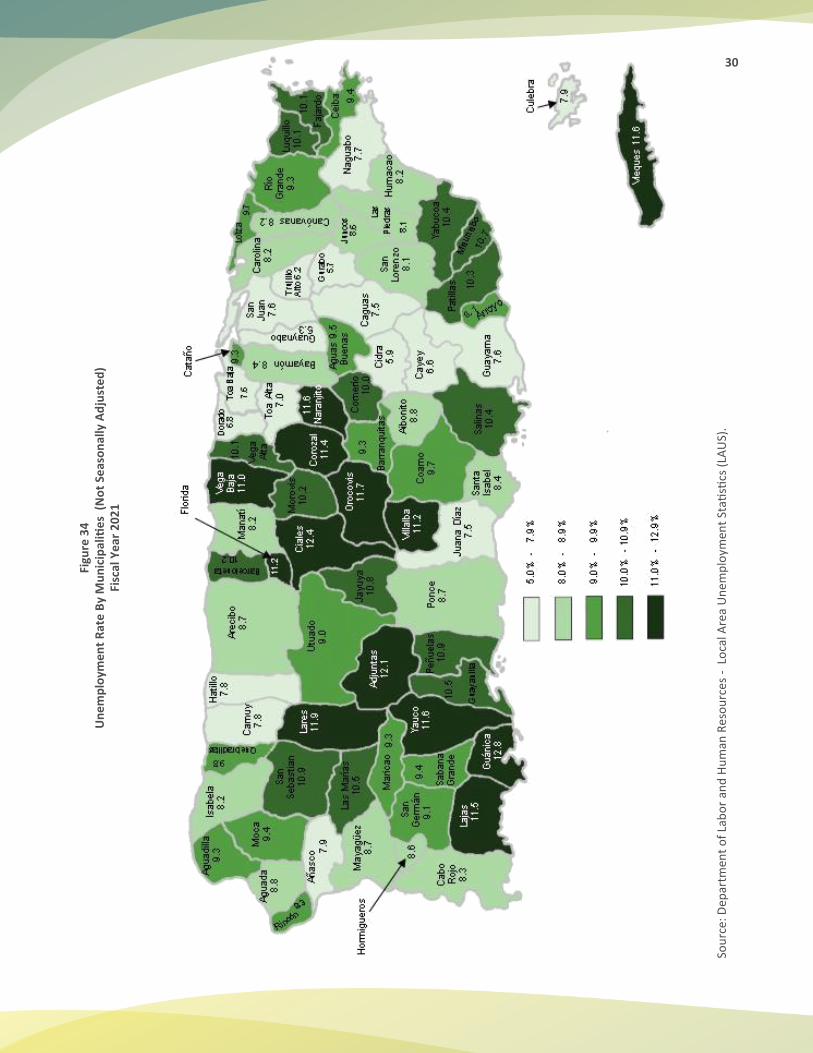
D. Unemployment Rate by Municipalities (Not Seasonally Adjusted)
The municipalities with the highest unemployment rate in FY 2021 were: Guánica, 12.8%; Ciales,
12.4; Adjuntas, 12.1%; Lares, 11.9%; Orocovis, 11.7%; Vieques, 11.6%; Naranjito, 11.6%; Yauco,
11.6%; Lajas, 11.5%; and Corozal 11.4%. Three of them belong to the municipalities affected by the
earthquakes; Guánica being the municipality with the highest unemployment rate and epicenter of
the earthquakes. They are followed by Yauco and Lajas; these three municipalities located next to
each other in southwest Puerto Rico. Six of these ten municipalities are located in the central area or
mountainous region of Puerto Rico (Ciales, Adjuntas, Lares, Orocovis, Naranjito and Corozal).
In previous years, the municipalities with the lowest unemployment rate were those in the northern
area of Puerto Rico, near the capital of San Juan. During this fiscal year after the COVID-19 pandemic,
a change is noted where municipalities in the central or mountainous area (such as Cayey and Cidra)
and southern municipalities such as Juana Diaz, enter the range of the 10 municipalities with the
lowest unemployment rate. San Juan, that previous years was among the first ten, in this fiscal year
enters the rank at number 11 of the municipalities with the lowest rate. In addition, municipalities
with less than 7.9% are those of Añasco, Hatillo, Camuy, Guayama and Naguabo (Figure 34).
16.2 15.2 14.0 14.4 12.8 11.8 11.5 10.3 8.4 8.4 8.7
-0.1
-1.0-1.2
0.4
-1.6
-1.0
-0.3
-1.2
-1.9
0.00.3
-3.0
-2.5
-2.0
-1.5
-1.0
-0.5
0.0
0.5
1.0
0.0
2.0
4.0
6.0
8.0
10.0
12.0
14.0
16.0
18.0
2011 2012 2013 2014 2015 2016 2017 2018 2019 2020 2021
Fiscal Years
Ne
t Ch
an
ge
in th
ou
san
ds
Un
em
plo
ym
en
t R
ate
in t
ho
usa
nd
s
Unemployment Rate Net Change
30
Fi
gure
34
U
ne
mp
loym
en
t R
ate
By
Mu
nic
ipal
itie
s (
No
t Se
aso
nal
ly A
dju
ste
d)
Fisc
al Y
ear
20
21
Sou
rce:
Dep
artm
ent
of
Lab
or
and
Hu
man
Res
ou
rce
s -
Lo
cal A
rea
Un
em
plo
ymen
t St
atisti
cs (
LAU
S).
31
E. Labor Force by Local Workforce Development Areas (ALDL)
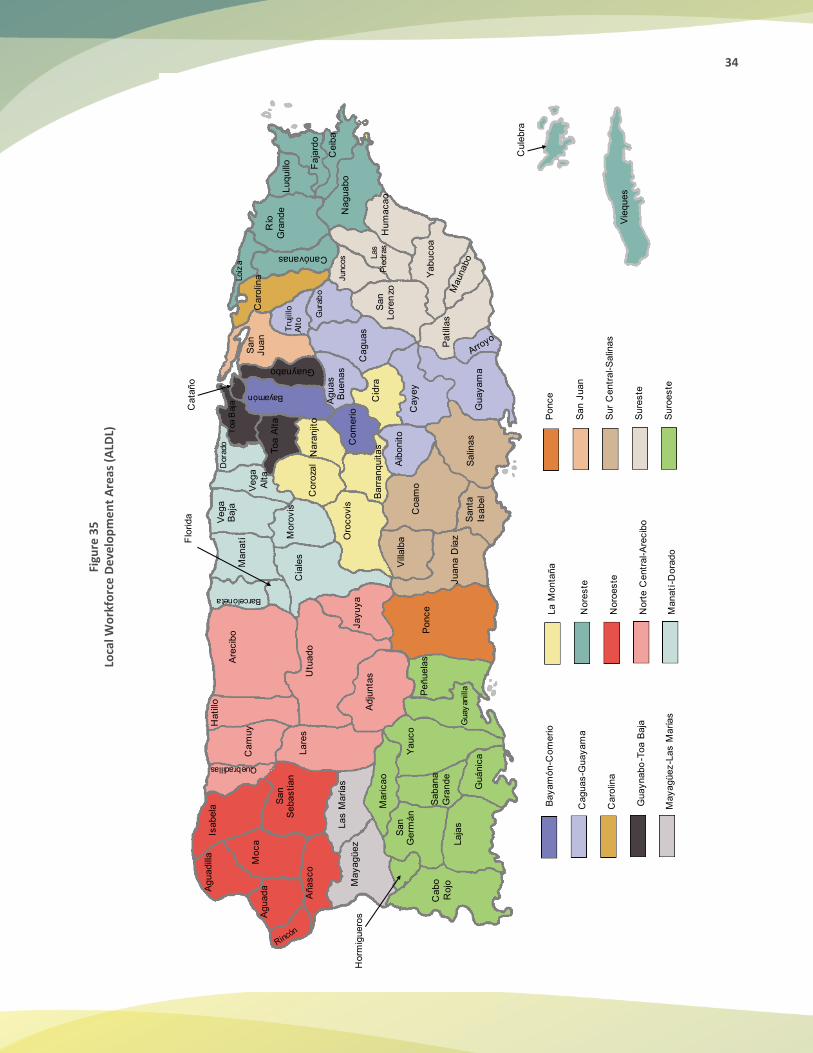
This section presents a labor force profile of each of the designated Local Workforce Development Areas (ALDL, for its acronym in Spanish) under the WIOA Program. The Program divides Puerto Rico into 15 local areas, with a total of 78 municipalities (Figure 35) (Table 4).
1. Bayamón-Comerío This area comprises only these two municipalities. In FY 2021 the labor force in this area registered a decrease of 239 persons. The Bayamón municipality showed a fall of 137 and Comerío a reduction of 101. In terms of employment, the area decreased 1,119 employees between FY 2020 and FY 2021. From those, 1,009 were from Bayamón and 110 from Comerío. The number of unemployed persons showed a increase of 881 persons. The unemployment rate in the area presented a rise of 1.3 percentage points in the comparative period.
2. Caguas-Guayama The eight municipalities that comprise this area are: Aguas Buenas, Aibonito, Arroyo, Caguas, Cayey, Guayama, Gurabo and Trujillo Alto. For FY 2021 the labor force in this area was estimated in 133,563 and represented a decrease of 2,324 persons. The employment for the area presented a decrease of 1,831 persons. The number of unemployed persons totaled 9,526, and the unemployment rate fell from 7.4% to 7.1% from FY 2020 to 2021.
3. Carolina Carolina is one of the few municipalities operating by itself as an ALDL under the WIOA Program. The labor force decreased from 60,402 to 60,309 representing a reduction of 93 persons between FY 2020 and FY 2021. Employment fell from 56,398 to 55,342 resulting in a reduction of 1,056 employed persons. Unemployment for the area diminished from 4,004 to 4,967 persons and the unemployment rate increased by 1.6 percentage points, from 6.6% in FY 2020 to 8.2% in FY 2021.
4. Guaynabo Toa - Baja The area is composed of four municipalities: Cataño, Guaynabo, Toa Alta and Toa Baja. The labor force reflected a reduction, from FY 2020 (100,373) to 99,571 in FY 2021, a decrease of 802 persons. Toa Alta showed the most important fell with a decrease of 301 persons. Likewise, the number of employed people for the area also showed a decrease for the same period, of 1,623 persons. Conversely, the number of unemployed persons and the unemployment rate presented increases. The first one rose by 821, and the unemployment rate increased by 0.9 percentage points. 5. La Montaña This area is composed such the municipalities as Barranquitas, Cidra, Corozal, Orocovis and Naranjito. It is characterized mainly for its diminished agricultural activity, and located in the central mountainous sector of Puerto Rico. Its labor force for FY 2020 was 43,261 and 42,232 for FY 2021 representing a loss of 1,029 persons. Cidra presented the most important fall with a loss of 386 persons. Employment in the area decreased by 1,110. The number of unemployed people increased from 3,807 to 3,888 between both years. The unemployment rate registered an increase of 0.4 percentage points between both years.
32
6. Manatí - Dorado This area is composed of eight municipalities: Barceloneta, Ciales, Dorado, Florida, Manatí, Morovis, Vega Alta and Vega Baja. This area presented a reduction in the labor force of 1,163 persons. Manatí showed the most important fall with a loss of 279 persons. Employment in this area totaled 61,626 in FY 2020 and 60,319 for FY 2021. The number of unemployed people reflected an increase of 144. In terms of the unemployment rate, it registered an increase of 0.4 percentage points. 7. Mayaguez-Las Marías This area is composed of only these two municipalities. Its labor force reflected a decrease of 273 persons. Mayaguez presented the most notable decrease with a loss of 391 persons. The employment sector showed an increase of 132 persons from FY 2020 to FY 2021. Unemployed persons and the unemployment rate registered a reduction of 405 persons, 1.6 percentage points, respectively.
8. Noreste This area is composed of nine municipalities: Canóvanas, Ceiba, Culebra, Fajardo, Loíza, Luquillo, Naguabo, Rio Grande, and Vieques. The labor force fell from 72,730 in FY 2020 to 71,840 in FY 2021 which meant 889 less persons in the labor force. A decrease of 1,423 persons was registered in employment, from 66,659 in FY 2020 to 65,236 in FY 2021. The unemployed persons increase for the period in FY 2020, when there were 6,070 unemployed and 6,605 in FY 2021. This represented an increase of 0.8 percentage points in the unemployment rate for that period.
9. Noroeste This area is composed of seven municipalities: Aguada, Aguadilla, Añasco, Isabela, Moca, Rincón and San Sebastián. The labor force for the area was estimated at 71,949 for FY 2020 and in 70,242 in FY 2021. This meant a decrease of 1,707 persons. The employment for the area showed a fall of 623 employees. Unemployment diminiched by 1,085. The unemployment rate of the area fell from 10.4% in FY 2020 to 9.1% in FY 2021. 10. Norte Central - Arecibo Eight municipalities comprise this area. These are: Adjuntas, Arecibo, Camuy, Hatillo, Jayuya, Lares Quebradillas and Utuado. Its labor force recorded a decrease of 1,690 persons from FY 2020 (74,284) to FY 2021 (72,594). Hatillo, had the most important reduction of 593 persons. The number of employed persons decreased from 66,025 in FY 2020 to 65,953 in FY 2021. The number of unemployed persons decreased in the FY 2020-2021 period, from 8,259 to 6,642, respectively, for a total reduction of 1,618 persons. The unemployment rate of the area diminished from 11.1% in 2020 to 9.1% in 2021.
11. Ponce Ponce is another standalone ALDL with a labor force of 44,247 in FY 2021, representing a reduction of 766 persons from FY 2020. Employment for the municipality fell by 322 persons. Unemployment registered 4,229 persons in FY 2020 and 3,785 in FY 2021, representing 444 less people unemployed. The unemployment rate for the area decreased from 9.6% to 8.7%, a reduction of 0.9 percent point.
33
12. San Juan Like Carolina and Ponce, San Juan is the other standalone ALDL of the 15 workforce areas in Puerto Rico. In FY 2021 the labor force was estimated at 131,426 while in FY 2020 the number was 131,632, representing growth of 207 from one year to the other. Employment was estimated at 121,653 for FY 2021, representing an increase of 1,559 employees. Total unemployment in the capital city had an increase of 1,765 persons in FY 2021. The unemployment rate increased by 1.3 percentage points. 13. Sur Central This area is composed of five municipalities: Coamo, Juana Díaz, Salinas, Santa Isabel and Villalba. The labor force for the area was estimated at 47,514 for FY 2020, while for FY 2021 at 46,182. It represented a decrease of 1,333 persons. Santa Isabel showed the most important decrease with 401 persons. The number of employed people in the area was 41,989 in FY 2021. This represented a decrease of 5 employees. Unemployment showed a reduction of 1,327 unemployed persons. The unemployment rate of the area fell from 11.6% in FY 2020 to 9.1% in FY 2021, a difference of 2.5 percentage points. 14. Sureste Seven municipalities comprise this area. These are: Humacao, Juncos, Las Piedras, Maunabo, Patillas, San Lorenzo and Yabucoa. Its labor force showed a reduction of 1,947 persons from FY 2020 (67,423) to 2021 (65,476). Humacao showed the most important fall with a loss of 379 persons. The number of employed persons registered a decrease of 934 persons. The number of unemployed persons decreased by 1,013. The unemployment rate for the area diminished from 10.0% to 8.7% or 1.2 percentage points.
15. Suroeste This is the ALDL encompassing the largest number of municipalities with 10 of them. They are: Cabo Rojo, Guánica, Guayanilla, Hormigueros, Lajas, Maricao, Peñuelas, Sabana Grande, San Germán and Yauco. The labor force for FY 2020 was estimated at 65,490 and 64,306 in FY 2021 for a decrease of 1,183 persons. Yauco showed the most important fall with a loss of 473 persons. The number of employed people in the area presented a rise of 187 persons. The number of unemployment persons showed a reduction of by 1,370, and the unemployment rate fell by 1.9 percentage points.
34
Fi
gure
35
Lo
cal W
ork
forc
e D
eve
lop
me
nt
Are
as (
ALD
L)
-
-
-
-
-
-
-
35
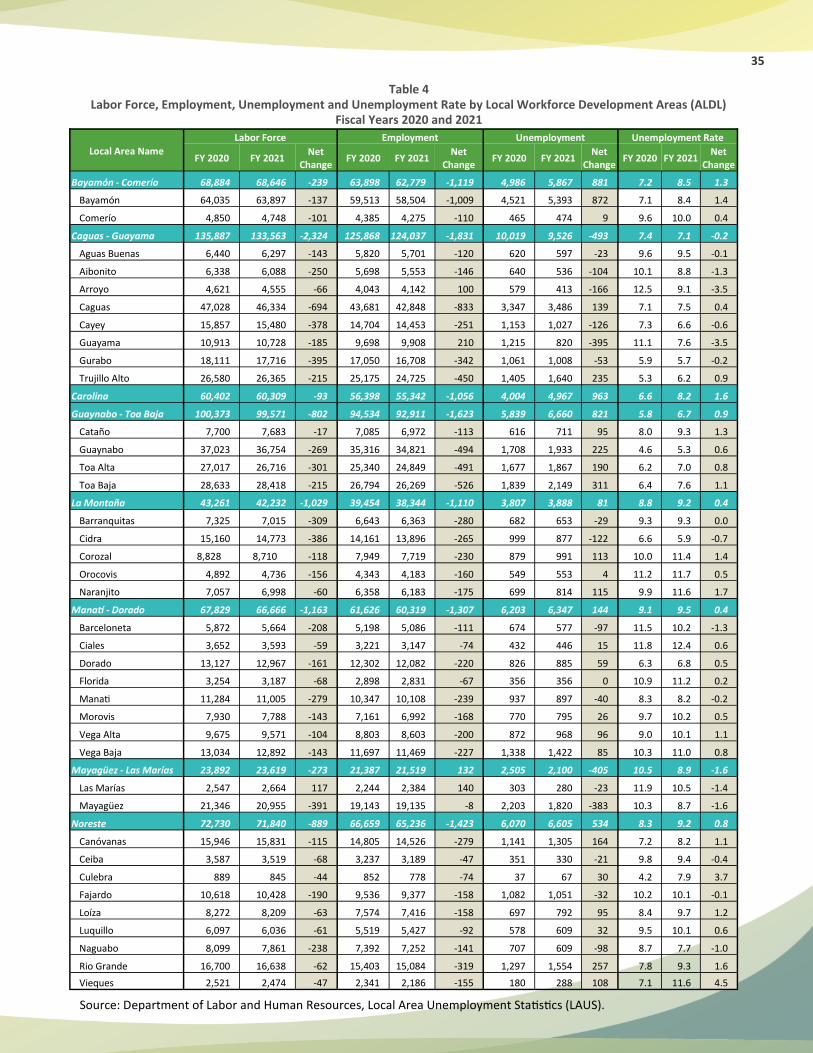
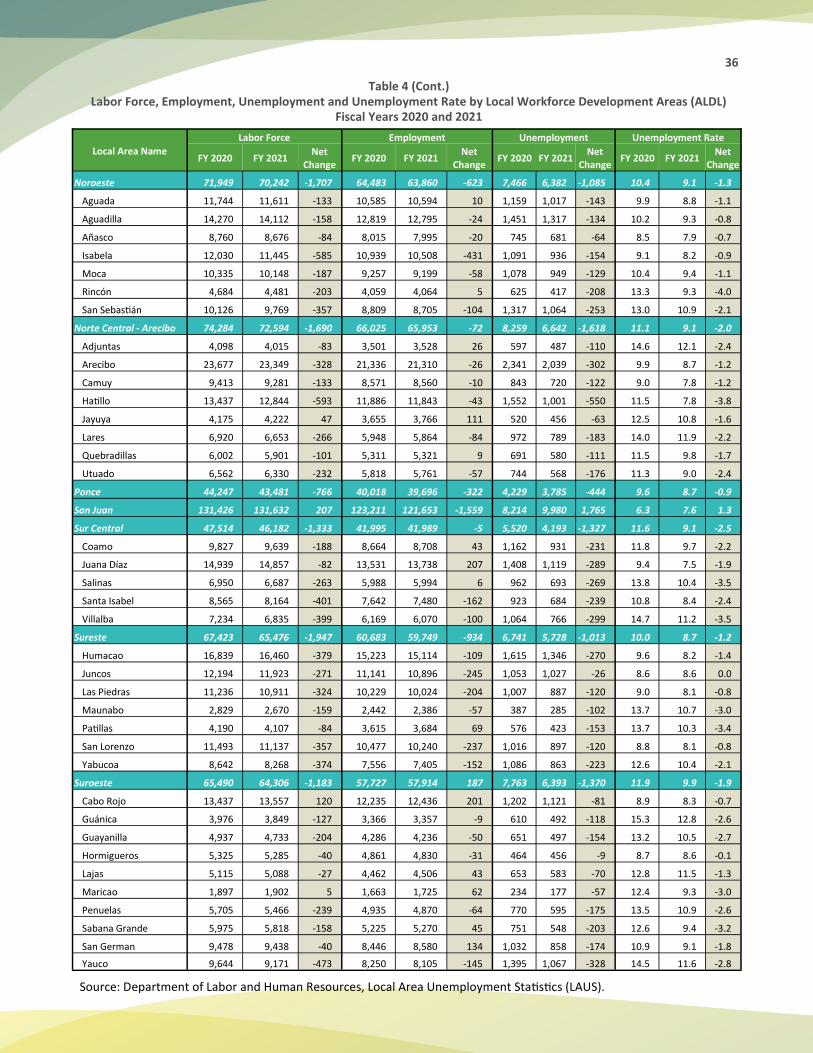
Table 4 Labor Force, Employment, Unemployment and Unemployment Rate by Local Workforce Development Areas (ALDL)
Fiscal Years 2020 and 2021
Source: Department of Labor and Human Resources, Local Area Unemployment Statistics (LAUS).
Local Area Name
Labor Force Employment Unemployment Unemployment Rate
FY 2020 FY 2021 Net
Change FY 2020 FY 2021
Net Change
FY 2020 FY 2021 Net
Change FY 2020 FY 2021
Net Change
Bayamón - Comerío 68,884 68,646 -239 63,898 62,779 -1,119 4,986 5,867 881 7.2 8.5 1.3
Bayamón 64,035 63,897 -137 59,513 58,504 -1,009 4,521 5,393 872 7.1 8.4 1.4
Comerío 4,850 4,748 -101 4,385 4,275 -110 465 474 9 9.6 10.0 0.4
Caguas - Guayama 135,887 133,563 -2,324 125,868 124,037 -1,831 10,019 9,526 -493 7.4 7.1 -0.2
Aguas Buenas 6,440 6,297 -143 5,820 5,701 -120 620 597 -23 9.6 9.5 -0.1
Aibonito 6,338 6,088 -250 5,698 5,553 -146 640 536 -104 10.1 8.8 -1.3
Arroyo 4,621 4,555 -66 4,043 4,142 100 579 413 -166 12.5 9.1 -3.5
Caguas 47,028 46,334 -694 43,681 42,848 -833 3,347 3,486 139 7.1 7.5 0.4
Cayey 15,857 15,480 -378 14,704 14,453 -251 1,153 1,027 -126 7.3 6.6 -0.6
Guayama 10,913 10,728 -185 9,698 9,908 210 1,215 820 -395 11.1 7.6 -3.5
Gurabo 18,111 17,716 -395 17,050 16,708 -342 1,061 1,008 -53 5.9 5.7 -0.2
Trujillo Alto 26,580 26,365 -215 25,175 24,725 -450 1,405 1,640 235 5.3 6.2 0.9
Carolina 60,402 60,309 -93 56,398 55,342 -1,056 4,004 4,967 963 6.6 8.2 1.6
Guaynabo - Toa Baja 100,373 99,571 -802 94,534 92,911 -1,623 5,839 6,660 821 5.8 6.7 0.9
Cataño 7,700 7,683 -17 7,085 6,972 -113 616 711 95 8.0 9.3 1.3
Guaynabo 37,023 36,754 -269 35,316 34,821 -494 1,708 1,933 225 4.6 5.3 0.6
Toa Alta 27,017 26,716 -301 25,340 24,849 -491 1,677 1,867 190 6.2 7.0 0.8
Toa Baja 28,633 28,418 -215 26,794 26,269 -526 1,839 2,149 311 6.4 7.6 1.1
La Montaña 43,261 42,232 -1,029 39,454 38,344 -1,110 3,807 3,888 81 8.8 9.2 0.4
Barranquitas 7,325 7,015 -309 6,643 6,363 -280 682 653 -29 9.3 9.3 0.0
Cidra 15,160 14,773 -386 14,161 13,896 -265 999 877 -122 6.6 5.9 -0.7
Corozal 8,828 8,710 -118 7,949 7,719 -230 879 991 113 10.0 11.4 1.4
Orocovis 4,892 4,736 -156 4,343 4,183 -160 549 553 4 11.2 11.7 0.5
Naranjito 7,057 6,998 -60 6,358 6,183 -175 699 814 115 9.9 11.6 1.7
Manatí - Dorado 67,829 66,666 -1,163 61,626 60,319 -1,307 6,203 6,347 144 9.1 9.5 0.4
Barceloneta 5,872 5,664 -208 5,198 5,086 -111 674 577 -97 11.5 10.2 -1.3
Ciales 3,652 3,593 -59 3,221 3,147 -74 432 446 15 11.8 12.4 0.6
Dorado 13,127 12,967 -161 12,302 12,082 -220 826 885 59 6.3 6.8 0.5
Florida 3,254 3,187 -68 2,898 2,831 -67 356 356 0 10.9 11.2 0.2
Manati 11,284 11,005 -279 10,347 10,108 -239 937 897 -40 8.3 8.2 -0.2
Morovis 7,930 7,788 -143 7,161 6,992 -168 770 795 26 9.7 10.2 0.5
Vega Alta 9,675 9,571 -104 8,803 8,603 -200 872 968 96 9.0 10.1 1.1
Vega Baja 13,034 12,892 -143 11,697 11,469 -227 1,338 1,422 85 10.3 11.0 0.8
Mayagüez - Las Marías 23,892 23,619 -273 21,387 21,519 132 2,505 2,100 -405 10.5 8.9 -1.6
Las Marías 2,547 2,664 117 2,244 2,384 140 303 280 -23 11.9 10.5 -1.4
Mayagüez 21,346 20,955 -391 19,143 19,135 -8 2,203 1,820 -383 10.3 8.7 -1.6
Noreste 72,730 71,840 -889 66,659 65,236 -1,423 6,070 6,605 534 8.3 9.2 0.8
Canóvanas 15,946 15,831 -115 14,805 14,526 -279 1,141 1,305 164 7.2 8.2 1.1
Ceiba 3,587 3,519 -68 3,237 3,189 -47 351 330 -21 9.8 9.4 -0.4
Culebra 889 845 -44 852 778 -74 37 67 30 4.2 7.9 3.7
Fajardo 10,618 10,428 -190 9,536 9,377 -158 1,082 1,051 -32 10.2 10.1 -0.1
Loíza 8,272 8,209 -63 7,574 7,416 -158 697 792 95 8.4 9.7 1.2
Luquillo 6,097 6,036 -61 5,519 5,427 -92 578 609 32 9.5 10.1 0.6
Naguabo 8,099 7,861 -238 7,392 7,252 -141 707 609 -98 8.7 7.7 -1.0
Rio Grande 16,700 16,638 -62 15,403 15,084 -319 1,297 1,554 257 7.8 9.3 1.6
Vieques 2,521 2,474 -47 2,341 2,186 -155 180 288 108 7.1 11.6 4.5
36
Table 4 (Cont.) Labor Force, Employment, Unemployment and Unemployment Rate by Local Workforce Development Areas (ALDL)
Fiscal Years 2020 and 2021
Source: Department of Labor and Human Resources, Local Area Unemployment Statistics (LAUS).
Local Area Name
Labor Force Employment Unemployment Unemployment Rate
FY 2020 FY 2021 Net
Change FY 2020 FY 2021
Net Change
FY 2020 FY 2021 Net
Change FY 2020 FY 2021
Net Change
Noroeste 71,949 70,242 -1,707 64,483 63,860 -623 7,466 6,382 -1,085 10.4 9.1 -1.3
Aguada 11,744 11,611 -133 10,585 10,594 10 1,159 1,017 -143 9.9 8.8 -1.1
Aguadilla 14,270 14,112 -158 12,819 12,795 -24 1,451 1,317 -134 10.2 9.3 -0.8
Añasco 8,760 8,676 -84 8,015 7,995 -20 745 681 -64 8.5 7.9 -0.7
Isabela 12,030 11,445 -585 10,939 10,508 -431 1,091 936 -154 9.1 8.2 -0.9
Moca 10,335 10,148 -187 9,257 9,199 -58 1,078 949 -129 10.4 9.4 -1.1
Rincón 4,684 4,481 -203 4,059 4,064 5 625 417 -208 13.3 9.3 -4.0
San Sebastián 10,126 9,769 -357 8,809 8,705 -104 1,317 1,064 -253 13.0 10.9 -2.1
Norte Central - Arecibo 74,284 72,594 -1,690 66,025 65,953 -72 8,259 6,642 -1,618 11.1 9.1 -2.0
Adjuntas 4,098 4,015 -83 3,501 3,528 26 597 487 -110 14.6 12.1 -2.4
Arecibo 23,677 23,349 -328 21,336 21,310 -26 2,341 2,039 -302 9.9 8.7 -1.2
Camuy 9,413 9,281 -133 8,571 8,560 -10 843 720 -122 9.0 7.8 -1.2
Hatillo 13,437 12,844 -593 11,886 11,843 -43 1,552 1,001 -550 11.5 7.8 -3.8
Jayuya 4,175 4,222 47 3,655 3,766 111 520 456 -63 12.5 10.8 -1.6
Lares 6,920 6,653 -266 5,948 5,864 -84 972 789 -183 14.0 11.9 -2.2
Quebradillas 6,002 5,901 -101 5,311 5,321 9 691 580 -111 11.5 9.8 -1.7
Utuado 6,562 6,330 -232 5,818 5,761 -57 744 568 -176 11.3 9.0 -2.4
Ponce 44,247 43,481 -766 40,018 39,696 -322 4,229 3,785 -444 9.6 8.7 -0.9
San Juan 131,426 131,632 207 123,211 121,653 -1,559 8,214 9,980 1,765 6.3 7.6 1.3
Sur Central 47,514 46,182 -1,333 41,995 41,989 -5 5,520 4,193 -1,327 11.6 9.1 -2.5
Coamo 9,827 9,639 -188 8,664 8,708 43 1,162 931 -231 11.8 9.7 -2.2
Juana Díaz 14,939 14,857 -82 13,531 13,738 207 1,408 1,119 -289 9.4 7.5 -1.9
Salinas 6,950 6,687 -263 5,988 5,994 6 962 693 -269 13.8 10.4 -3.5
Santa Isabel 8,565 8,164 -401 7,642 7,480 -162 923 684 -239 10.8 8.4 -2.4
Villalba 7,234 6,835 -399 6,169 6,070 -100 1,064 766 -299 14.7 11.2 -3.5
Sureste 67,423 65,476 -1,947 60,683 59,749 -934 6,741 5,728 -1,013 10.0 8.7 -1.2
Humacao 16,839 16,460 -379 15,223 15,114 -109 1,615 1,346 -270 9.6 8.2 -1.4
Juncos 12,194 11,923 -271 11,141 10,896 -245 1,053 1,027 -26 8.6 8.6 0.0
Las Piedras 11,236 10,911 -324 10,229 10,024 -204 1,007 887 -120 9.0 8.1 -0.8
Maunabo 2,829 2,670 -159 2,442 2,386 -57 387 285 -102 13.7 10.7 -3.0
Patillas 4,190 4,107 -84 3,615 3,684 69 576 423 -153 13.7 10.3 -3.4
San Lorenzo 11,493 11,137 -357 10,477 10,240 -237 1,016 897 -120 8.8 8.1 -0.8
Yabucoa 8,642 8,268 -374 7,556 7,405 -152 1,086 863 -223 12.6 10.4 -2.1
Suroeste 65,490 64,306 -1,183 57,727 57,914 187 7,763 6,393 -1,370 11.9 9.9 -1.9
Cabo Rojo 13,437 13,557 120 12,235 12,436 201 1,202 1,121 -81 8.9 8.3 -0.7
Guánica 3,976 3,849 -127 3,366 3,357 -9 610 492 -118 15.3 12.8 -2.6
Guayanilla 4,937 4,733 -204 4,286 4,236 -50 651 497 -154 13.2 10.5 -2.7
Hormigueros 5,325 5,285 -40 4,861 4,830 -31 464 456 -9 8.7 8.6 -0.1
Lajas 5,115 5,088 -27 4,462 4,506 43 653 583 -70 12.8 11.5 -1.3
Maricao 1,897 1,902 5 1,663 1,725 62 234 177 -57 12.4 9.3 -3.0
Penuelas 5,705 5,466 -239 4,935 4,870 -64 770 595 -175 13.5 10.9 -2.6
Sabana Grande 5,975 5,818 -158 5,225 5,270 45 751 548 -203 12.6 9.4 -3.2
San German 9,478 9,438 -40 8,446 8,580 134 1,032 858 -174 10.9 9.1 -1.8
Yauco 9,644 9,171 -473 8,250 8,105 -145 1,395 1,067 -328 14.5 11.6 -2.8
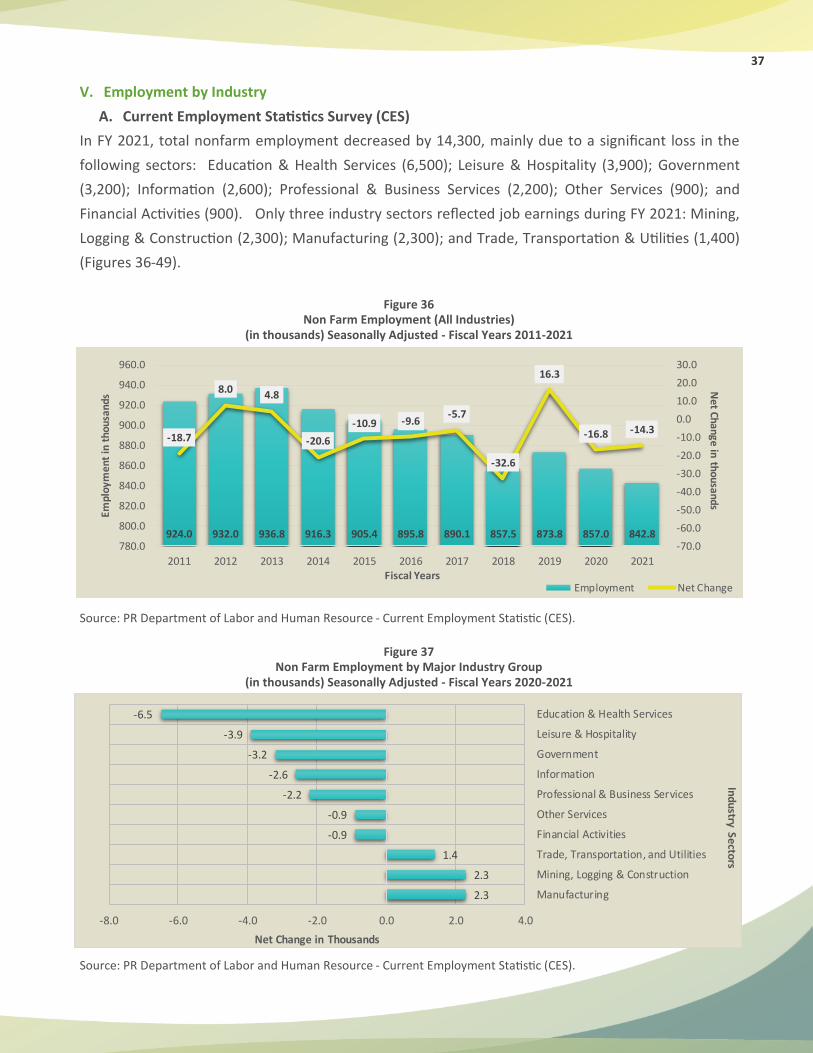
37
V. Employment by Industry
A. Current Employment Statistics Survey (CES)
In FY 2021, total nonfarm employment decreased by 14,300, mainly due to a significant loss in the
following sectors: Education & Health Services (6,500); Leisure & Hospitality (3,900); Government
(3,200); Information (2,600); Professional & Business Services (2,200); Other Services (900); and
Financial Activities (900). Only three industry sectors reflected job earnings during FY 2021: Mining,
Logging & Construction (2,300); Manufacturing (2,300); and Trade, Transportation & Utilities (1,400)
(Figures 36-49).
Figure 36 Non Farm Employment (All Industries)
(in thousands) Seasonally Adjusted - Fiscal Years 2011-2021
Source: PR Department of Labor and Human Resource - Current Employment Statistic (CES).
Figure 37
Non Farm Employment by Major Industry Group (in thousands) Seasonally Adjusted - Fiscal Years 2020-2021
Source: PR Department of Labor and Human Resource - Current Employment Statistic (CES).
924.0 932.0 936.8 916.3 905.4 895.8 890.1 857.5 873.8 857.0 842.8
-18.7
8.0 4.8
-20.6
-10.9 -9.6-5.7
-32.6
16.3
-16.8 -14.3
-70.0
-60.0
-50.0
-40.0
-30.0
-20.0
-10.0
0.0
10.0
20.0
30.0
780.0
800.0
820.0
840.0
860.0
880.0
900.0
920.0
940.0
960.0
2011 2012 2013 2014 2015 2016 2017 2018 2019 2020 2021Fiscal Years
Net Change in thousands
Empl
oym
ent
in t
hous
ands
Employment Net Change
2.3
2.3
1.4
-0.9
-0.9
-2.2
-2.6
-3.2
-3.9
-6.5
-8.0 -6.0 -4.0 -2.0 0.0 2.0 4.0
Manufacturing
Mining, Logging & Construction
Trade, Transportation, and Utilities
Financial Activities
Other Services
Professional & Business Services
Information
Government
Leisure & Hospitality
Education & Health Services
Net Change in Thousands
Ind
ustry
Se
ctors
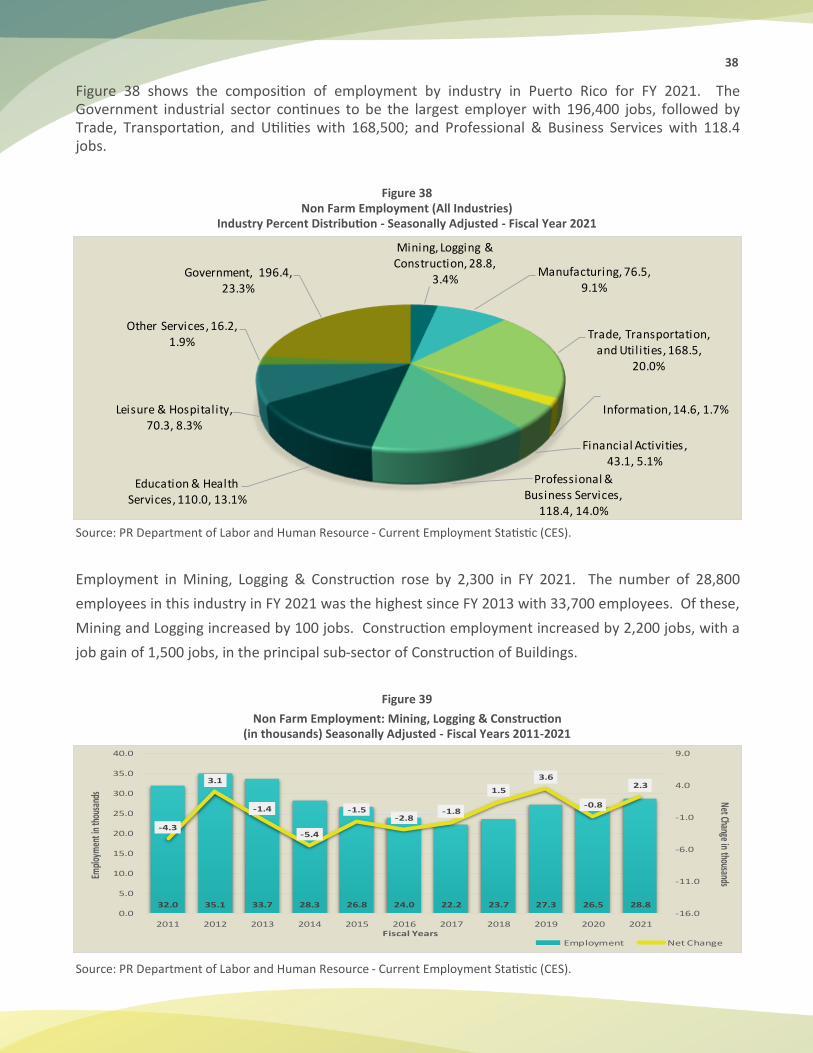
38
Figure 38 shows the composition of employment by industry in Puerto Rico for FY 2021. The Government industrial sector continues to be the largest employer with 196,400 jobs, followed by Trade, Transportation, and Utilities with 168,500; and Professional & Business Services with 118.4 jobs.
Figure 38
Non Farm Employment (All Industries) Industry Percent Distribution - Seasonally Adjusted - Fiscal Year 2021
Source: PR Department of Labor and Human Resource - Current Employment Statistic (CES).
Employment in Mining, Logging & Construction rose by 2,300 in FY 2021. The number of 28,800
employees in this industry in FY 2021 was the highest since FY 2013 with 33,700 employees. Of these,
Mining and Logging increased by 100 jobs. Construction employment increased by 2,200 jobs, with a
job gain of 1,500 jobs, in the principal sub-sector of Construction of Buildings.
Figure 39
Non Farm Employment: Mining, Logging & Construction (in thousands) Seasonally Adjusted - Fiscal Years 2011-2021
Source: PR Department of Labor and Human Resource - Current Employment Statistic (CES).
32.0 35.1 33.7 28.3 26.8 24.0 22.2 23.7 27.3 26.5 28.8
-4.3
3.1
-1.4
-5.4
-1.5-2.8
-1.8
1.5
3.6
-0.8
2.3
-16.0
-11.0
-6.0
-1.0
4.0
9.0
0.0
5.0
10.0
15.0
20.0
25.0
30.0
35.0
40.0
2011 2012 2013 2014 2015 2016 2017 2018 2019 2020 2021Fiscal Years
Net Change in thousandsEmpl
oym
ent i
n th
ousa
nds
Employment Net Change
Mining, Logging & Construction, 28.8,
3.4%Manufacturing, 76.5,
9.1%
Trade, Transportation, and Utilities, 168.5,
20.0%
Information, 14.6, 1.7%
Financial Activities, 43.1, 5.1%
Professional & Business Services,
118.4, 14.0%
Education & Health Services, 110.0, 13.1%
Leisure & Hospitality, 70.3, 8.3%
Other Services, 16.2, 1.9%
Government, 196.4, 23.3%
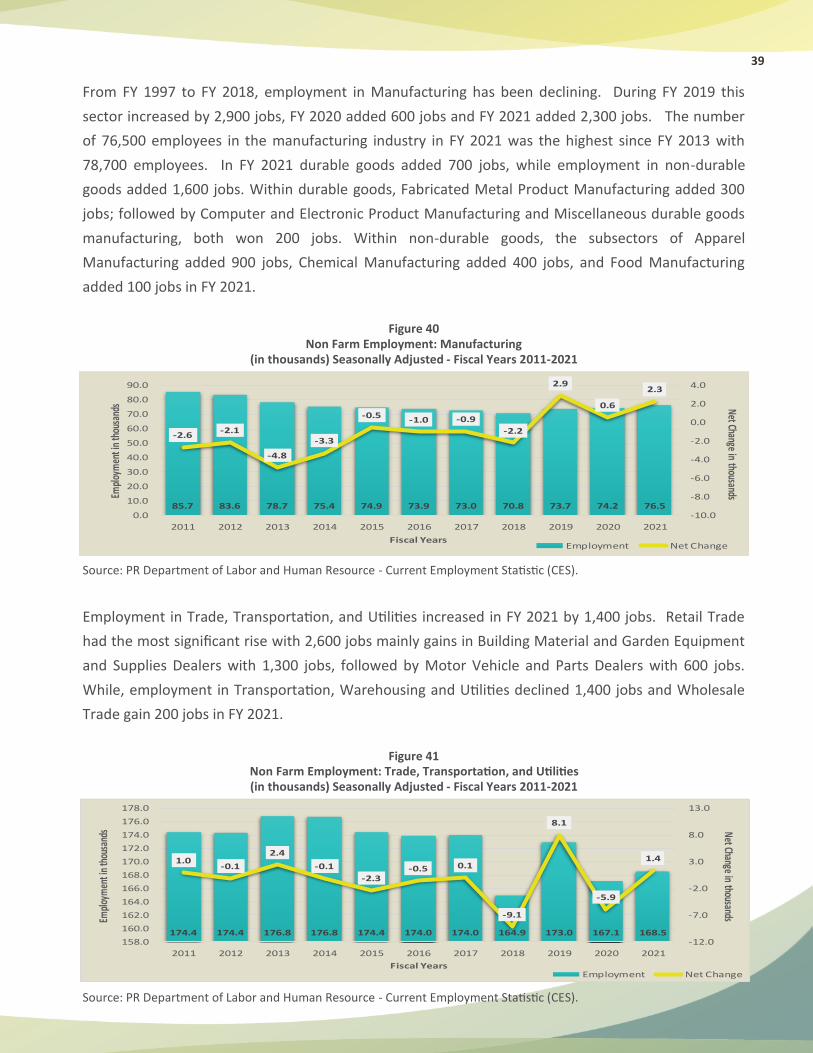
39
From FY 1997 to FY 2018, employment in Manufacturing has been declining. During FY 2019 this
sector increased by 2,900 jobs, FY 2020 added 600 jobs and FY 2021 added 2,300 jobs. The number
of 76,500 employees in the manufacturing industry in FY 2021 was the highest since FY 2013 with
78,700 employees. In FY 2021 durable goods added 700 jobs, while employment in non-durable
goods added 1,600 jobs. Within durable goods, Fabricated Metal Product Manufacturing added 300
jobs; followed by Computer and Electronic Product Manufacturing and Miscellaneous durable goods
manufacturing, both won 200 jobs. Within non-durable goods, the subsectors of Apparel
Manufacturing added 900 jobs, Chemical Manufacturing added 400 jobs, and Food Manufacturing
added 100 jobs in FY 2021.
Figure 40 Non Farm Employment: Manufacturing
(in thousands) Seasonally Adjusted - Fiscal Years 2011-2021
Source: PR Department of Labor and Human Resource - Current Employment Statistic (CES).
Employment in Trade, Transportation, and Utilities increased in FY 2021 by 1,400 jobs. Retail Trade
had the most significant rise with 2,600 jobs mainly gains in Building Material and Garden Equipment
and Supplies Dealers with 1,300 jobs, followed by Motor Vehicle and Parts Dealers with 600 jobs.
While, employment in Transportation, Warehousing and Utilities declined 1,400 jobs and Wholesale
Trade gain 200 jobs in FY 2021.
Figure 41 Non Farm Employment: Trade, Transportation, and Utilities (in thousands) Seasonally Adjusted - Fiscal Years 2011-2021
Source: PR Department of Labor and Human Resource - Current Employment Statistic (CES).
85.7 83.6 78.7 75.4 74.9 73.9 73.0 70.8 73.7 74.2 76.5
-2.6-2.1
-4.8
-3.3
-0.5-1.0 -0.9
-2.2
2.9
0.6
2.3
-10.0
-8.0
-6.0
-4.0
-2.0
0.0
2.0
4.0
0.0
10.0
20.0
30.0
40.0
50.0
60.0
70.0
80.0
90.0
2011 2012 2013 2014 2015 2016 2017 2018 2019 2020 2021
Fiscal Years
Net Change in thousandsEmpl
oym
ent i
n th
ousa
nds
Employment Net Change
174.4 174.4 176.8 176.8 174.4 174.0 174.0 164.9 173.0 167.1 168.5
1.0-0.1
2.4
-0.1
-2.3-0.5 0.1
-9.1
8.1
-5.9
1.4
-12.0
-7.0
-2.0
3.0
8.0
13.0
158.0
160.0
162.0
164.0
166.0
168.0
170.0
172.0
174.0
176.0
178.0
2011 2012 2013 2014 2015 2016 2017 2018 2019 2020 2021
Fiscal Years
Net Change in thousandsEmpl
oym
ent i
n th
ousa
nds
Employment Net Change
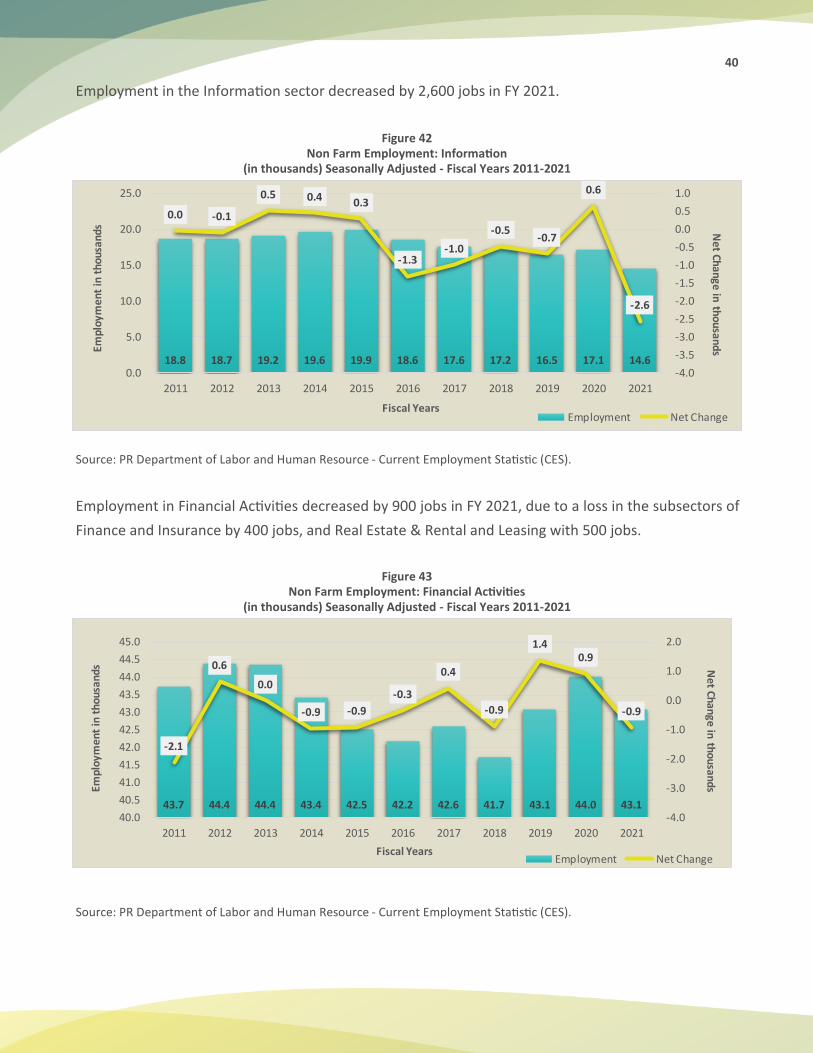
40
Employment in the Information sector decreased by 2,600 jobs in FY 2021.
Figure 42 Non Farm Employment: Information
(in thousands) Seasonally Adjusted - Fiscal Years 2011-2021
Source: PR Department of Labor and Human Resource - Current Employment Statistic (CES).
Employment in Financial Activities decreased by 900 jobs in FY 2021, due to a loss in the subsectors of
Finance and Insurance by 400 jobs, and Real Estate & Rental and Leasing with 500 jobs.
Figure 43 Non Farm Employment: Financial Activities
(in thousands) Seasonally Adjusted - Fiscal Years 2011-2021
Source: PR Department of Labor and Human Resource - Current Employment Statistic (CES).
18.8 18.7 19.2 19.6 19.9 18.6 17.6 17.2 16.5 17.1 14.6
0.0 -0.1
0.5 0.4 0.3
-1.3-1.0
-0.5-0.7
0.6
-2.6
-4.0
-3.5
-3.0
-2.5
-2.0
-1.5
-1.0
-0.5
0.0
0.5
1.0
0.0
5.0
10.0
15.0
20.0
25.0
2011 2012 2013 2014 2015 2016 2017 2018 2019 2020 2021
Fiscal Years
Net Change in thousandsEm
ploy
men
t in
tho
usan
ds
Employment Net Change
43.7 44.4 44.4 43.4 42.5 42.2 42.6 41.7 43.1 44.0 43.1
-2.1
0.6
0.0
-0.9 -0.9
-0.3
0.4
-0.9
1.40.9
-0.9
-4.0
-3.0
-2.0
-1.0
0.0
1.0
2.0
40.0
40.5
41.0
41.5
42.0
42.5
43.0
43.5
44.0
44.5
45.0
2011 2012 2013 2014 2015 2016 2017 2018 2019 2020 2021
Fiscal Years
Ne
t Change in thousandsEm
ploy
me
nt in
tho
usan
ds
Employment Net Change
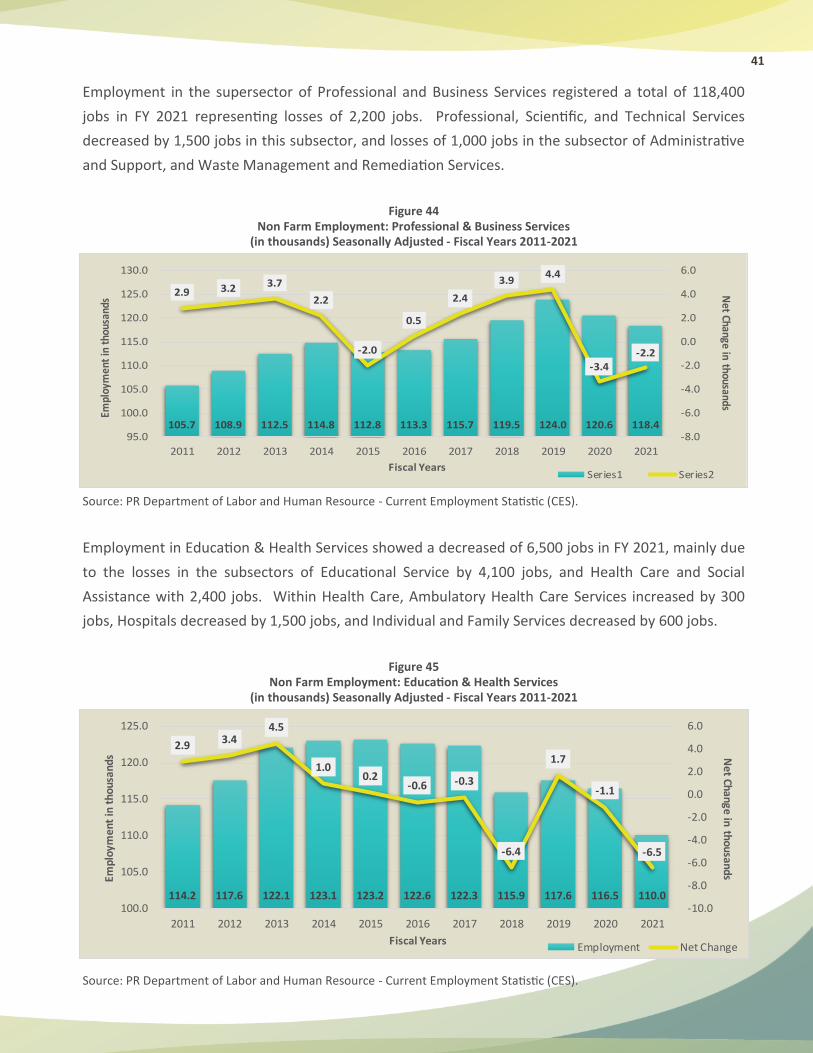
41
Employment in the supersector of Professional and Business Services registered a total of 118,400
jobs in FY 2021 representing losses of 2,200 jobs. Professional, Scientific, and Technical Services
decreased by 1,500 jobs in this subsector, and losses of 1,000 jobs in the subsector of Administrative
and Support, and Waste Management and Remediation Services.
Figure 44 Non Farm Employment: Professional & Business Services
(in thousands) Seasonally Adjusted - Fiscal Years 2011-2021
Source: PR Department of Labor and Human Resource - Current Employment Statistic (CES).
Employment in Education & Health Services showed a decreased of 6,500 jobs in FY 2021, mainly due
to the losses in the subsectors of Educational Service by 4,100 jobs, and Health Care and Social
Assistance with 2,400 jobs. Within Health Care, Ambulatory Health Care Services increased by 300
jobs, Hospitals decreased by 1,500 jobs, and Individual and Family Services decreased by 600 jobs.
Figure 45 Non Farm Employment: Education & Health Services
(in thousands) Seasonally Adjusted - Fiscal Years 2011-2021
Source: PR Department of Labor and Human Resource - Current Employment Statistic (CES).
105.7 108.9 112.5 114.8 112.8 113.3 115.7 119.5 124.0 120.6 118.4
2.9 3.2 3.7
2.2
-2.0
0.5
2.4
3.94.4
-3.4-2.2
-8.0
-6.0
-4.0
-2.0
0.0
2.0
4.0
6.0
95.0
100.0
105.0
110.0
115.0
120.0
125.0
130.0
2011 2012 2013 2014 2015 2016 2017 2018 2019 2020 2021
Fiscal Years
Net Change in thousands
Empl
oym
ent
in t
hous
ands
Series1 Series2
114.2 117.6 122.1 123.1 123.2 122.6 122.3 115.9 117.6 116.5 110.0
2.93.4
4.5
1.00.2
-0.6 -0.3
-6.4
1.7
-1.1
-6.5
-10.0
-8.0
-6.0
-4.0
-2.0
0.0
2.0
4.0
6.0
100.0
105.0
110.0
115.0
120.0
125.0
2011 2012 2013 2014 2015 2016 2017 2018 2019 2020 2021
Fiscal Years
Net Change in thousands
Empl
oym
ent
in t
hous
ands
Employment Net Change
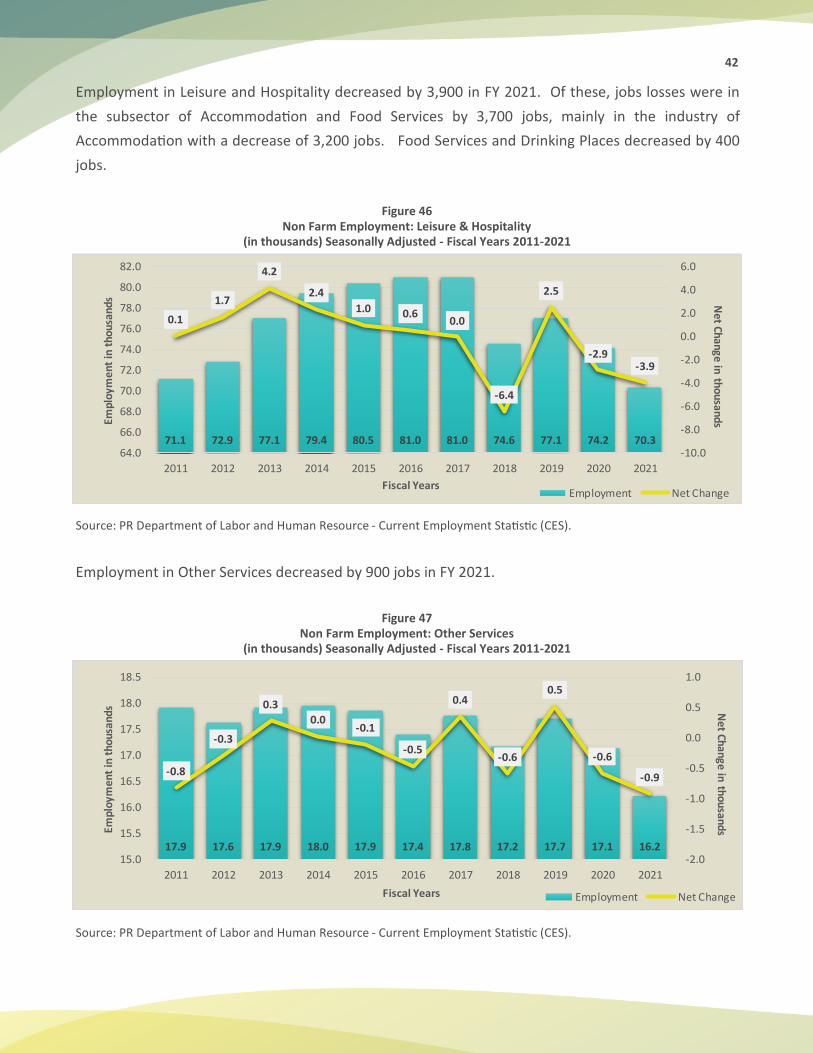
42
Employment in Leisure and Hospitality decreased by 3,900 in FY 2021. Of these, jobs losses were in
the subsector of Accommodation and Food Services by 3,700 jobs, mainly in the industry of
Accommodation with a decrease of 3,200 jobs. Food Services and Drinking Places decreased by 400
jobs.
Figure 46 Non Farm Employment: Leisure & Hospitality
(in thousands) Seasonally Adjusted - Fiscal Years 2011-2021
Source: PR Department of Labor and Human Resource - Current Employment Statistic (CES).
Employment in Other Services decreased by 900 jobs in FY 2021.
Figure 47 Non Farm Employment: Other Services
(in thousands) Seasonally Adjusted - Fiscal Years 2011-2021
Source: PR Department of Labor and Human Resource - Current Employment Statistic (CES).
71.1 72.9 77.1 79.4 80.5 81.0 81.0 74.6 77.1 74.2 70.3
0.1
1.7
4.2
2.4
1.0 0.60.0
-6.4
2.5
-2.9-3.9
-10.0
-8.0
-6.0
-4.0
-2.0
0.0
2.0
4.0
6.0
64.0
66.0
68.0
70.0
72.0
74.0
76.0
78.0
80.0
82.0
2011 2012 2013 2014 2015 2016 2017 2018 2019 2020 2021
Fiscal Years
Net Change in thousandsEm
ploy
men
t in
tho
usan
ds
Employment Net Change
17.9 17.6 17.9 18.0 17.9 17.4 17.8 17.2 17.7 17.1 16.2
-0.8
-0.3
0.3
0.0-0.1
-0.5
0.4
-0.6
0.5
-0.6
-0.9
-2.0
-1.5
-1.0
-0.5
0.0
0.5
1.0
15.0
15.5
16.0
16.5
17.0
17.5
18.0
18.5
2011 2012 2013 2014 2015 2016 2017 2018 2019 2020 2021
Fiscal Years
Net Change in thousandsEm
ploy
men
t in
tho
usan
ds
Employment Net Change
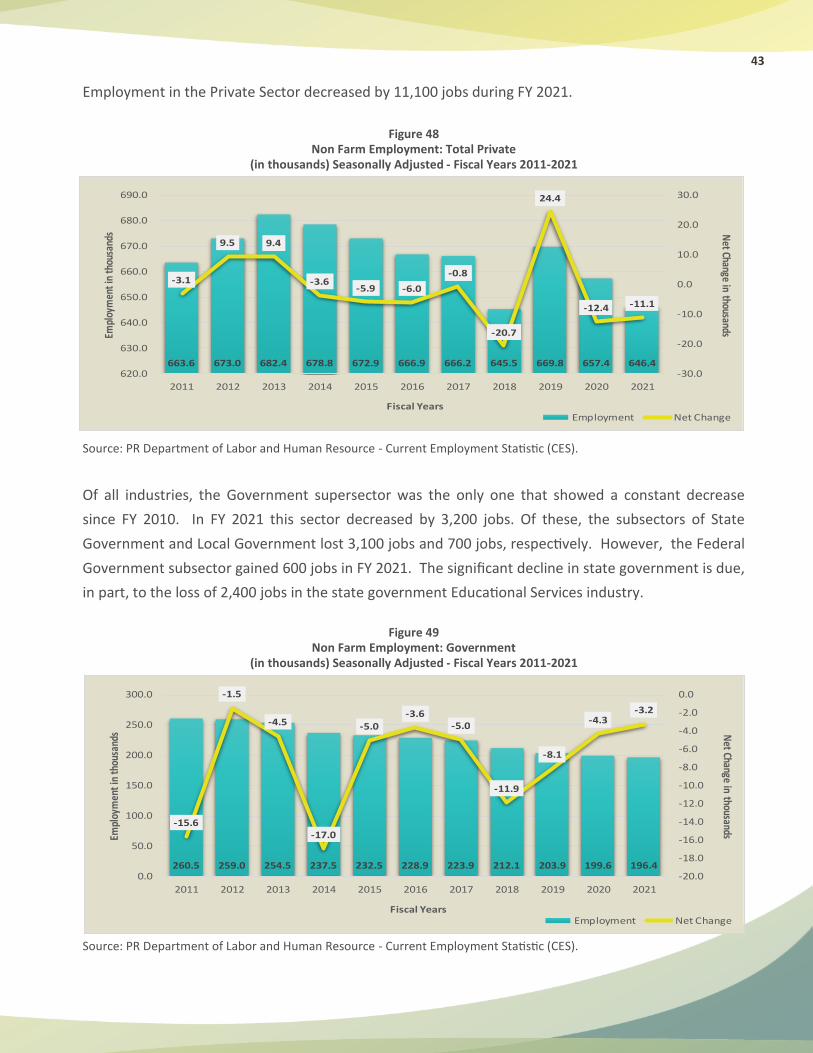
43
Employment in the Private Sector decreased by 11,100 jobs during FY 2021.
Figure 48 Non Farm Employment: Total Private
(in thousands) Seasonally Adjusted - Fiscal Years 2011-2021
Source: PR Department of Labor and Human Resource - Current Employment Statistic (CES).
Of all industries, the Government supersector was the only one that showed a constant decrease
since FY 2010. In FY 2021 this sector decreased by 3,200 jobs. Of these, the subsectors of State
Government and Local Government lost 3,100 jobs and 700 jobs, respectively. However, the Federal
Government subsector gained 600 jobs in FY 2021. The significant decline in state government is due,
in part, to the loss of 2,400 jobs in the state government Educational Services industry.
Figure 49
Non Farm Employment: Government (in thousands) Seasonally Adjusted - Fiscal Years 2011-2021
Source: PR Department of Labor and Human Resource - Current Employment Statistic (CES).
663.6 673.0 682.4 678.8 672.9 666.9 666.2 645.5 669.8 657.4 646.4
-3.1
9.5 9.4
-3.6-5.9 -6.0
-0.8
-20.7
24.4
-12.4 -11.1
-30.0
-20.0
-10.0
0.0
10.0
20.0
30.0
620.0
630.0
640.0
650.0
660.0
670.0
680.0
690.0
2011 2012 2013 2014 2015 2016 2017 2018 2019 2020 2021
Fiscal Years
Net Change in thousandsEm
ploy
men
t in
thou
sand
s
Employment Net Change
260.5 259.0 254.5 237.5 232.5 228.9 223.9 212.1 203.9 199.6 196.4
-15.6
-1.5
-4.5
-17.0
-5.0-3.6
-5.0
-11.9
-8.1
-4.3-3.2
-20.0
-18.0
-16.0
-14.0
-12.0
-10.0
-8.0
-6.0
-4.0
-2.0
0.0
0.0
50.0
100.0
150.0
200.0
250.0
300.0
2011 2012 2013 2014 2015 2016 2017 2018 2019 2020 2021
Fiscal Years
Net Change in thousandsEm
ploy
men
t in
thou
sand
s
Employment Net Change
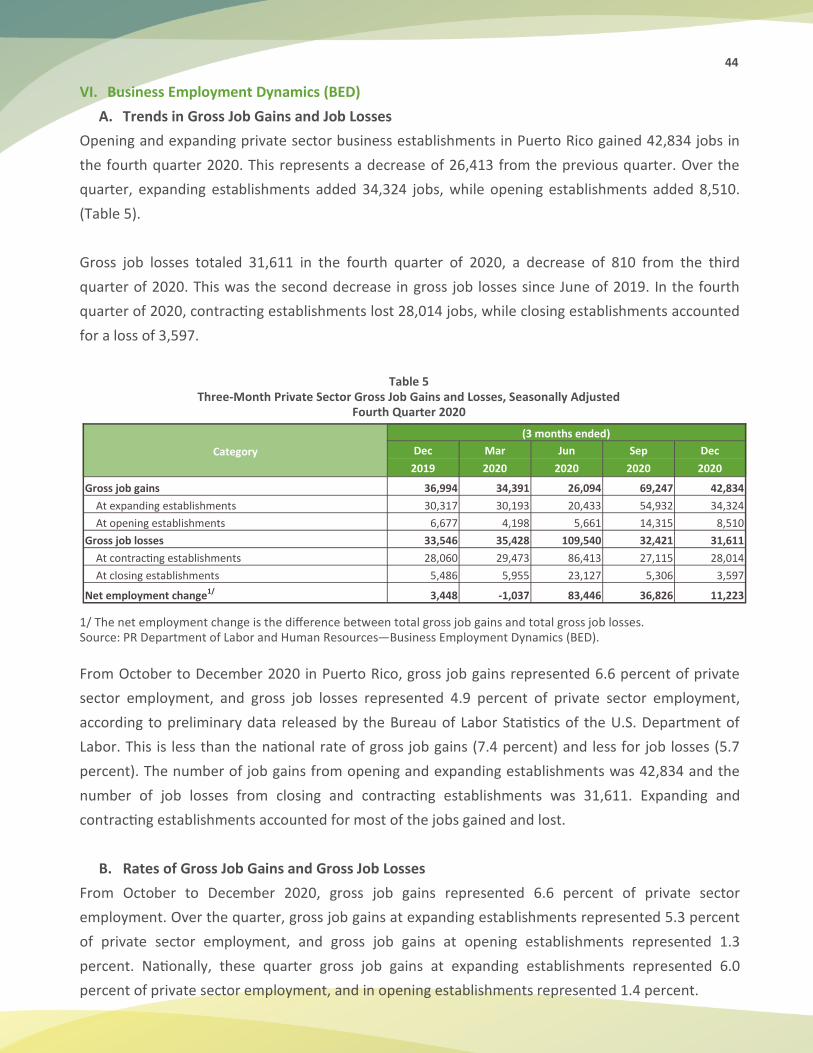
44
VI. Business Employment Dynamics (BED)
A. Trends in Gross Job Gains and Job Losses
Opening and expanding private sector business establishments in Puerto Rico gained 42,834 jobs in
the fourth quarter 2020. This represents a decrease of 26,413 from the previous quarter. Over the
quarter, expanding establishments added 34,324 jobs, while opening establishments added 8,510.
(Table 5).
Gross job losses totaled 31,611 in the fourth quarter of 2020, a decrease of 810 from the third
quarter of 2020. This was the second decrease in gross job losses since June of 2019. In the fourth
quarter of 2020, contracting establishments lost 28,014 jobs, while closing establishments accounted
for a loss of 3,597.
Table 5 Three-Month Private Sector Gross Job Gains and Losses, Seasonally Adjusted
Fourth Quarter 2020
1/ The net employment change is the difference between total gross job gains and total gross job losses. Source: PR Department of Labor and Human Resources—Business Employment Dynamics (BED).
From October to December 2020 in Puerto Rico, gross job gains represented 6.6 percent of private
sector employment, and gross job losses represented 4.9 percent of private sector employment,
according to preliminary data released by the Bureau of Labor Statistics of the U.S. Department of
Labor. This is less than the national rate of gross job gains (7.4 percent) and less for job losses (5.7
percent). The number of job gains from opening and expanding establishments was 42,834 and the
number of job losses from closing and contracting establishments was 31,611. Expanding and
contracting establishments accounted for most of the jobs gained and lost.
B. Rates of Gross Job Gains and Gross Job Losses
From October to December 2020, gross job gains represented 6.6 percent of private sector
employment. Over the quarter, gross job gains at expanding establishments represented 5.3 percent
of private sector employment, and gross job gains at opening establishments represented 1.3
percent. Nationally, these quarter gross job gains at expanding establishments represented 6.0
percent of private sector employment, and in opening establishments represented 1.4 percent.
Category
(3 months ended)
Dec Mar Jun Sep Dec
2019 2020 2020 2020 2020
Gross job gains 36,994 34,391 26,094 69,247 42,834
At expanding establishments 30,317 30,193 20,433 54,932 34,324
At opening establishments 6,677 4,198 5,661 14,315 8,510
Gross job losses 33,546 35,428 109,540 32,421 31,611
At contracting establishments 28,060 29,473 86,413 27,115 28,014
At closing establishments 5,486 5,955 23,127 5,306 3,597
Net employment change1/ 3,448 -1,037 83,446 36,826 11,223
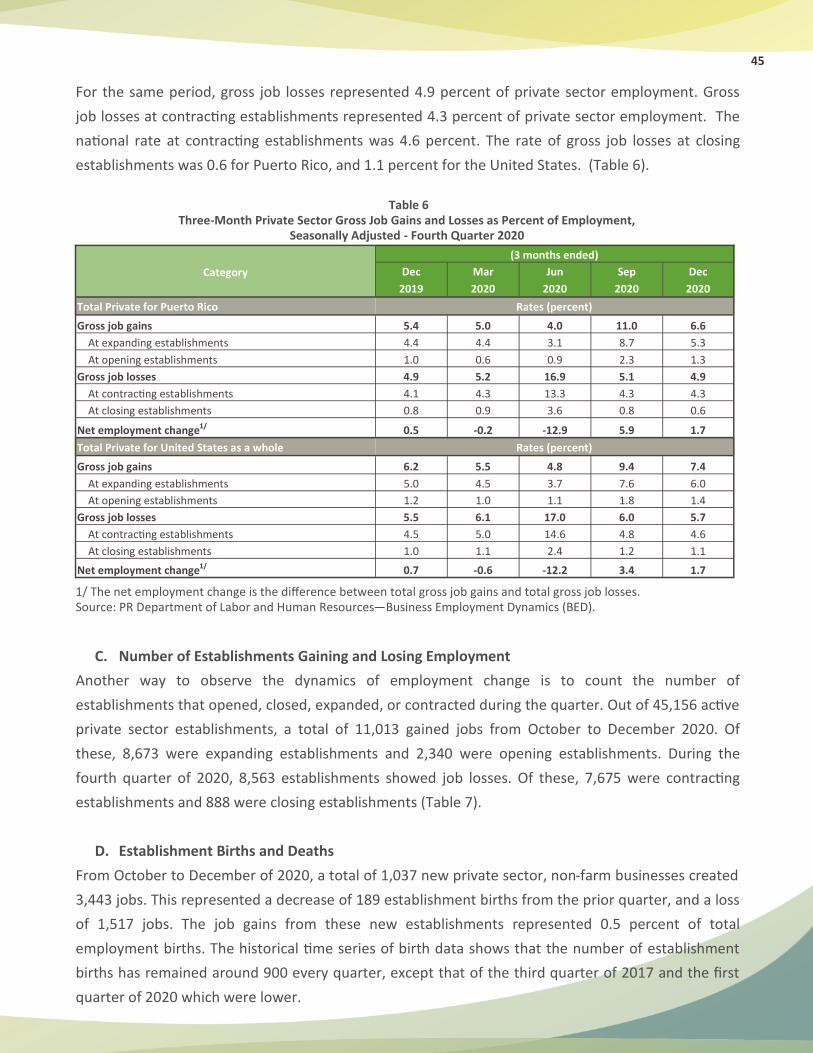
45
For the same period, gross job losses represented 4.9 percent of private sector employment. Gross
job losses at contracting establishments represented 4.3 percent of private sector employment. The
national rate at contracting establishments was 4.6 percent. The rate of gross job losses at closing
establishments was 0.6 for Puerto Rico, and 1.1 percent for the United States. (Table 6).
Table 6
Three-Month Private Sector Gross Job Gains and Losses as Percent of Employment, Seasonally Adjusted - Fourth Quarter 2020
1/ The net employment change is the difference between total gross job gains and total gross job losses. Source: PR Department of Labor and Human Resources—Business Employment Dynamics (BED).
C. Number of Establishments Gaining and Losing Employment
Another way to observe the dynamics of employment change is to count the number of
establishments that opened, closed, expanded, or contracted during the quarter. Out of 45,156 active
private sector establishments, a total of 11,013 gained jobs from October to December 2020. Of
these, 8,673 were expanding establishments and 2,340 were opening establishments. During the
fourth quarter of 2020, 8,563 establishments showed job losses. Of these, 7,675 were contracting
establishments and 888 were closing establishments (Table 7).
D. Establishment Births and Deaths
From October to December of 2020, a total of 1,037 new private sector, non-farm businesses created
3,443 jobs. This represented a decrease of 189 establishment births from the prior quarter, and a loss
of 1,517 jobs. The job gains from these new establishments represented 0.5 percent of total
employment births. The historical time series of birth data shows that the number of establishment
births has remained around 900 every quarter, except that of the third quarter of 2017 and the first
quarter of 2020 which were lower.
Category
(3 months ended)
Dec Mar Jun Sep Dec
2019 2020 2020 2020 2020
Total Private for Puerto Rico Rates (percent)
Gross job gains 5.4 5.0 4.0 11.0 6.6
At expanding establishments 4.4 4.4 3.1 8.7 5.3
At opening establishments 1.0 0.6 0.9 2.3 1.3
Gross job losses 4.9 5.2 16.9 5.1 4.9
At contracting establishments 4.1 4.3 13.3 4.3 4.3
At closing establishments 0.8 0.9 3.6 0.8 0.6
Net employment change1/ 0.5 -0.2 -12.9 5.9 1.7
Total Private for United States as a whole Rates (percent)
Gross job gains 6.2 5.5 4.8 9.4 7.4
At expanding establishments 5.0 4.5 3.7 7.6 6.0
At opening establishments 1.2 1.0 1.1 1.8 1.4
Gross job losses 5.5 6.1 17.0 6.0 5.7
At contracting establishments 4.5 5.0 14.6 4.8 4.6
At closing establishments 1.0 1.1 2.4 1.2 1.1
Net employment change1/ 0.7 -0.6 -12.2 3.4 1.7
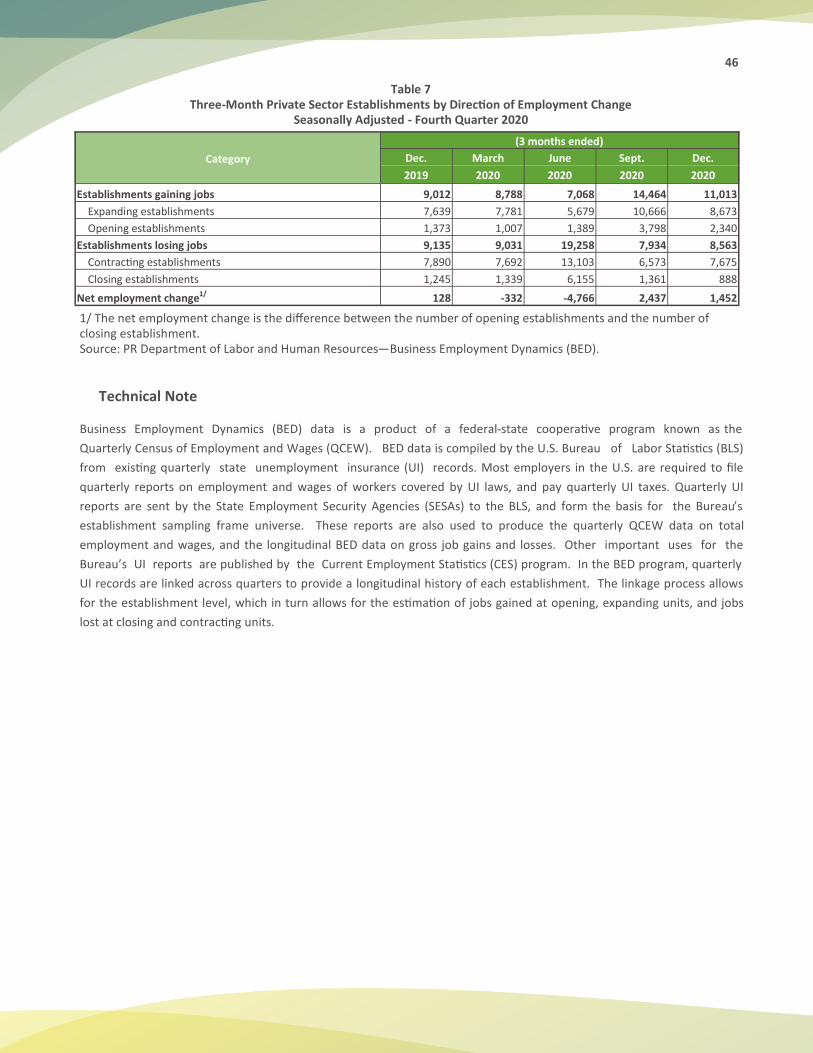
46
Table 7 Three-Month Private Sector Establishments by Direction of Employment Change
Seasonally Adjusted - Fourth Quarter 2020
1/ The net employment change is the difference between the number of opening establishments and the number of closing establishment. Source: PR Department of Labor and Human Resources—Business Employment Dynamics (BED).
Technical Note Business Employment Dynamics (BED) data is a product of a federal-state cooperative program known as the
Quarterly Census of Employment and Wages (QCEW). BED data is compiled by the U.S. Bureau of Labor Statistics (BLS)
from existing quarterly state unemployment insurance (UI) records. Most employers in the U.S. are required to file
quarterly reports on employment and wages of workers covered by UI laws, and pay quarterly UI taxes. Quarterly UI
reports are sent by the State Employment Security Agencies (SESAs) to the BLS, and form the basis for the Bureau’s
establishment sampling frame universe. These reports are also used to produce the quarterly QCEW data on total
employment and wages, and the longitudinal BED data on gross job gains and losses. Other important uses for the
Bureau’s UI reports are published by the Current Employment Statistics (CES) program. In the BED program, quarterly
UI records are linked across quarters to provide a longitudinal history of each establishment. The linkage process allows
for the establishment level, which in turn allows for the estimation of jobs gained at opening, expanding units, and jobs
lost at closing and contracting units.
Category
(3 months ended)
Dec. March June Sept. Dec.
2019 2020 2020 2020 2020
Establishments gaining jobs 9,012 8,788 7,068 14,464 11,013
Expanding establishments 7,639 7,781 5,679 10,666 8,673
Opening establishments 1,373 1,007 1,389 3,798 2,340
Establishments losing jobs 9,135 9,031 19,258 7,934 8,563
Contracting establishments 7,890 7,692 13,103 6,573 7,675
Closing establishments 1,245 1,339 6,155 1,361 888
Net employment change1/ 128 -332 -4,766 2,437 1,452
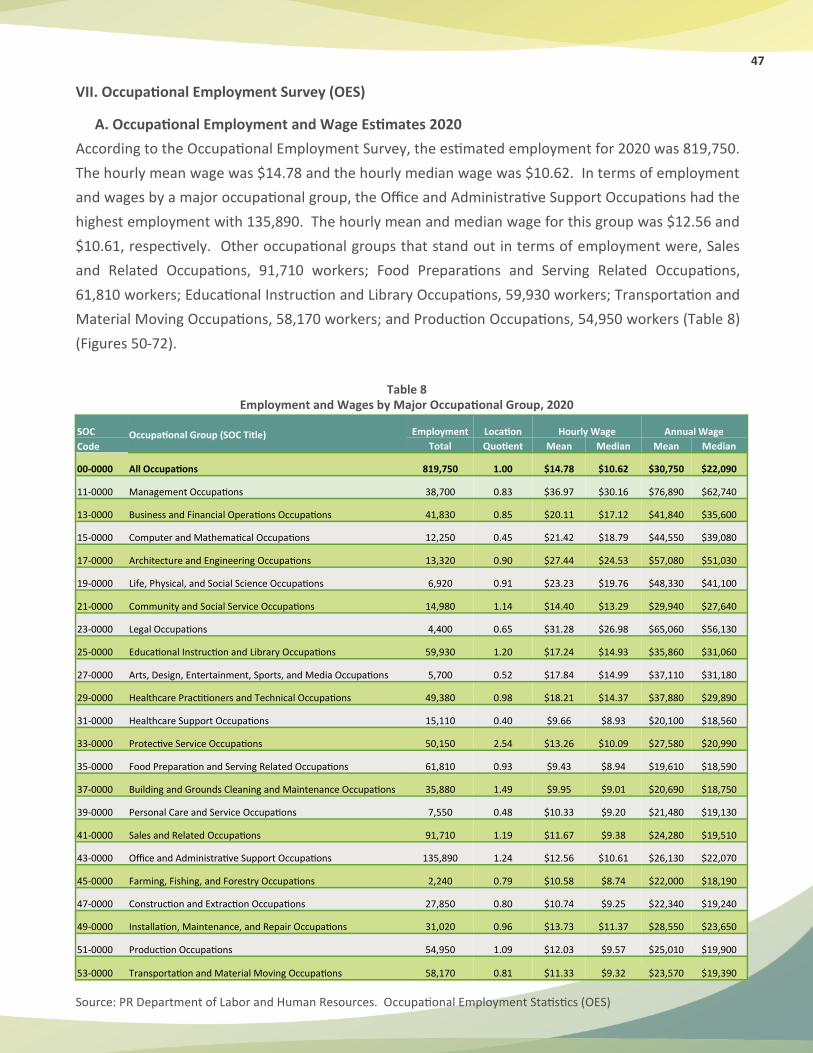
47
VII. Occupational Employment Survey (OES)
A. Occupational Employment and Wage Estimates 2020
According to the Occupational Employment Survey, the estimated employment for 2020 was 819,750.
The hourly mean wage was $14.78 and the hourly median wage was $10.62. In terms of employment
and wages by a major occupational group, the Office and Administrative Support Occupations had the
highest employment with 135,890. The hourly mean and median wage for this group was $12.56 and
$10.61, respectively. Other occupational groups that stand out in terms of employment were, Sales
and Related Occupations, 91,710 workers; Food Preparations and Serving Related Occupations,
61,810 workers; Educational Instruction and Library Occupations, 59,930 workers; Transportation and
Material Moving Occupations, 58,170 workers; and Production Occupations, 54,950 workers (Table 8)
(Figures 50-72).
Table 8 Employment and Wages by Major Occupational Group, 2020
Source: PR Department of Labor and Human Resources. Occupational Employment Statistics (OES)
SOC Occupational Group (SOC Title) Employment Hourly Wage Annual Wage Location
Code Total Mean Median Mean Median Quotient
00-0000 All Occupations 819,750 $14.78 $10.62 $30,750 $22,090 1.00
11-0000 Management Occupations 38,700 $36.97 $30.16 $76,890 $62,740 0.83
13-0000 Business and Financial Operations Occupations 41,830 $20.11 $17.12 $41,840 $35,600 0.85
15-0000 Computer and Mathematical Occupations 12,250 $21.42 $18.79 $44,550 $39,080 0.45
17-0000 Architecture and Engineering Occupations 13,320 $27.44 $24.53 $57,080 $51,030 0.90
19-0000 Life, Physical, and Social Science Occupations 6,920 $23.23 $19.76 $48,330 $41,100 0.91
21-0000 Community and Social Service Occupations 14,980 $14.40 $13.29 $29,940 $27,640 1.14
23-0000 Legal Occupations 4,400 $31.28 $26.98 $65,060 $56,130 0.65
25-0000 Educational Instruction and Library Occupations 59,930 $17.24 $14.93 $35,860 $31,060 1.20
27-0000 Arts, Design, Entertainment, Sports, and Media Occupations 5,700 $17.84 $14.99 $37,110 $31,180 0.52
29-0000 Healthcare Practitioners and Technical Occupations 49,380 $18.21 $14.37 $37,880 $29,890 0.98
31-0000 Healthcare Support Occupations 15,110 $9.66 $8.93 $20,100 $18,560 0.40
33-0000 Protective Service Occupations 50,150 $13.26 $10.09 $27,580 $20,990 2.54
35-0000 Food Preparation and Serving Related Occupations 61,810 $9.43 $8.94 $19,610 $18,590 0.93
37-0000 Building and Grounds Cleaning and Maintenance Occupations 35,880 $9.95 $9.01 $20,690 $18,750 1.49
39-0000 Personal Care and Service Occupations 7,550 $10.33 $9.20 $21,480 $19,130 0.48
41-0000 Sales and Related Occupations 91,710 $11.67 $9.38 $24,280 $19,510 1.19
43-0000 Office and Administrative Support Occupations 135,890 $12.56 $10.61 $26,130 $22,070 1.24
45-0000 Farming, Fishing, and Forestry Occupations 2,240 $10.58 $8.74 $22,000 $18,190 0.79
47-0000 Construction and Extraction Occupations 27,850 $10.74 $9.25 $22,340 $19,240 0.80
49-0000 Installation, Maintenance, and Repair Occupations 31,020 $13.73 $11.37 $28,550 $23,650 0.96
51-0000 Production Occupations 54,950 $12.03 $9.57 $25,010 $19,900 1.09
53-0000 Transportation and Material Moving Occupations 58,170 $11.33 $9.32 $23,570 $19,390 0.81
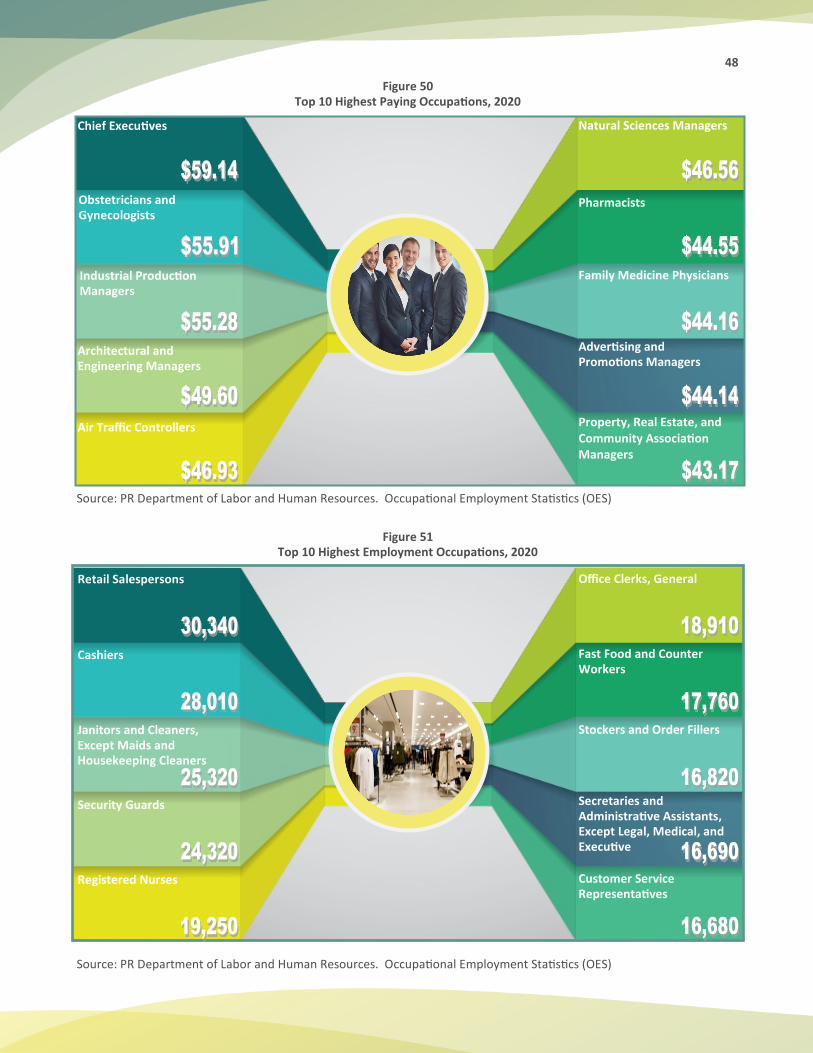
48
Figure 50 Top 10 Highest Paying Occupations, 2020
Source: PR Department of Labor and Human Resources. Occupational Employment Statistics (OES)
Figure 51
Top 10 Highest Employment Occupations, 2020
Source: PR Department of Labor and Human Resources. Occupational Employment Statistics (OES)
Chief Executives
Obstetricians and Gynecologists
Industrial Production Managers
Architectural and Engineering Managers
Air Traffic Controllers
Natural Sciences Managers
Pharmacists
Family Medicine Physicians
Advertising and Promotions Managers
Property, Real Estate, and Community Association Managers
Retail Salespersons
Cashiers
Janitors and Cleaners, Except Maids and Housekeeping Cleaners
Security Guards
Registered Nurses
Office Clerks, General
Fast Food and Counter Workers
Stockers and Order Fillers
Secretaries and Administrative Assistants, Except Legal, Medical, and Executive
Customer Service Representatives
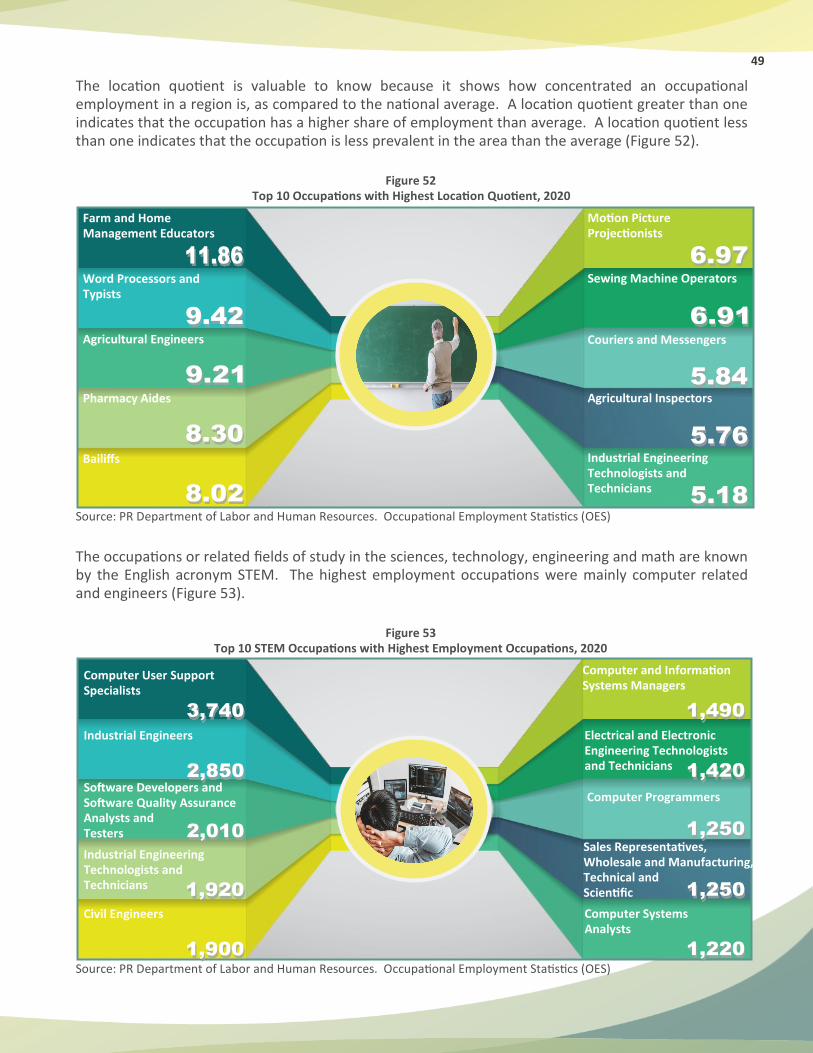
49
The location quotient is valuable to know because it shows how concentrated an occupational employment in a region is, as compared to the national average. A location quotient greater than one indicates that the occupation has a higher share of employment than average. A location quotient less than one indicates that the occupation is less prevalent in the area than the average (Figure 52).
Figure 52 Top 10 Occupations with Highest Location Quotient, 2020
Source: PR Department of Labor and Human Resources. Occupational Employment Statistics (OES)
The occupations or related fields of study in the sciences, technology, engineering and math are known by the English acronym STEM. The highest employment occupations were mainly computer related and engineers (Figure 53).
Figure 53 Top 10 STEM Occupations with Highest Employment Occupations, 2020
Source: PR Department of Labor and Human Resources. Occupational Employment Statistics (OES)
Farm and Home Management Educators
Word Processors and Typists
Agricultural Engineers
Pharmacy Aides
Bailiffs
Motion Picture Projectionists
Sewing Machine Operators
Couriers and Messengers
Agricultural Inspectors
Industrial Engineering Technologists and Technicians
Computer User Support Specialists
Industrial Engineers
Software Developers and Software Quality Assurance Analysts and Testers
Industrial Engineering Technologists and Technicians
Civil Engineers
Computer and Information Systems Managers
Electrical and Electronic Engineering Technologists and Technicians
Sales Representatives, Wholesale and Manufacturing, Technical and Scientific
Computer Programmers
Computer Systems Analysts
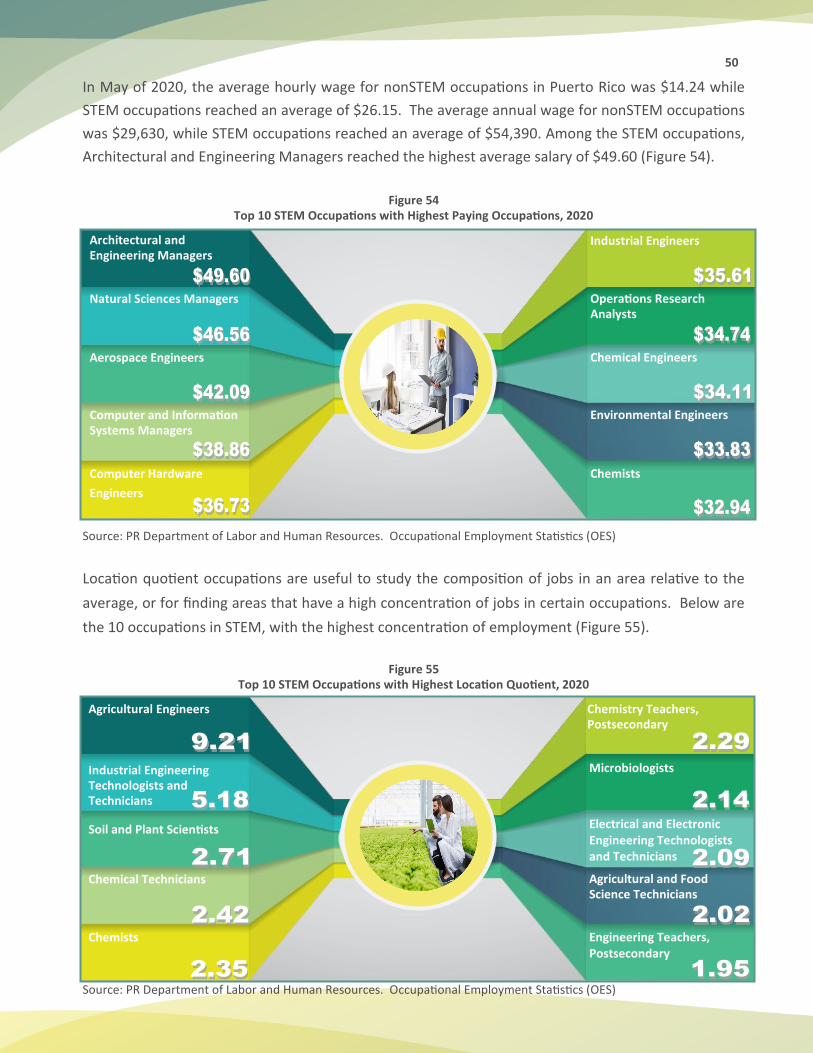
50
In May of 2020, the average hourly wage for nonSTEM occupations in Puerto Rico was $14.24 while
STEM occupations reached an average of $26.15. The average annual wage for nonSTEM occupations
was $29,630, while STEM occupations reached an average of $54,390. Among the STEM occupations,
Architectural and Engineering Managers reached the highest average salary of $49.60 (Figure 54).
Figure 54
Top 10 STEM Occupations with Highest Paying Occupations, 2020
Source: PR Department of Labor and Human Resources. Occupational Employment Statistics (OES)
Location quotient occupations are useful to study the composition of jobs in an area relative to the
average, or for finding areas that have a high concentration of jobs in certain occupations. Below are
the 10 occupations in STEM, with the highest concentration of employment (Figure 55).
Figure 55 Top 10 STEM Occupations with Highest Location Quotient, 2020
Source: PR Department of Labor and Human Resources. Occupational Employment Statistics (OES)
Architectural and Engineering Managers
Natural Sciences Managers
Aerospace Engineers
Computer and Information Systems Managers
Computer Hardware
Engineers
Industrial Engineers
Operations Research Analysts
Chemical Engineers
Environmental Engineers
Chemists
Agricultural Engineers
Industrial Engineering Technologists and Technicians
Soil and Plant Scientists
Chemical Technicians
Chemists
Chemistry Teachers, Postsecondary
Microbiologists
Electrical and Electronic Engineering Technologists and Technicians
Agricultural and Food Science Technicians
Engineering Teachers, Postsecondary

51
B. Employment by Typical Education Level
Occupations that typically require postsecondary education for entry level, made up 32.3% of
employment. The largest postsecondary category, or occupations that typically requires a bachelor’s
degree for entry, made up 19.9% of employment. This educational category includes registered
nurses, kindergarten teachers on through the secondary levels, and many management, business and
financial operations, computer, and engineering occupations, among others.
Occupations that typically require a high school diploma or the equivalent for entry level, made up
43.1% of employment, and occupations that require no formal educational credential for entry made
up 24.6% of employment. These two educational categories include most production and
construction occupations, as well as many occupations such as, retail salespersons, cashiers, and
general office clerks.
Occupations that typically require a postsecondary nondegree award, such as a certificate, for entry
level made up 4.1% of employment. (Figure 56).
Figure 56 Percent of Employment by Typical Education Level, 2020
Source: PR Department of Labor and Human Resources. Occupational Employment Statistics (OES)
Doctoral or professional degree,
2.4
Master's degree, 1.1
Bachelor's degree, 19.9
Associate's degree, 2.3
Postsecondary nondegree award, 4.1
Some college, no degree, 2.5
High school diploma or
equivalent, 43.1
No formal educational credential, 24.6
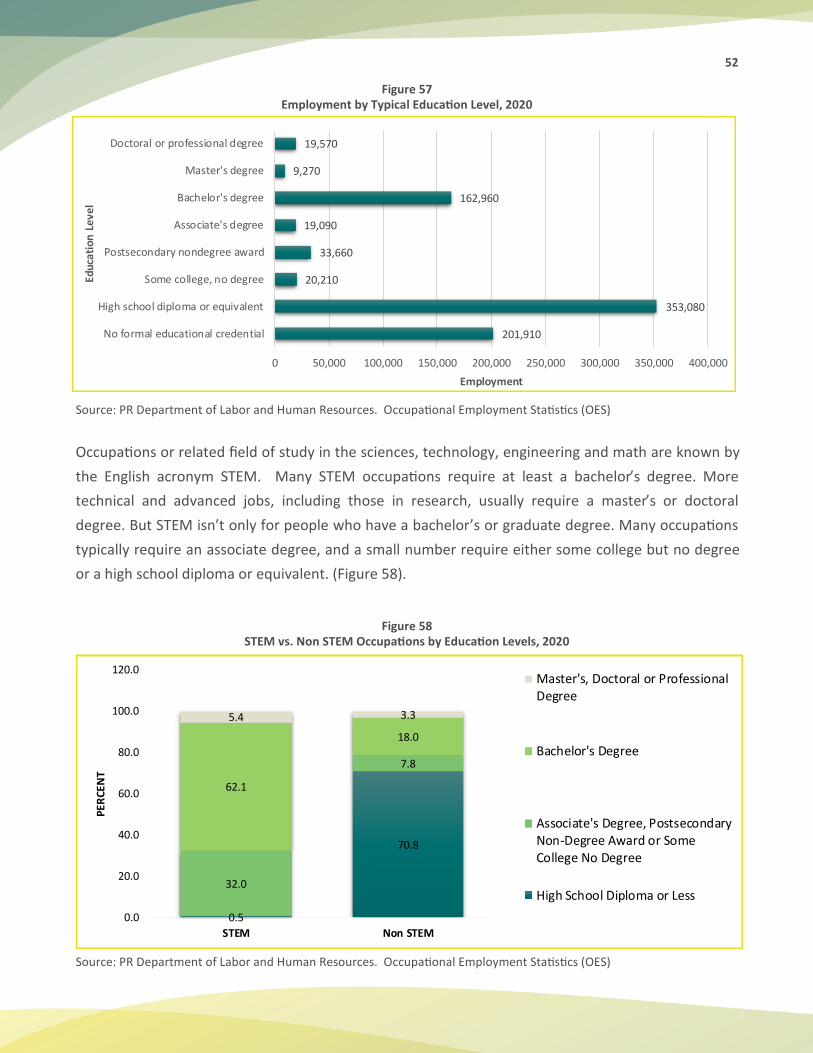
52
Figure 57 Employment by Typical Education Level, 2020
Source: PR Department of Labor and Human Resources. Occupational Employment Statistics (OES)
Occupations or related field of study in the sciences, technology, engineering and math are known by
the English acronym STEM. Many STEM occupations require at least a bachelor’s degree. More
technical and advanced jobs, including those in research, usually require a master’s or doctoral
degree. But STEM isn’t only for people who have a bachelor’s or graduate degree. Many occupations
typically require an associate degree, and a small number require either some college but no degree
or a high school diploma or equivalent. (Figure 58).
Figure 58 STEM vs. Non STEM Occupations by Education Levels, 2020
Source: PR Department of Labor and Human Resources. Occupational Employment Statistics (OES)
201,910
353,080
20,210
33,660
19,090
162,960
9,270
19,570
0 50,000 100,000 150,000 200,000 250,000 300,000 350,000 400,000
No formal educational credential
High school diploma or equivalent
Some college, no degree
Postsecondary nondegree award
Associate's degree
Bachelor's degree
Master's degree
Doctoral or professional degree
Employment
Educ
atio
n Le
vel
0.5
70.8
32.0
7.8
62.1
18.0
5.4 3.3
0.0
20.0
40.0
60.0
80.0
100.0
120.0
STEM Non STEM
PE
RC
EN
T
Master's, Doctoral or ProfessionalDegree
Bachelor's Degree
Associate's Degree, PostsecondaryNon-Degree Award or SomeCollege No Degree
High School Diploma or Less
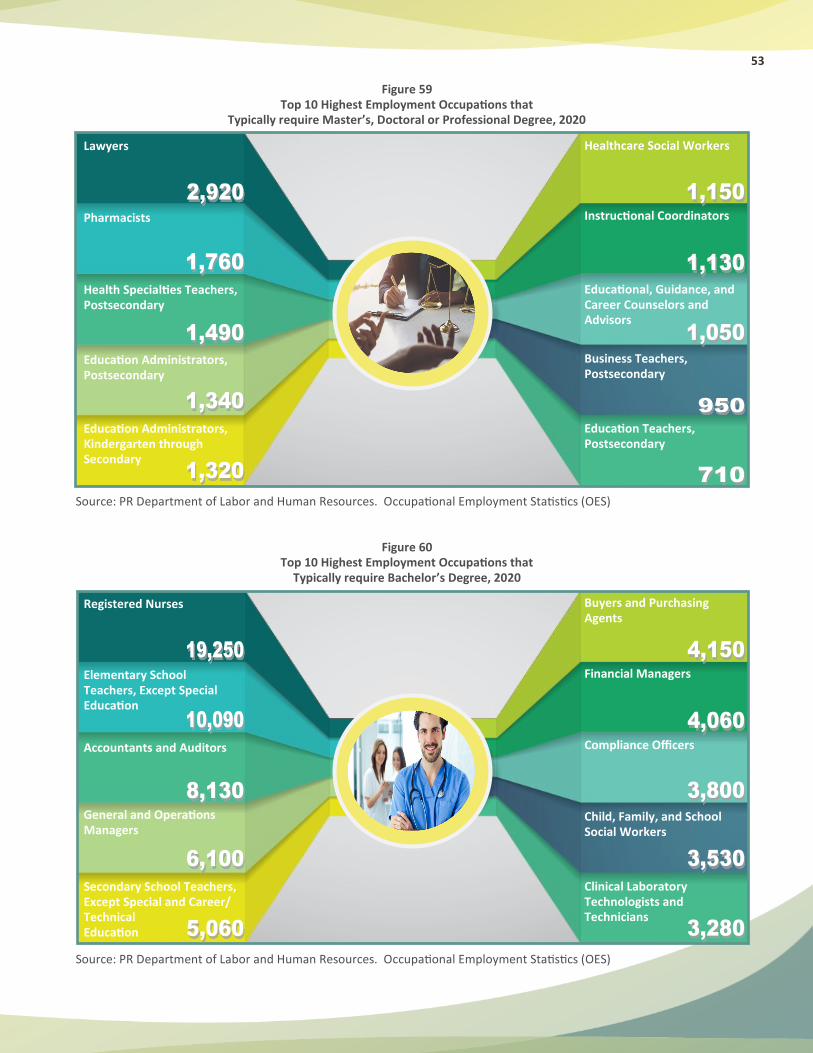
53
Figure 59 Top 10 Highest Employment Occupations that
Typically require Master’s, Doctoral or Professional Degree, 2020
Source: PR Department of Labor and Human Resources. Occupational Employment Statistics (OES)
Figure 60 Top 10 Highest Employment Occupations that
Typically require Bachelor’s Degree, 2020
Source: PR Department of Labor and Human Resources. Occupational Employment Statistics (OES)
Lawyers
Pharmacists
Health Specialties Teachers, Postsecondary
Education Administrators, Postsecondary
Education Administrators, Kindergarten through Secondary
Healthcare Social Workers
Instructional Coordinators
Educational, Guidance, and Career Counselors and Advisors
Business Teachers, Postsecondary
Education Teachers, Postsecondary
Registered Nurses
Elementary School Teachers, Except Special Education
Accountants and Auditors
General and Operations Managers
Secondary School Teachers, Except Special and Career/Technical Education
Buyers and Purchasing Agents
Financial Managers
Compliance Officers
Child, Family, and School Social Workers
Clinical Laboratory Technologists and Technicians
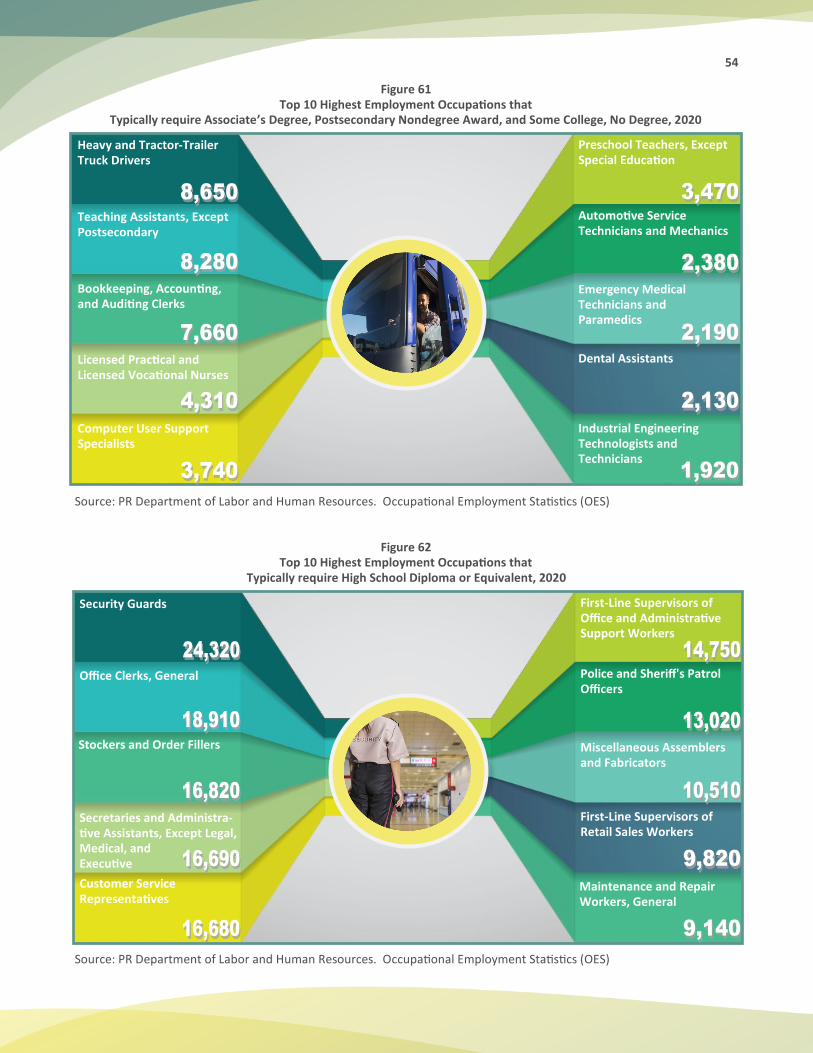
54
Figure 61 Top 10 Highest Employment Occupations that
Typically require Associate’s Degree, Postsecondary Nondegree Award, and Some College, No Degree, 2020
Source: PR Department of Labor and Human Resources. Occupational Employment Statistics (OES)
Figure 62 Top 10 Highest Employment Occupations that
Typically require High School Diploma or Equivalent, 2020
Source: PR Department of Labor and Human Resources. Occupational Employment Statistics (OES)
Heavy and Tractor-Trailer Truck Drivers
Teaching Assistants, Except Postsecondary
Bookkeeping, Accounting, and Auditing Clerks
Licensed Practical and Licensed Vocational Nurses
Computer User Support Specialists
Preschool Teachers, Except Special Education
Automotive Service Technicians and Mechanics
Emergency Medical Technicians and Paramedics
Dental Assistants
Industrial Engineering Technologists and Technicians
Security Guards
Office Clerks, General
Stockers and Order Fillers
Secretaries and Administra-tive Assistants, Except Legal, Medical, and Executive
Customer Service Representatives
First-Line Supervisors of Office and Administrative Support Workers
Police and Sheriff's Patrol Officers
Miscellaneous Assemblers and Fabricators
First-Line Supervisors of Retail Sales Workers
Maintenance and Repair Workers, General
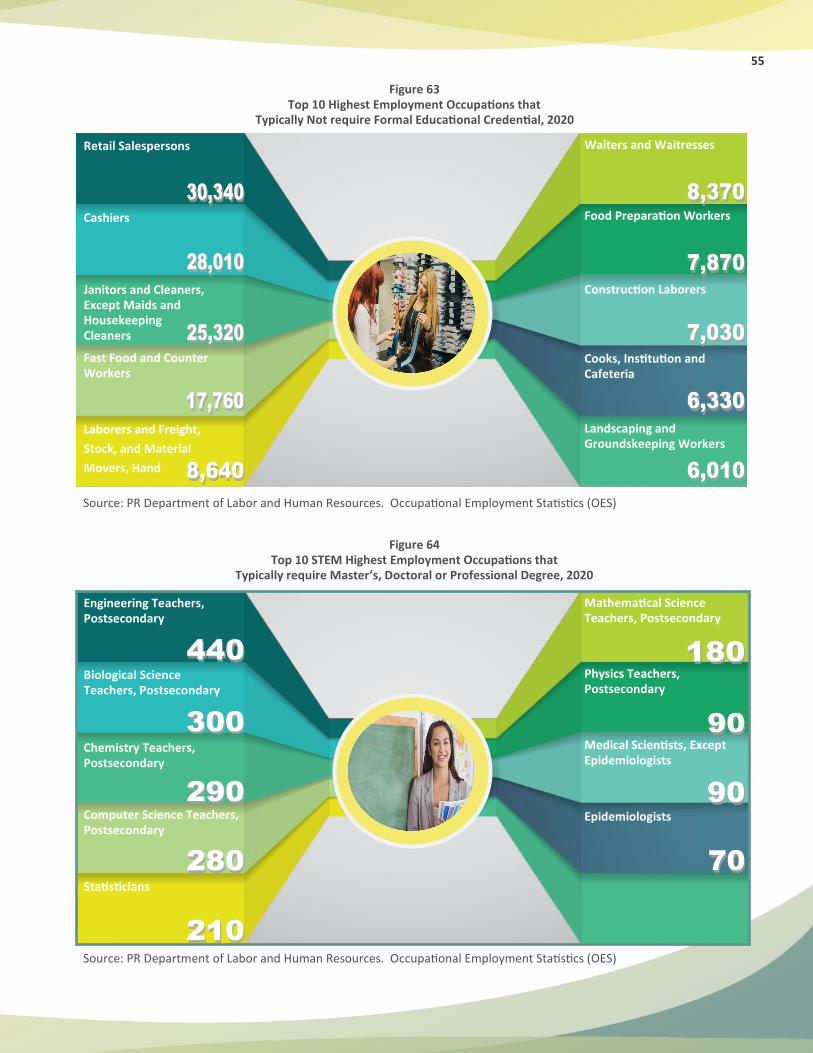
55
Figure 63 Top 10 Highest Employment Occupations that
Typically Not require Formal Educational Credential, 2020
Source: PR Department of Labor and Human Resources. Occupational Employment Statistics (OES)
Figure 64
Top 10 STEM Highest Employment Occupations that Typically require Master’s, Doctoral or Professional Degree, 2020
Source: PR Department of Labor and Human Resources. Occupational Employment Statistics (OES)
Retail Salespersons
Cashiers
Janitors and Cleaners, Except Maids and Housekeeping Cleaners
Fast Food and Counter Workers
Laborers and Freight,
Stock, and Material
Movers, Hand
Waiters and Waitresses
Food Preparation Workers
Construction Laborers
Cooks, Institution and Cafeteria
Landscaping and Groundskeeping Workers
Engineering Teachers, Postsecondary
Biological Science Teachers, Postsecondary
Chemistry Teachers, Postsecondary
Computer Science Teachers, Postsecondary
Statisticians
Mathematical Science Teachers, Postsecondary
Physics Teachers, Postsecondary
Medical Scientists, Except Epidemiologists
Epidemiologists
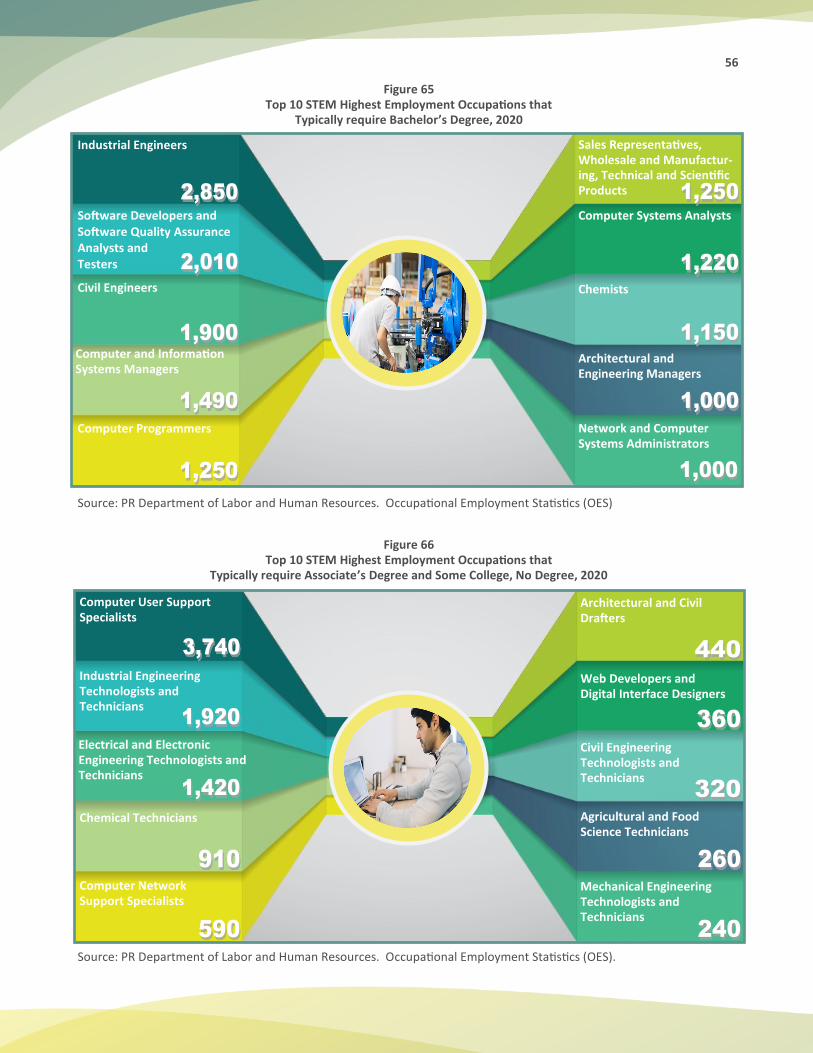
56
Figure 65 Top 10 STEM Highest Employment Occupations that
Typically require Bachelor’s Degree, 2020
Source: PR Department of Labor and Human Resources. Occupational Employment Statistics (OES)
Figure 66
Top 10 STEM Highest Employment Occupations that Typically require Associate’s Degree and Some College, No Degree, 2020
Source: PR Department of Labor and Human Resources. Occupational Employment Statistics (OES).
Industrial Engineers
Software Developers and Software Quality Assurance Analysts and Testers
Civil Engineers
Computer and Information Systems Managers
Computer Programmers
Sales Representatives, Wholesale and Manufactur-ing, Technical and Scientific Products
Computer Systems Analysts
Chemists
Architectural and Engineering Managers
Network and Computer Systems Administrators
Computer User Support Specialists
Industrial Engineering Technologists and Technicians
Electrical and Electronic Engineering Technologists and Technicians
Chemical Technicians
Computer Network Support Specialists
Architectural and Civil Drafters
Civil Engineering Technologists and Technicians
Web Developers and Digital Interface Designers
Agricultural and Food Science Technicians
Mechanical Engineering Technologists and Technicians
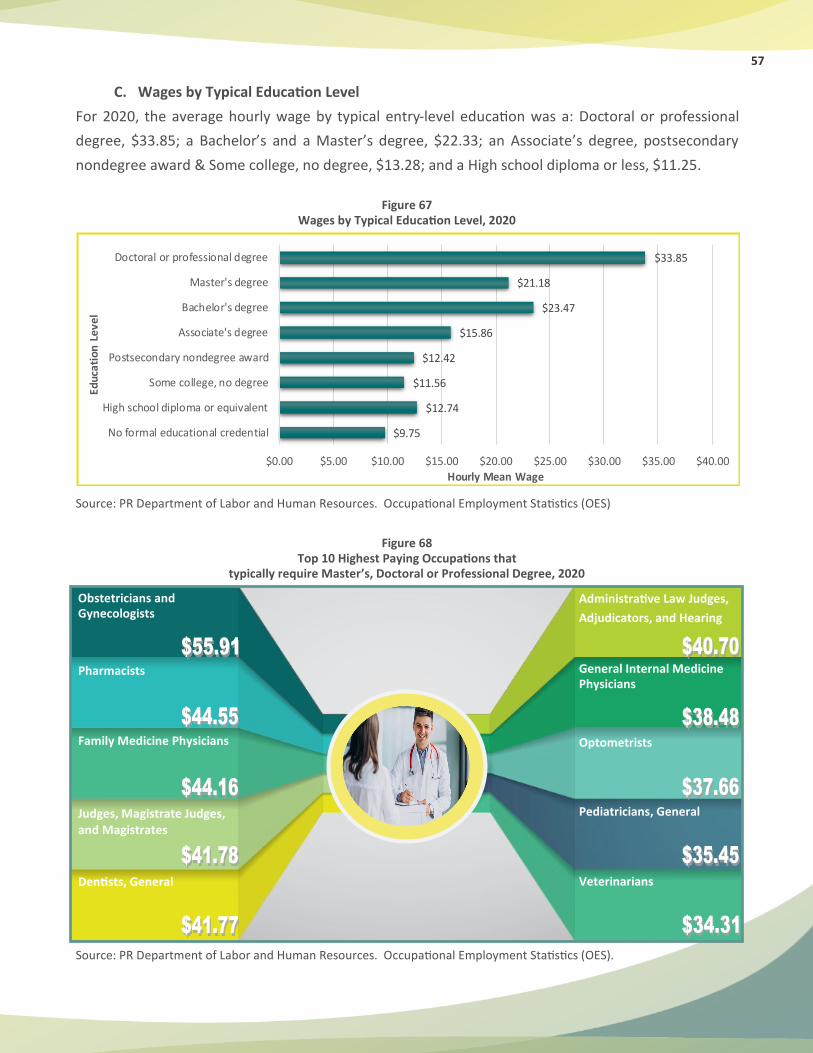
57
C. Wages by Typical Education Level
For 2020, the average hourly wage by typical entry-level education was a: Doctoral or professional
degree, $33.85; a Bachelor’s and a Master’s degree, $22.33; an Associate’s degree, postsecondary
nondegree award & Some college, no degree, $13.28; and a High school diploma or less, $11.25.
Figure 67
Wages by Typical Education Level, 2020
Source: PR Department of Labor and Human Resources. Occupational Employment Statistics (OES)
Figure 68 Top 10 Highest Paying Occupations that
typically require Master’s, Doctoral or Professional Degree, 2020
Source: PR Department of Labor and Human Resources. Occupational Employment Statistics (OES).
Obstetricians and Gynecologists
Pharmacists
Family Medicine Physicians
Judges, Magistrate Judges, and Magistrates
Dentists, General
Administrative Law Judges,
Adjudicators, and Hearing
General Internal Medicine Physicians
Optometrists
Pediatricians, General
Veterinarians
$9.75
$12.74
$11.56
$12.42
$15.86
$23.47
$21.18
$33.85
$0.00 $5.00 $10.00 $15.00 $20.00 $25.00 $30.00 $35.00 $40.00
No formal educational credential
High school diploma or equivalent
Some college, no degree
Postsecondary nondegree award
Associate's degree
Bachelor's degree
Master's degree
Doctoral or professional degree
Hourly Mean Wage
Ed
uca
tio
n L
ev
el
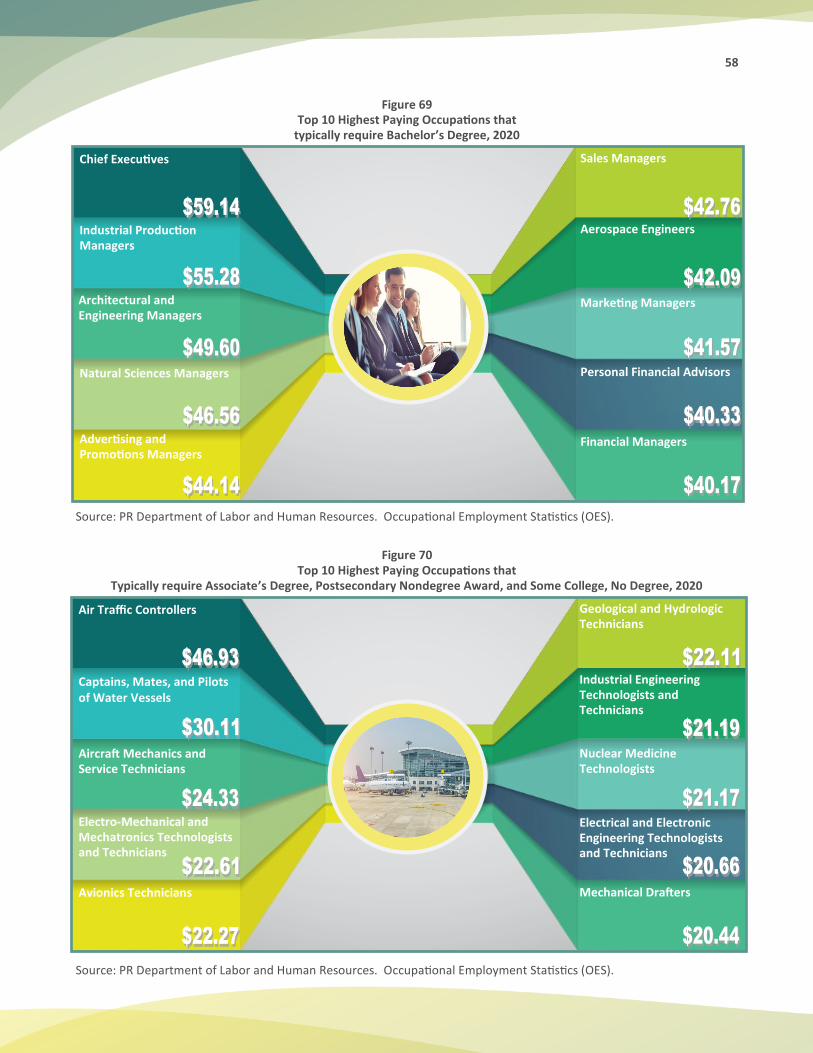
58
Figure 69
Top 10 Highest Paying Occupations that typically require Bachelor’s Degree, 2020
Source: PR Department of Labor and Human Resources. Occupational Employment Statistics (OES).
Figure 70
Top 10 Highest Paying Occupations that Typically require Associate’s Degree, Postsecondary Nondegree Award, and Some College, No Degree, 2020
Source: PR Department of Labor and Human Resources. Occupational Employment Statistics (OES).
Air Traffic Controllers
Captains, Mates, and Pilots of Water Vessels
Aircraft Mechanics and Service Technicians
Electro-Mechanical and Mechatronics Technologists and Technicians
Avionics Technicians
Geological and Hydrologic Technicians
Industrial Engineering Technologists and Technicians
Nuclear Medicine Technologists
Electrical and Electronic Engineering Technologists and Technicians
Mechanical Drafters
Chief Executives
Industrial Production Managers
Architectural and Engineering Managers
Natural Sciences Managers
Advertising and Promotions Managers
Sales Managers
Aerospace Engineers
Marketing Managers
Personal Financial Advisors
Financial Managers
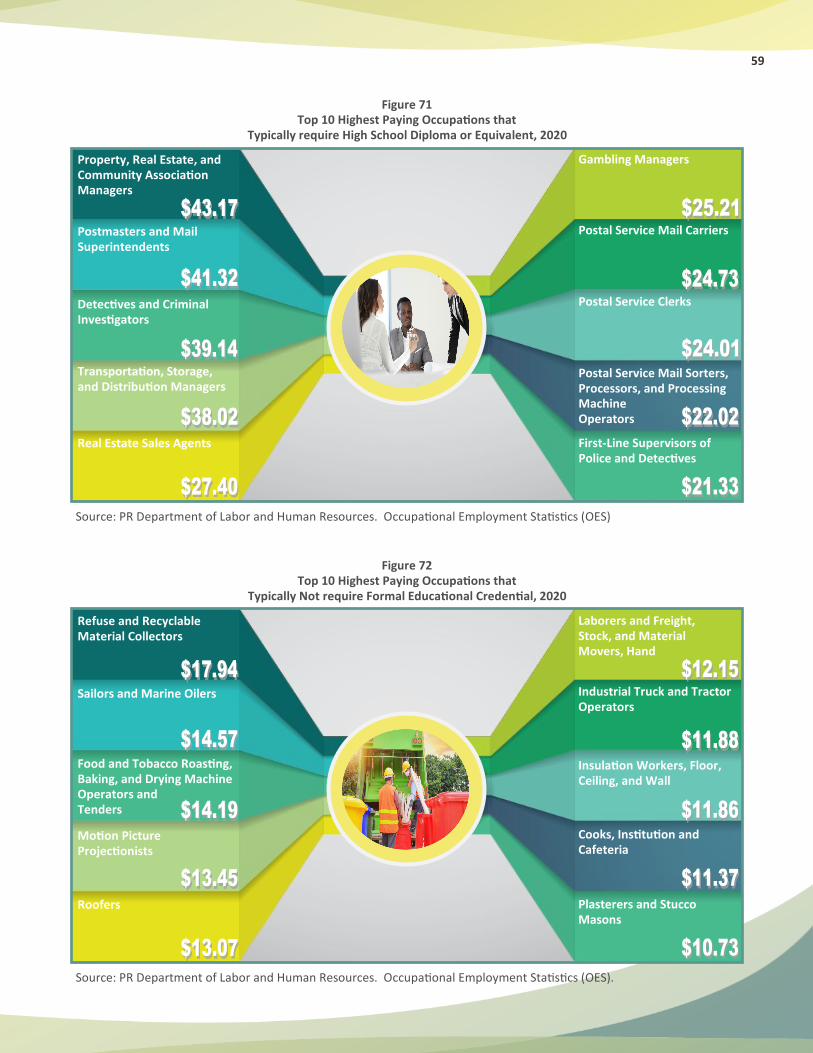
59
Figure 71
Top 10 Highest Paying Occupations that Typically require High School Diploma or Equivalent, 2020
Source: PR Department of Labor and Human Resources. Occupational Employment Statistics (OES)
Figure 72
Top 10 Highest Paying Occupations that Typically Not require Formal Educational Credential, 2020
Source: PR Department of Labor and Human Resources. Occupational Employment Statistics (OES).
Property, Real Estate, and Community Association Managers
Postmasters and Mail Superintendents
Detectives and Criminal Investigators
Transportation, Storage, and Distribution Managers
Real Estate Sales Agents
Gambling Managers
Postal Service Mail Carriers
Postal Service Clerks
Postal Service Mail Sorters, Processors, and Processing Machine Operators
First-Line Supervisors of Police and Detectives
Refuse and Recyclable Material Collectors
Sailors and Marine Oilers
Food and Tobacco Roasting, Baking, and Drying Machine Operators and Tenders
Motion Picture Projectionists
Roofers
Laborers and Freight, Stock, and Material Movers, Hand
Industrial Truck and Tractor Operators
Insulation Workers, Floor, Ceiling, and Wall
Cooks, Institution and Cafeteria
Plasterers and Stucco Masons
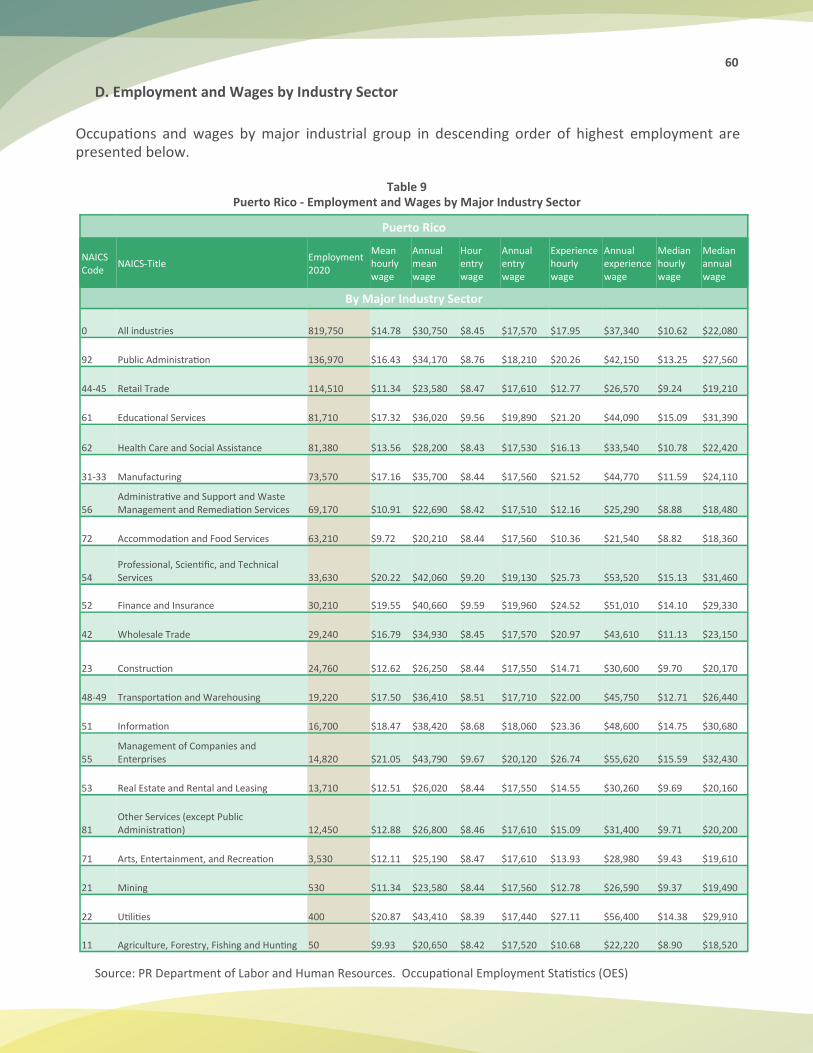
60
D. Employment and Wages by Industry Sector
Occupations and wages by major industrial group in descending order of highest employment are presented below.
Table 9
Puerto Rico - Employment and Wages by Major Industry Sector
Source: PR Department of Labor and Human Resources. Occupational Employment Statistics (OES)
Puerto Rico
NAICS Code
NAICS-Title Employment 2020
Mean hourly wage
Annual mean wage
Hour entry wage
Annual entry wage
Experience hourly wage
Annual experience wage
Median hourly wage
Median annual wage
By Major Industry Sector
0 All industries 819,750 $14.78 $30,750 $8.45 $17,570 $17.95 $37,340 $10.62 $22,080
92 Public Administration 136,970 $16.43 $34,170 $8.76 $18,210 $20.26 $42,150 $13.25 $27,560
44-45 Retail Trade 114,510 $11.34 $23,580 $8.47 $17,610 $12.77 $26,570 $9.24 $19,210
61 Educational Services 81,710 $17.32 $36,020 $9.56 $19,890 $21.20 $44,090 $15.09 $31,390
62 Health Care and Social Assistance 81,380 $13.56 $28,200 $8.43 $17,530 $16.13 $33,540 $10.78 $22,420
31-33 Manufacturing 73,570 $17.16 $35,700 $8.44 $17,560 $21.52 $44,770 $11.59 $24,110
56 Administrative and Support and Waste Management and Remediation Services 69,170 $10.91 $22,690 $8.42 $17,510 $12.16 $25,290 $8.88 $18,480
72 Accommodation and Food Services 63,210 $9.72 $20,210 $8.44 $17,560 $10.36 $21,540 $8.82 $18,360
54 Professional, Scientific, and Technical Services 33,630 $20.22 $42,060 $9.20 $19,130 $25.73 $53,520 $15.13 $31,460
52 Finance and Insurance 30,210 $19.55 $40,660 $9.59 $19,960 $24.52 $51,010 $14.10 $29,330
42 Wholesale Trade 29,240 $16.79 $34,930 $8.45 $17,570 $20.97 $43,610 $11.13 $23,150
23 Construction 24,760 $12.62 $26,250 $8.44 $17,550 $14.71 $30,600 $9.70 $20,170
48-49 Transportation and Warehousing 19,220 $17.50 $36,410 $8.51 $17,710 $22.00 $45,750 $12.71 $26,440
51 Information 16,700 $18.47 $38,420 $8.68 $18,060 $23.36 $48,600 $14.75 $30,680
55 Management of Companies and Enterprises 14,820 $21.05 $43,790 $9.67 $20,120 $26.74 $55,620 $15.59 $32,430
53 Real Estate and Rental and Leasing 13,710 $12.51 $26,020 $8.44 $17,550 $14.55 $30,260 $9.69 $20,160
81 Other Services (except Public Administration) 12,450 $12.88 $26,800 $8.46 $17,610 $15.09 $31,400 $9.71 $20,200
71 Arts, Entertainment, and Recreation 3,530 $12.11 $25,190 $8.47 $17,610 $13.93 $28,980 $9.43 $19,610
21 Mining 530 $11.34 $23,580 $8.44 $17,560 $12.78 $26,590 $9.37 $19,490
22 Utilities 400 $20.87 $43,410 $8.39 $17,440 $27.11 $56,400 $14.38 $29,910
11 Agriculture, Forestry, Fishing and Hunting 50 $9.93 $20,650 $8.42 $17,520 $10.68 $22,220 $8.90 $18,520
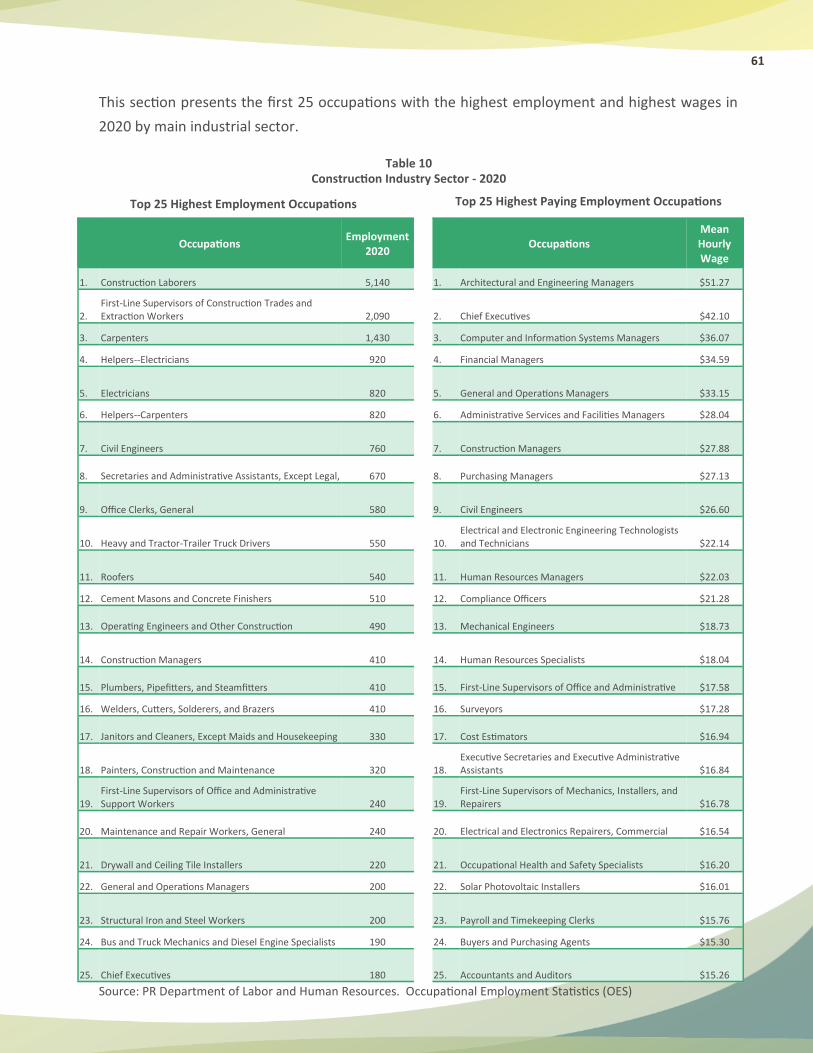
61
This section presents the first 25 occupations with the highest employment and highest wages in
2020 by main industrial sector.
Source: PR Department of Labor and Human Resources. Occupational Employment Statistics (OES)
Top 25 Highest Employment Occupations Top 25 Highest Paying Employment Occupations
Table 10 Construction Industry Sector - 2020
Occupations Employment
2020 Occupations
Mean Hourly Wage
1. Construction Laborers 5,140 1. Architectural and Engineering Managers $51.27
2. First-Line Supervisors of Construction Trades and Extraction Workers 2,090 2. Chief Executives $42.10
3. Carpenters 1,430 3. Computer and Information Systems Managers $36.07
4. Helpers--Electricians 920 4. Financial Managers $34.59
5. Electricians 820 5. General and Operations Managers $33.15
6. Helpers--Carpenters 820 6. Administrative Services and Facilities Managers $28.04
7. Civil Engineers 760 7. Construction Managers $27.88
8. Secretaries and Administrative Assistants, Except Legal, 670 8. Purchasing Managers $27.13
9. Office Clerks, General 580 9. Civil Engineers $26.60
10. Heavy and Tractor-Trailer Truck Drivers 550 10. Electrical and Electronic Engineering Technologists and Technicians $22.14
11. Roofers 540 11. Human Resources Managers $22.03
12. Cement Masons and Concrete Finishers 510 12. Compliance Officers $21.28
13. Operating Engineers and Other Construction 490 13. Mechanical Engineers $18.73
14. Construction Managers 410 14. Human Resources Specialists $18.04
15. Plumbers, Pipefitters, and Steamfitters 410 15. First-Line Supervisors of Office and Administrative $17.58
16. Welders, Cutters, Solderers, and Brazers 410 16. Surveyors $17.28
17. Janitors and Cleaners, Except Maids and Housekeeping 330 17. Cost Estimators $16.94
18. Painters, Construction and Maintenance 320 18. Executive Secretaries and Executive Administrative Assistants $16.84
19. First-Line Supervisors of Office and Administrative Support Workers 240 19.
First-Line Supervisors of Mechanics, Installers, and Repairers $16.78
20. Maintenance and Repair Workers, General 240 20. Electrical and Electronics Repairers, Commercial $16.54
21. Drywall and Ceiling Tile Installers 220 21. Occupational Health and Safety Specialists $16.20
22. General and Operations Managers 200 22. Solar Photovoltaic Installers $16.01
23. Structural Iron and Steel Workers 200 23. Payroll and Timekeeping Clerks $15.76
24. Bus and Truck Mechanics and Diesel Engine Specialists 190 24. Buyers and Purchasing Agents $15.30
25. Chief Executives 180 25. Accountants and Auditors $15.26
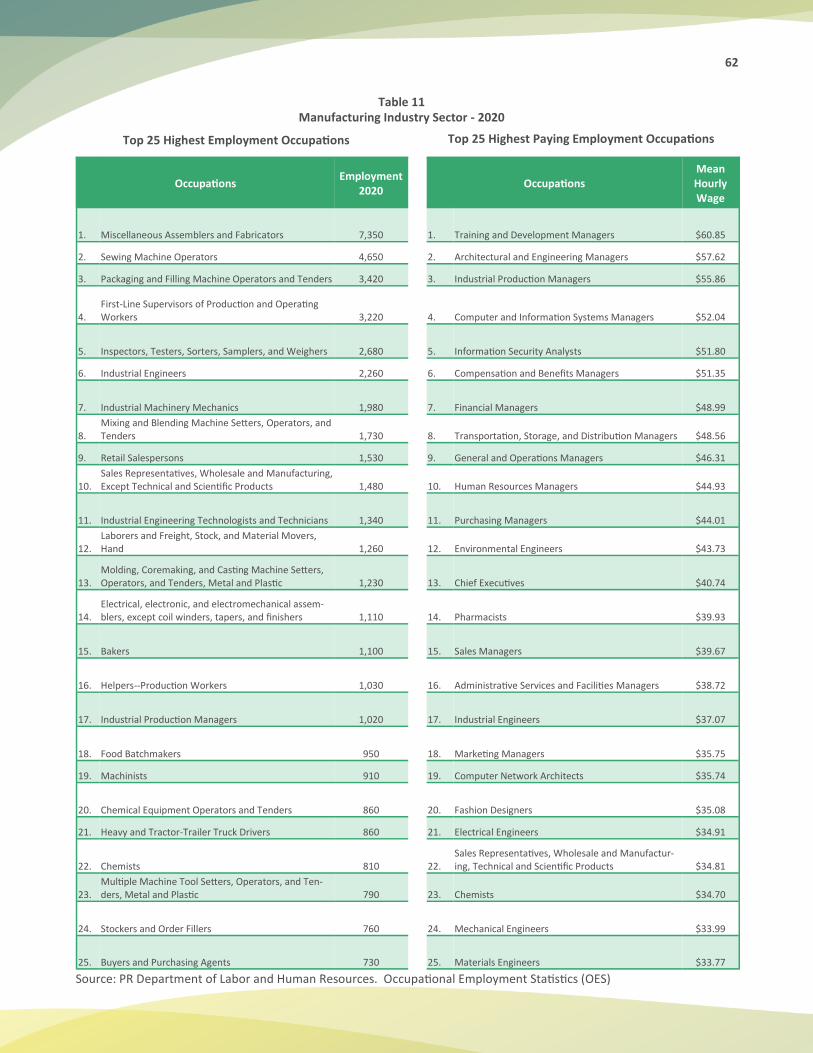
62
Source: PR Department of Labor and Human Resources. Occupational Employment Statistics (OES)
Top 25 Highest Employment Occupations Top 25 Highest Paying Employment Occupations
Table 11 Manufacturing Industry Sector - 2020
Occupations Employment
2020 Occupations
Mean Hourly Wage
1. Miscellaneous Assemblers and Fabricators 7,350 1. Training and Development Managers $60.85
2. Sewing Machine Operators 4,650 2. Architectural and Engineering Managers $57.62
3. Packaging and Filling Machine Operators and Tenders 3,420 3. Industrial Production Managers $55.86
4. First-Line Supervisors of Production and Operating Workers 3,220 4. Computer and Information Systems Managers $52.04
5. Inspectors, Testers, Sorters, Samplers, and Weighers 2,680 5. Information Security Analysts $51.80
6. Industrial Engineers 2,260 6. Compensation and Benefits Managers $51.35
7. Industrial Machinery Mechanics 1,980 7. Financial Managers $48.99
8. Mixing and Blending Machine Setters, Operators, and Tenders 1,730 8. Transportation, Storage, and Distribution Managers $48.56
9. Retail Salespersons 1,530 9. General and Operations Managers $46.31
10. Sales Representatives, Wholesale and Manufacturing, Except Technical and Scientific Products 1,480 10. Human Resources Managers $44.93
11. Industrial Engineering Technologists and Technicians 1,340 11. Purchasing Managers $44.01
12. Laborers and Freight, Stock, and Material Movers, Hand 1,260 12. Environmental Engineers $43.73
13. Molding, Coremaking, and Casting Machine Setters, Operators, and Tenders, Metal and Plastic 1,230 13. Chief Executives $40.74
14. Electrical, electronic, and electromechanical assem-blers, except coil winders, tapers, and finishers 1,110 14. Pharmacists $39.93
15. Bakers 1,100 15. Sales Managers $39.67
16. Helpers--Production Workers 1,030 16. Administrative Services and Facilities Managers $38.72
17. Industrial Production Managers 1,020 17. Industrial Engineers $37.07
18. Food Batchmakers 950 18. Marketing Managers $35.75
19. Machinists 910 19. Computer Network Architects $35.74
20. Chemical Equipment Operators and Tenders 860 20. Fashion Designers $35.08
21. Heavy and Tractor-Trailer Truck Drivers 860 21. Electrical Engineers $34.91
22. Chemists 810 22. Sales Representatives, Wholesale and Manufactur-ing, Technical and Scientific Products $34.81
23. Multiple Machine Tool Setters, Operators, and Ten-ders, Metal and Plastic 790 23. Chemists $34.70
24. Stockers and Order Fillers 760 24. Mechanical Engineers $33.99
25. Buyers and Purchasing Agents 730 25. Materials Engineers $33.77
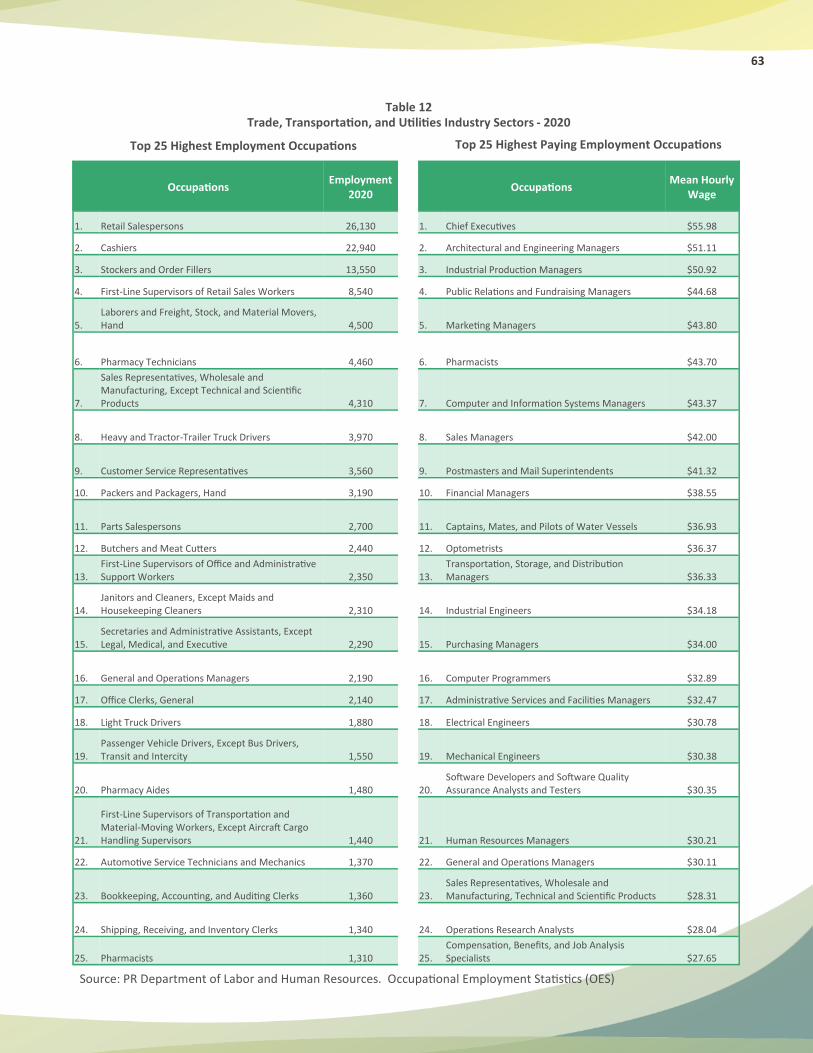
63
Source: PR Department of Labor and Human Resources. Occupational Employment Statistics (OES)
Top 25 Highest Employment Occupations Top 25 Highest Paying Employment Occupations
Table 12 Trade, Transportation, and Utilities Industry Sectors - 2020
Occupations Employment
2020 Occupations
Mean Hourly Wage
1. Retail Salespersons 26,130 1. Chief Executives $55.98
2. Cashiers 22,940 2. Architectural and Engineering Managers $51.11
3. Stockers and Order Fillers 13,550 3. Industrial Production Managers $50.92
4. First-Line Supervisors of Retail Sales Workers 8,540 4. Public Relations and Fundraising Managers $44.68
5. Laborers and Freight, Stock, and Material Movers, Hand 4,500 5. Marketing Managers $43.80
6. Pharmacy Technicians 4,460 6. Pharmacists $43.70
7.
Sales Representatives, Wholesale and Manufacturing, Except Technical and Scientific Products 4,310 7. Computer and Information Systems Managers $43.37
8. Heavy and Tractor-Trailer Truck Drivers 3,970 8. Sales Managers $42.00
9. Customer Service Representatives 3,560 9. Postmasters and Mail Superintendents $41.32
10. Packers and Packagers, Hand 3,190 10. Financial Managers $38.55
11. Parts Salespersons 2,700 11. Captains, Mates, and Pilots of Water Vessels $36.93
12. Butchers and Meat Cutters 2,440 12. Optometrists $36.37
13. First-Line Supervisors of Office and Administrative Support Workers 2,350 13.
Transportation, Storage, and Distribution Managers $36.33
14. Janitors and Cleaners, Except Maids and Housekeeping Cleaners 2,310 14. Industrial Engineers $34.18
15. Secretaries and Administrative Assistants, Except Legal, Medical, and Executive 2,290 15. Purchasing Managers $34.00
16. General and Operations Managers 2,190 16. Computer Programmers $32.89
17. Office Clerks, General 2,140 17. Administrative Services and Facilities Managers $32.47
18. Light Truck Drivers 1,880 18. Electrical Engineers $30.78
19. Passenger Vehicle Drivers, Except Bus Drivers, Transit and Intercity 1,550 19. Mechanical Engineers $30.38
20. Pharmacy Aides 1,480 20. Software Developers and Software Quality Assurance Analysts and Testers $30.35
21.
First-Line Supervisors of Transportation and Material-Moving Workers, Except Aircraft Cargo Handling Supervisors 1,440 21. Human Resources Managers $30.21
22. Automotive Service Technicians and Mechanics 1,370 22. General and Operations Managers $30.11
23. Bookkeeping, Accounting, and Auditing Clerks 1,360 23. Sales Representatives, Wholesale and Manufacturing, Technical and Scientific Products $28.31
24. Shipping, Receiving, and Inventory Clerks 1,340 24. Operations Research Analysts $28.04
25. Pharmacists 1,310 25. Compensation, Benefits, and Job Analysis Specialists $27.65
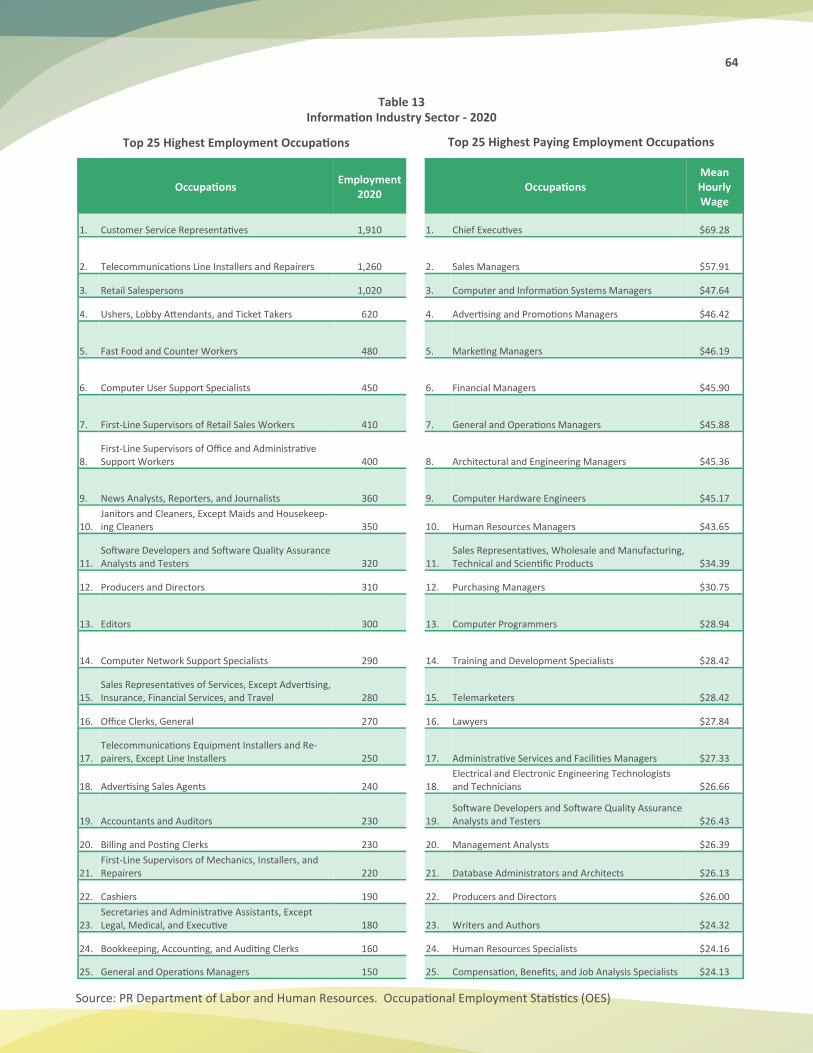
64
Source: PR Department of Labor and Human Resources. Occupational Employment Statistics (OES)
Top 25 Highest Employment Occupations Top 25 Highest Paying Employment Occupations
Table 13 Information Industry Sector - 2020
Occupations Employment
2020 Occupations
Mean Hourly Wage
1. Customer Service Representatives 1,910 1. Chief Executives $69.28
2. Telecommunications Line Installers and Repairers 1,260 2. Sales Managers $57.91
3. Retail Salespersons 1,020 3. Computer and Information Systems Managers $47.64
4. Ushers, Lobby Attendants, and Ticket Takers 620 4. Advertising and Promotions Managers $46.42
5. Fast Food and Counter Workers 480 5. Marketing Managers $46.19
6. Computer User Support Specialists 450 6. Financial Managers $45.90
7. First-Line Supervisors of Retail Sales Workers 410 7. General and Operations Managers $45.88
8. First-Line Supervisors of Office and Administrative Support Workers 400 8. Architectural and Engineering Managers $45.36
9. News Analysts, Reporters, and Journalists 360 9. Computer Hardware Engineers $45.17
10. Janitors and Cleaners, Except Maids and Housekeep-ing Cleaners 350 10. Human Resources Managers $43.65
11. Software Developers and Software Quality Assurance Analysts and Testers 320 11.
Sales Representatives, Wholesale and Manufacturing, Technical and Scientific Products $34.39
12. Producers and Directors 310 12. Purchasing Managers $30.75
13. Editors 300 13. Computer Programmers $28.94
14. Computer Network Support Specialists 290 14. Training and Development Specialists $28.42
15. Sales Representatives of Services, Except Advertising, Insurance, Financial Services, and Travel 280 15. Telemarketers $28.42
16. Office Clerks, General 270 16. Lawyers $27.84
17. Telecommunications Equipment Installers and Re-pairers, Except Line Installers 250 17. Administrative Services and Facilities Managers $27.33
18. Advertising Sales Agents 240 18. Electrical and Electronic Engineering Technologists and Technicians $26.66
19. Accountants and Auditors 230 19. Software Developers and Software Quality Assurance Analysts and Testers $26.43
20. Billing and Posting Clerks 230 20. Management Analysts $26.39
21. First-Line Supervisors of Mechanics, Installers, and Repairers 220 21. Database Administrators and Architects $26.13
22. Cashiers 190 22. Producers and Directors $26.00
23. Secretaries and Administrative Assistants, Except Legal, Medical, and Executive 180 23. Writers and Authors $24.32
24. Bookkeeping, Accounting, and Auditing Clerks 160 24. Human Resources Specialists $24.16
25. General and Operations Managers 150 25. Compensation, Benefits, and Job Analysis Specialists $24.13
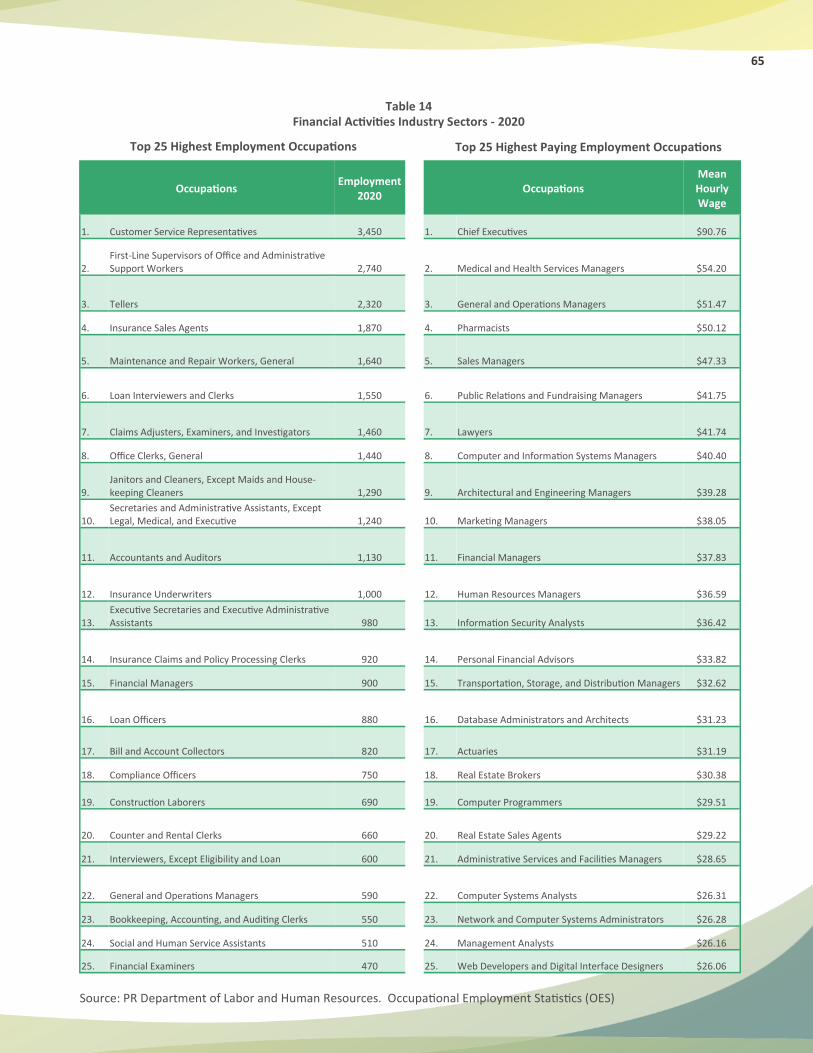
65
Source: PR Department of Labor and Human Resources. Occupational Employment Statistics (OES)
Top 25 Highest Employment Occupations Top 25 Highest Paying Employment Occupations
Table 14 Financial Activities Industry Sectors - 2020
Occupations Employment
2020 Occupations
Mean Hourly Wage
1. Customer Service Representatives 3,450 1. Chief Executives $90.76
2. First-Line Supervisors of Office and Administrative Support Workers 2,740 2. Medical and Health Services Managers $54.20
3. Tellers 2,320 3. General and Operations Managers $51.47
4. Insurance Sales Agents 1,870 4. Pharmacists $50.12
5. Maintenance and Repair Workers, General 1,640 5. Sales Managers $47.33
6. Loan Interviewers and Clerks 1,550 6. Public Relations and Fundraising Managers $41.75
7. Claims Adjusters, Examiners, and Investigators 1,460 7. Lawyers $41.74
8. Office Clerks, General 1,440 8. Computer and Information Systems Managers $40.40
9. Janitors and Cleaners, Except Maids and House-keeping Cleaners 1,290 9. Architectural and Engineering Managers $39.28
10. Secretaries and Administrative Assistants, Except Legal, Medical, and Executive 1,240 10. Marketing Managers $38.05
11. Accountants and Auditors 1,130 11. Financial Managers $37.83
12. Insurance Underwriters 1,000 12. Human Resources Managers $36.59
13. Executive Secretaries and Executive Administrative Assistants 980 13. Information Security Analysts $36.42
14. Insurance Claims and Policy Processing Clerks 920 14. Personal Financial Advisors $33.82
15. Financial Managers 900 15. Transportation, Storage, and Distribution Managers $32.62
16. Loan Officers 880 16. Database Administrators and Architects $31.23
17. Bill and Account Collectors 820 17. Actuaries $31.19
18. Compliance Officers 750 18. Real Estate Brokers $30.38
19. Construction Laborers 690 19. Computer Programmers $29.51
20. Counter and Rental Clerks 660 20. Real Estate Sales Agents $29.22
21. Interviewers, Except Eligibility and Loan 600 21. Administrative Services and Facilities Managers $28.65
22. General and Operations Managers 590 22. Computer Systems Analysts $26.31
23. Bookkeeping, Accounting, and Auditing Clerks 550 23. Network and Computer Systems Administrators $26.28
24. Social and Human Service Assistants 510 24. Management Analysts $26.16
25. Financial Examiners 470 25. Web Developers and Digital Interface Designers $26.06
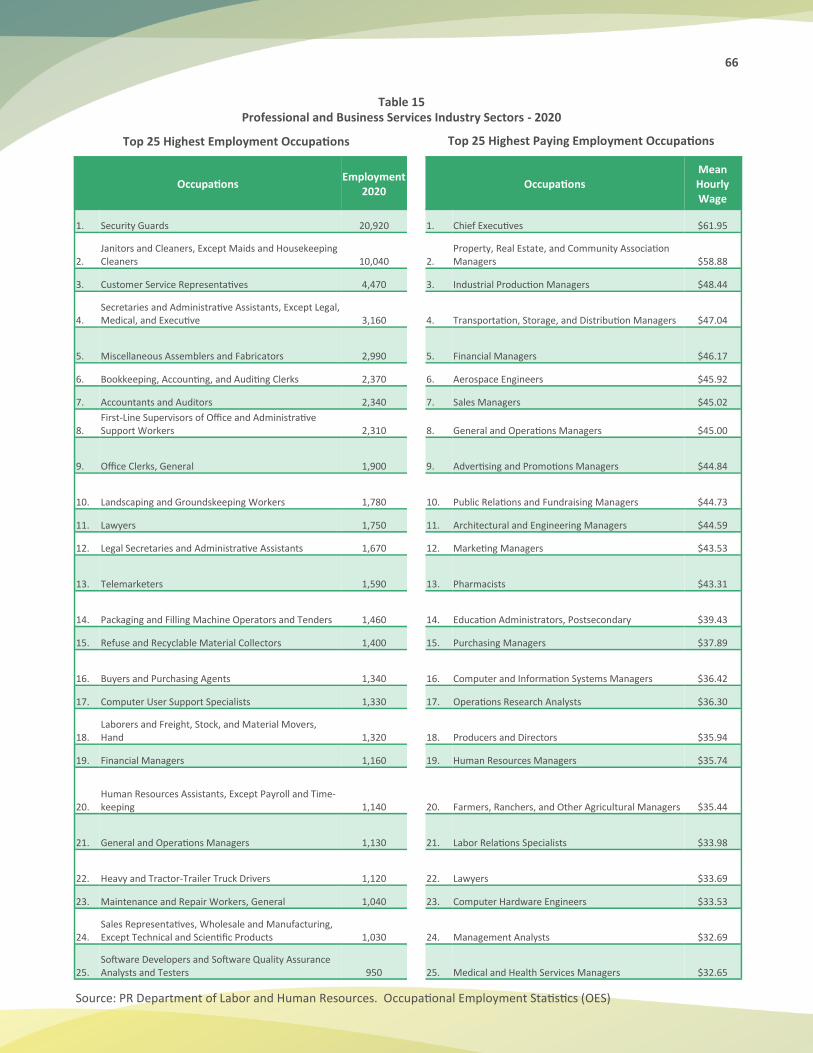
66
Source: PR Department of Labor and Human Resources. Occupational Employment Statistics (OES)
Top 25 Highest Employment Occupations Top 25 Highest Paying Employment Occupations
Table 15 Professional and Business Services Industry Sectors - 2020
Occupations Employment
2020 Occupations
Mean Hourly Wage
1. Security Guards 20,920 1. Chief Executives $61.95
2. Janitors and Cleaners, Except Maids and Housekeeping Cleaners 10,040 2.
Property, Real Estate, and Community Association Managers $58.88
3. Customer Service Representatives 4,470 3. Industrial Production Managers $48.44
4. Secretaries and Administrative Assistants, Except Legal, Medical, and Executive 3,160 4. Transportation, Storage, and Distribution Managers $47.04
5. Miscellaneous Assemblers and Fabricators 2,990 5. Financial Managers $46.17
6. Bookkeeping, Accounting, and Auditing Clerks 2,370 6. Aerospace Engineers $45.92
7. Accountants and Auditors 2,340 7. Sales Managers $45.02
8. First-Line Supervisors of Office and Administrative Support Workers 2,310 8. General and Operations Managers $45.00
9. Office Clerks, General 1,900 9. Advertising and Promotions Managers $44.84
10. Landscaping and Groundskeeping Workers 1,780 10. Public Relations and Fundraising Managers $44.73
11. Lawyers 1,750 11. Architectural and Engineering Managers $44.59
12. Legal Secretaries and Administrative Assistants 1,670 12. Marketing Managers $43.53
13. Telemarketers 1,590 13. Pharmacists $43.31
14. Packaging and Filling Machine Operators and Tenders 1,460 14. Education Administrators, Postsecondary $39.43
15. Refuse and Recyclable Material Collectors 1,400 15. Purchasing Managers $37.89
16. Buyers and Purchasing Agents 1,340 16. Computer and Information Systems Managers $36.42
17. Computer User Support Specialists 1,330 17. Operations Research Analysts $36.30
18. Laborers and Freight, Stock, and Material Movers, Hand 1,320 18. Producers and Directors $35.94
19. Financial Managers 1,160 19. Human Resources Managers $35.74
20. Human Resources Assistants, Except Payroll and Time-keeping 1,140 20. Farmers, Ranchers, and Other Agricultural Managers $35.44
21. General and Operations Managers 1,130 21. Labor Relations Specialists $33.98
22. Heavy and Tractor-Trailer Truck Drivers 1,120 22. Lawyers $33.69
23. Maintenance and Repair Workers, General 1,040 23. Computer Hardware Engineers $33.53
24. Sales Representatives, Wholesale and Manufacturing, Except Technical and Scientific Products 1,030 24. Management Analysts $32.69
25. Software Developers and Software Quality Assurance Analysts and Testers 950 25. Medical and Health Services Managers $32.65
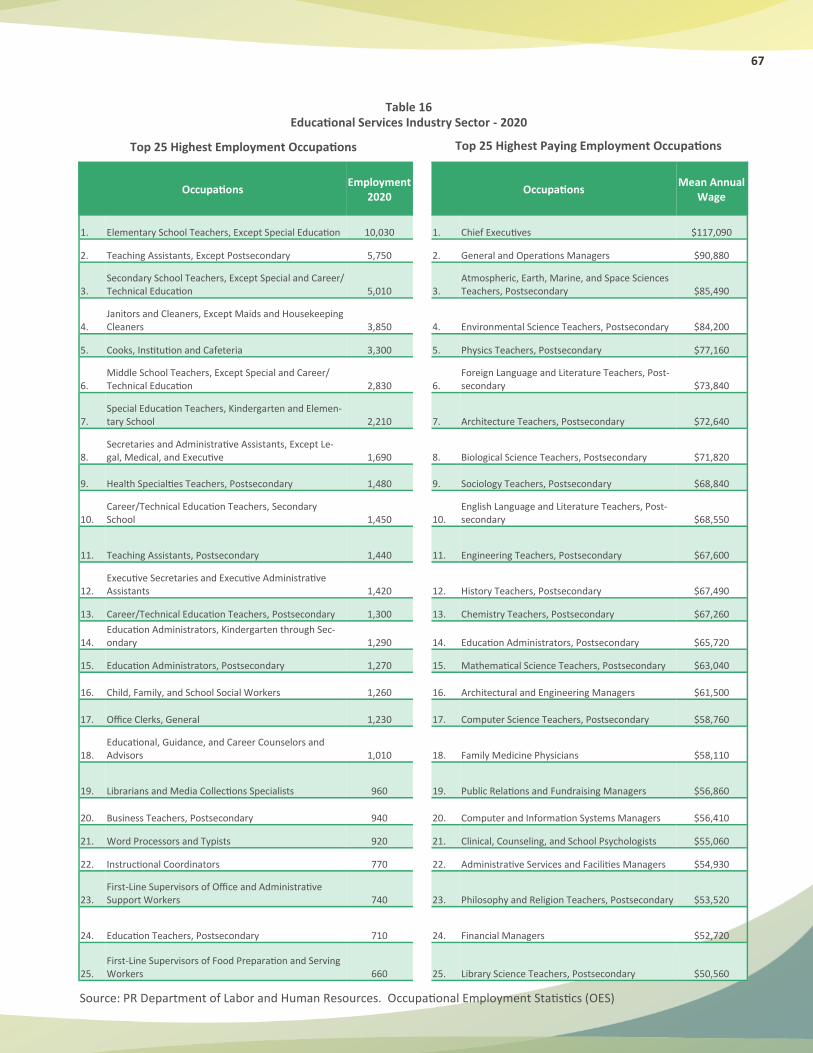
67
Source: PR Department of Labor and Human Resources. Occupational Employment Statistics (OES)
Top 25 Highest Employment Occupations Top 25 Highest Paying Employment Occupations
Table 16 Educational Services Industry Sector - 2020
Occupations Employment
2020 Occupations
Mean Annual Wage
1. Elementary School Teachers, Except Special Education 10,030 1. Chief Executives $117,090
2. Teaching Assistants, Except Postsecondary 5,750 2. General and Operations Managers $90,880
3. Secondary School Teachers, Except Special and Career/Technical Education 5,010 3.
Atmospheric, Earth, Marine, and Space Sciences Teachers, Postsecondary $85,490
4. Janitors and Cleaners, Except Maids and Housekeeping Cleaners 3,850 4. Environmental Science Teachers, Postsecondary $84,200
5. Cooks, Institution and Cafeteria 3,300 5. Physics Teachers, Postsecondary $77,160
6. Middle School Teachers, Except Special and Career/Technical Education 2,830 6.
Foreign Language and Literature Teachers, Post-secondary $73,840
7. Special Education Teachers, Kindergarten and Elemen-tary School 2,210 7. Architecture Teachers, Postsecondary $72,640
8. Secretaries and Administrative Assistants, Except Le-gal, Medical, and Executive 1,690 8. Biological Science Teachers, Postsecondary $71,820
9. Health Specialties Teachers, Postsecondary 1,480 9. Sociology Teachers, Postsecondary $68,840
10. Career/Technical Education Teachers, Secondary School 1,450 10.
English Language and Literature Teachers, Post-secondary $68,550
11. Teaching Assistants, Postsecondary 1,440 11. Engineering Teachers, Postsecondary $67,600
12. Executive Secretaries and Executive Administrative Assistants 1,420 12. History Teachers, Postsecondary $67,490
13. Career/Technical Education Teachers, Postsecondary 1,300 13. Chemistry Teachers, Postsecondary $67,260
14. Education Administrators, Kindergarten through Sec-ondary 1,290 14. Education Administrators, Postsecondary $65,720
15. Education Administrators, Postsecondary 1,270 15. Mathematical Science Teachers, Postsecondary $63,040
16. Child, Family, and School Social Workers 1,260 16. Architectural and Engineering Managers $61,500
17. Office Clerks, General 1,230 17. Computer Science Teachers, Postsecondary $58,760
18. Educational, Guidance, and Career Counselors and Advisors 1,010 18. Family Medicine Physicians $58,110
19. Librarians and Media Collections Specialists 960 19. Public Relations and Fundraising Managers $56,860
20. Business Teachers, Postsecondary 940 20. Computer and Information Systems Managers $56,410
21. Word Processors and Typists 920 21. Clinical, Counseling, and School Psychologists $55,060
22. Instructional Coordinators 770 22. Administrative Services and Facilities Managers $54,930
23. First-Line Supervisors of Office and Administrative Support Workers 740 23. Philosophy and Religion Teachers, Postsecondary $53,520
24. Education Teachers, Postsecondary 710 24. Financial Managers $52,720
25. First-Line Supervisors of Food Preparation and Serving Workers 660 25. Library Science Teachers, Postsecondary $50,560
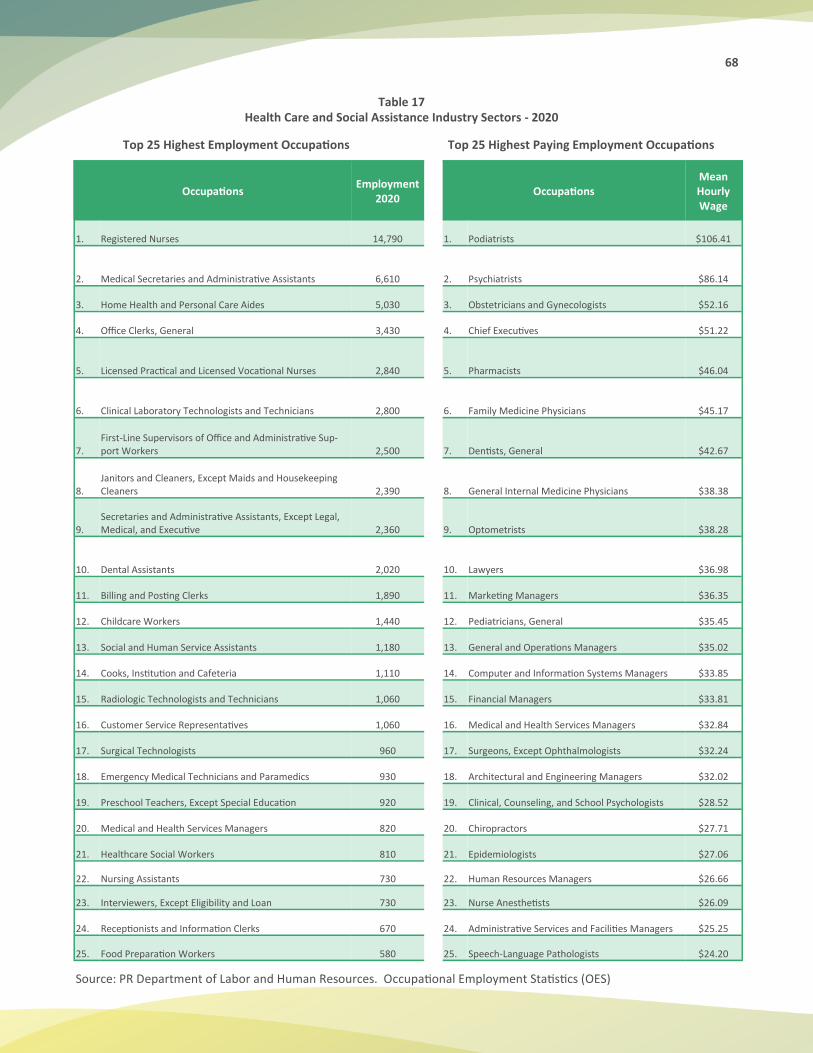
68
Source: PR Department of Labor and Human Resources. Occupational Employment Statistics (OES)
Top 25 Highest Employment Occupations Top 25 Highest Paying Employment Occupations
Table 17 Health Care and Social Assistance Industry Sectors - 2020
Occupations Employment
2020 Occupations
Mean Hourly Wage
1. Registered Nurses 14,790 1. Podiatrists $106.41
2. Medical Secretaries and Administrative Assistants 6,610 2. Psychiatrists $86.14
3. Home Health and Personal Care Aides 5,030 3. Obstetricians and Gynecologists $52.16
4. Office Clerks, General 3,430 4. Chief Executives $51.22
5. Licensed Practical and Licensed Vocational Nurses 2,840 5. Pharmacists $46.04
6. Clinical Laboratory Technologists and Technicians 2,800 6. Family Medicine Physicians $45.17
7. First-Line Supervisors of Office and Administrative Sup-port Workers 2,500 7. Dentists, General $42.67
8. Janitors and Cleaners, Except Maids and Housekeeping Cleaners 2,390 8. General Internal Medicine Physicians $38.38
9. Secretaries and Administrative Assistants, Except Legal, Medical, and Executive 2,360 9. Optometrists $38.28
10. Dental Assistants 2,020 10. Lawyers $36.98
11. Billing and Posting Clerks 1,890 11. Marketing Managers $36.35
12. Childcare Workers 1,440 12. Pediatricians, General $35.45
13. Social and Human Service Assistants 1,180 13. General and Operations Managers $35.02
14. Cooks, Institution and Cafeteria 1,110 14. Computer and Information Systems Managers $33.85
15. Radiologic Technologists and Technicians 1,060 15. Financial Managers $33.81
16. Customer Service Representatives 1,060 16. Medical and Health Services Managers $32.84
17. Surgical Technologists 960 17. Surgeons, Except Ophthalmologists $32.24
18. Emergency Medical Technicians and Paramedics 930 18. Architectural and Engineering Managers $32.02
19. Preschool Teachers, Except Special Education 920 19. Clinical, Counseling, and School Psychologists $28.52
20. Medical and Health Services Managers 820 20. Chiropractors $27.71
21. Healthcare Social Workers 810 21. Epidemiologists $27.06
22. Nursing Assistants 730 22. Human Resources Managers $26.66
23. Interviewers, Except Eligibility and Loan 730 23. Nurse Anesthetists $26.09
24. Receptionists and Information Clerks 670 24. Administrative Services and Facilities Managers $25.25
25. Food Preparation Workers 580 25. Speech-Language Pathologists $24.20
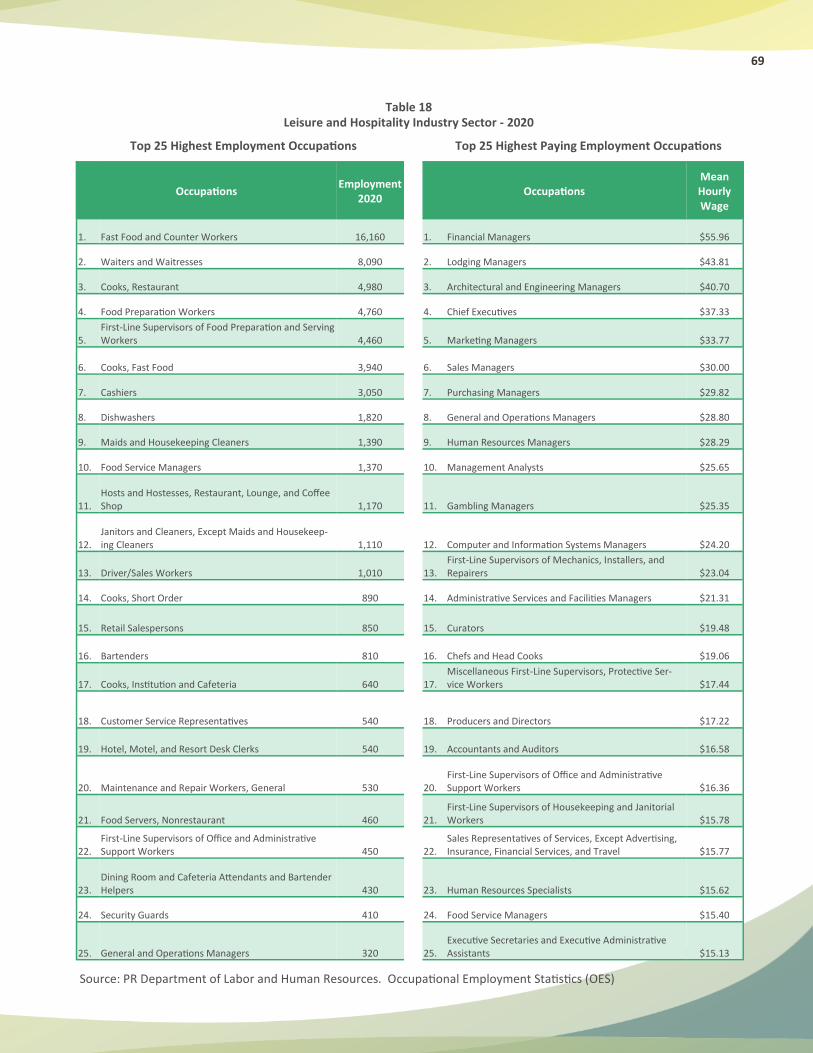
69
Source: PR Department of Labor and Human Resources. Occupational Employment Statistics (OES)
Top 25 Highest Employment Occupations Top 25 Highest Paying Employment Occupations
Table 18 Leisure and Hospitality Industry Sector - 2020
Occupations Employment
2020 Occupations
Mean Hourly Wage
1. Fast Food and Counter Workers 16,160 1. Financial Managers $55.96
2. Waiters and Waitresses 8,090 2. Lodging Managers $43.81
3. Cooks, Restaurant 4,980 3. Architectural and Engineering Managers $40.70
4. Food Preparation Workers 4,760 4. Chief Executives $37.33
5. First-Line Supervisors of Food Preparation and Serving Workers 4,460 5. Marketing Managers $33.77
6. Cooks, Fast Food 3,940 6. Sales Managers $30.00
7. Cashiers 3,050 7. Purchasing Managers $29.82
8. Dishwashers 1,820 8. General and Operations Managers $28.80
9. Maids and Housekeeping Cleaners 1,390 9. Human Resources Managers $28.29
10. Food Service Managers 1,370 10. Management Analysts $25.65
11. Hosts and Hostesses, Restaurant, Lounge, and Coffee Shop 1,170 11. Gambling Managers $25.35
12. Janitors and Cleaners, Except Maids and Housekeep-ing Cleaners 1,110 12. Computer and Information Systems Managers $24.20
13. Driver/Sales Workers 1,010 13. First-Line Supervisors of Mechanics, Installers, and Repairers $23.04
14. Cooks, Short Order 890 14. Administrative Services and Facilities Managers $21.31
15. Retail Salespersons 850 15. Curators $19.48
16. Bartenders 810 16. Chefs and Head Cooks $19.06
17. Cooks, Institution and Cafeteria 640 17. Miscellaneous First-Line Supervisors, Protective Ser-vice Workers $17.44
18. Customer Service Representatives 540 18. Producers and Directors $17.22
19. Hotel, Motel, and Resort Desk Clerks 540 19. Accountants and Auditors $16.58
20. Maintenance and Repair Workers, General 530 20. First-Line Supervisors of Office and Administrative Support Workers $16.36
21. Food Servers, Nonrestaurant 460 21. First-Line Supervisors of Housekeeping and Janitorial Workers $15.78
22. First-Line Supervisors of Office and Administrative Support Workers 450 22.
Sales Representatives of Services, Except Advertising, Insurance, Financial Services, and Travel $15.77
23. Dining Room and Cafeteria Attendants and Bartender Helpers 430 23. Human Resources Specialists $15.62
24. Security Guards 410 24. Food Service Managers $15.40
25. General and Operations Managers 320 25. Executive Secretaries and Executive Administrative Assistants $15.13
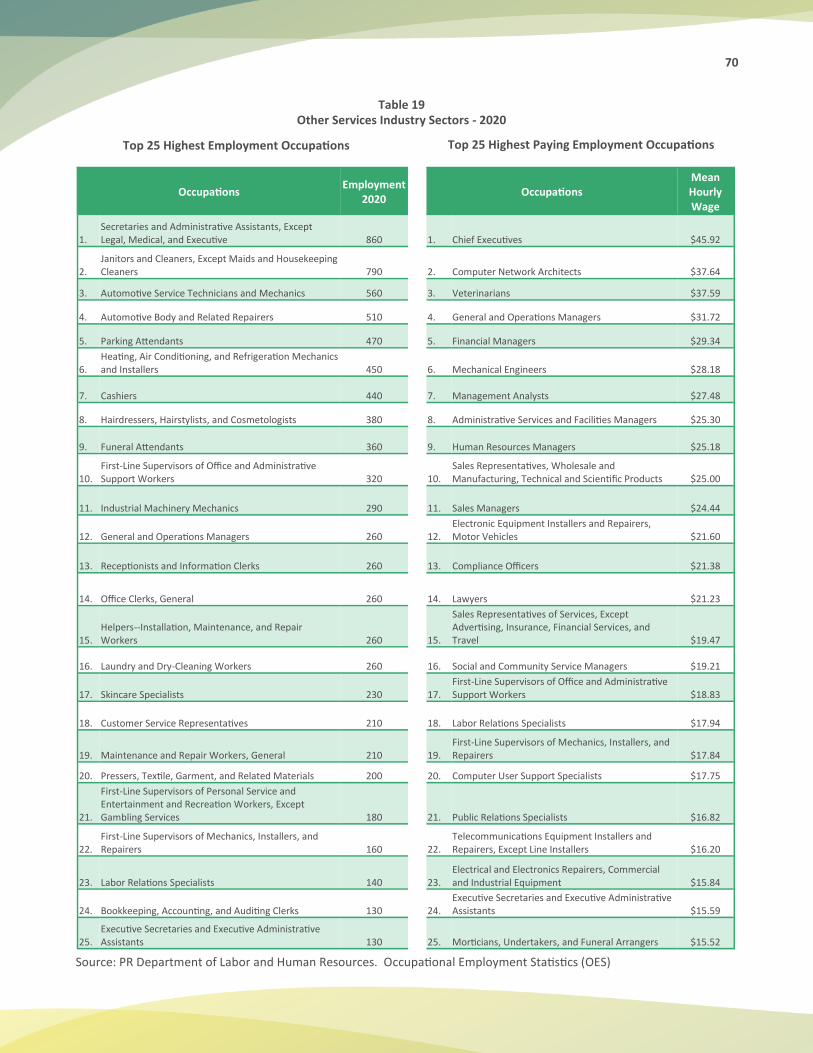
70
Source: PR Department of Labor and Human Resources. Occupational Employment Statistics (OES)
Top 25 Highest Employment Occupations Top 25 Highest Paying Employment Occupations
Table 19 Other Services Industry Sectors - 2020
Occupations Employment
2020 Occupations
Mean Hourly Wage
1. Secretaries and Administrative Assistants, Except Legal, Medical, and Executive 860 1. Chief Executives $45.92
2. Janitors and Cleaners, Except Maids and Housekeeping Cleaners 790 2. Computer Network Architects $37.64
3. Automotive Service Technicians and Mechanics 560 3. Veterinarians $37.59
4. Automotive Body and Related Repairers 510 4. General and Operations Managers $31.72
5. Parking Attendants 470 5. Financial Managers $29.34
6. Heating, Air Conditioning, and Refrigeration Mechanics and Installers 450 6. Mechanical Engineers $28.18
7. Cashiers 440 7. Management Analysts $27.48
8. Hairdressers, Hairstylists, and Cosmetologists 380 8. Administrative Services and Facilities Managers $25.30
9. Funeral Attendants 360 9. Human Resources Managers $25.18
10. First-Line Supervisors of Office and Administrative Support Workers 320 10.
Sales Representatives, Wholesale and Manufacturing, Technical and Scientific Products $25.00
11. Industrial Machinery Mechanics 290 11. Sales Managers $24.44
12. General and Operations Managers 260 12. Electronic Equipment Installers and Repairers, Motor Vehicles $21.60
13. Receptionists and Information Clerks 260 13. Compliance Officers $21.38
14. Office Clerks, General 260 14. Lawyers $21.23
15. Helpers--Installation, Maintenance, and Repair Workers 260 15.
Sales Representatives of Services, Except Advertising, Insurance, Financial Services, and Travel $19.47
16. Laundry and Dry-Cleaning Workers 260 16. Social and Community Service Managers $19.21
17. Skincare Specialists 230 17. First-Line Supervisors of Office and Administrative Support Workers $18.83
18. Customer Service Representatives 210 18. Labor Relations Specialists $17.94
19. Maintenance and Repair Workers, General 210 19. First-Line Supervisors of Mechanics, Installers, and Repairers $17.84
20. Pressers, Textile, Garment, and Related Materials 200 20. Computer User Support Specialists $17.75
21.
First-Line Supervisors of Personal Service and Entertainment and Recreation Workers, Except Gambling Services 180 21. Public Relations Specialists $16.82
22. First-Line Supervisors of Mechanics, Installers, and Repairers 160 22.
Telecommunications Equipment Installers and Repairers, Except Line Installers $16.20
23. Labor Relations Specialists 140 23. Electrical and Electronics Repairers, Commercial and Industrial Equipment $15.84
24. Bookkeeping, Accounting, and Auditing Clerks 130 24. Executive Secretaries and Executive Administrative Assistants $15.59
25. Executive Secretaries and Executive Administrative Assistants 130 25. Morticians, Undertakers, and Funeral Arrangers $15.52
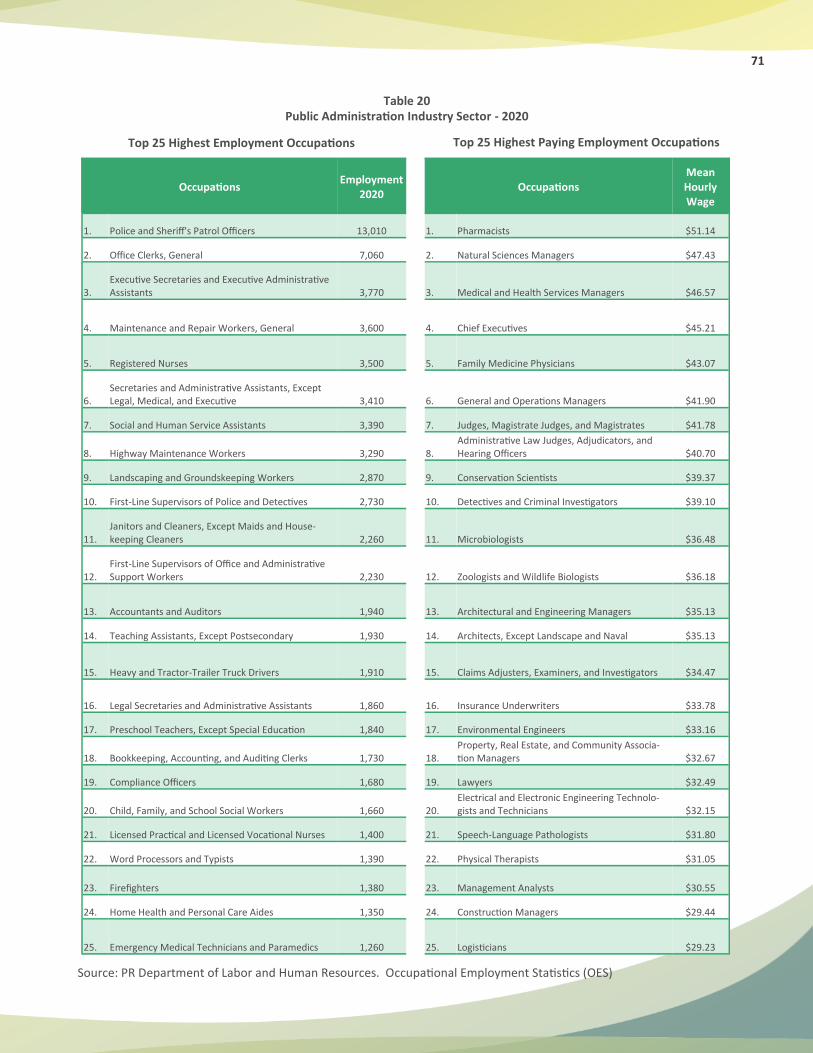
71
Source: PR Department of Labor and Human Resources. Occupational Employment Statistics (OES)
Top 25 Highest Employment Occupations Top 25 Highest Paying Employment Occupations
Table 20 Public Administration Industry Sector - 2020
Occupations Employment
2020 Occupations
Mean Hourly Wage
1. Police and Sheriff's Patrol Officers 13,010 1. Pharmacists $51.14
2. Office Clerks, General 7,060 2. Natural Sciences Managers $47.43
3. Executive Secretaries and Executive Administrative Assistants 3,770 3. Medical and Health Services Managers $46.57
4. Maintenance and Repair Workers, General 3,600 4. Chief Executives $45.21
5. Registered Nurses 3,500 5. Family Medicine Physicians $43.07
6. Secretaries and Administrative Assistants, Except Legal, Medical, and Executive 3,410 6. General and Operations Managers $41.90
7. Social and Human Service Assistants 3,390 7. Judges, Magistrate Judges, and Magistrates $41.78
8. Highway Maintenance Workers 3,290 8. Administrative Law Judges, Adjudicators, and Hearing Officers $40.70
9. Landscaping and Groundskeeping Workers 2,870 9. Conservation Scientists $39.37
10. First-Line Supervisors of Police and Detectives 2,730 10. Detectives and Criminal Investigators $39.10
11. Janitors and Cleaners, Except Maids and House-keeping Cleaners 2,260 11. Microbiologists $36.48
12. First-Line Supervisors of Office and Administrative Support Workers 2,230 12. Zoologists and Wildlife Biologists $36.18
13. Accountants and Auditors 1,940 13. Architectural and Engineering Managers $35.13
14. Teaching Assistants, Except Postsecondary 1,930 14. Architects, Except Landscape and Naval $35.13
15. Heavy and Tractor-Trailer Truck Drivers 1,910 15. Claims Adjusters, Examiners, and Investigators $34.47
16. Legal Secretaries and Administrative Assistants 1,860 16. Insurance Underwriters $33.78
17. Preschool Teachers, Except Special Education 1,840 17. Environmental Engineers $33.16
18. Bookkeeping, Accounting, and Auditing Clerks 1,730 18. Property, Real Estate, and Community Associa-tion Managers $32.67
19. Compliance Officers 1,680 19. Lawyers $32.49
20. Child, Family, and School Social Workers 1,660 20. Electrical and Electronic Engineering Technolo-gists and Technicians $32.15
21. Licensed Practical and Licensed Vocational Nurses 1,400 21. Speech-Language Pathologists $31.80
22. Word Processors and Typists 1,390 22. Physical Therapists $31.05
23. Firefighters 1,380 23. Management Analysts $30.55
24. Home Health and Personal Care Aides 1,350 24. Construction Managers $29.44
25. Emergency Medical Technicians and Paramedics 1,260 25. Logisticians $29.23
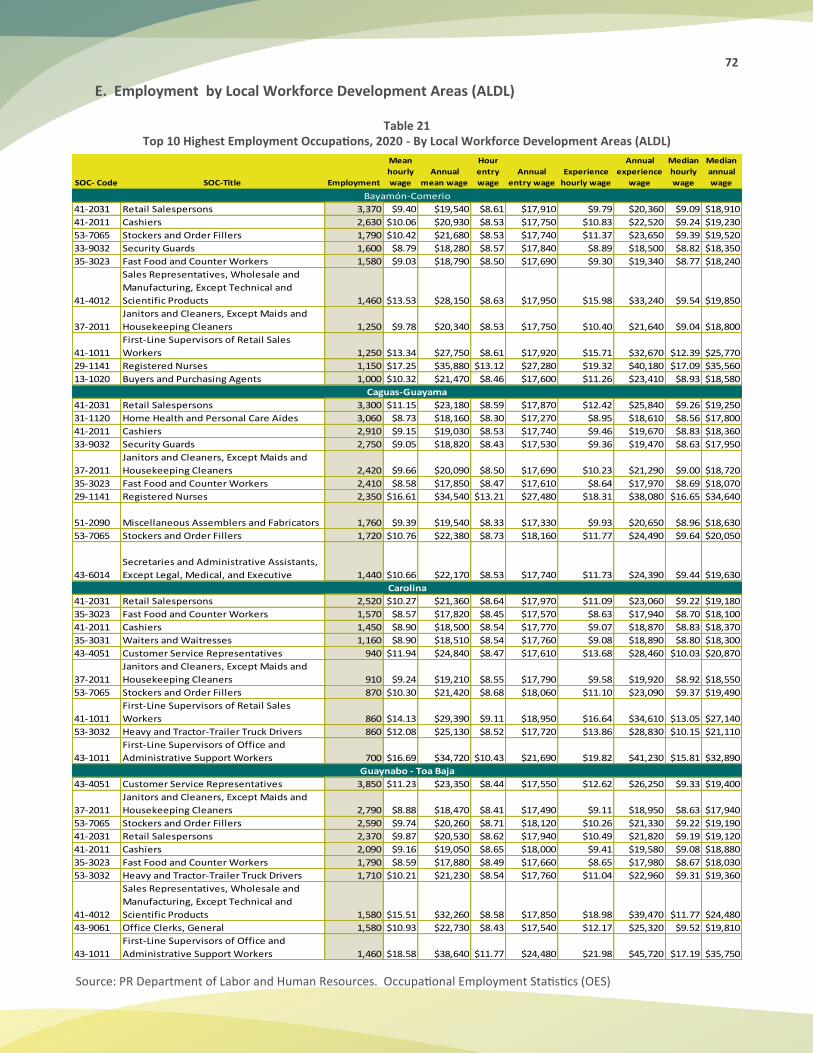
72
E. Employment by Local Workforce Development Areas (ALDL)
Table 21 Top 10 Highest Employment Occupations, 2020 - By Local Workforce Development Areas (ALDL)
Source: PR Department of Labor and Human Resources. Occupational Employment Statistics (OES)
SOC- Code SOC-Title Employment
Mean
hourly
wage
Annual
mean wage
Hour
entry
wage
Annual
entry wage
Experience
hourly wage
Annual
experience
wage
Median
hourly
wage
Median
annual
wage
41-2031 Retail Salespersons 3,370 $9.40 $19,540 $8.61 $17,910 $9.79 $20,360 $9.09 $18,910
41-2011 Cashiers 2,630 $10.06 $20,930 $8.53 $17,750 $10.83 $22,520 $9.24 $19,230
53-7065 Stockers and Order Fillers 1,790 $10.42 $21,680 $8.53 $17,740 $11.37 $23,650 $9.39 $19,520
33-9032 Security Guards 1,600 $8.79 $18,280 $8.57 $17,840 $8.89 $18,500 $8.82 $18,350
35-3023 Fast Food and Counter Workers 1,580 $9.03 $18,790 $8.50 $17,690 $9.30 $19,340 $8.77 $18,240
41-4012
Sales Representatives, Wholesale and
Manufacturing, Except Technical and
Scientific Products 1,460 $13.53 $28,150 $8.63 $17,950 $15.98 $33,240 $9.54 $19,850
37-2011
Janitors and Cleaners, Except Maids and
Housekeeping Cleaners 1,250 $9.78 $20,340 $8.53 $17,750 $10.40 $21,640 $9.04 $18,800
41-1011
First-Line Supervisors of Retail Sales
Workers 1,250 $13.34 $27,750 $8.61 $17,920 $15.71 $32,670 $12.39 $25,770
29-1141 Registered Nurses 1,150 $17.25 $35,880 $13.12 $27,280 $19.32 $40,180 $17.09 $35,560
13-1020 Buyers and Purchasing Agents 1,000 $10.32 $21,470 $8.46 $17,600 $11.26 $23,410 $8.93 $18,580
41-2031 Retail Salespersons 3,300 $11.15 $23,180 $8.59 $17,870 $12.42 $25,840 $9.26 $19,250
31-1120 Home Health and Personal Care Aides 3,060 $8.73 $18,160 $8.30 $17,270 $8.95 $18,610 $8.56 $17,800
41-2011 Cashiers 2,910 $9.15 $19,030 $8.53 $17,740 $9.46 $19,670 $8.83 $18,360
33-9032 Security Guards 2,750 $9.05 $18,820 $8.43 $17,530 $9.36 $19,470 $8.63 $17,950
37-2011
Janitors and Cleaners, Except Maids and
Housekeeping Cleaners 2,420 $9.66 $20,090 $8.50 $17,690 $10.23 $21,290 $9.00 $18,720
35-3023 Fast Food and Counter Workers 2,410 $8.58 $17,850 $8.47 $17,610 $8.64 $17,970 $8.69 $18,070
29-1141 Registered Nurses 2,350 $16.61 $34,540 $13.21 $27,480 $18.31 $38,080 $16.65 $34,640
51-2090 Miscellaneous Assemblers and Fabricators 1,760 $9.39 $19,540 $8.33 $17,330 $9.93 $20,650 $8.96 $18,630
53-7065 Stockers and Order Fillers 1,720 $10.76 $22,380 $8.73 $18,160 $11.77 $24,490 $9.64 $20,050
43-6014
Secretaries and Administrative Assistants,
Except Legal, Medical, and Executive 1,440 $10.66 $22,170 $8.53 $17,740 $11.73 $24,390 $9.44 $19,630
41-2031 Retail Salespersons 2,520 $10.27 $21,360 $8.64 $17,970 $11.09 $23,060 $9.22 $19,180
35-3023 Fast Food and Counter Workers 1,570 $8.57 $17,820 $8.45 $17,570 $8.63 $17,940 $8.70 $18,100
41-2011 Cashiers 1,450 $8.90 $18,500 $8.54 $17,770 $9.07 $18,870 $8.83 $18,370
35-3031 Waiters and Waitresses 1,160 $8.90 $18,510 $8.54 $17,760 $9.08 $18,890 $8.80 $18,300
43-4051 Customer Service Representatives 940 $11.94 $24,840 $8.47 $17,610 $13.68 $28,460 $10.03 $20,870
37-2011
Janitors and Cleaners, Except Maids and
Housekeeping Cleaners 910 $9.24 $19,210 $8.55 $17,790 $9.58 $19,920 $8.92 $18,550
53-7065 Stockers and Order Fillers 870 $10.30 $21,420 $8.68 $18,060 $11.10 $23,090 $9.37 $19,490
41-1011
First-Line Supervisors of Retail Sales
Workers 860 $14.13 $29,390 $9.11 $18,950 $16.64 $34,610 $13.05 $27,140
53-3032 Heavy and Tractor-Trailer Truck Drivers 860 $12.08 $25,130 $8.52 $17,720 $13.86 $28,830 $10.15 $21,110
43-1011
First-Line Supervisors of Office and
Administrative Support Workers 700 $16.69 $34,720 $10.43 $21,690 $19.82 $41,230 $15.81 $32,890
43-4051 Customer Service Representatives 3,850 $11.23 $23,350 $8.44 $17,550 $12.62 $26,250 $9.33 $19,400
37-2011
Janitors and Cleaners, Except Maids and
Housekeeping Cleaners 2,790 $8.88 $18,470 $8.41 $17,490 $9.11 $18,950 $8.63 $17,940
53-7065 Stockers and Order Fillers 2,590 $9.74 $20,260 $8.71 $18,120 $10.26 $21,330 $9.22 $19,190
41-2031 Retail Salespersons 2,370 $9.87 $20,530 $8.62 $17,940 $10.49 $21,820 $9.19 $19,120
41-2011 Cashiers 2,090 $9.16 $19,050 $8.65 $18,000 $9.41 $19,580 $9.08 $18,880
35-3023 Fast Food and Counter Workers 1,790 $8.59 $17,880 $8.49 $17,660 $8.65 $17,980 $8.67 $18,030
53-3032 Heavy and Tractor-Trailer Truck Drivers 1,710 $10.21 $21,230 $8.54 $17,760 $11.04 $22,960 $9.31 $19,360
41-4012
Sales Representatives, Wholesale and
Manufacturing, Except Technical and
Scientific Products 1,580 $15.51 $32,260 $8.58 $17,850 $18.98 $39,470 $11.77 $24,480
43-9061 Office Clerks, General 1,580 $10.93 $22,730 $8.43 $17,540 $12.17 $25,320 $9.52 $19,810
43-1011
First-Line Supervisors of Office and
Administrative Support Workers 1,460 $18.58 $38,640 $11.77 $24,480 $21.98 $45,720 $17.19 $35,750
Bayamón-Comerio
Caguas-Guayama
Carolina
Guaynabo - Toa Baja
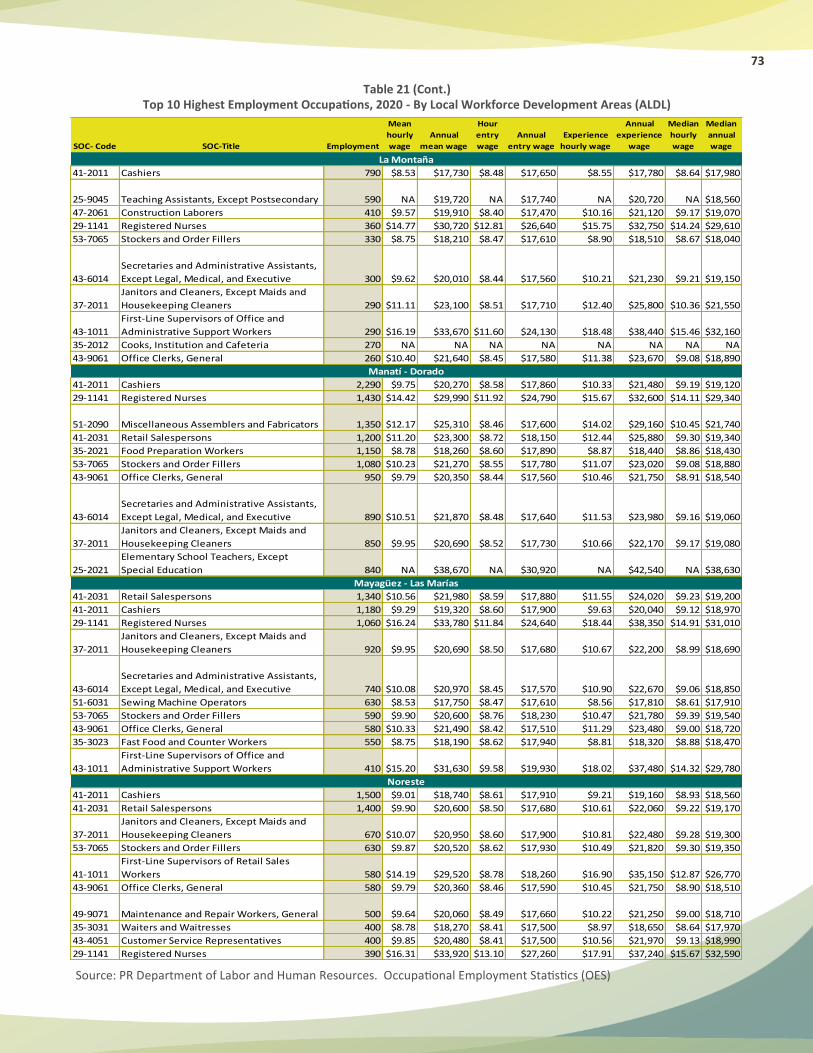
73
Table 21 (Cont.) Top 10 Highest Employment Occupations, 2020 - By Local Workforce Development Areas (ALDL)
Source: PR Department of Labor and Human Resources. Occupational Employment Statistics (OES)
SOC- Code SOC-Title Employment
Mean
hourly
wage
Annual
mean wage
Hour
entry
wage
Annual
entry wage
Experience
hourly wage
Annual
experience
wage
Median
hourly
wage
Median
annual
wage
41-2011 Cashiers 790 $8.53 $17,730 $8.48 $17,650 $8.55 $17,780 $8.64 $17,980
25-9045 Teaching Assistants, Except Postsecondary 590 NA $19,720 NA $17,740 NA $20,720 NA $18,560
47-2061 Construction Laborers 410 $9.57 $19,910 $8.40 $17,470 $10.16 $21,120 $9.17 $19,070
29-1141 Registered Nurses 360 $14.77 $30,720 $12.81 $26,640 $15.75 $32,750 $14.24 $29,610
53-7065 Stockers and Order Fillers 330 $8.75 $18,210 $8.47 $17,610 $8.90 $18,510 $8.67 $18,040
43-6014
Secretaries and Administrative Assistants,
Except Legal, Medical, and Executive 300 $9.62 $20,010 $8.44 $17,560 $10.21 $21,230 $9.21 $19,150
37-2011
Janitors and Cleaners, Except Maids and
Housekeeping Cleaners 290 $11.11 $23,100 $8.51 $17,710 $12.40 $25,800 $10.36 $21,550
43-1011
First-Line Supervisors of Office and
Administrative Support Workers 290 $16.19 $33,670 $11.60 $24,130 $18.48 $38,440 $15.46 $32,160
35-2012 Cooks, Institution and Cafeteria 270 NA NA NA NA NA NA NA NA
43-9061 Office Clerks, General 260 $10.40 $21,640 $8.45 $17,580 $11.38 $23,670 $9.08 $18,890
41-2011 Cashiers 2,290 $9.75 $20,270 $8.58 $17,860 $10.33 $21,480 $9.19 $19,120
29-1141 Registered Nurses 1,430 $14.42 $29,990 $11.92 $24,790 $15.67 $32,600 $14.11 $29,340
51-2090 Miscellaneous Assemblers and Fabricators 1,350 $12.17 $25,310 $8.46 $17,600 $14.02 $29,160 $10.45 $21,740
41-2031 Retail Salespersons 1,200 $11.20 $23,300 $8.72 $18,150 $12.44 $25,880 $9.30 $19,340
35-2021 Food Preparation Workers 1,150 $8.78 $18,260 $8.60 $17,890 $8.87 $18,440 $8.86 $18,430
53-7065 Stockers and Order Fillers 1,080 $10.23 $21,270 $8.55 $17,780 $11.07 $23,020 $9.08 $18,880
43-9061 Office Clerks, General 950 $9.79 $20,350 $8.44 $17,560 $10.46 $21,750 $8.91 $18,540
43-6014
Secretaries and Administrative Assistants,
Except Legal, Medical, and Executive 890 $10.51 $21,870 $8.48 $17,640 $11.53 $23,980 $9.16 $19,060
37-2011
Janitors and Cleaners, Except Maids and
Housekeeping Cleaners 850 $9.95 $20,690 $8.52 $17,730 $10.66 $22,170 $9.17 $19,080
25-2021
Elementary School Teachers, Except
Special Education 840 NA $38,670 NA $30,920 NA $42,540 NA $38,630
41-2031 Retail Salespersons 1,340 $10.56 $21,980 $8.59 $17,880 $11.55 $24,020 $9.23 $19,200
41-2011 Cashiers 1,180 $9.29 $19,320 $8.60 $17,900 $9.63 $20,040 $9.12 $18,970
29-1141 Registered Nurses 1,060 $16.24 $33,780 $11.84 $24,640 $18.44 $38,350 $14.91 $31,010
37-2011
Janitors and Cleaners, Except Maids and
Housekeeping Cleaners 920 $9.95 $20,690 $8.50 $17,680 $10.67 $22,200 $8.99 $18,690
43-6014
Secretaries and Administrative Assistants,
Except Legal, Medical, and Executive 740 $10.08 $20,970 $8.45 $17,570 $10.90 $22,670 $9.06 $18,850
51-6031 Sewing Machine Operators 630 $8.53 $17,750 $8.47 $17,610 $8.56 $17,810 $8.61 $17,910
53-7065 Stockers and Order Fillers 590 $9.90 $20,600 $8.76 $18,230 $10.47 $21,780 $9.39 $19,540
43-9061 Office Clerks, General 580 $10.33 $21,490 $8.42 $17,510 $11.29 $23,480 $9.00 $18,720
35-3023 Fast Food and Counter Workers 550 $8.75 $18,190 $8.62 $17,940 $8.81 $18,320 $8.88 $18,470
43-1011
First-Line Supervisors of Office and
Administrative Support Workers 410 $15.20 $31,630 $9.58 $19,930 $18.02 $37,480 $14.32 $29,780
41-2011 Cashiers 1,500 $9.01 $18,740 $8.61 $17,910 $9.21 $19,160 $8.93 $18,560
41-2031 Retail Salespersons 1,400 $9.90 $20,600 $8.50 $17,680 $10.61 $22,060 $9.22 $19,170
37-2011
Janitors and Cleaners, Except Maids and
Housekeeping Cleaners 670 $10.07 $20,950 $8.60 $17,900 $10.81 $22,480 $9.28 $19,300
53-7065 Stockers and Order Fillers 630 $9.87 $20,520 $8.62 $17,930 $10.49 $21,820 $9.30 $19,350
41-1011
First-Line Supervisors of Retail Sales
Workers 580 $14.19 $29,520 $8.78 $18,260 $16.90 $35,150 $12.87 $26,770
43-9061 Office Clerks, General 580 $9.79 $20,360 $8.46 $17,590 $10.45 $21,750 $8.90 $18,510
49-9071 Maintenance and Repair Workers, General 500 $9.64 $20,060 $8.49 $17,660 $10.22 $21,250 $9.00 $18,710
35-3031 Waiters and Waitresses 400 $8.78 $18,270 $8.41 $17,500 $8.97 $18,650 $8.64 $17,970
43-4051 Customer Service Representatives 400 $9.85 $20,480 $8.41 $17,500 $10.56 $21,970 $9.13 $18,990
29-1141 Registered Nurses 390 $16.31 $33,920 $13.10 $27,260 $17.91 $37,240 $15.67 $32,590
Mayagüez - Las Marías
Noreste
Manatí - Dorado
La Montaña
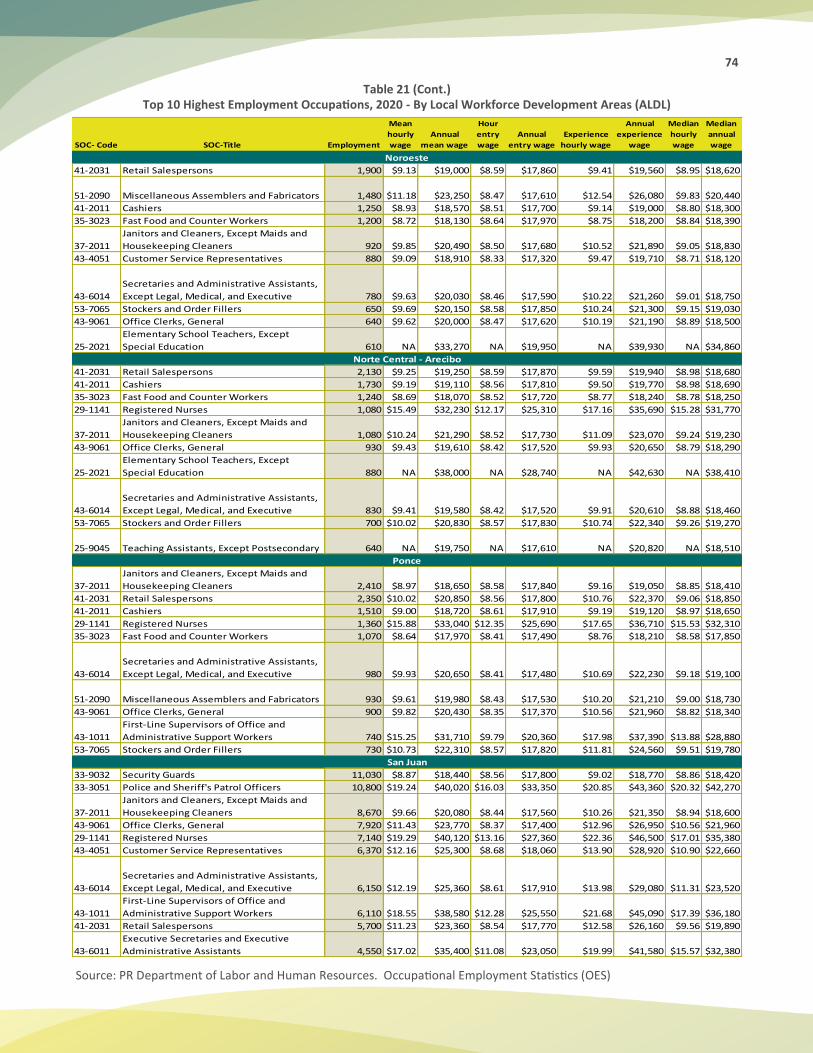
74
Table 21 (Cont.) Top 10 Highest Employment Occupations, 2020 - By Local Workforce Development Areas (ALDL)
Source: PR Department of Labor and Human Resources. Occupational Employment Statistics (OES)
SOC- Code SOC-Title Employment
Mean
hourly
wage
Annual
mean wage
Hour
entry
wage
Annual
entry wage
Experience
hourly wage
Annual
experience
wage
Median
hourly
wage
Median
annual
wage
41-2031 Retail Salespersons 1,900 $9.13 $19,000 $8.59 $17,860 $9.41 $19,560 $8.95 $18,620
51-2090 Miscellaneous Assemblers and Fabricators 1,480 $11.18 $23,250 $8.47 $17,610 $12.54 $26,080 $9.83 $20,440
41-2011 Cashiers 1,250 $8.93 $18,570 $8.51 $17,700 $9.14 $19,000 $8.80 $18,300
35-3023 Fast Food and Counter Workers 1,200 $8.72 $18,130 $8.64 $17,970 $8.75 $18,200 $8.84 $18,390
37-2011
Janitors and Cleaners, Except Maids and
Housekeeping Cleaners 920 $9.85 $20,490 $8.50 $17,680 $10.52 $21,890 $9.05 $18,830
43-4051 Customer Service Representatives 880 $9.09 $18,910 $8.33 $17,320 $9.47 $19,710 $8.71 $18,120
43-6014
Secretaries and Administrative Assistants,
Except Legal, Medical, and Executive 780 $9.63 $20,030 $8.46 $17,590 $10.22 $21,260 $9.01 $18,750
53-7065 Stockers and Order Fillers 650 $9.69 $20,150 $8.58 $17,850 $10.24 $21,300 $9.15 $19,030
43-9061 Office Clerks, General 640 $9.62 $20,000 $8.47 $17,620 $10.19 $21,190 $8.89 $18,500
25-2021
Elementary School Teachers, Except
Special Education 610 NA $33,270 NA $19,950 NA $39,930 NA $34,860
41-2031 Retail Salespersons 2,130 $9.25 $19,250 $8.59 $17,870 $9.59 $19,940 $8.98 $18,680
41-2011 Cashiers 1,730 $9.19 $19,110 $8.56 $17,810 $9.50 $19,770 $8.98 $18,690
35-3023 Fast Food and Counter Workers 1,240 $8.69 $18,070 $8.52 $17,720 $8.77 $18,240 $8.78 $18,250
29-1141 Registered Nurses 1,080 $15.49 $32,230 $12.17 $25,310 $17.16 $35,690 $15.28 $31,770
37-2011
Janitors and Cleaners, Except Maids and
Housekeeping Cleaners 1,080 $10.24 $21,290 $8.52 $17,730 $11.09 $23,070 $9.24 $19,230
43-9061 Office Clerks, General 930 $9.43 $19,610 $8.42 $17,520 $9.93 $20,650 $8.79 $18,290
25-2021
Elementary School Teachers, Except
Special Education 880 NA $38,000 NA $28,740 NA $42,630 NA $38,410
43-6014
Secretaries and Administrative Assistants,
Except Legal, Medical, and Executive 830 $9.41 $19,580 $8.42 $17,520 $9.91 $20,610 $8.88 $18,460
53-7065 Stockers and Order Fillers 700 $10.02 $20,830 $8.57 $17,830 $10.74 $22,340 $9.26 $19,270
25-9045 Teaching Assistants, Except Postsecondary 640 NA $19,750 NA $17,610 NA $20,820 NA $18,510
37-2011
Janitors and Cleaners, Except Maids and
Housekeeping Cleaners 2,410 $8.97 $18,650 $8.58 $17,840 $9.16 $19,050 $8.85 $18,410
41-2031 Retail Salespersons 2,350 $10.02 $20,850 $8.56 $17,800 $10.76 $22,370 $9.06 $18,850
41-2011 Cashiers 1,510 $9.00 $18,720 $8.61 $17,910 $9.19 $19,120 $8.97 $18,650
29-1141 Registered Nurses 1,360 $15.88 $33,040 $12.35 $25,690 $17.65 $36,710 $15.53 $32,310
35-3023 Fast Food and Counter Workers 1,070 $8.64 $17,970 $8.41 $17,490 $8.76 $18,210 $8.58 $17,850
43-6014
Secretaries and Administrative Assistants,
Except Legal, Medical, and Executive 980 $9.93 $20,650 $8.41 $17,480 $10.69 $22,230 $9.18 $19,100
51-2090 Miscellaneous Assemblers and Fabricators 930 $9.61 $19,980 $8.43 $17,530 $10.20 $21,210 $9.00 $18,730
43-9061 Office Clerks, General 900 $9.82 $20,430 $8.35 $17,370 $10.56 $21,960 $8.82 $18,340
43-1011
First-Line Supervisors of Office and
Administrative Support Workers 740 $15.25 $31,710 $9.79 $20,360 $17.98 $37,390 $13.88 $28,880
53-7065 Stockers and Order Fillers 730 $10.73 $22,310 $8.57 $17,820 $11.81 $24,560 $9.51 $19,780
33-9032 Security Guards 11,030 $8.87 $18,440 $8.56 $17,800 $9.02 $18,770 $8.86 $18,420
33-3051 Police and Sheriff's Patrol Officers 10,800 $19.24 $40,020 $16.03 $33,350 $20.85 $43,360 $20.32 $42,270
37-2011
Janitors and Cleaners, Except Maids and
Housekeeping Cleaners 8,670 $9.66 $20,080 $8.44 $17,560 $10.26 $21,350 $8.94 $18,600
43-9061 Office Clerks, General 7,920 $11.43 $23,770 $8.37 $17,400 $12.96 $26,950 $10.56 $21,960
29-1141 Registered Nurses 7,140 $19.29 $40,120 $13.16 $27,360 $22.36 $46,500 $17.01 $35,380
43-4051 Customer Service Representatives 6,370 $12.16 $25,300 $8.68 $18,060 $13.90 $28,920 $10.90 $22,660
43-6014
Secretaries and Administrative Assistants,
Except Legal, Medical, and Executive 6,150 $12.19 $25,360 $8.61 $17,910 $13.98 $29,080 $11.31 $23,520
43-1011
First-Line Supervisors of Office and
Administrative Support Workers 6,110 $18.55 $38,580 $12.28 $25,550 $21.68 $45,090 $17.39 $36,180
41-2031 Retail Salespersons 5,700 $11.23 $23,360 $8.54 $17,770 $12.58 $26,160 $9.56 $19,890
43-6011
Executive Secretaries and Executive
Administrative Assistants 4,550 $17.02 $35,400 $11.08 $23,050 $19.99 $41,580 $15.57 $32,380
Noroeste
Norte Central - Arecibo
Ponce
San Juan
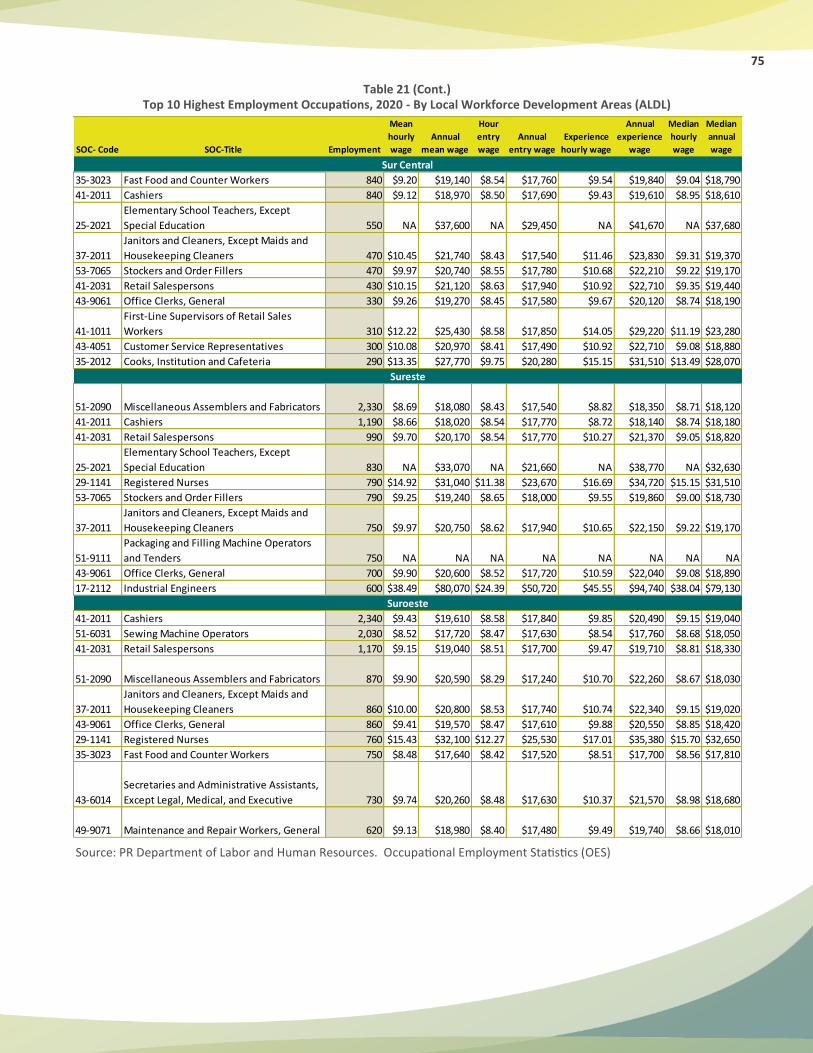
75
Table 21 (Cont.) Top 10 Highest Employment Occupations, 2020 - By Local Workforce Development Areas (ALDL)
Source: PR Department of Labor and Human Resources. Occupational Employment Statistics (OES)
SOC- Code SOC-Title Employment
Mean
hourly
wage
Annual
mean wage
Hour
entry
wage
Annual
entry wage
Experience
hourly wage
Annual
experience
wage
Median
hourly
wage
Median
annual
wage
35-3023 Fast Food and Counter Workers 840 $9.20 $19,140 $8.54 $17,760 $9.54 $19,840 $9.04 $18,790
41-2011 Cashiers 840 $9.12 $18,970 $8.50 $17,690 $9.43 $19,610 $8.95 $18,610
25-2021
Elementary School Teachers, Except
Special Education 550 NA $37,600 NA $29,450 NA $41,670 NA $37,680
37-2011
Janitors and Cleaners, Except Maids and
Housekeeping Cleaners 470 $10.45 $21,740 $8.43 $17,540 $11.46 $23,830 $9.31 $19,370
53-7065 Stockers and Order Fillers 470 $9.97 $20,740 $8.55 $17,780 $10.68 $22,210 $9.22 $19,170
41-2031 Retail Salespersons 430 $10.15 $21,120 $8.63 $17,940 $10.92 $22,710 $9.35 $19,440
43-9061 Office Clerks, General 330 $9.26 $19,270 $8.45 $17,580 $9.67 $20,120 $8.74 $18,190
41-1011
First-Line Supervisors of Retail Sales
Workers 310 $12.22 $25,430 $8.58 $17,850 $14.05 $29,220 $11.19 $23,280
43-4051 Customer Service Representatives 300 $10.08 $20,970 $8.41 $17,490 $10.92 $22,710 $9.08 $18,880
35-2012 Cooks, Institution and Cafeteria 290 $13.35 $27,770 $9.75 $20,280 $15.15 $31,510 $13.49 $28,070
51-2090 Miscellaneous Assemblers and Fabricators 2,330 $8.69 $18,080 $8.43 $17,540 $8.82 $18,350 $8.71 $18,120
41-2011 Cashiers 1,190 $8.66 $18,020 $8.54 $17,770 $8.72 $18,140 $8.74 $18,180
41-2031 Retail Salespersons 990 $9.70 $20,170 $8.54 $17,770 $10.27 $21,370 $9.05 $18,820
25-2021
Elementary School Teachers, Except
Special Education 830 NA $33,070 NA $21,660 NA $38,770 NA $32,630
29-1141 Registered Nurses 790 $14.92 $31,040 $11.38 $23,670 $16.69 $34,720 $15.15 $31,510
53-7065 Stockers and Order Fillers 790 $9.25 $19,240 $8.65 $18,000 $9.55 $19,860 $9.00 $18,730
37-2011
Janitors and Cleaners, Except Maids and
Housekeeping Cleaners 750 $9.97 $20,750 $8.62 $17,940 $10.65 $22,150 $9.22 $19,170
51-9111
Packaging and Filling Machine Operators
and Tenders 750 NA NA NA NA NA NA NA NA
43-9061 Office Clerks, General 700 $9.90 $20,600 $8.52 $17,720 $10.59 $22,040 $9.08 $18,890
17-2112 Industrial Engineers 600 $38.49 $80,070 $24.39 $50,720 $45.55 $94,740 $38.04 $79,130
41-2011 Cashiers 2,340 $9.43 $19,610 $8.58 $17,840 $9.85 $20,490 $9.15 $19,040
51-6031 Sewing Machine Operators 2,030 $8.52 $17,720 $8.47 $17,630 $8.54 $17,760 $8.68 $18,050
41-2031 Retail Salespersons 1,170 $9.15 $19,040 $8.51 $17,700 $9.47 $19,710 $8.81 $18,330
51-2090 Miscellaneous Assemblers and Fabricators 870 $9.90 $20,590 $8.29 $17,240 $10.70 $22,260 $8.67 $18,030
37-2011
Janitors and Cleaners, Except Maids and
Housekeeping Cleaners 860 $10.00 $20,800 $8.53 $17,740 $10.74 $22,340 $9.15 $19,020
43-9061 Office Clerks, General 860 $9.41 $19,570 $8.47 $17,610 $9.88 $20,550 $8.85 $18,420
29-1141 Registered Nurses 760 $15.43 $32,100 $12.27 $25,530 $17.01 $35,380 $15.70 $32,650
35-3023 Fast Food and Counter Workers 750 $8.48 $17,640 $8.42 $17,520 $8.51 $17,700 $8.56 $17,810
43-6014
Secretaries and Administrative Assistants,
Except Legal, Medical, and Executive 730 $9.74 $20,260 $8.48 $17,630 $10.37 $21,570 $8.98 $18,680
49-9071 Maintenance and Repair Workers, General 620 $9.13 $18,980 $8.40 $17,480 $9.49 $19,740 $8.66 $18,010
Sur Central
Sureste
Suroeste
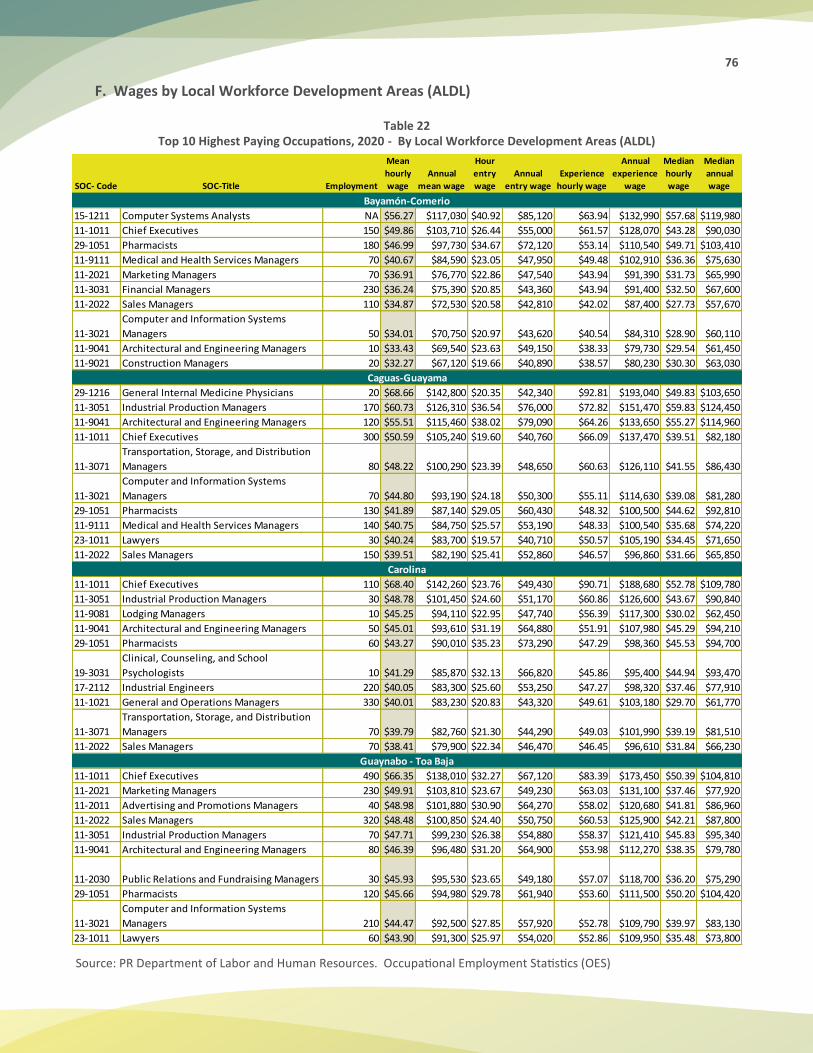
76
F. Wages by Local Workforce Development Areas (ALDL)
Table 22 Top 10 Highest Paying Occupations, 2020 - By Local Workforce Development Areas (ALDL)
Source: PR Department of Labor and Human Resources. Occupational Employment Statistics (OES)
SOC- Code SOC-Title Employment
Mean
hourly
wage
Annual
mean wage
Hour
entry
wage
Annual
entry wage
Experience
hourly wage
Annual
experience
wage
Median
hourly
wage
Median
annual
wage
15-1211 Computer Systems Analysts NA $56.27 $117,030 $40.92 $85,120 $63.94 $132,990 $57.68 $119,980
11-1011 Chief Executives 150 $49.86 $103,710 $26.44 $55,000 $61.57 $128,070 $43.28 $90,030
29-1051 Pharmacists 180 $46.99 $97,730 $34.67 $72,120 $53.14 $110,540 $49.71 $103,410
11-9111 Medical and Health Services Managers 70 $40.67 $84,590 $23.05 $47,950 $49.48 $102,910 $36.36 $75,630
11-2021 Marketing Managers 70 $36.91 $76,770 $22.86 $47,540 $43.94 $91,390 $31.73 $65,990
11-3031 Financial Managers 230 $36.24 $75,390 $20.85 $43,360 $43.94 $91,400 $32.50 $67,600
11-2022 Sales Managers 110 $34.87 $72,530 $20.58 $42,810 $42.02 $87,400 $27.73 $57,670
11-3021
Computer and Information Systems
Managers 50 $34.01 $70,750 $20.97 $43,620 $40.54 $84,310 $28.90 $60,110
11-9041 Architectural and Engineering Managers 10 $33.43 $69,540 $23.63 $49,150 $38.33 $79,730 $29.54 $61,450
11-9021 Construction Managers 20 $32.27 $67,120 $19.66 $40,890 $38.57 $80,230 $30.30 $63,030
29-1216 General Internal Medicine Physicians 20 $68.66 $142,800 $20.35 $42,340 $92.81 $193,040 $49.83 $103,650
11-3051 Industrial Production Managers 170 $60.73 $126,310 $36.54 $76,000 $72.82 $151,470 $59.83 $124,450
11-9041 Architectural and Engineering Managers 120 $55.51 $115,460 $38.02 $79,090 $64.26 $133,650 $55.27 $114,960
11-1011 Chief Executives 300 $50.59 $105,240 $19.60 $40,760 $66.09 $137,470 $39.51 $82,180
11-3071
Transportation, Storage, and Distribution
Managers 80 $48.22 $100,290 $23.39 $48,650 $60.63 $126,110 $41.55 $86,430
11-3021
Computer and Information Systems
Managers 70 $44.80 $93,190 $24.18 $50,300 $55.11 $114,630 $39.08 $81,280
29-1051 Pharmacists 130 $41.89 $87,140 $29.05 $60,430 $48.32 $100,500 $44.62 $92,810
11-9111 Medical and Health Services Managers 140 $40.75 $84,750 $25.57 $53,190 $48.33 $100,540 $35.68 $74,220
23-1011 Lawyers 30 $40.24 $83,700 $19.57 $40,710 $50.57 $105,190 $34.45 $71,650
11-2022 Sales Managers 150 $39.51 $82,190 $25.41 $52,860 $46.57 $96,860 $31.66 $65,850
11-1011 Chief Executives 110 $68.40 $142,260 $23.76 $49,430 $90.71 $188,680 $52.78 $109,780
11-3051 Industrial Production Managers 30 $48.78 $101,450 $24.60 $51,170 $60.86 $126,600 $43.67 $90,840
11-9081 Lodging Managers 10 $45.25 $94,110 $22.95 $47,740 $56.39 $117,300 $30.02 $62,450
11-9041 Architectural and Engineering Managers 50 $45.01 $93,610 $31.19 $64,880 $51.91 $107,980 $45.29 $94,210
29-1051 Pharmacists 60 $43.27 $90,010 $35.23 $73,290 $47.29 $98,360 $45.53 $94,700
19-3031
Clinical, Counseling, and School
Psychologists 10 $41.29 $85,870 $32.13 $66,820 $45.86 $95,400 $44.94 $93,470
17-2112 Industrial Engineers 220 $40.05 $83,300 $25.60 $53,250 $47.27 $98,320 $37.46 $77,910
11-1021 General and Operations Managers 330 $40.01 $83,230 $20.83 $43,320 $49.61 $103,180 $29.70 $61,770
11-3071
Transportation, Storage, and Distribution
Managers 70 $39.79 $82,760 $21.30 $44,290 $49.03 $101,990 $39.19 $81,510
11-2022 Sales Managers 70 $38.41 $79,900 $22.34 $46,470 $46.45 $96,610 $31.84 $66,230
11-1011 Chief Executives 490 $66.35 $138,010 $32.27 $67,120 $83.39 $173,450 $50.39 $104,810
11-2021 Marketing Managers 230 $49.91 $103,810 $23.67 $49,230 $63.03 $131,100 $37.46 $77,920
11-2011 Advertising and Promotions Managers 40 $48.98 $101,880 $30.90 $64,270 $58.02 $120,680 $41.81 $86,960
11-2022 Sales Managers 320 $48.48 $100,850 $24.40 $50,750 $60.53 $125,900 $42.21 $87,800
11-3051 Industrial Production Managers 70 $47.71 $99,230 $26.38 $54,880 $58.37 $121,410 $45.83 $95,340
11-9041 Architectural and Engineering Managers 80 $46.39 $96,480 $31.20 $64,900 $53.98 $112,270 $38.35 $79,780
11-2030 Public Relations and Fundraising Managers 30 $45.93 $95,530 $23.65 $49,180 $57.07 $118,700 $36.20 $75,290
29-1051 Pharmacists 120 $45.66 $94,980 $29.78 $61,940 $53.60 $111,500 $50.20 $104,420
11-3021
Computer and Information Systems
Managers 210 $44.47 $92,500 $27.85 $57,920 $52.78 $109,790 $39.97 $83,130
23-1011 Lawyers 60 $43.90 $91,300 $25.97 $54,020 $52.86 $109,950 $35.48 $73,800
Bayamón-Comerio
Caguas-Guayama
Carolina
Guaynabo - Toa Baja
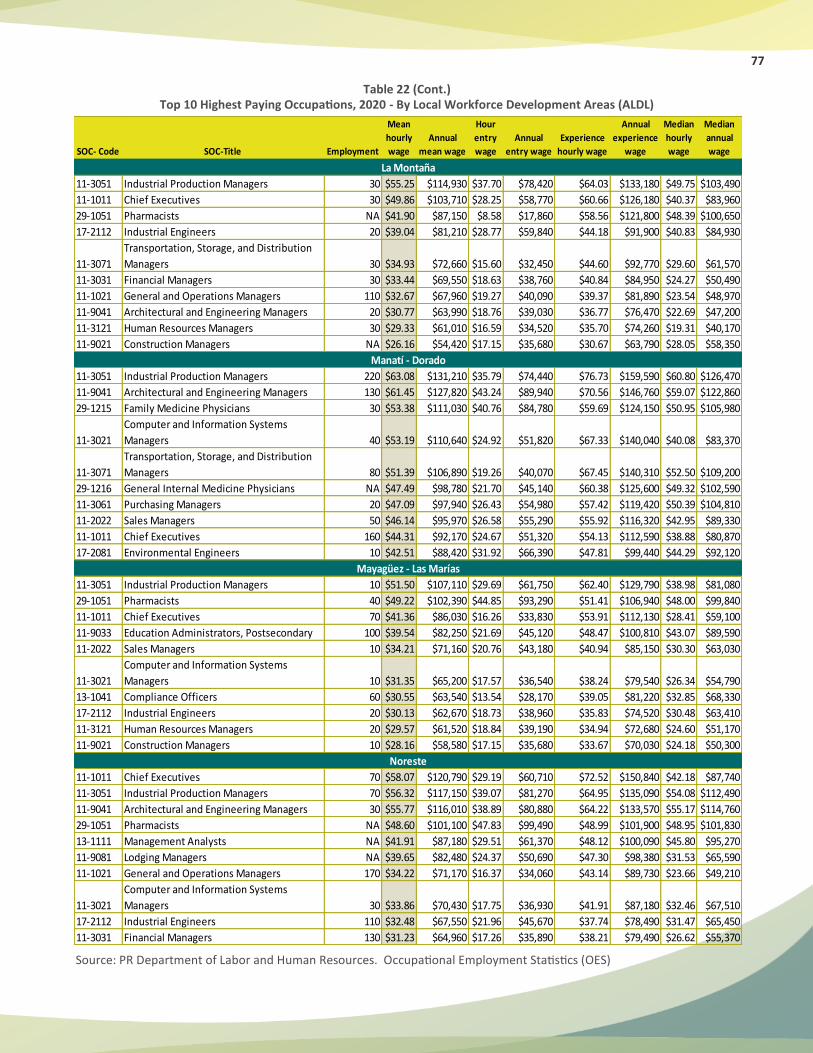
77
Table 22 (Cont.) Top 10 Highest Paying Occupations, 2020 - By Local Workforce Development Areas (ALDL)
Source: PR Department of Labor and Human Resources. Occupational Employment Statistics (OES)
SOC- Code SOC-Title Employment
Mean
hourly
wage
Annual
mean wage
Hour
entry
wage
Annual
entry wage
Experience
hourly wage
Annual
experience
wage
Median
hourly
wage
Median
annual
wage
11-3051 Industrial Production Managers 30 $55.25 $114,930 $37.70 $78,420 $64.03 $133,180 $49.75 $103,490
11-1011 Chief Executives 30 $49.86 $103,710 $28.25 $58,770 $60.66 $126,180 $40.37 $83,960
29-1051 Pharmacists NA $41.90 $87,150 $8.58 $17,860 $58.56 $121,800 $48.39 $100,650
17-2112 Industrial Engineers 20 $39.04 $81,210 $28.77 $59,840 $44.18 $91,900 $40.83 $84,930
11-3071
Transportation, Storage, and Distribution
Managers 30 $34.93 $72,660 $15.60 $32,450 $44.60 $92,770 $29.60 $61,570
11-3031 Financial Managers 30 $33.44 $69,550 $18.63 $38,760 $40.84 $84,950 $24.27 $50,490
11-1021 General and Operations Managers 110 $32.67 $67,960 $19.27 $40,090 $39.37 $81,890 $23.54 $48,970
11-9041 Architectural and Engineering Managers 20 $30.77 $63,990 $18.76 $39,030 $36.77 $76,470 $22.69 $47,200
11-3121 Human Resources Managers 30 $29.33 $61,010 $16.59 $34,520 $35.70 $74,260 $19.31 $40,170
11-9021 Construction Managers NA $26.16 $54,420 $17.15 $35,680 $30.67 $63,790 $28.05 $58,350
11-3051 Industrial Production Managers 220 $63.08 $131,210 $35.79 $74,440 $76.73 $159,590 $60.80 $126,470
11-9041 Architectural and Engineering Managers 130 $61.45 $127,820 $43.24 $89,940 $70.56 $146,760 $59.07 $122,860
29-1215 Family Medicine Physicians 30 $53.38 $111,030 $40.76 $84,780 $59.69 $124,150 $50.95 $105,980
11-3021
Computer and Information Systems
Managers 40 $53.19 $110,640 $24.92 $51,820 $67.33 $140,040 $40.08 $83,370
11-3071
Transportation, Storage, and Distribution
Managers 80 $51.39 $106,890 $19.26 $40,070 $67.45 $140,310 $52.50 $109,200
29-1216 General Internal Medicine Physicians NA $47.49 $98,780 $21.70 $45,140 $60.38 $125,600 $49.32 $102,590
11-3061 Purchasing Managers 20 $47.09 $97,940 $26.43 $54,980 $57.42 $119,420 $50.39 $104,810
11-2022 Sales Managers 50 $46.14 $95,970 $26.58 $55,290 $55.92 $116,320 $42.95 $89,330
11-1011 Chief Executives 160 $44.31 $92,170 $24.67 $51,320 $54.13 $112,590 $38.88 $80,870
17-2081 Environmental Engineers 10 $42.51 $88,420 $31.92 $66,390 $47.81 $99,440 $44.29 $92,120
11-3051 Industrial Production Managers 10 $51.50 $107,110 $29.69 $61,750 $62.40 $129,790 $38.98 $81,080
29-1051 Pharmacists 40 $49.22 $102,390 $44.85 $93,290 $51.41 $106,940 $48.00 $99,840
11-1011 Chief Executives 70 $41.36 $86,030 $16.26 $33,830 $53.91 $112,130 $28.41 $59,100
11-9033 Education Administrators, Postsecondary 100 $39.54 $82,250 $21.69 $45,120 $48.47 $100,810 $43.07 $89,590
11-2022 Sales Managers 10 $34.21 $71,160 $20.76 $43,180 $40.94 $85,150 $30.30 $63,030
11-3021
Computer and Information Systems
Managers 10 $31.35 $65,200 $17.57 $36,540 $38.24 $79,540 $26.34 $54,790
13-1041 Compliance Officers 60 $30.55 $63,540 $13.54 $28,170 $39.05 $81,220 $32.85 $68,330
17-2112 Industrial Engineers 20 $30.13 $62,670 $18.73 $38,960 $35.83 $74,520 $30.48 $63,410
11-3121 Human Resources Managers 20 $29.57 $61,520 $18.84 $39,190 $34.94 $72,680 $24.60 $51,170
11-9021 Construction Managers 10 $28.16 $58,580 $17.15 $35,680 $33.67 $70,030 $24.18 $50,300
11-1011 Chief Executives 70 $58.07 $120,790 $29.19 $60,710 $72.52 $150,840 $42.18 $87,740
11-3051 Industrial Production Managers 70 $56.32 $117,150 $39.07 $81,270 $64.95 $135,090 $54.08 $112,490
11-9041 Architectural and Engineering Managers 30 $55.77 $116,010 $38.89 $80,880 $64.22 $133,570 $55.17 $114,760
29-1051 Pharmacists NA $48.60 $101,100 $47.83 $99,490 $48.99 $101,900 $48.95 $101,830
13-1111 Management Analysts NA $41.91 $87,180 $29.51 $61,370 $48.12 $100,090 $45.80 $95,270
11-9081 Lodging Managers NA $39.65 $82,480 $24.37 $50,690 $47.30 $98,380 $31.53 $65,590
11-1021 General and Operations Managers 170 $34.22 $71,170 $16.37 $34,060 $43.14 $89,730 $23.66 $49,210
11-3021
Computer and Information Systems
Managers 30 $33.86 $70,430 $17.75 $36,930 $41.91 $87,180 $32.46 $67,510
17-2112 Industrial Engineers 110 $32.48 $67,550 $21.96 $45,670 $37.74 $78,490 $31.47 $65,450
11-3031 Financial Managers 130 $31.23 $64,960 $17.26 $35,890 $38.21 $79,490 $26.62 $55,370
Mayagüez - Las Marías
Noreste
Manatí - Dorado
La Montaña
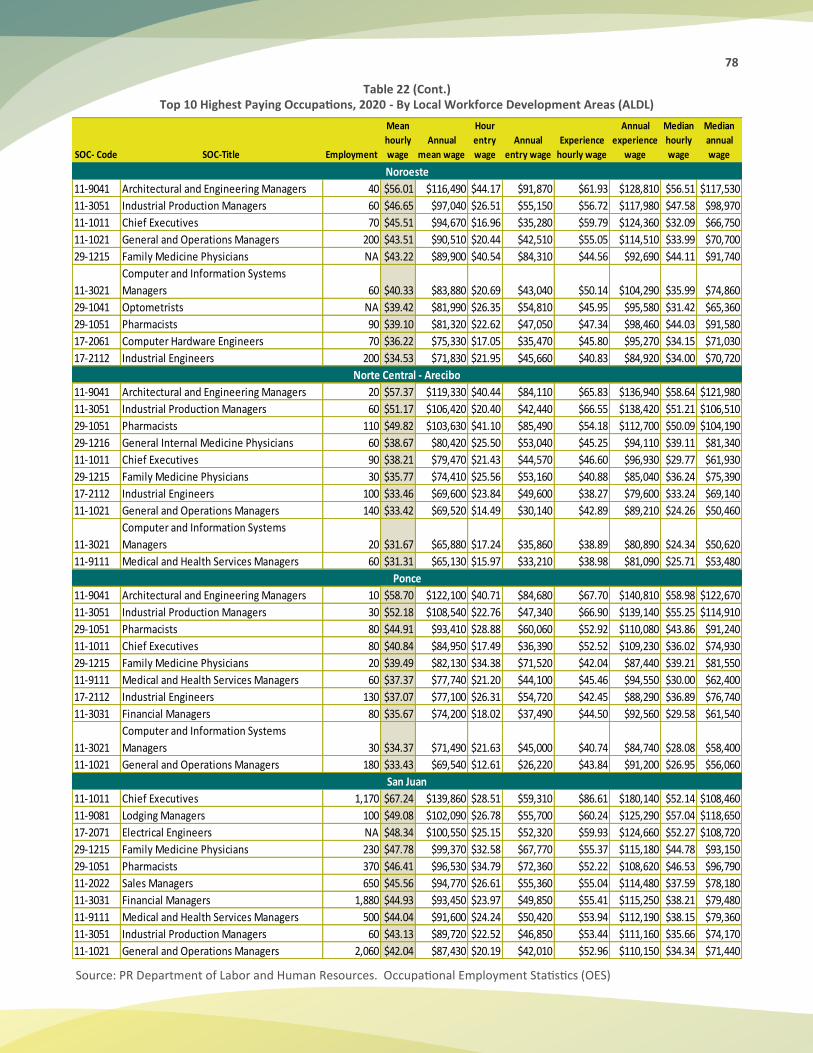
78
Table 22 (Cont.) Top 10 Highest Paying Occupations, 2020 - By Local Workforce Development Areas (ALDL)
Source: PR Department of Labor and Human Resources. Occupational Employment Statistics (OES)
SOC- Code SOC-Title Employment
Mean
hourly
wage
Annual
mean wage
Hour
entry
wage
Annual
entry wage
Experience
hourly wage
Annual
experience
wage
Median
hourly
wage
Median
annual
wage
11-9041 Architectural and Engineering Managers 40 $56.01 $116,490 $44.17 $91,870 $61.93 $128,810 $56.51 $117,530
11-3051 Industrial Production Managers 60 $46.65 $97,040 $26.51 $55,150 $56.72 $117,980 $47.58 $98,970
11-1011 Chief Executives 70 $45.51 $94,670 $16.96 $35,280 $59.79 $124,360 $32.09 $66,750
11-1021 General and Operations Managers 200 $43.51 $90,510 $20.44 $42,510 $55.05 $114,510 $33.99 $70,700
29-1215 Family Medicine Physicians NA $43.22 $89,900 $40.54 $84,310 $44.56 $92,690 $44.11 $91,740
11-3021
Computer and Information Systems
Managers 60 $40.33 $83,880 $20.69 $43,040 $50.14 $104,290 $35.99 $74,860
29-1041 Optometrists NA $39.42 $81,990 $26.35 $54,810 $45.95 $95,580 $31.42 $65,360
29-1051 Pharmacists 90 $39.10 $81,320 $22.62 $47,050 $47.34 $98,460 $44.03 $91,580
17-2061 Computer Hardware Engineers 70 $36.22 $75,330 $17.05 $35,470 $45.80 $95,270 $34.15 $71,030
17-2112 Industrial Engineers 200 $34.53 $71,830 $21.95 $45,660 $40.83 $84,920 $34.00 $70,720
11-9041 Architectural and Engineering Managers 20 $57.37 $119,330 $40.44 $84,110 $65.83 $136,940 $58.64 $121,980
11-3051 Industrial Production Managers 60 $51.17 $106,420 $20.40 $42,440 $66.55 $138,420 $51.21 $106,510
29-1051 Pharmacists 110 $49.82 $103,630 $41.10 $85,490 $54.18 $112,700 $50.09 $104,190
29-1216 General Internal Medicine Physicians 60 $38.67 $80,420 $25.50 $53,040 $45.25 $94,110 $39.11 $81,340
11-1011 Chief Executives 90 $38.21 $79,470 $21.43 $44,570 $46.60 $96,930 $29.77 $61,930
29-1215 Family Medicine Physicians 30 $35.77 $74,410 $25.56 $53,160 $40.88 $85,040 $36.24 $75,390
17-2112 Industrial Engineers 100 $33.46 $69,600 $23.84 $49,600 $38.27 $79,600 $33.24 $69,140
11-1021 General and Operations Managers 140 $33.42 $69,520 $14.49 $30,140 $42.89 $89,210 $24.26 $50,460
11-3021
Computer and Information Systems
Managers 20 $31.67 $65,880 $17.24 $35,860 $38.89 $80,890 $24.34 $50,620
11-9111 Medical and Health Services Managers 60 $31.31 $65,130 $15.97 $33,210 $38.98 $81,090 $25.71 $53,480
11-9041 Architectural and Engineering Managers 10 $58.70 $122,100 $40.71 $84,680 $67.70 $140,810 $58.98 $122,670
11-3051 Industrial Production Managers 30 $52.18 $108,540 $22.76 $47,340 $66.90 $139,140 $55.25 $114,910
29-1051 Pharmacists 80 $44.91 $93,410 $28.88 $60,060 $52.92 $110,080 $43.86 $91,240
11-1011 Chief Executives 80 $40.84 $84,950 $17.49 $36,390 $52.52 $109,230 $36.02 $74,930
29-1215 Family Medicine Physicians 20 $39.49 $82,130 $34.38 $71,520 $42.04 $87,440 $39.21 $81,550
11-9111 Medical and Health Services Managers 60 $37.37 $77,740 $21.20 $44,100 $45.46 $94,550 $30.00 $62,400
17-2112 Industrial Engineers 130 $37.07 $77,100 $26.31 $54,720 $42.45 $88,290 $36.89 $76,740
11-3031 Financial Managers 80 $35.67 $74,200 $18.02 $37,490 $44.50 $92,560 $29.58 $61,540
11-3021
Computer and Information Systems
Managers 30 $34.37 $71,490 $21.63 $45,000 $40.74 $84,740 $28.08 $58,400
11-1021 General and Operations Managers 180 $33.43 $69,540 $12.61 $26,220 $43.84 $91,200 $26.95 $56,060
11-1011 Chief Executives 1,170 $67.24 $139,860 $28.51 $59,310 $86.61 $180,140 $52.14 $108,460
11-9081 Lodging Managers 100 $49.08 $102,090 $26.78 $55,700 $60.24 $125,290 $57.04 $118,650
17-2071 Electrical Engineers NA $48.34 $100,550 $25.15 $52,320 $59.93 $124,660 $52.27 $108,720
29-1215 Family Medicine Physicians 230 $47.78 $99,370 $32.58 $67,770 $55.37 $115,180 $44.78 $93,150
29-1051 Pharmacists 370 $46.41 $96,530 $34.79 $72,360 $52.22 $108,620 $46.53 $96,790
11-2022 Sales Managers 650 $45.56 $94,770 $26.61 $55,360 $55.04 $114,480 $37.59 $78,180
11-3031 Financial Managers 1,880 $44.93 $93,450 $23.97 $49,850 $55.41 $115,250 $38.21 $79,480
11-9111 Medical and Health Services Managers 500 $44.04 $91,600 $24.24 $50,420 $53.94 $112,190 $38.15 $79,360
11-3051 Industrial Production Managers 60 $43.13 $89,720 $22.52 $46,850 $53.44 $111,160 $35.66 $74,170
11-1021 General and Operations Managers 2,060 $42.04 $87,430 $20.19 $42,010 $52.96 $110,150 $34.34 $71,440
Noroeste
Norte Central - Arecibo
Ponce
San Juan
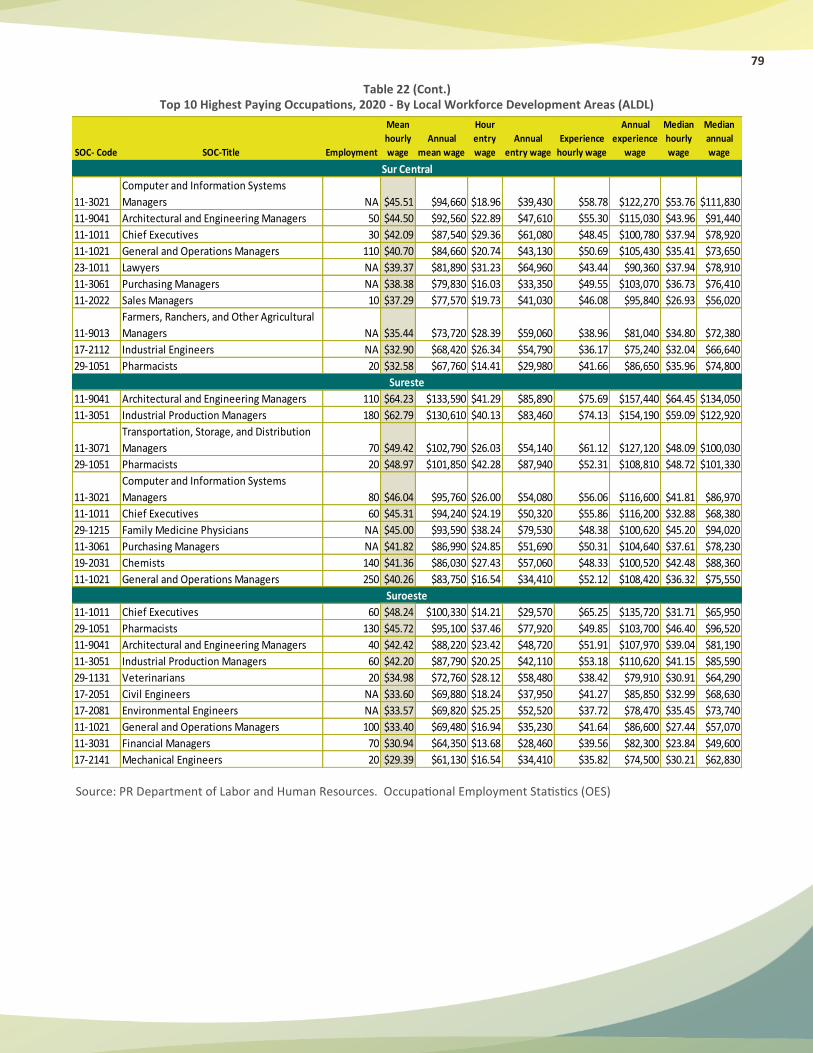
79
Table 22 (Cont.) Top 10 Highest Paying Occupations, 2020 - By Local Workforce Development Areas (ALDL)
Source: PR Department of Labor and Human Resources. Occupational Employment Statistics (OES)
SOC- Code SOC-Title Employment
Mean
hourly
wage
Annual
mean wage
Hour
entry
wage
Annual
entry wage
Experience
hourly wage
Annual
experience
wage
Median
hourly
wage
Median
annual
wage
11-3021
Computer and Information Systems
Managers NA $45.51 $94,660 $18.96 $39,430 $58.78 $122,270 $53.76 $111,830
11-9041 Architectural and Engineering Managers 50 $44.50 $92,560 $22.89 $47,610 $55.30 $115,030 $43.96 $91,440
11-1011 Chief Executives 30 $42.09 $87,540 $29.36 $61,080 $48.45 $100,780 $37.94 $78,920
11-1021 General and Operations Managers 110 $40.70 $84,660 $20.74 $43,130 $50.69 $105,430 $35.41 $73,650
23-1011 Lawyers NA $39.37 $81,890 $31.23 $64,960 $43.44 $90,360 $37.94 $78,910
11-3061 Purchasing Managers NA $38.38 $79,830 $16.03 $33,350 $49.55 $103,070 $36.73 $76,410
11-2022 Sales Managers 10 $37.29 $77,570 $19.73 $41,030 $46.08 $95,840 $26.93 $56,020
11-9013
Farmers, Ranchers, and Other Agricultural
Managers NA $35.44 $73,720 $28.39 $59,060 $38.96 $81,040 $34.80 $72,380
17-2112 Industrial Engineers NA $32.90 $68,420 $26.34 $54,790 $36.17 $75,240 $32.04 $66,640
29-1051 Pharmacists 20 $32.58 $67,760 $14.41 $29,980 $41.66 $86,650 $35.96 $74,800
11-9041 Architectural and Engineering Managers 110 $64.23 $133,590 $41.29 $85,890 $75.69 $157,440 $64.45 $134,050
11-3051 Industrial Production Managers 180 $62.79 $130,610 $40.13 $83,460 $74.13 $154,190 $59.09 $122,920
11-3071
Transportation, Storage, and Distribution
Managers 70 $49.42 $102,790 $26.03 $54,140 $61.12 $127,120 $48.09 $100,030
29-1051 Pharmacists 20 $48.97 $101,850 $42.28 $87,940 $52.31 $108,810 $48.72 $101,330
11-3021
Computer and Information Systems
Managers 80 $46.04 $95,760 $26.00 $54,080 $56.06 $116,600 $41.81 $86,970
11-1011 Chief Executives 60 $45.31 $94,240 $24.19 $50,320 $55.86 $116,200 $32.88 $68,380
29-1215 Family Medicine Physicians NA $45.00 $93,590 $38.24 $79,530 $48.38 $100,620 $45.20 $94,020
11-3061 Purchasing Managers NA $41.82 $86,990 $24.85 $51,690 $50.31 $104,640 $37.61 $78,230
19-2031 Chemists 140 $41.36 $86,030 $27.43 $57,060 $48.33 $100,520 $42.48 $88,360
11-1021 General and Operations Managers 250 $40.26 $83,750 $16.54 $34,410 $52.12 $108,420 $36.32 $75,550
11-1011 Chief Executives 60 $48.24 $100,330 $14.21 $29,570 $65.25 $135,720 $31.71 $65,950
29-1051 Pharmacists 130 $45.72 $95,100 $37.46 $77,920 $49.85 $103,700 $46.40 $96,520
11-9041 Architectural and Engineering Managers 40 $42.42 $88,220 $23.42 $48,720 $51.91 $107,970 $39.04 $81,190
11-3051 Industrial Production Managers 60 $42.20 $87,790 $20.25 $42,110 $53.18 $110,620 $41.15 $85,590
29-1131 Veterinarians 20 $34.98 $72,760 $28.12 $58,480 $38.42 $79,910 $30.91 $64,290
17-2051 Civil Engineers NA $33.60 $69,880 $18.24 $37,950 $41.27 $85,850 $32.99 $68,630
17-2081 Environmental Engineers NA $33.57 $69,820 $25.25 $52,520 $37.72 $78,470 $35.45 $73,740
11-1021 General and Operations Managers 100 $33.40 $69,480 $16.94 $35,230 $41.64 $86,600 $27.44 $57,070
11-3031 Financial Managers 70 $30.94 $64,350 $13.68 $28,460 $39.56 $82,300 $23.84 $49,600
17-2141 Mechanical Engineers 20 $29.39 $61,130 $16.54 $34,410 $35.82 $74,500 $30.21 $62,830
Sur Central
Sureste
Suroeste
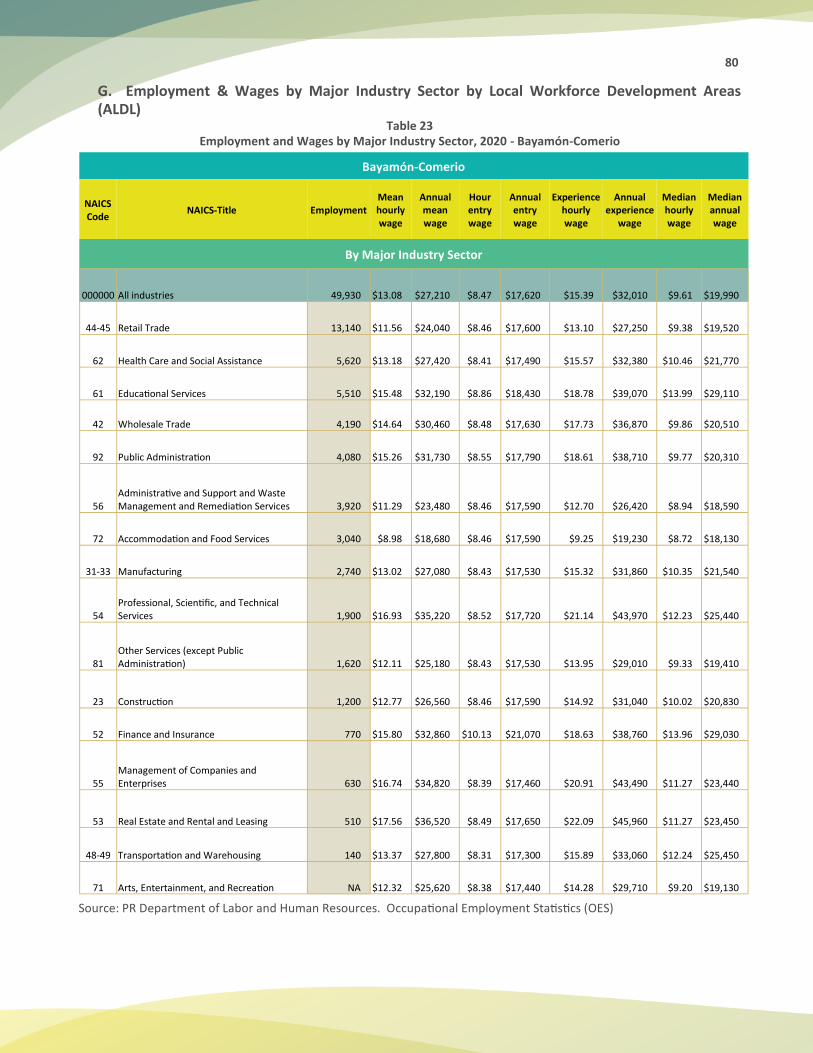
80
G. Employment & Wages by Major Industry Sector by Local Workforce Development Areas (ALDL)
Table 23 Employment and Wages by Major Industry Sector, 2020 - Bayamón-Comerio
Source: PR Department of Labor and Human Resources. Occupational Employment Statistics (OES)
Bayamón-Comerio
NAICS Code
NAICS-Title Employment Mean hourly wage
Annual mean wage
Hour entry wage
Annual entry wage
Experience hourly wage
Annual experience
wage
Median hourly wage
Median annual wage
By Major Industry Sector
000000 All industries 49,930 $13.08 $27,210 $8.47 $17,620 $15.39 $32,010 $9.61 $19,990
44-45 Retail Trade 13,140 $11.56 $24,040 $8.46 $17,600 $13.10 $27,250 $9.38 $19,520
62 Health Care and Social Assistance 5,620 $13.18 $27,420 $8.41 $17,490 $15.57 $32,380 $10.46 $21,770
61 Educational Services 5,510 $15.48 $32,190 $8.86 $18,430 $18.78 $39,070 $13.99 $29,110
42 Wholesale Trade 4,190 $14.64 $30,460 $8.48 $17,630 $17.73 $36,870 $9.86 $20,510
92 Public Administration 4,080 $15.26 $31,730 $8.55 $17,790 $18.61 $38,710 $9.77 $20,310
56 Administrative and Support and Waste Management and Remediation Services 3,920 $11.29 $23,480 $8.46 $17,590 $12.70 $26,420 $8.94 $18,590
72 Accommodation and Food Services 3,040 $8.98 $18,680 $8.46 $17,590 $9.25 $19,230 $8.72 $18,130
31-33 Manufacturing 2,740 $13.02 $27,080 $8.43 $17,530 $15.32 $31,860 $10.35 $21,540
54 Professional, Scientific, and Technical Services 1,900 $16.93 $35,220 $8.52 $17,720 $21.14 $43,970 $12.23 $25,440
81 Other Services (except Public Administration) 1,620 $12.11 $25,180 $8.43 $17,530 $13.95 $29,010 $9.33 $19,410
23 Construction 1,200 $12.77 $26,560 $8.46 $17,590 $14.92 $31,040 $10.02 $20,830
52 Finance and Insurance 770 $15.80 $32,860 $10.13 $21,070 $18.63 $38,760 $13.96 $29,030
55 Management of Companies and Enterprises 630 $16.74 $34,820 $8.39 $17,460 $20.91 $43,490 $11.27 $23,440
53 Real Estate and Rental and Leasing 510 $17.56 $36,520 $8.49 $17,650 $22.09 $45,960 $11.27 $23,450
48-49 Transportation and Warehousing 140 $13.37 $27,800 $8.31 $17,300 $15.89 $33,060 $12.24 $25,450
71 Arts, Entertainment, and Recreation NA $12.32 $25,620 $8.38 $17,440 $14.28 $29,710 $9.20 $19,130
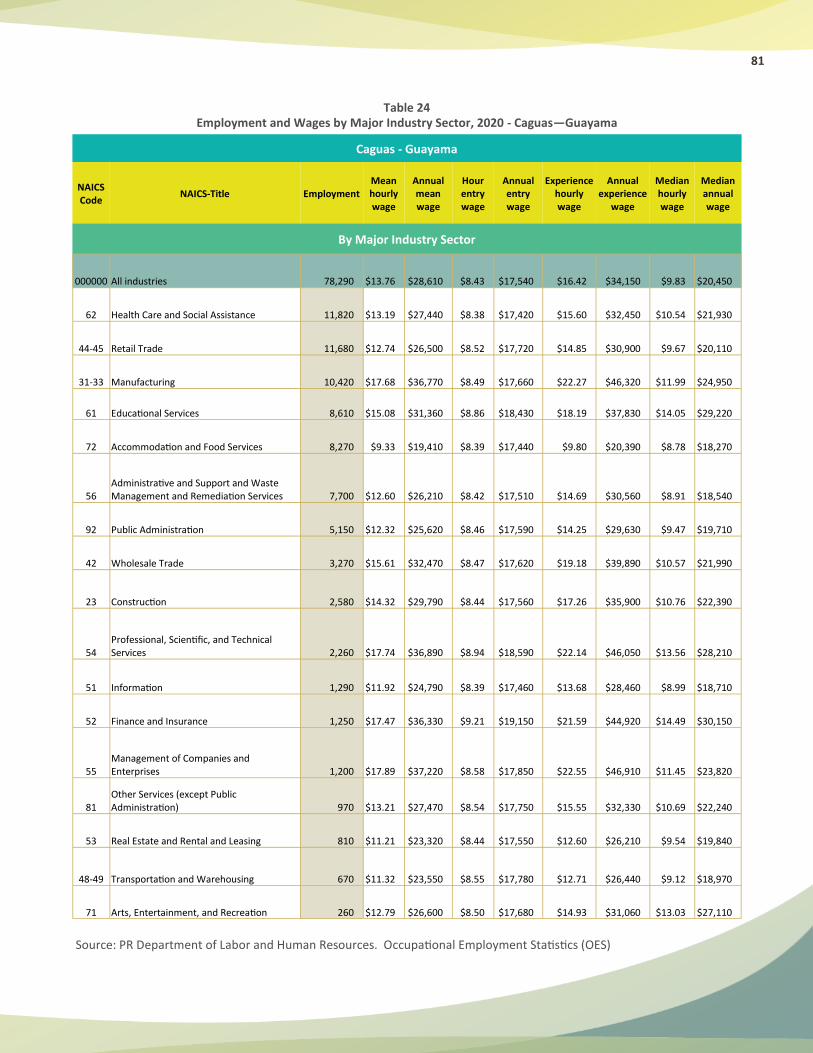
81
Table 24
Employment and Wages by Major Industry Sector, 2020 - Caguas—Guayama
Source: PR Department of Labor and Human Resources. Occupational Employment Statistics (OES)
Caguas - Guayama
NAICS Code
NAICS-Title Employment Mean hourly wage
Annual mean wage
Hour entry wage
Annual entry wage
Experience hourly wage
Annual experience
wage
Median hourly wage
Median annual wage
By Major Industry Sector
000000 All industries 78,290 $13.76 $28,610 $8.43 $17,540 $16.42 $34,150 $9.83 $20,450
62 Health Care and Social Assistance 11,820 $13.19 $27,440 $8.38 $17,420 $15.60 $32,450 $10.54 $21,930
44-45 Retail Trade 11,680 $12.74 $26,500 $8.52 $17,720 $14.85 $30,900 $9.67 $20,110
31-33 Manufacturing 10,420 $17.68 $36,770 $8.49 $17,660 $22.27 $46,320 $11.99 $24,950
61 Educational Services 8,610 $15.08 $31,360 $8.86 $18,430 $18.19 $37,830 $14.05 $29,220
72 Accommodation and Food Services 8,270 $9.33 $19,410 $8.39 $17,440 $9.80 $20,390 $8.78 $18,270
56 Administrative and Support and Waste Management and Remediation Services 7,700 $12.60 $26,210 $8.42 $17,510 $14.69 $30,560 $8.91 $18,540
92 Public Administration 5,150 $12.32 $25,620 $8.46 $17,590 $14.25 $29,630 $9.47 $19,710
42 Wholesale Trade 3,270 $15.61 $32,470 $8.47 $17,620 $19.18 $39,890 $10.57 $21,990
23 Construction 2,580 $14.32 $29,790 $8.44 $17,560 $17.26 $35,900 $10.76 $22,390
54 Professional, Scientific, and Technical Services 2,260 $17.74 $36,890 $8.94 $18,590 $22.14 $46,050 $13.56 $28,210
51 Information 1,290 $11.92 $24,790 $8.39 $17,460 $13.68 $28,460 $8.99 $18,710
52 Finance and Insurance 1,250 $17.47 $36,330 $9.21 $19,150 $21.59 $44,920 $14.49 $30,150
55 Management of Companies and Enterprises 1,200 $17.89 $37,220 $8.58 $17,850 $22.55 $46,910 $11.45 $23,820
81 Other Services (except Public Administration) 970 $13.21 $27,470 $8.54 $17,750 $15.55 $32,330 $10.69 $22,240
53 Real Estate and Rental and Leasing 810 $11.21 $23,320 $8.44 $17,550 $12.60 $26,210 $9.54 $19,840
48-49 Transportation and Warehousing 670 $11.32 $23,550 $8.55 $17,780 $12.71 $26,440 $9.12 $18,970
71 Arts, Entertainment, and Recreation 260 $12.79 $26,600 $8.50 $17,680 $14.93 $31,060 $13.03 $27,110
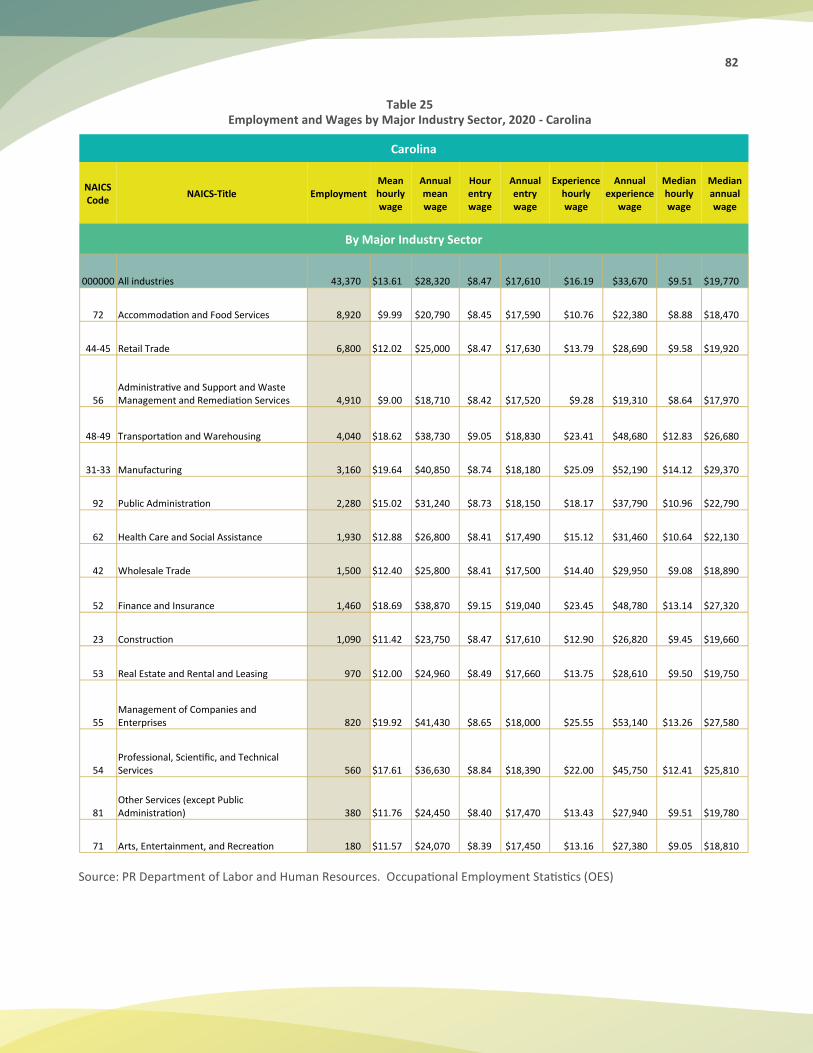
82
Table 25
Employment and Wages by Major Industry Sector, 2020 - Carolina
Source: PR Department of Labor and Human Resources. Occupational Employment Statistics (OES)
Carolina
NAICS Code
NAICS-Title Employment Mean hourly wage
Annual mean wage
Hour entry wage
Annual entry wage
Experience hourly wage
Annual experience
wage
Median hourly wage
Median annual wage
By Major Industry Sector
000000 All industries 43,370 $13.61 $28,320 $8.47 $17,610 $16.19 $33,670 $9.51 $19,770
72 Accommodation and Food Services 8,920 $9.99 $20,790 $8.45 $17,590 $10.76 $22,380 $8.88 $18,470
44-45 Retail Trade 6,800 $12.02 $25,000 $8.47 $17,630 $13.79 $28,690 $9.58 $19,920
56 Administrative and Support and Waste Management and Remediation Services 4,910 $9.00 $18,710 $8.42 $17,520 $9.28 $19,310 $8.64 $17,970
48-49 Transportation and Warehousing 4,040 $18.62 $38,730 $9.05 $18,830 $23.41 $48,680 $12.83 $26,680
31-33 Manufacturing 3,160 $19.64 $40,850 $8.74 $18,180 $25.09 $52,190 $14.12 $29,370
92 Public Administration 2,280 $15.02 $31,240 $8.73 $18,150 $18.17 $37,790 $10.96 $22,790
62 Health Care and Social Assistance 1,930 $12.88 $26,800 $8.41 $17,490 $15.12 $31,460 $10.64 $22,130
42 Wholesale Trade 1,500 $12.40 $25,800 $8.41 $17,500 $14.40 $29,950 $9.08 $18,890
52 Finance and Insurance 1,460 $18.69 $38,870 $9.15 $19,040 $23.45 $48,780 $13.14 $27,320
23 Construction 1,090 $11.42 $23,750 $8.47 $17,610 $12.90 $26,820 $9.45 $19,660
53 Real Estate and Rental and Leasing 970 $12.00 $24,960 $8.49 $17,660 $13.75 $28,610 $9.50 $19,750
55 Management of Companies and Enterprises 820 $19.92 $41,430 $8.65 $18,000 $25.55 $53,140 $13.26 $27,580
54 Professional, Scientific, and Technical Services 560 $17.61 $36,630 $8.84 $18,390 $22.00 $45,750 $12.41 $25,810
81 Other Services (except Public Administration) 380 $11.76 $24,450 $8.40 $17,470 $13.43 $27,940 $9.51 $19,780
71 Arts, Entertainment, and Recreation 180 $11.57 $24,070 $8.39 $17,450 $13.16 $27,380 $9.05 $18,810
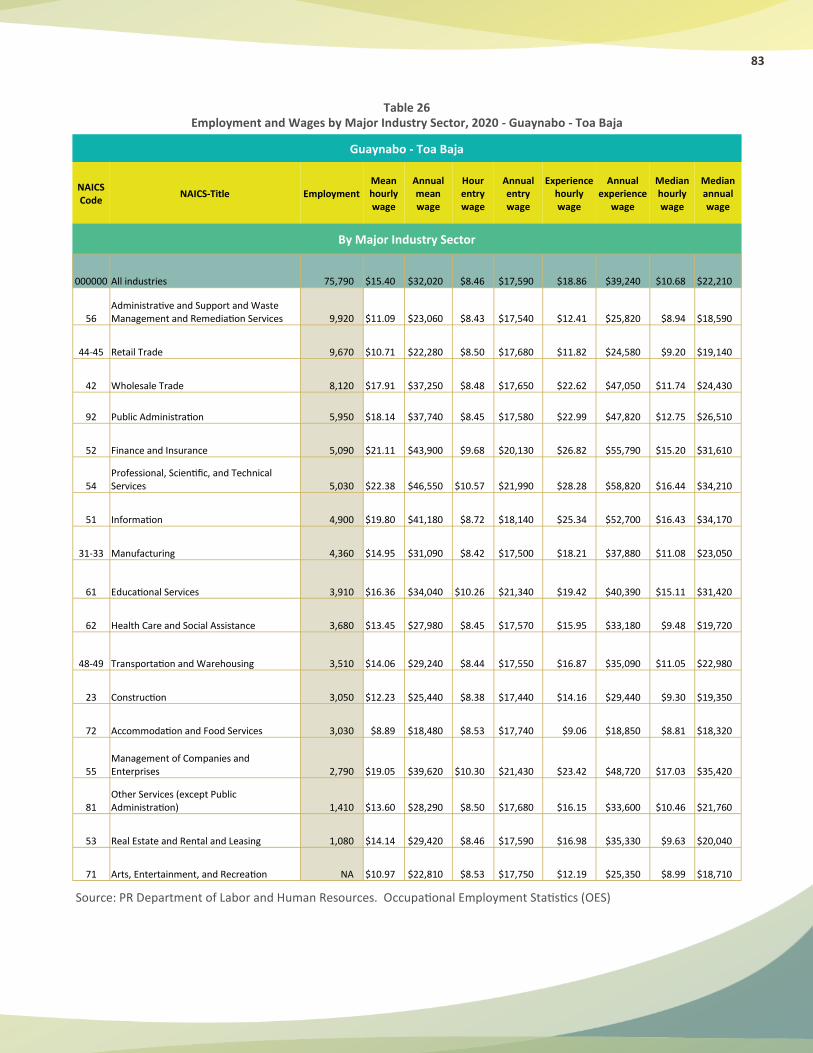
83
Table 26
Employment and Wages by Major Industry Sector, 2020 - Guaynabo - Toa Baja
Source: PR Department of Labor and Human Resources. Occupational Employment Statistics (OES)
Guaynabo - Toa Baja
NAICS Code
NAICS-Title Employment Mean hourly wage
Annual mean wage
Hour entry wage
Annual entry wage
Experience hourly wage
Annual experience
wage
Median hourly wage
Median annual wage
By Major Industry Sector
000000 All industries 75,790 $15.40 $32,020 $8.46 $17,590 $18.86 $39,240 $10.68 $22,210
56 Administrative and Support and Waste Management and Remediation Services 9,920 $11.09 $23,060 $8.43 $17,540 $12.41 $25,820 $8.94 $18,590
44-45 Retail Trade 9,670 $10.71 $22,280 $8.50 $17,680 $11.82 $24,580 $9.20 $19,140
42 Wholesale Trade 8,120 $17.91 $37,250 $8.48 $17,650 $22.62 $47,050 $11.74 $24,430
92 Public Administration 5,950 $18.14 $37,740 $8.45 $17,580 $22.99 $47,820 $12.75 $26,510
52 Finance and Insurance 5,090 $21.11 $43,900 $9.68 $20,130 $26.82 $55,790 $15.20 $31,610
54 Professional, Scientific, and Technical Services 5,030 $22.38 $46,550 $10.57 $21,990 $28.28 $58,820 $16.44 $34,210
51 Information 4,900 $19.80 $41,180 $8.72 $18,140 $25.34 $52,700 $16.43 $34,170
31-33 Manufacturing 4,360 $14.95 $31,090 $8.42 $17,500 $18.21 $37,880 $11.08 $23,050
61 Educational Services 3,910 $16.36 $34,040 $10.26 $21,340 $19.42 $40,390 $15.11 $31,420
62 Health Care and Social Assistance 3,680 $13.45 $27,980 $8.45 $17,570 $15.95 $33,180 $9.48 $19,720
48-49 Transportation and Warehousing 3,510 $14.06 $29,240 $8.44 $17,550 $16.87 $35,090 $11.05 $22,980
23 Construction 3,050 $12.23 $25,440 $8.38 $17,440 $14.16 $29,440 $9.30 $19,350
72 Accommodation and Food Services 3,030 $8.89 $18,480 $8.53 $17,740 $9.06 $18,850 $8.81 $18,320
55 Management of Companies and Enterprises 2,790 $19.05 $39,620 $10.30 $21,430 $23.42 $48,720 $17.03 $35,420
81 Other Services (except Public Administration) 1,410 $13.60 $28,290 $8.50 $17,680 $16.15 $33,600 $10.46 $21,760
53 Real Estate and Rental and Leasing 1,080 $14.14 $29,420 $8.46 $17,590 $16.98 $35,330 $9.63 $20,040
71 Arts, Entertainment, and Recreation NA $10.97 $22,810 $8.53 $17,750 $12.19 $25,350 $8.99 $18,710
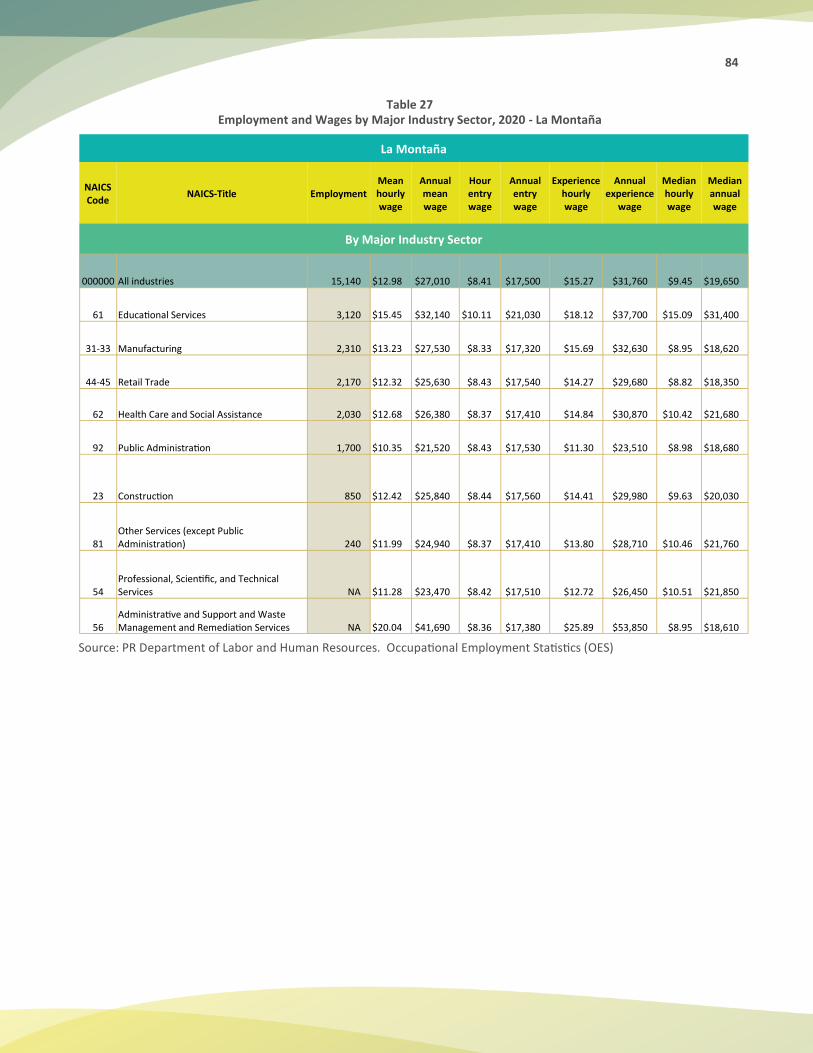
84
Table 27
Employment and Wages by Major Industry Sector, 2020 - La Montaña
Source: PR Department of Labor and Human Resources. Occupational Employment Statistics (OES)
La Montaña
NAICS Code
NAICS-Title Employment Mean hourly wage
Annual mean wage
Hour entry wage
Annual entry wage
Experience hourly wage
Annual experience
wage
Median hourly wage
Median annual wage
By Major Industry Sector
000000 All industries 15,140 $12.98 $27,010 $8.41 $17,500 $15.27 $31,760 $9.45 $19,650
61 Educational Services 3,120 $15.45 $32,140 $10.11 $21,030 $18.12 $37,700 $15.09 $31,400
31-33 Manufacturing 2,310 $13.23 $27,530 $8.33 $17,320 $15.69 $32,630 $8.95 $18,620
44-45 Retail Trade 2,170 $12.32 $25,630 $8.43 $17,540 $14.27 $29,680 $8.82 $18,350
62 Health Care and Social Assistance 2,030 $12.68 $26,380 $8.37 $17,410 $14.84 $30,870 $10.42 $21,680
92 Public Administration 1,700 $10.35 $21,520 $8.43 $17,530 $11.30 $23,510 $8.98 $18,680
23 Construction 850 $12.42 $25,840 $8.44 $17,560 $14.41 $29,980 $9.63 $20,030
81 Other Services (except Public Administration) 240 $11.99 $24,940 $8.37 $17,410 $13.80 $28,710 $10.46 $21,760
54 Professional, Scientific, and Technical Services NA $11.28 $23,470 $8.42 $17,510 $12.72 $26,450 $10.51 $21,850
56 Administrative and Support and Waste Management and Remediation Services NA $20.04 $41,690 $8.36 $17,380 $25.89 $53,850 $8.95 $18,610
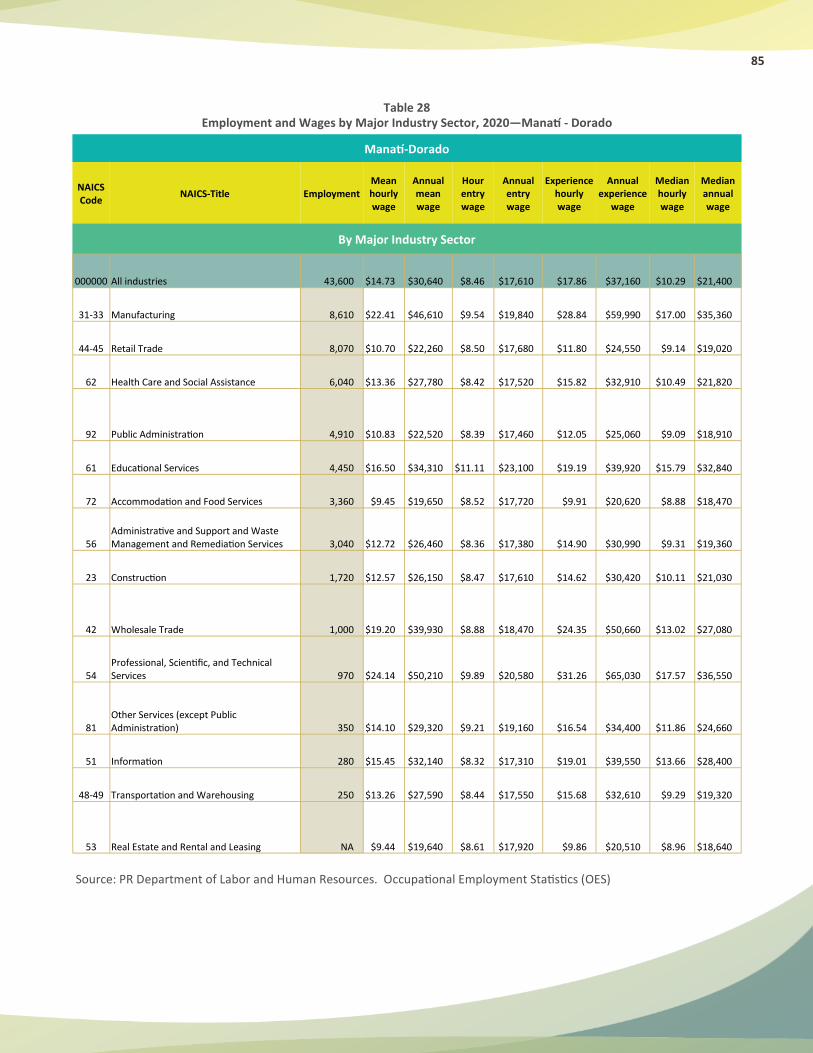
85
Table 28
Employment and Wages by Major Industry Sector, 2020—Manatí - Dorado
Source: PR Department of Labor and Human Resources. Occupational Employment Statistics (OES)
Manatí-Dorado
NAICS Code
NAICS-Title Employment Mean hourly wage
Annual mean wage
Hour entry wage
Annual entry wage
Experience hourly wage
Annual experience
wage
Median hourly wage
Median annual wage
By Major Industry Sector
000000 All industries 43,600 $14.73 $30,640 $8.46 $17,610 $17.86 $37,160 $10.29 $21,400
31-33 Manufacturing 8,610 $22.41 $46,610 $9.54 $19,840 $28.84 $59,990 $17.00 $35,360
44-45 Retail Trade 8,070 $10.70 $22,260 $8.50 $17,680 $11.80 $24,550 $9.14 $19,020
62 Health Care and Social Assistance 6,040 $13.36 $27,780 $8.42 $17,520 $15.82 $32,910 $10.49 $21,820
92 Public Administration 4,910 $10.83 $22,520 $8.39 $17,460 $12.05 $25,060 $9.09 $18,910
61 Educational Services 4,450 $16.50 $34,310 $11.11 $23,100 $19.19 $39,920 $15.79 $32,840
72 Accommodation and Food Services 3,360 $9.45 $19,650 $8.52 $17,720 $9.91 $20,620 $8.88 $18,470
56 Administrative and Support and Waste Management and Remediation Services 3,040 $12.72 $26,460 $8.36 $17,380 $14.90 $30,990 $9.31 $19,360
23 Construction 1,720 $12.57 $26,150 $8.47 $17,610 $14.62 $30,420 $10.11 $21,030
42 Wholesale Trade 1,000 $19.20 $39,930 $8.88 $18,470 $24.35 $50,660 $13.02 $27,080
54 Professional, Scientific, and Technical Services 970 $24.14 $50,210 $9.89 $20,580 $31.26 $65,030 $17.57 $36,550
81 Other Services (except Public Administration) 350 $14.10 $29,320 $9.21 $19,160 $16.54 $34,400 $11.86 $24,660
51 Information 280 $15.45 $32,140 $8.32 $17,310 $19.01 $39,550 $13.66 $28,400
48-49 Transportation and Warehousing 250 $13.26 $27,590 $8.44 $17,550 $15.68 $32,610 $9.29 $19,320
53 Real Estate and Rental and Leasing NA $9.44 $19,640 $8.61 $17,920 $9.86 $20,510 $8.96 $18,640

86
Table 29
Employment and Wages by Major Industry Sector, 2020 - Mayagüez - Las Marías
Source: PR Department of Labor and Human Resources. Occupational Employment Statistics (OES)
Mayagüez - Las Marías
NAICS Code
NAICS-Title Employment Mean hourly wage
Annual mean wage
Hour entry wage
Annual entry wage
Experience hourly wage
Annual experience
wage
Median hourly wage
Median annual wage
By Major Industry Sector
000000 All industries 23,090 $13.67 $28,440 $8.46 $17,600 $16.28 $33,860 $9.60 $19,970
62 Health Care and Social Assistance 4,350 $13.74 $28,580 $8.47 $17,620 $16.38 $34,070 $10.08 $20,960
44-45 Retail Trade 4,260 $11.01 $22,890 $8.52 $17,710 $12.25 $25,490 $9.28 $19,310
61 Educational Services 4,030 $19.83 $41,240 $10.16 $21,140 $24.66 $51,300 $16.54 $34,400
72 Accommodation and Food Services 1,740 $8.92 $18,550 $8.47 $17,620 $9.14 $19,020 $8.74 $18,180
31-33 Manufacturing 1,730 $11.25 $23,400 $8.44 $17,550 $12.66 $26,320 $9.00 $18,720
56 Administrative and Support and Waste Management and Remediation Services 1,560 $13.10 $27,250 $8.46 $17,600 $15.42 $32,080 $9.43 $19,630
92 Public Administration 1,500 $15.64 $32,530 $8.33 $17,330 $19.29 $40,120 $9.11 $18,950
54 Professional, Scientific, and Technical Services 840 $16.34 $33,990 $8.86 $18,430 $20.08 $41,760 $13.62 $28,320
52 Finance and Insurance 630 $14.16 $29,450 $8.49 $17,660 $17.00 $35,350 $11.64 $24,210
23 Construction 540 $12.45 $25,890 $8.53 $17,740 $14.41 $29,970 $9.57 $19,920
42 Wholesale Trade 450 $10.50 $21,850 $8.33 $17,320 $11.59 $24,110 $8.88 $18,470
81 Other Services (except Public Administration) 380 $10.45 $21,740 $8.46 $17,600 $11.45 $23,810 $9.08 $18,890
53 Real Estate and Rental and Leasing 310 $10.82 $22,510 $8.47 $17,630 $11.99 $24,950 $9.28 $19,300
48-49 Transportation and Warehousing 270 $9.95 $20,710 $8.46 $17,600 $10.70 $22,260 $8.95 $18,630
51 Information 170 $9.61 $19,990 $8.39 $17,460 $10.22 $21,260 $8.67 $18,040
71 Arts, Entertainment, and Recreation 30 $9.38 $19,500 $8.39 $17,450 $9.87 $20,530 $8.60 $17,900
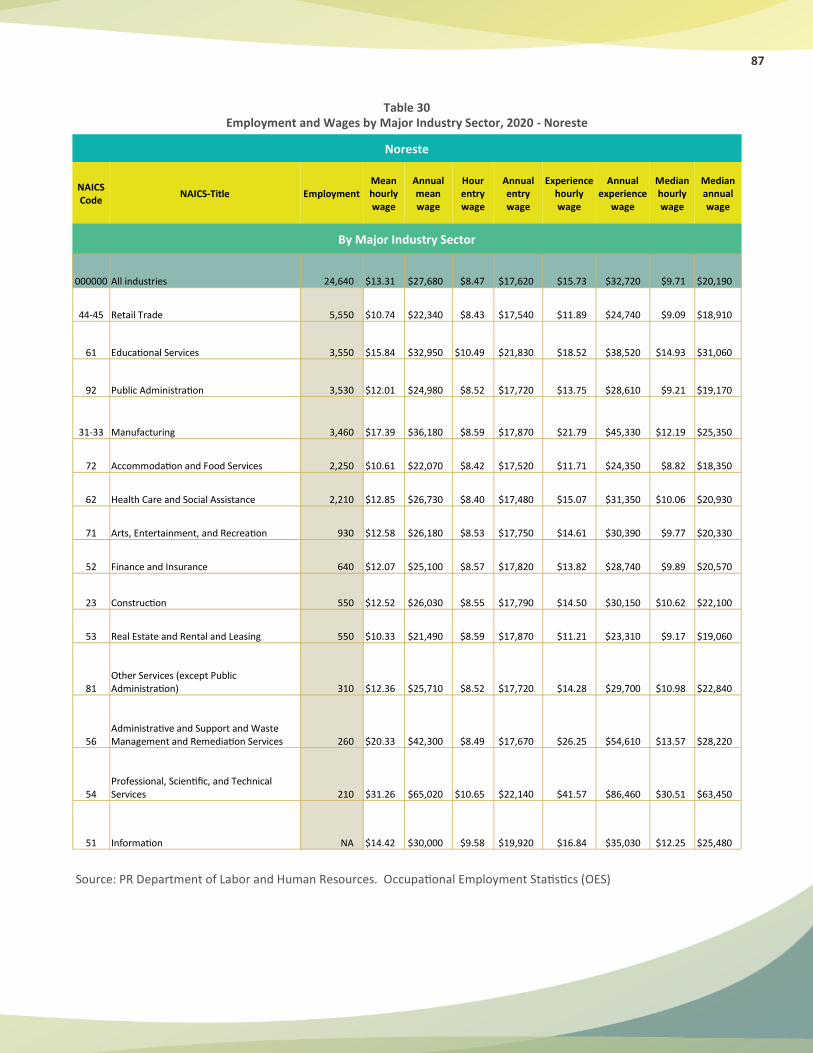
87
Table 30
Employment and Wages by Major Industry Sector, 2020 - Noreste
Source: PR Department of Labor and Human Resources. Occupational Employment Statistics (OES)
Noreste
NAICS Code
NAICS-Title Employment Mean hourly wage
Annual mean wage
Hour entry wage
Annual entry wage
Experience hourly wage
Annual experience
wage
Median hourly wage
Median annual wage
By Major Industry Sector
000000 All industries 24,640 $13.31 $27,680 $8.47 $17,620 $15.73 $32,720 $9.71 $20,190
44-45 Retail Trade 5,550 $10.74 $22,340 $8.43 $17,540 $11.89 $24,740 $9.09 $18,910
61 Educational Services 3,550 $15.84 $32,950 $10.49 $21,830 $18.52 $38,520 $14.93 $31,060
92 Public Administration 3,530 $12.01 $24,980 $8.52 $17,720 $13.75 $28,610 $9.21 $19,170
31-33 Manufacturing 3,460 $17.39 $36,180 $8.59 $17,870 $21.79 $45,330 $12.19 $25,350
72 Accommodation and Food Services 2,250 $10.61 $22,070 $8.42 $17,520 $11.71 $24,350 $8.82 $18,350
62 Health Care and Social Assistance 2,210 $12.85 $26,730 $8.40 $17,480 $15.07 $31,350 $10.06 $20,930
71 Arts, Entertainment, and Recreation 930 $12.58 $26,180 $8.53 $17,750 $14.61 $30,390 $9.77 $20,330
52 Finance and Insurance 640 $12.07 $25,100 $8.57 $17,820 $13.82 $28,740 $9.89 $20,570
23 Construction 550 $12.52 $26,030 $8.55 $17,790 $14.50 $30,150 $10.62 $22,100
53 Real Estate and Rental and Leasing 550 $10.33 $21,490 $8.59 $17,870 $11.21 $23,310 $9.17 $19,060
81 Other Services (except Public Administration) 310 $12.36 $25,710 $8.52 $17,720 $14.28 $29,700 $10.98 $22,840
56 Administrative and Support and Waste Management and Remediation Services 260 $20.33 $42,300 $8.49 $17,670 $26.25 $54,610 $13.57 $28,220
54 Professional, Scientific, and Technical Services 210 $31.26 $65,020 $10.65 $22,140 $41.57 $86,460 $30.51 $63,450
51 Information NA $14.42 $30,000 $9.58 $19,920 $16.84 $35,030 $12.25 $25,480

88
Table 31
Employment and Wages by Major Industry Sector, 2020 - Noroeste
Source: PR Department of Labor and Human Resources. Occupational Employment Statistics (OES)
Noroeste
NAICS Code
NAICS-Title Employment Mean hourly wage
Annual mean wage
Hour entry wage
Annual entry wage
Experience hourly wage
Annual experience
wage
Median hourly wage
Median annual wage
By Major Industry Sector
000000 All industries 37,530 $12.94 $26,910 $8.44 $17,560 $15.18 $31,580 $9.36 $19,460
44-45 Retail Trade 7,250 $10.66 $22,180 $8.45 $17,580 $11.77 $24,480 $8.95 $18,610
31-33 Manufacturing 4,890 $14.28 $29,700 $8.40 $17,470 $17.22 $35,810 $9.82 $20,430
61 Educational Services 4,700 $15.81 $32,890 $9.16 $19,060 $19.13 $39,800 $14.95 $31,090
62 Health Care and Social Assistance 3,900 $11.39 $23,690 $8.41 $17,500 $12.88 $26,780 $9.31 $19,360
92 Public Administration 3,700 $13.83 $28,770 $8.52 $17,710 $16.49 $34,290 $9.34 $19,440
72 Accommodation and Food Services 3,420 $9.36 $19,480 $8.46 $17,590 $9.82 $20,420 $8.81 $18,320
54 Professional, Scientific, and Technical Services 3,320 $17.77 $36,960 $8.33 $17,330 $22.49 $46,780 $15.42 $32,070
56 Administrative and Support and Waste Management and Remediation Services 1,490 $9.27 $19,290 $8.41 $17,490 $9.71 $20,190 $8.73 $18,160
23 Construction 1,270 $11.90 $24,760 $8.44 $17,560 $13.64 $28,360 $9.15 $19,040
42 Wholesale Trade 1,000 $18.58 $38,650 $8.47 $17,620 $23.64 $49,170 $12.21 $25,410
52 Finance and Insurance 720 $13.17 $27,400 $8.46 $17,590 $15.53 $32,300 $10.73 $22,310
48-49 Transportation and Warehousing 610 $11.16 $23,210 $8.44 $17,560 $12.51 $26,030 $9.06 $18,850
53 Real Estate and Rental and Leasing 380 $11.99 $24,940 $8.47 $17,630 $13.75 $28,600 $9.07 $18,860
81 Other Services (except Public Administration) 340 $9.32 $19,390 $8.44 $17,570 $9.76 $20,300 $8.89 $18,500
51 Information 300 $12.20 $25,380 $8.52 $17,730 $14.04 $29,210 $10.61 $22,070
21 Mining 60 $8.87 $18,450 $8.38 $17,430 $9.11 $18,950 $8.73 $18,150
71 Arts, Entertainment, and Recreation NA $9.70 $20,180 $8.59 $17,880 $10.25 $21,330 $9.00 $18,730
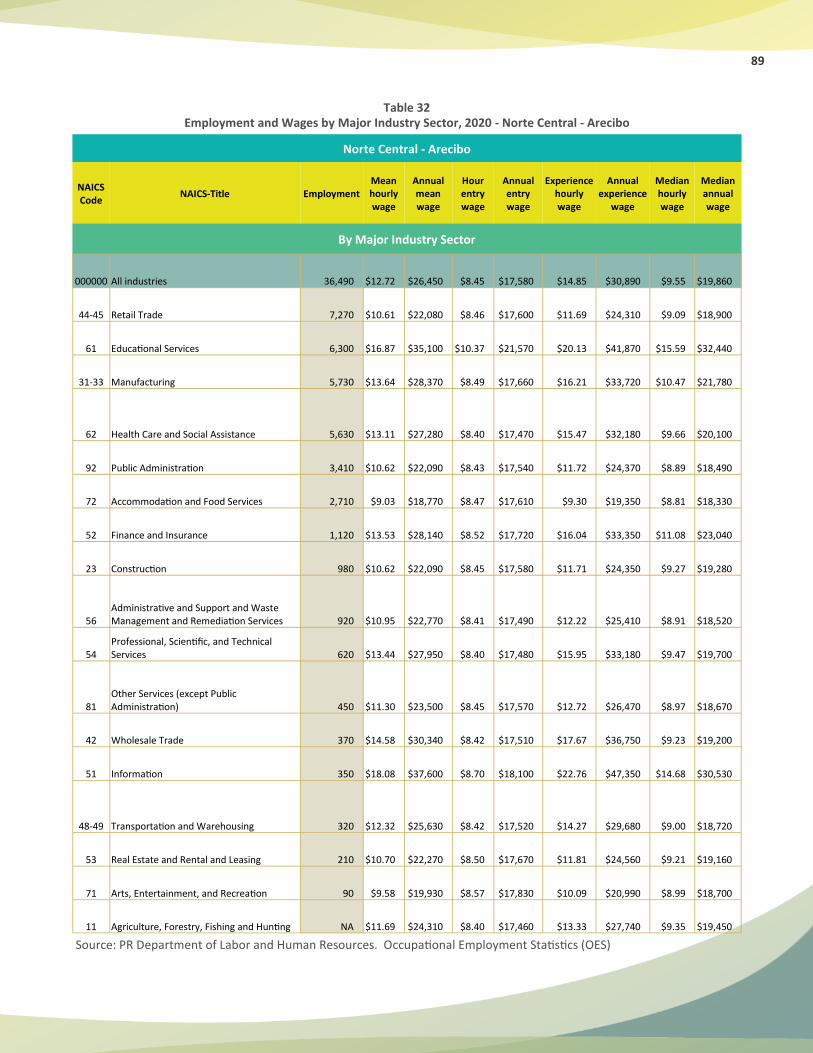
89
Table 32
Employment and Wages by Major Industry Sector, 2020 - Norte Central - Arecibo
Source: PR Department of Labor and Human Resources. Occupational Employment Statistics (OES)
Norte Central - Arecibo
NAICS Code
NAICS-Title Employment Mean hourly wage
Annual mean wage
Hour entry wage
Annual entry wage
Experience hourly wage
Annual experience
wage
Median hourly wage
Median annual wage
By Major Industry Sector
000000 All industries 36,490 $12.72 $26,450 $8.45 $17,580 $14.85 $30,890 $9.55 $19,860
44-45 Retail Trade 7,270 $10.61 $22,080 $8.46 $17,600 $11.69 $24,310 $9.09 $18,900
61 Educational Services 6,300 $16.87 $35,100 $10.37 $21,570 $20.13 $41,870 $15.59 $32,440
31-33 Manufacturing 5,730 $13.64 $28,370 $8.49 $17,660 $16.21 $33,720 $10.47 $21,780
62 Health Care and Social Assistance 5,630 $13.11 $27,280 $8.40 $17,470 $15.47 $32,180 $9.66 $20,100
92 Public Administration 3,410 $10.62 $22,090 $8.43 $17,540 $11.72 $24,370 $8.89 $18,490
72 Accommodation and Food Services 2,710 $9.03 $18,770 $8.47 $17,610 $9.30 $19,350 $8.81 $18,330
52 Finance and Insurance 1,120 $13.53 $28,140 $8.52 $17,720 $16.04 $33,350 $11.08 $23,040
23 Construction 980 $10.62 $22,090 $8.45 $17,580 $11.71 $24,350 $9.27 $19,280
56 Administrative and Support and Waste Management and Remediation Services 920 $10.95 $22,770 $8.41 $17,490 $12.22 $25,410 $8.91 $18,520
54 Professional, Scientific, and Technical Services 620 $13.44 $27,950 $8.40 $17,480 $15.95 $33,180 $9.47 $19,700
81 Other Services (except Public Administration) 450 $11.30 $23,500 $8.45 $17,570 $12.72 $26,470 $8.97 $18,670
42 Wholesale Trade 370 $14.58 $30,340 $8.42 $17,510 $17.67 $36,750 $9.23 $19,200
51 Information 350 $18.08 $37,600 $8.70 $18,100 $22.76 $47,350 $14.68 $30,530
48-49 Transportation and Warehousing 320 $12.32 $25,630 $8.42 $17,520 $14.27 $29,680 $9.00 $18,720
53 Real Estate and Rental and Leasing 210 $10.70 $22,270 $8.50 $17,670 $11.81 $24,560 $9.21 $19,160
71 Arts, Entertainment, and Recreation 90 $9.58 $19,930 $8.57 $17,830 $10.09 $20,990 $8.99 $18,700
11 Agriculture, Forestry, Fishing and Hunting NA $11.69 $24,310 $8.40 $17,460 $13.33 $27,740 $9.35 $19,450

90
Table 33
Employment and Wages by Major Industry Sector, 2020 - Ponce
Source: PR Department of Labor and Human Resources. Occupational Employment Statistics (OES)
Ponce
NAICS Code
NAICS-Title Employment Mean hourly wage
Annual mean wage
Hour entry wage
Annual entry wage
Experience hourly wage
Annual experience
wage
Median hourly wage
Median annual wage
By Major Industry Sector
0 All industries 36,660 $12.92 $26,880 $8.42 $17,520 $15.17 $31,560 $9.45 $19,660
44-45 Retail Trade 6,710 $10.97 $22,810 $8.44 $17,560 $12.23 $25,430 $9.06 $18,850
62 Health Care and Social Assistance 5,850 $13.77 $28,650 $8.47 $17,620 $16.42 $34,160 $11.02 $22,910
61 Educational Services 5,110 $17.19 $35,750 $9.22 $19,190 $21.17 $44,030 $15.08 $31,360
56 Administrative and Support and Waste Management and Remediation Services 3,570 $9.32 $19,390 $8.45 $17,580 $9.76 $20,290 $8.74 $18,170
31-33 Manufacturing 3,080 $14.58 $30,320 $8.39 $17,440 $17.67 $36,760 $10.12 $21,050
72 Accommodation and Food Services 3,060 $9.12 $18,970 $8.39 $17,460 $9.48 $19,730 $8.69 $18,070
92 Public Administration 2,710 $15.01 $31,220 $8.26 $17,180 $18.38 $38,240 $9.22 $19,180
53 Real Estate and Rental and Leasing 1,200 $11.44 $23,790 $8.37 $17,410 $12.97 $26,990 $10.39 $21,620
23 Construction 1,170 $11.11 $23,100 $8.39 $17,440 $12.47 $25,930 $9.02 $18,770
54 Professional, Scientific, and Technical Services 900 $14.26 $29,670 $8.42 $17,520 $17.18 $35,740 $9.72 $20,210
51 Information 690 $14.58 $30,330 $8.49 $17,660 $17.63 $36,670 $11.85 $24,640
42 Wholesale Trade 610 $14.03 $29,190 $8.49 $17,650 $16.81 $34,960 $11.16 $23,210
48-49 Transportation and Warehousing 500 $15.70 $32,660 $8.50 $17,690 $19.30 $40,150 $11.58 $24,080
81 Other Services (except Public Administration) 500 $11.02 $22,920 $8.54 $17,760 $12.26 $25,510 $9.30 $19,350
52 Finance and Insurance 490 $13.29 $27,640 $8.42 $17,520 $15.72 $32,700 $11.42 $23,760
71 Arts, Entertainment, and Recreation 130 $13.69 $28,480 $8.39 $17,460 $16.34 $33,990 $9.70 $20,180
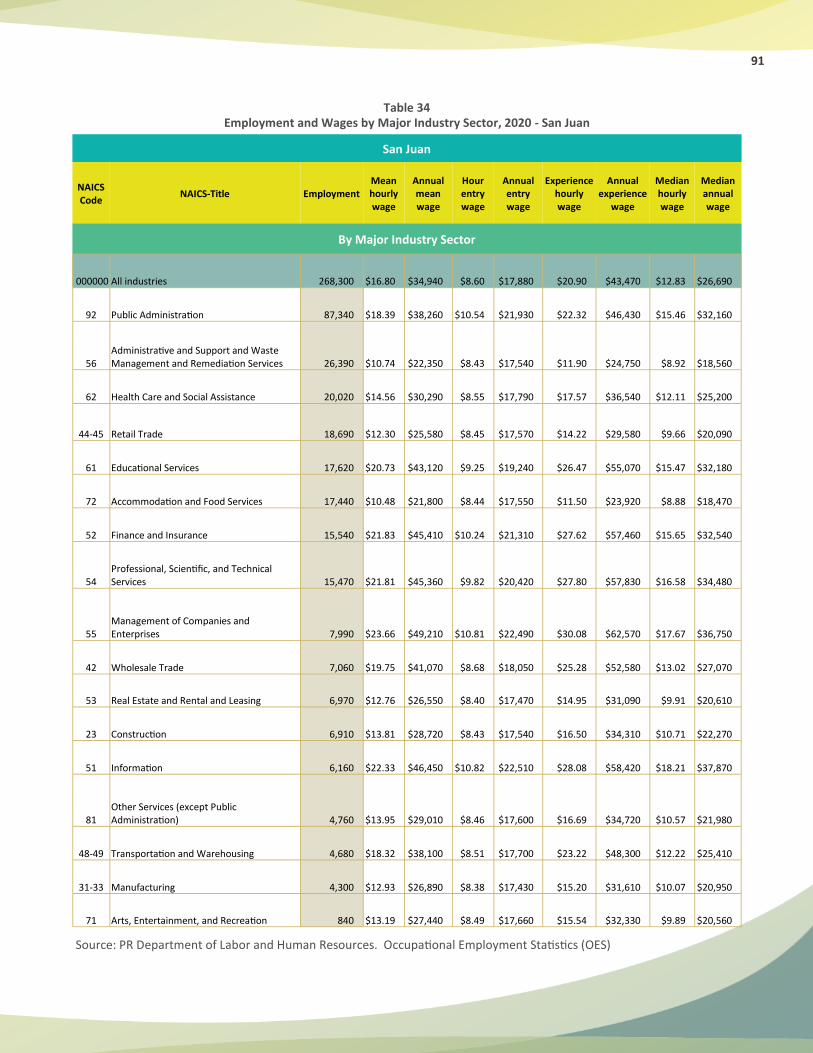
91
Table 34
Employment and Wages by Major Industry Sector, 2020 - San Juan
Source: PR Department of Labor and Human Resources. Occupational Employment Statistics (OES)
San Juan
NAICS Code
NAICS-Title Employment Mean hourly wage
Annual mean wage
Hour entry wage
Annual entry wage
Experience hourly wage
Annual experience
wage
Median hourly wage
Median annual wage
By Major Industry Sector
000000 All industries 268,300 $16.80 $34,940 $8.60 $17,880 $20.90 $43,470 $12.83 $26,690
92 Public Administration 87,340 $18.39 $38,260 $10.54 $21,930 $22.32 $46,430 $15.46 $32,160
56 Administrative and Support and Waste Management and Remediation Services 26,390 $10.74 $22,350 $8.43 $17,540 $11.90 $24,750 $8.92 $18,560
62 Health Care and Social Assistance 20,020 $14.56 $30,290 $8.55 $17,790 $17.57 $36,540 $12.11 $25,200
44-45 Retail Trade 18,690 $12.30 $25,580 $8.45 $17,570 $14.22 $29,580 $9.66 $20,090
61 Educational Services 17,620 $20.73 $43,120 $9.25 $19,240 $26.47 $55,070 $15.47 $32,180
72 Accommodation and Food Services 17,440 $10.48 $21,800 $8.44 $17,550 $11.50 $23,920 $8.88 $18,470
52 Finance and Insurance 15,540 $21.83 $45,410 $10.24 $21,310 $27.62 $57,460 $15.65 $32,540
54 Professional, Scientific, and Technical Services 15,470 $21.81 $45,360 $9.82 $20,420 $27.80 $57,830 $16.58 $34,480
55 Management of Companies and Enterprises 7,990 $23.66 $49,210 $10.81 $22,490 $30.08 $62,570 $17.67 $36,750
42 Wholesale Trade 7,060 $19.75 $41,070 $8.68 $18,050 $25.28 $52,580 $13.02 $27,070
53 Real Estate and Rental and Leasing 6,970 $12.76 $26,550 $8.40 $17,470 $14.95 $31,090 $9.91 $20,610
23 Construction 6,910 $13.81 $28,720 $8.43 $17,540 $16.50 $34,310 $10.71 $22,270
51 Information 6,160 $22.33 $46,450 $10.82 $22,510 $28.08 $58,420 $18.21 $37,870
81 Other Services (except Public Administration) 4,760 $13.95 $29,010 $8.46 $17,600 $16.69 $34,720 $10.57 $21,980
48-49 Transportation and Warehousing 4,680 $18.32 $38,100 $8.51 $17,700 $23.22 $48,300 $12.22 $25,410
31-33 Manufacturing 4,300 $12.93 $26,890 $8.38 $17,430 $15.20 $31,610 $10.07 $20,950
71 Arts, Entertainment, and Recreation 840 $13.19 $27,440 $8.49 $17,660 $15.54 $32,330 $9.89 $20,560
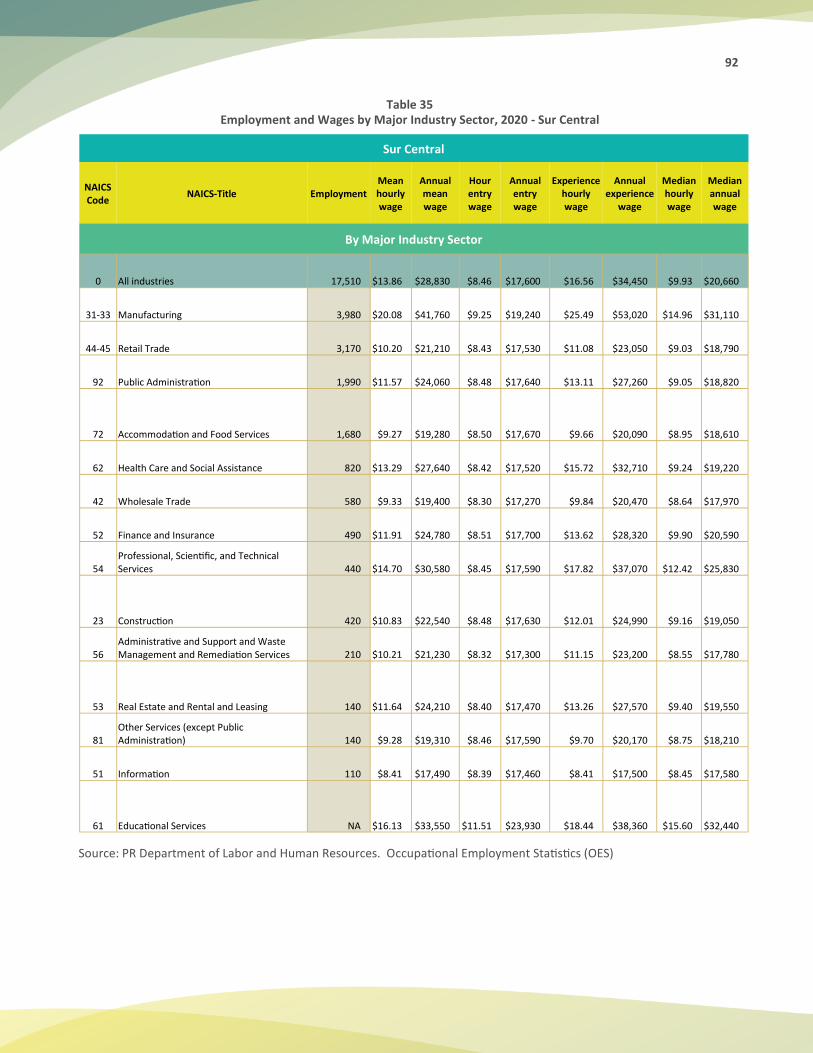
92
Table 35
Employment and Wages by Major Industry Sector, 2020 - Sur Central
Source: PR Department of Labor and Human Resources. Occupational Employment Statistics (OES)
Sur Central
NAICS Code
NAICS-Title Employment Mean hourly wage
Annual mean wage
Hour entry wage
Annual entry wage
Experience hourly wage
Annual experience
wage
Median hourly wage
Median annual wage
By Major Industry Sector
0 All industries 17,510 $13.86 $28,830 $8.46 $17,600 $16.56 $34,450 $9.93 $20,660
31-33 Manufacturing 3,980 $20.08 $41,760 $9.25 $19,240 $25.49 $53,020 $14.96 $31,110
44-45 Retail Trade 3,170 $10.20 $21,210 $8.43 $17,530 $11.08 $23,050 $9.03 $18,790
92 Public Administration 1,990 $11.57 $24,060 $8.48 $17,640 $13.11 $27,260 $9.05 $18,820
72 Accommodation and Food Services 1,680 $9.27 $19,280 $8.50 $17,670 $9.66 $20,090 $8.95 $18,610
62 Health Care and Social Assistance 820 $13.29 $27,640 $8.42 $17,520 $15.72 $32,710 $9.24 $19,220
42 Wholesale Trade 580 $9.33 $19,400 $8.30 $17,270 $9.84 $20,470 $8.64 $17,970
52 Finance and Insurance 490 $11.91 $24,780 $8.51 $17,700 $13.62 $28,320 $9.90 $20,590
54 Professional, Scientific, and Technical Services 440 $14.70 $30,580 $8.45 $17,590 $17.82 $37,070 $12.42 $25,830
23 Construction 420 $10.83 $22,540 $8.48 $17,630 $12.01 $24,990 $9.16 $19,050
56 Administrative and Support and Waste Management and Remediation Services 210 $10.21 $21,230 $8.32 $17,300 $11.15 $23,200 $8.55 $17,780
53 Real Estate and Rental and Leasing 140 $11.64 $24,210 $8.40 $17,470 $13.26 $27,570 $9.40 $19,550
81 Other Services (except Public Administration) 140 $9.28 $19,310 $8.46 $17,590 $9.70 $20,170 $8.75 $18,210
51 Information 110 $8.41 $17,490 $8.39 $17,460 $8.41 $17,500 $8.45 $17,580
61 Educational Services NA $16.13 $33,550 $11.51 $23,930 $18.44 $38,360 $15.60 $32,440

93
Table 36
Employment and Wages by Major Industry Sector, 2020 - Guaynabo - Sureste
Source: PR Department of Labor and Human Resources. Occupational Employment Statistics (OES)
Sureste
NAICS Code
NAICS-Title Employment Mean hourly wage
Annual mean wage
Hour entry wage
Annual entry wage
Experience hourly wage
Annual experience
wage
Median hourly wage
Median annual wage
By Major Industry Sector
000000 All industries 33,150 $15.33 $31,896 $8.46 $17,592 $18.77 $39,048 $9.86 $20,507
31-33 Manufacturing 8,980 $24.41 $50,777 $9.51 $19,780 $31.86 $66,275 $18.32 $38,105
44-45 Retail Trade 4,550 $9.73 $20,247 $8.46 $17,605 $10.37 $21,568 $8.81 $18,322
92 Public Administration 4,300 $10.15 $21,109 $8.51 $17,707 $10.97 $22,810 $9.06 $18,840
62 Health Care and Social Assistance 3,280 $14.42 $29,984 $8.74 $18,183 $17.25 $35,885 $12.80 $26,622
23 Construction 1,510 $11.00 $22,877 $8.50 $17,674 $12.25 $25,479 $9.36 $19,473
52 Finance and Insurance 730 $14.83 $30,848 $9.07 $18,876 $17.71 $36,834 $11.61 $24,142
51 Information 630 $11.74 $24,423 $8.56 $17,809 $13.33 $27,730 $9.59 $19,947
72 Accommodation and Food Services 620 $9.76 $20,294 $8.41 $17,493 $10.43 $21,695 $8.74 $18,177
54 Professional, Scientific, and Technical Services 360 $16.95 $35,256 $8.46 $17,602 $21.19 $44,083 $11.29 $23,491
81 Other Services (except Public Administration) 230 $15.96 $33,187 $8.44 $17,548 $19.71 $41,007 $9.78 $20,346
53 Real Estate and Rental and Leasing 220 $11.56 $24,042 $8.56 $17,815 $13.06 $27,156 $9.89 $20,569
48-49 Transportation and Warehousing 200 $9.94 $20,674 $8.32 $17,297 $10.75 $22,363 $8.79 $18,288
42 Wholesale Trade NA $9.80 $20,376 $8.71 $18,121 $10.34 $21,503 $9.44 $19,637
61 Educational Services NA $16.47 $34,253 $9.68 $20,138 $19.86 $41,310 $15.06 $31,333
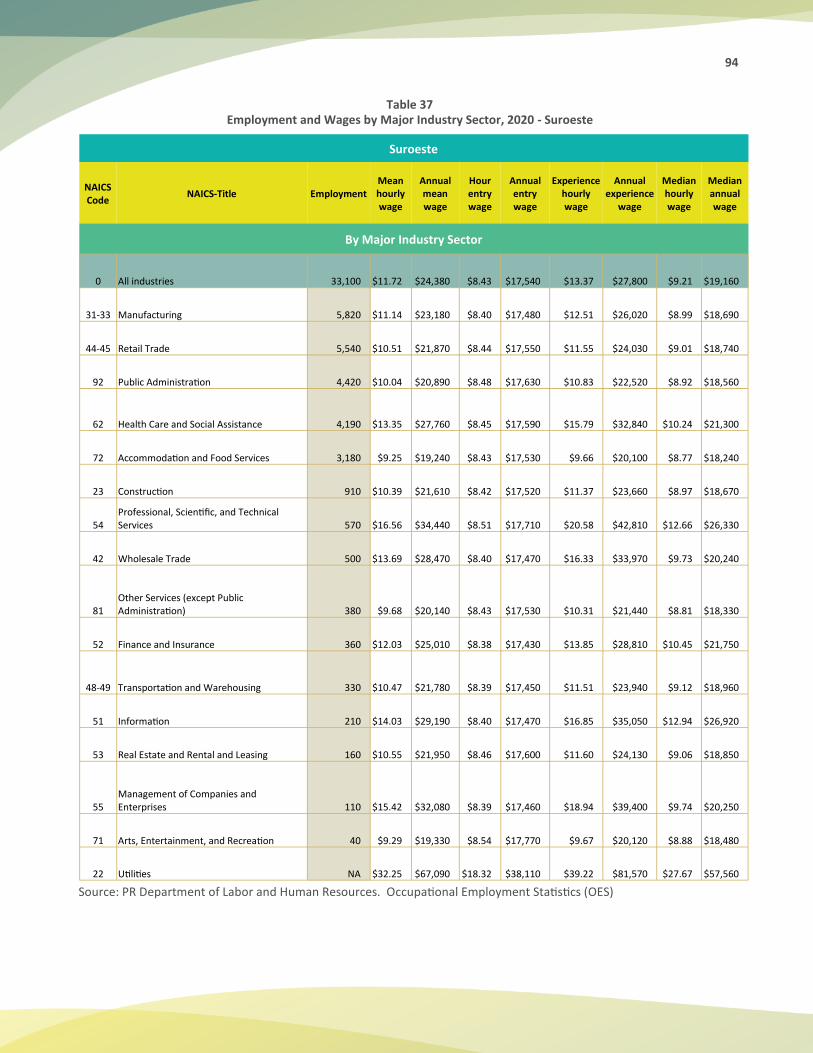
94
Table 37
Employment and Wages by Major Industry Sector, 2020 - Suroeste
Source: PR Department of Labor and Human Resources. Occupational Employment Statistics (OES)
Suroeste
NAICS Code
NAICS-Title Employment Mean hourly wage
Annual mean wage
Hour entry wage
Annual entry wage
Experience hourly wage
Annual experience
wage
Median hourly wage
Median annual wage
By Major Industry Sector
0 All industries 33,100 $11.72 $24,380 $8.43 $17,540 $13.37 $27,800 $9.21 $19,160
31-33 Manufacturing 5,820 $11.14 $23,180 $8.40 $17,480 $12.51 $26,020 $8.99 $18,690
44-45 Retail Trade 5,540 $10.51 $21,870 $8.44 $17,550 $11.55 $24,030 $9.01 $18,740
92 Public Administration 4,420 $10.04 $20,890 $8.48 $17,630 $10.83 $22,520 $8.92 $18,560
62 Health Care and Social Assistance 4,190 $13.35 $27,760 $8.45 $17,590 $15.79 $32,840 $10.24 $21,300
72 Accommodation and Food Services 3,180 $9.25 $19,240 $8.43 $17,530 $9.66 $20,100 $8.77 $18,240
23 Construction 910 $10.39 $21,610 $8.42 $17,520 $11.37 $23,660 $8.97 $18,670
54 Professional, Scientific, and Technical Services 570 $16.56 $34,440 $8.51 $17,710 $20.58 $42,810 $12.66 $26,330
42 Wholesale Trade 500 $13.69 $28,470 $8.40 $17,470 $16.33 $33,970 $9.73 $20,240
81 Other Services (except Public Administration) 380 $9.68 $20,140 $8.43 $17,530 $10.31 $21,440 $8.81 $18,330
52 Finance and Insurance 360 $12.03 $25,010 $8.38 $17,430 $13.85 $28,810 $10.45 $21,750
48-49 Transportation and Warehousing 330 $10.47 $21,780 $8.39 $17,450 $11.51 $23,940 $9.12 $18,960
51 Information 210 $14.03 $29,190 $8.40 $17,470 $16.85 $35,050 $12.94 $26,920
53 Real Estate and Rental and Leasing 160 $10.55 $21,950 $8.46 $17,600 $11.60 $24,130 $9.06 $18,850
55 Management of Companies and Enterprises 110 $15.42 $32,080 $8.39 $17,460 $18.94 $39,400 $9.74 $20,250
71 Arts, Entertainment, and Recreation 40 $9.29 $19,330 $8.54 $17,770 $9.67 $20,120 $8.88 $18,480
22 Utilities NA $32.25 $67,090 $18.32 $38,110 $39.22 $81,570 $27.67 $57,560
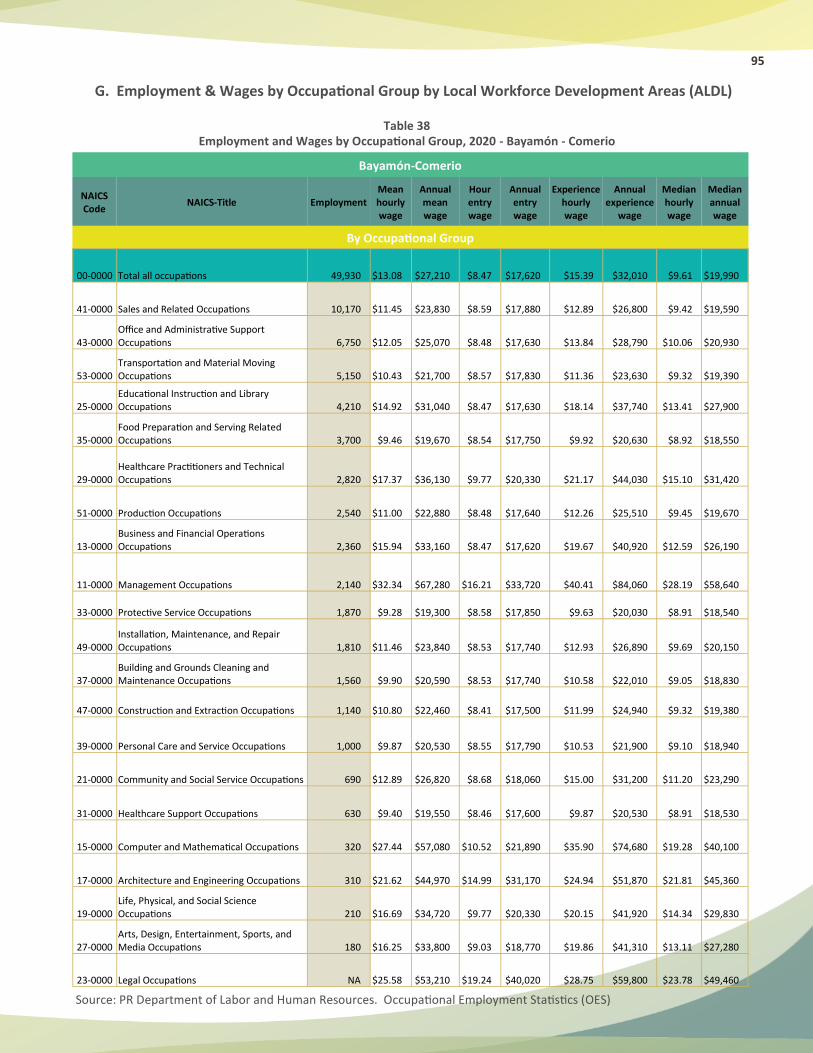
95
G. Employment & Wages by Occupational Group by Local Workforce Development Areas (ALDL)
Table 38 Employment and Wages by Occupational Group, 2020 - Bayamón - Comerio
Source: PR Department of Labor and Human Resources. Occupational Employment Statistics (OES)
Bayamón-Comerio
NAICS Code
NAICS-Title Employment Mean hourly wage
Annual mean wage
Hour entry wage
Annual entry wage
Experience hourly wage
Annual experience
wage
Median hourly wage
Median annual wage
By Occupational Group
00-0000 Total all occupations 49,930 $13.08 $27,210 $8.47 $17,620 $15.39 $32,010 $9.61 $19,990
41-0000 Sales and Related Occupations 10,170 $11.45 $23,830 $8.59 $17,880 $12.89 $26,800 $9.42 $19,590
43-0000 Office and Administrative Support Occupations 6,750 $12.05 $25,070 $8.48 $17,630 $13.84 $28,790 $10.06 $20,930
53-0000 Transportation and Material Moving Occupations 5,150 $10.43 $21,700 $8.57 $17,830 $11.36 $23,630 $9.32 $19,390
25-0000 Educational Instruction and Library Occupations 4,210 $14.92 $31,040 $8.47 $17,630 $18.14 $37,740 $13.41 $27,900
35-0000 Food Preparation and Serving Related Occupations 3,700 $9.46 $19,670 $8.54 $17,750 $9.92 $20,630 $8.92 $18,550
29-0000 Healthcare Practitioners and Technical Occupations 2,820 $17.37 $36,130 $9.77 $20,330 $21.17 $44,030 $15.10 $31,420
51-0000 Production Occupations 2,540 $11.00 $22,880 $8.48 $17,640 $12.26 $25,510 $9.45 $19,670
13-0000 Business and Financial Operations Occupations 2,360 $15.94 $33,160 $8.47 $17,620 $19.67 $40,920 $12.59 $26,190
11-0000 Management Occupations 2,140 $32.34 $67,280 $16.21 $33,720 $40.41 $84,060 $28.19 $58,640
33-0000 Protective Service Occupations 1,870 $9.28 $19,300 $8.58 $17,850 $9.63 $20,030 $8.91 $18,540
49-0000 Installation, Maintenance, and Repair Occupations 1,810 $11.46 $23,840 $8.53 $17,740 $12.93 $26,890 $9.69 $20,150
37-0000 Building and Grounds Cleaning and Maintenance Occupations 1,560 $9.90 $20,590 $8.53 $17,740 $10.58 $22,010 $9.05 $18,830
47-0000 Construction and Extraction Occupations 1,140 $10.80 $22,460 $8.41 $17,500 $11.99 $24,940 $9.32 $19,380
39-0000 Personal Care and Service Occupations 1,000 $9.87 $20,530 $8.55 $17,790 $10.53 $21,900 $9.10 $18,940
21-0000 Community and Social Service Occupations 690 $12.89 $26,820 $8.68 $18,060 $15.00 $31,200 $11.20 $23,290
31-0000 Healthcare Support Occupations 630 $9.40 $19,550 $8.46 $17,600 $9.87 $20,530 $8.91 $18,530
15-0000 Computer and Mathematical Occupations 320 $27.44 $57,080 $10.52 $21,890 $35.90 $74,680 $19.28 $40,100
17-0000 Architecture and Engineering Occupations 310 $21.62 $44,970 $14.99 $31,170 $24.94 $51,870 $21.81 $45,360
19-0000 Life, Physical, and Social Science Occupations 210 $16.69 $34,720 $9.77 $20,330 $20.15 $41,920 $14.34 $29,830
27-0000 Arts, Design, Entertainment, Sports, and Media Occupations 180 $16.25 $33,800 $9.03 $18,770 $19.86 $41,310 $13.11 $27,280
23-0000 Legal Occupations NA $25.58 $53,210 $19.24 $40,020 $28.75 $59,800 $23.78 $49,460
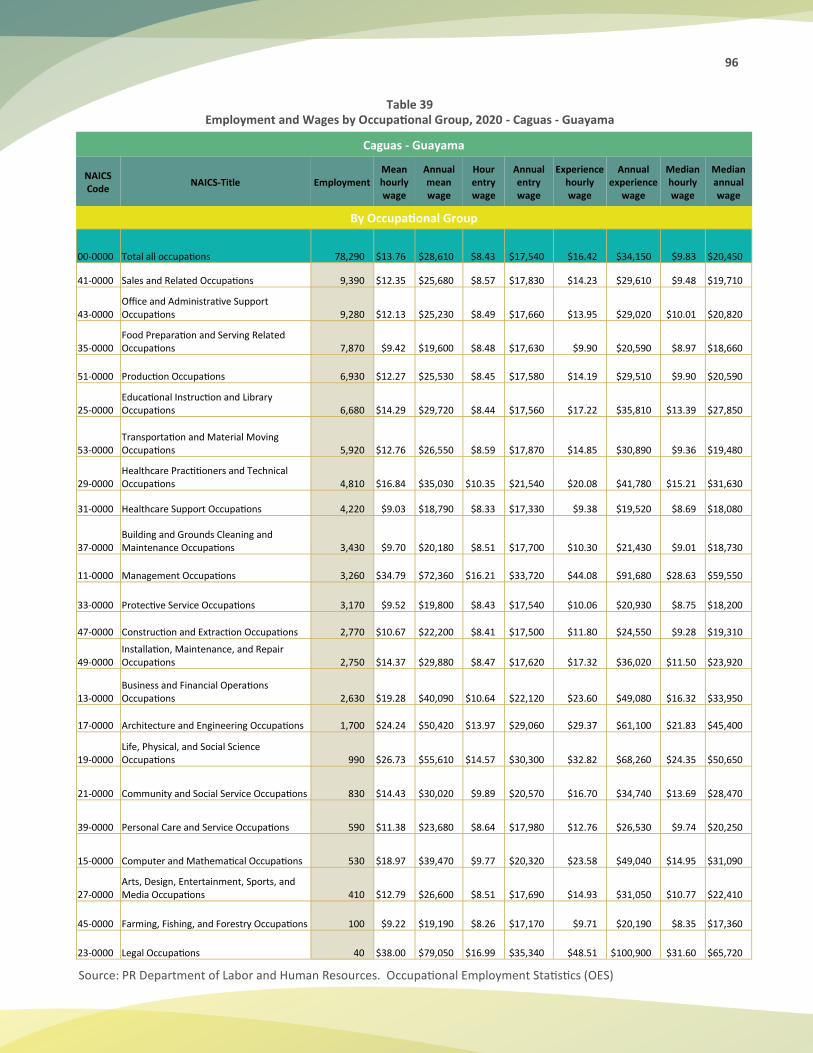
96
Table 39
Employment and Wages by Occupational Group, 2020 - Caguas - Guayama
Source: PR Department of Labor and Human Resources. Occupational Employment Statistics (OES)
Caguas - Guayama
NAICS Code
NAICS-Title Employment Mean hourly wage
Annual mean wage
Hour entry wage
Annual entry wage
Experience hourly wage
Annual experience
wage
Median hourly wage
Median annual wage
By Occupational Group
00-0000 Total all occupations 78,290 $13.76 $28,610 $8.43 $17,540 $16.42 $34,150 $9.83 $20,450
41-0000 Sales and Related Occupations 9,390 $12.35 $25,680 $8.57 $17,830 $14.23 $29,610 $9.48 $19,710
43-0000 Office and Administrative Support Occupations 9,280 $12.13 $25,230 $8.49 $17,660 $13.95 $29,020 $10.01 $20,820
35-0000 Food Preparation and Serving Related Occupations 7,870 $9.42 $19,600 $8.48 $17,630 $9.90 $20,590 $8.97 $18,660
51-0000 Production Occupations 6,930 $12.27 $25,530 $8.45 $17,580 $14.19 $29,510 $9.90 $20,590
25-0000 Educational Instruction and Library Occupations 6,680 $14.29 $29,720 $8.44 $17,560 $17.22 $35,810 $13.39 $27,850
53-0000 Transportation and Material Moving Occupations 5,920 $12.76 $26,550 $8.59 $17,870 $14.85 $30,890 $9.36 $19,480
29-0000 Healthcare Practitioners and Technical Occupations 4,810 $16.84 $35,030 $10.35 $21,540 $20.08 $41,780 $15.21 $31,630
31-0000 Healthcare Support Occupations 4,220 $9.03 $18,790 $8.33 $17,330 $9.38 $19,520 $8.69 $18,080
37-0000 Building and Grounds Cleaning and Maintenance Occupations 3,430 $9.70 $20,180 $8.51 $17,700 $10.30 $21,430 $9.01 $18,730
11-0000 Management Occupations 3,260 $34.79 $72,360 $16.21 $33,720 $44.08 $91,680 $28.63 $59,550
33-0000 Protective Service Occupations 3,170 $9.52 $19,800 $8.43 $17,540 $10.06 $20,930 $8.75 $18,200
47-0000 Construction and Extraction Occupations 2,770 $10.67 $22,200 $8.41 $17,500 $11.80 $24,550 $9.28 $19,310
49-0000 Installation, Maintenance, and Repair Occupations 2,750 $14.37 $29,880 $8.47 $17,620 $17.32 $36,020 $11.50 $23,920
13-0000 Business and Financial Operations Occupations 2,630 $19.28 $40,090 $10.64 $22,120 $23.60 $49,080 $16.32 $33,950
17-0000 Architecture and Engineering Occupations 1,700 $24.24 $50,420 $13.97 $29,060 $29.37 $61,100 $21.83 $45,400
19-0000 Life, Physical, and Social Science Occupations 990 $26.73 $55,610 $14.57 $30,300 $32.82 $68,260 $24.35 $50,650
21-0000 Community and Social Service Occupations 830 $14.43 $30,020 $9.89 $20,570 $16.70 $34,740 $13.69 $28,470
39-0000 Personal Care and Service Occupations 590 $11.38 $23,680 $8.64 $17,980 $12.76 $26,530 $9.74 $20,250
15-0000 Computer and Mathematical Occupations 530 $18.97 $39,470 $9.77 $20,320 $23.58 $49,040 $14.95 $31,090
27-0000 Arts, Design, Entertainment, Sports, and Media Occupations 410 $12.79 $26,600 $8.51 $17,690 $14.93 $31,050 $10.77 $22,410
45-0000 Farming, Fishing, and Forestry Occupations 100 $9.22 $19,190 $8.26 $17,170 $9.71 $20,190 $8.35 $17,360
23-0000 Legal Occupations 40 $38.00 $79,050 $16.99 $35,340 $48.51 $100,900 $31.60 $65,720
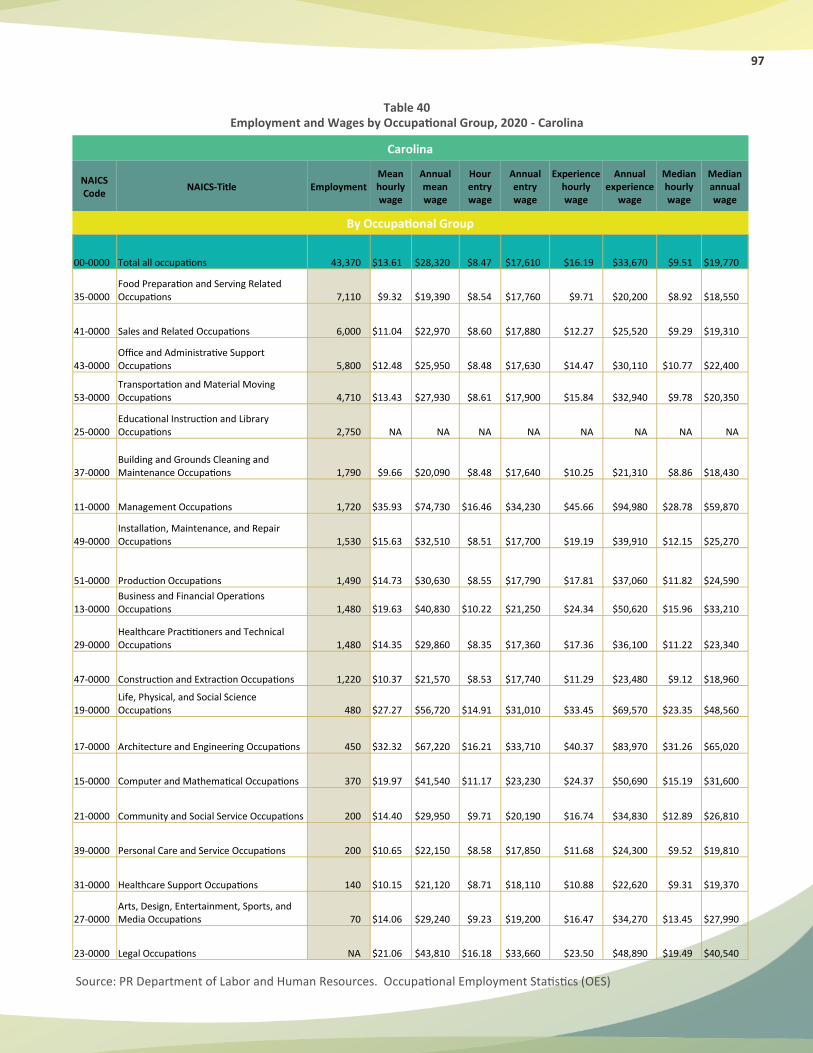
97
Table 40
Employment and Wages by Occupational Group, 2020 - Carolina
Source: PR Department of Labor and Human Resources. Occupational Employment Statistics (OES)
Carolina
NAICS Code
NAICS-Title Employment Mean hourly wage
Annual mean wage
Hour entry wage
Annual entry wage
Experience hourly wage
Annual experience
wage
Median hourly wage
Median annual wage
By Occupational Group
00-0000 Total all occupations 43,370 $13.61 $28,320 $8.47 $17,610 $16.19 $33,670 $9.51 $19,770
35-0000 Food Preparation and Serving Related Occupations 7,110 $9.32 $19,390 $8.54 $17,760 $9.71 $20,200 $8.92 $18,550
41-0000 Sales and Related Occupations 6,000 $11.04 $22,970 $8.60 $17,880 $12.27 $25,520 $9.29 $19,310
43-0000 Office and Administrative Support Occupations 5,800 $12.48 $25,950 $8.48 $17,630 $14.47 $30,110 $10.77 $22,400
53-0000 Transportation and Material Moving Occupations 4,710 $13.43 $27,930 $8.61 $17,900 $15.84 $32,940 $9.78 $20,350
25-0000 Educational Instruction and Library Occupations 2,750 NA NA NA NA NA NA NA NA
37-0000 Building and Grounds Cleaning and Maintenance Occupations 1,790 $9.66 $20,090 $8.48 $17,640 $10.25 $21,310 $8.86 $18,430
11-0000 Management Occupations 1,720 $35.93 $74,730 $16.46 $34,230 $45.66 $94,980 $28.78 $59,870
49-0000 Installation, Maintenance, and Repair Occupations 1,530 $15.63 $32,510 $8.51 $17,700 $19.19 $39,910 $12.15 $25,270
51-0000 Production Occupations 1,490 $14.73 $30,630 $8.55 $17,790 $17.81 $37,060 $11.82 $24,590
13-0000 Business and Financial Operations Occupations 1,480 $19.63 $40,830 $10.22 $21,250 $24.34 $50,620 $15.96 $33,210
29-0000 Healthcare Practitioners and Technical Occupations 1,480 $14.35 $29,860 $8.35 $17,360 $17.36 $36,100 $11.22 $23,340
47-0000 Construction and Extraction Occupations 1,220 $10.37 $21,570 $8.53 $17,740 $11.29 $23,480 $9.12 $18,960
19-0000 Life, Physical, and Social Science Occupations 480 $27.27 $56,720 $14.91 $31,010 $33.45 $69,570 $23.35 $48,560
17-0000 Architecture and Engineering Occupations 450 $32.32 $67,220 $16.21 $33,710 $40.37 $83,970 $31.26 $65,020
15-0000 Computer and Mathematical Occupations 370 $19.97 $41,540 $11.17 $23,230 $24.37 $50,690 $15.19 $31,600
21-0000 Community and Social Service Occupations 200 $14.40 $29,950 $9.71 $20,190 $16.74 $34,830 $12.89 $26,810
39-0000 Personal Care and Service Occupations 200 $10.65 $22,150 $8.58 $17,850 $11.68 $24,300 $9.52 $19,810
31-0000 Healthcare Support Occupations 140 $10.15 $21,120 $8.71 $18,110 $10.88 $22,620 $9.31 $19,370
27-0000 Arts, Design, Entertainment, Sports, and Media Occupations 70 $14.06 $29,240 $9.23 $19,200 $16.47 $34,270 $13.45 $27,990
23-0000 Legal Occupations NA $21.06 $43,810 $16.18 $33,660 $23.50 $48,890 $19.49 $40,540

98
Table 41
Employment and Wages by Occupational Group, 2020 - Guaynabo - Toa Baja
Source: PR Department of Labor and Human Resources. Occupational Employment Statistics (OES)
Guaynabo - Toa Baja
NAICS Code
NAICS-Title Employment Mean hourly wage
Annual mean wage
Hour entry wage
Annual entry wage
Experience hourly wage
Annual experience
wage
Median hourly wage
Median annual wage
By Occupational Group
00-0000 Total all occupations 75,790 $15.40 $32,020 $8.46 $17,590 $18.86 $39,240 $10.68 $22,210
43-0000 Office and Administrative Support Occupations 14,400 $12.66 $26,340 $8.44 $17,570 $14.77 $30,730 $10.51 $21,850
41-0000 Sales and Related Occupations 9,510 $13.19 $27,440 $8.62 $17,920 $15.48 $32,190 $9.59 $19,950
53-0000 Transportation and Material Moving Occupations 9,090 $10.67 $22,190 $8.58 $17,850 $11.71 $24,360 $9.39 $19,530
13-0000 Business and Financial Operations Occupations 5,260 $21.54 $44,810 $11.88 $24,710 $26.37 $54,860 $19.40 $40,350
11-0000 Management Occupations 4,490 $43.50 $90,480 $20.86 $43,390 $54.82 $114,030 $36.34 $75,580
35-0000 Food Preparation and Serving Related Occupations 3,900 $9.27 $19,280 $8.60 $17,890 $9.60 $19,970 $8.98 $18,680
51-0000 Production Occupations 3,720 $12.08 $25,120 $8.46 $17,590 $13.89 $28,880 $10.08 $20,960
49-0000 Installation, Maintenance, and Repair Occupations 3,630 $13.98 $29,080 $8.83 $18,370 $16.56 $34,440 $12.39 $25,760
25-0000 Educational Instruction and Library Occupations 3,440 $15.33 $31,890 $10.13 $21,070 $17.93 $37,300 $14.52 $30,200
37-0000 Building and Grounds Cleaning and Maintenance Occupations 3,360 $8.94 $18,590 $8.40 $17,480 $9.20 $19,140 $8.65 $17,990
47-0000 Construction and Extraction Occupations 3,100 $10.67 $22,200 $8.35 $17,370 $11.83 $24,610 $9.03 $18,790
33-0000 Protective Service Occupations 2,630 $12.45 $25,890 $8.62 $17,930 $14.36 $29,870 $9.35 $19,460
29-0000 Healthcare Practitioners and Technical Occupations 1,990 $18.68 $38,860 $10.51 $21,850 $22.77 $47,360 $14.46 $30,070
15-0000 Computer and Mathematical Occupations 1,510 $20.85 $43,370 $10.77 $22,390 $25.89 $53,850 $18.56 $38,610
17-0000 Architecture and Engineering Occupations 1,460 $22.37 $46,530 $11.90 $24,740 $27.61 $57,420 $20.78 $43,230
27-0000 Arts, Design, Entertainment, Sports, and Media Occupations 1,340 $23.59 $49,070 $13.02 $27,090 $28.88 $60,070 $20.45 $42,540
39-0000 Personal Care and Service Occupations 950 $9.78 $20,340 $8.45 $17,580 $10.44 $21,710 $8.96 $18,640
31-0000 Healthcare Support Occupations 880 $9.50 $19,750 $8.58 $17,850 $9.96 $20,710 $9.01 $18,740
21-0000 Community and Social Service Occupations 670 $15.10 $31,410 $9.89 $20,570 $17.71 $36,840 $13.06 $27,160
19-0000 Life, Physical, and Social Science Occupations 360 $27.09 $56,360 $15.45 $32,140 $32.91 $68,460 $24.49 $50,950
23-0000 Legal Occupations 80 $40.97 $85,210 $25.89 $53,860 $48.50 $100,890 $33.97 $70,660
45-0000 Farming, Fishing, and Forestry Occupations 40 $14.18 $29,490 $8.26 $17,170 $17.14 $35,650 $9.99 $20,780
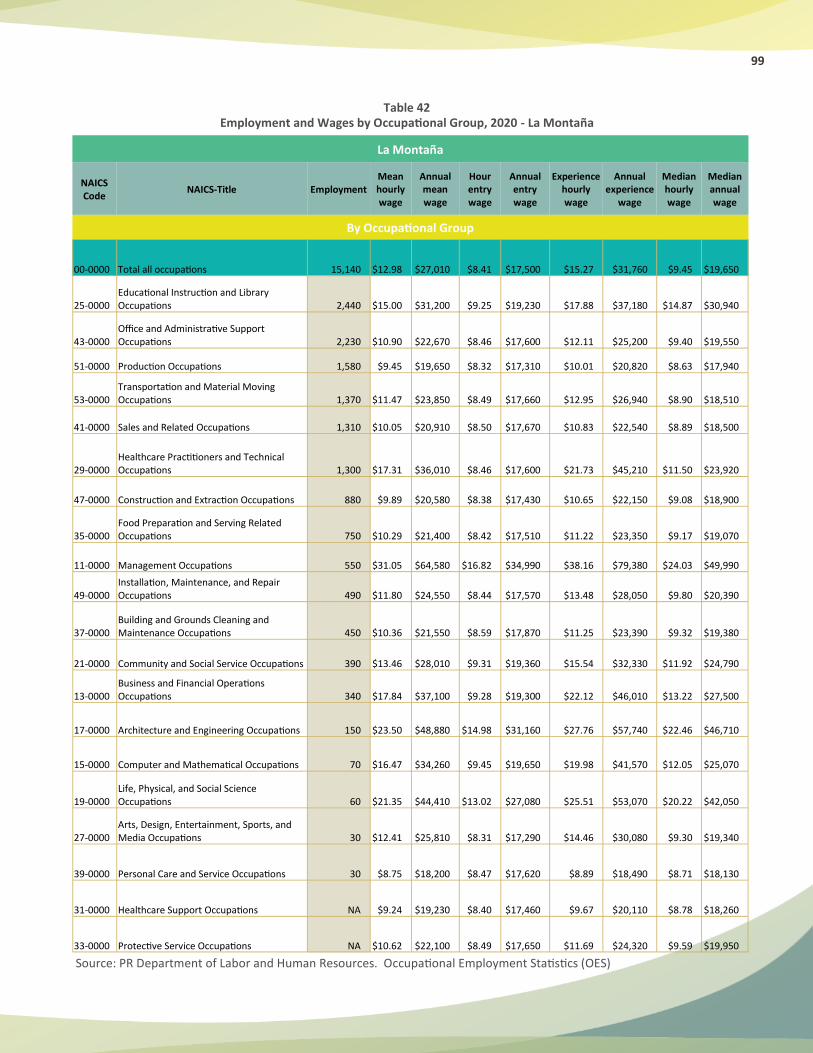
99
Table 42
Employment and Wages by Occupational Group, 2020 - La Montaña
Source: PR Department of Labor and Human Resources. Occupational Employment Statistics (OES)
La Montaña
NAICS Code
NAICS-Title Employment Mean hourly wage
Annual mean wage
Hour entry wage
Annual entry wage
Experience hourly wage
Annual experience
wage
Median hourly wage
Median annual wage
By Occupational Group
00-0000 Total all occupations 15,140 $12.98 $27,010 $8.41 $17,500 $15.27 $31,760 $9.45 $19,650
25-0000 Educational Instruction and Library Occupations 2,440 $15.00 $31,200 $9.25 $19,230 $17.88 $37,180 $14.87 $30,940
43-0000 Office and Administrative Support Occupations 2,230 $10.90 $22,670 $8.46 $17,600 $12.11 $25,200 $9.40 $19,550
51-0000 Production Occupations 1,580 $9.45 $19,650 $8.32 $17,310 $10.01 $20,820 $8.63 $17,940
53-0000 Transportation and Material Moving Occupations 1,370 $11.47 $23,850 $8.49 $17,660 $12.95 $26,940 $8.90 $18,510
41-0000 Sales and Related Occupations 1,310 $10.05 $20,910 $8.50 $17,670 $10.83 $22,540 $8.89 $18,500
29-0000 Healthcare Practitioners and Technical Occupations 1,300 $17.31 $36,010 $8.46 $17,600 $21.73 $45,210 $11.50 $23,920
47-0000 Construction and Extraction Occupations 880 $9.89 $20,580 $8.38 $17,430 $10.65 $22,150 $9.08 $18,900
35-0000 Food Preparation and Serving Related Occupations 750 $10.29 $21,400 $8.42 $17,510 $11.22 $23,350 $9.17 $19,070
11-0000 Management Occupations 550 $31.05 $64,580 $16.82 $34,990 $38.16 $79,380 $24.03 $49,990
49-0000 Installation, Maintenance, and Repair Occupations 490 $11.80 $24,550 $8.44 $17,570 $13.48 $28,050 $9.80 $20,390
37-0000 Building and Grounds Cleaning and Maintenance Occupations 450 $10.36 $21,550 $8.59 $17,870 $11.25 $23,390 $9.32 $19,380
21-0000 Community and Social Service Occupations 390 $13.46 $28,010 $9.31 $19,360 $15.54 $32,330 $11.92 $24,790
13-0000 Business and Financial Operations Occupations 340 $17.84 $37,100 $9.28 $19,300 $22.12 $46,010 $13.22 $27,500
17-0000 Architecture and Engineering Occupations 150 $23.50 $48,880 $14.98 $31,160 $27.76 $57,740 $22.46 $46,710
15-0000 Computer and Mathematical Occupations 70 $16.47 $34,260 $9.45 $19,650 $19.98 $41,570 $12.05 $25,070
19-0000 Life, Physical, and Social Science Occupations 60 $21.35 $44,410 $13.02 $27,080 $25.51 $53,070 $20.22 $42,050
27-0000 Arts, Design, Entertainment, Sports, and Media Occupations 30 $12.41 $25,810 $8.31 $17,290 $14.46 $30,080 $9.30 $19,340
39-0000 Personal Care and Service Occupations 30 $8.75 $18,200 $8.47 $17,620 $8.89 $18,490 $8.71 $18,130
31-0000 Healthcare Support Occupations NA $9.24 $19,230 $8.40 $17,460 $9.67 $20,110 $8.78 $18,260
33-0000 Protective Service Occupations NA $10.62 $22,100 $8.49 $17,650 $11.69 $24,320 $9.59 $19,950
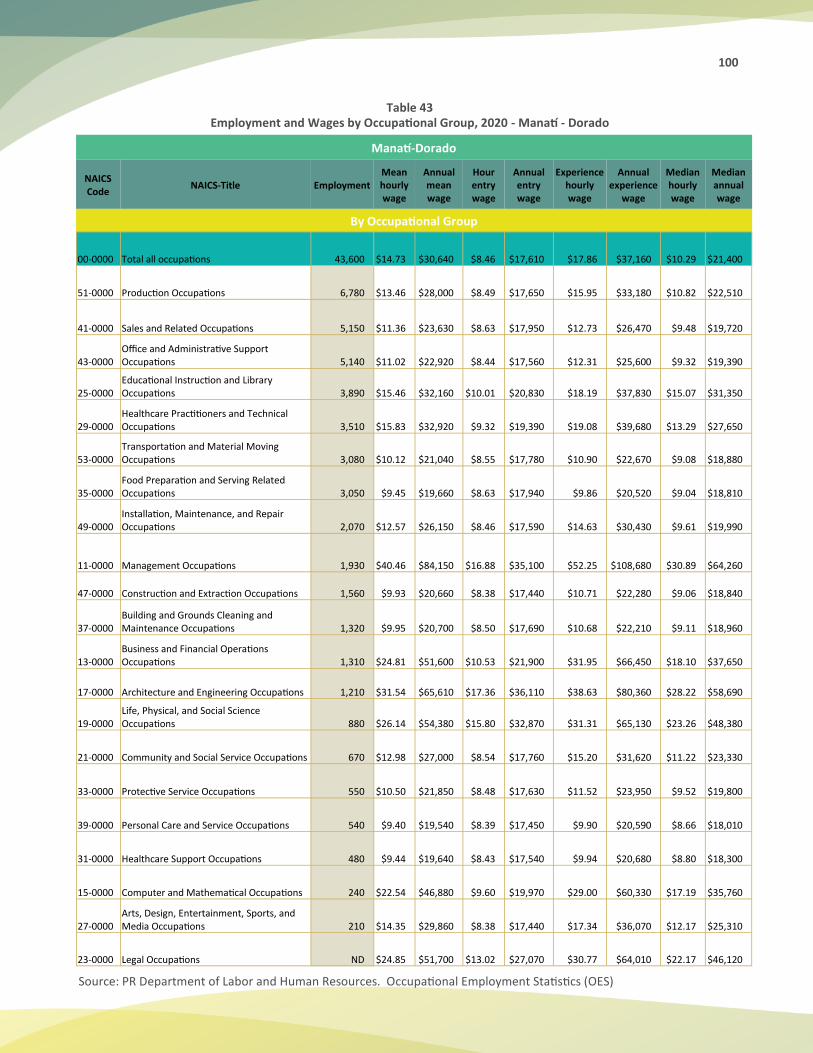
100
Table 43
Employment and Wages by Occupational Group, 2020 - Manatí - Dorado
Source: PR Department of Labor and Human Resources. Occupational Employment Statistics (OES)
Manatí-Dorado
NAICS Code
NAICS-Title Employment Mean hourly wage
Annual mean wage
Hour entry wage
Annual entry wage
Experience hourly wage
Annual experience
wage
Median hourly wage
Median annual wage
By Occupational Group
00-0000 Total all occupations 43,600 $14.73 $30,640 $8.46 $17,610 $17.86 $37,160 $10.29 $21,400
51-0000 Production Occupations 6,780 $13.46 $28,000 $8.49 $17,650 $15.95 $33,180 $10.82 $22,510
41-0000 Sales and Related Occupations 5,150 $11.36 $23,630 $8.63 $17,950 $12.73 $26,470 $9.48 $19,720
43-0000 Office and Administrative Support Occupations 5,140 $11.02 $22,920 $8.44 $17,560 $12.31 $25,600 $9.32 $19,390
25-0000 Educational Instruction and Library Occupations 3,890 $15.46 $32,160 $10.01 $20,830 $18.19 $37,830 $15.07 $31,350
29-0000 Healthcare Practitioners and Technical Occupations 3,510 $15.83 $32,920 $9.32 $19,390 $19.08 $39,680 $13.29 $27,650
53-0000 Transportation and Material Moving Occupations 3,080 $10.12 $21,040 $8.55 $17,780 $10.90 $22,670 $9.08 $18,880
35-0000 Food Preparation and Serving Related Occupations 3,050 $9.45 $19,660 $8.63 $17,940 $9.86 $20,520 $9.04 $18,810
49-0000 Installation, Maintenance, and Repair Occupations 2,070 $12.57 $26,150 $8.46 $17,590 $14.63 $30,430 $9.61 $19,990
11-0000 Management Occupations 1,930 $40.46 $84,150 $16.88 $35,100 $52.25 $108,680 $30.89 $64,260
47-0000 Construction and Extraction Occupations 1,560 $9.93 $20,660 $8.38 $17,440 $10.71 $22,280 $9.06 $18,840
37-0000 Building and Grounds Cleaning and Maintenance Occupations 1,320 $9.95 $20,700 $8.50 $17,690 $10.68 $22,210 $9.11 $18,960
13-0000 Business and Financial Operations Occupations 1,310 $24.81 $51,600 $10.53 $21,900 $31.95 $66,450 $18.10 $37,650
17-0000 Architecture and Engineering Occupations 1,210 $31.54 $65,610 $17.36 $36,110 $38.63 $80,360 $28.22 $58,690
19-0000 Life, Physical, and Social Science Occupations 880 $26.14 $54,380 $15.80 $32,870 $31.31 $65,130 $23.26 $48,380
21-0000 Community and Social Service Occupations 670 $12.98 $27,000 $8.54 $17,760 $15.20 $31,620 $11.22 $23,330
33-0000 Protective Service Occupations 550 $10.50 $21,850 $8.48 $17,630 $11.52 $23,950 $9.52 $19,800
39-0000 Personal Care and Service Occupations 540 $9.40 $19,540 $8.39 $17,450 $9.90 $20,590 $8.66 $18,010
31-0000 Healthcare Support Occupations 480 $9.44 $19,640 $8.43 $17,540 $9.94 $20,680 $8.80 $18,300
15-0000 Computer and Mathematical Occupations 240 $22.54 $46,880 $9.60 $19,970 $29.00 $60,330 $17.19 $35,760
27-0000 Arts, Design, Entertainment, Sports, and Media Occupations 210 $14.35 $29,860 $8.38 $17,440 $17.34 $36,070 $12.17 $25,310
23-0000 Legal Occupations ND $24.85 $51,700 $13.02 $27,070 $30.77 $64,010 $22.17 $46,120
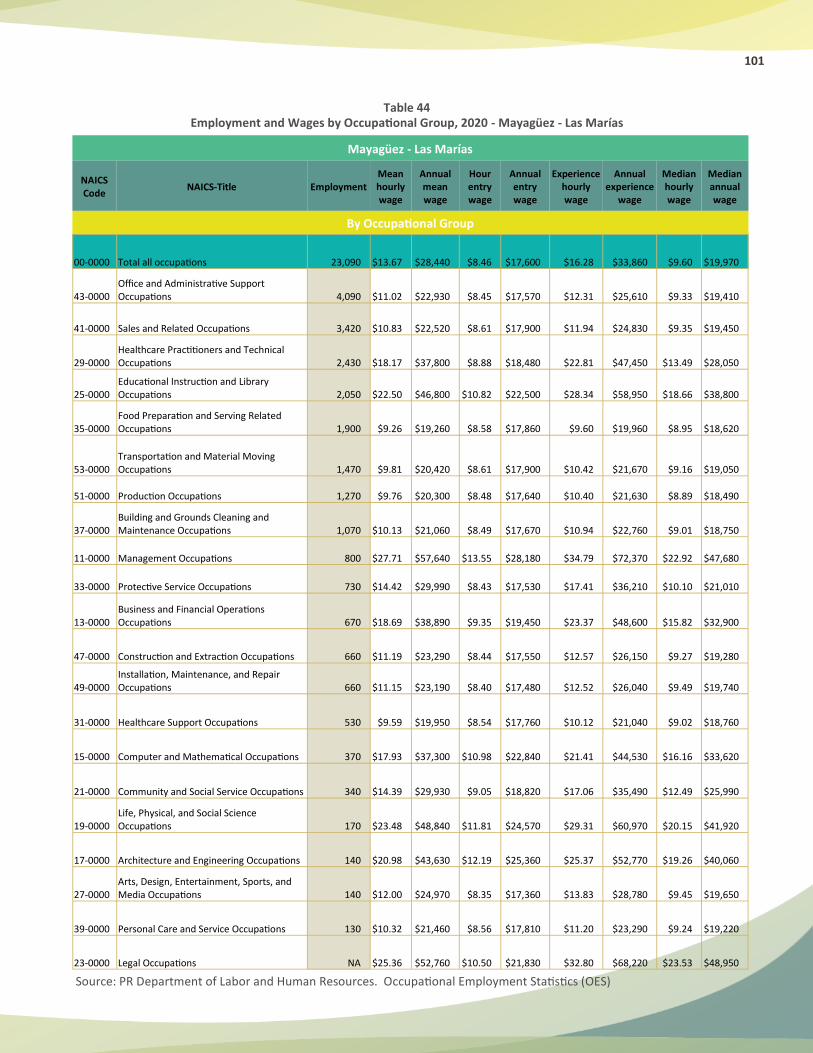
101
Table 44
Employment and Wages by Occupational Group, 2020 - Mayagüez - Las Marías
Source: PR Department of Labor and Human Resources. Occupational Employment Statistics (OES)
Mayagüez - Las Marías
NAICS Code
NAICS-Title Employment Mean hourly wage
Annual mean wage
Hour entry wage
Annual entry wage
Experience hourly wage
Annual experience
wage
Median hourly wage
Median annual wage
By Occupational Group
00-0000 Total all occupations 23,090 $13.67 $28,440 $8.46 $17,600 $16.28 $33,860 $9.60 $19,970
43-0000 Office and Administrative Support Occupations 4,090 $11.02 $22,930 $8.45 $17,570 $12.31 $25,610 $9.33 $19,410
41-0000 Sales and Related Occupations 3,420 $10.83 $22,520 $8.61 $17,900 $11.94 $24,830 $9.35 $19,450
29-0000 Healthcare Practitioners and Technical Occupations 2,430 $18.17 $37,800 $8.88 $18,480 $22.81 $47,450 $13.49 $28,050
25-0000 Educational Instruction and Library Occupations 2,050 $22.50 $46,800 $10.82 $22,500 $28.34 $58,950 $18.66 $38,800
35-0000 Food Preparation and Serving Related Occupations 1,900 $9.26 $19,260 $8.58 $17,860 $9.60 $19,960 $8.95 $18,620
53-0000 Transportation and Material Moving Occupations 1,470 $9.81 $20,420 $8.61 $17,900 $10.42 $21,670 $9.16 $19,050
51-0000 Production Occupations 1,270 $9.76 $20,300 $8.48 $17,640 $10.40 $21,630 $8.89 $18,490
37-0000 Building and Grounds Cleaning and Maintenance Occupations 1,070 $10.13 $21,060 $8.49 $17,670 $10.94 $22,760 $9.01 $18,750
11-0000 Management Occupations 800 $27.71 $57,640 $13.55 $28,180 $34.79 $72,370 $22.92 $47,680
33-0000 Protective Service Occupations 730 $14.42 $29,990 $8.43 $17,530 $17.41 $36,210 $10.10 $21,010
13-0000 Business and Financial Operations Occupations 670 $18.69 $38,890 $9.35 $19,450 $23.37 $48,600 $15.82 $32,900
47-0000 Construction and Extraction Occupations 660 $11.19 $23,290 $8.44 $17,550 $12.57 $26,150 $9.27 $19,280
49-0000 Installation, Maintenance, and Repair Occupations 660 $11.15 $23,190 $8.40 $17,480 $12.52 $26,040 $9.49 $19,740
31-0000 Healthcare Support Occupations 530 $9.59 $19,950 $8.54 $17,760 $10.12 $21,040 $9.02 $18,760
15-0000 Computer and Mathematical Occupations 370 $17.93 $37,300 $10.98 $22,840 $21.41 $44,530 $16.16 $33,620
21-0000 Community and Social Service Occupations 340 $14.39 $29,930 $9.05 $18,820 $17.06 $35,490 $12.49 $25,990
19-0000 Life, Physical, and Social Science Occupations 170 $23.48 $48,840 $11.81 $24,570 $29.31 $60,970 $20.15 $41,920
17-0000 Architecture and Engineering Occupations 140 $20.98 $43,630 $12.19 $25,360 $25.37 $52,770 $19.26 $40,060
27-0000 Arts, Design, Entertainment, Sports, and Media Occupations 140 $12.00 $24,970 $8.35 $17,360 $13.83 $28,780 $9.45 $19,650
39-0000 Personal Care and Service Occupations 130 $10.32 $21,460 $8.56 $17,810 $11.20 $23,290 $9.24 $19,220
23-0000 Legal Occupations NA $25.36 $52,760 $10.50 $21,830 $32.80 $68,220 $23.53 $48,950
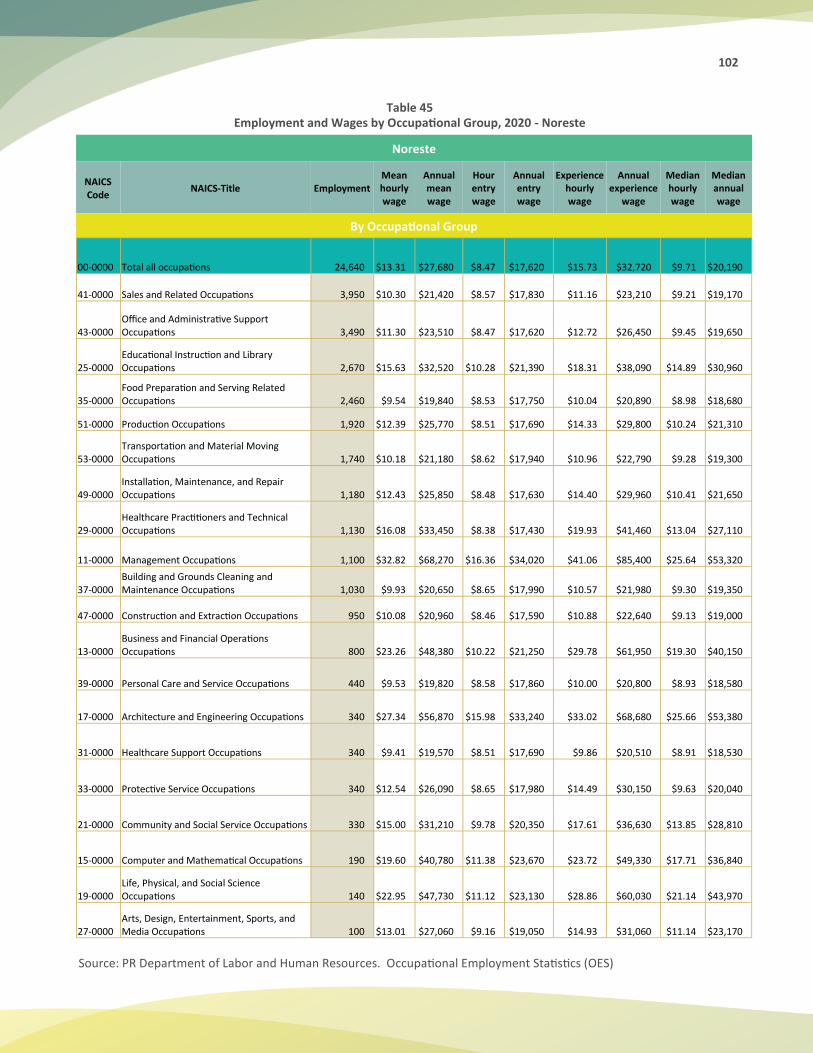
102
Table 45
Employment and Wages by Occupational Group, 2020 - Noreste
Source: PR Department of Labor and Human Resources. Occupational Employment Statistics (OES)
Noreste
NAICS Code
NAICS-Title Employment Mean hourly wage
Annual mean wage
Hour entry wage
Annual entry wage
Experience hourly wage
Annual experience
wage
Median hourly wage
Median annual wage
By Occupational Group
00-0000 Total all occupations 24,640 $13.31 $27,680 $8.47 $17,620 $15.73 $32,720 $9.71 $20,190
41-0000 Sales and Related Occupations 3,950 $10.30 $21,420 $8.57 $17,830 $11.16 $23,210 $9.21 $19,170
43-0000 Office and Administrative Support Occupations 3,490 $11.30 $23,510 $8.47 $17,620 $12.72 $26,450 $9.45 $19,650
25-0000 Educational Instruction and Library Occupations 2,670 $15.63 $32,520 $10.28 $21,390 $18.31 $38,090 $14.89 $30,960
35-0000 Food Preparation and Serving Related Occupations 2,460 $9.54 $19,840 $8.53 $17,750 $10.04 $20,890 $8.98 $18,680
51-0000 Production Occupations 1,920 $12.39 $25,770 $8.51 $17,690 $14.33 $29,800 $10.24 $21,310
53-0000 Transportation and Material Moving Occupations 1,740 $10.18 $21,180 $8.62 $17,940 $10.96 $22,790 $9.28 $19,300
49-0000 Installation, Maintenance, and Repair Occupations 1,180 $12.43 $25,850 $8.48 $17,630 $14.40 $29,960 $10.41 $21,650
29-0000 Healthcare Practitioners and Technical Occupations 1,130 $16.08 $33,450 $8.38 $17,430 $19.93 $41,460 $13.04 $27,110
11-0000 Management Occupations 1,100 $32.82 $68,270 $16.36 $34,020 $41.06 $85,400 $25.64 $53,320
37-0000 Building and Grounds Cleaning and Maintenance Occupations 1,030 $9.93 $20,650 $8.65 $17,990 $10.57 $21,980 $9.30 $19,350
47-0000 Construction and Extraction Occupations 950 $10.08 $20,960 $8.46 $17,590 $10.88 $22,640 $9.13 $19,000
13-0000 Business and Financial Operations Occupations 800 $23.26 $48,380 $10.22 $21,250 $29.78 $61,950 $19.30 $40,150
39-0000 Personal Care and Service Occupations 440 $9.53 $19,820 $8.58 $17,860 $10.00 $20,800 $8.93 $18,580
17-0000 Architecture and Engineering Occupations 340 $27.34 $56,870 $15.98 $33,240 $33.02 $68,680 $25.66 $53,380
31-0000 Healthcare Support Occupations 340 $9.41 $19,570 $8.51 $17,690 $9.86 $20,510 $8.91 $18,530
33-0000 Protective Service Occupations 340 $12.54 $26,090 $8.65 $17,980 $14.49 $30,150 $9.63 $20,040
21-0000 Community and Social Service Occupations 330 $15.00 $31,210 $9.78 $20,350 $17.61 $36,630 $13.85 $28,810
15-0000 Computer and Mathematical Occupations 190 $19.60 $40,780 $11.38 $23,670 $23.72 $49,330 $17.71 $36,840
19-0000 Life, Physical, and Social Science Occupations 140 $22.95 $47,730 $11.12 $23,130 $28.86 $60,030 $21.14 $43,970
27-0000 Arts, Design, Entertainment, Sports, and Media Occupations 100 $13.01 $27,060 $9.16 $19,050 $14.93 $31,060 $11.14 $23,170

103
Table 46
Employment and Wages by Occupational Group, 2020 - Noroeste
Source: PR Department of Labor and Human Resources. Occupational Employment Statistics (OES)
Noroeste
NAICS Code
NAICS-Title Employment Mean hourly wage
Annual mean wage
Hour entry wage
Annual entry wage
Experience hourly wage
Annual experience
wage
Median hourly wage
Median annual wage
By Occupational Group
00-0000 Total all occupations 37,530 $12.94 $26,910 $8.44 $17,560 $15.18 $31,580 $9.36 $19,460
43-0000 Office and Administrative Support Occupations 5,710 $10.36 $21,550 $8.41 $17,490 $11.33 $23,570 $9.06 $18,850
41-0000 Sales and Related Occupations 5,580 $10.02 $20,850 $8.56 $17,800 $10.76 $22,370 $9.03 $18,780
51-0000 Production Occupations 3,790 $11.08 $23,040 $8.42 $17,520 $12.41 $25,810 $9.31 $19,370
25-0000 Educational Instruction and Library Occupations 3,670 $15.68 $32,610 $8.98 $18,680 $19.03 $39,580 $14.82 $30,820
35-0000 Food Preparation and Serving Related Occupations 3,290 $9.29 $19,330 $8.55 $17,780 $9.67 $20,110 $8.93 $18,580
53-0000 Transportation and Material Moving Occupations 2,650 $10.16 $21,140 $8.55 $17,780 $10.97 $22,820 $9.11 $18,940
29-0000 Healthcare Practitioners and Technical Occupations 1,700 $14.50 $30,150 $8.43 $17,540 $17.53 $36,460 $11.61 $24,160
37-0000 Building and Grounds Cleaning and Maintenance Occupations 1,450 $9.68 $20,130 $8.52 $17,730 $10.26 $21,330 $9.02 $18,760
11-0000 Management Occupations 1,390 $30.69 $63,840 $13.08 $27,210 $39.50 $82,160 $23.55 $48,980
47-0000 Construction and Extraction Occupations 1,360 $9.52 $19,800 $8.42 $17,520 $10.07 $20,940 $8.85 $18,410
49-0000 Installation, Maintenance, and Repair Occupations 1,150 $11.40 $23,710 $8.47 $17,610 $12.87 $26,760 $9.30 $19,350
15-0000 Computer and Mathematical Occupations 1,110 $22.39 $46,580 $14.57 $30,300 $26.31 $54,720 $19.53 $40,610
31-0000 Healthcare Support Occupations 1,030 $8.87 $18,450 $8.57 $17,830 $9.02 $18,760 $8.84 $18,390
13-0000 Business and Financial Operations Occupations 1,010 $20.02 $41,640 $10.20 $21,230 $24.93 $51,850 $16.58 $34,480
17-0000 Architecture and Engineering Occupations 910 $30.35 $63,130 $18.32 $38,100 $36.37 $75,650 $28.99 $60,310
33-0000 Protective Service Occupations 680 $14.11 $29,340 $8.54 $17,760 $16.89 $35,130 $9.14 $19,000
21-0000 Community and Social Service Occupations 420 $14.21 $29,550 $9.68 $20,140 $16.47 $34,250 $13.12 $27,290
39-0000 Personal Care and Service Occupations 340 $9.43 $19,620 $8.61 $17,920 $9.84 $20,480 $9.06 $18,850
19-0000 Life, Physical, and Social Science Occupations 170 $19.80 $41,170 $11.24 $23,370 $24.07 $50,080 $17.19 $35,750
27-0000 Arts, Design, Entertainment, Sports, and Media Occupations 80 $15.58 $32,410 $8.35 $17,360 $19.20 $39,930 $9.52 $19,800
23-0000 Legal Occupations 40 $25.42 $52,870 $17.16 $35,700 $29.54 $61,450 $19.78 $41,140
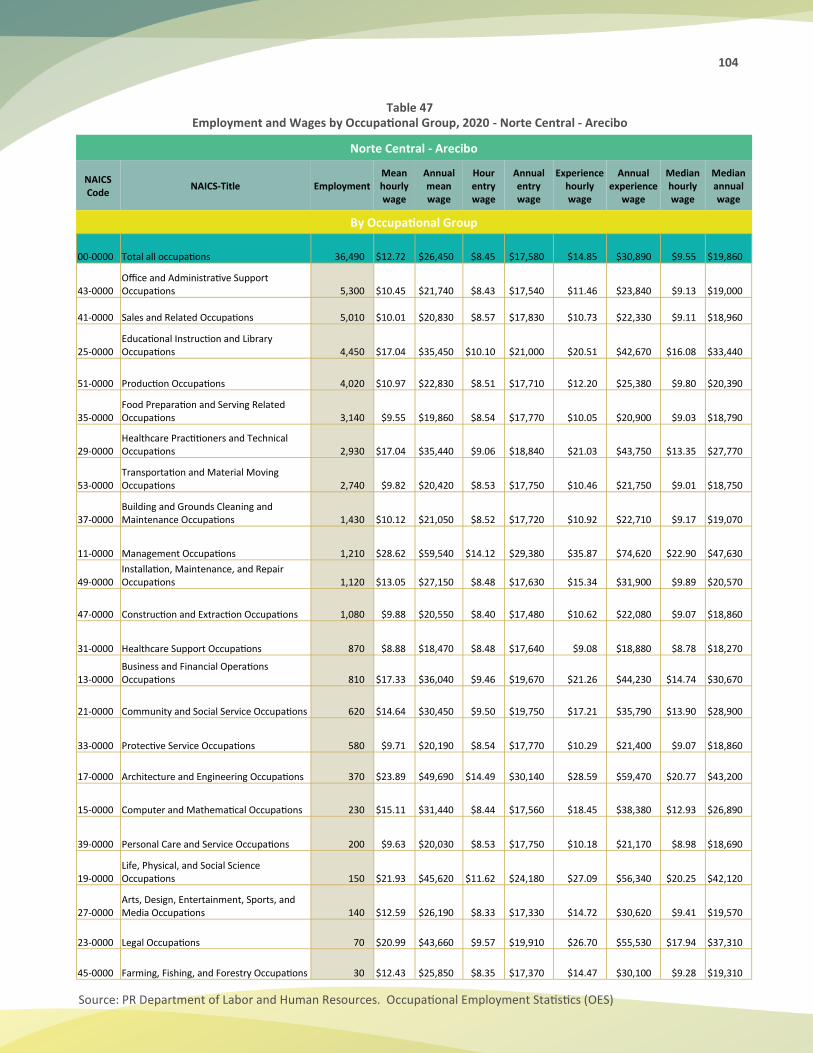
104
Table 47
Employment and Wages by Occupational Group, 2020 - Norte Central - Arecibo
Source: PR Department of Labor and Human Resources. Occupational Employment Statistics (OES)
Norte Central - Arecibo
NAICS Code
NAICS-Title Employment Mean hourly wage
Annual mean wage
Hour entry wage
Annual entry wage
Experience hourly wage
Annual experience
wage
Median hourly wage
Median annual wage
By Occupational Group
00-0000 Total all occupations 36,490 $12.72 $26,450 $8.45 $17,580 $14.85 $30,890 $9.55 $19,860
43-0000 Office and Administrative Support Occupations 5,300 $10.45 $21,740 $8.43 $17,540 $11.46 $23,840 $9.13 $19,000
41-0000 Sales and Related Occupations 5,010 $10.01 $20,830 $8.57 $17,830 $10.73 $22,330 $9.11 $18,960
25-0000 Educational Instruction and Library Occupations 4,450 $17.04 $35,450 $10.10 $21,000 $20.51 $42,670 $16.08 $33,440
51-0000 Production Occupations 4,020 $10.97 $22,830 $8.51 $17,710 $12.20 $25,380 $9.80 $20,390
35-0000 Food Preparation and Serving Related Occupations 3,140 $9.55 $19,860 $8.54 $17,770 $10.05 $20,900 $9.03 $18,790
29-0000 Healthcare Practitioners and Technical Occupations 2,930 $17.04 $35,440 $9.06 $18,840 $21.03 $43,750 $13.35 $27,770
53-0000 Transportation and Material Moving Occupations 2,740 $9.82 $20,420 $8.53 $17,750 $10.46 $21,750 $9.01 $18,750
37-0000 Building and Grounds Cleaning and Maintenance Occupations 1,430 $10.12 $21,050 $8.52 $17,720 $10.92 $22,710 $9.17 $19,070
11-0000 Management Occupations 1,210 $28.62 $59,540 $14.12 $29,380 $35.87 $74,620 $22.90 $47,630
49-0000 Installation, Maintenance, and Repair Occupations 1,120 $13.05 $27,150 $8.48 $17,630 $15.34 $31,900 $9.89 $20,570
47-0000 Construction and Extraction Occupations 1,080 $9.88 $20,550 $8.40 $17,480 $10.62 $22,080 $9.07 $18,860
31-0000 Healthcare Support Occupations 870 $8.88 $18,470 $8.48 $17,640 $9.08 $18,880 $8.78 $18,270
13-0000 Business and Financial Operations Occupations 810 $17.33 $36,040 $9.46 $19,670 $21.26 $44,230 $14.74 $30,670
21-0000 Community and Social Service Occupations 620 $14.64 $30,450 $9.50 $19,750 $17.21 $35,790 $13.90 $28,900
33-0000 Protective Service Occupations 580 $9.71 $20,190 $8.54 $17,770 $10.29 $21,400 $9.07 $18,860
17-0000 Architecture and Engineering Occupations 370 $23.89 $49,690 $14.49 $30,140 $28.59 $59,470 $20.77 $43,200
15-0000 Computer and Mathematical Occupations 230 $15.11 $31,440 $8.44 $17,560 $18.45 $38,380 $12.93 $26,890
39-0000 Personal Care and Service Occupations 200 $9.63 $20,030 $8.53 $17,750 $10.18 $21,170 $8.98 $18,690
19-0000 Life, Physical, and Social Science Occupations 150 $21.93 $45,620 $11.62 $24,180 $27.09 $56,340 $20.25 $42,120
27-0000 Arts, Design, Entertainment, Sports, and Media Occupations 140 $12.59 $26,190 $8.33 $17,330 $14.72 $30,620 $9.41 $19,570
23-0000 Legal Occupations 70 $20.99 $43,660 $9.57 $19,910 $26.70 $55,530 $17.94 $37,310
45-0000 Farming, Fishing, and Forestry Occupations 30 $12.43 $25,850 $8.35 $17,370 $14.47 $30,100 $9.28 $19,310
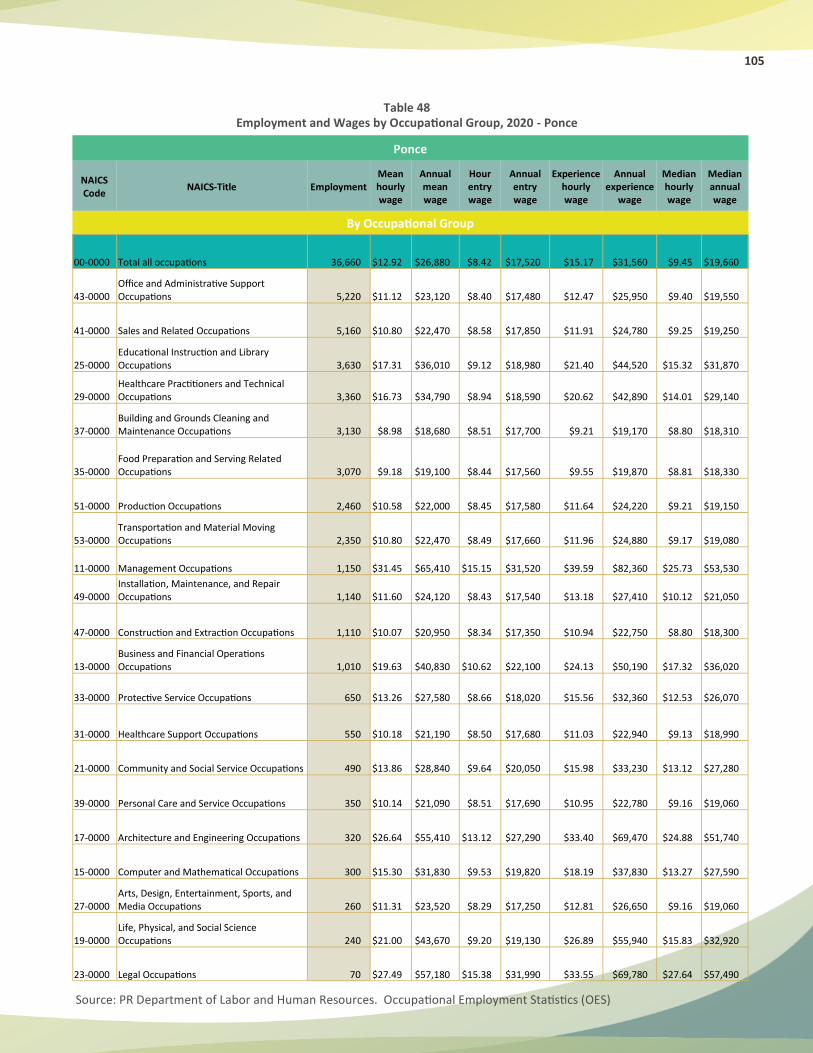
105
Table 48
Employment and Wages by Occupational Group, 2020 - Ponce
Source: PR Department of Labor and Human Resources. Occupational Employment Statistics (OES)
Ponce
NAICS Code
NAICS-Title Employment Mean hourly wage
Annual mean wage
Hour entry wage
Annual entry wage
Experience hourly wage
Annual experience
wage
Median hourly wage
Median annual wage
By Occupational Group
00-0000 Total all occupations 36,660 $12.92 $26,880 $8.42 $17,520 $15.17 $31,560 $9.45 $19,660
43-0000 Office and Administrative Support Occupations 5,220 $11.12 $23,120 $8.40 $17,480 $12.47 $25,950 $9.40 $19,550
41-0000 Sales and Related Occupations 5,160 $10.80 $22,470 $8.58 $17,850 $11.91 $24,780 $9.25 $19,250
25-0000 Educational Instruction and Library Occupations 3,630 $17.31 $36,010 $9.12 $18,980 $21.40 $44,520 $15.32 $31,870
29-0000 Healthcare Practitioners and Technical Occupations 3,360 $16.73 $34,790 $8.94 $18,590 $20.62 $42,890 $14.01 $29,140
37-0000 Building and Grounds Cleaning and Maintenance Occupations 3,130 $8.98 $18,680 $8.51 $17,700 $9.21 $19,170 $8.80 $18,310
35-0000 Food Preparation and Serving Related Occupations 3,070 $9.18 $19,100 $8.44 $17,560 $9.55 $19,870 $8.81 $18,330
51-0000 Production Occupations 2,460 $10.58 $22,000 $8.45 $17,580 $11.64 $24,220 $9.21 $19,150
53-0000 Transportation and Material Moving Occupations 2,350 $10.80 $22,470 $8.49 $17,660 $11.96 $24,880 $9.17 $19,080
11-0000 Management Occupations 1,150 $31.45 $65,410 $15.15 $31,520 $39.59 $82,360 $25.73 $53,530
49-0000 Installation, Maintenance, and Repair Occupations 1,140 $11.60 $24,120 $8.43 $17,540 $13.18 $27,410 $10.12 $21,050
47-0000 Construction and Extraction Occupations 1,110 $10.07 $20,950 $8.34 $17,350 $10.94 $22,750 $8.80 $18,300
13-0000 Business and Financial Operations Occupations 1,010 $19.63 $40,830 $10.62 $22,100 $24.13 $50,190 $17.32 $36,020
33-0000 Protective Service Occupations 650 $13.26 $27,580 $8.66 $18,020 $15.56 $32,360 $12.53 $26,070
31-0000 Healthcare Support Occupations 550 $10.18 $21,190 $8.50 $17,680 $11.03 $22,940 $9.13 $18,990
21-0000 Community and Social Service Occupations 490 $13.86 $28,840 $9.64 $20,050 $15.98 $33,230 $13.12 $27,280
39-0000 Personal Care and Service Occupations 350 $10.14 $21,090 $8.51 $17,690 $10.95 $22,780 $9.16 $19,060
17-0000 Architecture and Engineering Occupations 320 $26.64 $55,410 $13.12 $27,290 $33.40 $69,470 $24.88 $51,740
15-0000 Computer and Mathematical Occupations 300 $15.30 $31,830 $9.53 $19,820 $18.19 $37,830 $13.27 $27,590
27-0000 Arts, Design, Entertainment, Sports, and Media Occupations 260 $11.31 $23,520 $8.29 $17,250 $12.81 $26,650 $9.16 $19,060
19-0000 Life, Physical, and Social Science Occupations 240 $21.00 $43,670 $9.20 $19,130 $26.89 $55,940 $15.83 $32,920
23-0000 Legal Occupations 70 $27.49 $57,180 $15.38 $31,990 $33.55 $69,780 $27.64 $57,490
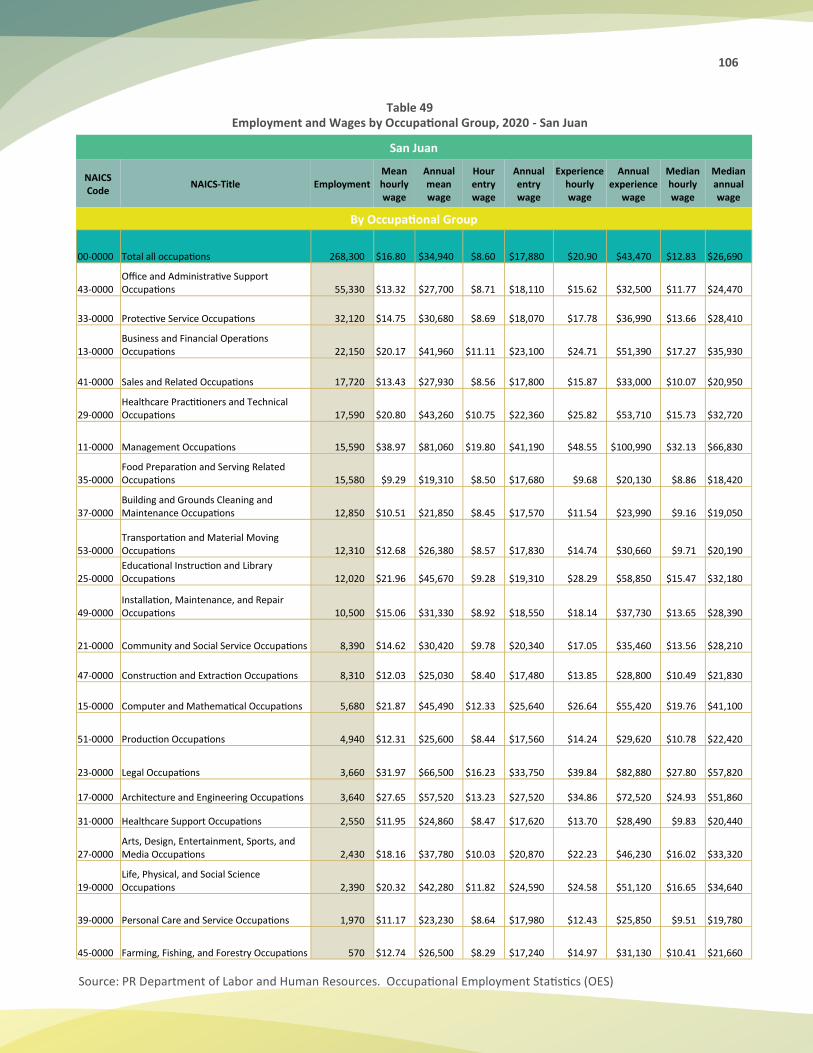
106
Table 49
Employment and Wages by Occupational Group, 2020 - San Juan
Source: PR Department of Labor and Human Resources. Occupational Employment Statistics (OES)
San Juan
NAICS Code
NAICS-Title Employment Mean hourly wage
Annual mean wage
Hour entry wage
Annual entry wage
Experience hourly wage
Annual experience
wage
Median hourly wage
Median annual wage
By Occupational Group
00-0000 Total all occupations 268,300 $16.80 $34,940 $8.60 $17,880 $20.90 $43,470 $12.83 $26,690
43-0000 Office and Administrative Support Occupations 55,330 $13.32 $27,700 $8.71 $18,110 $15.62 $32,500 $11.77 $24,470
33-0000 Protective Service Occupations 32,120 $14.75 $30,680 $8.69 $18,070 $17.78 $36,990 $13.66 $28,410
13-0000 Business and Financial Operations Occupations 22,150 $20.17 $41,960 $11.11 $23,100 $24.71 $51,390 $17.27 $35,930
41-0000 Sales and Related Occupations 17,720 $13.43 $27,930 $8.56 $17,800 $15.87 $33,000 $10.07 $20,950
29-0000 Healthcare Practitioners and Technical Occupations 17,590 $20.80 $43,260 $10.75 $22,360 $25.82 $53,710 $15.73 $32,720
11-0000 Management Occupations 15,590 $38.97 $81,060 $19.80 $41,190 $48.55 $100,990 $32.13 $66,830
35-0000 Food Preparation and Serving Related Occupations 15,580 $9.29 $19,310 $8.50 $17,680 $9.68 $20,130 $8.86 $18,420
37-0000 Building and Grounds Cleaning and Maintenance Occupations 12,850 $10.51 $21,850 $8.45 $17,570 $11.54 $23,990 $9.16 $19,050
53-0000 Transportation and Material Moving Occupations 12,310 $12.68 $26,380 $8.57 $17,830 $14.74 $30,660 $9.71 $20,190
25-0000 Educational Instruction and Library Occupations 12,020 $21.96 $45,670 $9.28 $19,310 $28.29 $58,850 $15.47 $32,180
49-0000 Installation, Maintenance, and Repair Occupations 10,500 $15.06 $31,330 $8.92 $18,550 $18.14 $37,730 $13.65 $28,390
21-0000 Community and Social Service Occupations 8,390 $14.62 $30,420 $9.78 $20,340 $17.05 $35,460 $13.56 $28,210
47-0000 Construction and Extraction Occupations 8,310 $12.03 $25,030 $8.40 $17,480 $13.85 $28,800 $10.49 $21,830
15-0000 Computer and Mathematical Occupations 5,680 $21.87 $45,490 $12.33 $25,640 $26.64 $55,420 $19.76 $41,100
51-0000 Production Occupations 4,940 $12.31 $25,600 $8.44 $17,560 $14.24 $29,620 $10.78 $22,420
23-0000 Legal Occupations 3,660 $31.97 $66,500 $16.23 $33,750 $39.84 $82,880 $27.80 $57,820
17-0000 Architecture and Engineering Occupations 3,640 $27.65 $57,520 $13.23 $27,520 $34.86 $72,520 $24.93 $51,860
31-0000 Healthcare Support Occupations 2,550 $11.95 $24,860 $8.47 $17,620 $13.70 $28,490 $9.83 $20,440
27-0000 Arts, Design, Entertainment, Sports, and Media Occupations 2,430 $18.16 $37,780 $10.03 $20,870 $22.23 $46,230 $16.02 $33,320
19-0000 Life, Physical, and Social Science Occupations 2,390 $20.32 $42,280 $11.82 $24,590 $24.58 $51,120 $16.65 $34,640
39-0000 Personal Care and Service Occupations 1,970 $11.17 $23,230 $8.64 $17,980 $12.43 $25,850 $9.51 $19,780
45-0000 Farming, Fishing, and Forestry Occupations 570 $12.74 $26,500 $8.29 $17,240 $14.97 $31,130 $10.41 $21,660
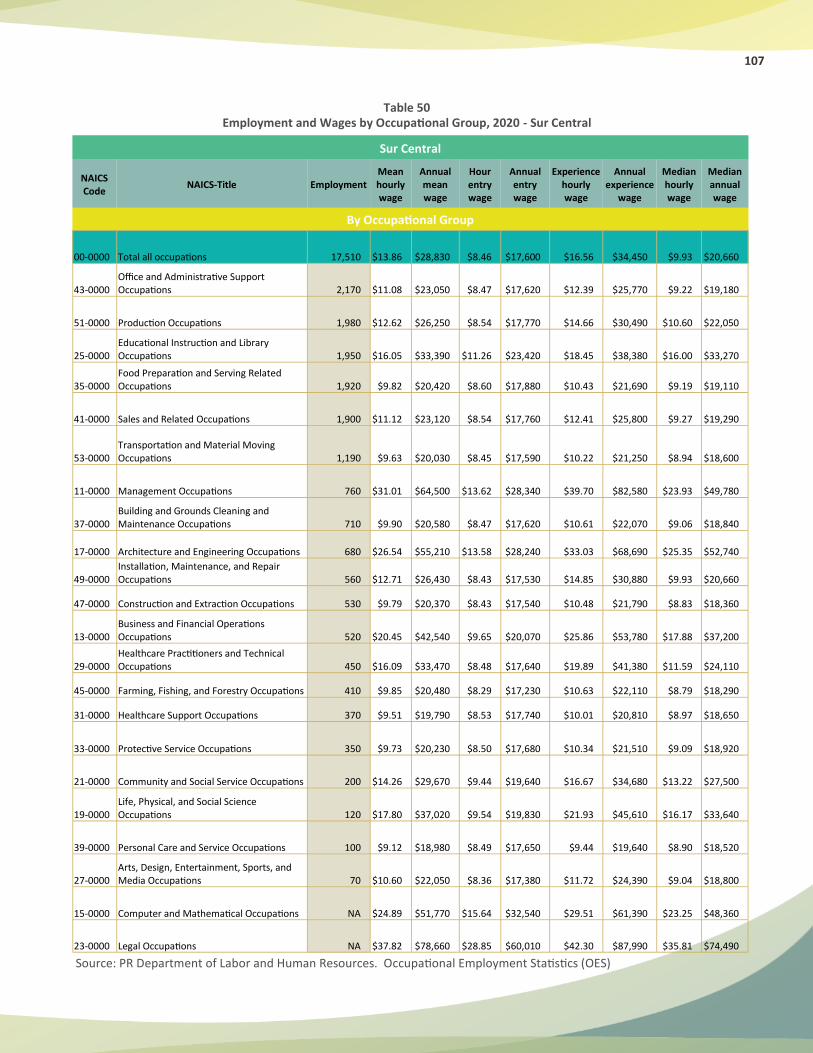
107
Table 50
Employment and Wages by Occupational Group, 2020 - Sur Central
Source: PR Department of Labor and Human Resources. Occupational Employment Statistics (OES)
Sur Central
NAICS Code
NAICS-Title Employment Mean hourly wage
Annual mean wage
Hour entry wage
Annual entry wage
Experience hourly wage
Annual experience
wage
Median hourly wage
Median annual wage
By Occupational Group
00-0000 Total all occupations 17,510 $13.86 $28,830 $8.46 $17,600 $16.56 $34,450 $9.93 $20,660
43-0000 Office and Administrative Support Occupations 2,170 $11.08 $23,050 $8.47 $17,620 $12.39 $25,770 $9.22 $19,180
51-0000 Production Occupations 1,980 $12.62 $26,250 $8.54 $17,770 $14.66 $30,490 $10.60 $22,050
25-0000 Educational Instruction and Library Occupations 1,950 $16.05 $33,390 $11.26 $23,420 $18.45 $38,380 $16.00 $33,270
35-0000 Food Preparation and Serving Related Occupations 1,920 $9.82 $20,420 $8.60 $17,880 $10.43 $21,690 $9.19 $19,110
41-0000 Sales and Related Occupations 1,900 $11.12 $23,120 $8.54 $17,760 $12.41 $25,800 $9.27 $19,290
53-0000 Transportation and Material Moving Occupations 1,190 $9.63 $20,030 $8.45 $17,590 $10.22 $21,250 $8.94 $18,600
11-0000 Management Occupations 760 $31.01 $64,500 $13.62 $28,340 $39.70 $82,580 $23.93 $49,780
37-0000 Building and Grounds Cleaning and Maintenance Occupations 710 $9.90 $20,580 $8.47 $17,620 $10.61 $22,070 $9.06 $18,840
17-0000 Architecture and Engineering Occupations 680 $26.54 $55,210 $13.58 $28,240 $33.03 $68,690 $25.35 $52,740
49-0000 Installation, Maintenance, and Repair Occupations 560 $12.71 $26,430 $8.43 $17,530 $14.85 $30,880 $9.93 $20,660
47-0000 Construction and Extraction Occupations 530 $9.79 $20,370 $8.43 $17,540 $10.48 $21,790 $8.83 $18,360
13-0000 Business and Financial Operations Occupations 520 $20.45 $42,540 $9.65 $20,070 $25.86 $53,780 $17.88 $37,200
29-0000 Healthcare Practitioners and Technical Occupations 450 $16.09 $33,470 $8.48 $17,640 $19.89 $41,380 $11.59 $24,110
45-0000 Farming, Fishing, and Forestry Occupations 410 $9.85 $20,480 $8.29 $17,230 $10.63 $22,110 $8.79 $18,290
31-0000 Healthcare Support Occupations 370 $9.51 $19,790 $8.53 $17,740 $10.01 $20,810 $8.97 $18,650
33-0000 Protective Service Occupations 350 $9.73 $20,230 $8.50 $17,680 $10.34 $21,510 $9.09 $18,920
21-0000 Community and Social Service Occupations 200 $14.26 $29,670 $9.44 $19,640 $16.67 $34,680 $13.22 $27,500
19-0000 Life, Physical, and Social Science Occupations 120 $17.80 $37,020 $9.54 $19,830 $21.93 $45,610 $16.17 $33,640
39-0000 Personal Care and Service Occupations 100 $9.12 $18,980 $8.49 $17,650 $9.44 $19,640 $8.90 $18,520
27-0000 Arts, Design, Entertainment, Sports, and Media Occupations 70 $10.60 $22,050 $8.36 $17,380 $11.72 $24,390 $9.04 $18,800
15-0000 Computer and Mathematical Occupations NA $24.89 $51,770 $15.64 $32,540 $29.51 $61,390 $23.25 $48,360
23-0000 Legal Occupations NA $37.82 $78,660 $28.85 $60,010 $42.30 $87,990 $35.81 $74,490
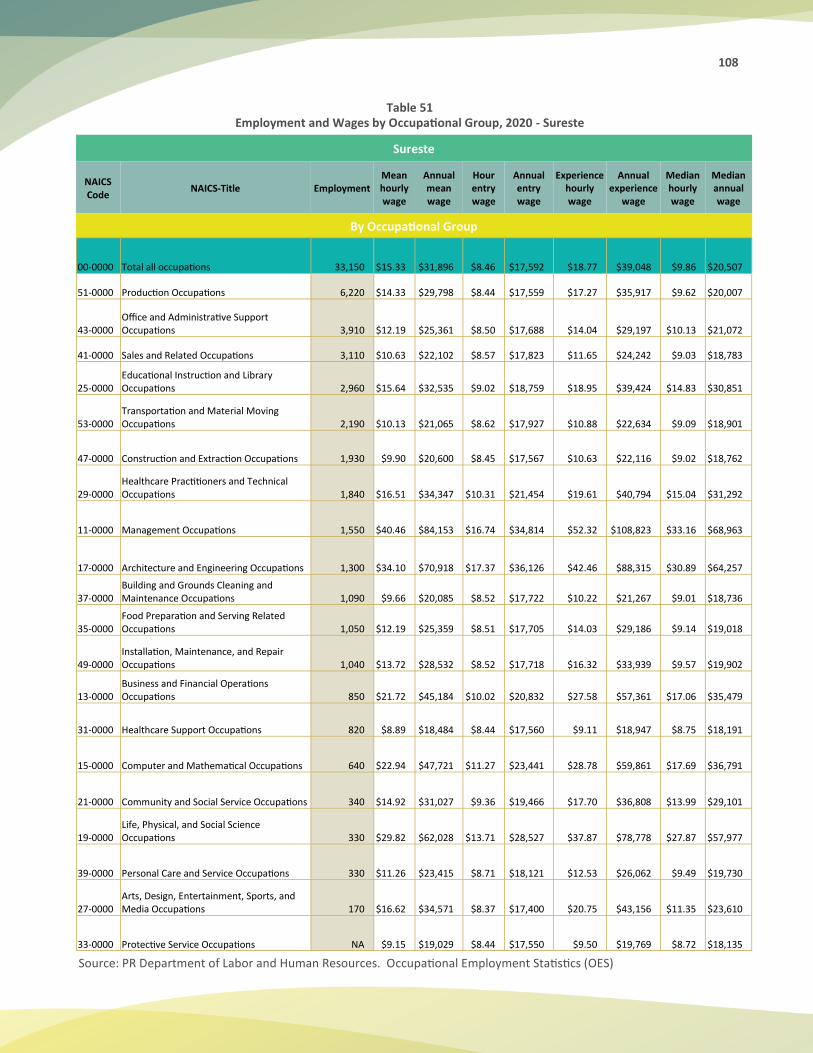
108
Table 51
Employment and Wages by Occupational Group, 2020 - Sureste
Source: PR Department of Labor and Human Resources. Occupational Employment Statistics (OES)
Sureste
NAICS Code
NAICS-Title Employment Mean hourly wage
Annual mean wage
Hour entry wage
Annual entry wage
Experience hourly wage
Annual experience
wage
Median hourly wage
Median annual wage
By Occupational Group
00-0000 Total all occupations 33,150 $15.33 $31,896 $8.46 $17,592 $18.77 $39,048 $9.86 $20,507
51-0000 Production Occupations 6,220 $14.33 $29,798 $8.44 $17,559 $17.27 $35,917 $9.62 $20,007
43-0000 Office and Administrative Support Occupations 3,910 $12.19 $25,361 $8.50 $17,688 $14.04 $29,197 $10.13 $21,072
41-0000 Sales and Related Occupations 3,110 $10.63 $22,102 $8.57 $17,823 $11.65 $24,242 $9.03 $18,783
25-0000 Educational Instruction and Library Occupations 2,960 $15.64 $32,535 $9.02 $18,759 $18.95 $39,424 $14.83 $30,851
53-0000 Transportation and Material Moving Occupations 2,190 $10.13 $21,065 $8.62 $17,927 $10.88 $22,634 $9.09 $18,901
47-0000 Construction and Extraction Occupations 1,930 $9.90 $20,600 $8.45 $17,567 $10.63 $22,116 $9.02 $18,762
29-0000 Healthcare Practitioners and Technical Occupations 1,840 $16.51 $34,347 $10.31 $21,454 $19.61 $40,794 $15.04 $31,292
11-0000 Management Occupations 1,550 $40.46 $84,153 $16.74 $34,814 $52.32 $108,823 $33.16 $68,963
17-0000 Architecture and Engineering Occupations 1,300 $34.10 $70,918 $17.37 $36,126 $42.46 $88,315 $30.89 $64,257
37-0000 Building and Grounds Cleaning and Maintenance Occupations 1,090 $9.66 $20,085 $8.52 $17,722 $10.22 $21,267 $9.01 $18,736
35-0000 Food Preparation and Serving Related Occupations 1,050 $12.19 $25,359 $8.51 $17,705 $14.03 $29,186 $9.14 $19,018
49-0000 Installation, Maintenance, and Repair Occupations 1,040 $13.72 $28,532 $8.52 $17,718 $16.32 $33,939 $9.57 $19,902
13-0000 Business and Financial Operations Occupations 850 $21.72 $45,184 $10.02 $20,832 $27.58 $57,361 $17.06 $35,479
31-0000 Healthcare Support Occupations 820 $8.89 $18,484 $8.44 $17,560 $9.11 $18,947 $8.75 $18,191
15-0000 Computer and Mathematical Occupations 640 $22.94 $47,721 $11.27 $23,441 $28.78 $59,861 $17.69 $36,791
21-0000 Community and Social Service Occupations 340 $14.92 $31,027 $9.36 $19,466 $17.70 $36,808 $13.99 $29,101
19-0000 Life, Physical, and Social Science Occupations 330 $29.82 $62,028 $13.71 $28,527 $37.87 $78,778 $27.87 $57,977
39-0000 Personal Care and Service Occupations 330 $11.26 $23,415 $8.71 $18,121 $12.53 $26,062 $9.49 $19,730
27-0000 Arts, Design, Entertainment, Sports, and Media Occupations 170 $16.62 $34,571 $8.37 $17,400 $20.75 $43,156 $11.35 $23,610
33-0000 Protective Service Occupations NA $9.15 $19,029 $8.44 $17,550 $9.50 $19,769 $8.72 $18,135
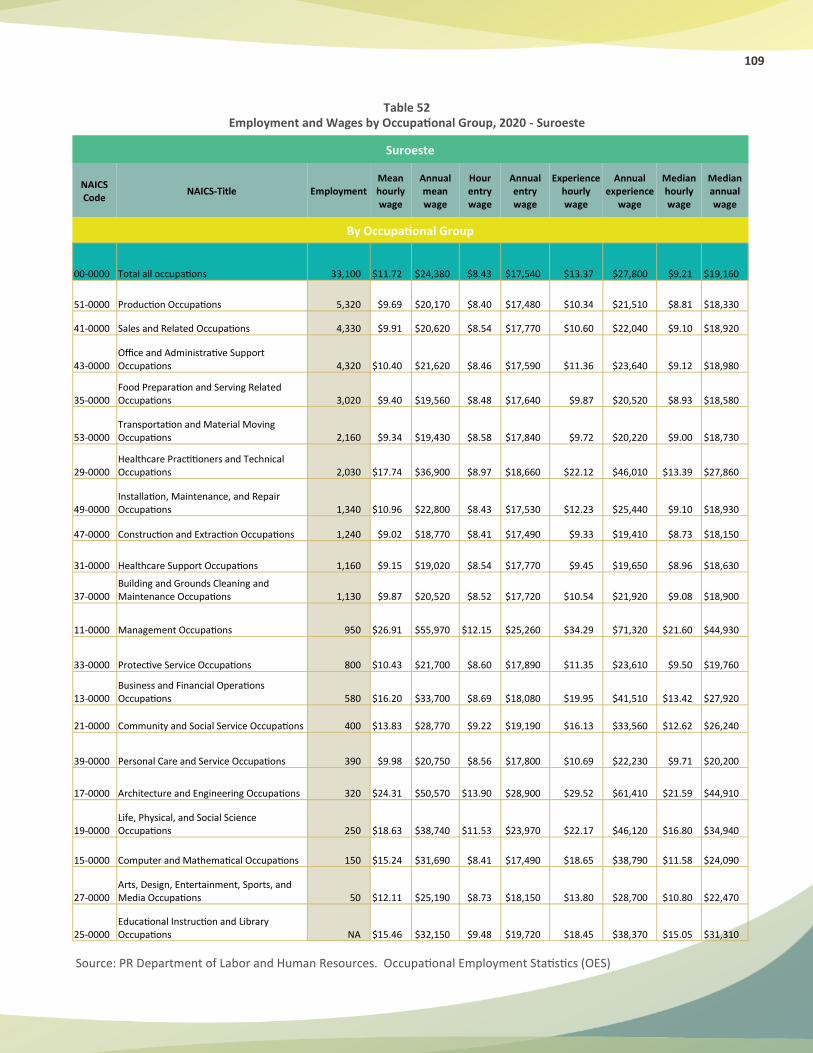
109
Table 52
Employment and Wages by Occupational Group, 2020 - Suroeste
Source: PR Department of Labor and Human Resources. Occupational Employment Statistics (OES)
Suroeste
NAICS Code
NAICS-Title Employment Mean hourly wage
Annual mean wage
Hour entry wage
Annual entry wage
Experience hourly wage
Annual experience
wage
Median hourly wage
Median annual wage
By Occupational Group
00-0000 Total all occupations 33,100 $11.72 $24,380 $8.43 $17,540 $13.37 $27,800 $9.21 $19,160
51-0000 Production Occupations 5,320 $9.69 $20,170 $8.40 $17,480 $10.34 $21,510 $8.81 $18,330
41-0000 Sales and Related Occupations 4,330 $9.91 $20,620 $8.54 $17,770 $10.60 $22,040 $9.10 $18,920
43-0000 Office and Administrative Support Occupations 4,320 $10.40 $21,620 $8.46 $17,590 $11.36 $23,640 $9.12 $18,980
35-0000 Food Preparation and Serving Related Occupations 3,020 $9.40 $19,560 $8.48 $17,640 $9.87 $20,520 $8.93 $18,580
53-0000 Transportation and Material Moving Occupations 2,160 $9.34 $19,430 $8.58 $17,840 $9.72 $20,220 $9.00 $18,730
29-0000 Healthcare Practitioners and Technical Occupations 2,030 $17.74 $36,900 $8.97 $18,660 $22.12 $46,010 $13.39 $27,860
49-0000 Installation, Maintenance, and Repair Occupations 1,340 $10.96 $22,800 $8.43 $17,530 $12.23 $25,440 $9.10 $18,930
47-0000 Construction and Extraction Occupations 1,240 $9.02 $18,770 $8.41 $17,490 $9.33 $19,410 $8.73 $18,150
31-0000 Healthcare Support Occupations 1,160 $9.15 $19,020 $8.54 $17,770 $9.45 $19,650 $8.96 $18,630
37-0000 Building and Grounds Cleaning and Maintenance Occupations 1,130 $9.87 $20,520 $8.52 $17,720 $10.54 $21,920 $9.08 $18,900
11-0000 Management Occupations 950 $26.91 $55,970 $12.15 $25,260 $34.29 $71,320 $21.60 $44,930
33-0000 Protective Service Occupations 800 $10.43 $21,700 $8.60 $17,890 $11.35 $23,610 $9.50 $19,760
13-0000 Business and Financial Operations Occupations 580 $16.20 $33,700 $8.69 $18,080 $19.95 $41,510 $13.42 $27,920
21-0000 Community and Social Service Occupations 400 $13.83 $28,770 $9.22 $19,190 $16.13 $33,560 $12.62 $26,240
39-0000 Personal Care and Service Occupations 390 $9.98 $20,750 $8.56 $17,800 $10.69 $22,230 $9.71 $20,200
17-0000 Architecture and Engineering Occupations 320 $24.31 $50,570 $13.90 $28,900 $29.52 $61,410 $21.59 $44,910
19-0000 Life, Physical, and Social Science Occupations 250 $18.63 $38,740 $11.53 $23,970 $22.17 $46,120 $16.80 $34,940
15-0000 Computer and Mathematical Occupations 150 $15.24 $31,690 $8.41 $17,490 $18.65 $38,790 $11.58 $24,090
27-0000 Arts, Design, Entertainment, Sports, and Media Occupations 50 $12.11 $25,190 $8.73 $18,150 $13.80 $28,700 $10.80 $22,470
25-0000 Educational Instruction and Library Occupations NA $15.46 $32,150 $9.48 $19,720 $18.45 $38,370 $15.05 $31,310
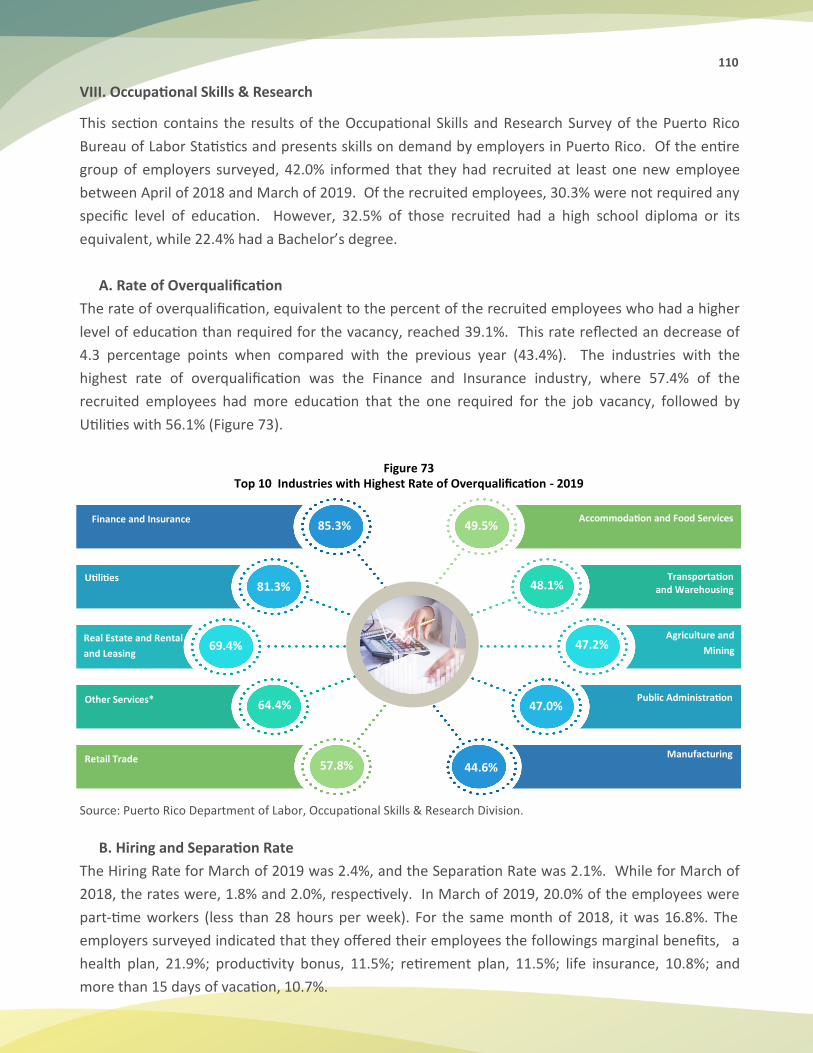
110
VIII. Occupational Skills & Research
This section contains the results of the Occupational Skills and Research Survey of the Puerto Rico
Bureau of Labor Statistics and presents skills on demand by employers in Puerto Rico. Of the entire
group of employers surveyed, 42.0% informed that they had recruited at least one new employee
between April of 2018 and March of 2019. Of the recruited employees, 30.3% were not required any
specific level of education. However, 32.5% of those recruited had a high school diploma or its
equivalent, while 22.4% had a Bachelor’s degree.
A. Rate of Overqualification
The rate of overqualification, equivalent to the percent of the recruited employees who had a higher
level of education than required for the vacancy, reached 39.1%. This rate reflected an decrease of
4.3 percentage points when compared with the previous year (43.4%). The industries with the
highest rate of overqualification was the Finance and Insurance industry, where 57.4% of the
recruited employees had more education that the one required for the job vacancy, followed by
Utilities with 56.1% (Figure 73).
Figure 73
Top 10 Industries with Highest Rate of Overqualification - 2019
Source: Puerto Rico Department of Labor, Occupational Skills & Research Division.
B. Hiring and Separation Rate
The Hiring Rate for March of 2019 was 2.4%, and the Separation Rate was 2.1%. While for March of
2018, the rates were, 1.8% and 2.0%, respectively. In March of 2019, 20.0% of the employees were
part-time workers (less than 28 hours per week). For the same month of 2018, it was 16.8%. The
employers surveyed indicated that they offered their employees the followings marginal benefits, a
health plan, 21.9%; productivity bonus, 11.5%; retirement plan, 11.5%; life insurance, 10.8%; and
more than 15 days of vacation, 10.7%.
85.3% Finance and Insurance
Utilities 81.3%
Real Estate and Rental
and Leasing
Other Services*
Retail Trade
69.4%
64.4%
57.8%
49.5%
48.1%
47.2%
47.0%
44.6%
Accommodation and Food Services
Transportation and Warehousing
Agriculture and
Mining
Public Administration
Manufacturing
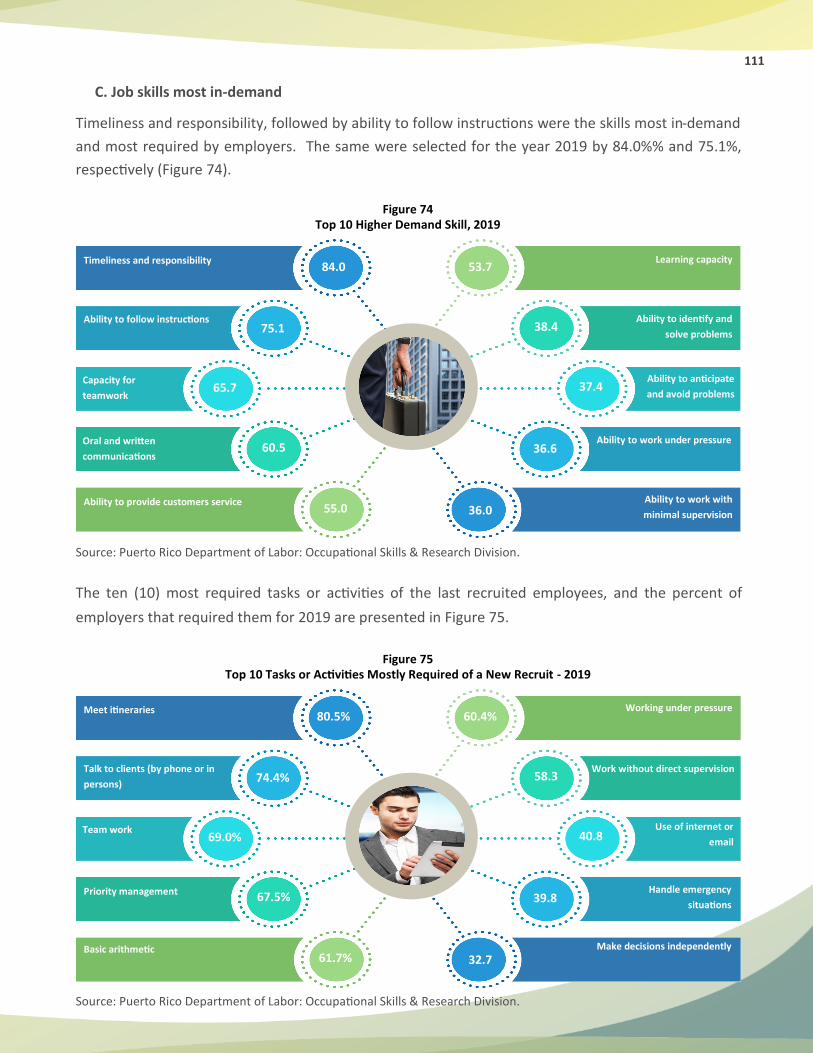
111
C. Job skills most in-demand
Timeliness and responsibility, followed by ability to follow instructions were the skills most in-demand
and most required by employers. The same were selected for the year 2019 by 84.0%% and 75.1%,
respectively (Figure 74).
Figure 74 Top 10 Higher Demand Skill, 2019
Source: Puerto Rico Department of Labor: Occupational Skills & Research Division.
The ten (10) most required tasks or activities of the last recruited employees, and the percent of
employers that required them for 2019 are presented in Figure 75.
Figure 75 Top 10 Tasks or Activities Mostly Required of a New Recruit - 2019
Source: Puerto Rico Department of Labor: Occupational Skills & Research Division.
84.0 Timeliness and responsibility
Ability to follow instructions 75.1
Oral and written
communications
Capacity for
teamwork
Ability to provide customers service
65.7
60.5
55.0
53.7
38.4
37.4
36.6
36.0
Learning capacity
Ability to identify and
solve problems
Ability to anticipate
and avoid problems
Ability to work with
minimal supervision
Ability to work under pressure
80.5% Meet itineraries
Talk to clients (by phone or in
persons) 74.4%
Team work
Priority management
Basic arithmetic
69.0%
67.5%
61.7%
60.4%
58.3
40.8
39.8
32.7
Work without direct supervision
Working under pressure
Use of internet or
Handle emergency
situations
Make decisions independently
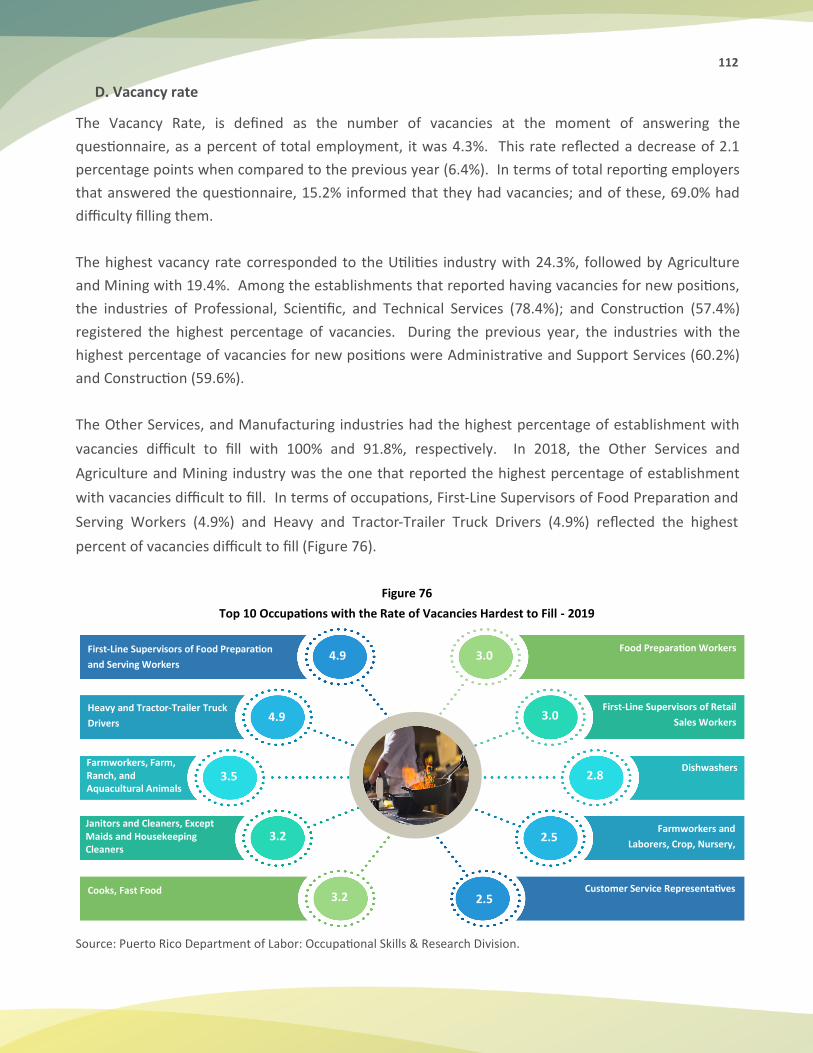
112
D. Vacancy rate
The Vacancy Rate, is defined as the number of vacancies at the moment of answering the
questionnaire, as a percent of total employment, it was 4.3%. This rate reflected a decrease of 2.1
percentage points when compared to the previous year (6.4%). In terms of total reporting employers
that answered the questionnaire, 15.2% informed that they had vacancies; and of these, 69.0% had
difficulty filling them.
The highest vacancy rate corresponded to the Utilities industry with 24.3%, followed by Agriculture
and Mining with 19.4%. Among the establishments that reported having vacancies for new positions,
the industries of Professional, Scientific, and Technical Services (78.4%); and Construction (57.4%)
registered the highest percentage of vacancies. During the previous year, the industries with the
highest percentage of vacancies for new positions were Administrative and Support Services (60.2%)
and Construction (59.6%).
The Other Services, and Manufacturing industries had the highest percentage of establishment with
vacancies difficult to fill with 100% and 91.8%, respectively. In 2018, the Other Services and
Agriculture and Mining industry was the one that reported the highest percentage of establishment
with vacancies difficult to fill. In terms of occupations, First-Line Supervisors of Food Preparation and
Serving Workers (4.9%) and Heavy and Tractor-Trailer Truck Drivers (4.9%) reflected the highest
percent of vacancies difficult to fill (Figure 76).
Figure 76
Top 10 Occupations with the Rate of Vacancies Hardest to Fill - 2019
Source: Puerto Rico Department of Labor: Occupational Skills & Research Division.
4.9 First-Line Supervisors of Food Preparation
and Serving Workers
Heavy and Tractor-Trailer Truck
Drivers 4.9
Farmworkers, Farm, Ranch, and Aquacultural Animals
Janitors and Cleaners, Except Maids and Housekeeping Cleaners
Cooks, Fast Food
3.5
3.2
3.2
3.0
3.0
2.8
2.5
2.5
Food Preparation Workers
First-Line Supervisors of Retail
Sales Workers
Dishwashers
Farmworkers and
Laborers, Crop, Nursery,
Customer Service Representatives
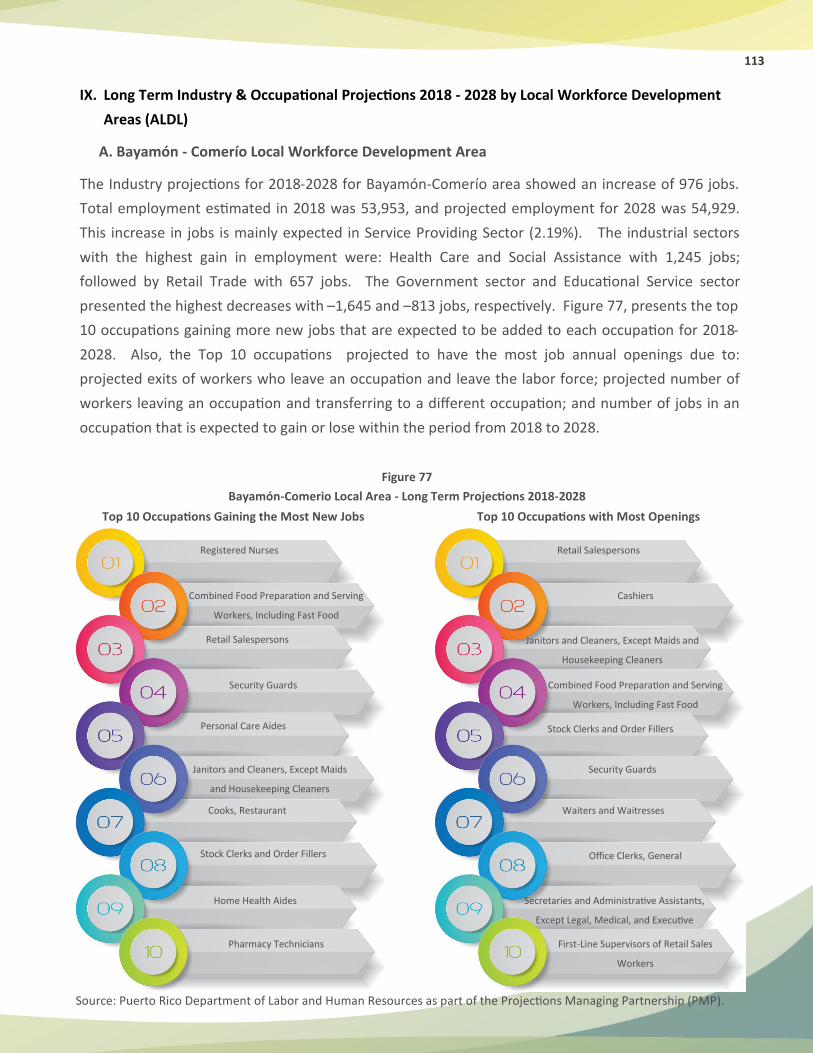
113
IX. Long Term Industry & Occupational Projections 2018 - 2028 by Local Workforce Development
Areas (ALDL)
A. Bayamón - Comerío Local Workforce Development Area
The Industry projections for 2018-2028 for Bayamón-Comerío area showed an increase of 976 jobs.
Total employment estimated in 2018 was 53,953, and projected employment for 2028 was 54,929.
This increase in jobs is mainly expected in Service Providing Sector (2.19%). The industrial sectors
with the highest gain in employment were: Health Care and Social Assistance with 1,245 jobs;
followed by Retail Trade with 657 jobs. The Government sector and Educational Service sector
presented the highest decreases with –1,645 and –813 jobs, respectively. Figure 77, presents the top
10 occupations gaining more new jobs that are expected to be added to each occupation for 2018-
2028. Also, the Top 10 occupations projected to have the most job annual openings due to:
projected exits of workers who leave an occupation and leave the labor force; projected number of
workers leaving an occupation and transferring to a different occupation; and number of jobs in an
occupation that is expected to gain or lose within the period from 2018 to 2028.
Figure 77
Bayamón-Comerio Local Area - Long Term Projections 2018-2028
Registered Nurses
Combined Food Preparation and Serving
Workers, Including Fast Food
Retail Salespersons
Security Guards
Personal Care Aides
Janitors and Cleaners, Except Maids
and Housekeeping Cleaners
Cooks, Restaurant
Stock Clerks and Order Fillers
Home Health Aides
Pharmacy Technicians
Retail Salespersons
Cashiers
Janitors and Cleaners, Except Maids and
Housekeeping Cleaners
Combined Food Preparation and Serving
Workers, Including Fast Food
Stock Clerks and Order Fillers
Security Guards
Waiters and Waitresses
Office Clerks, General
Secretaries and Administrative Assistants,
Except Legal, Medical, and Executive
First-Line Supervisors of Retail Sales
Workers
Top 10 Occupations Gaining the Most New Jobs Top 10 Occupations with Most Openings
Source: Puerto Rico Department of Labor and Human Resources as part of the Projections Managing Partnership (PMP).
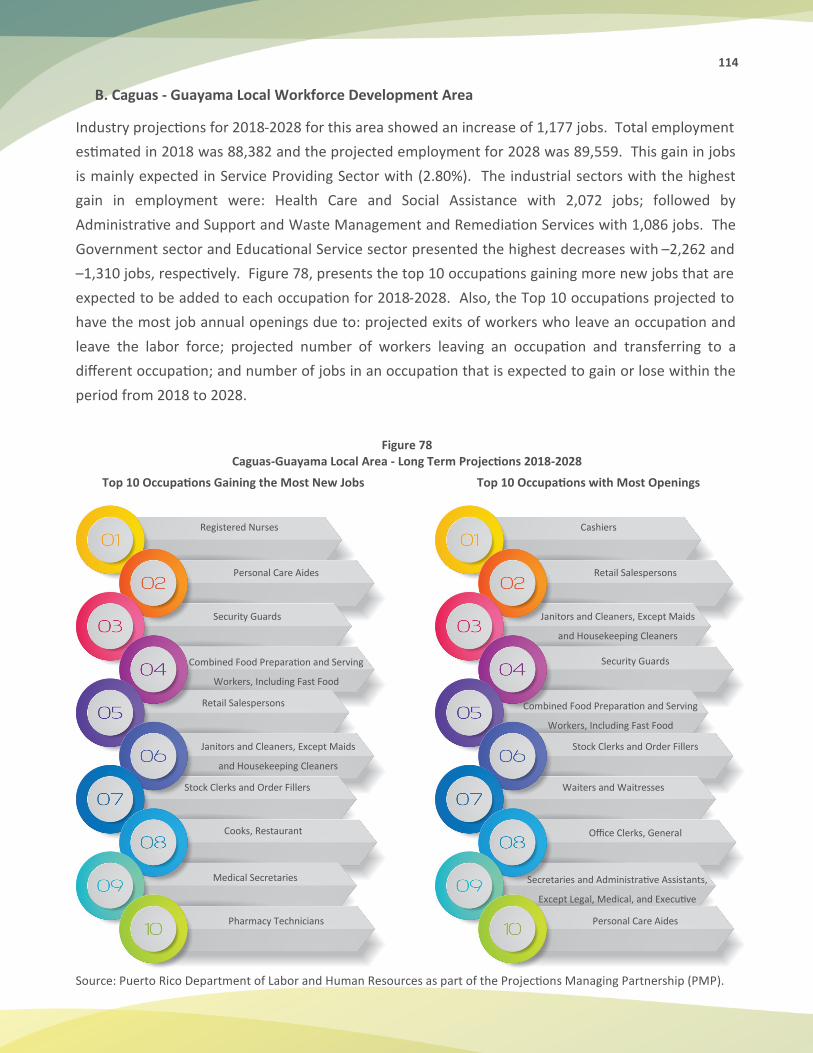
114
B. Caguas - Guayama Local Workforce Development Area
Industry projections for 2018-2028 for this area showed an increase of 1,177 jobs. Total employment
estimated in 2018 was 88,382 and the projected employment for 2028 was 89,559. This gain in jobs
is mainly expected in Service Providing Sector with (2.80%). The industrial sectors with the highest
gain in employment were: Health Care and Social Assistance with 2,072 jobs; followed by
Administrative and Support and Waste Management and Remediation Services with 1,086 jobs. The
Government sector and Educational Service sector presented the highest decreases with –2,262 and
–1,310 jobs, respectively. Figure 78, presents the top 10 occupations gaining more new jobs that are
expected to be added to each occupation for 2018-2028. Also, the Top 10 occupations projected to
have the most job annual openings due to: projected exits of workers who leave an occupation and
leave the labor force; projected number of workers leaving an occupation and transferring to a
different occupation; and number of jobs in an occupation that is expected to gain or lose within the
period from 2018 to 2028.
Figure 78 Caguas-Guayama Local Area - Long Term Projections 2018-2028
Registered Nurses
Personal Care Aides
Security Guards
Combined Food Preparation and Serving
Workers, Including Fast Food
Retail Salespersons
Janitors and Cleaners, Except Maids
and Housekeeping Cleaners
Stock Clerks and Order Fillers
Cooks, Restaurant
Medical Secretaries
Pharmacy Technicians
Cashiers
Retail Salespersons
Janitors and Cleaners, Except Maids
and Housekeeping Cleaners
Security Guards
Combined Food Preparation and Serving
Workers, Including Fast Food
Stock Clerks and Order Fillers
Waiters and Waitresses
Office Clerks, General
Secretaries and Administrative Assistants,
Except Legal, Medical, and Executive
Personal Care Aides
Top 10 Occupations Gaining the Most New Jobs Top 10 Occupations with Most Openings
Source: Puerto Rico Department of Labor and Human Resources as part of the Projections Managing Partnership (PMP).
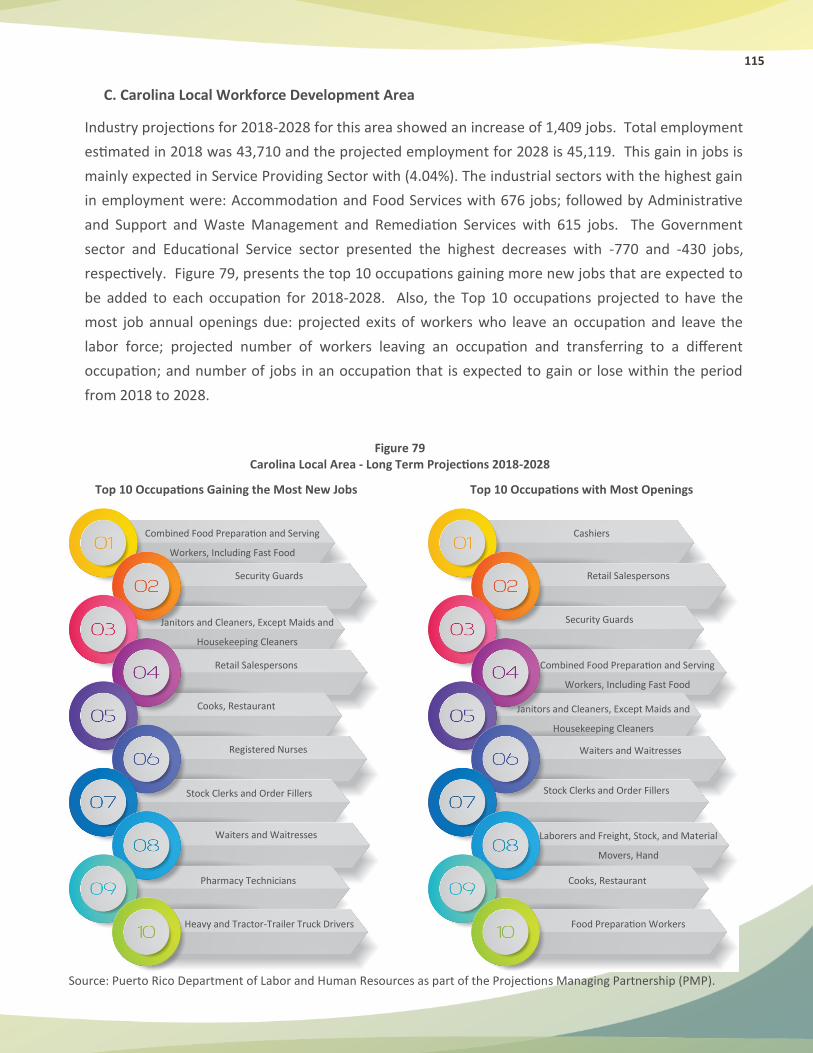
115
C. Carolina Local Workforce Development Area
Industry projections for 2018-2028 for this area showed an increase of 1,409 jobs. Total employment
estimated in 2018 was 43,710 and the projected employment for 2028 is 45,119. This gain in jobs is
mainly expected in Service Providing Sector with (4.04%). The industrial sectors with the highest gain
in employment were: Accommodation and Food Services with 676 jobs; followed by Administrative
and Support and Waste Management and Remediation Services with 615 jobs. The Government
sector and Educational Service sector presented the highest decreases with -770 and -430 jobs,
respectively. Figure 79, presents the top 10 occupations gaining more new jobs that are expected to
be added to each occupation for 2018-2028. Also, the Top 10 occupations projected to have the
most job annual openings due: projected exits of workers who leave an occupation and leave the
labor force; projected number of workers leaving an occupation and transferring to a different
occupation; and number of jobs in an occupation that is expected to gain or lose within the period
from 2018 to 2028.
Figure 79 Carolina Local Area - Long Term Projections 2018-2028
Combined Food Preparation and Serving
Workers, Including Fast Food
Security Guards
Janitors and Cleaners, Except Maids and
Housekeeping Cleaners
Retail Salespersons
Cooks, Restaurant
Registered Nurses
Stock Clerks and Order Fillers
Waiters and Waitresses
Pharmacy Technicians
Heavy and Tractor-Trailer Truck Drivers
Cashiers
Retail Salespersons
Security Guards
Combined Food Preparation and Serving
Workers, Including Fast Food
Janitors and Cleaners, Except Maids and
Housekeeping Cleaners
Waiters and Waitresses
Stock Clerks and Order Fillers
Laborers and Freight, Stock, and Material
Movers, Hand
Cooks, Restaurant
Food Preparation Workers
Top 10 Occupations Gaining the Most New Jobs Top 10 Occupations with Most Openings
Source: Puerto Rico Department of Labor and Human Resources as part of the Projections Managing Partnership (PMP).
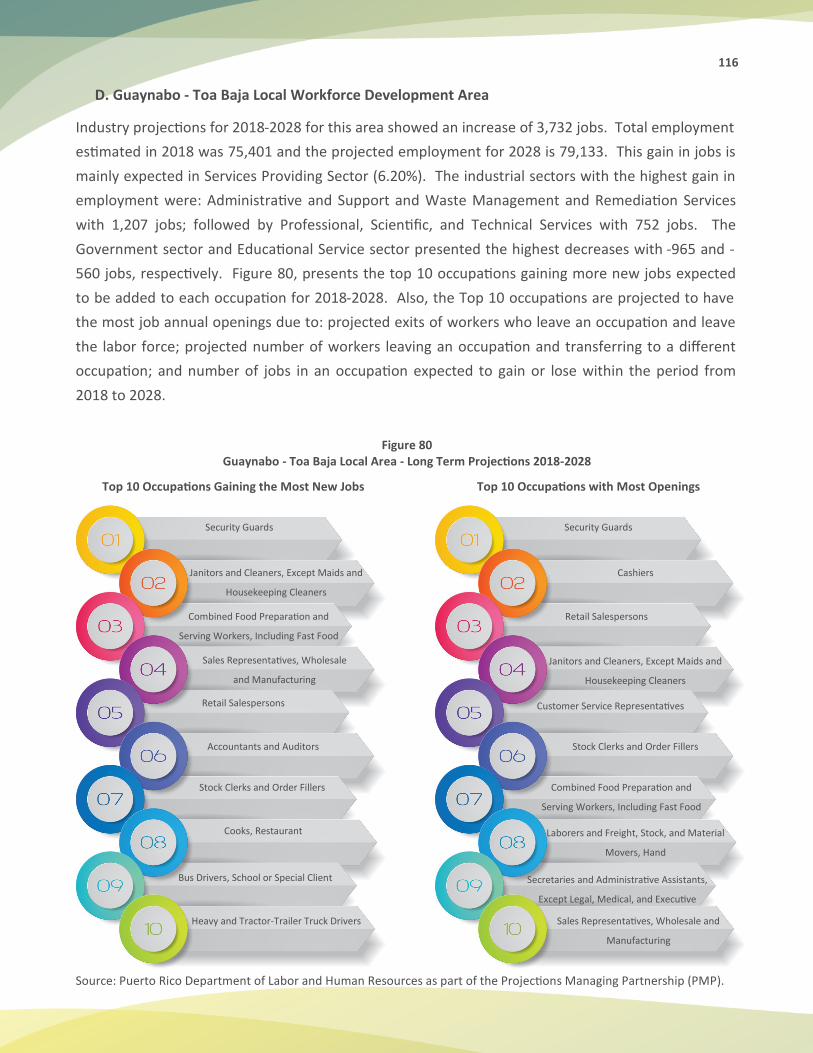
116
D. Guaynabo - Toa Baja Local Workforce Development Area
Industry projections for 2018-2028 for this area showed an increase of 3,732 jobs. Total employment
estimated in 2018 was 75,401 and the projected employment for 2028 is 79,133. This gain in jobs is
mainly expected in Services Providing Sector (6.20%). The industrial sectors with the highest gain in
employment were: Administrative and Support and Waste Management and Remediation Services
with 1,207 jobs; followed by Professional, Scientific, and Technical Services with 752 jobs. The
Government sector and Educational Service sector presented the highest decreases with -965 and -
560 jobs, respectively. Figure 80, presents the top 10 occupations gaining more new jobs expected
to be added to each occupation for 2018-2028. Also, the Top 10 occupations are projected to have
the most job annual openings due to: projected exits of workers who leave an occupation and leave
the labor force; projected number of workers leaving an occupation and transferring to a different
occupation; and number of jobs in an occupation expected to gain or lose within the period from
2018 to 2028.
Figure 80 Guaynabo - Toa Baja Local Area - Long Term Projections 2018-2028
Security Guards
Janitors and Cleaners, Except Maids and
Housekeeping Cleaners
Combined Food Preparation and
Serving Workers, Including Fast Food
Sales Representatives, Wholesale
and Manufacturing
Retail Salespersons
Accountants and Auditors
Stock Clerks and Order Fillers
Cooks, Restaurant
Bus Drivers, School or Special Client
Heavy and Tractor-Trailer Truck Drivers
Security Guards
Cashiers
Retail Salespersons
Janitors and Cleaners, Except Maids and
Housekeeping Cleaners
Customer Service Representatives
Stock Clerks and Order Fillers
Combined Food Preparation and
Serving Workers, Including Fast Food
Laborers and Freight, Stock, and Material
Movers, Hand
Secretaries and Administrative Assistants,
Except Legal, Medical, and Executive
Sales Representatives, Wholesale and
Manufacturing
Top 10 Occupations Gaining the Most New Jobs Top 10 Occupations with Most Openings
Source: Puerto Rico Department of Labor and Human Resources as part of the Projections Managing Partnership (PMP).
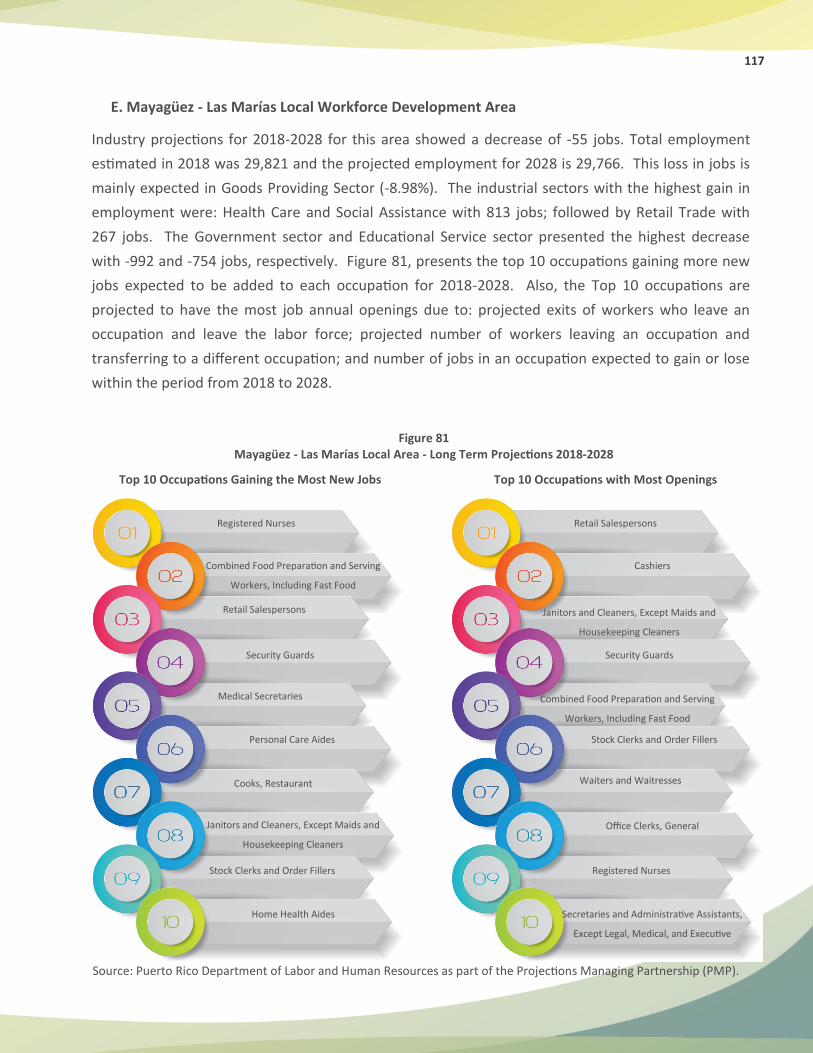
117
E. Mayagüez - Las Marías Local Workforce Development Area
Industry projections for 2018-2028 for this area showed a decrease of -55 jobs. Total employment
estimated in 2018 was 29,821 and the projected employment for 2028 is 29,766. This loss in jobs is
mainly expected in Goods Providing Sector (-8.98%). The industrial sectors with the highest gain in
employment were: Health Care and Social Assistance with 813 jobs; followed by Retail Trade with
267 jobs. The Government sector and Educational Service sector presented the highest decrease
with -992 and -754 jobs, respectively. Figure 81, presents the top 10 occupations gaining more new
jobs expected to be added to each occupation for 2018-2028. Also, the Top 10 occupations are
projected to have the most job annual openings due to: projected exits of workers who leave an
occupation and leave the labor force; projected number of workers leaving an occupation and
transferring to a different occupation; and number of jobs in an occupation expected to gain or lose
within the period from 2018 to 2028.
Figure 81 Mayagüez - Las Marías Local Area - Long Term Projections 2018-2028
Registered Nurses
Combined Food Preparation and Serving
Workers, Including Fast Food
Retail Salespersons
Security Guards
Medical Secretaries
Personal Care Aides
Cooks, Restaurant
Janitors and Cleaners, Except Maids and
Housekeeping Cleaners
Stock Clerks and Order Fillers
Home Health Aides
Retail Salespersons
Cashiers
Janitors and Cleaners, Except Maids and
Housekeeping Cleaners
Security Guards
Combined Food Preparation and Serving
Workers, Including Fast Food
Stock Clerks and Order Fillers
Waiters and Waitresses
Office Clerks, General
Registered Nurses
Secretaries and Administrative Assistants,
Except Legal, Medical, and Executive
Top 10 Occupations Gaining the Most New Jobs Top 10 Occupations with Most Openings
Source: Puerto Rico Department of Labor and Human Resources as part of the Projections Managing Partnership (PMP).
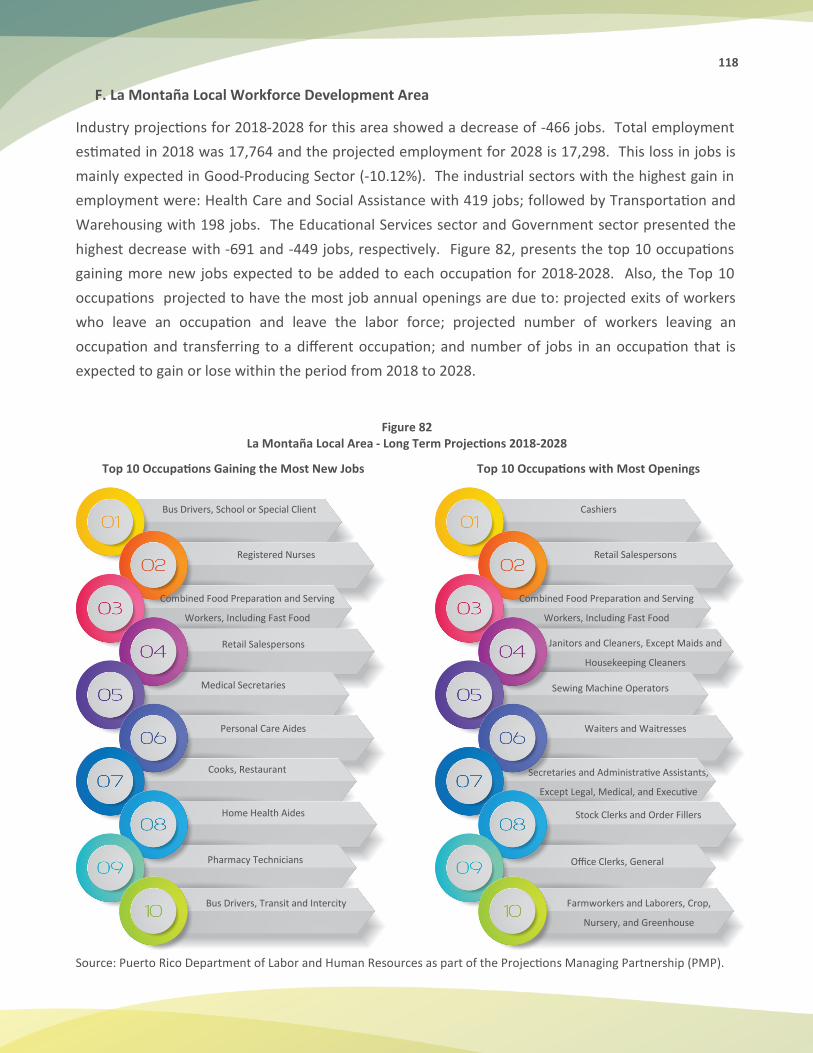
118
F. La Montaña Local Workforce Development Area
Industry projections for 2018-2028 for this area showed a decrease of -466 jobs. Total employment
estimated in 2018 was 17,764 and the projected employment for 2028 is 17,298. This loss in jobs is
mainly expected in Good-Producing Sector (-10.12%). The industrial sectors with the highest gain in
employment were: Health Care and Social Assistance with 419 jobs; followed by Transportation and
Warehousing with 198 jobs. The Educational Services sector and Government sector presented the
highest decrease with -691 and -449 jobs, respectively. Figure 82, presents the top 10 occupations
gaining more new jobs expected to be added to each occupation for 2018-2028. Also, the Top 10
occupations projected to have the most job annual openings are due to: projected exits of workers
who leave an occupation and leave the labor force; projected number of workers leaving an
occupation and transferring to a different occupation; and number of jobs in an occupation that is
expected to gain or lose within the period from 2018 to 2028.
Figure 82 La Montaña Local Area - Long Term Projections 2018-2028
Bus Drivers, School or Special Client
Registered Nurses
Combined Food Preparation and Serving
Workers, Including Fast Food
Retail Salespersons
Medical Secretaries
Personal Care Aides
Cooks, Restaurant
Home Health Aides
Pharmacy Technicians
Cashiers
Retail Salespersons
Combined Food Preparation and Serving
Workers, Including Fast Food
Janitors and Cleaners, Except Maids and
Housekeeping Cleaners
Sewing Machine Operators
Waiters and Waitresses
Secretaries and Administrative Assistants,
Except Legal, Medical, and Executive
Stock Clerks and Order Fillers
Office Clerks, General
Farmworkers and Laborers, Crop,
Nursery, and Greenhouse
Top 10 Occupations Gaining the Most New Jobs Top 10 Occupations with Most Openings
Source: Puerto Rico Department of Labor and Human Resources as part of the Projections Managing Partnership (PMP).
Bus Drivers, Transit and Intercity
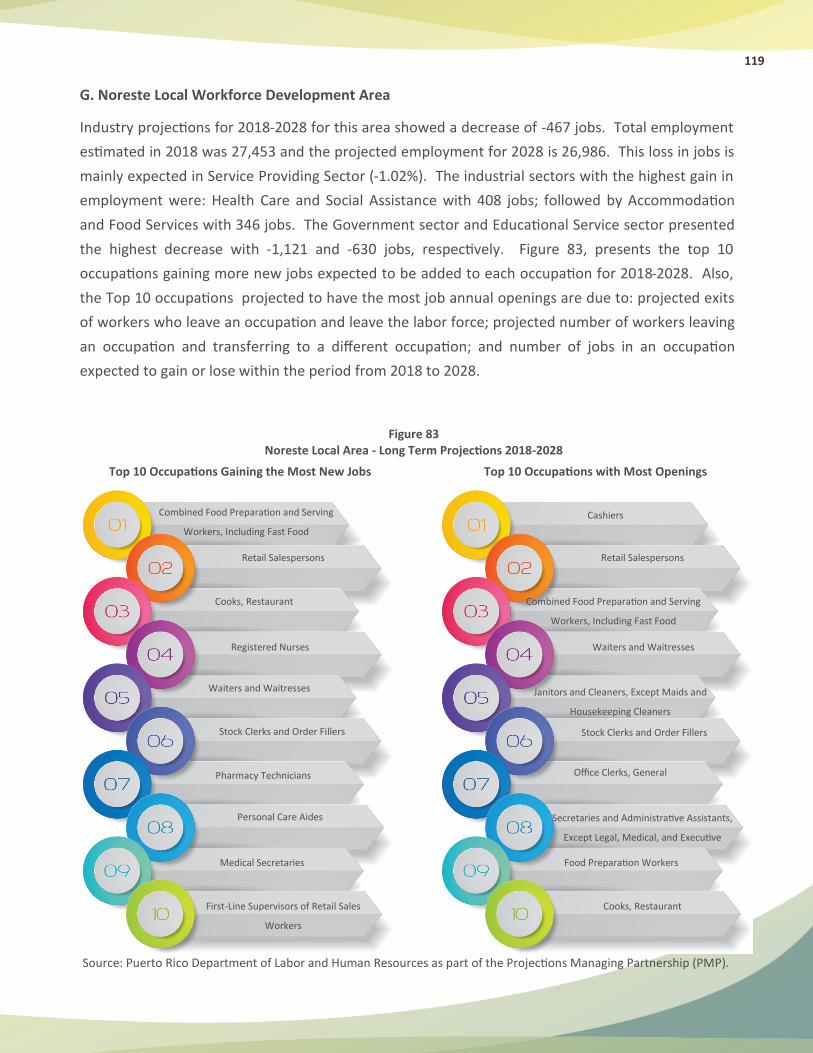
119
G. Noreste Local Workforce Development Area
Industry projections for 2018-2028 for this area showed a decrease of -467 jobs. Total employment
estimated in 2018 was 27,453 and the projected employment for 2028 is 26,986. This loss in jobs is
mainly expected in Service Providing Sector (-1.02%). The industrial sectors with the highest gain in
employment were: Health Care and Social Assistance with 408 jobs; followed by Accommodation
and Food Services with 346 jobs. The Government sector and Educational Service sector presented
the highest decrease with -1,121 and -630 jobs, respectively. Figure 83, presents the top 10
occupations gaining more new jobs expected to be added to each occupation for 2018-2028. Also,
the Top 10 occupations projected to have the most job annual openings are due to: projected exits
of workers who leave an occupation and leave the labor force; projected number of workers leaving
an occupation and transferring to a different occupation; and number of jobs in an occupation
expected to gain or lose within the period from 2018 to 2028.
Figure 83 Noreste Local Area - Long Term Projections 2018-2028
Combined Food Preparation and Serving
Workers, Including Fast Food
Retail Salespersons
Cooks, Restaurant
Registered Nurses
Waiters and Waitresses
Stock Clerks and Order Fillers
Pharmacy Technicians
Personal Care Aides
Medical Secretaries
First-Line Supervisors of Retail Sales
Workers
Cashiers
Retail Salespersons
Combined Food Preparation and Serving
Workers, Including Fast Food
Waiters and Waitresses
Janitors and Cleaners, Except Maids and
Housekeeping Cleaners
Stock Clerks and Order Fillers
Office Clerks, General
Secretaries and Administrative Assistants,
Except Legal, Medical, and Executive
Food Preparation Workers
Cooks, Restaurant
Top 10 Occupations Gaining the Most New Jobs Top 10 Occupations with Most Openings
Source: Puerto Rico Department of Labor and Human Resources as part of the Projections Managing Partnership (PMP).
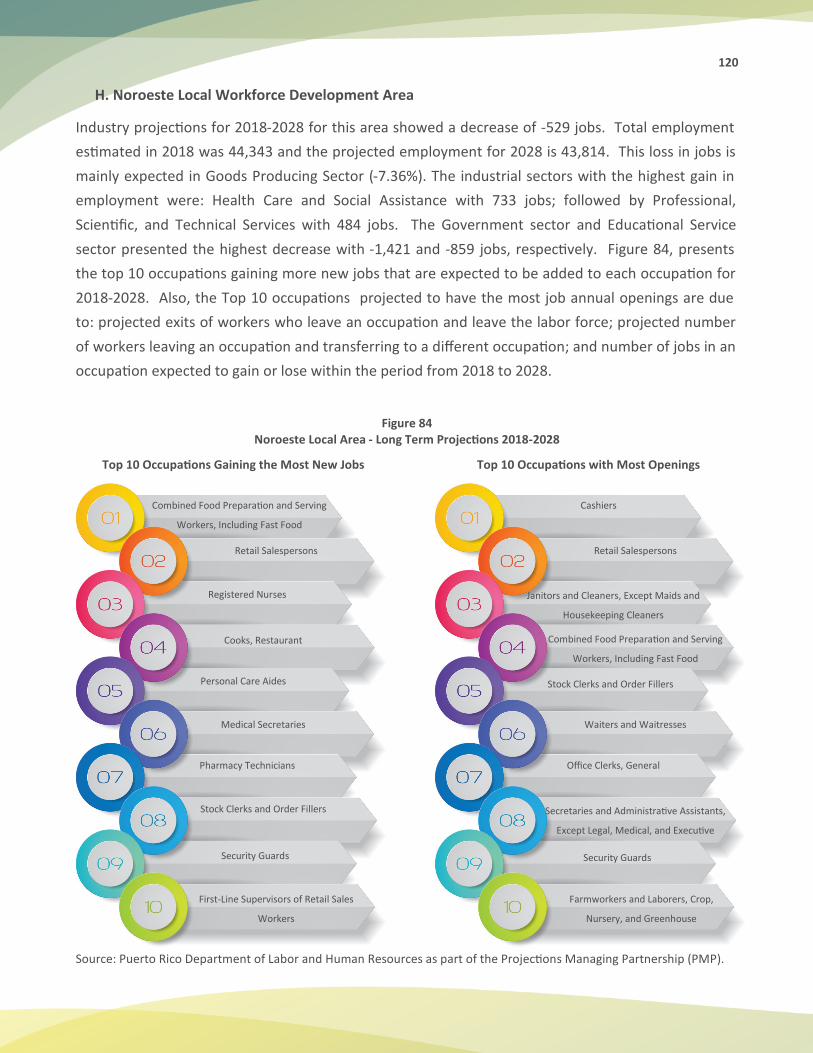
120
H. Noroeste Local Workforce Development Area
Industry projections for 2018-2028 for this area showed a decrease of -529 jobs. Total employment
estimated in 2018 was 44,343 and the projected employment for 2028 is 43,814. This loss in jobs is
mainly expected in Goods Producing Sector (-7.36%). The industrial sectors with the highest gain in
employment were: Health Care and Social Assistance with 733 jobs; followed by Professional,
Scientific, and Technical Services with 484 jobs. The Government sector and Educational Service
sector presented the highest decrease with -1,421 and -859 jobs, respectively. Figure 84, presents
the top 10 occupations gaining more new jobs that are expected to be added to each occupation for
2018-2028. Also, the Top 10 occupations projected to have the most job annual openings are due
to: projected exits of workers who leave an occupation and leave the labor force; projected number
of workers leaving an occupation and transferring to a different occupation; and number of jobs in an
occupation expected to gain or lose within the period from 2018 to 2028.
Figure 84 Noroeste Local Area - Long Term Projections 2018-2028
Combined Food Preparation and Serving
Workers, Including Fast Food
Retail Salespersons
Registered Nurses
Cooks, Restaurant
Personal Care Aides
Medical Secretaries
Pharmacy Technicians
Stock Clerks and Order Fillers
Security Guards
First-Line Supervisors of Retail Sales
Workers
Cashiers
Retail Salespersons
Janitors and Cleaners, Except Maids and
Housekeeping Cleaners
Combined Food Preparation and Serving
Workers, Including Fast Food
Stock Clerks and Order Fillers
Waiters and Waitresses
Office Clerks, General
Secretaries and Administrative Assistants,
Except Legal, Medical, and Executive
Security Guards
Farmworkers and Laborers, Crop,
Nursery, and Greenhouse
Top 10 Occupations Gaining the Most New Jobs Top 10 Occupations with Most Openings
Source: Puerto Rico Department of Labor and Human Resources as part of the Projections Managing Partnership (PMP).

121
I. Norte Central-Arecibo Local Workforce Development Area
Industry projections for 2018-2028 for this area showed a decrease of -1,828 jobs. Total employment
estimated in 2018 was 45,505 and the projected employment for 2028 is 43,677. This loss in jobs is
mainly expected in Goods Producing Sector (-10.20%). The industrial sectors with the highest gain in
employment were: Health Care and Social Assistance with 1,086 jobs; followed by Retail Trade with
484 jobs. The Government sector and Educational Service sector presented the highest decrease
with -1,863 and -1,235 jobs, respectively. Figure 85, presents the top 10 occupations gaining more
new jobs expected to be added to each occupation for 2018-2028. Also, the Top 10 occupations
projected to have the most job annual openings are due to: projected exits of workers who leave an
occupation and leave the labor force; projected number of workers leaving an occupation and
transferring to a different occupation; and number of jobs in an occupation expected to gain or lose
within the period from 2018 to 2028.
Figure 85 Norte Central - Arecibo Local Area - Long Term Projections 2018-2028
Registered Nurses
Personal Care Aides
Retail Salespersons
Combined Food Preparation and Serving
Workers, Including Fast Food
Home Health Aides
Medical Secretaries
Pharmacy Technicians
Cooks, Restaurant
Stock Clerks and Order Fillers
First-Line Supervisors of Retail Sales
Workers
Cashiers
Retail Salespersons
Combined Food Preparation and Serving
Workers, Including Fast Food
Janitors and Cleaners, Except Maids and
Housekeeping Cleaners
Stock Clerks and Order Fillers
Office Clerks, General
Farmworkers and Laborers, Crop,
Nursery, and Greenhouse
Secretaries and Administrative Assistants,
Except Legal, Medical, and Executive
Waiters and Waitresses
Sewing Machine Operators
Top 10 Occupations Gaining the Most New Jobs Top 10 Occupations with Most Openings
Source: Puerto Rico Department of Labor and Human Resources as part of the Projections Managing Partnership (PMP).
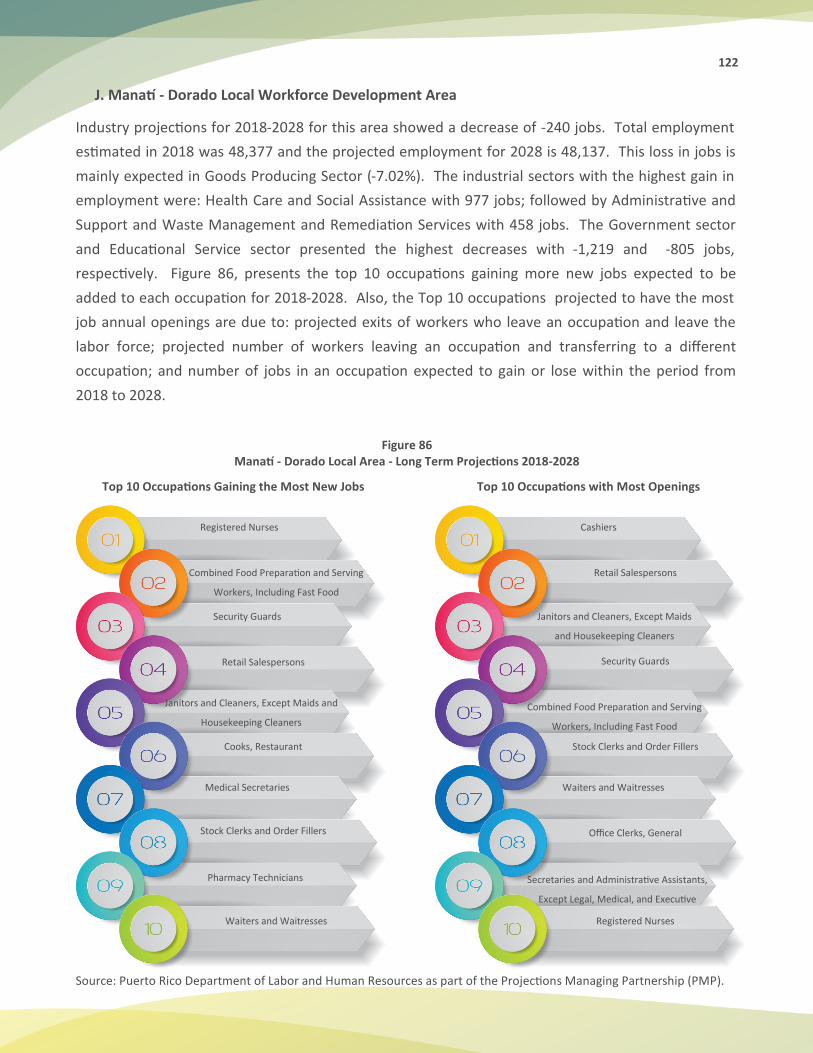
122
J. Manatí - Dorado Local Workforce Development Area
Industry projections for 2018-2028 for this area showed a decrease of -240 jobs. Total employment
estimated in 2018 was 48,377 and the projected employment for 2028 is 48,137. This loss in jobs is
mainly expected in Goods Producing Sector (-7.02%). The industrial sectors with the highest gain in
employment were: Health Care and Social Assistance with 977 jobs; followed by Administrative and
Support and Waste Management and Remediation Services with 458 jobs. The Government sector
and Educational Service sector presented the highest decreases with -1,219 and -805 jobs,
respectively. Figure 86, presents the top 10 occupations gaining more new jobs expected to be
added to each occupation for 2018-2028. Also, the Top 10 occupations projected to have the most
job annual openings are due to: projected exits of workers who leave an occupation and leave the
labor force; projected number of workers leaving an occupation and transferring to a different
occupation; and number of jobs in an occupation expected to gain or lose within the period from
2018 to 2028.
Figure 86 Manatí - Dorado Local Area - Long Term Projections 2018-2028
Registered Nurses
Combined Food Preparation and Serving
Workers, Including Fast Food
Security Guards
Retail Salespersons
Janitors and Cleaners, Except Maids and
Housekeeping Cleaners
Cooks, Restaurant
Medical Secretaries
Stock Clerks and Order Fillers
Pharmacy Technicians
Waiters and Waitresses
Cashiers
Retail Salespersons
Janitors and Cleaners, Except Maids
and Housekeeping Cleaners
Security Guards
Combined Food Preparation and Serving
Workers, Including Fast Food
Stock Clerks and Order Fillers
Waiters and Waitresses
Office Clerks, General
Secretaries and Administrative Assistants,
Except Legal, Medical, and Executive
Registered Nurses
Top 10 Occupations Gaining the Most New Jobs Top 10 Occupations with Most Openings
Source: Puerto Rico Department of Labor and Human Resources as part of the Projections Managing Partnership (PMP).
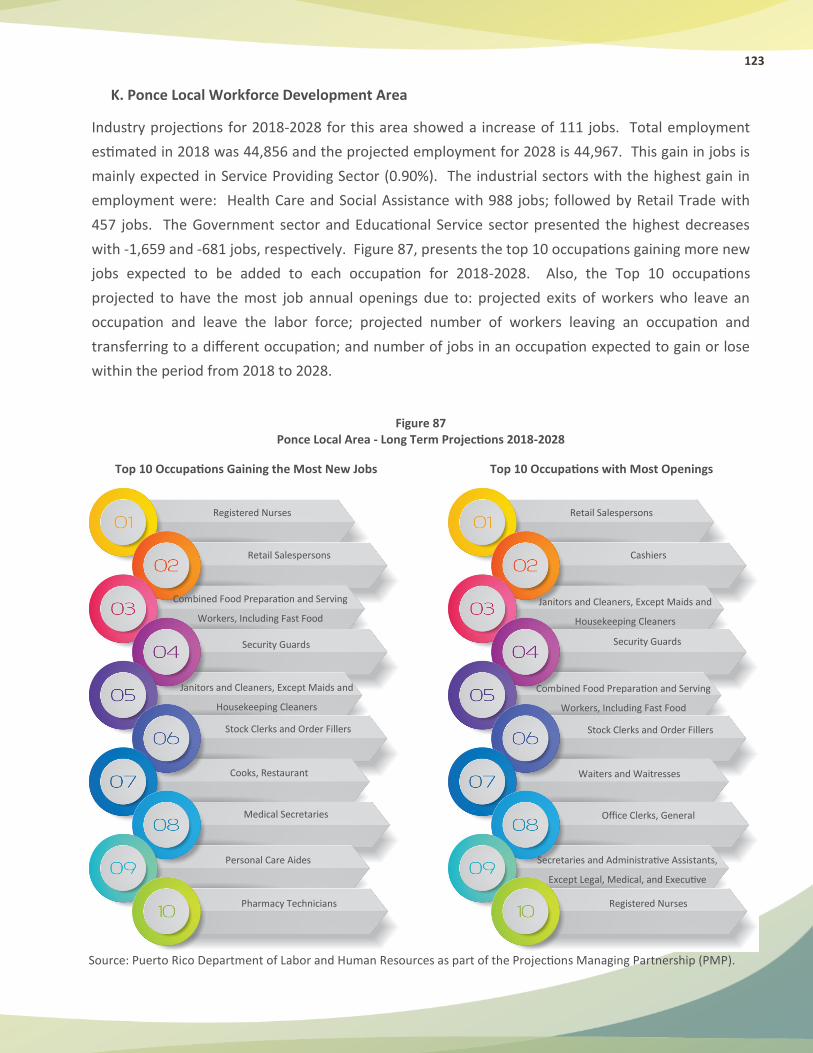
123
K. Ponce Local Workforce Development Area
Industry projections for 2018-2028 for this area showed a increase of 111 jobs. Total employment
estimated in 2018 was 44,856 and the projected employment for 2028 is 44,967. This gain in jobs is
mainly expected in Service Providing Sector (0.90%). The industrial sectors with the highest gain in
employment were: Health Care and Social Assistance with 988 jobs; followed by Retail Trade with
457 jobs. The Government sector and Educational Service sector presented the highest decreases
with -1,659 and -681 jobs, respectively. Figure 87, presents the top 10 occupations gaining more new
jobs expected to be added to each occupation for 2018-2028. Also, the Top 10 occupations
projected to have the most job annual openings due to: projected exits of workers who leave an
occupation and leave the labor force; projected number of workers leaving an occupation and
transferring to a different occupation; and number of jobs in an occupation expected to gain or lose
within the period from 2018 to 2028.
Figure 87 Ponce Local Area - Long Term Projections 2018-2028
Registered Nurses
Retail Salespersons
Combined Food Preparation and Serving
Workers, Including Fast Food
Security Guards
Janitors and Cleaners, Except Maids and
Housekeeping Cleaners
Stock Clerks and Order Fillers
Cooks, Restaurant
Medical Secretaries
Personal Care Aides
Pharmacy Technicians
Retail Salespersons
Cashiers
Janitors and Cleaners, Except Maids and
Housekeeping Cleaners
Security Guards
Combined Food Preparation and Serving
Workers, Including Fast Food
Stock Clerks and Order Fillers
Waiters and Waitresses
Office Clerks, General
Secretaries and Administrative Assistants,
Except Legal, Medical, and Executive
Registered Nurses
Top 10 Occupations Gaining the Most New Jobs Top 10 Occupations with Most Openings
Source: Puerto Rico Department of Labor and Human Resources as part of the Projections Managing Partnership (PMP).
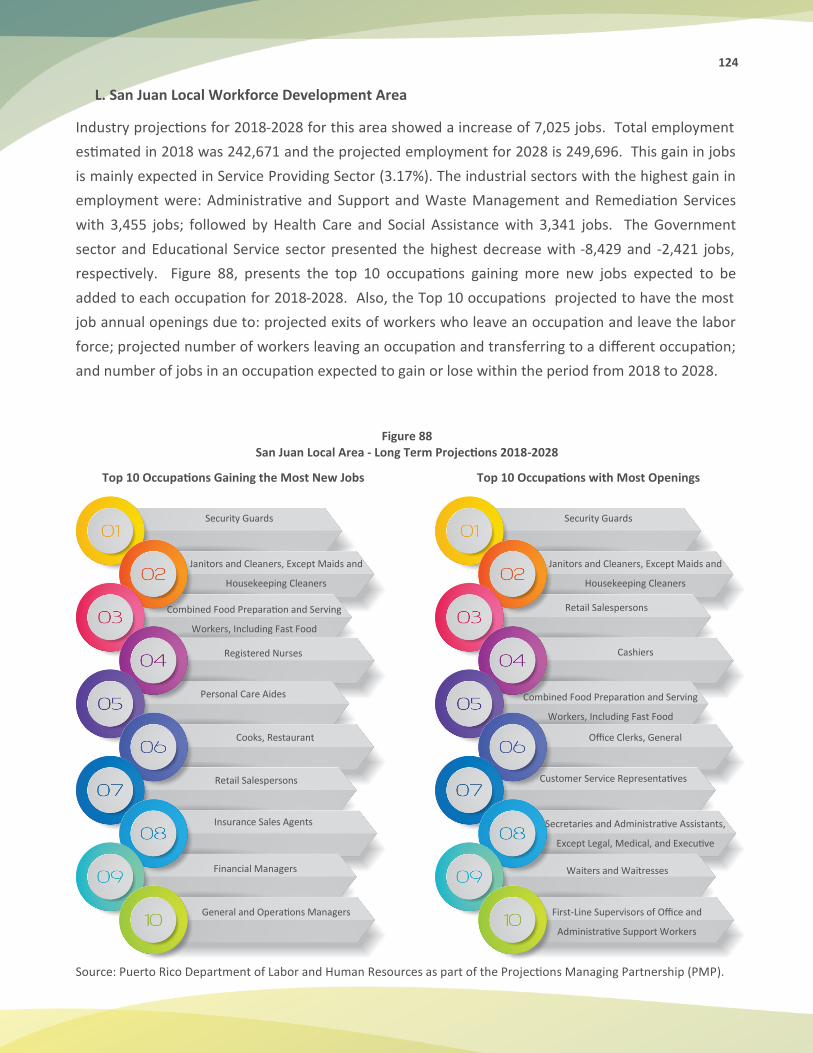
124
L. San Juan Local Workforce Development Area
Industry projections for 2018-2028 for this area showed a increase of 7,025 jobs. Total employment
estimated in 2018 was 242,671 and the projected employment for 2028 is 249,696. This gain in jobs
is mainly expected in Service Providing Sector (3.17%). The industrial sectors with the highest gain in
employment were: Administrative and Support and Waste Management and Remediation Services
with 3,455 jobs; followed by Health Care and Social Assistance with 3,341 jobs. The Government
sector and Educational Service sector presented the highest decrease with -8,429 and -2,421 jobs,
respectively. Figure 88, presents the top 10 occupations gaining more new jobs expected to be
added to each occupation for 2018-2028. Also, the Top 10 occupations projected to have the most
job annual openings due to: projected exits of workers who leave an occupation and leave the labor
force; projected number of workers leaving an occupation and transferring to a different occupation;
and number of jobs in an occupation expected to gain or lose within the period from 2018 to 2028.
Figure 88 San Juan Local Area - Long Term Projections 2018-2028
Security Guards
Janitors and Cleaners, Except Maids and
Housekeeping Cleaners
Combined Food Preparation and Serving
Workers, Including Fast Food
Registered Nurses
Personal Care Aides
Cooks, Restaurant
Retail Salespersons
Insurance Sales Agents
Financial Managers
General and Operations Managers
Security Guards
Janitors and Cleaners, Except Maids and
Housekeeping Cleaners
Retail Salespersons
Cashiers
Combined Food Preparation and Serving
Workers, Including Fast Food
Office Clerks, General
Customer Service Representatives
Secretaries and Administrative Assistants,
Except Legal, Medical, and Executive
Waiters and Waitresses
First-Line Supervisors of Office and
Administrative Support Workers
Top 10 Occupations Gaining the Most New Jobs Top 10 Occupations with Most Openings
Source: Puerto Rico Department of Labor and Human Resources as part of the Projections Managing Partnership (PMP).

125
M. Sur Central Local Workforce Development Area
Industry projections for 2018-2028 for this area showed a decrease of -723 jobs. Total employment
estimated in 2018 was 21,799 and the projected employment for 2028 is 21,076. This loss in jobs is
mainly expected in Goods-Producing Sector (-5.80%). The industrial sectors with the highest gain in
employment were: Health Care and Social Assistance with 297 jobs; followed by Retail Trade with
199 jobs. The Government sector and Educational Service sector presented the highest decrease
with -604 and -565 jobs, respectively. Figure 89, presents the top 10 occupations gaining more new
jobs expected to be added to each occupation for 2018-2028. Also, the Top 10 occupations
projected to have the most job annual openings are due to: projected exits of workers who leave an
occupation and leave the labor force; projected number of workers leaving an occupation and
transferring to a different occupation; and number of jobs in an occupation expected to gain or lose
within the period from 2018 to 2028.
Figure 89 Sur Central Local Area - Long Term Projections 2018-2028
Combined Food Preparation and Serving
Workers, Including Fast Food
Retail Salespersons
Personal Care Aides
Home Health Aides
Stock Clerks and Order Fillers
Cooks, Restaurant
Pharmacy Technicians
Registered Nurses
First-Line Supervisors of Retail Sales
Workers
Sewing Machine Operators
Cashiers
Farmworkers and Laborers, Crop,
Nursery, and Greenhouse
Retail Salespersons
Combined Food Preparation and Serving
Workers, Including Fast Food
Stock Clerks and Order Fillers
Janitors and Cleaners, Except Maids and
Housekeeping Cleaners
Waiters and Waitresses
Office Clerks, General
Secretaries and Administrative Assistants,
Except Legal, Medical, and Executive
Food Preparation Workers
Top 10 Occupations Gaining the Most New Jobs Top 10 Occupations with Most Openings
Source: Puerto Rico Department of Labor and Human Resources as part of the Projections Managing Partnership (PMP).
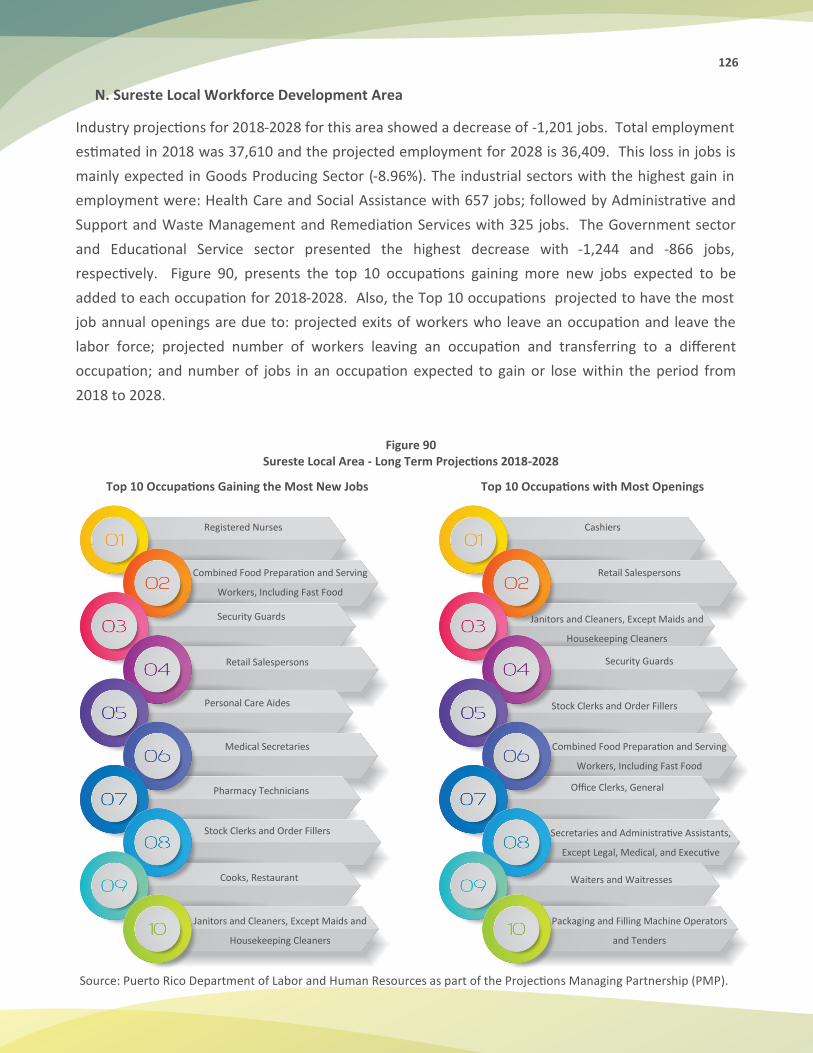
126
N. Sureste Local Workforce Development Area
Industry projections for 2018-2028 for this area showed a decrease of -1,201 jobs. Total employment
estimated in 2018 was 37,610 and the projected employment for 2028 is 36,409. This loss in jobs is
mainly expected in Goods Producing Sector (-8.96%). The industrial sectors with the highest gain in
employment were: Health Care and Social Assistance with 657 jobs; followed by Administrative and
Support and Waste Management and Remediation Services with 325 jobs. The Government sector
and Educational Service sector presented the highest decrease with -1,244 and -866 jobs,
respectively. Figure 90, presents the top 10 occupations gaining more new jobs expected to be
added to each occupation for 2018-2028. Also, the Top 10 occupations projected to have the most
job annual openings are due to: projected exits of workers who leave an occupation and leave the
labor force; projected number of workers leaving an occupation and transferring to a different
occupation; and number of jobs in an occupation expected to gain or lose within the period from
2018 to 2028.
Figure 90 Sureste Local Area - Long Term Projections 2018-2028
Registered Nurses
Combined Food Preparation and Serving
Workers, Including Fast Food
Security Guards
Retail Salespersons
Personal Care Aides
Medical Secretaries
Pharmacy Technicians
Stock Clerks and Order Fillers
Cooks, Restaurant
Janitors and Cleaners, Except Maids and
Housekeeping Cleaners
Cashiers
Retail Salespersons
Janitors and Cleaners, Except Maids and
Housekeeping Cleaners
Security Guards
Stock Clerks and Order Fillers
Combined Food Preparation and Serving
Workers, Including Fast Food
Office Clerks, General
Secretaries and Administrative Assistants,
Except Legal, Medical, and Executive
Waiters and Waitresses
Packaging and Filling Machine Operators
and Tenders
Top 10 Occupations Gaining the Most New Jobs Top 10 Occupations with Most Openings
Source: Puerto Rico Department of Labor and Human Resources as part of the Projections Managing Partnership (PMP).
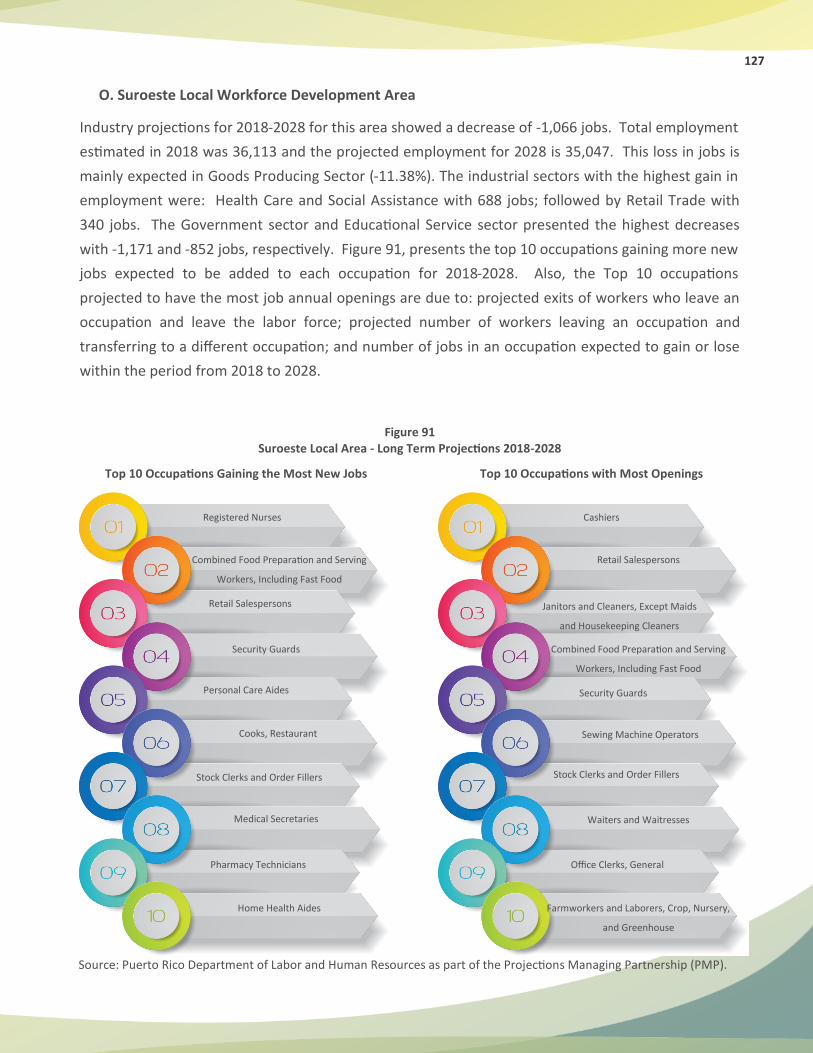
127
O. Suroeste Local Workforce Development Area
Industry projections for 2018-2028 for this area showed a decrease of -1,066 jobs. Total employment
estimated in 2018 was 36,113 and the projected employment for 2028 is 35,047. This loss in jobs is
mainly expected in Goods Producing Sector (-11.38%). The industrial sectors with the highest gain in
employment were: Health Care and Social Assistance with 688 jobs; followed by Retail Trade with
340 jobs. The Government sector and Educational Service sector presented the highest decreases
with -1,171 and -852 jobs, respectively. Figure 91, presents the top 10 occupations gaining more new
jobs expected to be added to each occupation for 2018-2028. Also, the Top 10 occupations
projected to have the most job annual openings are due to: projected exits of workers who leave an
occupation and leave the labor force; projected number of workers leaving an occupation and
transferring to a different occupation; and number of jobs in an occupation expected to gain or lose
within the period from 2018 to 2028.
Figure 91 Suroeste Local Area - Long Term Projections 2018-2028
Registered Nurses
Combined Food Preparation and Serving
Workers, Including Fast Food
Retail Salespersons
Security Guards
Personal Care Aides
Cooks, Restaurant
Stock Clerks and Order Fillers
Medical Secretaries
Pharmacy Technicians
Home Health Aides
Cashiers
Retail Salespersons
Janitors and Cleaners, Except Maids
and Housekeeping Cleaners
Combined Food Preparation and Serving
Workers, Including Fast Food
Security Guards
Sewing Machine Operators
Stock Clerks and Order Fillers
Waiters and Waitresses
Office Clerks, General
Farmworkers and Laborers, Crop, Nursery,
and Greenhouse
Top 10 Occupations Gaining the Most New Jobs Top 10 Occupations with Most Openings
Source: Puerto Rico Department of Labor and Human Resources as part of the Projections Managing Partnership (PMP).
128
X. Weekly Claims for Unemployment Insurance Data & Characteristics of the Insured Unemployed
A. Weekly Claims for Unemployment Insurance Data
The Unemployment Insurance weekly claims data is used for the current economic analysis of
unemployment trends in the nation, and states. Initial claims measure emerging unemployment and
continued weeks claim measure the number of persons claiming unemployment benefits.
Initial Claims - An initial claim is a claim filed by an unemployed individual after separation from
an employer. The claimant requests a determination of basic eligibility for the UI program. When
an initial claim is filed with a state, certain programmatic activities take place resulting in activity
counts including the count of initial claims.
Continued Weeks Claimed - A person who has already filed an initial claim and experienced a
week of unemployment files a continued claim, to claim benefits for that week of unemployment.
Continued claims are also referred to as insured unemployment.
In mid-March, the government of Puerto Rico issued Executive Order number OE-2020-023. It
contemplated the closure of both the government and private companies. They then issued other
executive orders that were gradually opening and changing the measures with which to address the
situation of the COVID -19 pandemic. We will present data of the unemployment claims filed per
week that include the months that comprise the fiscal year 2020 and 2021. For analysis purposes we
will compare with the 2019 (before the COVID-19) and 2017 (Hurricane María) claimant data.
Comparing the week ending 3/23/2019 with the week ending 3/21/2020, when the lockdown started
due to the COVID-19 pandemic, the results were the following: Initial claims were 1,002 to 20,148, a
rise in 19,146 more claims; continued claims were 15,503 to 16,539, a rise in 1,036 more claims; and
the insured unemployment rate was 1.84% to 1.94%, rise in 0.10%. Comparing the week ending
3/21/2020 with the week ending 3/20/2021, the results were the following: Initial claims were
20,148 to 1,592, a decreased in 18,556 less claims; continued claims were 16,539 to 50,083, a rise in
33,544 more claims; and the insured unemployment rate was 1.94% to 5.98%, rise in 4.04%.
The week ending 4/4/20 was the week when more initial claims were reported in Puerto Rico with
66,236 claims, in comparison with the week when Hurricane Maria claims were reported the week
ending 4/11/2017 with 8,281 claims.
Comparing the week ending 4/6/2019 with the week ending 4/4/2020 when the lockdown started
due to the COVID-19 pandemic, the results were the following: Initial claims were 1,163 to 66,236, a
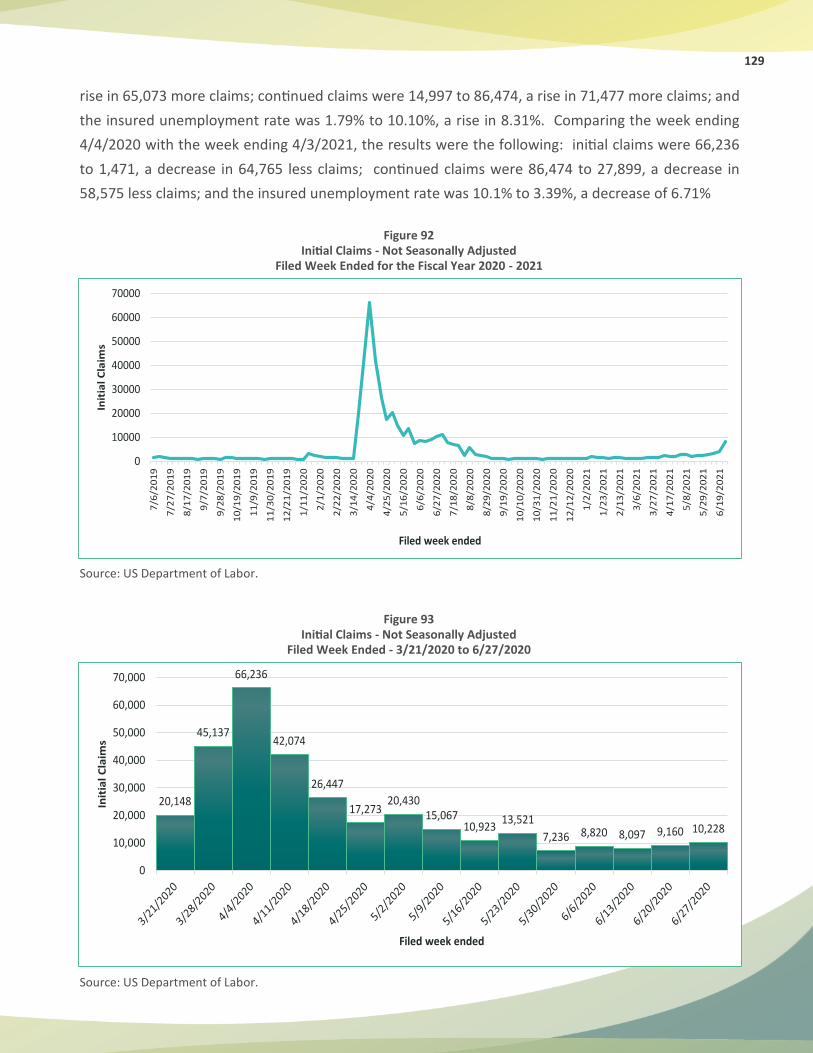
129
rise in 65,073 more claims; continued claims were 14,997 to 86,474, a rise in 71,477 more claims; and
the insured unemployment rate was 1.79% to 10.10%, a rise in 8.31%. Comparing the week ending
4/4/2020 with the week ending 4/3/2021, the results were the following: initial claims were 66,236
to 1,471, a decrease in 64,765 less claims; continued claims were 86,474 to 27,899, a decrease in
58,575 less claims; and the insured unemployment rate was 10.1% to 3.39%, a decrease of 6.71%
Figure 92 Initial Claims - Not Seasonally Adjusted
Filed Week Ended for the Fiscal Year 2020 - 2021
Source: US Department of Labor.
Figure 93 Initial Claims - Not Seasonally Adjusted
Filed Week Ended - 3/21/2020 to 6/27/2020
Source: US Department of Labor.
0
10000
20000
30000
40000
50000
60000
70000
7/6
/20
19
7/2
7/2
01
9
8/1
7/2
01
9
9/7
/20
19
9/2
8/2
01
9
10
/19
/20
19
11
/9/2
01
9
11
/30
/20
19
12
/21
/20
19
1/1
1/2
02
0
2/1
/20
20
2/2
2/2
02
0
3/1
4/2
02
0
4/4
/20
20
4/2
5/2
02
0
5/1
6/2
02
0
6/6
/20
20
6/2
7/2
02
0
7/1
8/2
02
0
8/8
/20
20
8/2
9/2
02
0
9/1
9/2
02
0
10
/10
/20
20
10
/31
/20
20
11
/21
/20
20
12
/12
/20
20
1/2
/20
21
1/2
3/2
02
1
2/1
3/2
02
1
3/6
/20
21
3/2
7/2
02
1
4/1
7/2
02
1
5/8
/20
21
5/2
9/2
02
1
6/1
9/2
02
1
Init
ial
Cla
ims
Filed week ended
20,148
45,137
66,236
42,074
26,447
17,27320,430
15,06710,923
13,521
7,236 8,820 8,097 9,160 10,228
0
10,000
20,000
30,000
40,000
50,000
60,000
70,000
Init
ial
Cla
ims
Filed week ended
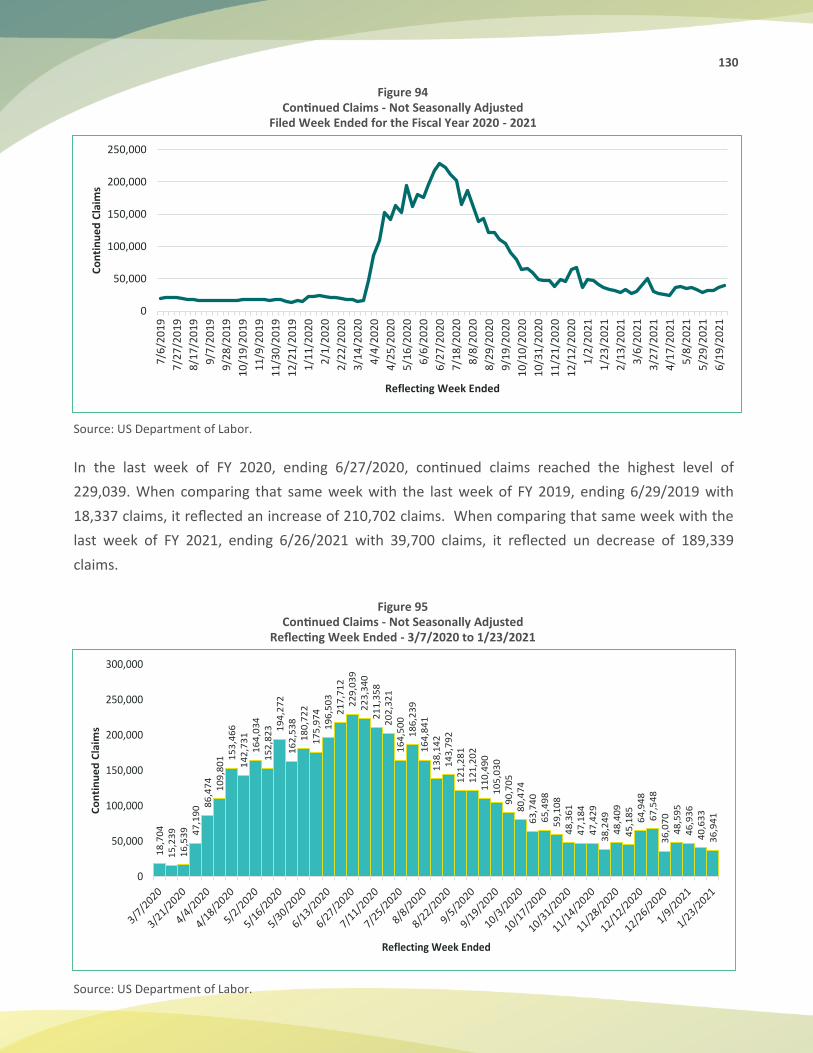
130
Figure 94 Continued Claims - Not Seasonally Adjusted
Filed Week Ended for the Fiscal Year 2020 - 2021
Source: US Department of Labor.
In the last week of FY 2020, ending 6/27/2020, continued claims reached the highest level of
229,039. When comparing that same week with the last week of FY 2019, ending 6/29/2019 with
18,337 claims, it reflected an increase of 210,702 claims. When comparing that same week with the
last week of FY 2021, ending 6/26/2021 with 39,700 claims, it reflected un decrease of 189,339
claims.
Figure 95 Continued Claims - Not Seasonally Adjusted
Reflecting Week Ended - 3/7/2020 to 1/23/2021
Source: US Department of Labor.
0
50,000
100,000
150,000
200,000
250,0007
/6/2
01
9
7/2
7/2
01
9
8/1
7/2
01
9
9/7
/20
19
9/2
8/2
01
9
10
/19
/20
19
11
/9/2
01
9
11
/30
/20
19
12
/21
/20
19
1/1
1/2
02
0
2/1
/20
20
2/2
2/2
02
0
3/1
4/2
02
0
4/4
/20
20
4/2
5/2
02
0
5/1
6/2
02
0
6/6
/20
20
6/2
7/2
02
0
7/1
8/2
02
0
8/8
/20
20
8/2
9/2
02
0
9/1
9/2
02
0
10
/10
/20
20
10
/31
/20
20
11
/21
/20
20
12
/12
/20
20
1/2
/20
21
1/2
3/2
02
1
2/1
3/2
02
1
3/6
/20
21
3/2
7/2
02
1
4/1
7/2
02
1
5/8
/20
21
5/2
9/2
02
1
6/1
9/2
02
1
Co
nti
nu
ed
Cla
ims
Reflecting Week Ended
18
,70
41
5,2
39
16
,53
9 47
,19
0 86
,47
41
09
,80
1 15
3,4
66
14
2,7
31
16
4,0
34
15
2,8
23 1
94
,27
21
62
,53
81
80
,72
21
75
,97
41
96
,50
32
17
,71
22
29
,03
92
23
,34
02
11
,35
82
02
,32
11
64
,50
01
86
,23
91
64
,84
11
38
,14
21
43
,79
21
21
,28
11
21
,20
21
10
,49
01
05
,03
09
0,7
05
80
,47
46
3,7
40
65
,49
85
9,1
08
48
,36
14
7,1
84
47
,42
93
8,2
49
48
,40
94
5,1
85
64
,94
86
7,5
48
36
,07
04
8,5
95
46
,93
64
0,6
33
36
,94
1
0
50,000
100,000
150,000
200,000
250,000
300,000
Co
nti
nu
ed
Cla
ims
Reflecting Week Ended
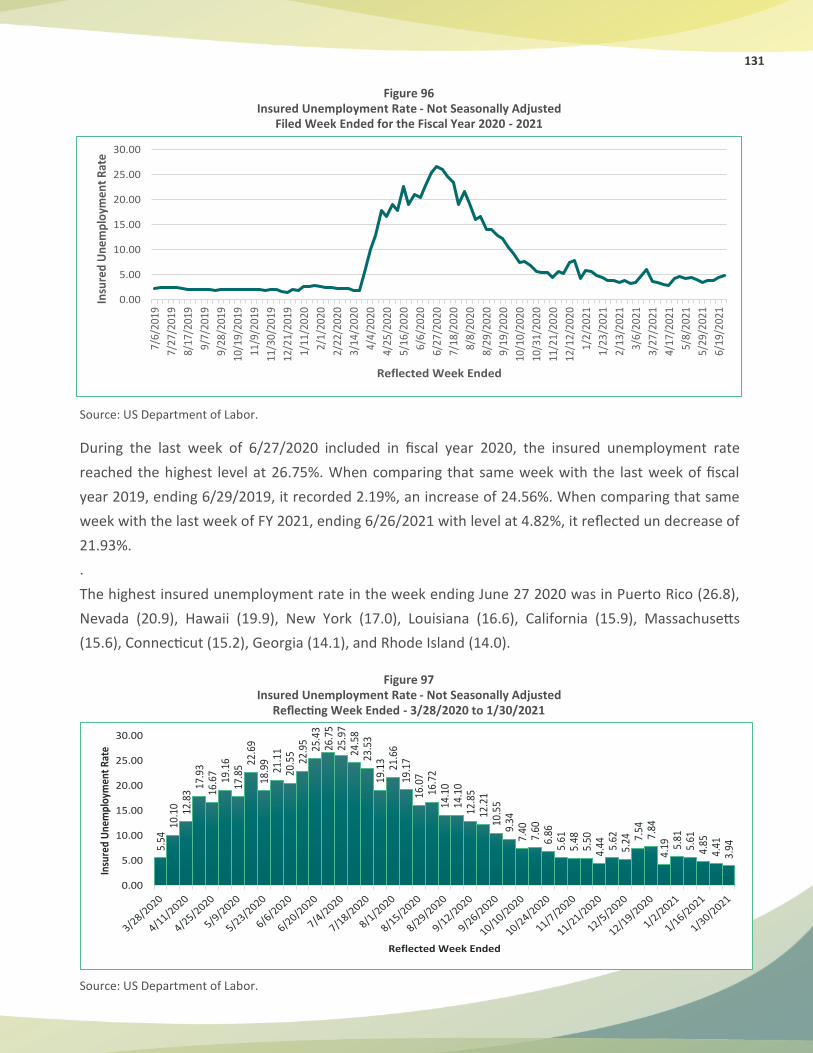
131
Figure 96 Insured Unemployment Rate - Not Seasonally Adjusted
Filed Week Ended for the Fiscal Year 2020 - 2021
Source: US Department of Labor.
During the last week of 6/27/2020 included in fiscal year 2020, the insured unemployment rate
reached the highest level at 26.75%. When comparing that same week with the last week of fiscal
year 2019, ending 6/29/2019, it recorded 2.19%, an increase of 24.56%. When comparing that same
week with the last week of FY 2021, ending 6/26/2021 with level at 4.82%, it reflected un decrease of
21.93%.
.
The highest insured unemployment rate in the week ending June 27 2020 was in Puerto Rico (26.8),
Nevada (20.9), Hawaii (19.9), New York (17.0), Louisiana (16.6), California (15.9), Massachusetts
(15.6), Connecticut (15.2), Georgia (14.1), and Rhode Island (14.0).
Figure 97
Insured Unemployment Rate - Not Seasonally Adjusted Reflecting Week Ended - 3/28/2020 to 1/30/2021
Source: US Department of Labor.
0.00
5.00
10.00
15.00
20.00
25.00
30.007/
6/20
19
7/27
/201
9
8/17
/201
9
9/7/
2019
9/28
/201
9
10/1
9/20
19
11/9
/201
9
11/3
0/20
19
12/2
1/20
19
1/11
/202
0
2/1/
2020
2/22
/202
0
3/14
/202
0
4/4/
2020
4/25
/202
0
5/16
/202
0
6/6/
2020
6/27
/202
0
7/18
/202
0
8/8/
2020
8/29
/202
0
9/19
/202
0
10/1
0/20
20
10/3
1/20
20
11/2
1/20
20
12/1
2/20
20
1/2/
2021
1/23
/202
1
2/13
/202
1
3/6/
2021
3/27
/202
1
4/17
/202
1
5/8/
2021
5/29
/202
1
6/19
/202
1
Insu
red
Un
emp
loym
ent
Rat
e
Reflected Week Ended
5.54
10.1
0 12.8
317
.93
16.6
719
.16
17.8
5 22.6
918
.99
21.1
120
.55
22.9
525
.43
26.7
525
.97
24.5
823
.53
19.1
321
.66
19.1
716
.07
16.7
214
.10
14.1
012
.85
12.2
110
.55
9.34
7.40
7.60
6.86
5.61
5.48
5.50
4.44 5.
625.
24 7.54
7.84
4.19 5.
815.
614.
854.
413.
94
0.00
5.00
10.00
15.00
20.00
25.00
30.00
Insu
red
Une
mpl
oym
ent
Rat
e
Reflected Week Ended
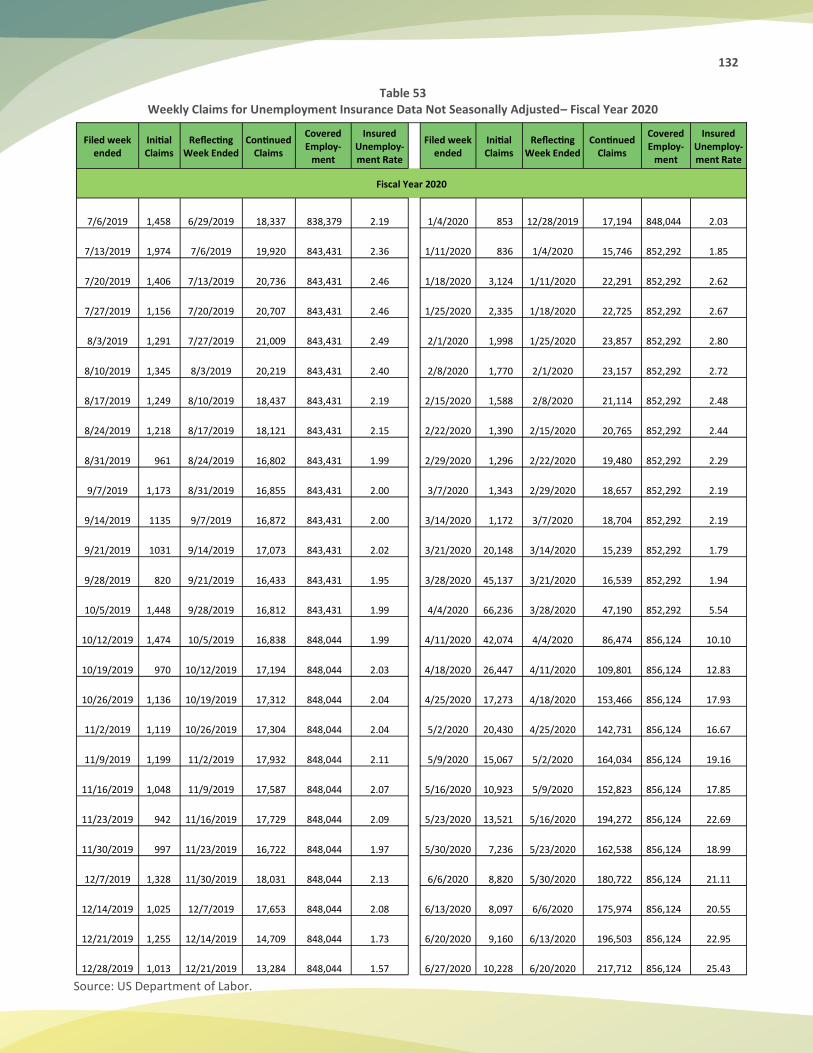
132
Table 53 Weekly Claims for Unemployment Insurance Data Not Seasonally Adjusted– Fiscal Year 2020
Source: US Department of Labor.
Filed week ended
Initial Claims
Reflecting Week Ended
Continued Claims
Covered Employ-
ment
Insured Unemploy-ment Rate
Filed week ended
Initial Claims
Reflecting Week Ended
Continued Claims
Covered Employ-
ment
Insured Unemploy-ment Rate
Fiscal Year 2020
7/6/2019 1,458 6/29/2019 18,337 838,379 2.19 1/4/2020 853 12/28/2019 17,194 848,044 2.03
7/13/2019 1,974 7/6/2019 19,920 843,431 2.36 1/11/2020 836 1/4/2020 15,746 852,292 1.85
7/20/2019 1,406 7/13/2019 20,736 843,431 2.46 1/18/2020 3,124 1/11/2020 22,291 852,292 2.62
7/27/2019 1,156 7/20/2019 20,707 843,431 2.46 1/25/2020 2,335 1/18/2020 22,725 852,292 2.67
8/3/2019 1,291 7/27/2019 21,009 843,431 2.49 2/1/2020 1,998 1/25/2020 23,857 852,292 2.80
8/10/2019 1,345 8/3/2019 20,219 843,431 2.40 2/8/2020 1,770 2/1/2020 23,157 852,292 2.72
8/17/2019 1,249 8/10/2019 18,437 843,431 2.19 2/15/2020 1,588 2/8/2020 21,114 852,292 2.48
8/24/2019 1,218 8/17/2019 18,121 843,431 2.15 2/22/2020 1,390 2/15/2020 20,765 852,292 2.44
8/31/2019 961 8/24/2019 16,802 843,431 1.99 2/29/2020 1,296 2/22/2020 19,480 852,292 2.29
9/7/2019 1,173 8/31/2019 16,855 843,431 2.00 3/7/2020 1,343 2/29/2020 18,657 852,292 2.19
9/14/2019 1135 9/7/2019 16,872 843,431 2.00 3/14/2020 1,172 3/7/2020 18,704 852,292 2.19
9/21/2019 1031 9/14/2019 17,073 843,431 2.02 3/21/2020 20,148 3/14/2020 15,239 852,292 1.79
9/28/2019 820 9/21/2019 16,433 843,431 1.95 3/28/2020 45,137 3/21/2020 16,539 852,292 1.94
10/5/2019 1,448 9/28/2019 16,812 843,431 1.99 4/4/2020 66,236 3/28/2020 47,190 852,292 5.54
10/12/2019 1,474 10/5/2019 16,838 848,044 1.99 4/11/2020 42,074 4/4/2020 86,474 856,124 10.10
10/19/2019 970 10/12/2019 17,194 848,044 2.03 4/18/2020 26,447 4/11/2020 109,801 856,124 12.83
10/26/2019 1,136 10/19/2019 17,312 848,044 2.04 4/25/2020 17,273 4/18/2020 153,466 856,124 17.93
11/2/2019 1,119 10/26/2019 17,304 848,044 2.04 5/2/2020 20,430 4/25/2020 142,731 856,124 16.67
11/9/2019 1,199 11/2/2019 17,932 848,044 2.11 5/9/2020 15,067 5/2/2020 164,034 856,124 19.16
11/16/2019 1,048 11/9/2019 17,587 848,044 2.07 5/16/2020 10,923 5/9/2020 152,823 856,124 17.85
11/23/2019 942 11/16/2019 17,729 848,044 2.09 5/23/2020 13,521 5/16/2020 194,272 856,124 22.69
11/30/2019 997 11/23/2019 16,722 848,044 1.97 5/30/2020 7,236 5/23/2020 162,538 856,124 18.99
12/7/2019 1,328 11/30/2019 18,031 848,044 2.13 6/6/2020 8,820 5/30/2020 180,722 856,124 21.11
12/14/2019 1,025 12/7/2019 17,653 848,044 2.08 6/13/2020 8,097 6/6/2020 175,974 856,124 20.55
12/21/2019 1,255 12/14/2019 14,709 848,044 1.73 6/20/2020 9,160 6/13/2020 196,503 856,124 22.95
12/28/2019 1,013 12/21/2019 13,284 848,044 1.57 6/27/2020 10,228 6/20/2020 217,712 856,124 25.43
133
Table 54 Weekly Claims for Unemployment Insurance Data Not Seasonally Adjusted - Fiscal Year 2021
Source: US Department of Labor.
Filed week ended
Initial Claims
Reflecting Week Ended
Continued Claims
Covered Employ-
ment
Insured Unemploy-ment Rate
Filed week ended
Initial Claims
Reflecting Week Ended
Continued Claims
Covered Employ-
ment
Insured Unemploy-ment Rate
Fiscal Year 2021
7/4/2020 11,257 6/27/2020 229,039 856,124 26.75 1/2/2021 1239 12/26/2020 36,070 861,782 4.19
7/11/2020 7,945 7/4/2020 223,340 859,886 25.97 1/9/2021 1,935 1/2/2021 48,595 836,949 5.81
7/18/2020 7,017 7/11/2020 211,358 859,886 24.58 1/16/2021 1,694 1/9/2021 46,936 836,949 5.61
7/25/2020 6,715 7/18/2020 202,321 859,886 23.53 1/23/2021 1,433 1/16/2021 40,633 836,949 4.85
8/1/2020 2,253 7/25/2020 164,500 859,886 19.13 1/30/2021 1,058 1/23/2021 36,941 836,949 4.41
8/8/2020 5,854 8/1/2020 186,239 859,886 21.66 2/6/2021 1,409 1/30/2021 32,944 836,949 3.94
8/15/2020 2,990 8/8/2020 164,841 859,886 19.17 2/13/2021 1,516 2/6/2021 31,802 836,949 3.80
8/22/2020 2,356 8/15/2020 138,142 859,886 16.07 2/20/2021 1,275 2/13/2021 28,927 836,949 3.46
8/29/2020 1,825 8/22/2020 143,792 859,886 16.72 2/27/2021 1,279 2/20/2021 32,678 836,949 3.90
9/5/2020 1,374 8/29/2020 121,281 859,886 14.10 3/6/2021 1,279 2/27/2021 27,134 836,949 3.24
9/12/2020 1185 9/5/2020 121,202 859,886 14.10 3/13/2021 1,266 3/6/2021 29,744 836,949 3.55
9/19/2020 1149 9/12/2020 110,490 859,886 12.85 3/20/2021 1,592 3/13/2021 41,209 836,949 4.92
9/26/2020 763 9/19/2020 105,030 859,886 12.21 3/27/2021 1,674 3/20/2021 50,083 836,949 5.98
10/3/2020 1,265 9/26/2020 90,705 859,886 10.55 4/3/2021 1,471 3/27/2021 30,759 836,949 3.68
10/10/2020 1,346 10/3/2020 80,474 861,782 9.34 4/10/2021 2,302 4/3/2021 27,899 823,593 3.39
10/17/2020 1,249 10/10/2020 63,740 861,782 7.40 4/17/2021 2,169 4/10/2021 25,686 823,593 3.12
10/24/2020 1,200 10/17/2020 65,498 861,782 7.60 4/24/2021 1,953 4/17/2021 23,923 823,593 2.90
10/31/2020 1,231 10/24/2020 59,108 861,782 6.86 5/1/2021 2,777 4/24/2021 35,925 823,593 4.36
11/7/2020 851 10/31/2020 48,361 861,782 5.61 5/8/2021 2,969 5/1/2021 37,778 823,593 4.59
11/14/2020 1,141 11/7/2020 47,184 861,782 5.48 5/15/2021 2,024 5/8/2021 35,628 823,593 4.33
11/21/2020 1113 11/14/2020 47,429 861,782 5.50 5/22/2021 2,367 5/15/2021 36,670 823,593 4.45
11/28/2020 969 11/21/2020 38,249 861,782 4.44 5/29/2021 2,469 5/22/2021 33,472 823,593 4.06
12/5/2020 1,350 11/28/2020 48,409 861,782 5.62 6/5/2021 3,029 5/29/2021 28,563 823,593 3.47
12/12/2020 1,273 12/5/2020 45,185 861,782 5.24 6/12/2021 3,074 6/5/2021 31,802 823,593 3.86
12/19/2020 1,119 12/12/2020 64,948 861,782 7.54 6/19/2021 4,028 6/12/2021 32,108 823,593 3.90
12/26/2020 1,093 12/19/2020 67,548 861,782 7.84 6/26/2021 8,126 6/19/2021 37,230 823,593 4.52
Table 55 Weekly Pandemic Claims Data – Fiscal Year 2020 to 2021
Source: US Department of Labor.
Report for Period Ending
Pandemic Unemploy-
ment Assistance
(PUA) Reflect Date
Pandemic Unemployment
Assistance (PUA)
Pandemic Emergency
Unemploy-ment Compensation
(PEUC)
Report for Period Ending
Pandemic Unemploy-
ment Assistance
(PUA) Reflect Date
Pandemic Unemployment
Assistance (PUA)
Pandemic Emergency Unemploy-
ment Compensation
(PEUC)
Initial Claims
Continued Claims
Continued Claims
Initial Claims
Continued Claims
Continued Claims
5/16/2020 1,022 5/9/2020 3,948 0 12/12/2020 13,967 12/5/2020 239,066 43,737
5/23/2020 67,611 5/16/2020 338,484 0 12/19/2020 13,366 12/12/2020 249,367 96,241
5/30/2020 15,631 5/23/2020 161,634 0 12/26/2020 13,285 12/19/2020 241,755 116,421
6/6/2020 18,338 5/30/2020 208,790 6,875 1/2/2021 13,111 12/26/2020 241,218 28,986
6/13/2020 20,501 6/6/2020 269,686 8,783 1/9/2021 3,868 1/2/2021 159,890 39,352
6/20/2020 30,535 6/13/2020 395,010 8,690 1/16/2021 13,891 1/9/2021 461,008 51,577
6/27/2020 37,519 6/20/2020 553,519 9,143 1/23/2021 7,820 1/16/2021 286,552 42,321
7/4/2020 39,490 6/27/2020 617,061 8,151 1/30/2021 4,216 1/23/2021 241,314 39,874
7/11/2020 26,176 7/4/2020 529,714 7,722 2/6/2021 3,883 1/30/2021 267,257 93,376
7/18/2020 23,407 7/11/2020 470,044 6,903 2/13/2021 4,276 2/6/2021 218,641 87,091
7/25/2020 24111 7/18/2020 526,850 5,884 2/20/2021 2,579 2/13/2021 203,806 64,351
8/1/2020 4024 7/25/2020 236,487 5,381 2/27/2021 2,122 2/20/2021 199,275 80,800
8/8/2020 24969 8/1/2020 448,143 5,409 3/6/2021 1,995 2/27/2021 187,476 62,484
8/15/2020 7,035 8/8/2020 278,030 5,089 3/13/2021 5,267 3/6/2021 228,452 76,554
8/22/2020 6,400 8/15/2020 263,590 4,712 3/20/2021 37,452 3/13/2021 496,107 39,821
8/29/2020 4,480 8/22/2020 186,879 4,927 3/27/2021 13,070 3/20/2021 380,826 15,430
9/5/2020 21,176 8/29/2020 343,725 4,780 4/3/2021 10,087 3/27/2021 288,649 6,267
9/12/2020 27,693 9/5/2020 441,260 0 4/10/2021 6,670 4/3/2021 270,869 6,785
9/19/2020 30,447 9/12/2020 182,280 5,461 4/17/2021 4,976 4/10/2021 239,267 4,853
9/26/2020 11,809 9/19/2020 194,614 7,110 4/24/2021 3,821 4/17/2021 209,817 8,648
10/3/2020 11314 9/26/2020 188,592 10,105 5/1/2021 3,225 4/24/2021 214,961 123,238
10/10/2020 11,521 10/3/2020 185,179 14,731 5/8/2021 3,226 5/1/2021 214,979 50,235
10/17/2020 12,443 10/10/2020 198,025 17,780 5/15/2021 3,100 5/8/2021 190,901 42,502
10/24/2020 11,744 10/17/2020 201,943 24,176 5/22/2021 2,106 5/15/2021 183,334 49,142
10/31/2020 11,648 10/24/2020 204,416 29,319 5/29/2021 1,598 5/22/2021 177,584 43,641
11/7/2020 11,507 10/31/2020 205,456 30,011 6/5/2021 1,566 5/29/2021 169,761 41,719
11/14/2020 11,390 11/7/2020 265,322 32,957 6/12/2021 1,507 6/5/2021 172,650 42,545
11/21/2020 11,416 11/14/2020 209,875 36,177 6/19/2021 1,580 6/12/2021 163,468 43,711
11/28/2020 11,837 11/21/2020 215,385 34,696 6/26/2021 3,367 6/19/2021 183,556 44,854
12/5/2020 13,267 11/28/2020 234,520 42,766
135
Figure 98 Pandemic Unemployment Assistance (PUA) Initial Claims
Source: US Department of Labor.
Figure 99
Pandemic Unemployment Assistance (PUA) Initial Claims
Source: US Department of Labor.
Figure 100
Pandemic Emergency Unemployment Compensation (PEUC)
Source: US Department of Labor.
0
10000
20000
30000
40000
50000
60000
70000
80000
PUA
Init
ial C
laim
s
Report for period ending
0
100,000
200,000
300,000
400,000
500,000
600,000
700,000
PUA
Con
tinu
ed C
laim
s
Reflect Date
0
20,000
40,000
60,000
80,000
100,000
120,000
140,000
PU
A C
on
tin
ued
Cla
ims
Reflect Date
136
A. Weekly Claims for Unemployment Insurance Data
Unemployment Insurance weekly claims data is used in current economic analysis of
unemployment trends. Initial claims measure emerging unemployment. Continued weeks claimed
measure the number of persons claiming unemployment benefits. This monthly report is due in the
National Office by the 20th of the month, following the month the data relates. The survey week is
to coincide with the survey week for the Bureau of Labor Statistics' Current Population Survey (CPS)
week. This usually represents weeks claimed, filed during the week containing the 19th of the month.
The week containing the 19th of the month is assumed to reflect unemployment experienced during
the prior week containing the 12th of the month, the CPS survey week. When the CPS survey week is
altered due to holidays, etc., the week used for the ETA 203 Report should be altered accordingly.
Insured Unemployed for this report, the number of insured unemployed, is the amount of regular
state UI continued weeks claimed, both intrastate and interstate. The total count for insured
unemployed is not reported on the ETA 203 but rather, the counts for demographic subcategories
are reported. The sum of any given category, such as age groups, should generally be identical to the
total for insured unemployed as reported on the ETA 539 report for state UI adjusted continued
weeks claimed (CW) for the same week. Continued weeks claimed, under the Extended Benefit (EB)
program, State Additional Benefits Program (AB), or any other extended compensation program
should not be included on the ETA 203.
Industry coding will follow the most recent edition of the North American Industry Classification
System (NAICS). Whenever possible, the industry assigned should be that of the employer for whom
the claimant last worked. If it is not feasible to obtain the industry code of the most recent employer,
the major base period employer may be substituted. Interstate claimants should be classified
according to the best information available in the agent state.
Occupation codes will follow the most recent revision of the Standard Occupational Classification
(SOC).
According to the COVID-19 pandemic, in Puerto Rico there was a total lockdown in mid-March, but
some industries continued to open little by little. We will present the characteristics of the
unemployed for the months that comprise fiscal year 2020 and 2021. The months of April to
September of fiscal year 2020 reflected the largest number of claimants, due to the COVID-19
pandemic.
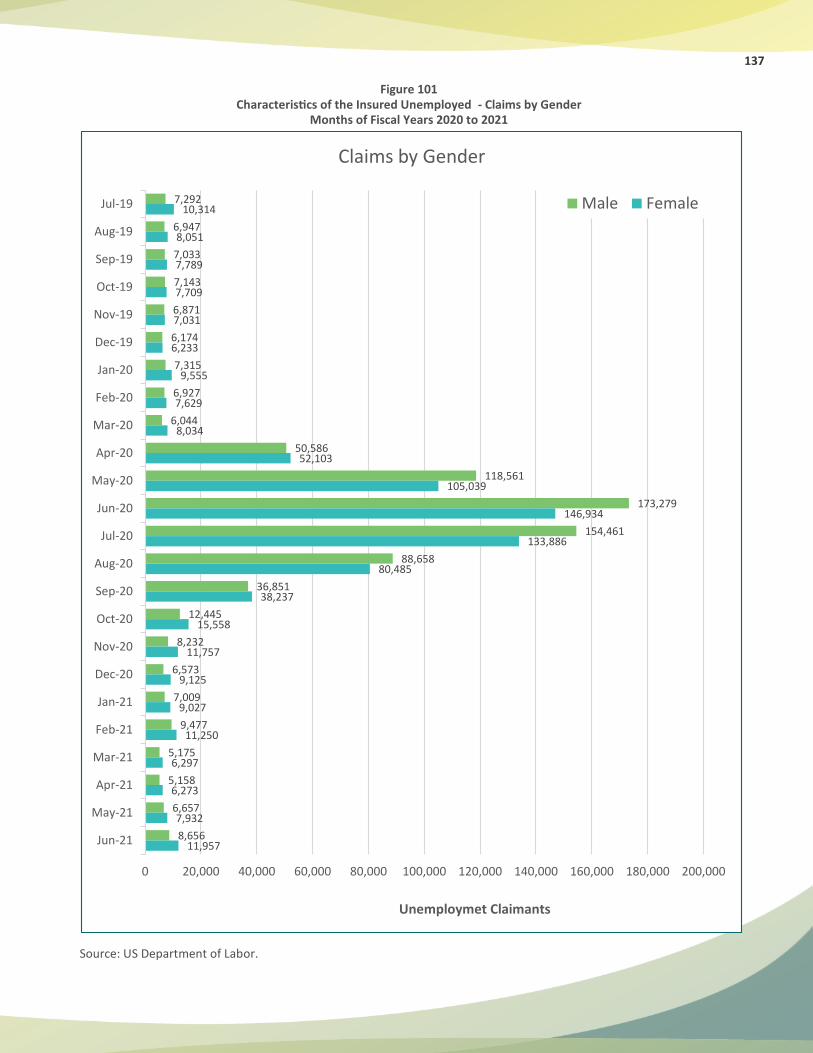
137
Source: US Department of Labor.
Figure 101 Characteristics of the Insured Unemployed - Claims by Gender
Months of Fiscal Years 2020 to 2021
7,292
6,947
7,033
7,143
6,871
6,174
7,315
6,927
6,044
50,586
118,561
173,279
154,461
88,658
36,851
12,445
8,232
6,573
7,009
9,477
5,175
5,158
6,657
8,656
10,314
8,051
7,789
7,709
7,031
6,233
9,555
7,629
8,034
52,103
105,039
146,934
133,886
80,485
38,237
15,558
11,757
9,125
9,027
11,250
6,297
6,273
7,932
11,957
0 20,000 40,000 60,000 80,000 100,000 120,000 140,000 160,000 180,000 200,000
Jul-19
Aug-19
Sep-19
Oct-19
Nov-19
Dec-19
Jan-20
Feb-20
Mar-20
Apr-20
May-20
Jun-20
Jul-20
Aug-20
Sep-20
Oct-20
Nov-20
Dec-20
Jan-21
Feb-21
Mar-21
Apr-21
May-21
Jun-21
Unemploymet Claimants
Claims by Gender
Male Female
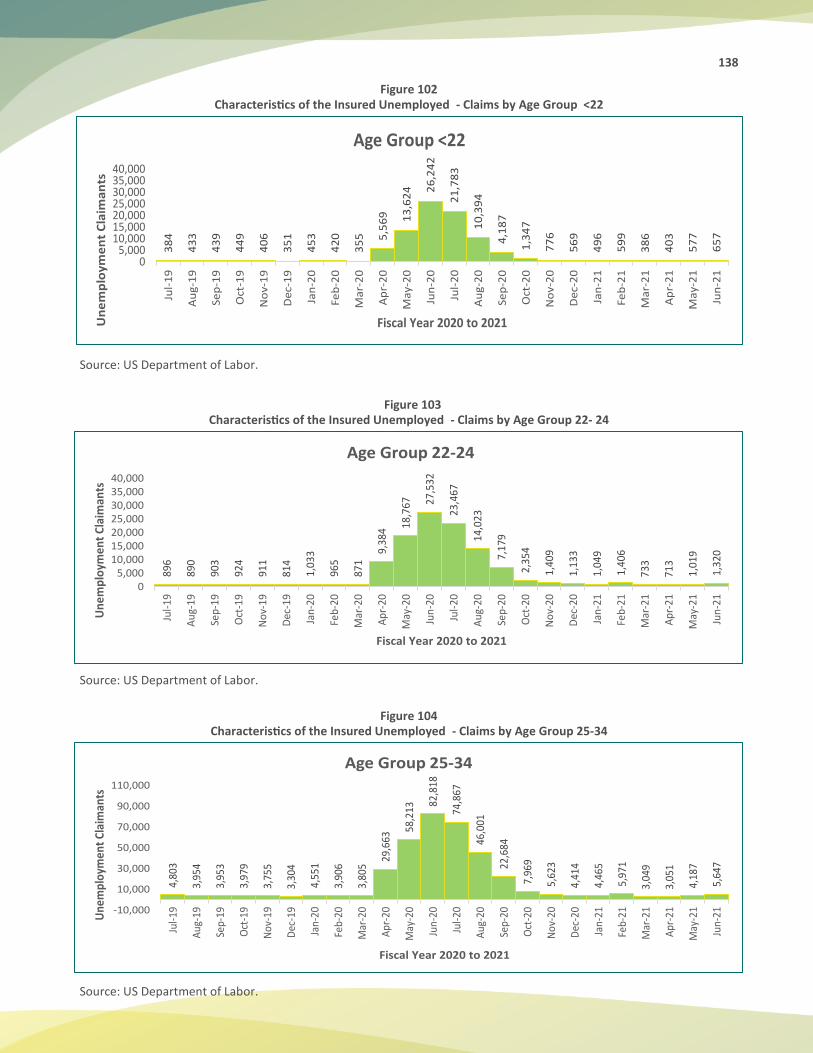
138
Figure 102 Characteristics of the Insured Unemployed - Claims by Age Group <22
Source: US Department of Labor.
Figure 103 Characteristics of the Insured Unemployed - Claims by Age Group 22- 24
Source: US Department of Labor.
Figure 104 Characteristics of the Insured Unemployed - Claims by Age Group 25-34
Source: US Department of Labor.
38
4
43
3
43
9
44
9
40
6
35
1
45
3
42
0
35
5 5,5
69 13
,62
4 26
,24
2
21
,78
3
10
,39
4
4,1
87
1,3
47
77
6
56
9
49
6
59
9
38
6
40
3
57
7
65
7
05,000
10,00015,00020,00025,00030,00035,00040,000
Jul-
19
Au
g-1
9
Sep
-19
Oct
-19
No
v-1
9
De
c-1
9
Jan
-20
Feb
-20
Ma
r-2
0
Ap
r-2
0
Ma
y-2
0
Jun
-20
Jul-
20
Au
g-2
0
Sep
-20
Oct
-20
No
v-2
0
De
c-2
0
Jan
-21
Feb
-21
Ma
r-2
1
Ap
r-2
1
Ma
y-2
1
Jun
-21
Un
em
plo
ym
en
t C
laim
an
ts
Fiscal Year 2020 to 2021
Age Group <2289
6
890
903
924
911
814
1,03
3
965
871
9,38
4 18,7
67 27,5
32
23,4
67
14,0
23
7,17
9
2,35
4
1,40
9
1,13
3
1,04
9
1,40
6
733
713
1,01
9
1,32
0
05,000
10,00015,00020,00025,00030,00035,00040,000
Jul-
19
Au
g-19
Sep-
19
Oct
-19
No
v-19
Dec
-19
Jan
-20
Feb-
20
Mar
-20
Ap
r-20
May
-20
Jun
-20
Jul-
20
Au
g-20
Sep-
20
Oct
-20
No
v-20
Dec
-20
Jan
-21
Feb-
21
Mar
-21
Ap
r-21
May
-21
Jun
-21
Un
emp
loym
ent
Cla
iman
ts
Fiscal Year 2020 to 2021
Age Group 22-24
4,80
3
3,95
4
3,95
3
3,97
9
3,75
5
3,30
4
4,55
1
3,90
6
3,80
5
29,6
63
58,2
13
82,8
18
74,8
67
46,0
01
22,6
84
7,96
9
5,62
3
4,41
4
4,46
5
5,97
1
3,04
9
3,05
1
4,18
7
5,64
7
-10,000
10,000
30,000
50,000
70,000
90,000
110,000
Jul-
19
Aug
-19
Sep-
19
Oct
-19
Nov
-19
Dec
-19
Jan-
20
Feb-
20
Mar
-20
Apr
-20
May
-20
Jun-
20
Jul-
20
Aug
-20
Sep-
20
Oct
-20
Nov
-20
Dec
-20
Jan-
21
Feb-
21
Mar
-21
Apr
-21
May
-21
Jun-
21Une
mp
loym
ent
Clai
man
ts
Fiscal Year 2020 to 2021
Age Group 25-34
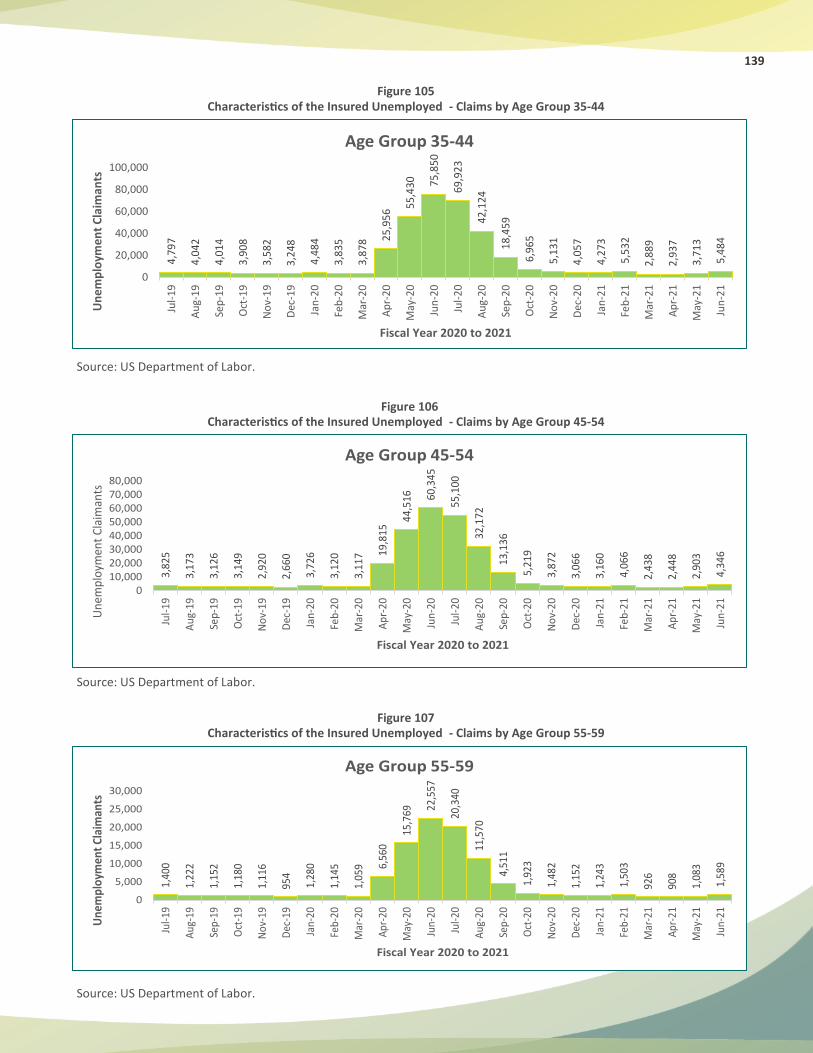
139
Figure 105 Characteristics of the Insured Unemployed - Claims by Age Group 35-44
Source: US Department of Labor.
Figure 106 Characteristics of the Insured Unemployed - Claims by Age Group 45-54
Source: US Department of Labor.
Figure 107 Characteristics of the Insured Unemployed - Claims by Age Group 55-59
Source: US Department of Labor.
4,79
7
4,04
2
4,01
4
3,90
8
3,58
2
3,24
8
4,48
4
3,83
5
3,87
8 25,9
56
55,4
30 75,8
50
69,9
23
42,1
24
18,4
59
6,96
5
5,13
1
4,05
7
4,27
3
5,53
2
2,88
9
2,93
7
3,71
3
5,48
4
0
20,000
40,000
60,000
80,000
100,000Ju
l-19
Au
g-19
Sep
-19
Oct
-19
No
v-19
Dec
-19
Jan
-20
Feb
-20
Mar
-20
Ap
r-20
May
-20
Jun
-20
Jul-
20
Au
g-20
Sep
-20
Oct
-20
No
v-20
Dec
-20
Jan
-21
Feb
-21
Mar
-21
Ap
r-21
May
-21
Jun
-21
Un
emp
loym
ent
Cla
iman
ts
Fiscal Year 2020 to 2021
Age Group 35-443,
825
3,17
3
3,12
6
3,14
9
2,92
0
2,66
0
3,72
6
3,12
0
3,11
7 19,8
15
44,5
16 60,3
45
55,1
00
32,1
72
13,1
36
5,21
9
3,87
2
3,06
6
3,16
0
4,06
6
2,43
8
2,44
8
2,90
3
4,34
6
010,00020,00030,00040,00050,00060,00070,00080,000
Jul-
19
Au
g-19
Sep-
19
Oct
-19
No
v-19
Dec
-19
Jan-
20
Feb-
20
Mar
-20
Ap
r-20
May
-20
Jun
-20
Jul-
20
Au
g-20
Sep-
20
Oct
-20
No
v-20
Dec
-20
Jan-
21
Feb-
21
Mar
-21
Ap
r-21
May
-21
Jun
-21
Un
emp
loym
ent
Cla
iman
ts
Fiscal Year 2020 to 2021
Age Group 45-54
1,40
0
1,22
2
1,15
2
1,18
0
1,11
6
954
1,28
0
1,14
5
1,05
9 6,56
0
15,7
69 22,5
57
20,3
40
11,5
70
4,51
1
1,92
3
1,48
2
1,15
2
1,24
3
1,50
3
926
908
1,08
3
1,58
9
0
5,000
10,000
15,000
20,000
25,000
30,000
Jul-1
9
Aug
-19
Sep-
19
Oct
-19
Nov
-19
Dec
-19
Jan-
20
Feb-
20
Mar
-20
Apr
-20
May
-20
Jun-
20
Jul-2
0
Aug
-20
Sep-
20
Oct
-20
Nov
-20
Dec
-20
Jan-
21
Feb-
21
Mar
-21
Apr
-21
May
-21
Jun-
21
Une
mpl
oym
ent
Clai
man
ts
Fiscal Year 2020 to 2021
Age Group 55-59
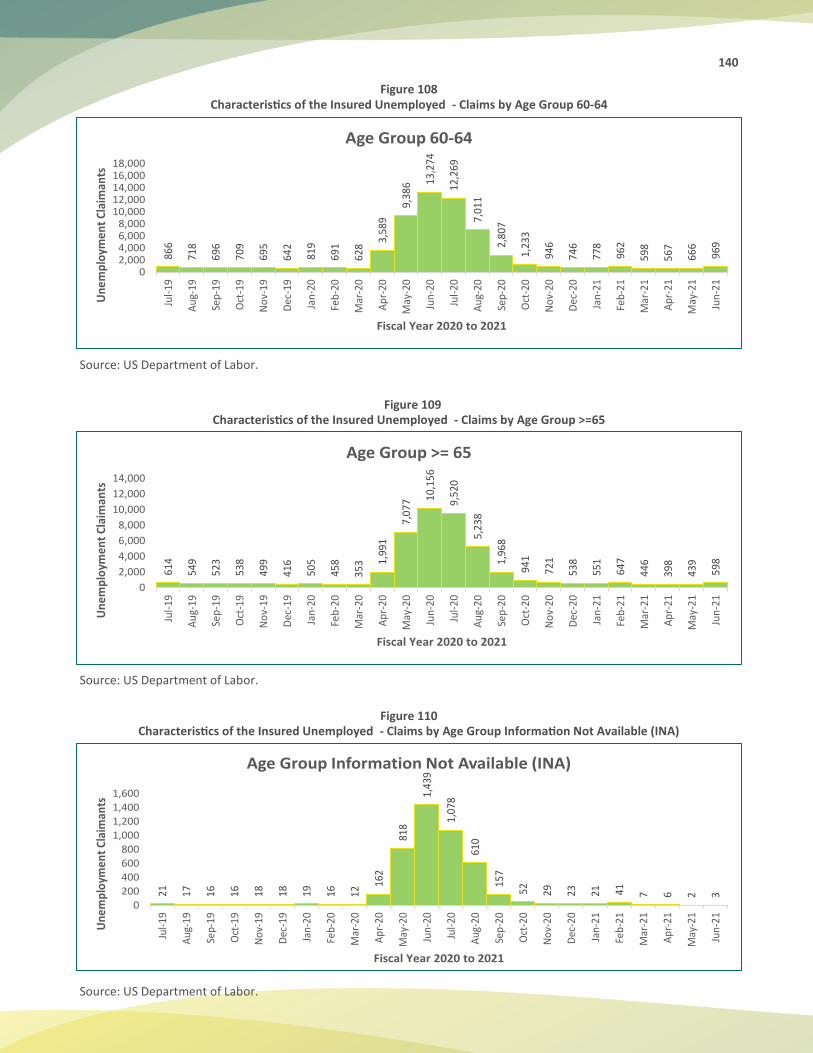
140
Figure 108 Characteristics of the Insured Unemployed - Claims by Age Group 60-64
Source: US Department of Labor.
Figure 109 Characteristics of the Insured Unemployed - Claims by Age Group >=65
Source: US Department of Labor.
Figure 110 Characteristics of the Insured Unemployed - Claims by Age Group Information Not Available (INA)
Source: US Department of Labor.
866
718
696
709
695
642
819
691
628
3,58
9
9,38
6 13,2
74
12,2
69
7,01
1
2,80
7
1,23
3
946
746
778
962
598
567
666
969
02,0004,0006,0008,000
10,00012,00014,00016,00018,000
Jul-
19
Au
g-19
Sep-
19
Oct
-19
No
v-19
Dec
-19
Jan-
20
Feb-
20
Mar
-20
Ap
r-20
May
-20
Jun
-20
Jul-
20
Au
g-20
Sep-
20
Oct
-20
No
v-20
Dec
-20
Jan-
21
Feb-
21
Mar
-21
Ap
r-21
May
-21
Jun
-21
Un
emp
loym
ent
Cla
iman
ts
Fiscal Year 2020 to 2021
Age Group 60-64
614
549
523
538
499
416
505
458
353 1,
991
7,07
7 10,1
56
9,52
0
5,23
8
1,96
8
941
721
538
551
647
446
398
439
598
0
2,000
4,000
6,000
8,000
10,000
12,000
14,000
Jul-
19
Au
g-19
Sep
-19
Oct
-19
No
v-19
Dec
-19
Jan
-20
Feb
-20
Mar
-20
Ap
r-20
May
-20
Jun
-20
Jul-
20
Au
g-20
Sep
-20
Oct
-20
No
v-20
Dec
-20
Jan
-21
Feb
-21
Mar
-21
Ap
r-21
May
-21
Jun
-21
Un
emp
loym
ent
Cla
iman
ts
Fiscal Year 2020 to 2021
Age Group >= 65
21 17 16 16 18 18 19 16 12
162
818
1,43
9
1,07
8
610
157
52 29 23 21 41 7 6 2 3
0
200
400
600
800
1,000
1,200
1,400
1,600
Jul-
19
Au
g-19
Sep-
19
Oct
-19
No
v-19
Dec
-19
Jan-
20
Feb-
20
Mar
-20
Ap
r-20
May
-20
Jun
-20
Jul-
20
Au
g-20
Sep-
20
Oct
-20
No
v-20
Dec
-20
Jan-
21
Feb-
21
Mar
-21
Ap
r-21
May
-21
Jun
-21
Un
emp
loym
ent
Clai
man
ts
Fiscal Year 2020 to 2021
Age Group Information Not Available (INA)
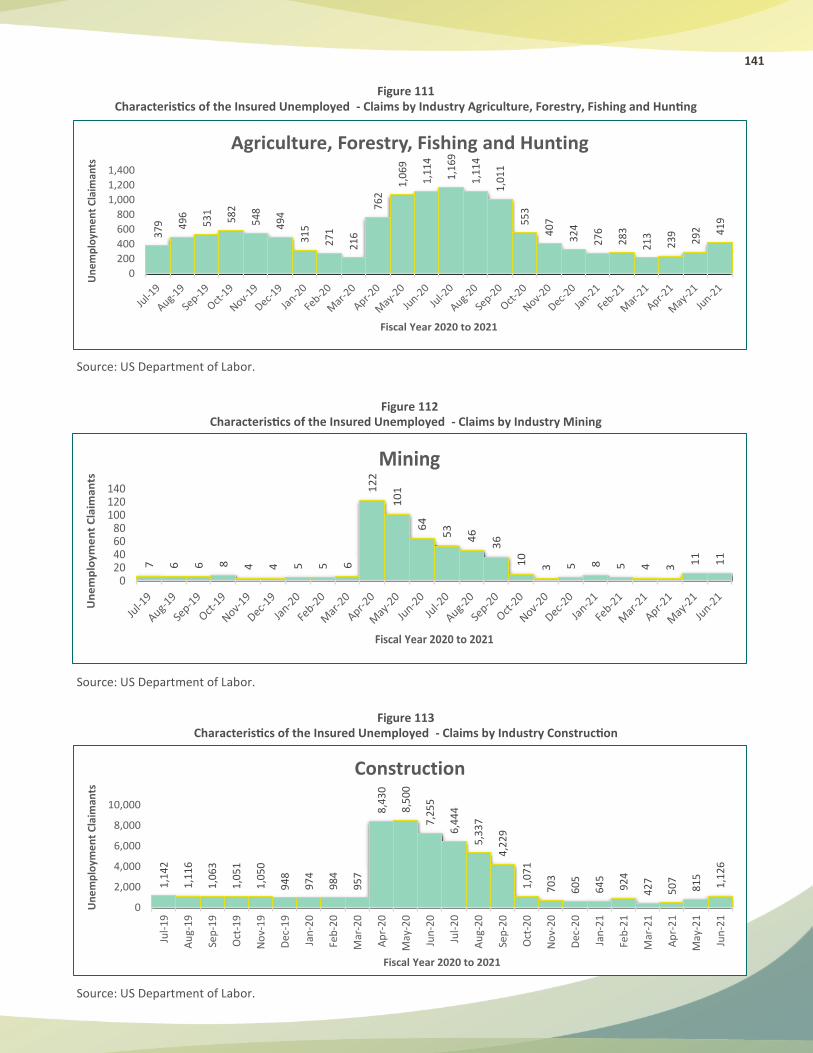
141
Figure 111 Characteristics of the Insured Unemployed - Claims by Industry Agriculture, Forestry, Fishing and Hunting
Source: US Department of Labor.
Figure 112 Characteristics of the Insured Unemployed - Claims by Industry Mining
Source: US Department of Labor.
Figure 113 Characteristics of the Insured Unemployed - Claims by Industry Construction
Source: US Department of Labor.
379 49
6
531
582
548
494
315
271
216
762
1,06
9
1,11
4
1,16
9
1,11
4
1,01
1
553
407
324
276
283
213
239
292 41
9
0
200
400
600
800
1,000
1,200
1,400
Un
emp
loym
ent
Cla
iman
ts
Fiscal Year 2020 to 2021
Agriculture, Forestry, Fishing and Hunting7 6 6 8 4 4 5 5 6
12
2
10
1
64
53
46
36
10
3 5 8 5 4 3 11
11
020406080
100120140
Un
em
plo
ym
en
t C
laim
an
ts
Fiscal Year 2020 to 2021
Mining
1,1
42
1,1
16
1,0
63
1,0
51
1,0
50
94
8
97
4
984
95
7
8,4
30
8,5
00
7,2
55
6,4
44
5,3
37
4,2
29
1,0
71
70
3
60
5
64
5
92
4
42
7
50
7
815
1,1
26
0
2,000
4,000
6,000
8,000
10,000
Jul-
19
Au
g-1
9
Sep
-19
Oct
-19
No
v-1
9
Dec
-19
Jan
-20
Feb
-20
Mar
-20
Ap
r-2
0
May
-20
Jun
-20
Jul-
20
Au
g-2
0
Sep
-20
Oct
-20
No
v-2
0
Dec
-20
Jan
-21
Feb
-21
Mar
-21
Ap
r-2
1
May
-21
Jun
-21
Un
emp
loym
ent
Cla
iman
ts
Fiscal Year 2020 to 2021
Construction
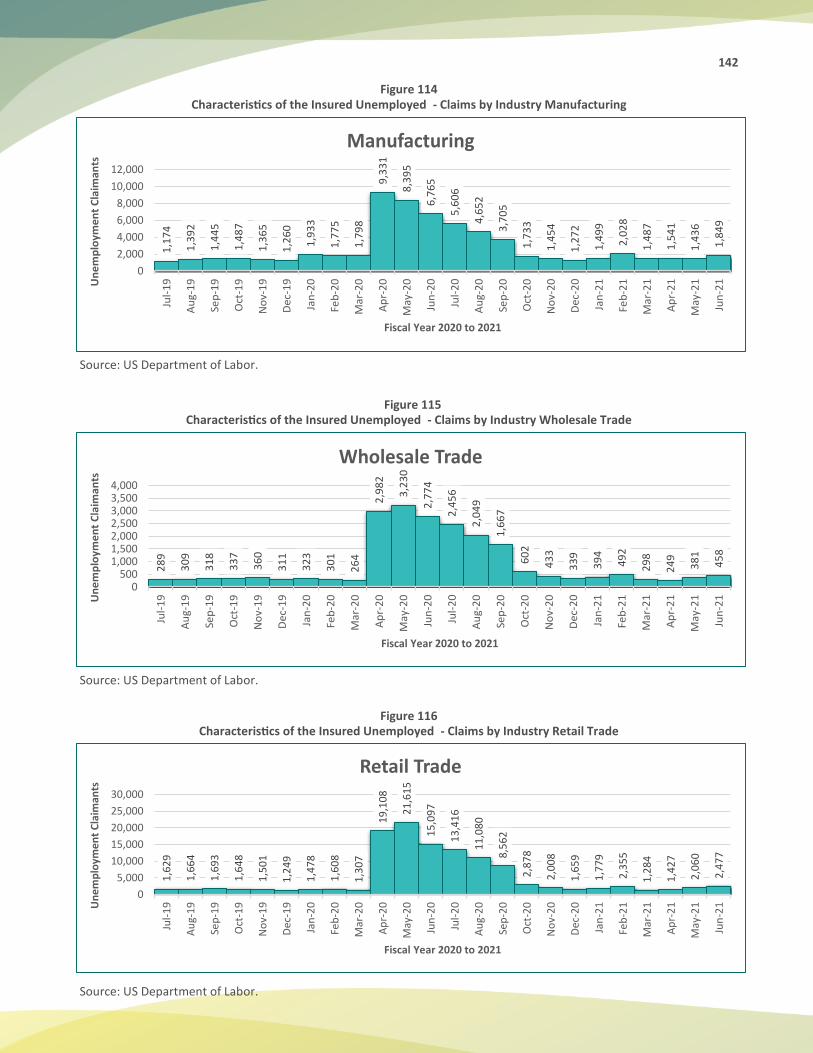
142
Figure 114 Characteristics of the Insured Unemployed - Claims by Industry Manufacturing
Source: US Department of Labor.
Figure 115 Characteristics of the Insured Unemployed - Claims by Industry Wholesale Trade
Source: US Department of Labor.
Figure 116 Characteristics of the Insured Unemployed - Claims by Industry Retail Trade
Source: US Department of Labor.
1,1
74
1,3
92
1,4
45
1,4
87
1,3
65
1,2
60
1,9
33
1,7
75
1,7
98
9,3
31
8,3
95
6,7
65
5,6
06
4,6
52
3,7
05
1,7
33
1,4
54
1,2
72
1,4
99
2,0
28
1,4
87
1,5
41
1,4
36
1,8
49
0
2,000
4,000
6,000
8,000
10,000
12,000Ju
l-1
9
Au
g-1
9
Sep
-19
Oct
-19
No
v-1
9
De
c-1
9
Jan
-20
Feb
-20
Mar
-20
Ap
r-2
0
May
-20
Jun
-20
Jul-
20
Au
g-2
0
Sep
-20
Oct
-20
No
v-2
0
De
c-2
0
Jan
-21
Feb
-21
Mar
-21
Ap
r-2
1
May
-21
Jun
-21U
ne
mp
loym
en
t C
laim
an
ts
Fiscal Year 2020 to 2021
Manufacturing2
89
30
9
31
8
33
7
36
0
31
1
32
3
30
1
26
4
2,9
82
3,2
30
2,7
74
2,4
56
2,0
49
1,6
67
60
2
43
3
33
9
39
4
49
2
29
8
24
9
38
1
45
8
0500
1,0001,5002,0002,5003,0003,5004,000
Jul-
19
Au
g-1
9
Sep
-19
Oct
-19
No
v-1
9
De
c-1
9
Jan
-20
Feb
-20
Mar
-20
Ap
r-2
0
May
-20
Jun
-20
Jul-
20
Au
g-2
0
Sep
-20
Oct
-20
No
v-2
0
De
c-2
0
Jan
-21
Feb
-21
Mar
-21
Ap
r-2
1
May
-21
Jun
-21U
ne
mp
loym
en
t C
laim
an
ts
Fiscal Year 2020 to 2021
Wholesale Trade
1,6
29
1,6
64
1,6
93
1,6
48
1,5
01
1,2
49
1,4
78
1,6
08
1,3
07
19
,10
8
21
,61
5
15
,09
7
13
,41
6
11
,08
0
8,5
62
2,8
78
2,0
08
1,6
59
1,7
79
2,3
55
1,2
84
1,4
27
2,0
60
2,4
77
0
5,000
10,000
15,000
20,000
25,000
30,000
Jul-
19
Au
g-1
9
Sep
-19
Oct
-19
No
v-1
9
Dec
-19
Jan
-20
Feb
-20
Mar
-20
Ap
r-2
0
May
-20
Jun
-20
Jul-
20
Au
g-2
0
Sep
-20
Oct
-20
No
v-2
0
Dec
-20
Jan
-21
Feb
-21
Mar
-21
Ap
r-2
1
May
-21
Jun
-21U
ne
mp
loym
en
t C
laim
ants
Fiscal Year 2020 to 2021
Retail Trade
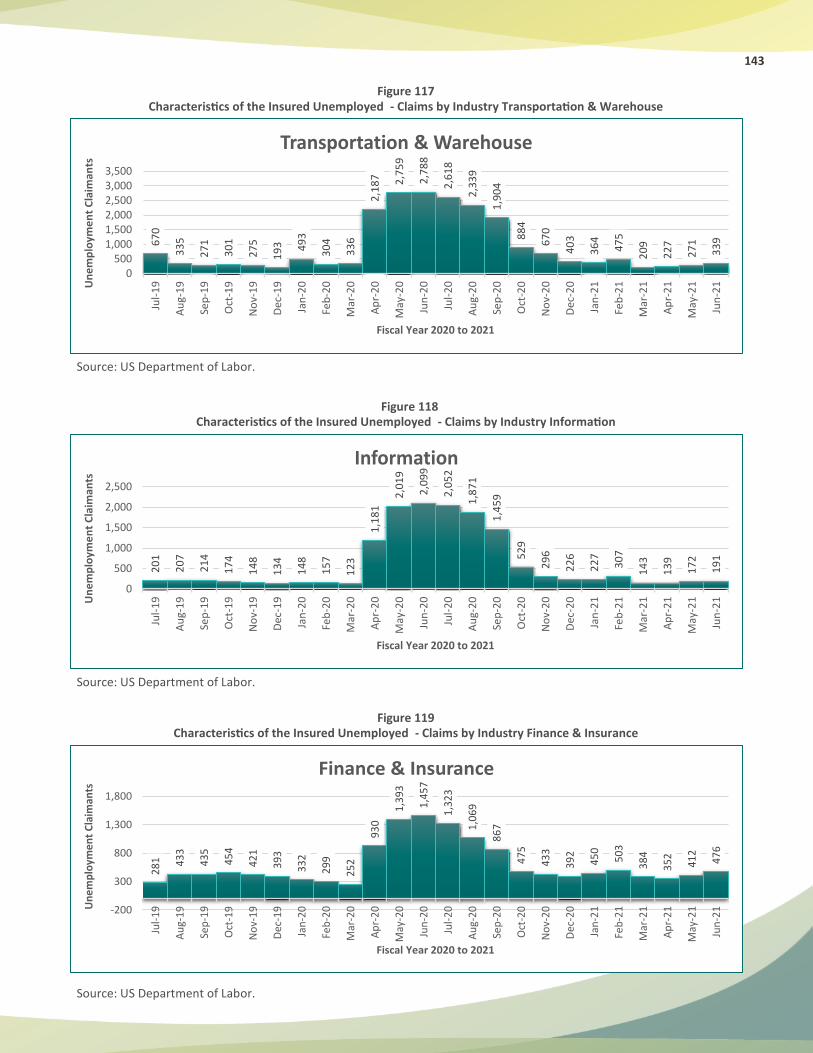
143
Figure 117 Characteristics of the Insured Unemployed - Claims by Industry Transportation & Warehouse
Source: US Department of Labor.
Figure 118 Characteristics of the Insured Unemployed - Claims by Industry Information
Source: US Department of Labor.
Figure 119 Characteristics of the Insured Unemployed - Claims by Industry Finance & Insurance
Source: US Department of Labor.
67
0
33
5
27
1
30
1
27
5
19
3 49
3
30
4
33
6
2,1
87 2,7
59
2,7
88
2,6
18
2,3
39
1,9
04
88
4
67
0
40
3
36
4
47
5
20
9
22
7
27
1
33
9
0500
1,0001,5002,0002,5003,0003,500
Jul-
19
Au
g-1
9
Sep
-19
Oct
-19
No
v-1
9
Dec
-19
Jan
-20
Feb
-20
Mar
-20
Ap
r-2
0
May
-20
Jun
-20
Jul-
20
Au
g-2
0
Sep
-20
Oct
-20
No
v-2
0
Dec
-20
Jan
-21
Feb
-21
Mar
-21
Ap
r-2
1
May
-21
Jun
-21U
ne
mp
loym
en
t C
laim
an
ts
Fiscal Year 2020 to 2021
Transportation & Warehouse2
01
20
7
21
4
17
4
14
8
13
4
14
8
15
7
12
3
1,1
81
2,0
19
2,0
99
2,0
52
1,8
71
1,4
59
52
9
29
6
22
6
22
7
30
7
14
3
13
9
17
2
19
1
0
500
1,000
1,500
2,000
2,500
Jul-
19
Au
g-1
9
Sep
-19
Oct
-19
No
v-1
9
Dec
-19
Jan
-20
Feb
-20
Mar
-20
Ap
r-2
0
May
-20
Jun
-20
Jul-
20
Au
g-2
0
Sep
-20
Oct
-20
No
v-2
0
Dec
-20
Jan
-21
Feb
-21
Mar
-21
Ap
r-2
1
May
-21
Jun
-21U
ne
mp
loym
en
t C
laim
an
ts
Fiscal Year 2020 to 2021
Information
281 43
3
435
454
421
393
332
299
252
930
1,39
3
1,45
7
1,32
3
1,06
9
867
475
433
392
450
503
384
352
412
476
-200
300
800
1,300
1,800
Jul-
19
Au
g-19
Sep
-19
Oct
-19
No
v-19
Dec
-19
Jan
-20
Feb
-20
Mar
-20
Ap
r-20
May
-20
Jun
-20
Jul-
20
Au
g-20
Sep
-20
Oct
-20
No
v-20
Dec
-20
Jan
-21
Feb
-21
Mar
-21
Ap
r-21
May
-21
Jun
-21U
nem
plo
yme
nt
Cla
iman
ts
Fiscal Year 2020 to 2021
Finance & Insurance
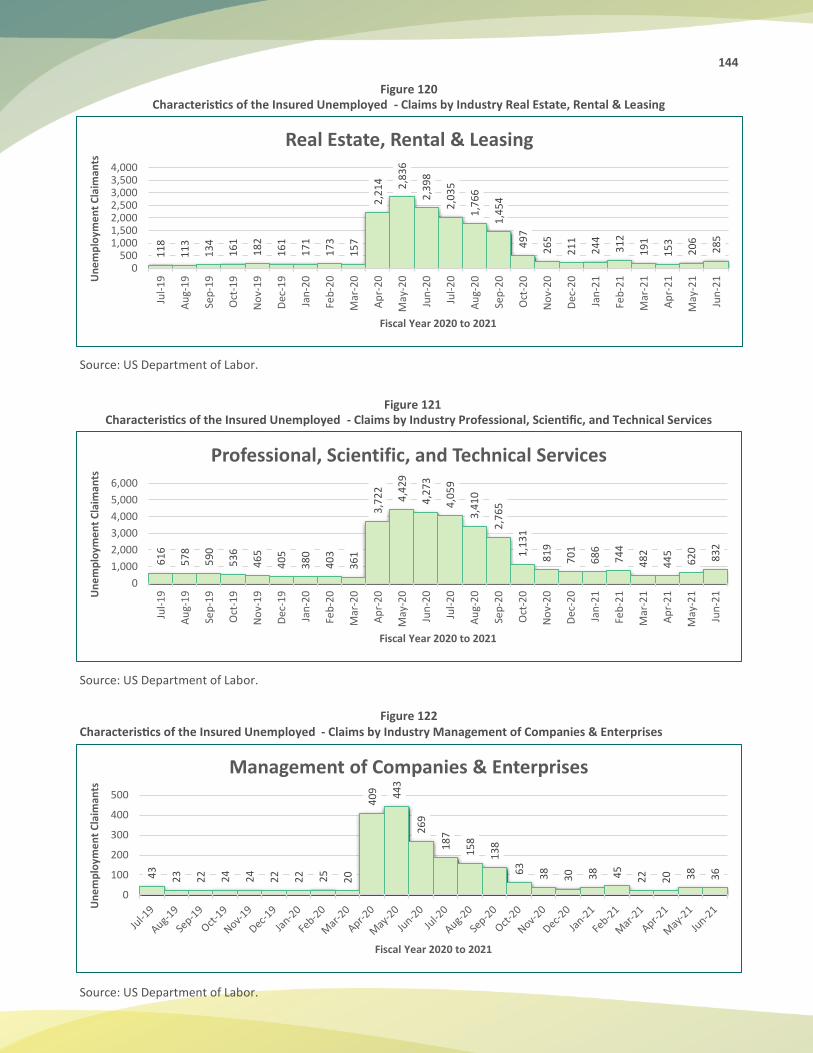
144
Figure 120 Characteristics of the Insured Unemployed - Claims by Industry Real Estate, Rental & Leasing
Source: US Department of Labor.
Figure 121 Characteristics of the Insured Unemployed - Claims by Industry Professional, Scientific, and Technical Services
Source: US Department of Labor.
Figure 122 Characteristics of the Insured Unemployed - Claims by Industry Management of Companies & Enterprises
Source: US Department of Labor.
11
8
11
3
13
4
16
1
18
2
16
1
17
1
17
3
15
7
2,2
14 2,8
36
2,3
98
2,0
35
1,7
66
1,4
54
49
7
26
5
21
1
24
4
31
2
19
1
15
3
20
6
28
5
0500
1,0001,5002,0002,5003,0003,5004,000
Jul-
19
Au
g-1
9
Sep
-19
Oct
-19
No
v-1
9
Dec
-19
Jan
-20
Feb
-20
Mar
-20
Ap
r-2
0
May
-20
Jun
-20
Jul-
20
Au
g-2
0
Sep
-20
Oct
-20
No
v-2
0
Dec
-20
Jan
-21
Feb
-21
Mar
-21
Ap
r-2
1
May
-21
Jun
-21U
ne
mp
loym
en
t C
laim
ants
Fiscal Year 2020 to 2021
Real Estate, Rental & Leasing6
16
57
8
59
0
53
6
46
5
40
5
38
0
40
3
36
1
3,7
22
4,4
29
4,2
73
4,0
59
3,4
10
2,7
65
1,1
31
81
9
70
1
68
6
74
4
48
2
44
5
62
0
83
2
0
1,000
2,000
3,000
4,000
5,000
6,000
Jul-
19
Au
g-1
9
Sep
-19
Oct
-19
No
v-1
9
Dec
-19
Jan
-20
Feb
-20
Mar
-20
Ap
r-2
0
May
-20
Jun
-20
Jul-
20
Au
g-2
0
Sep
-20
Oct
-20
No
v-2
0
Dec
-20
Jan
-21
Feb
-21
Mar
-21
Ap
r-2
1
May
-21
Jun
-21U
ne
mp
loym
en
t C
laim
ants
Fiscal Year 2020 to 2021
Professional, Scientific, and Technical Services
43
23
22 24
24
22
22 25
20
40
9 44
3
26
9
18
7
15
8
13
8
63
38
30 38 45
22
20 38
36
0
100
200
300
400
500
Un
em
plo
yme
nt
Cla
iman
ts
Fiscal Year 2020 to 2021
Management of Companies & Enterprises
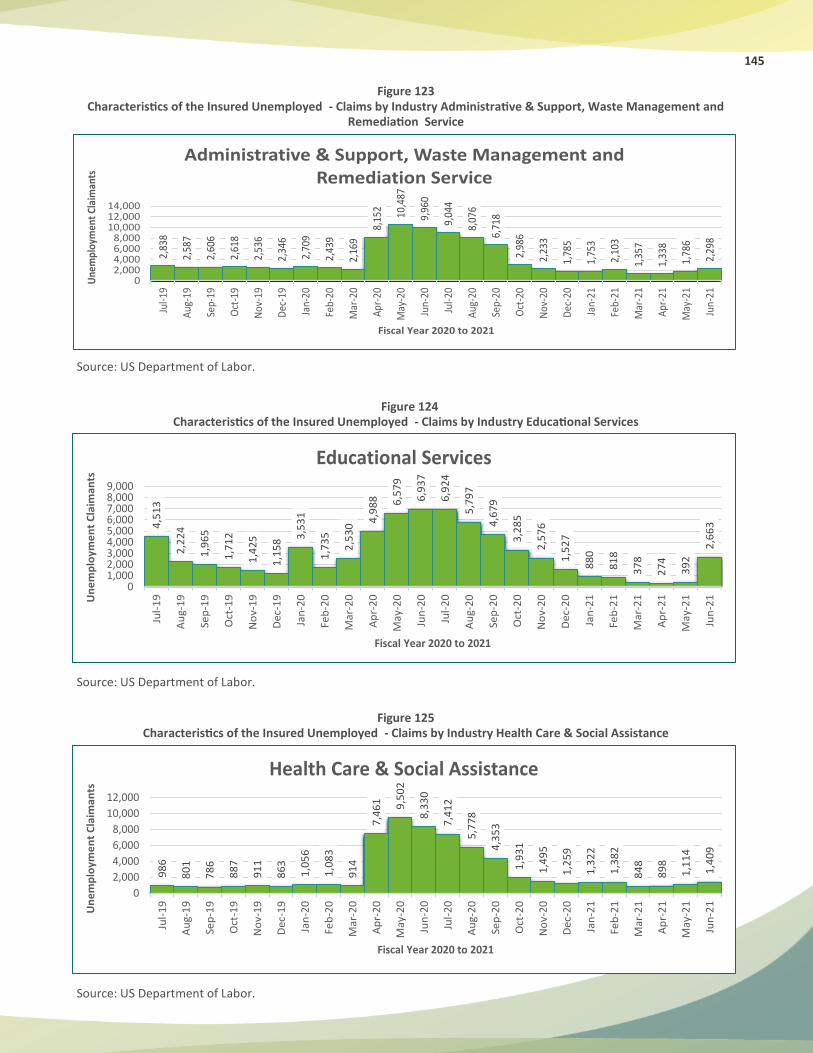
145
Figure 123 Characteristics of the Insured Unemployed - Claims by Industry Administrative & Support, Waste Management and
Remediation Service
Source: US Department of Labor.
Figure 124 Characteristics of the Insured Unemployed - Claims by Industry Educational Services
Source: US Department of Labor.
Figure 125 Characteristics of the Insured Unemployed - Claims by Industry Health Care & Social Assistance
Source: US Department of Labor.
2,83
8
2,58
7
2,60
6
2,61
8
2,53
6
2,34
6
2,70
9
2,43
9
2,16
9
8,15
2
10,4
87
9,96
0
9,04
4
8,07
6
6,71
8
2,98
6
2,23
3
1,78
5
1,75
3
2,10
3
1,35
7
1,33
8
1,78
6
2,29
8
02,0004,0006,0008,000
10,00012,00014,000
Jul-1
9
Aug
-19
Sep-
19
Oct
-19
Nov
-19
Dec
-19
Jan-
20
Feb-
20
Mar
-20
Apr
-20
May
-20
Jun-
20
Jul-2
0
Aug
-20
Sep-
20
Oct
-20
Nov
-20
Dec
-20
Jan-
21
Feb-
21
Mar
-21
Apr
-21
May
-21
Jun-
21
Une
mpl
oym
ent
Clai
man
ts
Fiscal Year 2020 to 2021
Administrative & Support, Waste Management and Remediation Service
4,5
13
2,2
24
1,9
65
1,7
12
1,4
25
1,1
58 3
,53
1
1,7
35
2,5
30
4,9
88 6,5
79
6,9
37
6,9
24
5,7
97
4,6
79
3,2
85
2,5
76
1,5
27
88
0
81
8
37
8
27
4
39
2
2,6
63
01,0002,0003,0004,0005,0006,0007,0008,0009,000
Jul-
19
Au
g-1
9
Sep
-19
Oct
-19
No
v-1
9
De
c-1
9
Jan
-20
Feb
-20
Mar
-20
Ap
r-2
0
May
-20
Jun
-20
Jul-
20
Au
g-2
0
Sep
-20
Oct
-20
No
v-2
0
De
c-2
0
Jan
-21
Feb
-21
Mar
-21
Ap
r-2
1
May
-21
Jun
-21U
ne
mp
loym
en
t C
laim
an
ts
Fiscal Year 2020 to 2021
Educational Services
98
6
80
1
78
6
88
7
91
1
86
3
1,0
56
1,0
83
91
4
7,4
61 9,5
02
8,3
30
7,4
12
5,7
78
4,3
53
1,9
31
1,4
95
1,2
59
1,3
22
1,3
82
84
8
89
8
1,1
14
1,4
09
0
2,000
4,000
6,000
8,000
10,000
12,000
Jul-
19
Au
g-1
9
Sep
-19
Oct
-19
No
v-1
9
De
c-1
9
Jan
-20
Feb
-20
Mar
-20
Ap
r-2
0
May
-20
Jun
-20
Jul-
20
Au
g-2
0
Sep
-20
Oct
-20
No
v-2
0
De
c-2
0
Jan
-21
Feb
-21
Mar
-21
Ap
r-2
1
May
-21
Jun
-21
Un
em
plo
yme
nt
Cla
ima
nts
Fiscal Year 2020 to 2021
Health Care & Social Assistance
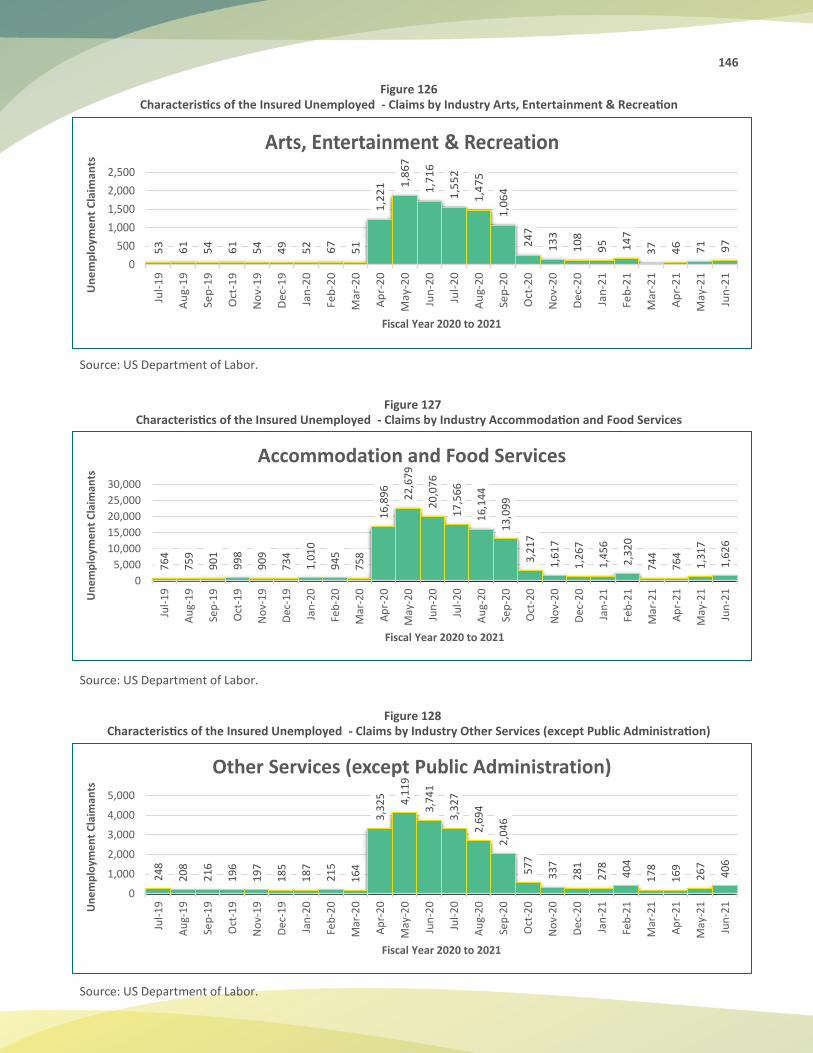
146
Figure 126 Characteristics of the Insured Unemployed - Claims by Industry Arts, Entertainment & Recreation
Source: US Department of Labor.
Figure 127 Characteristics of the Insured Unemployed - Claims by Industry Accommodation and Food Services
Source: US Department of Labor.
Figure 128 Characteristics of the Insured Unemployed - Claims by Industry Other Services (except Public Administration)
Source: US Department of Labor.
53
61
54
61
54
49
52 67
51
1,2
21 1
,86
7
1,7
16
1,5
52
1,4
75
1,0
64
24
7
13
3
10
8
95 14
7
37
46 71 97
0
500
1,000
1,500
2,000
2,500Ju
l-1
9
Au
g-1
9
Sep
-19
Oct
-19
No
v-1
9
De
c-1
9
Jan
-20
Feb
-20
Ma
r-2
0
Ap
r-2
0
Ma
y-2
0
Jun
-20
Jul-
20
Au
g-2
0
Sep
-20
Oct
-20
No
v-2
0
De
c-2
0
Jan
-21
Feb
-21
Ma
r-2
1
Ap
r-2
1
Ma
y-2
1
Jun
-21
Un
em
plo
ym
en
t C
laim
an
ts
Fiscal Year 2020 to 2021
Arts, Entertainment & Recreation7
64
75
9
90
1
99
8
90
9
73
4
1,0
10
94
5
75
8
16
,89
6
22
,67
9
20
,07
6
17
,56
6
16
,14
4
13
,09
9
3,2
17
1,6
17
1,2
67
1,4
56
2,3
20
74
4
76
4
1,3
17
1,6
26
0
5,000
10,000
15,000
20,000
25,000
30,000
Jul-
19
Au
g-1
9
Sep
-19
Oct
-19
No
v-1
9
Dec
-19
Jan
-20
Feb
-20
Mar
-20
Ap
r-2
0
May
-20
Jun
-20
Jul-
20
Au
g-2
0
Sep
-20
Oct
-20
No
v-2
0
Dec
-20
Jan
-21
Feb
-21
Mar
-21
Ap
r-2
1
May
-21
Jun
-21Un
em
plo
yme
nt
Cla
iman
ts
Fiscal Year 2020 to 2021
Accommodation and Food Services
24
8
20
8
21
6
19
6
19
7
18
5
18
7
21
5
16
4
3,3
25 4,1
19
3,7
41
3,3
27
2,6
94
2,0
46
57
7
33
7
28
1
27
8
40
4
17
8
16
9
26
7
40
6
0
1,000
2,000
3,000
4,000
5,000
Jul-
19
Au
g-1
9
Sep
-19
Oct
-19
No
v-1
9
Dec
-19
Jan
-20
Feb
-20
Mar
-20
Ap
r-2
0
May
-20
Jun
-20
Jul-
20
Au
g-2
0
Sep
-20
Oct
-20
No
v-2
0
Dec
-20
Jan
-21
Feb
-21
Mar
-21
Ap
r-2
1
May
-21
Jun
-21Un
em
plo
yme
nt
Cla
iman
ts
Fiscal Year 2020 to 2021
Other Services (except Public Administration)
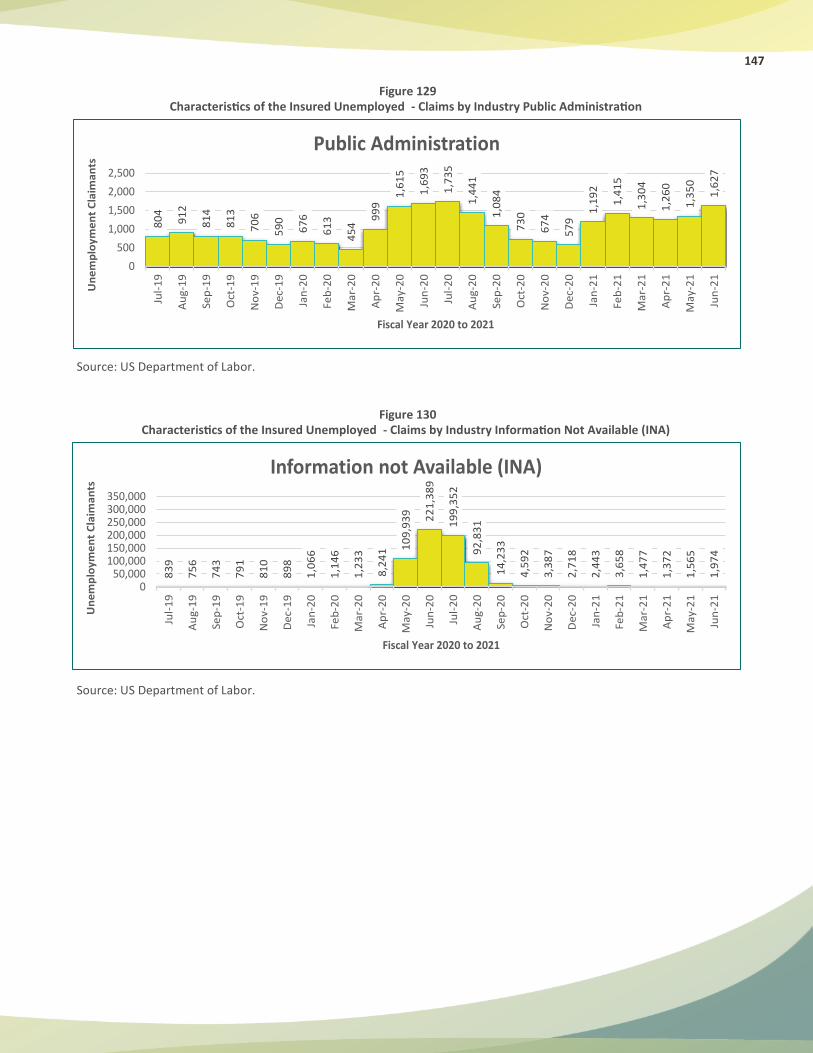
147
Figure 129 Characteristics of the Insured Unemployed - Claims by Industry Public Administration
Source: US Department of Labor.
Figure 130 Characteristics of the Insured Unemployed - Claims by Industry Information Not Available (INA)
Source: US Department of Labor.
80
4
91
2
81
4
81
3
70
6
59
0
67
6
61
3
45
4
99
9
1,6
15
1,6
93
1,7
35
1,4
41
1,0
84
73
0
67
4
57
9
1,1
92
1,4
15
1,3
04
1,2
60
1,3
50
1,6
27
0
500
1,000
1,500
2,000
2,500Ju
l-1
9
Au
g-1
9
Sep
-19
Oct
-19
No
v-1
9
De
c-1
9
Jan
-20
Feb
-20
Ma
r-2
0
Ap
r-2
0
Ma
y-2
0
Jun
-20
Jul-
20
Au
g-2
0
Sep
-20
Oct
-20
No
v-2
0
De
c-2
0
Jan
-21
Feb
-21
Ma
r-2
1
Ap
r-2
1
Ma
y-2
1
Jun
-21
Un
em
plo
ym
en
t C
laim
an
ts
Fiscal Year 2020 to 2021
Public Administration8
39
75
6
74
3
79
1
81
0
89
8
1,0
66
1,1
46
1,2
33
8,2
41 1
09
,93
9 22
1,3
89
19
9,3
52
92
,83
1
14
,23
3
4,5
92
3,3
87
2,7
18
2,4
43
3,6
58
1,4
77
1,3
72
1,5
65
1,9
74
050,000
100,000150,000200,000250,000300,000350,000
Jul-
19
Au
g-1
9
Sep
-19
Oct
-19
No
v-1
9
De
c-1
9
Jan
-20
Feb
-20
Ma
r-2
0
Ap
r-2
0
Ma
y-2
0
Jun
-20
Jul-
20
Au
g-2
0
Sep
-20
Oct
-20
No
v-2
0
De
c-2
0
Jan
-21
Feb
-21
Ma
r-2
1
Ap
r-2
1
Ma
y-2
1
Jun
-21
Un
em
plo
ym
en
t C
laim
an
ts
Fiscal Year 2020 to 2021
Information not Available (INA)
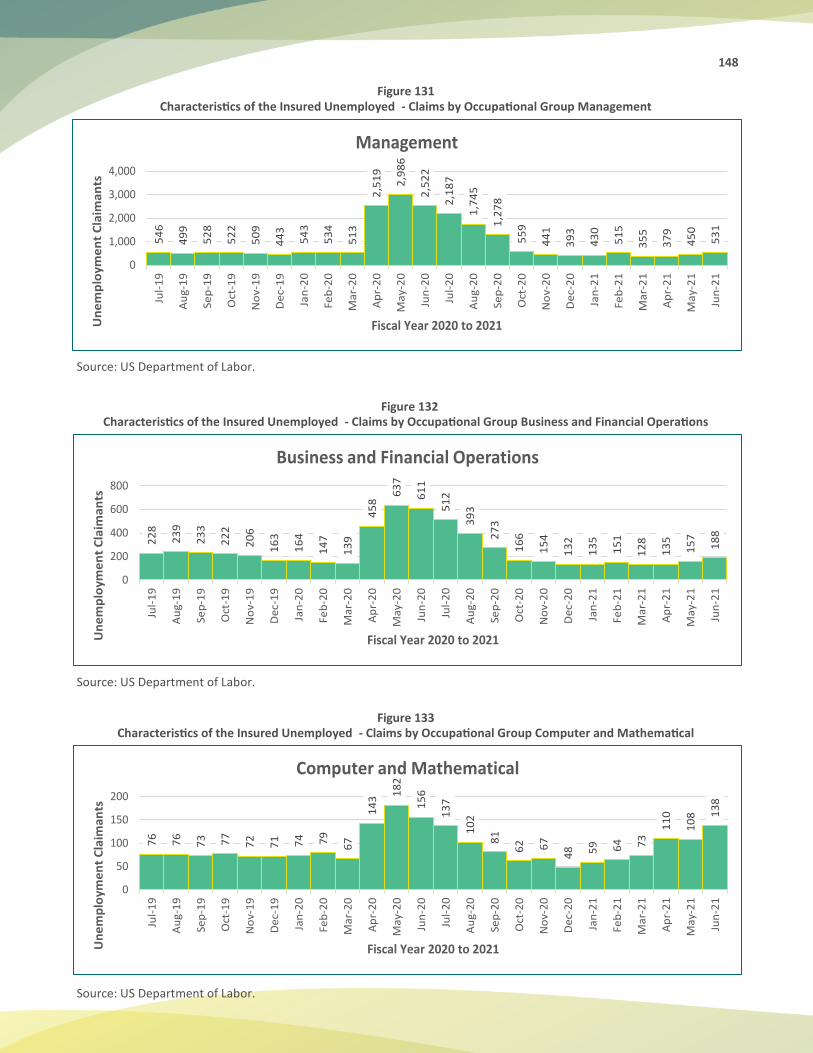
148
Figure 131 Characteristics of the Insured Unemployed - Claims by Occupational Group Management
Source: US Department of Labor.
Figure 132 Characteristics of the Insured Unemployed - Claims by Occupational Group Business and Financial Operations
Source: US Department of Labor.
Figure 133 Characteristics of the Insured Unemployed - Claims by Occupational Group Computer and Mathematical
Source: US Department of Labor.
54
6
49
9
52
8
52
2
50
9
44
3
54
3
53
4
51
3
2,5
19
2,9
86
2,5
22
2,1
87
1,7
45
1,2
78
55
9
44
1
39
3
43
0
51
5
35
5
37
9
45
0
53
1
0
1,000
2,000
3,000
4,000Ju
l-1
9
Au
g-1
9
Sep
-19
Oct
-19
No
v-1
9
De
c-1
9
Jan
-20
Feb
-20
Ma
r-2
0
Ap
r-2
0
Ma
y-2
0
Jun
-20
Jul-
20
Au
g-2
0
Sep
-20
Oct
-20
No
v-2
0
De
c-2
0
Jan
-21
Feb
-21
Ma
r-2
1
Ap
r-2
1
Ma
y-2
1
Jun
-21
Un
em
plo
ym
en
t C
laim
an
ts
Fiscal Year 2020 to 2021
Management2
28
23
9
23
3
22
2
20
6
16
3
16
4
14
7
13
9
45
8
63
7
61
1
51
2
39
3
27
3
16
6
15
4
13
2
13
5
15
1
12
8
13
5
15
7
18
8
0
200
400
600
800
Jul-
19
Au
g-1
9
Sep
-19
Oct
-19
No
v-1
9
De
c-1
9
Jan
-20
Feb
-20
Ma
r-2
0
Ap
r-2
0
Ma
y-2
0
Jun
-20
Jul-
20
Au
g-2
0
Sep
-20
Oct
-20
No
v-2
0
De
c-2
0
Jan
-21
Feb
-21
Ma
r-2
1
Ap
r-2
1
Ma
y-2
1
Jun
-21
Un
em
plo
yme
nt
Cla
ima
nts
Fiscal Year 2020 to 2021
Business and Financial Operations
76
76
73 77
72
71 74 79
67
14
3 18
2
15
6
13
7
10
2
81
62 67
48 59 64 73
11
0
10
8 13
8
0
50
100
150
200
Jul-
19
Au
g-1
9
Sep
-19
Oct
-19
No
v-1
9
De
c-1
9
Jan
-20
Feb
-20
Mar
-20
Ap
r-2
0
May
-20
Jun
-20
Jul-
20
Au
g-2
0
Sep
-20
Oct
-20
No
v-2
0
De
c-2
0
Jan
-21
Feb
-21
Mar
-21
Ap
r-2
1
May
-21
Jun
-21
Un
em
plo
yme
nt
Cla
ima
nts
Fiscal Year 2020 to 2021
Computer and Mathematical
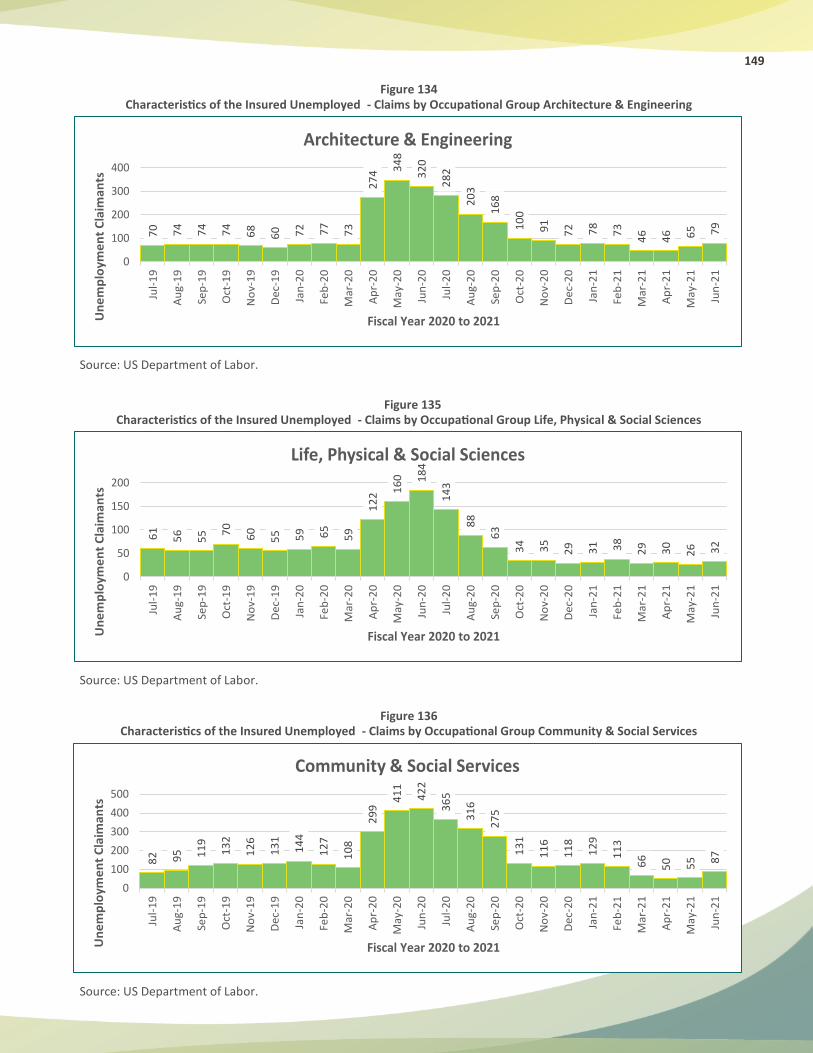
149
Figure 134 Characteristics of the Insured Unemployed - Claims by Occupational Group Architecture & Engineering
Source: US Department of Labor.
Figure 135 Characteristics of the Insured Unemployed - Claims by Occupational Group Life, Physical & Social Sciences
Source: US Department of Labor.
Figure 136 Characteristics of the Insured Unemployed - Claims by Occupational Group Community & Social Services
Source: US Department of Labor.
70 74
74
74
68
60 72 77
73
27
4 34
8
32
0
28
2
20
3
16
8
10
0
91
72 78
73
46
46 65 79
0
100
200
300
400Ju
l-1
9
Au
g-1
9
Sep
-19
Oct
-19
No
v-1
9
De
c-1
9
Jan
-20
Feb
-20
Mar
-20
Ap
r-2
0
May
-20
Jun
-20
Jul-
20
Au
g-2
0
Sep
-20
Oct
-20
No
v-2
0
De
c-2
0
Jan
-21
Feb
-21
Mar
-21
Ap
r-2
1
May
-21
Jun
-21
Un
em
plo
yme
nt
Cla
ima
nts
Fiscal Year 2020 to 2021
Architecture & Engineering6
1
56
55 7
0
60
55 59 65
59
12
2 16
0 18
4
14
3
88
63
34 35
29 31 38
29 30
26 32
0
50
100
150
200
Jul-
19
Au
g-1
9
Sep
-19
Oct
-19
No
v-1
9
De
c-1
9
Jan
-20
Feb
-20
Mar
-20
Ap
r-2
0
May
-20
Jun
-20
Jul-
20
Au
g-2
0
Sep
-20
Oct
-20
No
v-2
0
De
c-2
0
Jan
-21
Feb
-21
Mar
-21
Ap
r-2
1
May
-21
Jun
-21
Un
em
plo
yme
nt
Cla
ima
nts
Fiscal Year 2020 to 2021
Life, Physical & Social Sciences
82 95 11
9
13
2
12
6
13
1
14
4
12
7
10
8
29
9
41
1
42
2
36
5
31
6
27
5
13
1
11
6
11
8
12
9
11
3
66
50 55 8
7
0
100
200
300
400
500
Jul-
19
Au
g-1
9
Sep
-19
Oct
-19
No
v-1
9
De
c-1
9
Jan
-20
Feb
-20
Mar
-20
Ap
r-2
0
May
-20
Jun
-20
Jul-
20
Au
g-2
0
Sep
-20
Oct
-20
No
v-2
0
De
c-2
0
Jan
-21
Feb
-21
Mar
-21
Ap
r-2
1
May
-21
Jun
-21
Un
em
plo
yme
nt
Cla
ima
nts
Fiscal Year 2020 to 2021
Community & Social Services
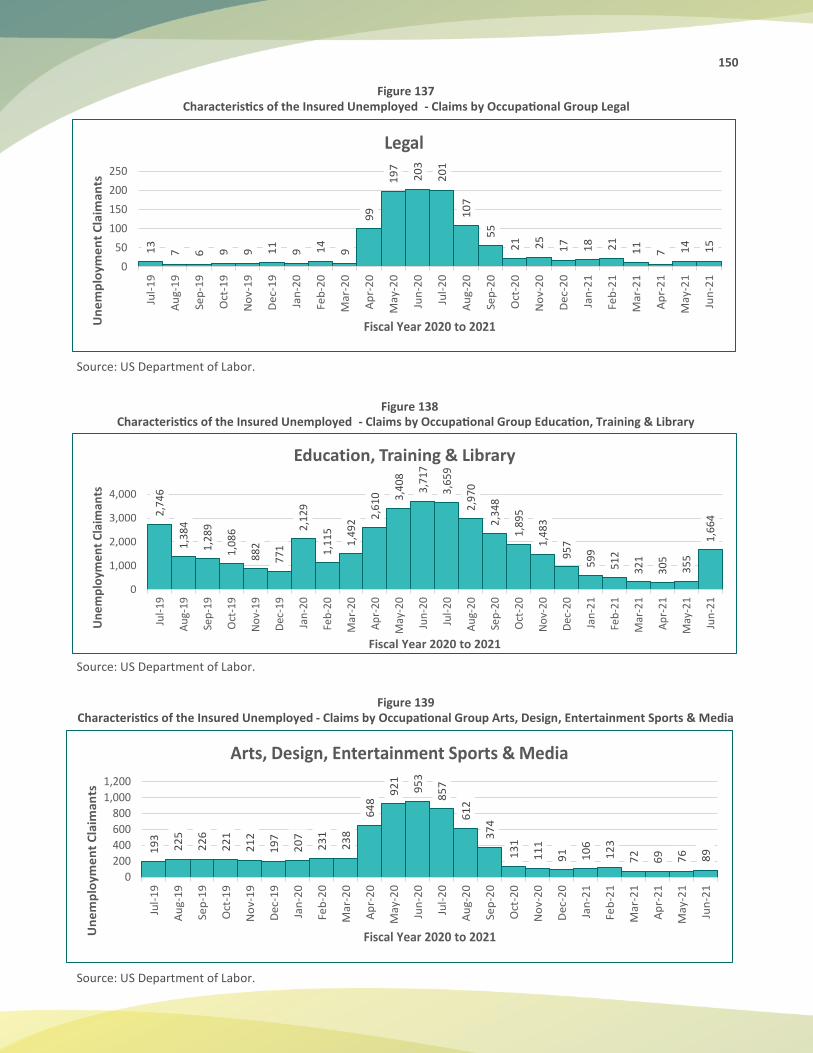
150
Figure 137 Characteristics of the Insured Unemployed - Claims by Occupational Group Legal
Source: US Department of Labor.
Figure 138 Characteristics of the Insured Unemployed - Claims by Occupational Group Education, Training & Library
Source: US Department of Labor.
Figure 139 Characteristics of the Insured Unemployed - Claims by Occupational Group Arts, Design, Entertainment Sports & Media
Source: US Department of Labor.
13
7 6 9 9 11
9 14
9
99
19
7
20
3
20
1
10
7
55
21 25
17 18 21
11
7 14 15
0
50
100
150
200
250
Jul-
19
Au
g-1
9
Sep
-19
Oct
-19
No
v-1
9
De
c-1
9
Jan
-20
Feb
-20
Ma
r-2
0
Ap
r-2
0
Ma
y-2
0
Jun
-20
Jul-
20
Au
g-2
0
Sep
-20
Oct
-20
No
v-2
0
De
c-2
0
Jan
-21
Feb
-21
Ma
r-2
1
Ap
r-2
1
Ma
y-2
1
Jun
-21
Un
em
plo
yme
nt
Cla
ima
nts
Fiscal Year 2020 to 2021
Legal2
,74
6
1,3
84
1,2
89
1,0
86
88
2
77
1
2,1
29
1,1
15
1,4
92 2
,61
0 3,4
08
3,7
17
3,6
59
2,9
70
2,3
48
1,8
95
1,4
83
95
7
59
9
51
2
32
1
30
5
35
5
1,6
64
0
1,000
2,000
3,000
4,000
Jul-
19
Au
g-1
9
Sep
-19
Oct
-19
No
v-1
9
Dec
-19
Jan
-20
Feb
-20
Mar
-20
Ap
r-2
0
May
-20
Jun
-20
Jul-
20
Au
g-2
0
Sep
-20
Oct
-20
No
v-2
0
Dec
-20
Jan
-21
Feb
-21
Mar
-21
Ap
r-2
1
May
-21
Jun
-21
Un
em
plo
yme
nt
Cla
iman
ts
Fiscal Year 2020 to 2021
Education, Training & Library
19
3
22
5
22
6
22
1
21
2
19
7
20
7
23
1
23
8
64
8
92
1
95
3
85
7
61
2
37
4
13
1
11
1
91 10
6
12
3
72
69 76 89
0
200
400
600
800
1,000
1,200
Jul-
19
Au
g-1
9
Sep
-19
Oct
-19
No
v-1
9
De
c-1
9
Jan
-20
Feb
-20
Ma
r-2
0
Ap
r-2
0
May
-20
Jun
-20
Jul-
20
Au
g-2
0
Sep
-20
Oct
-20
No
v-2
0
De
c-2
0
Jan
-21
Feb
-21
Ma
r-2
1
Ap
r-2
1
Ma
y-2
1
Jun
-21
Un
em
plo
yme
nt
Cla
ima
nts
Fiscal Year 2020 to 2021
Arts, Design, Entertainment Sports & Media
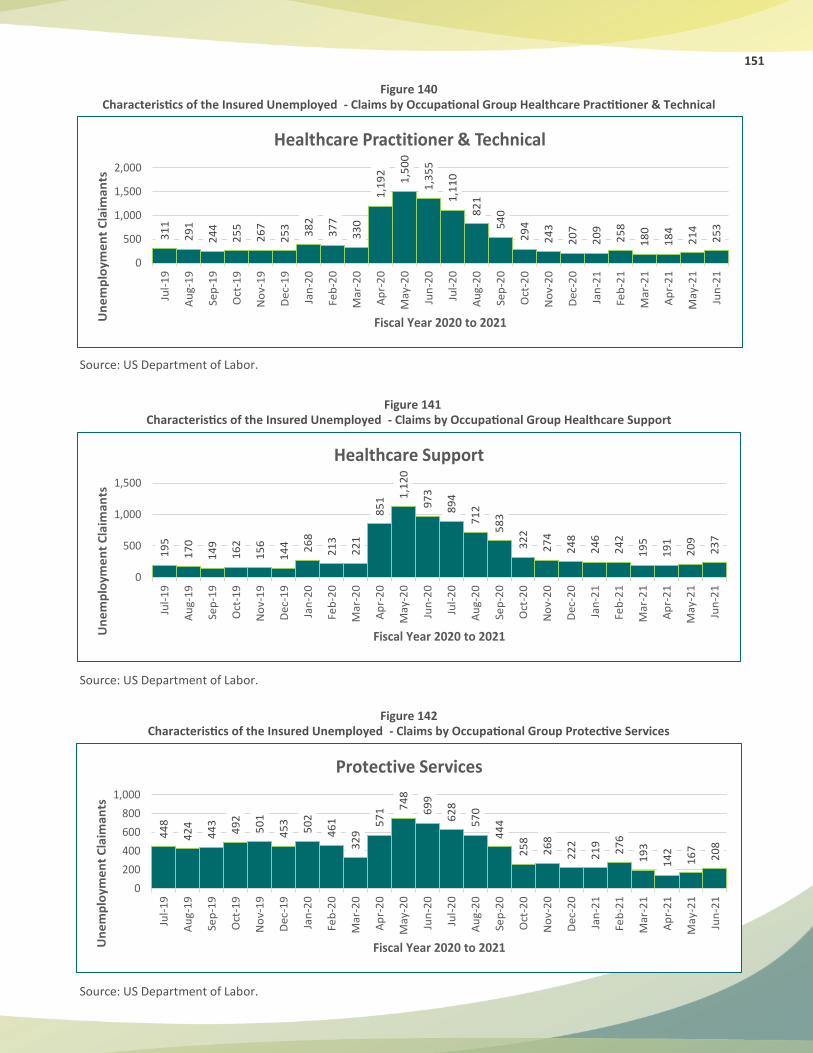
151
Figure 140 Characteristics of the Insured Unemployed - Claims by Occupational Group Healthcare Practitioner & Technical
Source: US Department of Labor.
Figure 141 Characteristics of the Insured Unemployed - Claims by Occupational Group Healthcare Support
Source: US Department of Labor.
Figure 142 Characteristics of the Insured Unemployed - Claims by Occupational Group Protective Services
Source: US Department of Labor.
31
1
29
1
24
4
25
5
26
7
25
3
38
2
37
7
33
0
1,1
92
1,5
00
1,3
55
1,1
10
82
1
54
0
29
4
24
3
20
7
20
9
25
8
18
0
18
4
21
4
25
3
0
500
1,000
1,500
2,000Ju
l-1
9
Au
g-1
9
Sep
-19
Oct
-19
No
v-1
9
De
c-1
9
Jan
-20
Feb
-20
Ma
r-2
0
Ap
r-2
0
May
-20
Jun
-20
Jul-
20
Au
g-2
0
Sep
-20
Oct
-20
No
v-2
0
De
c-2
0
Jan
-21
Feb
-21
Ma
r-2
1
Ap
r-2
1
Ma
y-2
1
Jun
-21
Un
em
plo
yme
nt
Cla
ima
nts
Fiscal Year 2020 to 2021
Healthcare Practitioner & Technical1
95
17
0
14
9
16
2
15
6
14
4 26
8
21
3
22
1
85
1 1,1
20
97
3
89
4
71
2
58
3
32
2
27
4
24
8
24
6
24
2
19
5
19
1
20
9
23
7
0
500
1,000
1,500
Jul-
19
Au
g-1
9
Sep
-19
Oct
-19
No
v-1
9
De
c-1
9
Jan
-20
Feb
-20
Mar
-20
Ap
r-2
0
May
-20
Jun
-20
Jul-
20
Au
g-2
0
Sep
-20
Oct
-20
No
v-2
0
De
c-2
0
Jan
-21
Feb
-21
Mar
-21
Ap
r-2
1
May
-21
Jun
-21
Un
em
plo
yme
nt
Cla
ima
nts
Fiscal Year 2020 to 2021
Healthcare Support
44
8
42
4
44
3
49
2
50
1
45
3
50
2
46
1
32
9
57
1 74
8
69
9
62
8
57
0
44
4
25
8
26
8
22
2
21
9
27
6
19
3
14
2
16
7
20
8
0
200
400
600
800
1,000
Jul-
19
Au
g-1
9
Sep
-19
Oct
-19
No
v-1
9
De
c-1
9
Jan
-20
Feb
-20
Mar
-20
Ap
r-2
0
May
-20
Jun
-20
Jul-
20
Au
g-2
0
Sep
-20
Oct
-20
No
v-2
0
De
c-2
0
Jan
-21
Feb
-21
Mar
-21
Ap
r-2
1
May
-21
Jun
-21
Un
em
plo
yme
nt
Cla
ima
nts
Fiscal Year 2020 to 2021
Protective Services
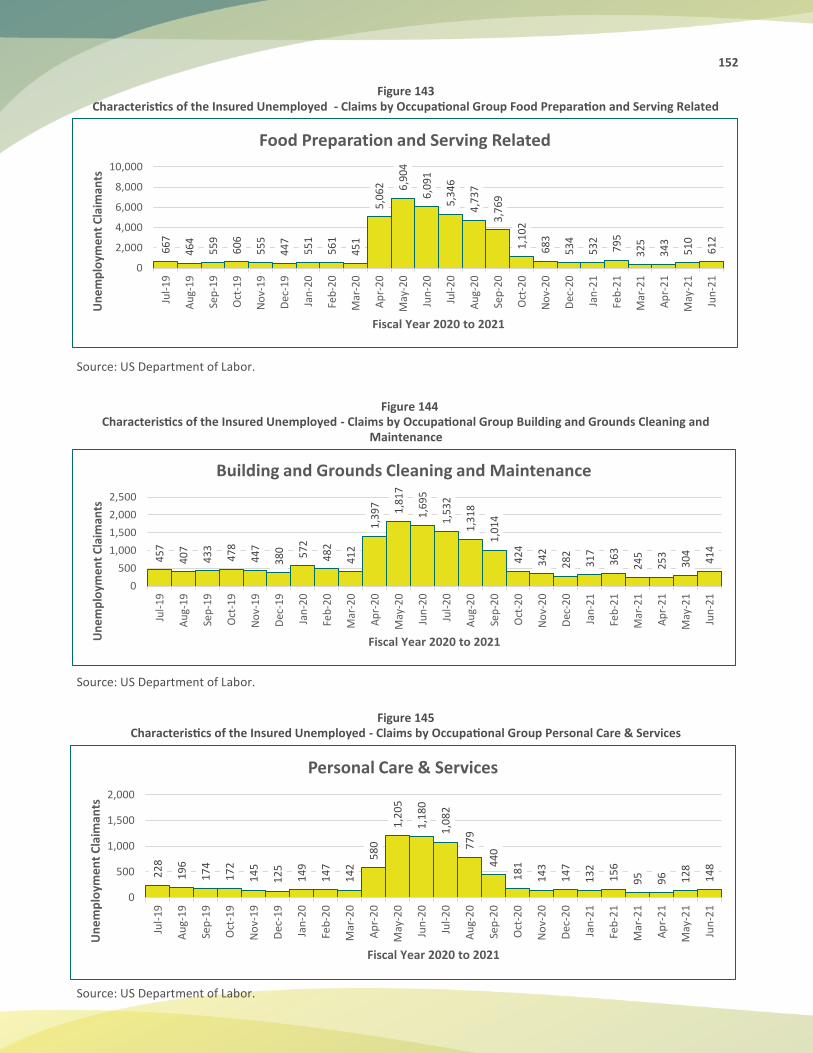
152
Figure 143 Characteristics of the Insured Unemployed - Claims by Occupational Group Food Preparation and Serving Related
Source: US Department of Labor.
Figure 144 Characteristics of the Insured Unemployed - Claims by Occupational Group Building and Grounds Cleaning and
Maintenance
Source: US Department of Labor.
Figure 145 Characteristics of the Insured Unemployed - Claims by Occupational Group Personal Care & Services
Source: US Department of Labor.
667
464
559
606
555
447
551
561
451
5,06
2 6,90
4
6,09
1
5,34
6
4,73
7
3,76
9
1,10
2
683
534
532
795
325
343
510
612
0
2,000
4,000
6,000
8,000
10,000Ju
l-19
Au
g-19
Sep
-19
Oct
-19
No
v-19
Dec
-19
Jan
-20
Feb
-20
Mar
-20
Ap
r-20
May
-20
Jun
-20
Jul-
20
Au
g-20
Sep
-20
Oct
-20
No
v-20
Dec
-20
Jan
-21
Feb
-21
Mar
-21
Ap
r-21
May
-21
Jun
-21
Un
emp
loym
ent
Cla
iman
ts
Fiscal Year 2020 to 2021
Food Preparation and Serving Related45
7
407
433
478
447
380 57
2
482
412
1,39
7 1,81
7
1,69
5
1,53
2
1,31
8
1,01
4
424
342
282
317
363
245
253
304
414
0
500
1,000
1,500
2,000
2,500
Jul-
19
Au
g-19
Sep
-19
Oct
-19
No
v-19
Dec
-19
Jan
-20
Feb
-20
Mar
-20
Ap
r-20
May
-20
Jun
-20
Jul-
20
Au
g-20
Sep
-20
Oct
-20
No
v-20
Dec
-20
Jan
-21
Feb
-21
Mar
-21
Ap
r-21
May
-21
Jun
-21
Un
emp
loym
ent
Cla
iman
ts
Fiscal Year 2020 to 2021
Building and Grounds Cleaning and Maintenance
22
8
19
6
17
4
17
2
14
5
12
5
14
9
14
7
14
2
58
0
1,2
05
1,1
80
1,0
82
77
9
44
0
18
1
14
3
14
7
13
2
15
6
95
96 12
8
14
8
0
500
1,000
1,500
2,000
Jul-
19
Au
g-1
9
Sep
-19
Oct
-19
No
v-1
9
Dec
-19
Jan
-20
Feb
-20
Mar
-20
Ap
r-2
0
May
-20
Jun
-20
Jul-
20
Au
g-2
0
Sep
-20
Oct
-20
No
v-2
0
Dec
-20
Jan
-21
Feb
-21
Mar
-21
Ap
r-2
1
May
-21
Jun
-21
Un
em
plo
yme
nt
Cla
iman
ts
Fiscal Year 2020 to 2021
Personal Care & Services
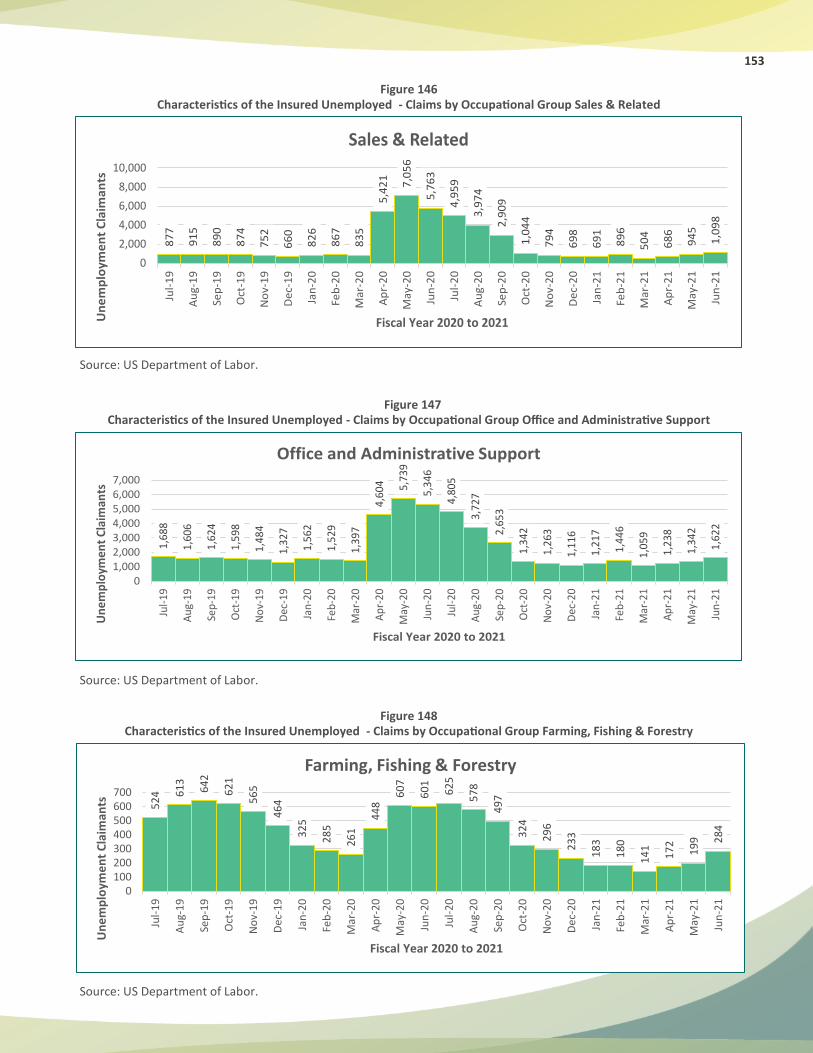
153
Figure 146 Characteristics of the Insured Unemployed - Claims by Occupational Group Sales & Related
Source: US Department of Labor.
Figure 147 Characteristics of the Insured Unemployed - Claims by Occupational Group Office and Administrative Support
Source: US Department of Labor.
Figure 148 Characteristics of the Insured Unemployed - Claims by Occupational Group Farming, Fishing & Forestry
Source: US Department of Labor.
87
7
91
5
89
0
87
4
75
2
66
0
82
6
86
7
83
5
5,4
21
7,0
56
5,7
63
4,9
59
3,9
74
2,9
09
1,0
44
79
4
69
8
69
1
89
6
50
4
68
6
94
5
1,0
98
0
2,000
4,000
6,000
8,000
10,000Ju
l-1
9
Au
g-1
9
Sep
-19
Oct
-19
No
v-1
9
De
c-1
9
Jan
-20
Feb
-20
Mar
-20
Ap
r-2
0
May
-20
Jun
-20
Jul-
20
Au
g-2
0
Sep
-20
Oct
-20
No
v-2
0
De
c-2
0
Jan
-21
Feb
-21
Mar
-21
Ap
r-2
1
May
-21
Jun
-21
Un
em
plo
yme
nt
Cla
ima
nts
Fiscal Year 2020 to 2021
Sales & Related1,
688
1,60
6
1,62
4
1,59
8
1,48
4
1,32
7
1,56
2
1,52
9
1,39
7
4,60
4 5,73
9
5,34
6
4,80
5
3,72
7
2,65
3
1,34
2
1,26
3
1,11
6
1,21
7
1,44
6
1,05
9
1,23
8
1,34
2
1,62
2
01,0002,0003,0004,0005,0006,0007,000
Jul-
19
Au
g-19
Sep
-19
Oct
-19
No
v-19
Dec
-19
Jan
-20
Feb
-20
Mar
-20
Ap
r-20
May
-20
Jun
-20
Jul-
20
Au
g-20
Sep
-20
Oct
-20
No
v-20
Dec
-20
Jan
-21
Feb
-21
Mar
-21
Ap
r-21
May
-21
Jun
-21
Un
emp
loym
ent
Cla
iman
ts
Fiscal Year 2020 to 2021
Office and Administrative Support
52
4 61
3
64
2
62
1
56
5
46
4
32
5
28
5
26
1
44
8
60
7
60
1
62
5
57
8
49
7
32
4
29
6
23
3
18
3
18
0
14
1
17
2
19
9 28
4
0100200300400500600700
Jul-
19
Au
g-1
9
Sep
-19
Oct
-19
No
v-1
9
Dec
-19
Jan
-20
Feb
-20
Mar
-20
Ap
r-2
0
May
-20
Jun
-20
Jul-
20
Au
g-2
0
Sep
-20
Oct
-20
No
v-2
0
Dec
-20
Jan
-21
Feb
-21
Mar
-21
Ap
r-2
1
May
-21
Jun
-21
Un
em
plo
yme
nt
Cla
iman
ts
Fiscal Year 2020 to 2021
Farming, Fishing & Forestry
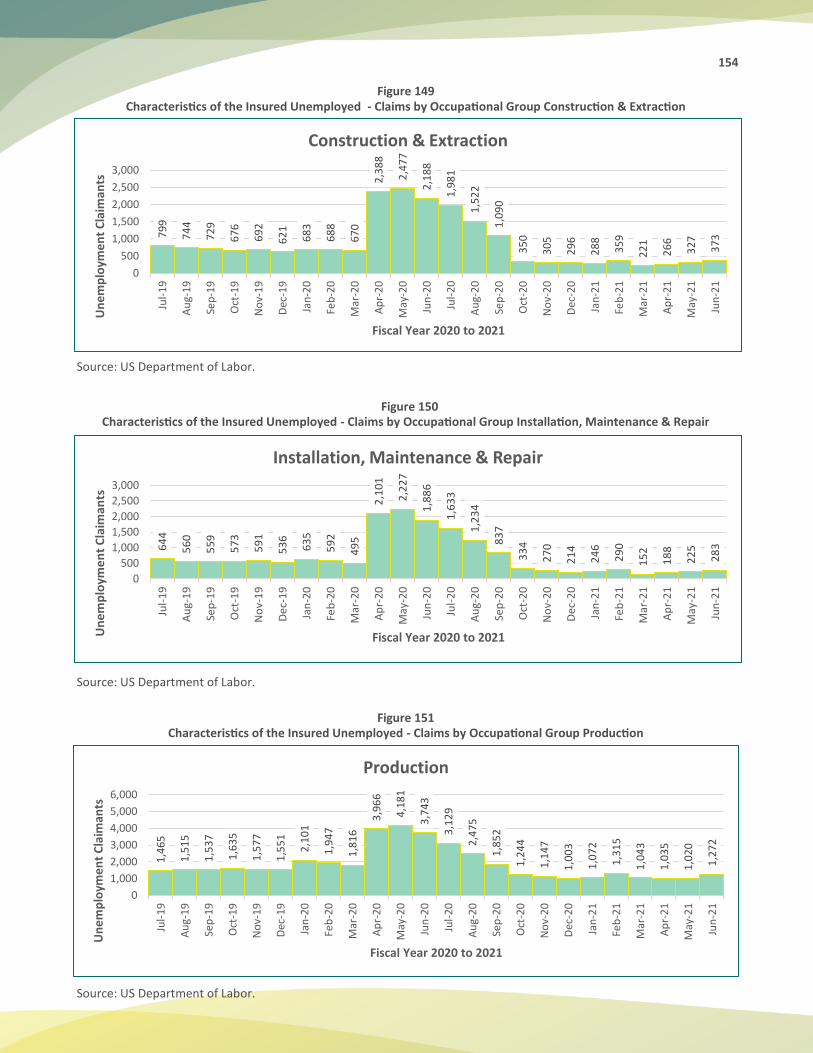
154
Figure 149 Characteristics of the Insured Unemployed - Claims by Occupational Group Construction & Extraction
Source: US Department of Labor.
Figure 150 Characteristics of the Insured Unemployed - Claims by Occupational Group Installation, Maintenance & Repair
Source: US Department of Labor.
Figure 151 Characteristics of the Insured Unemployed - Claims by Occupational Group Production
Source: US Department of Labor.
79
9
74
4
72
9
67
6
69
2
62
1
68
3
68
8
67
0
2,3
88
2,4
77
2,1
88
1,9
81
1,5
22
1,0
90
35
0
30
5
29
6
28
8
35
9
22
1
26
6
32
7
37
3
0
500
1,000
1,500
2,000
2,500
3,000Ju
l-1
9
Au
g-1
9
Sep
-19
Oct
-19
No
v-1
9
Dec
-19
Jan
-20
Feb
-20
Mar
-20
Ap
r-2
0
May
-20
Jun
-20
Jul-
20
Au
g-2
0
Sep
-20
Oct
-20
No
v-2
0
Dec
-20
Jan
-21
Feb
-21
Mar
-21
Ap
r-2
1
May
-21
Jun
-21
Un
em
plo
yme
nt
Cla
iman
ts
Fiscal Year 2020 to 2021
Construction & Extraction6
44
56
0
55
9
57
3
59
1
53
6
63
5
59
2
49
5
2,1
01
2,2
27
1,8
86
1,6
33
1,2
34
83
7
33
4
27
0
21
4
24
6
29
0
15
2
18
8
22
5
28
3
0
500
1,000
1,500
2,000
2,500
3,000
Jul-
19
Au
g-1
9
Sep
-19
Oct
-19
No
v-1
9
De
c-1
9
Jan
-20
Feb
-20
Mar
-20
Ap
r-2
0
May
-20
Jun
-20
Jul-
20
Au
g-2
0
Sep
-20
Oct
-20
No
v-2
0
De
c-2
0
Jan
-21
Feb
-21
Mar
-21
Ap
r-2
1
May
-21
Jun
-21
Un
em
plo
yme
nt
Cla
ima
nts
Fiscal Year 2020 to 2021
Installation, Maintenance & Repair
1,4
65
1,5
15
1,5
37
1,6
35
1,5
77
1,5
51
2,1
01
1,9
47
1,8
16
3,9
66
4,1
81
3,7
43
3,1
29
2,4
75
1,8
52
1,2
44
1,1
47
1,0
03
1,0
72
1,3
15
1,0
43
1,0
35
1,0
20
1,2
72
0
1,000
2,000
3,000
4,000
5,000
6,000
Jul-
19
Au
g-1
9
Sep
-19
Oct
-19
No
v-1
9
Dec
-19
Jan
-20
Feb
-20
Mar
-20
Ap
r-2
0
May
-20
Jun
-20
Jul-
20
Au
g-2
0
Sep
-20
Oct
-20
No
v-2
0
Dec
-20
Jan
-21
Feb
-21
Mar
-21
Ap
r-2
1
May
-21
Jun
-21
Un
em
plo
yme
nt
Cla
iman
ts
Fiscal Year 2020 to 2021
Production
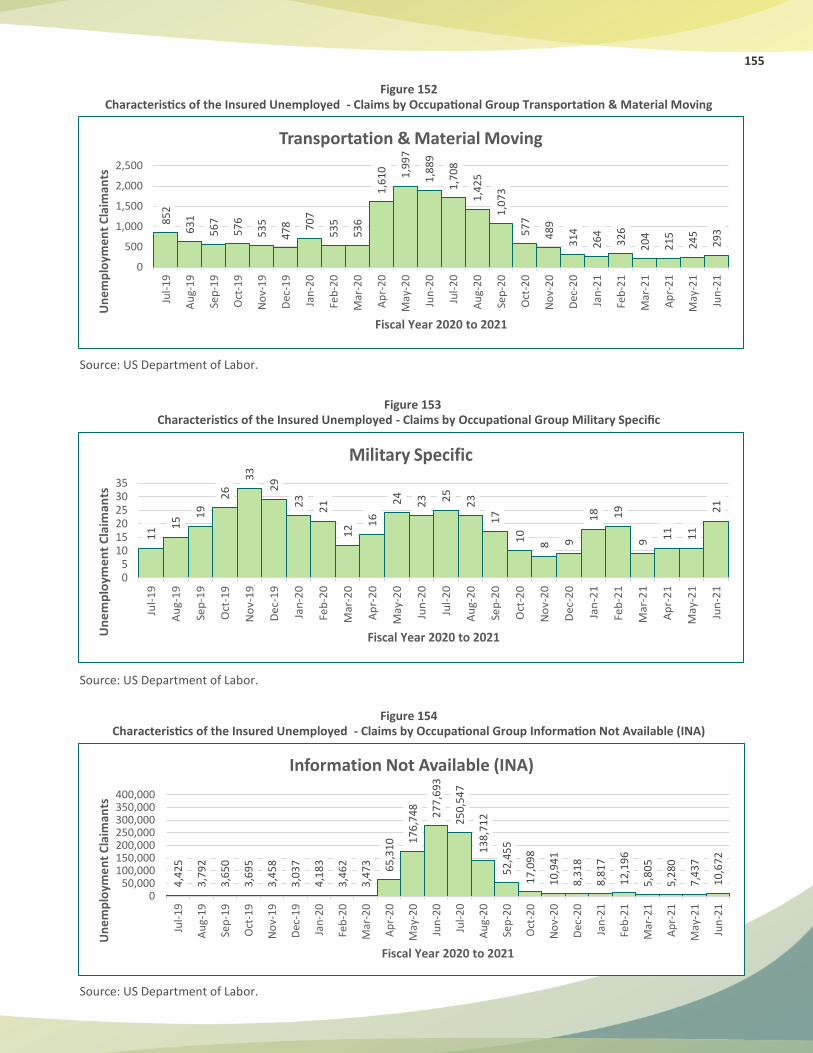
155
Figure 152 Characteristics of the Insured Unemployed - Claims by Occupational Group Transportation & Material Moving
Source: US Department of Labor.
Figure 153 Characteristics of the Insured Unemployed - Claims by Occupational Group Military Specific
Source: US Department of Labor.
Figure 154 Characteristics of the Insured Unemployed - Claims by Occupational Group Information Not Available (INA)
Source: US Department of Labor.
85
2
63
1
56
7
57
6
53
5
47
8 70
7
53
5
53
6
1,6
10 1,9
97
1,8
89
1,7
08
1,4
25
1,0
73
57
7
48
9
31
4
26
4
32
6
20
4
21
5
24
5
29
3
0
500
1,000
1,500
2,000
2,500Ju
l-1
9
Au
g-1
9
Sep
-19
Oct
-19
No
v-1
9
Dec
-19
Jan
-20
Feb
-20
Mar
-20
Ap
r-2
0
May
-20
Jun
-20
Jul-
20
Au
g-2
0
Sep
-20
Oct
-20
No
v-2
0
Dec
-20
Jan
-21
Feb
-21
Mar
-21
Ap
r-2
1
May
-21
Jun
-21
Un
em
plo
yme
nt
Cla
iman
ts
Fiscal Year 2020 to 2021
Transportation & Material Moving1
1 15 1
9
26
33
29
23
21
12 1
6
24
23 25
23
17
10
8 9
18 19
9 11
11
21
05
101520253035
Jul-
19
Au
g-1
9
Sep
-19
Oct
-19
No
v-1
9
De
c-1
9
Jan
-20
Feb
-20
Mar
-20
Ap
r-2
0
May
-20
Jun
-20
Jul-
20
Au
g-2
0
Sep
-20
Oct
-20
No
v-2
0
De
c-2
0
Jan
-21
Feb
-21
Mar
-21
Ap
r-2
1
May
-21
Jun
-21
Un
em
plo
yme
nt
Cla
ima
nts
Fiscal Year 2020 to 2021
Military Specific
4,4
25
3,7
92
3,6
50
3,6
95
3,4
58
3,0
37
4,1
83
3,4
62
3,4
73 65
,31
0 17
6,7
48
27
7,6
93
25
0,5
47
13
8,7
12
52
,45
5
17
,09
8
10
,94
1
8,3
18
8,8
17
12
,19
6
5,8
05
5,2
80
7,4
37
10
,67
2
050,000
100,000150,000200,000250,000300,000350,000400,000
Jul-
19
Au
g-1
9
Sep
-19
Oct
-19
No
v-1
9
Dec
-19
Jan
-20
Feb
-20
Mar
-20
Ap
r-2
0
May
-20
Jun
-20
Jul-
20
Au
g-2
0
Sep
-20
Oct
-20
No
v-2
0
Dec
-20
Jan
-21
Feb
-21
Mar
-21
Ap
r-2
1
May
-21
Jun
-21
Un
em
plo
yme
nt
Cla
iman
ts
Fiscal Year 2020 to 2021
Information Not Available (INA)
"This workforce product was funded by a grant awarded by the U.S. Department Labor's Employment and Training Administration. The product was created by recipient and does not necessarily reflect the official position of the U.S. Department Labor. The U.S. Department of Labor makes no guarantees, warranties, or assurances any kind, express or implied, with respect to such information, including any infom1ation on linked sites and including, but not limited to, accuracy of the information or completeness, timeliness, usefulness, adequacy, continued availability, or
This product is copyrighted by the institution that created it. Internal use by organization /or personal use by an individual for non-commercial purposes permissible. All other uses require the prior authorization of the copyright

157
158
Carlos J. Rivera Santiago Secretary of Labor Juan R. López Rivera Acting Assistant Secretary for Statistics and Publications Noel Zayas Moró Economist PR Bureau of Statistics PR Bureau of Labor Statistics Prudencio Rivera Martínez Building, 11 & 17TH Floor 505 Muñoz Rivera Ave. Hato Rey, Puerto Rico 00918 PO BOX 195540 San Juan, Puerto Rico 00919-5540 Phone: (787) 754-5300 Ext. 3000 Fax: (787) 754-5360 Email: [email protected] Facebook: mercadolaboraldtrh Web Page: www.mercadolaboral.pr.gov