Embed Size (px)
Citation preview

ECONOMIC SURVEY 2021
HIGHLIGHTS
1
ECONOMIC SURVEY 2021
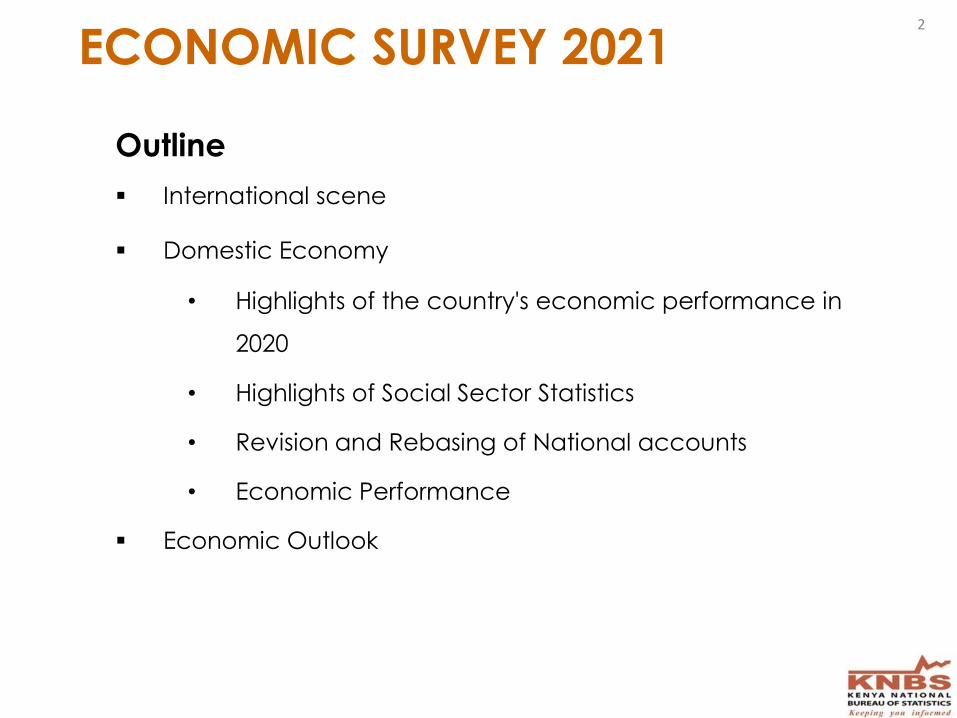
Outline
International scene
Domestic Economy
• Highlights of the country's economic performance in
2020
• Highlights of Social Sector Statistics
• Revision and Rebasing of National accounts
• Economic Performance
Economic Outlook
2
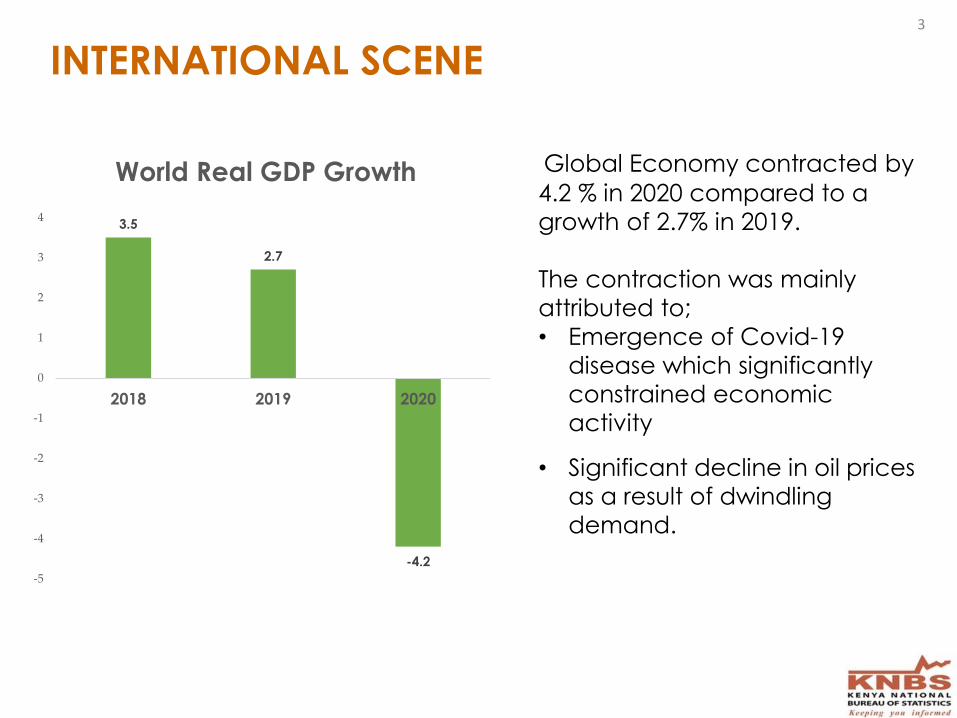
INTERNATIONAL SCENE
Global Economy contracted by
4.2 % in 2020 compared to a
growth of 2.7% in 2019.
The contraction was mainly
attributed to;
• Emergence of Covid-19
disease which significantly
constrained economic
activity
• Significant decline in oil prices
as a result of dwindling
demand.
3.5
2.7
-4.2
-5
-4
-3
-2
-1
0
1
2
3
4
2018 2019 2020
World Real GDP Growth
3
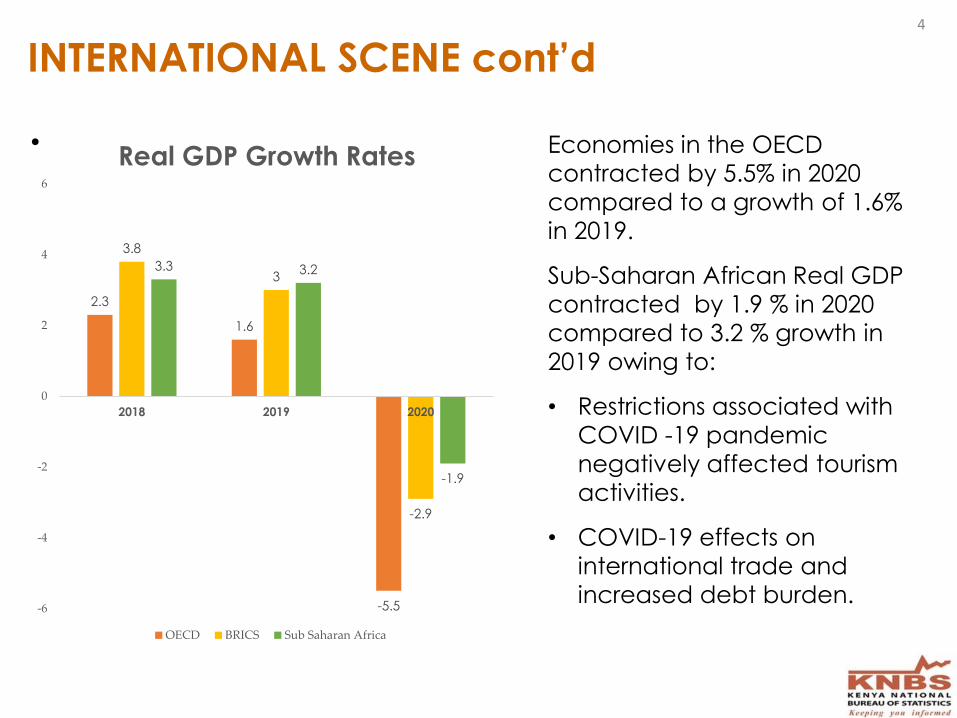
INTERNATIONAL SCENE cont’d
• Economies in the OECD
contracted by 5.5% in 2020
compared to a growth of 1.6%
in 2019.
Sub-Saharan African Real GDP
contracted by 1.9 % in 2020
compared to 3.2 % growth in
2019 owing to:
• Restrictions associated with
COVID -19 pandemic
negatively affected tourism
activities.
• COVID-19 effects on
international trade and
increased debt burden.
2.3
1.6
-5.5
3.8
3
-2.9
3.3 3.2
-1.9
-6
-4
-2
0
2
4
6
2018 2019 2020
Real GDP Growth Rates
OECD BRICS Sub Saharan Africa
4
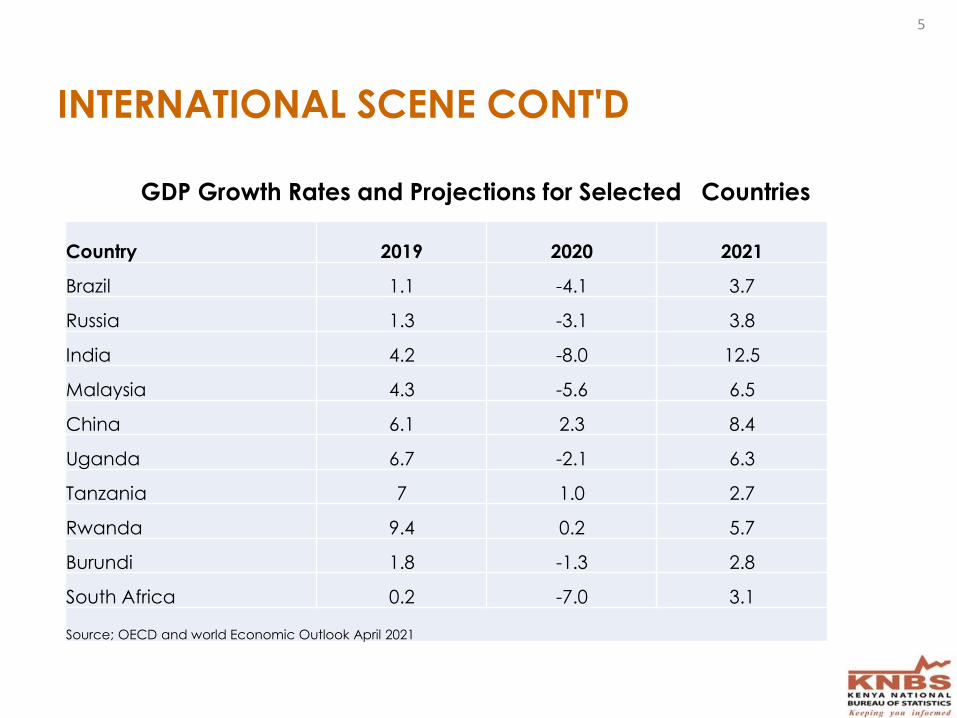
INTERNATIONAL SCENE CONT'D
GDP Growth Rates and Projections for Selected Countries
Country 2019 2020 2021
Brazil 1.1 -4.1 3.7
Russia 1.3 -3.1 3.8
India 4.2 -8.0 12.5
Malaysia 4.3 -5.6 6.5
China 6.1 2.3 8.4
Uganda 6.7 -2.1 6.3
Tanzania 7 1.0 2.7
Rwanda 9.4 0.2 5.7
Burundi 1.8 -1.3 2.8
South Africa 0.2 -7.0 3.1
Source; OECD and world Economic Outlook April 2021
5
6
Domestic
Economy
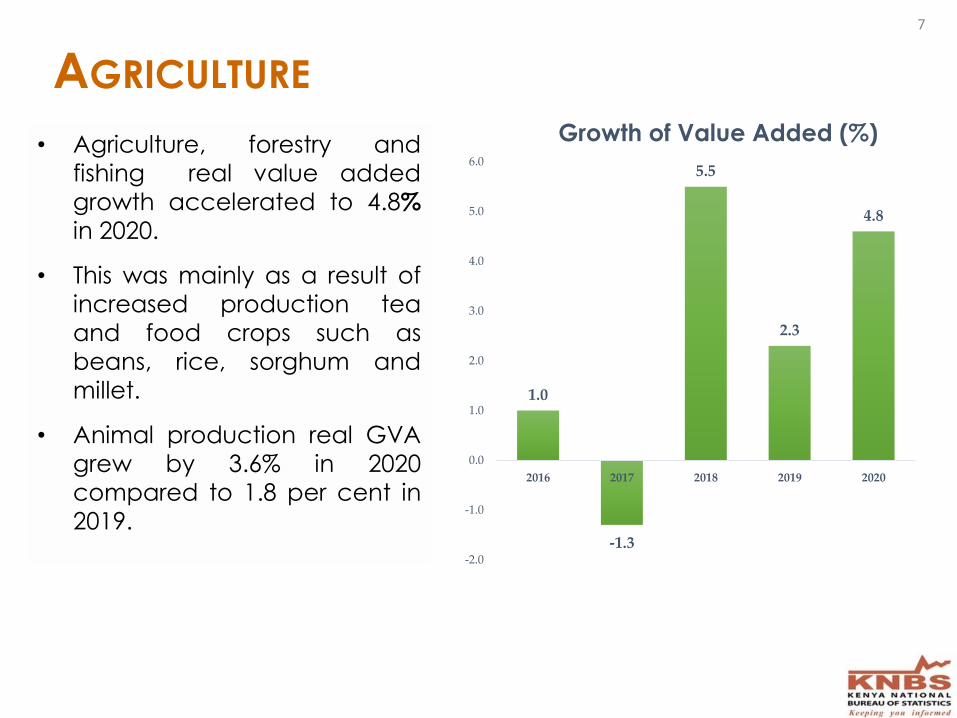
AGRICULTURE
• Agriculture, forestry and
fishing real value added
growth accelerated to 4.8%
in 2020.
• This was mainly as a result of
increased production tea
and food crops such as
beans, rice, sorghum and
millet.
• Animal production real GVA
grew by 3.6% in 2020
compared to 1.8 per cent in
2019.
1.0
-1.3
5.5
2.3
4.8
-2.0
-1.0
0.0
1.0
2.0
3.0
4.0
5.0
6.0
2016 2017 2018 2019 2020
Growth of Value Added (%)
7
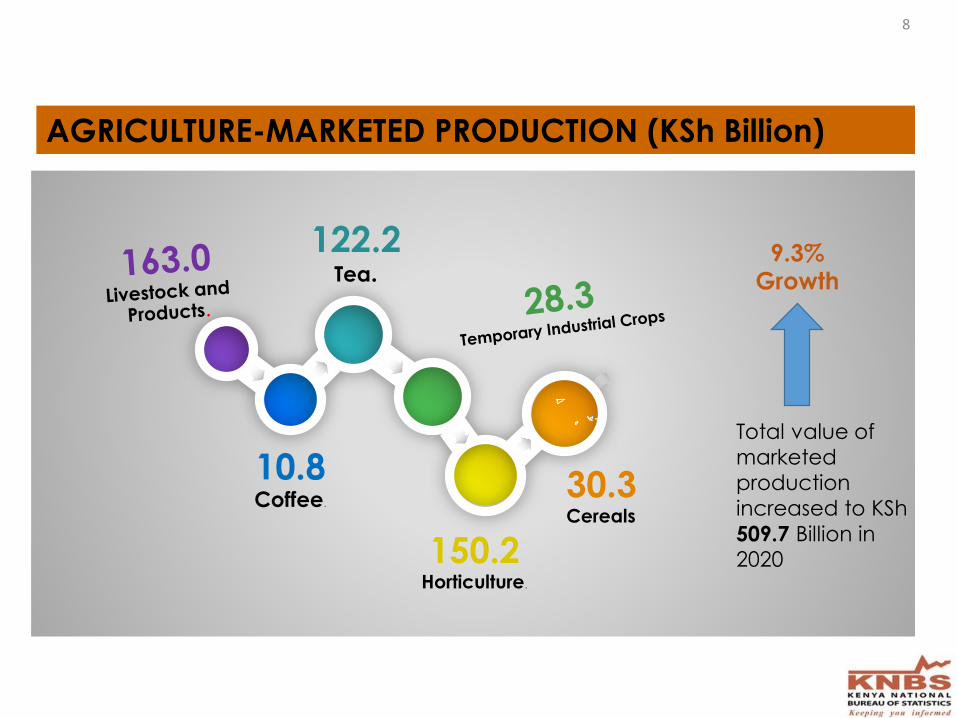
AGRICULTURE-MARKETED PRODUCTION (KSh Billion)
10.8Coffee.
122.2Tea.
150.2Horticulture.
30.3Cereals
9.3% Growth
Total value of
marketed
production
increased to KSh
509.7 Billion in 2020
8
9
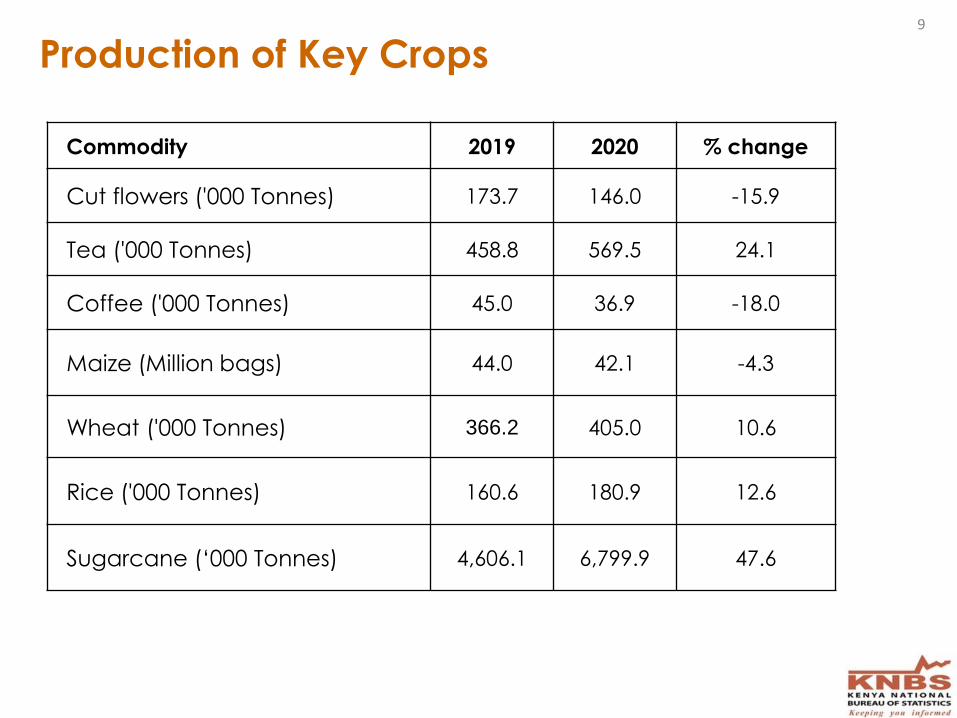
Commodity 2019 2020 % change
Cut flowers ('000 Tonnes) 173.7 146.0 -15.9
Tea ('000 Tonnes) 458.8 569.5 24.1
Coffee ('000 Tonnes) 45.0 36.9 -18.0
Maize (Million bags) 44.0 42.1 -4.3
Wheat ('000 Tonnes) 366.2 405.0 10.6
Rice ('000 Tonnes) 160.6 180.9 12.6
Sugarcane (‘000 Tonnes) 4,606.1 6,799.9 47.6
Production of Key Crops
10
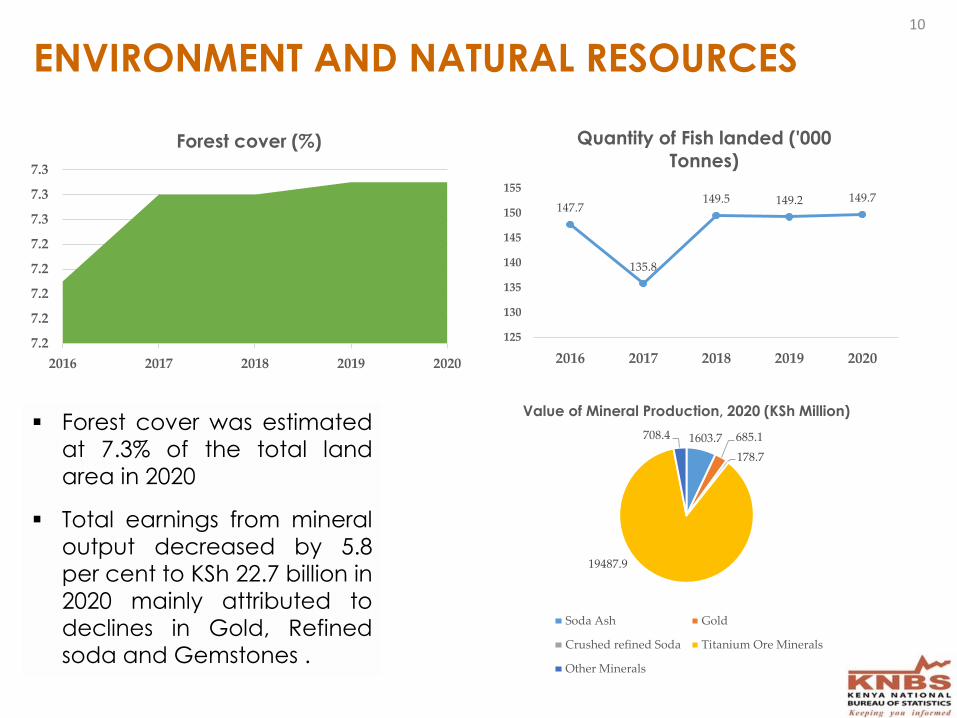
ENVIRONMENT AND NATURAL RESOURCES
7.2
7.2
7.2
7.2
7.2
7.3
7.3
7.3
2016 2017 2018 2019 2020
Forest cover (%)
147.7
135.8
149.5 149.2 149.7
125
130
135
140
145
150
155
2016 2017 2018 2019 2020
Quantity of Fish landed ('000
Tonnes)
Forest cover was estimatedat 7.3% of the total landarea in 2020
Total earnings from mineraloutput decreased by 5.8per cent to KSh 22.7 billion in
2020 mainly attributed todeclines in Gold, Refinedsoda and Gemstones .
1603.7 685.1
178.7
19487.9
708.4
Value of Mineral Production, 2020 (KSh Million)
Soda Ash Gold
Crushed refined Soda Titanium Ore Minerals
Other Minerals
11
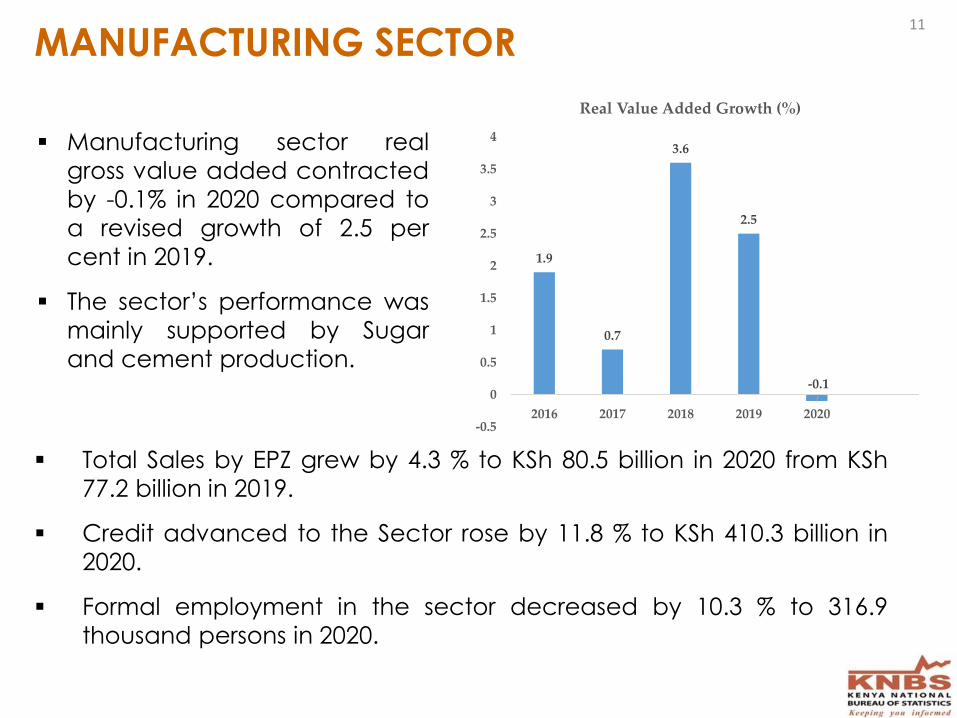
MANUFACTURING SECTOR
Manufacturing sector real
gross value added contracted
by -0.1% in 2020 compared to
a revised growth of 2.5 per
cent in 2019.
The sector’s performance was
mainly supported by Sugar
and cement production.
1.9
0.7
3.6
2.5
-0.1
-0.5
0
0.5
1
1.5
2
2.5
3
3.5
4
2016 2017 2018 2019 2020
Real Value Added Growth (%)
Total Sales by EPZ grew by 4.3 % to KSh 80.5 billion in 2020 from KSh
77.2 billion in 2019.
Credit advanced to the Sector rose by 11.8 % to KSh 410.3 billion in
2020.
Formal employment in the sector decreased by 10.3 % to 316.9
thousand persons in 2020.
12
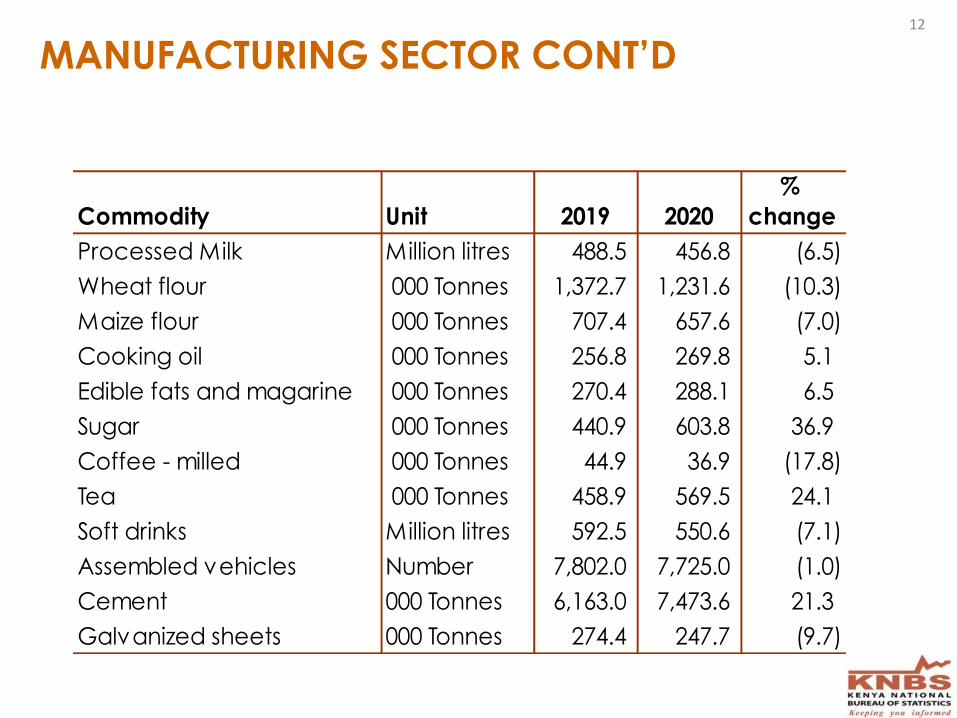
Commodity Unit 2019 2020
%
change
Processed Milk Million litres 488.5 456.8 (6.5)
Wheat flour 000 Tonnes 1,372.7 1,231.6 (10.3)
Maize flour 000 Tonnes 707.4 657.6 (7.0)
Cooking oil 000 Tonnes 256.8 269.8 5.1
Edible fats and magarine 000 Tonnes 270.4 288.1 6.5
Sugar 000 Tonnes 440.9 603.8 36.9
Coffee - milled 000 Tonnes 44.9 36.9 (17.8)
Tea 000 Tonnes 458.9 569.5 24.1
Soft drinks Million litres 592.5 550.6 (7.1)
Assembled vehicles Number 7,802.0 7,725.0 (1.0)
Cement 000 Tonnes 6,163.0 7,473.6 21.3
Galvanized sheets 000 Tonnes 274.4 247.7 (9.7)
MANUFACTURING SECTOR CONT’D

13
The construction sector
recorded a growth of 11.8 per
cent in 2020 compared to a 5.6
per cent growth in 2019.
The length of paved road as at
30th June 2020 was 22,649 Km
compared to 21,295 Km in June
2019.
Cement consumption which is
a key input to the sector increased by 20.3 % in 2020.
5.86.3 6.1
5.6
11.8
0.0
2.0
4.0
6.0
8.0
10.0
12.0
14.0
2016 2017 2018 2019 2020
Real GVA Growth (%)
CONSTRUCTION SECTOR
Electricity supply GVA contracted by 0.5 % in 2020 compared to 1.7 % growth in 2019.
Electricity generated increased by 17.1 % to 11.6 million Mega Watt hours in 2020.
Key projects:
• Completion of Olkaria V Geothermal power plant with an installed capacity of 172.3 MW
• Ongoing development of the Gitaru Solar Power plant with an estimated capacity of 42.5 MW
The total value of petroleum products imported dropped by 33.9% to KSh 209.1 billion in 2020 from KSh 316.6 billion in 2019.
ENERGY SECTOR
14
15
ENERGY SECTOR
0
2,000
4,000
6,000
8,000
10,000
12,000
2016 2017 2018 2019 2020
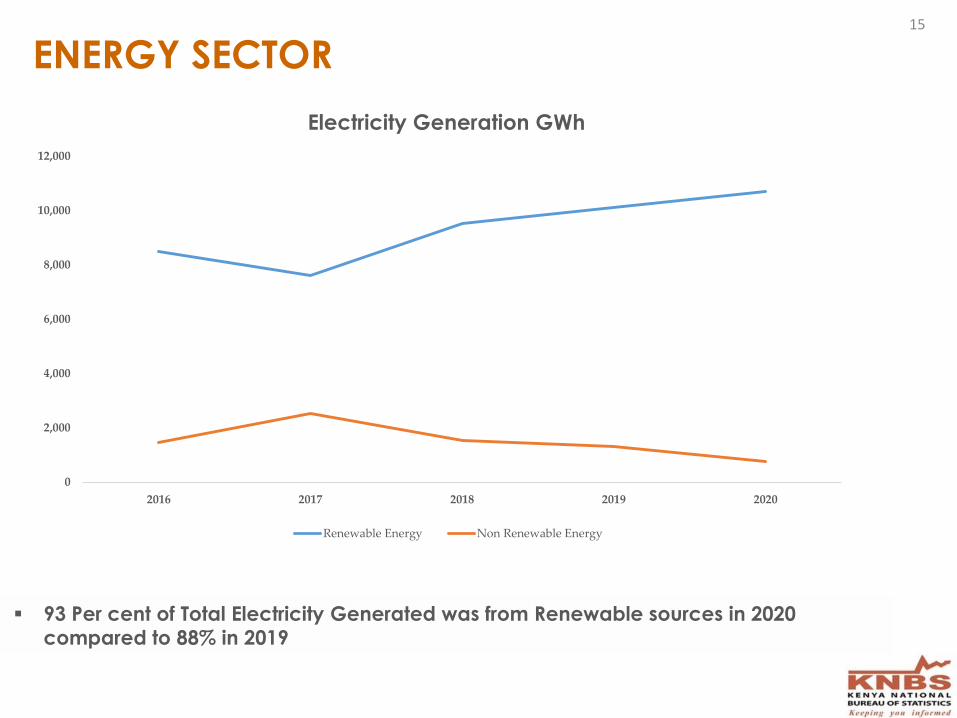
Electricity Generation GWh
Renewable Energy Non Renewable Energy
93 Per cent of Total Electricity Generated was from Renewable sources in 2020
compared to 88% in 2019
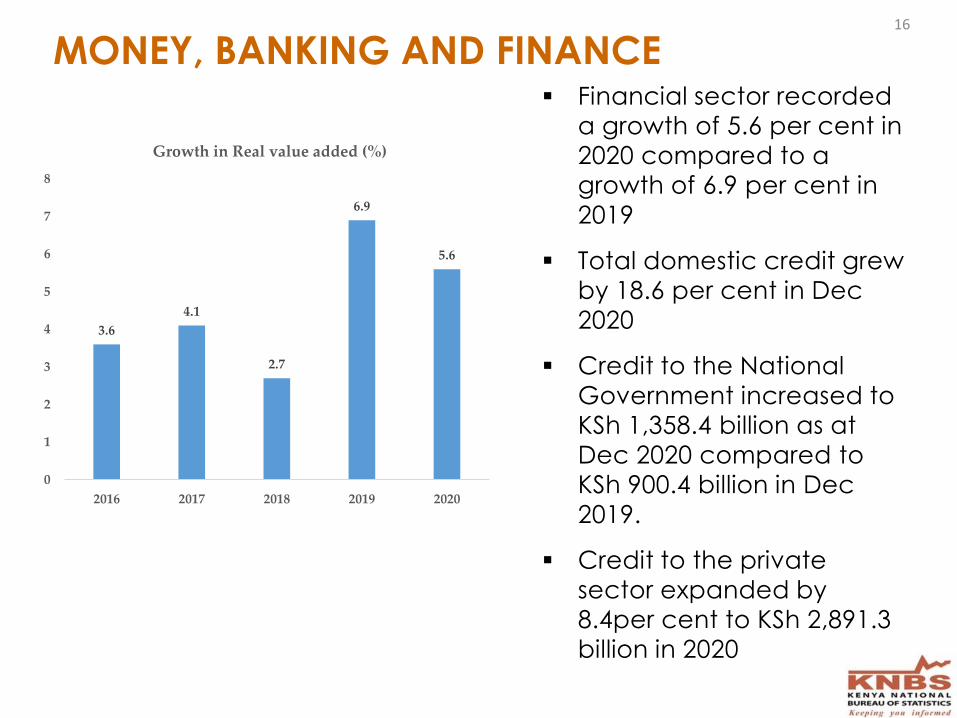
MONEY, BANKING AND FINANCE Financial sector recorded
a growth of 5.6 per cent in
2020 compared to a
growth of 6.9 per cent in
2019
Total domestic credit grew
by 18.6 per cent in Dec
2020
Credit to the National
Government increased to
KSh 1,358.4 billion as at
Dec 2020 compared to
KSh 900.4 billion in Dec
2019.
Credit to the private
sector expanded by
8.4per cent to KSh 2,891.3
billion in 2020
16
3.6
4.1
2.7
6.9
5.6
0
1
2
3
4
5
6
7
8
2016 2017 2018 2019 2020
Growth in Real value added (%)
PUBLIC FINANCE
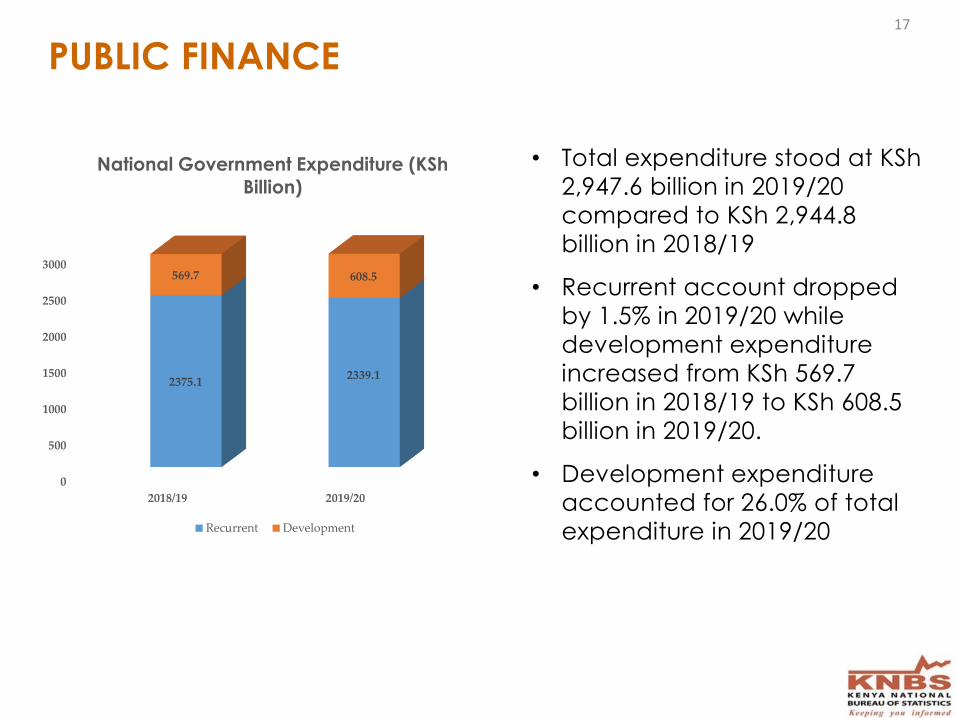
• Total expenditure stood at KSh
2,947.6 billion in 2019/20
compared to KSh 2,944.8
billion in 2018/19
• Recurrent account dropped
by 1.5% in 2019/20 while
development expenditure
increased from KSh 569.7
billion in 2018/19 to KSh 608.5
billion in 2019/20.
• Development expenditure
accounted for 26.0% of total
expenditure in 2019/20
0
500
1000
1500
2000
2500
3000
2018/19 2019/20
2375.12339.1
569.7 608.5
National Government Expenditure (KSh
Billion)
Recurrent Development
17

18
PUBLIC FINANCE
11.61
13.43
96.96
84.43
88.94
85.9
155.83
167.3
0 50 100 150 200
2018/19
2019/20
County Government Expenditure (KSh
Billion)
employee compensation use of goods and services
Acquisition of nonfinancial assets Acquisition of financial assets
Total expenditure by County
Governments rose from KSh
405.5 billion in 2018/19 to KSh
417.2 billion in 2019/20
County Government
expenditure on compensation of
employees rose from KSh 155.8
billion in 2018/19 to 167.3 billion
in 2019/20.
19
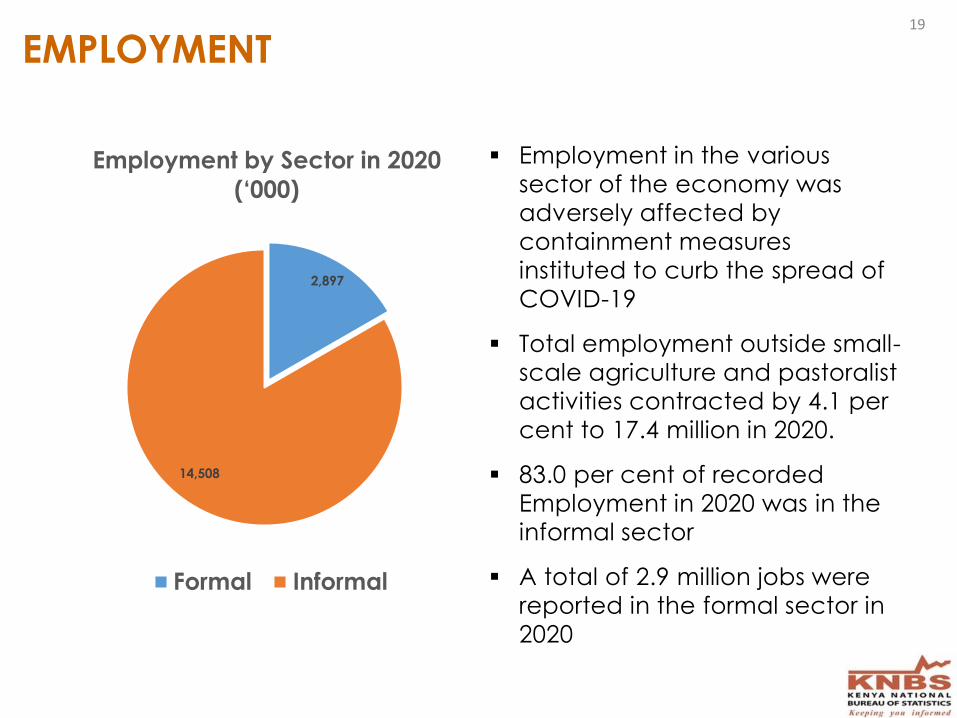
EMPLOYMENT
2,897
14,508
Employment by Sector in 2020
(‘000)
Formal Informal
Employment in the various
sector of the economy was
adversely affected by
containment measures
instituted to curb the spread of
COVID-19
Total employment outside small-
scale agriculture and pastoralist
activities contracted by 4.1 per
cent to 17.4 million in 2020.
83.0 per cent of recorded
Employment in 2020 was in the
informal sector
A total of 2.9 million jobs were
reported in the formal sector in
2020
20
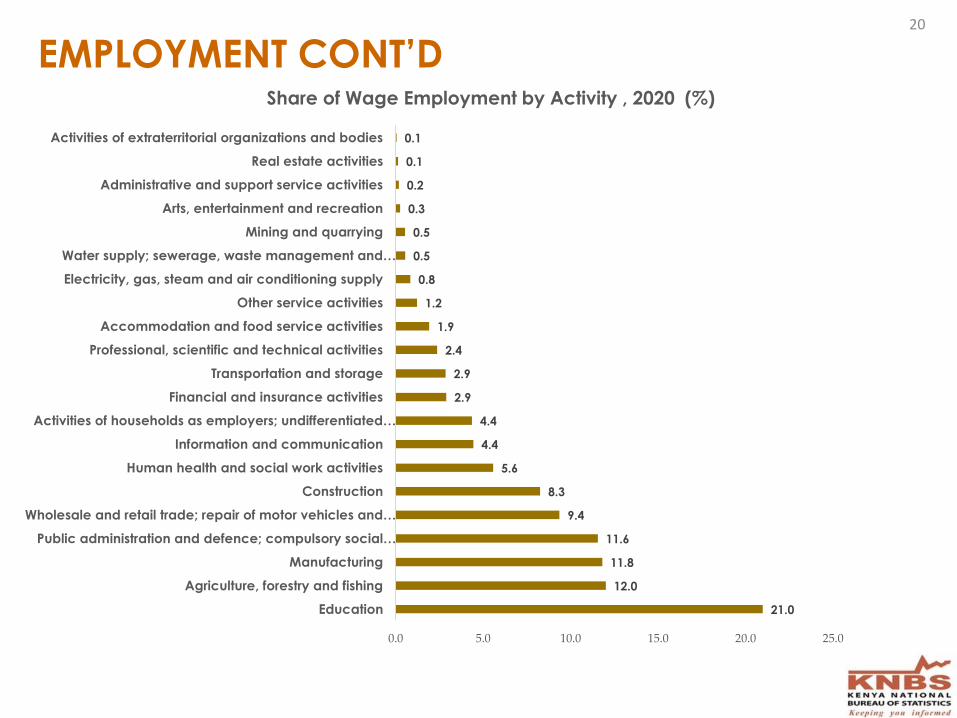
EMPLOYMENT CONT’D
21.0
12.0
11.8
11.6
9.4
8.3
5.6
4.4
4.4
2.9
2.9
2.4
1.9
1.2
0.8
0.5
0.5
0.3
0.2
0.1
0.1
0.0 5.0 10.0 15.0 20.0 25.0
Education
Agriculture, forestry and fishing
Manufacturing
Public administration and defence; compulsory social…
Wholesale and retail trade; repair of motor vehicles and…
Construction
Human health and social work activities
Information and communication
Activities of households as employers; undifferentiated…
Financial and insurance activities
Transportation and storage
Professional, scientific and technical activities
Accommodation and food service activities
Other service activities
Electricity, gas, steam and air conditioning supply
Water supply; sewerage, waste management and…
Mining and quarrying
Arts, entertainment and recreation
Administrative and support service activities
Real estate activities
Activities of extraterritorial organizations and bodies
Share of Wage Employment by Activity , 2020 (%)
21
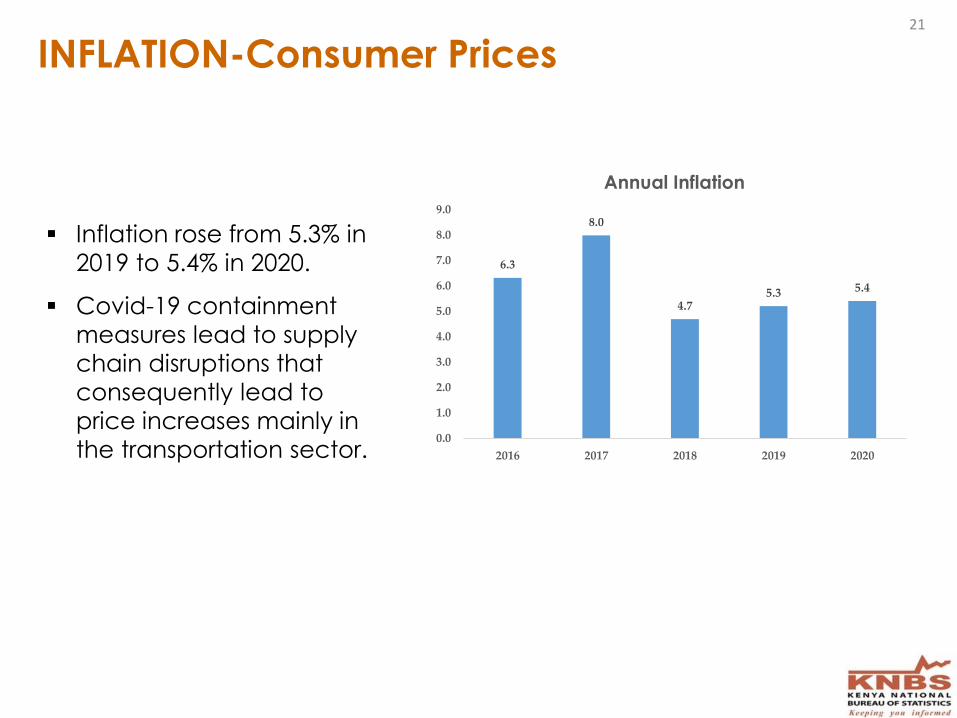
INFLATION-Consumer Prices
Inflation rose from 5.3% in
2019 to 5.4% in 2020.
Covid-19 containment
measures lead to supply
chain disruptions that
consequently lead to
price increases mainly in
the transportation sector.
6.3
8.0
4.75.3 5.4
0.0
1.0
2.0
3.0
4.0
5.0
6.0
7.0
8.0
9.0
2016 2017 2018 2019 2020
Annual Inflation
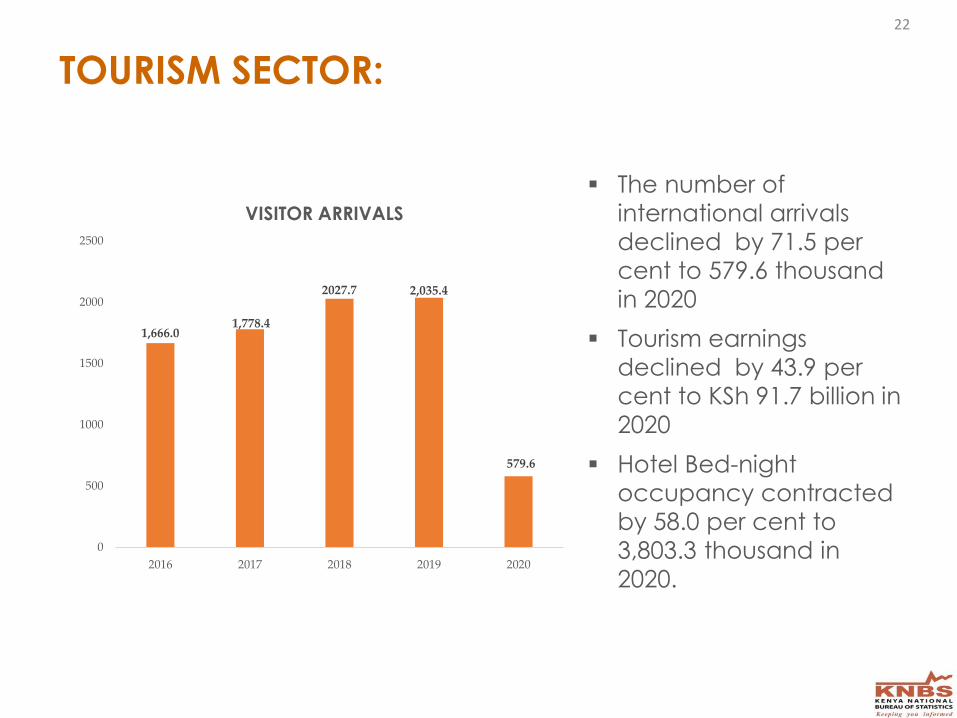
TOURISM SECTOR:
The number of
international arrivals
declined by 71.5 per
cent to 579.6 thousand
in 2020
Tourism earnings
declined by 43.9 per
cent to KSh 91.7 billion in
2020
Hotel Bed-night
occupancy contracted
by 58.0 per cent to
3,803.3 thousand in
2020.
1,666.01,778.4
2027.7 2,035.4
579.6
0
500
1000
1500
2000
2500
2016 2017 2018 2019 2020
VISITOR ARRIVALS
22

23
TRANSPORTATION AND STORAGE
The sector’s Gross value
added declined by 7.8 % in
2020 from growth of 6.3% in
2019.
Restriction on mobility
instituted by the Government
to curb the spread of Covid -
19 dampened the sectors
growth during the review period.
8.2
3.6
5.76.3
-7.8
-8
-6
-4
-2
0
2
4
6
8
10
2016 2017 2018 2019 2020
Growth in Real value added (%)
24
TRANSPORTATION AND STORAGE CONT'D
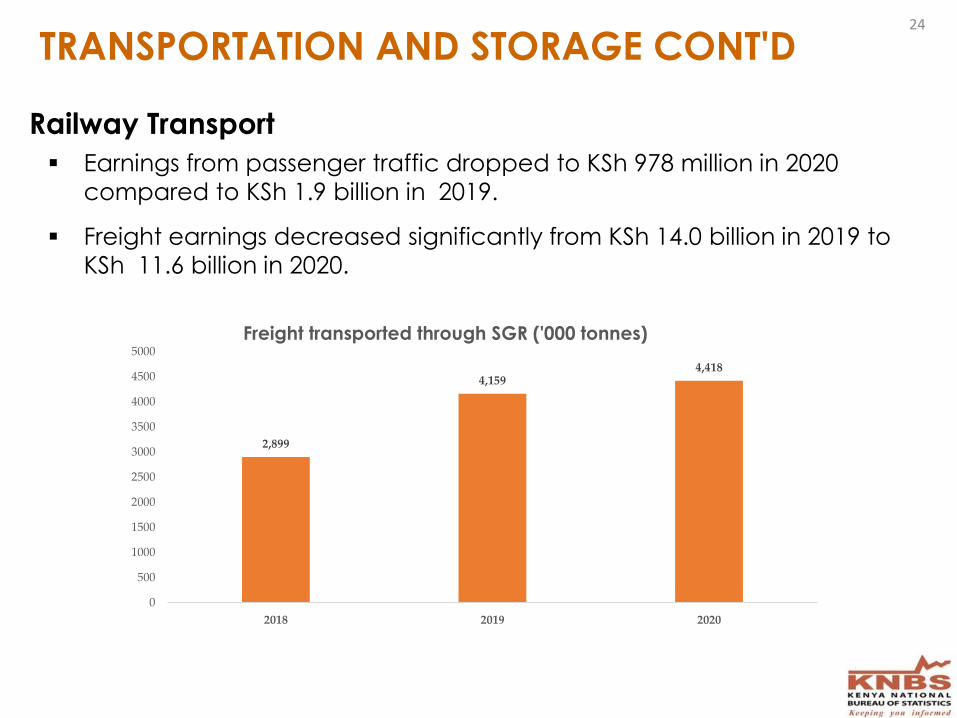
Railway Transport
Earnings from passenger traffic dropped to KSh 978 million in 2020
compared to KSh 1.9 billion in 2019.
Freight earnings decreased significantly from KSh 14.0 billion in 2019 to
KSh 11.6 billion in 2020.
2,899
4,1594,418
0
500
1000
1500
2000
2500
3000
3500
4000
4500
5000
2018 2019 2020
Freight transported through SGR ('000 tonnes)
25
TRANSPORTATION AND STORAGE CONT'D
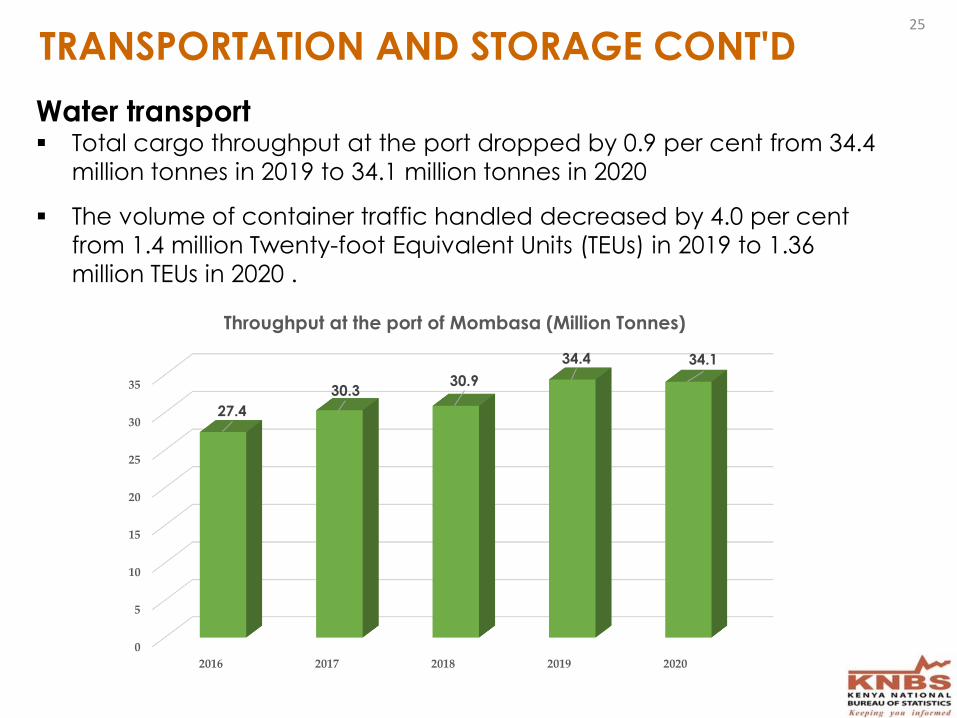
Water transport Total cargo throughput at the port dropped by 0.9 per cent from 34.4
million tonnes in 2019 to 34.1 million tonnes in 2020
The volume of container traffic handled decreased by 4.0 per cent
from 1.4 million Twenty-foot Equivalent Units (TEUs) in 2019 to 1.36
million TEUs in 2020 .
0
5
10
15
20
25
30
35
2016 2017 2018 2019 2020
27.4
30.330.9
34.4 34.1
Throughput at the port of Mombasa (Million Tonnes)
26
TRANSPORTATION AND STORAGE CONT'D …
Pipeline Transport
Air transport
Pipeline throughput dropped by 3.1 per cent from 7,025.9 thousand
cubic metres in 2019 to 6,806.8 thousand cubic metres in 2020.
The total number of passengers handled dropped by 62.5 per cent
from 12.0 million in 2019 to 4.5 million passengers in 2020.
Volume of commercial cargo traffic handled decreased by 8.9 per
cent to 341.4 thousand tonnes in 2020.
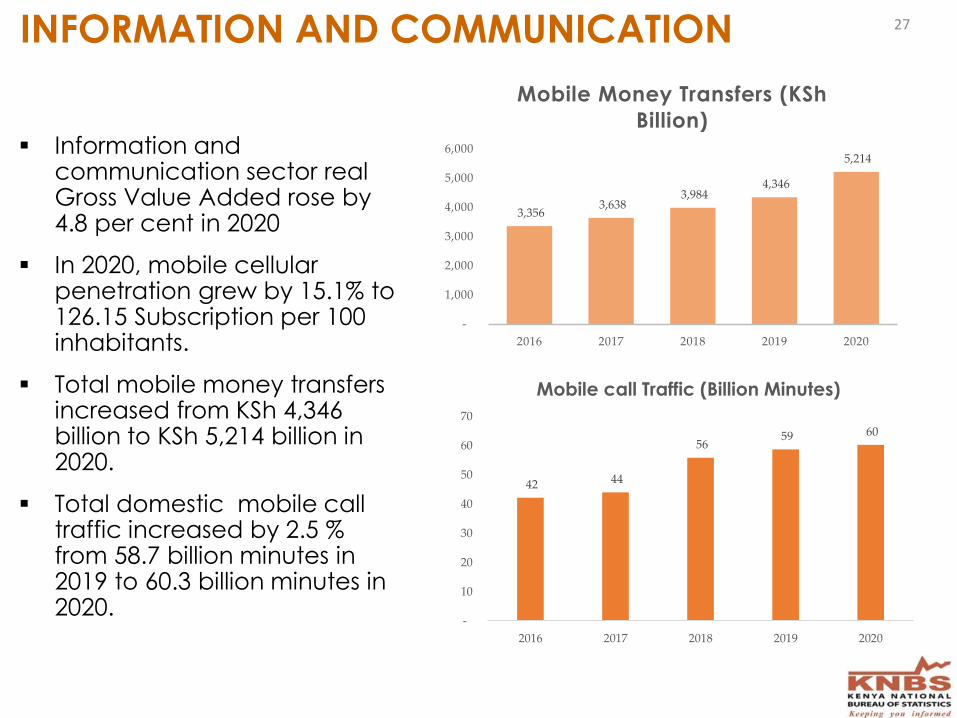
Information and communication sector real Gross Value Added rose by 4.8 per cent in 2020
In 2020, mobile cellular penetration grew by 15.1% to 126.15 Subscription per 100 inhabitants.
Total mobile money transfers increased from KSh 4,346 billion to KSh 5,214 billion in 2020.
Total domestic mobile call traffic increased by 2.5 % from 58.7 billion minutes in 2019 to 60.3 billion minutes in 2020.
INFORMATION AND COMMUNICATION
3,356 3,638
3,984 4,346
5,214
-
1,000
2,000
3,000
4,000
5,000
6,000
2016 2017 2018 2019 2020
Mobile Money Transfers (KSh
Billion)
42 44
56 59 60
-
10
20
30
40
50
60
70
2016 2017 2018 2019 2020
Mobile call Traffic (Billion Minutes)
27
28
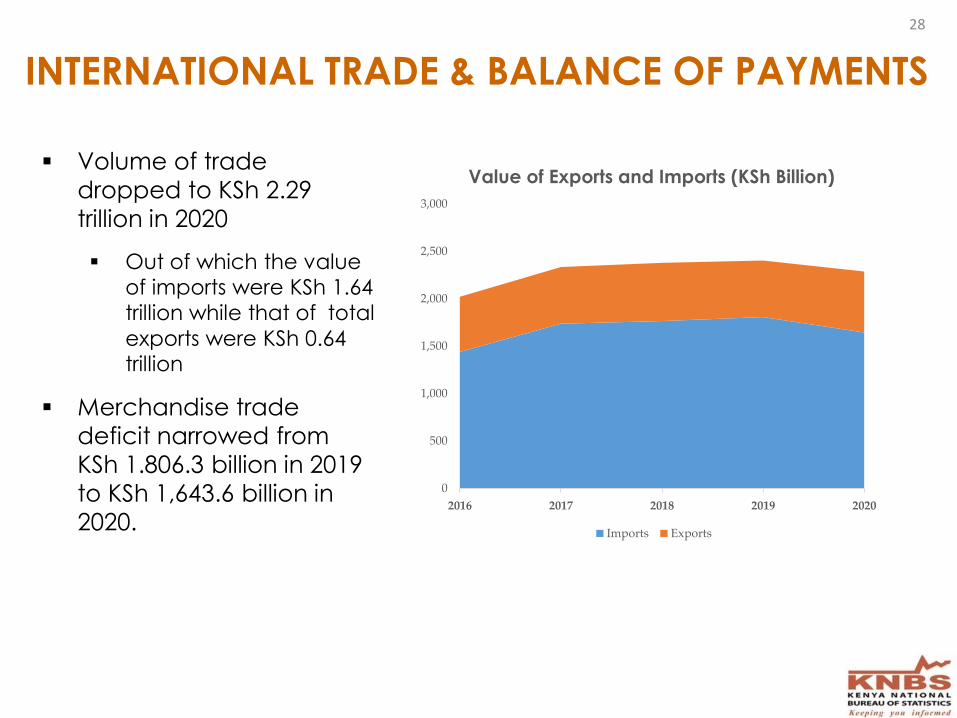
INTERNATIONAL TRADE & BALANCE OF PAYMENTS
Volume of trade
dropped to KSh 2.29
trillion in 2020
Out of which the value
of imports were KSh 1.64
trillion while that of total
exports were KSh 0.64trillion
Merchandise trade
deficit narrowed from
KSh 1.806.3 billion in 2019
to KSh 1,643.6 billion in
2020.
0
500
1,000
1,500
2,000
2,500
3,000
2016 2017 2018 2019 2020
Value of Exports and Imports (KSh Billion)
Imports Exports

29
INTERNATIONAL TRADE & BOP CONT’D
The current account
balance narrowed from a
deficit of KSh 539.2 billion
in 2019 to a deficit of KSh
491.7 billion in 2020
Total net financial inflows
increased to KSh 396.5
billion in 2020 reflecting an
increase of 4.1%.
Overall balance of
payments position
improved to a surplus of
KSh 152.4 billion in 2020.
(5.4)
(6.9)
(5.4) (5.3)(4.6)
(8.0)
(7.0)
(6.0)
(5.0)
(4.0)
(3.0)
(2.0)
(1.0)
-
2016 2017 2018 2019 2020
Current account as a % of GDP
30
Social sector

Selected Indicators on Education
Indicator 2019 2020
%
change
Total No. of educational institutions 89,337 90,1450.90
No. of registered Technical Vocational and Education Training (TVET) institutions
2,140 2,3017.52
Enrolment
Primary schools 10,072 10,1700.97
Secondary Schools 3,260 3,520.47.99
TVET 430,598 451,2054.79
University 509,468 546,6997.31
Adult Education 209,082 180,395(13.72)
31
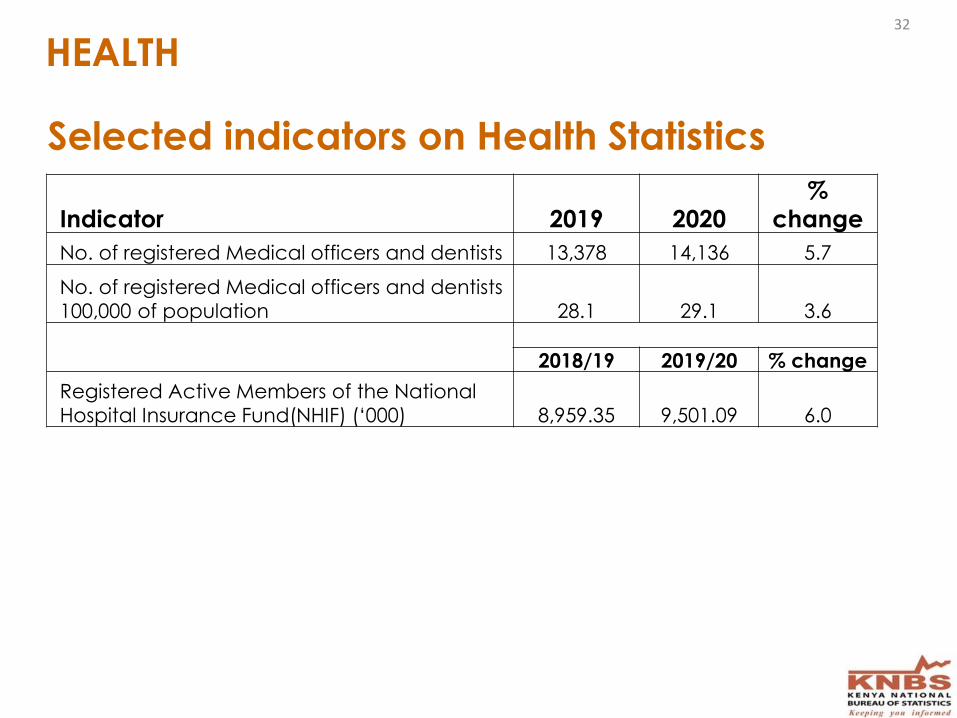
Indicator 2019 2020
%
change
No. of registered Medical officers and dentists 13,378 14,136 5.7
No. of registered Medical officers and dentists
100,000 of population 28.1 29.1 3.6
2018/19 2019/20 % change
Registered Active Members of the National
Hospital Insurance Fund(NHIF) (‘000) 8,959.35 9,501.09 6.0
Selected indicators on Health Statistics
HEALTH32
33
Economic Performance

Revision and rebasing of national accounts
• The Kenya National Bureau of Statistics initiated the process ofrevising and rebasing the National Accounts in 2017.
• Revision and rebasing of National Accounts is a normal statisticalprocedure undertaken internationally by National Statistics Offices,to ensure macroeconomic statistics present the most up to datereflection of the economy.
• Revision and rebasing of National Accounts statistics are alsonecessitated by the need to meet users’ demands and to capturechanges occasioned by information and communicationtechnologies, rise in globalization and digitalization of the economyand the existence of new types of transactions in the economy
• Best international practice requires revision and rebasing ofNational Accounts every five years, with a base year not older than10 years.
34

Process of current revision
1st step
• Took stock of the available data and assessed their suitability
• Formulated a data collection strategy to fill the gaps
2nd step
• Carried out various surveys
• Analyzed and validated the data
• Reviewed the available information to inform choice of the base year (change from 2009 to 2016)
3rd step
• Revised and Rebased estimates produced
• Technical Assistance received from Statistics Sweden and IMF
• Engaged stakeholders and other external experts (including IMF Headquarters) to peer review the revised estimates.
• Reviewed the estimates based on the comments from experts
35
Outcome of revision and rebasing
• The process of the revision and rebasing of National Accounts has resulted in:
• Improved compliance with the 2008 System of National Accounts compilation guidelines.
• Improved coverage of economic activities due to improved data sources.
• Better estimates of the size of the economy and rate of growth.
• Improved accuracy, consistency and reliability of the National Accounts estimates.
• Detailed report on the revision process is available on the KNBS website
36
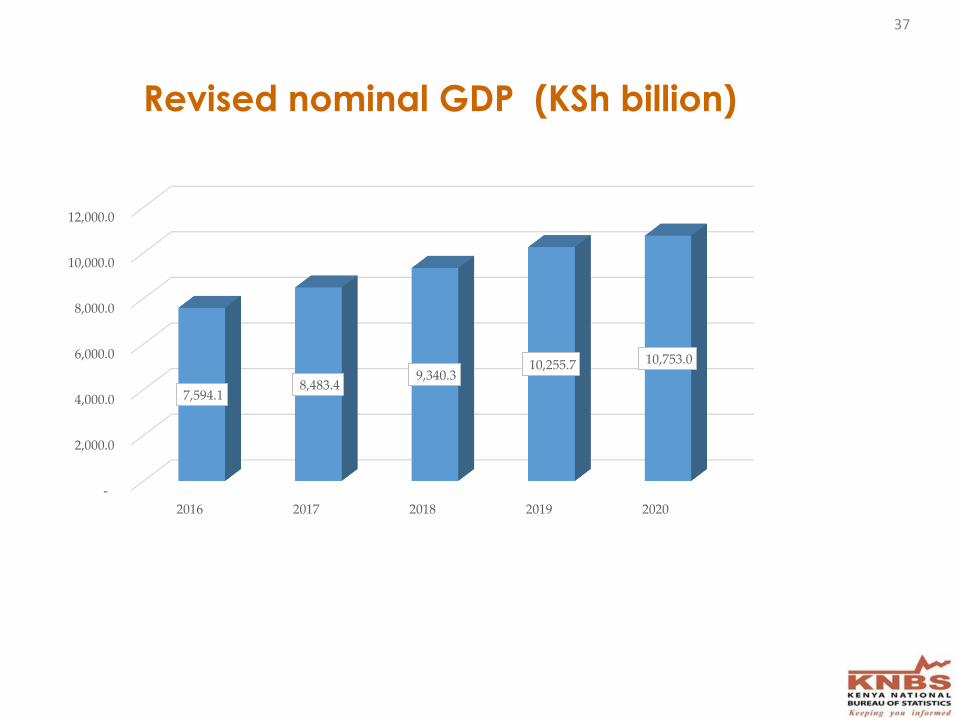
Revised nominal GDP (KSh billion)
-
2,000.0
4,000.0
6,000.0
8,000.0
10,000.0
12,000.0
2016 2017 2018 2019 2020
7,594.1 8,483.4
9,340.3 10,255.7 10,753.0
37
38
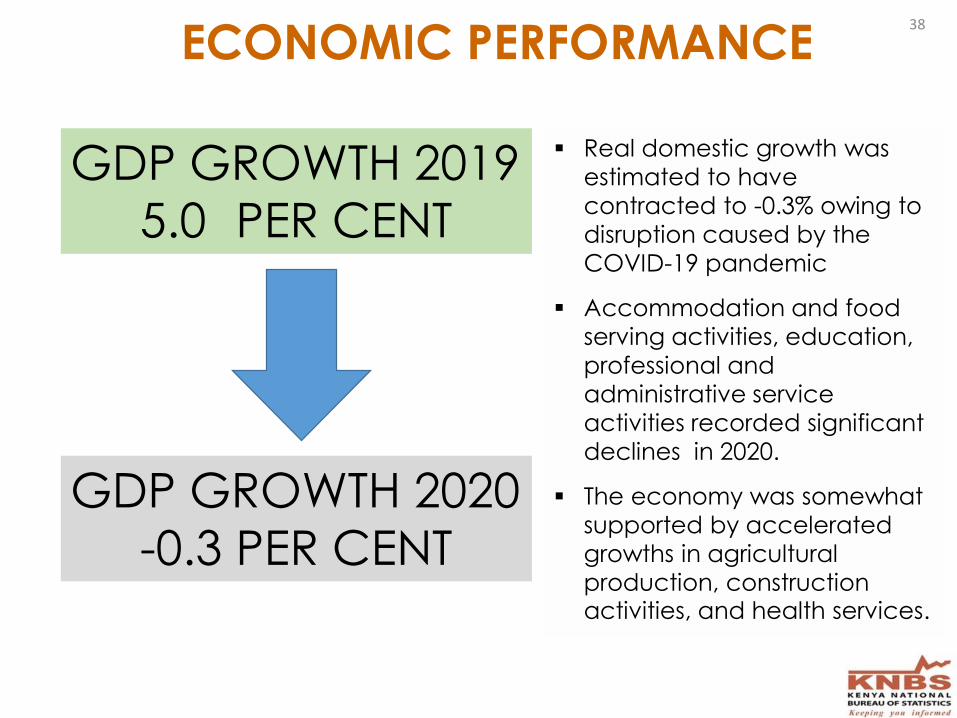
ECONOMIC PERFORMANCE
Real domestic growth was
estimated to have
contracted to -0.3% owing to
disruption caused by the
COVID-19 pandemic
Accommodation and food
serving activities, education,
professional and
administrative service
activities recorded significant
declines in 2020.
The economy was somewhat
supported by accelerated
growths in agricultural
production, construction activities, and health services.
GDP GROWTH 2020
-0.3 PER CENT
GDP GROWTH 2019
5.0 PER CENT
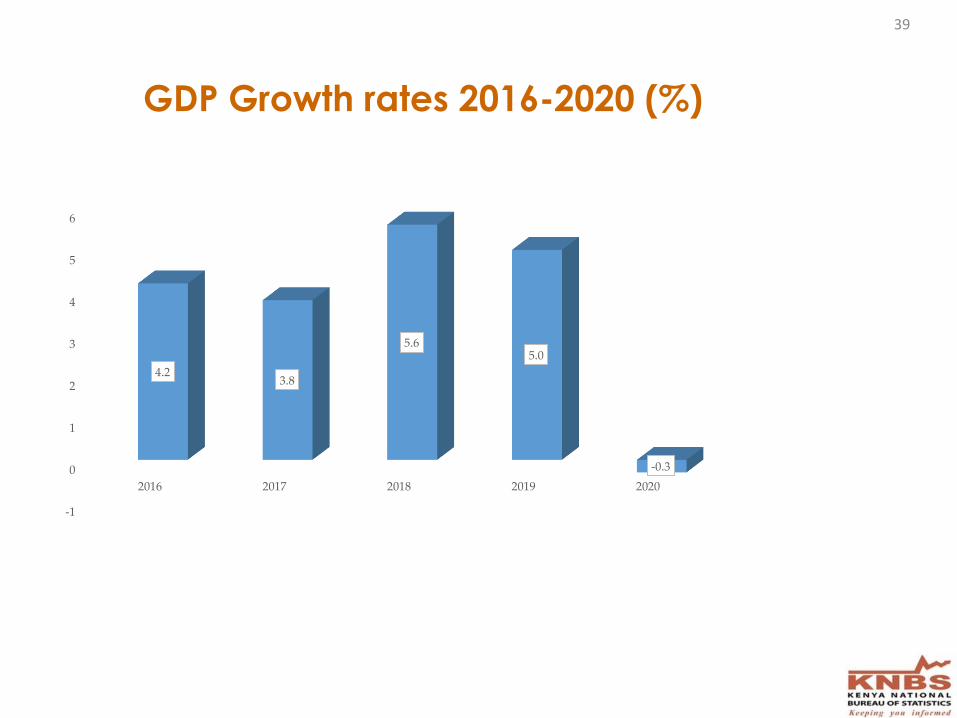
GDP Growth rates 2016-2020 (%)
-1
0
1
2
3
4
5
6
2016 2017 2018 2019 2020
4.23.8
5.65.0
-0.3
39

E
M
GDP
GROWTH
2020:
-0.3%A
M
I
W
ECONOMIC PERFORMANCE (GDP byActivity 2020)
40
Fi
A
T
W
H
F
A
41
ECONOMIC PERFORMANCE
The contraction in Economic performance was attributed to;
• Disruption in labour supply brought about by restriction of
movement and social distancing meant to contain the spread
of Covid-19
• Reduced demands for goods and services.
The large contraction in tourism and related activities was partly offset
by growth in the Construction and Health sectors both driven by
continued investment in public infrastructure and Health.
The improvement in Agricultural activities was due to sufficient rains
that were well spread throughout the year.

42
Economic Outlook
ECONOMIC OUTLOOK
Global
• Globally, most of the developing economies are projected toexperience a more challenging recovery from the COVID-19pandemic compared to their developed economies counterpart.
• This is largely so because of the uneven access to COVID-19vaccine which is therefore likely to impact negatively on the fullresumption of economic activities in the developing economies.
• The global economic growth is expected to rebound to 5.6 percent in 2021.
• Consequently, the volume of world merchandise trade is projectedto expand by 8.0 per cent in 2021 after a contraction of 5.3 percent in 2020. T
• The growth in the world trade is expected to boost externaldemand for Kenya’s products and thereby likely to augment thecountry’s economic growth.
43
ECONOMIC OUTLOOK
Domestically, oil prices have been rising significantly in response to
the global price rise.
On average, the international oil prices are likely to be higher.
Effectively then, oil prices in Kenya will probably remain high and
therefore counterproductive to economic growth.
On average, inflation was lower in the first quarter of 2021
compared to a similar quarter of 2020. However, there was a
significant rise in the inflation rate during the second quarter and it
is likely that this trend will continue in the second half of 2021 partly
due to higher energy and transportation prices.
44
ECONOMIC OUTLOOK
The country has so far experienced below normal rainfall in the first
half of 2021.
However, the weather forecast points to the possibility of the short rains beingbetter in most parts of the country later in the year.
Output of the agriculture sector, which is largely rain fed, is therefore likely to belower than the 2020 level.
Full resumption of activities in the education sector and the hotel
industry, that were almost halted for the better part of 2020, is likely
to significantly boost the growth.
Other key sectors like manufacturing and transportation are likely
to rebound and support the country’s economic growth.
The key macroeconomic indicators will most probably remain
stable and supportive of growth in 2021, the economy is therefore
expected to record a significant rebound in 2021.
45
46
Thank You