Embed Size (px)
Citation preview
ECONOMIC CHALLENGES of
NUCLEAR PLANTS in COMPETITIVE POWER MARKETS
Regulatory Market Arbitrage
Harvard Electricity Policy Group March 10-11, 2016
BILL MOHL
PRESIDENT
ENTERGY WHOLESALE COMMODITIES
Caution Regarding Forward-Looking Statements
In this presentation, and from time to time, Entergy Corporation makes certain “forward-looking statements” within the meaning of the Private Securities Litigation Reform Act of 1995. Except to the extent required by the federal securities laws, Entergy undertakes no obligation to publicly update or revise any forward-looking statements, whether as a result of new information, future events or otherwise. Forward-looking statements involve a number of risks and uncertainties. There are factors that could cause actual results to differ materially from those expressed or implied in the forward-looking statements, including (a) those factors discussed in this presentation and in: (i) Entergy’s most recent Annual Report on Form 10-K, any subsequent Quarterly Reports on Form 10-Q and (ii) Entergy’s other reports and filings made under
the Securities Exchange Act of 1934; (b) uncertainties associated with rate proceedings, formula rate plans and other cost recovery mechanisms; (c) uncertainties associated with efforts to remediate the effects of major storms and recover related restoration costs; (d) nuclear plant relicensing, operating and regulatory risks, including any changes resulting from the nuclear crisis in Japan following its catastrophic earthquake and tsunami; (e) legislative and regulatory actions and risks and uncertainties associated with claims or litigation by or against Entergy and its subsidiaries and (f) economic conditions and conditions in commodity and capital markets during the periods covered by the forward-looking statements, in addition to other factors described elsewhere in this presentation and subsequent securities filings.
1
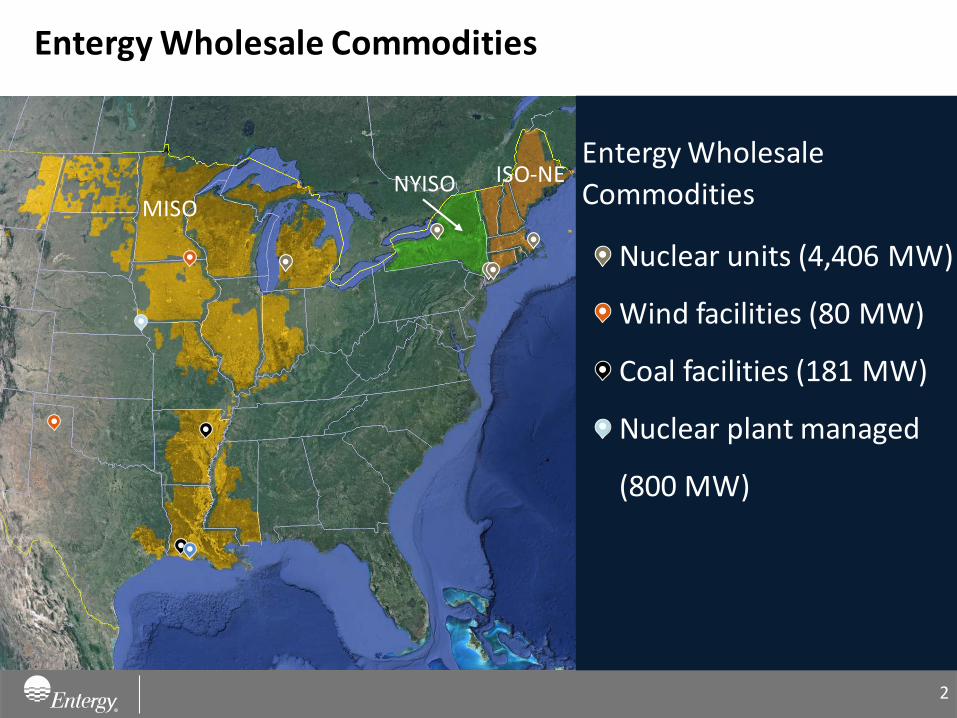
Entergy Wholesale Commodities
NYISO MISO
Entergy Wholesale
Commodities
Nuclear units (4,406 MW)
Wind facilities (80 MW)
Coal facilities (181 MW)
Nuclear plant managed
(800 MW)
ISO-NE
2
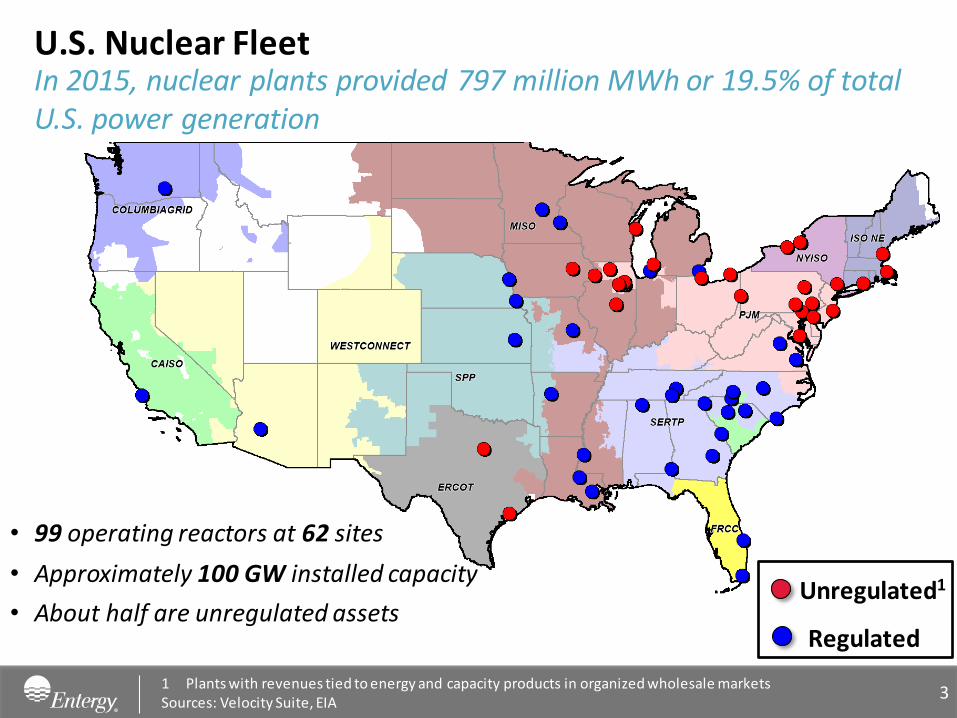
U.S. Nuclear Fleet
3
In 2015, nuclear plants provided 797 million MWh or 19.5% of total U.S. power generation
• 99 operating reactors at 62 sites
• Approximately 100 GW installed capacity
• About half are unregulated assets Unregulated1
Regulated
1 Plants with revenues tied to energy and capacity products in organized wholesale markets Sources: Velocity Suite, EIA
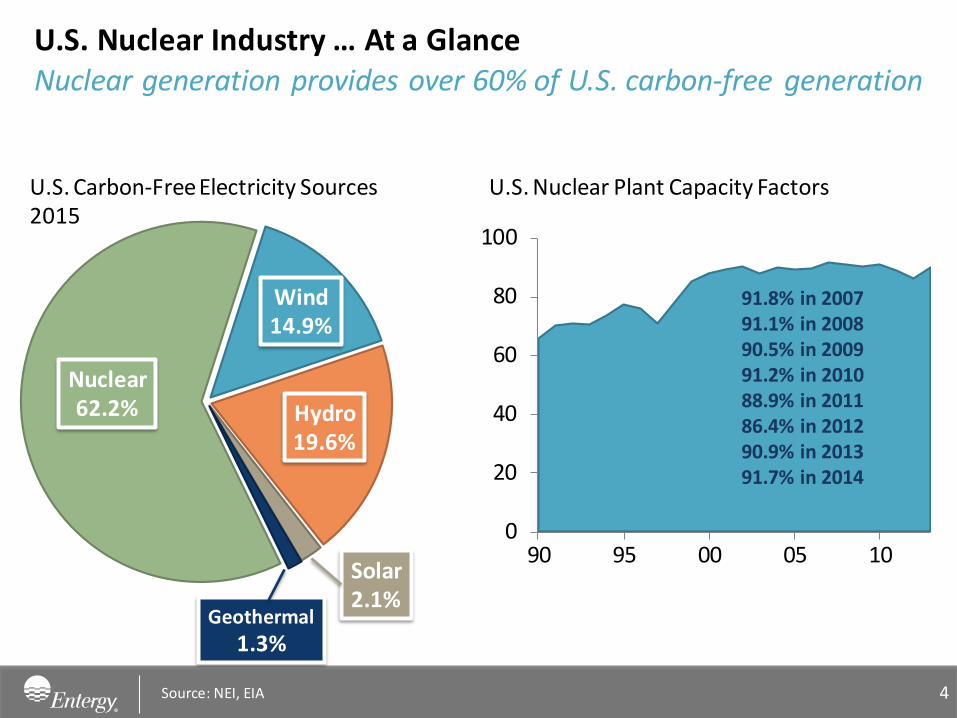
U.S. Nuclear Industry … At a Glance
4
Nuclear generation provides over 60% of U.S. carbon-free generation
0
20
40
60
80
100
90 95 00 05 10
U.S. Nuclear Plant Capacity Factors
91.8% in 2007 91.1% in 2008 90.5% in 2009 91.2% in 2010 88.9% in 2011 86.4% in 2012 90.9% in 2013 91.7% in 2014
U.S. Carbon-Free Electricity Sources 2015
Source: NEI, EIA
Nuclear 62.2%
Wind 14.9%
Hydro 19.6%
Solar 2.1%
Geothermal
1.3%
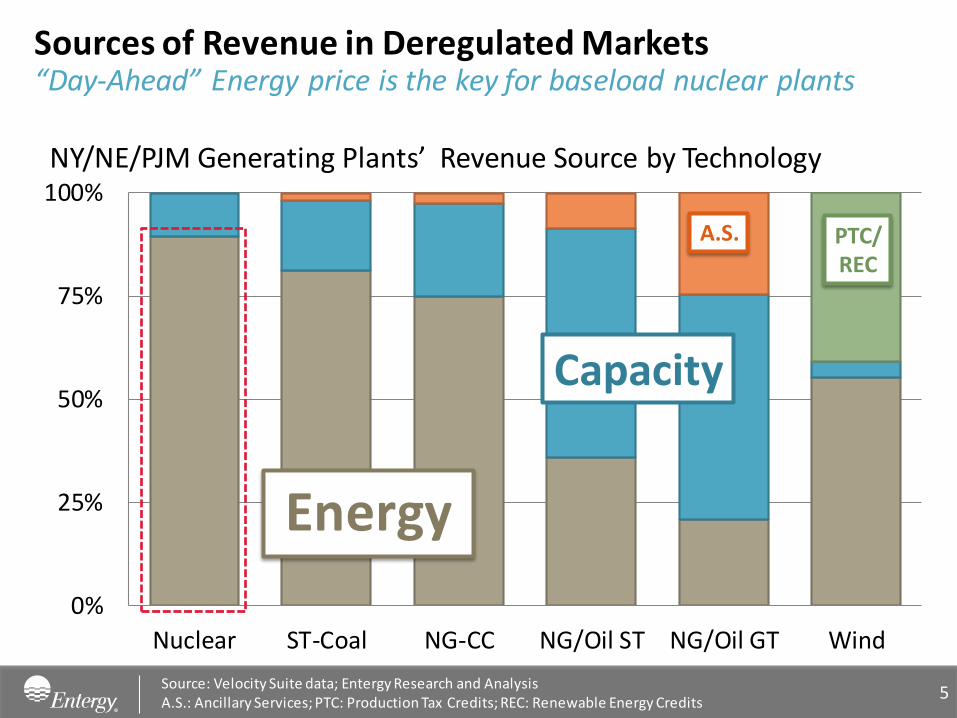
Sources of Revenue in Deregulated Markets
Source: Velocity Suite data; Entergy Research and Analysis A.S.: Ancillary Services; PTC: Production Tax Credits; REC: Renewable Energy Credits
“Day-Ahead” Energy price is the key for baseload nuclear plants
0%
25%
50%
75%
100%
Nuclear ST-Coal NG-CC NG/Oil ST NG/Oil GT Wind
Energy
Capacity
A.S.
NY/NE/PJM Generating Plants’ Revenue Source by Technology
PTC/ REC
5
0
20
40
60
80
2005
2006
2007
2008
2009
2010
2011
2012
2013
2014
2015
2016
2017
2018
2019
2020
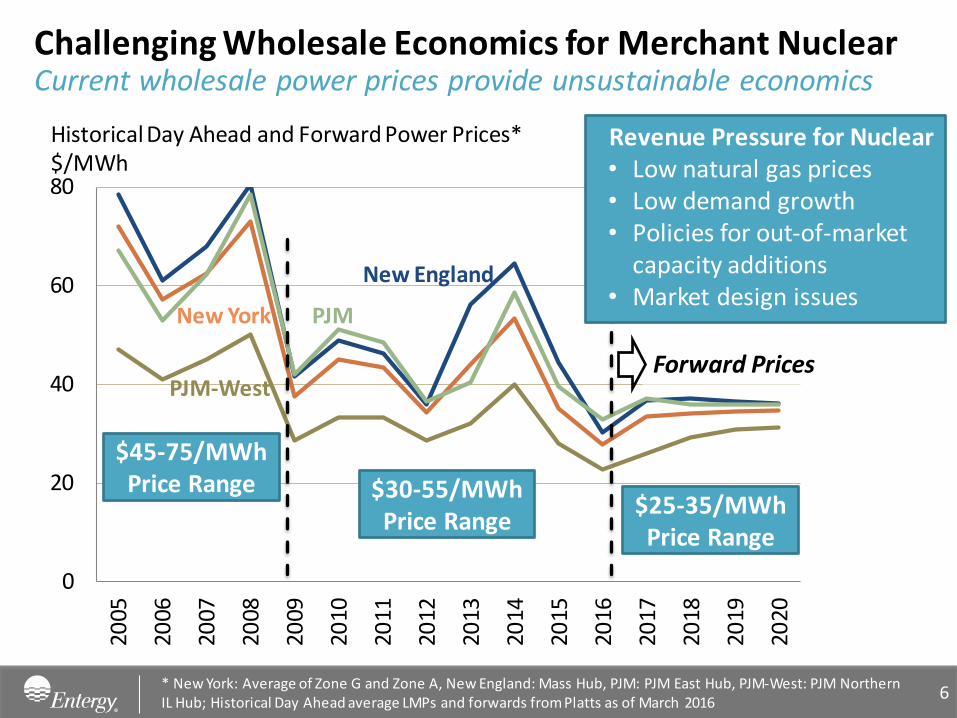
Challenging Wholesale Economics for Merchant Nuclear
6
Current wholesale power prices provide unsustainable economics
$45-75/MWh Price Range
Forward Prices
Historical Day Ahead and Forward Power Prices* $/MWh
Revenue Pressure for Nuclear • Low natural gas prices • Low demand growth • Policies for out-of-market
capacity additions • Market design issues
New York
New England
PJM
PJM-West
$30-55/MWh Price Range
$25-35/MWh Price Range
* New York: Average of Zone G and Zone A, New England: Mass Hub, PJM: PJM East Hub, PJM-West: PJM Northern IL Hub; Historical Day Ahead average LMPs and forwards from Platts as of March 2016
0
20
40
60
80
2005
2006
2007
2008
2009
2010
2011
2012
2013
2014
2015
2016
2017
2018
2019
2020
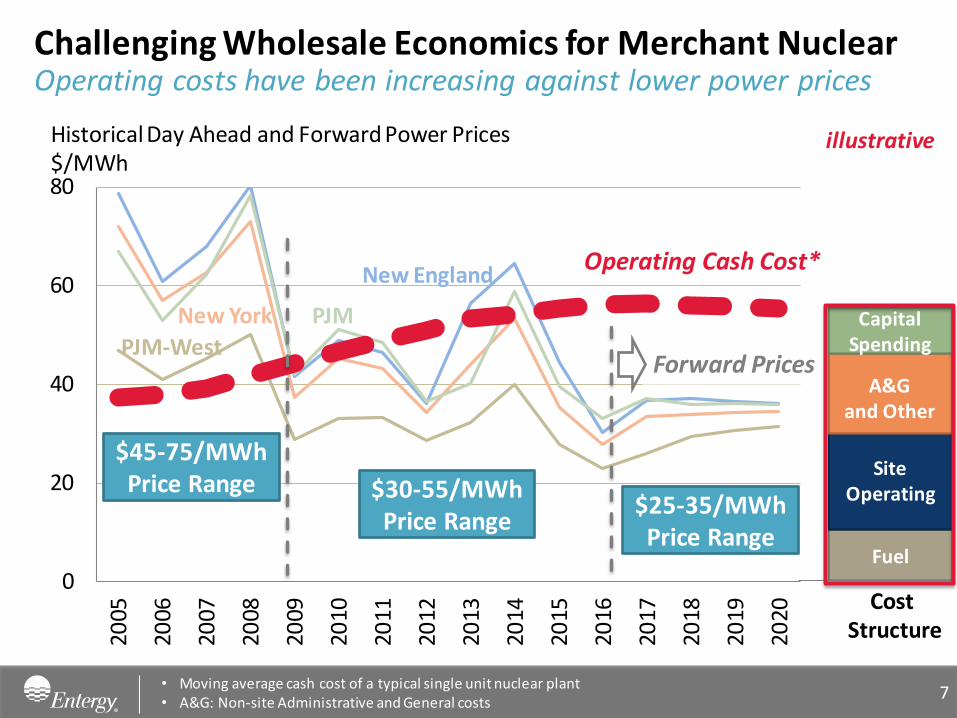
Challenging Wholesale Economics for Merchant Nuclear
7
Operating costs have been increasing against lower power prices
$45-75/MWh Price Range
Forward Prices
Historical Day Ahead and Forward Power Prices $/MWh
New York
New England
PJM
PJM-West
$30-55/MWh Price Range
$25-35/MWh Price Range
Fuel
Site Operating
Capital Spending
A&G and Other
Operating Cash Cost*
• Moving average cash cost of a typical single unit nuclear plant • A&G: Non-site Administrative and General costs
illustrative
Cost Structure
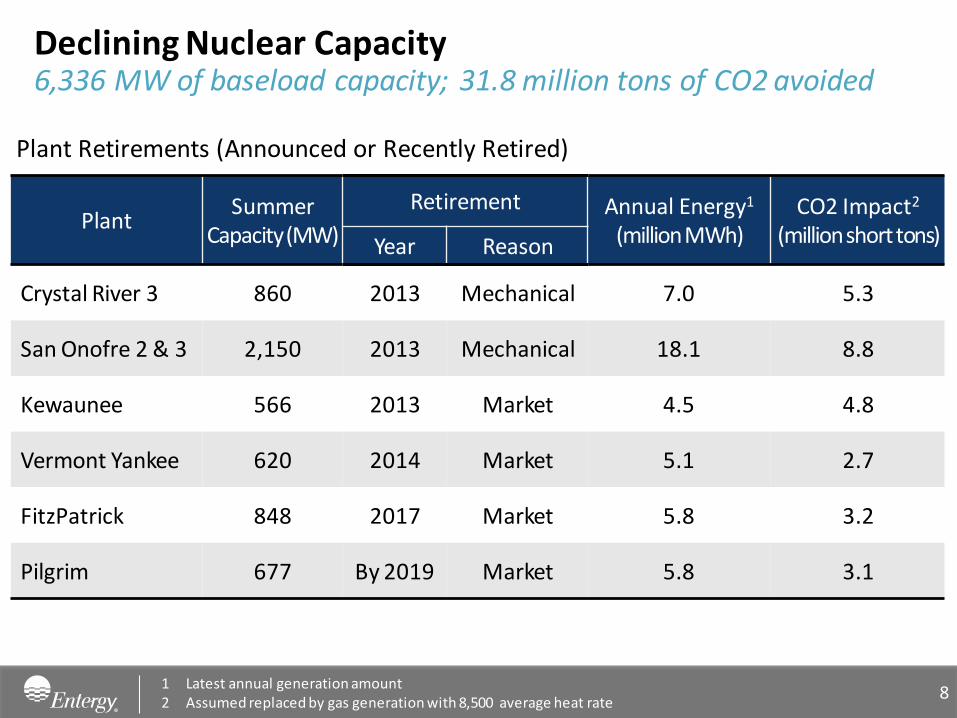
Declining Nuclear Capacity
8
Plant Summer
Capacity (MW)
Retirement Annual Energy1 (million MWh)
CO2 Impact2 (million short tons) Year Reason
Crystal River 3 860 2013 Mechanical 7.0 5.3
San Onofre 2 & 3 2,150 2013 Mechanical 18.1 8.8
Kewaunee 566 2013 Market 4.5 4.8
Vermont Yankee 620 2014 Market 5.1 2.7
FitzPatrick 848 2017 Market 5.8 3.2
Pilgrim 677 By 2019 Market 5.8 3.1
1 Latest annual generation amount 2 Assumed replaced by gas generation with 8,500 average heat rate
6,336 MW of baseload capacity; 31.8 million tons of CO2 avoided
Plant Retirements (Announced or Recently Retired)
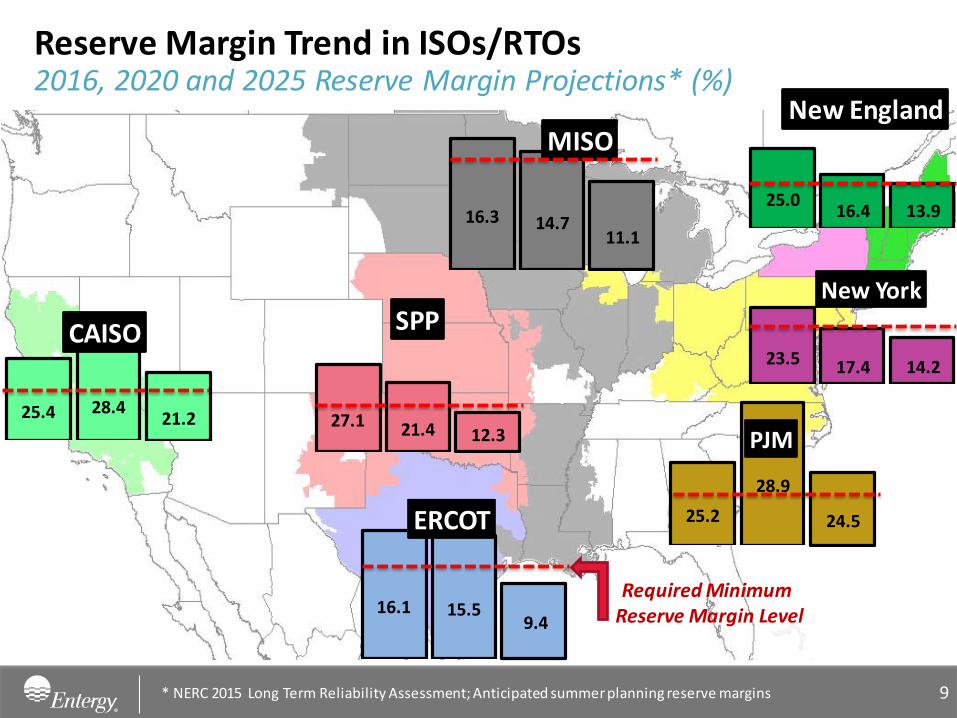
25.4
28.4
21.2
CAISO
Reserve Margin Trend in ISOs/RTOs
* NERC 2015 Long Term Reliability Assessment; Anticipated summer planning reserve margins
2016, 2020 and 2025 Reserve Margin Projections* (%)
16.3
14.7
11.1
MISO
25.0
16.4
13.9
New England
23.5
17.4
14.2
New York
25.2
28.9
24.5
PJM
27.1
21.4
12.3
SPP
16.1
15.5
9.4
ERCOT
Required Minimum Reserve Margin Level
9
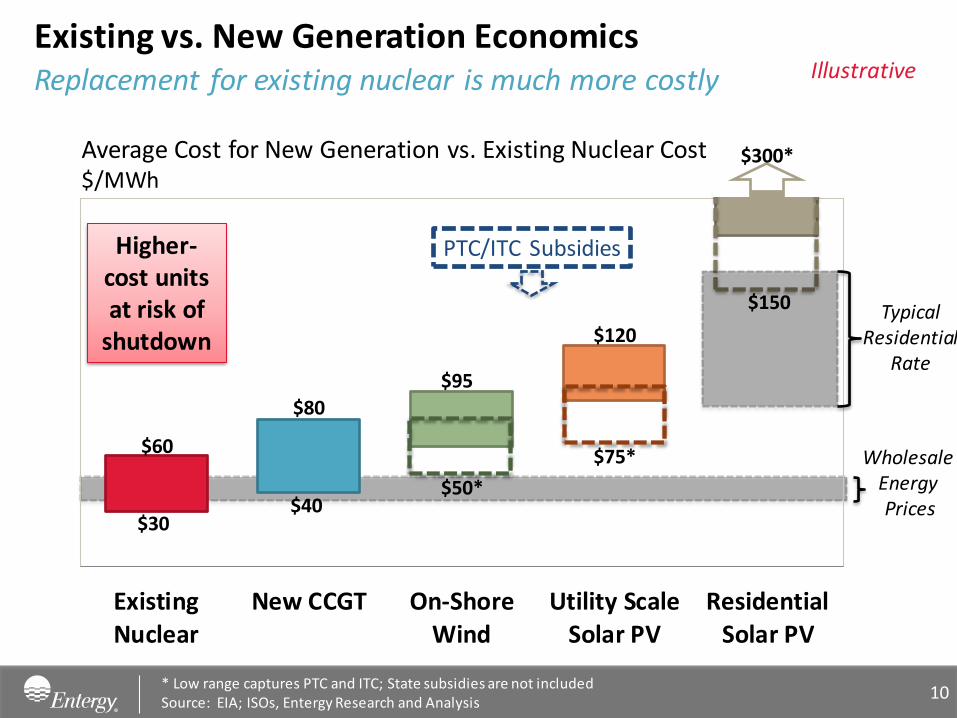
Existing vs. New Generation Economics
* Low range captures PTC and ITC; State subsidies are not included Source: EIA; ISOs, Entergy Research and Analysis
Replacement for existing nuclear is much more costly
ExistingNuclear
New CCGT On-ShoreWind
Utility ScaleSolar PV
ResidentialSolar PV
Average Cost for New Generation vs. Existing Nuclear Cost $/MWh
Higher-cost units at risk of
shutdown
Illustrative
10
Wholesale Energy Prices
PTC/ITC Subsidies
$60
$80
$95
$120 Typical
Residential Rate
$150
$30 $40
$50*
$75*
$300*
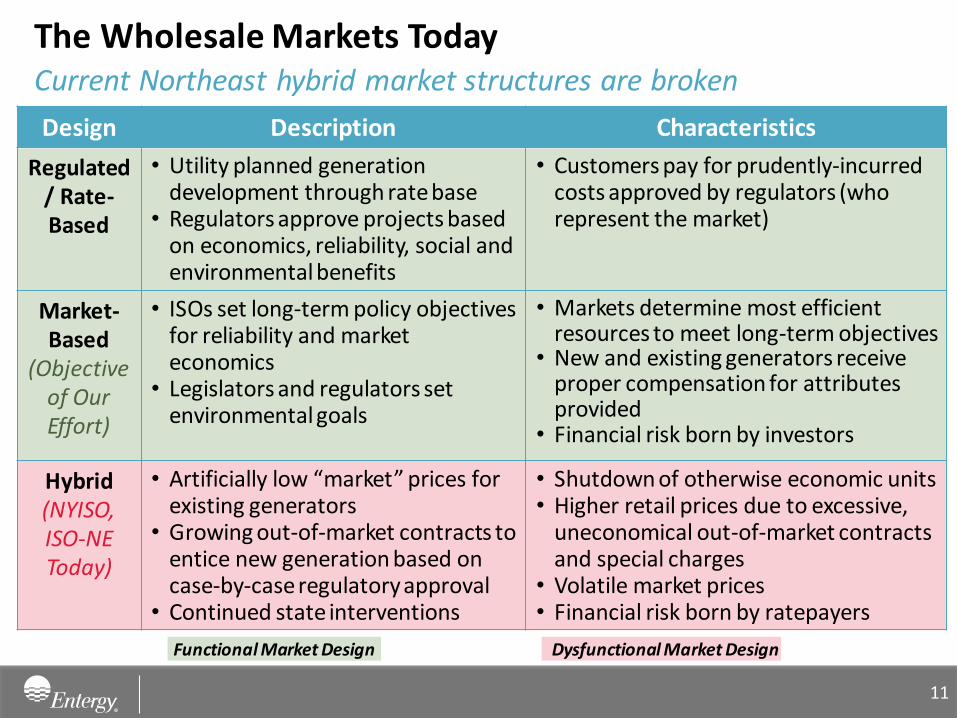
Design Description Characteristics
Regulated / Rate-Based
• Utility planned generation development through rate base
• Regulators approve projects based on economics, reliability, social and environmental benefits
• Customers pay for prudently-incurred costs approved by regulators (who represent the market)
Market-Based
(Objective of Our Effort)
• ISOs set long-term policy objectives for reliability and market economics
• Legislators and regulators set environmental goals
• Markets determine most efficient resources to meet long-term objectives
• New and existing generators receive proper compensation for attributes provided
• Financial risk born by investors
Hybrid (NYISO, ISO-NE Today)
• Artificially low “market” prices for existing generators
• Growing out-of-market contracts to entice new generation based on case-by-case regulatory approval
• Continued state interventions
• Shutdown of otherwise economic units • Higher retail prices due to excessive,
uneconomical out-of-market contracts and special charges
• Volatile market prices • Financial risk born by ratepayers
The Wholesale Markets Today Current Northeast hybrid market structures are broken
Functional Market Design Dysfunctional Market Design
11
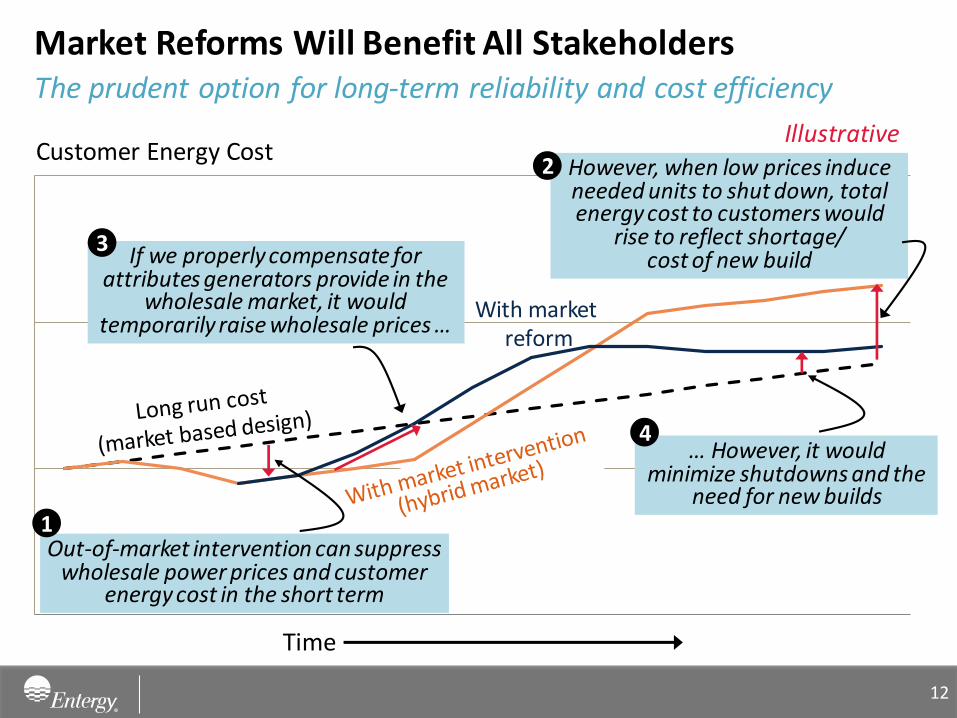
The prudent option for long-term reliability and cost efficiency
Market Reforms Will Benefit All Stakeholders
Customer Energy Cost
Time
With market reform
However, when low prices induce needed units to shut down, total energy cost to customers would
rise to reflect shortage/ cost of new build If we properly compensate for
attributes generators provide in the wholesale market, it would
temporarily raise wholesale prices …
2
… However, it would minimize shutdowns and the
need for new builds
4
3
Out-of-market intervention can suppress wholesale power prices and customer
energy cost in the short term
1
Illustrative
12
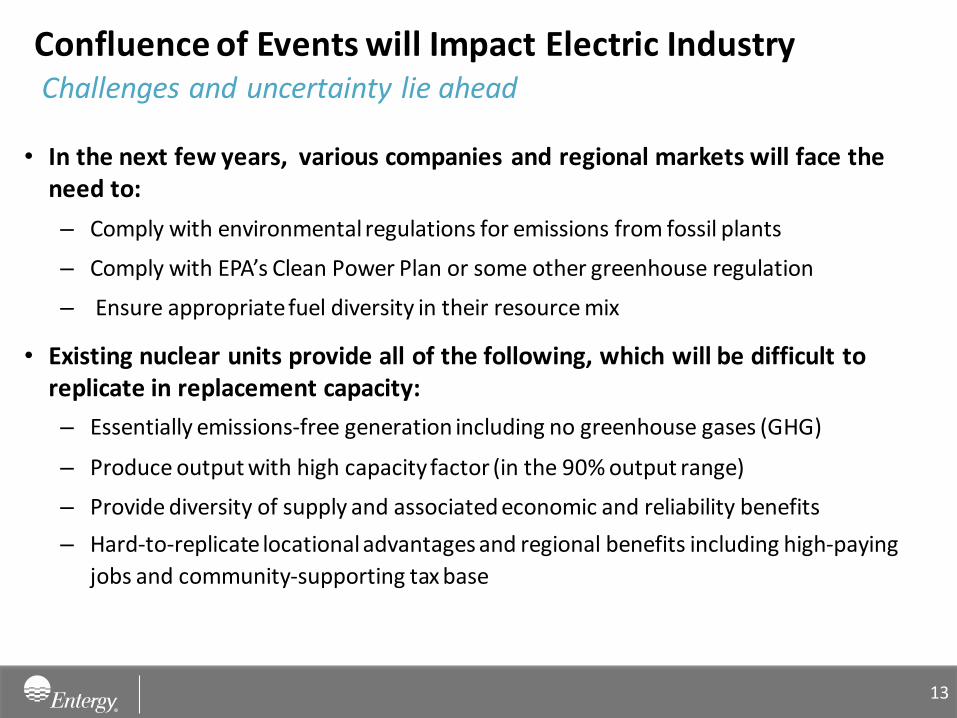
Confluence of Events will Impact Electric Industry
• In the next few years, various companies and regional markets will face the need to:
– Comply with environmental regulations for emissions from fossil plants
– Comply with EPA’s Clean Power Plan or some other greenhouse regulation
– Ensure appropriate fuel diversity in their resource mix
• Existing nuclear units provide all of the following, which will be difficult to replicate in replacement capacity:
– Essentially emissions-free generation including no greenhouse gases (GHG)
– Produce output with high capacity factor (in the 90% output range)
– Provide diversity of supply and associated economic and reliability benefits
– Hard-to-replicate locational advantages and regional benefits including high-paying
jobs and community-supporting tax base
13
Challenges and uncertainty lie ahead
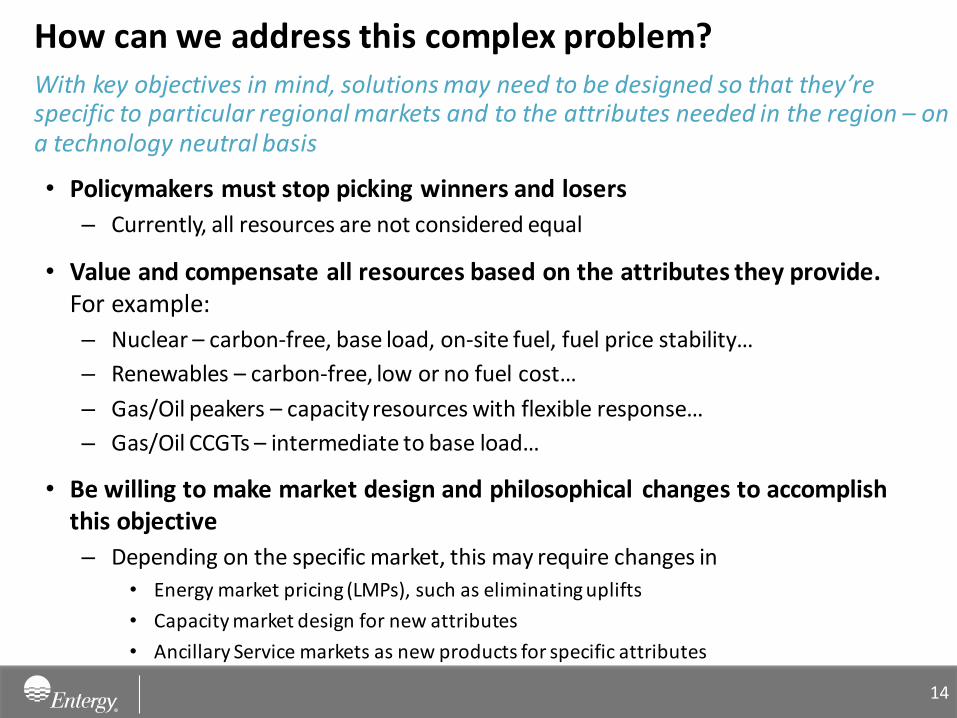
How can we address this complex problem?
• Policymakers must stop picking winners and losers
– Currently, all resources are not considered equal
• Value and compensate all resources based on the attributes they provide. For example:
– Nuclear – carbon-free, base load, on-site fuel, fuel price stability…
– Renewables – carbon-free, low or no fuel cost…
– Gas/Oil peakers – capacity resources with flexible response…
– Gas/Oil CCGTs – intermediate to base load…
• Be willing to make market design and philosophical changes to accomplish this objective
– Depending on the specific market, this may require changes in
• Energy market pricing (LMPs), such as eliminating uplifts
• Capacity market design for new attributes
• Ancillary Service markets as new products for specific attributes
With key objectives in mind, solutions may need to be designed so that they’re specific to particular regional markets and to the attributes needed in the region – on a technology neutral basis
14

Appendix
15
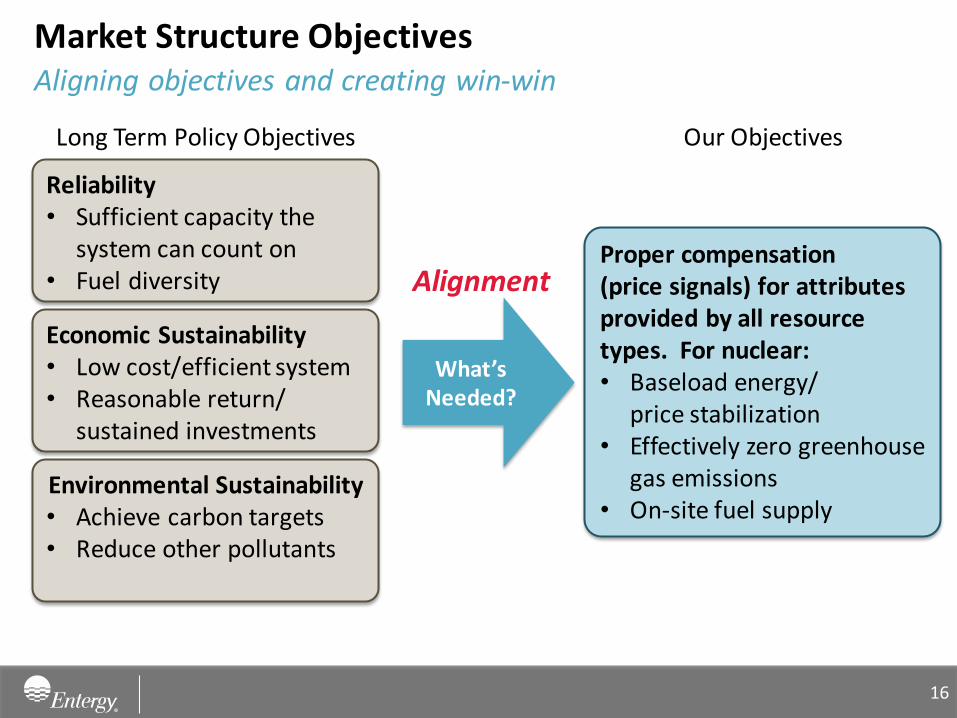
Proper compensation (price signals) for attributes provided by all resource types. For nuclear: • Baseload energy/
price stabilization • Effectively zero greenhouse
gas emissions • On-site fuel supply
Market Structure Objectives Aligning objectives and creating win-win
Long Term Policy Objectives
Reliability • Sufficient capacity the
system can count on • Fuel diversity
Economic Sustainability • Low cost/efficient system • Reasonable return/
sustained investments
Environmental Sustainability • Achieve carbon targets • Reduce other pollutants
Our Objectives
What’s Needed?
Alignment
16
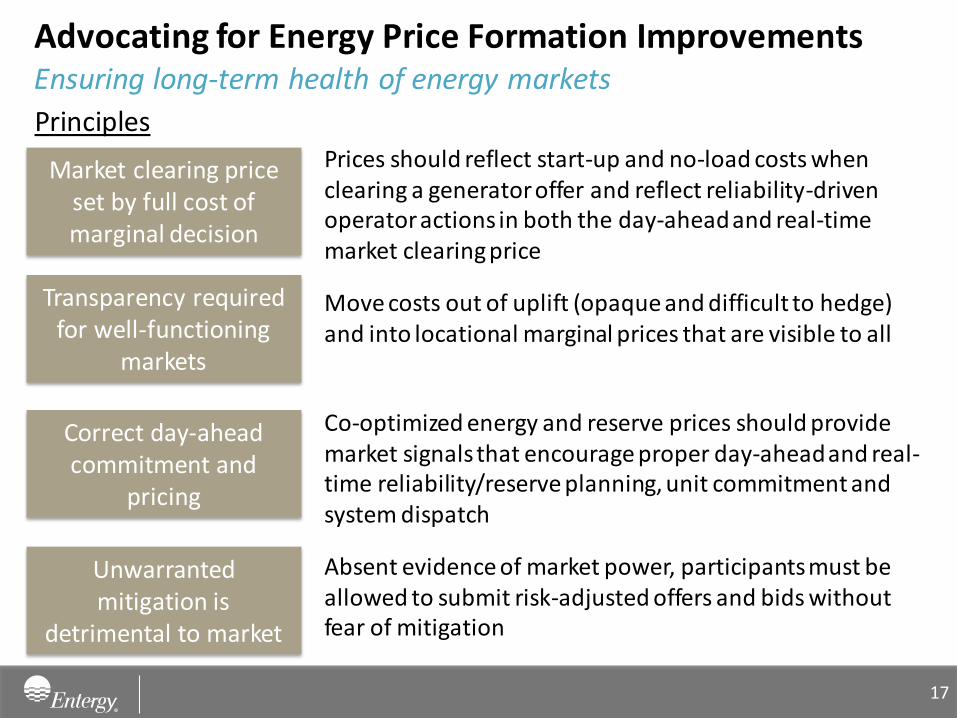
Ensuring long-term health of energy markets
Advocating for Energy Price Formation Improvements
Market clearing price set by full cost of marginal decision
Prices should reflect start-up and no-load costs when clearing a generator offer and reflect reliability-driven operator actions in both the day-ahead and real-time market clearing price
Transparency required for well-functioning
markets
Move costs out of uplift (opaque and difficult to hedge) and into locational marginal prices that are visible to all
Correct day-ahead commitment and
pricing
Co-optimized energy and reserve prices should provide market signals that encourage proper day-ahead and real- time reliability/reserve planning, unit commitment and system dispatch
Unwarranted mitigation is
detrimental to market
Absent evidence of market power, participants must be allowed to submit risk-adjusted offers and bids without fear of mitigation
Principles
17