Embed Size (px)
Citation preview
Economic Development: Global Scholars Forum
Judith I. Stallmann, ProfessorAgricultural Economics, Rural Sociology, and Public Affairs
Community Development Extension Specialist
April 12, 2006
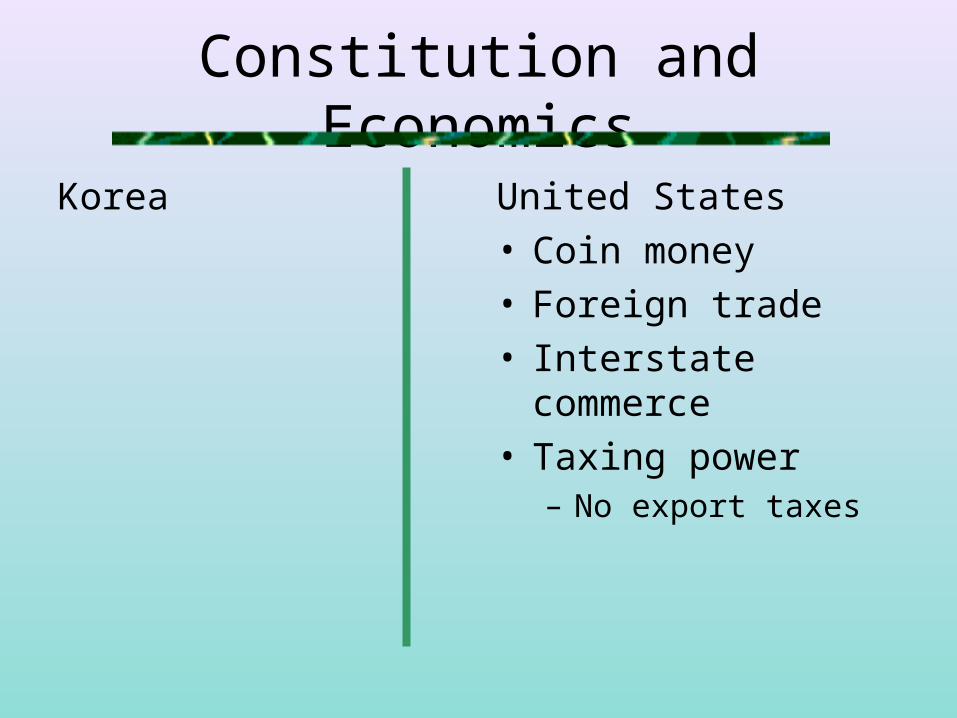
Constitution and Economics
Korea United States• Coin money• Foreign trade• Interstate commerce• Taxing power
– No export taxes
Basis of law
• If not specifically allowed by the law, it is prohibited.– For an economy, results in rigidity
• If not specifically prohibited by the law, it is allowed.– For an economy, allows flexibility
• Which do you have?
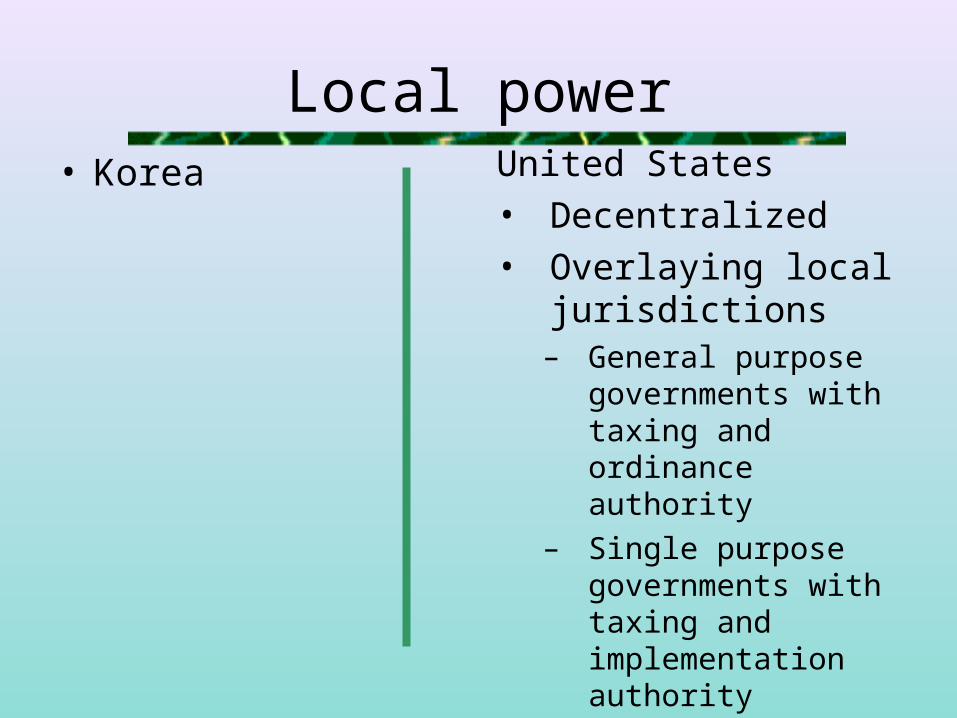
Local power• Korea United States
• Decentralized• Overlaying local
jurisdictions – General purpose
governments with taxing and ordinance authority
– Single purpose governments with taxing and implementation authority
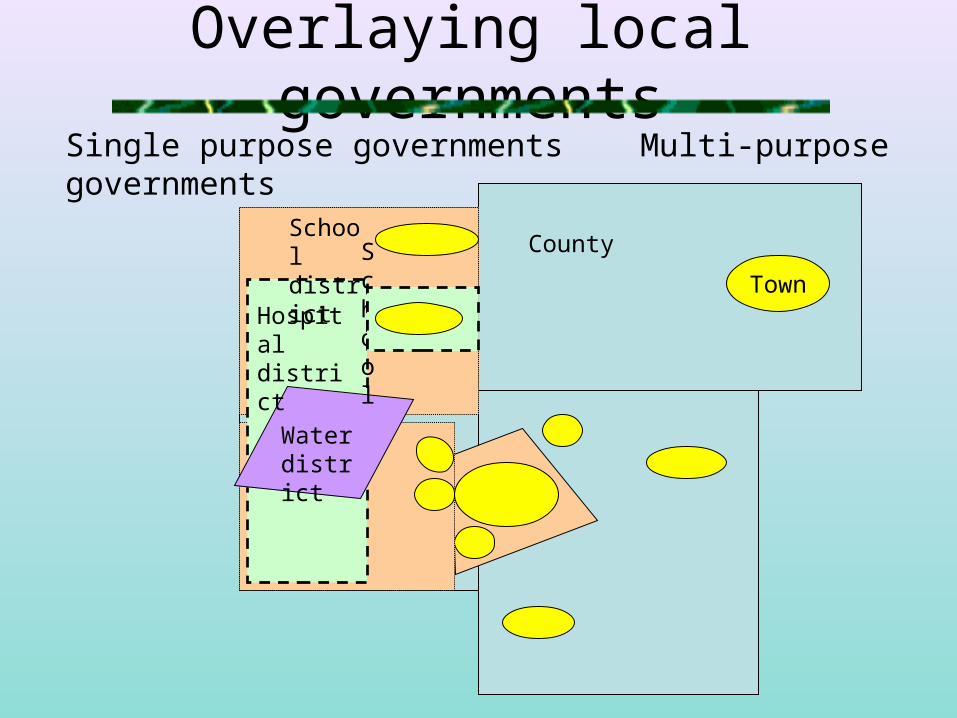
Overlaying local governmentsSingle purpose governments Multi-purpose governments
TownSchool
School district
Hospital district
Water district
County
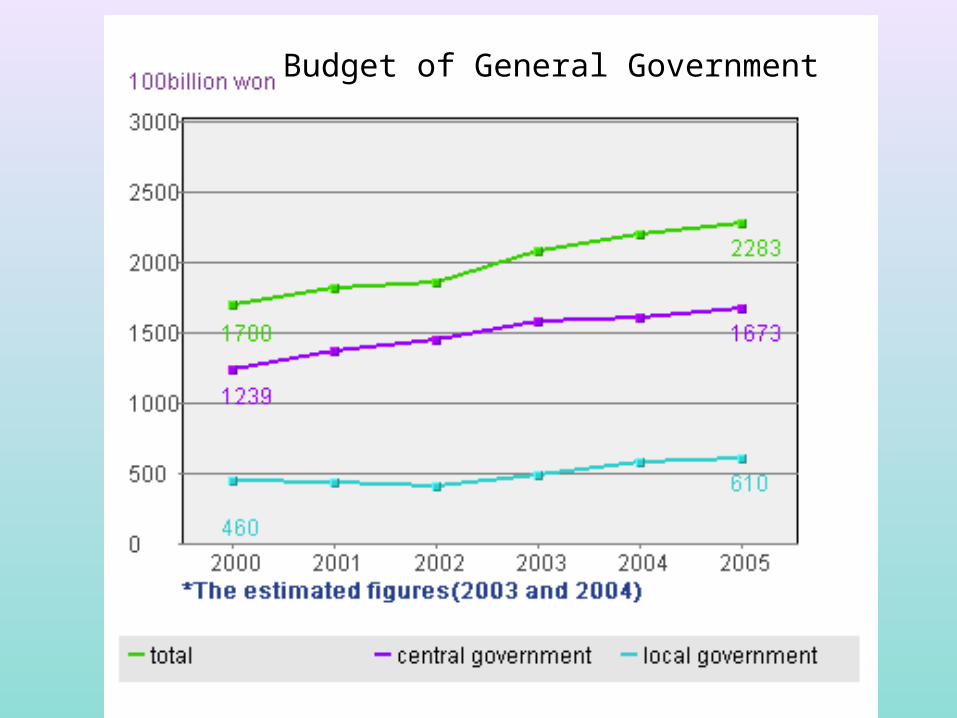
Budget of General Government
Local government
Structure of decentralized and overlaying local governments:
• Local governments have a lot of power
• Means need to collaborate and cooperate
• Means that they also compete– Often choose to compete on incentives and low
taxes– Could compete on well-run government, quality
of workforce, quality of life, business climate
Economic development
• National government determined
• Market determines
• Market with government policies and incentives– National government – Local government
Level for economic development?
• At the level of the majority of costs and benefits– Some projects have national importance
• National government giving incentives makes little economic sense unless it has an explicit regional policy
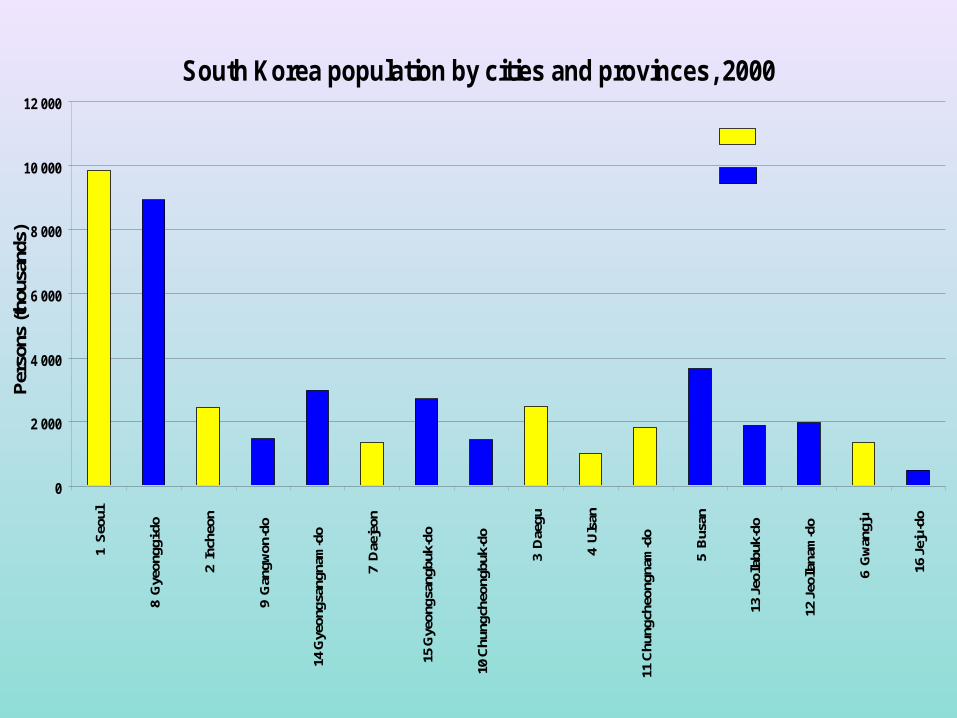
South Korea population by cities and provinces, 2000
0
2 000
4 000
6 000
8 000
10 000
12 0001
Seo
ul
8 G
yeon
ggi-d
o
2 In
cheo
n
9 G
angw
on-d
o
14 G
yeon
gsan
gnam
-do
7 D
aeje
on
15 G
yeon
gsan
gbuk
-do
10 C
hung
cheo
ngbu
k-do
3 D
aegu
4 U
lsan
11 C
hung
cheo
ngna
m-d
o
5 B
usan
13 J
eolla
buk-
do
12 J
eolla
nam
-do
6 G
wan
gju
16 J
eju-
do
Per
sons
(tho
usan
ds)
Cities
Provinces
Collaboration and cooperation
• Between governments
• With businesses
• With citizens
• With non-profit agencies
Citizen participation
Formal:• Elections• In some jurisdictions citizens can petition to
put issues on the ballot• Some laws require citizen input
– Oversight commissions– Public hearings
Informal• Local government may ask for citizen input • Citizens take an idea to local government
How to get citizens to participate
• Ask citizens for their ideas
• Work to make sure all groups are involved
• Meet where citizens are comfortable
• Have a history of using citizen input– Don’t ignore the ideas that you asked for
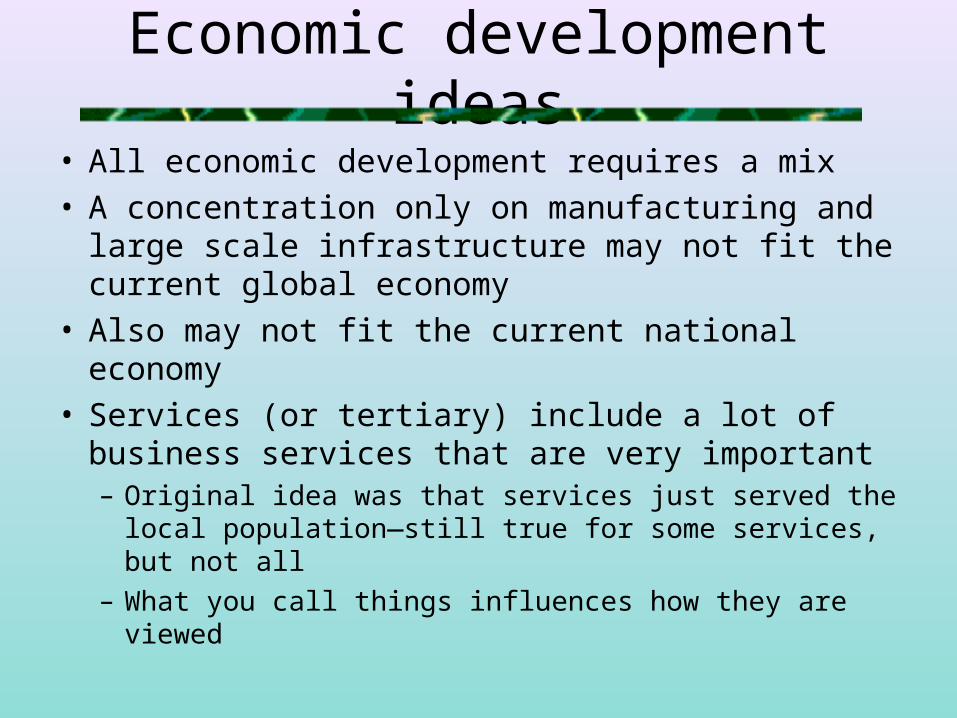
Economic development ideas
• All economic development requires a mix• A concentration only on manufacturing and large
scale infrastructure may not fit the current global economy
• Also may not fit the current national economy• Services (or tertiary) include a lot of business
services that are very important– Original idea was that services just served the local
population—still true for some services, but not all– What you call things influences how they are viewed
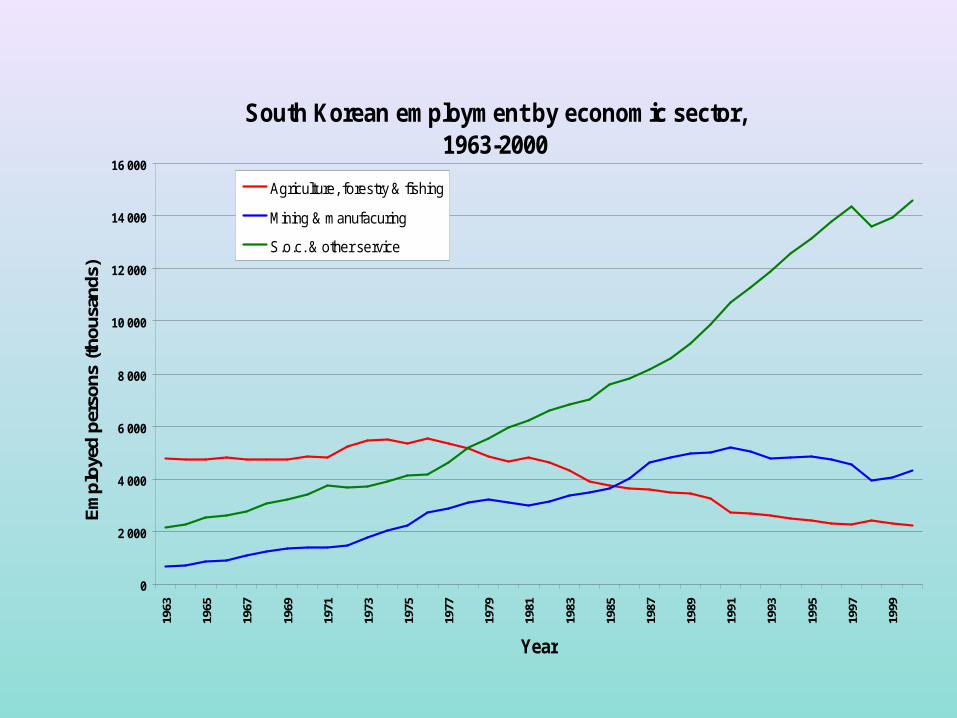
South Korean employment by economic sector, 1963-2000
0
2 000
4 000
6 000
8 000
10 000
12 000
14 000
16 00019
63
1965
1967
1969
1971
1973
1975
1977
1979
1981
1983
1985
1987
1989
1991
1993
1995
1997
1999
Year
Em
ploy
ed p
erso
ns (t
hous
ands
)
Agriculture, forestry & fishing
Mining & manufacuring
S.o.c. & other service
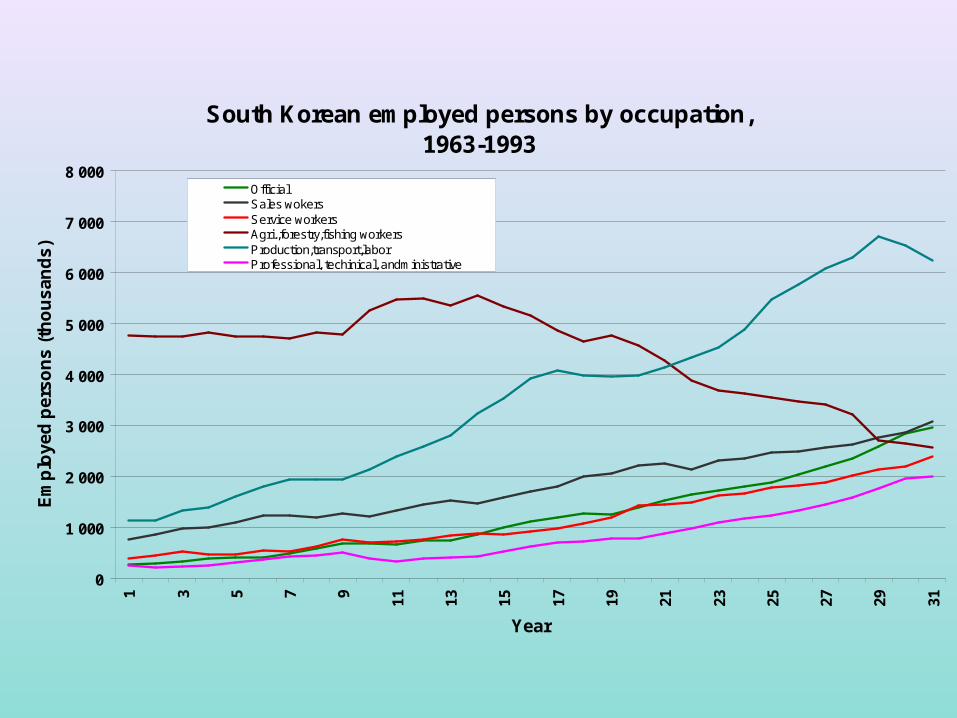
South Korean employed persons by occupation, 1963-1993
0
1 000
2 000
3 000
4 000
5 000
6 000
7 000
8 000
1 3 5 7 9 11 13 15 17 19 21 23 25 27 29 31
Year
Em
plo
ye
d p
ers
on
s (
tho
us
an
ds
)
OfficialSales wokersService workersAgri.,forestry,fishing workersProduction,transport,laborProfessional, techinical, andministrative
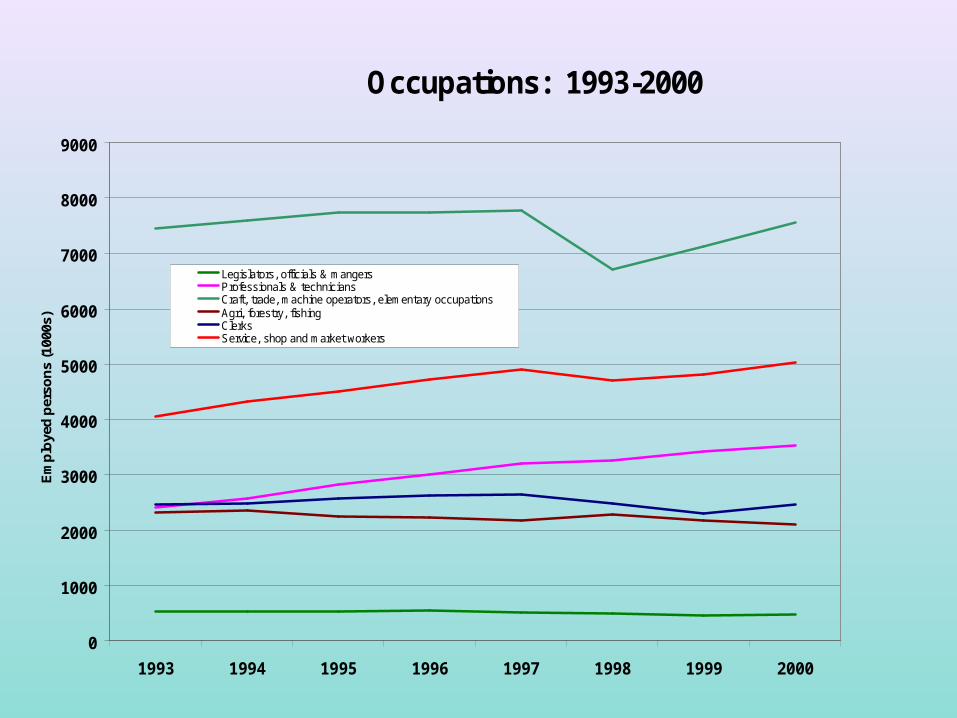
Occupations: 1993-2000
0
1000
2000
3000
4000
5000
6000
7000
8000
9000
1993 1994 1995 1996 1997 1998 1999 2000
Em
plo
yed
per
son
s (1
000s
)
Legislators, officials & mangersProfessionals & techniciansCraft, trade, machine operators, elementary occupationsAgri, forestry, fishingClerksService, shop and market workers
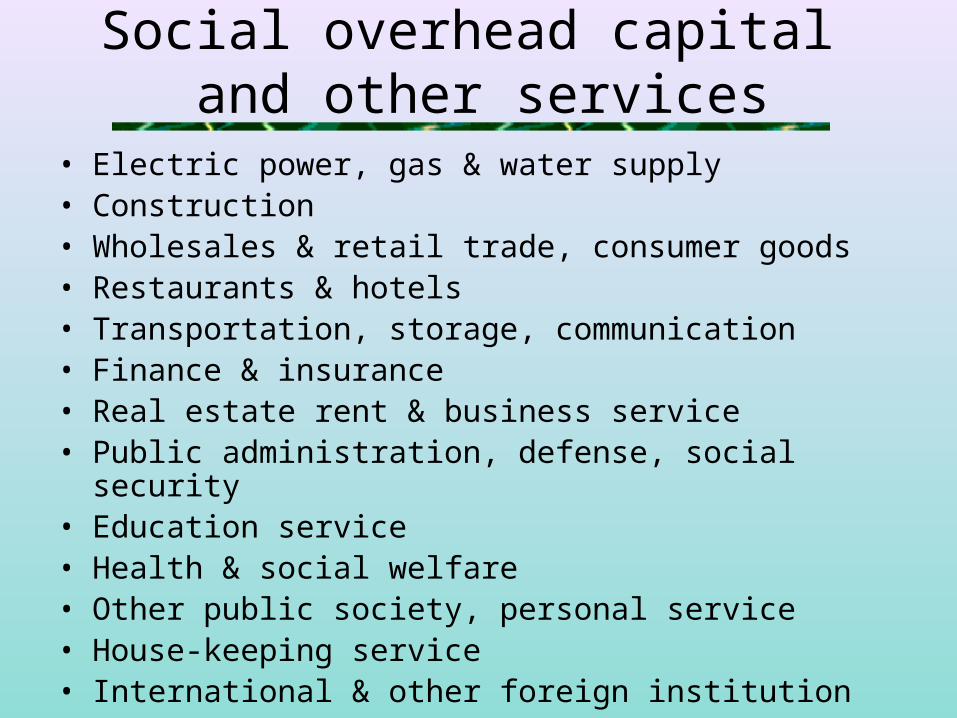
• Electric power, gas & water supply• Construction• Wholesales & retail trade, consumer goods• Restaurants & hotels• Transportation, storage, communication• Finance & insurance• Real estate rent & business service• Public administration, defense, social security• Education service• Health & social welfare• Other public society, personal service• House-keeping service• International & other foreign institution
Social overhead capital and other services
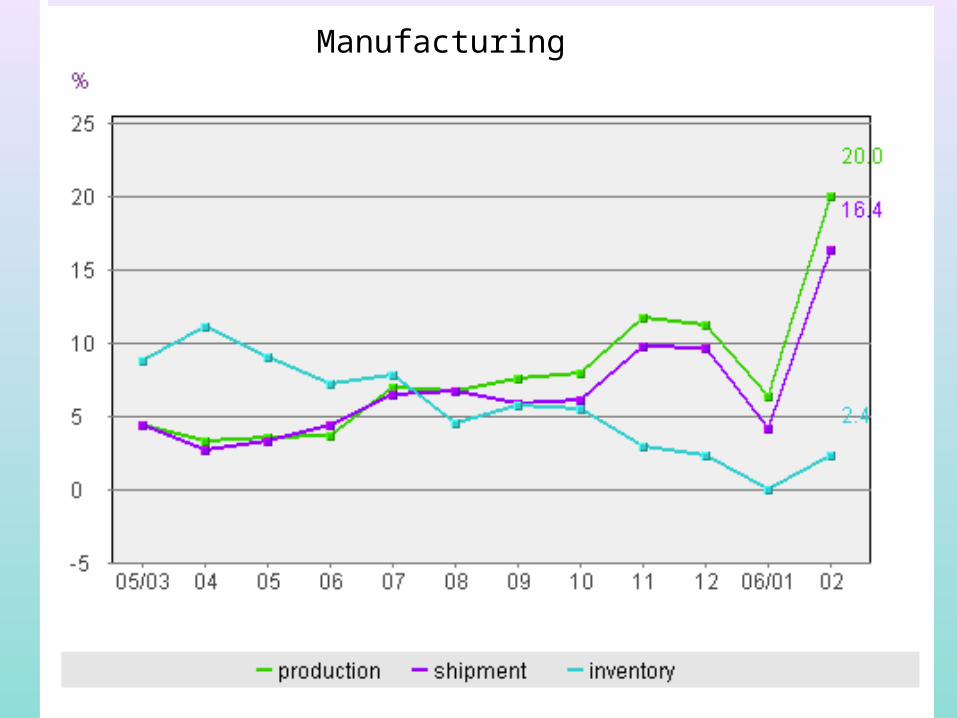
Manufacturing
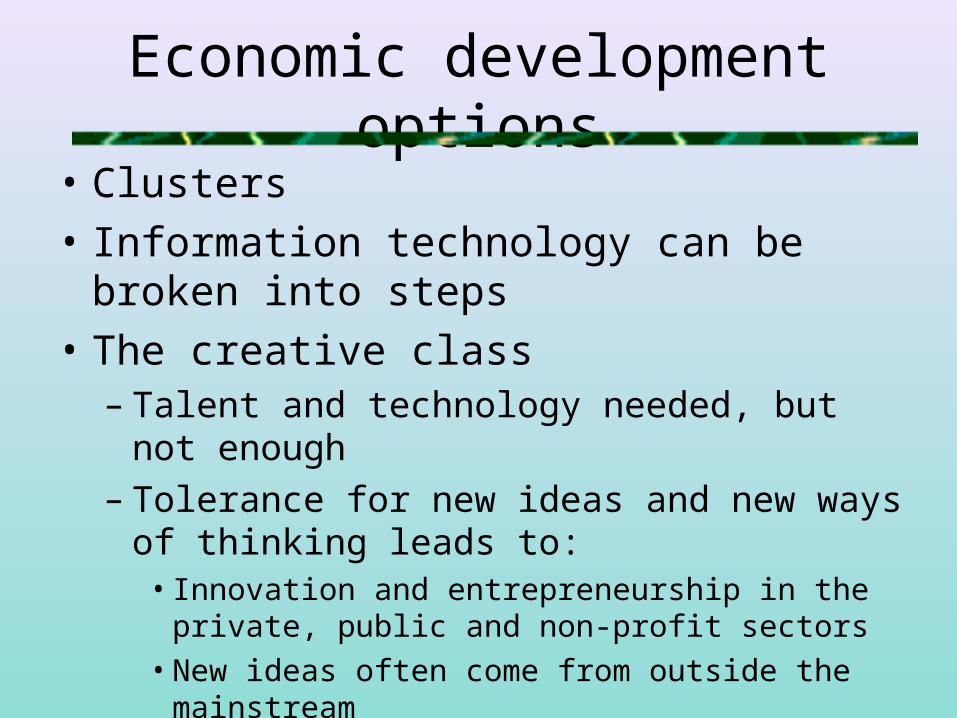
Economic development options
• Clusters
• Information technology can be broken into steps
• The creative class– Talent and technology needed, but not enough– Tolerance for new ideas and new ways of
thinking leads to:• Innovation and entrepreneurship in the private,
public and non-profit sectors• New ideas often come from outside the mainstream
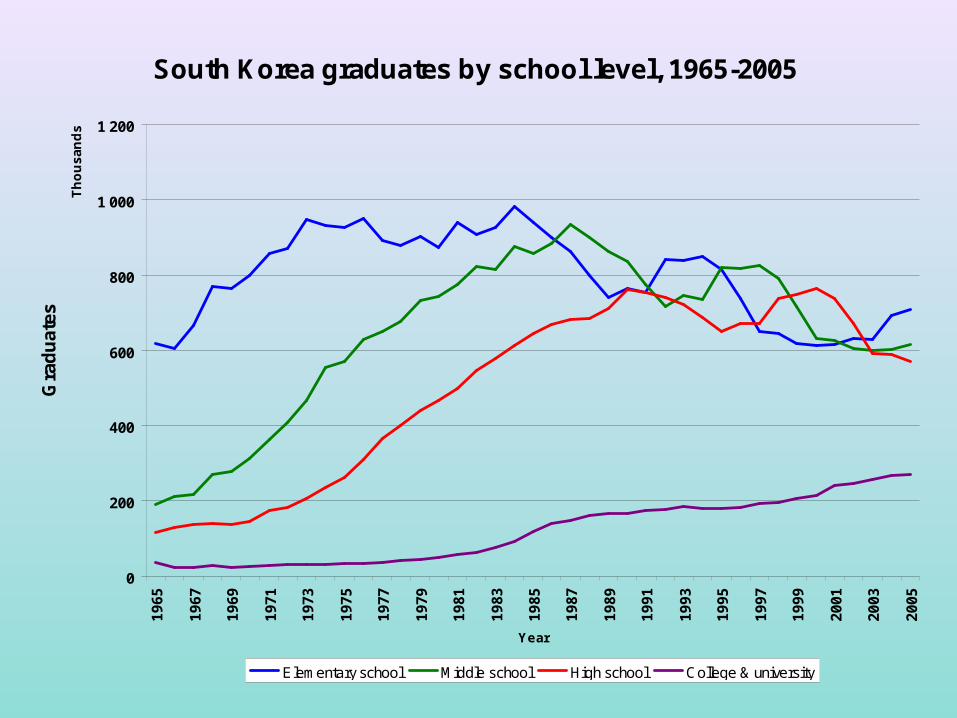
South Korea graduates by school level, 1965-2005
0
200
400
600
800
1 000
1 200
19
65
19
67
19
69
19
71
19
73
19
75
19
77
19
79
19
81
19
83
19
85
19
87
19
89
19
91
19
93
19
95
19
97
19
99
20
01
20
03
20
05
Th
ou
sa
nd
s
Year
Gra
du
ates
Elementary school Middle school High school College & university
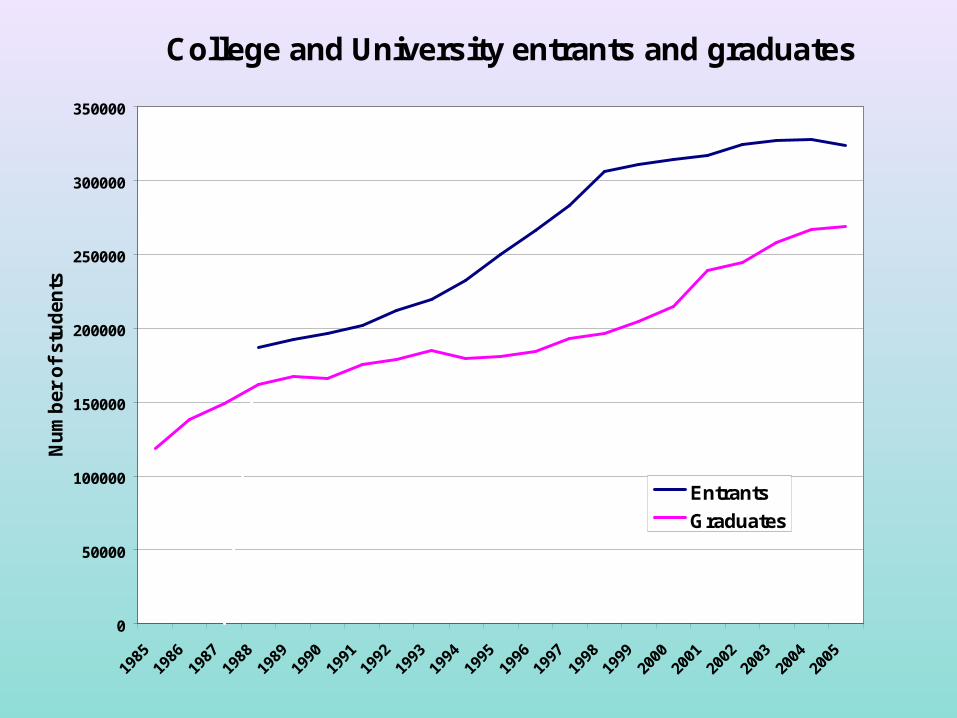
College and University entrants and graduates
0
50000
100000
150000
200000
250000
300000
350000
1985
1986
1987
1988
1989
1990
1991
1992
1993
1994
1995
1996
1997
1998
1999
2000
2001
2002
2003
2004
2005
Nu
mb
er o
f st
ud
ents
Entrants
Graduates
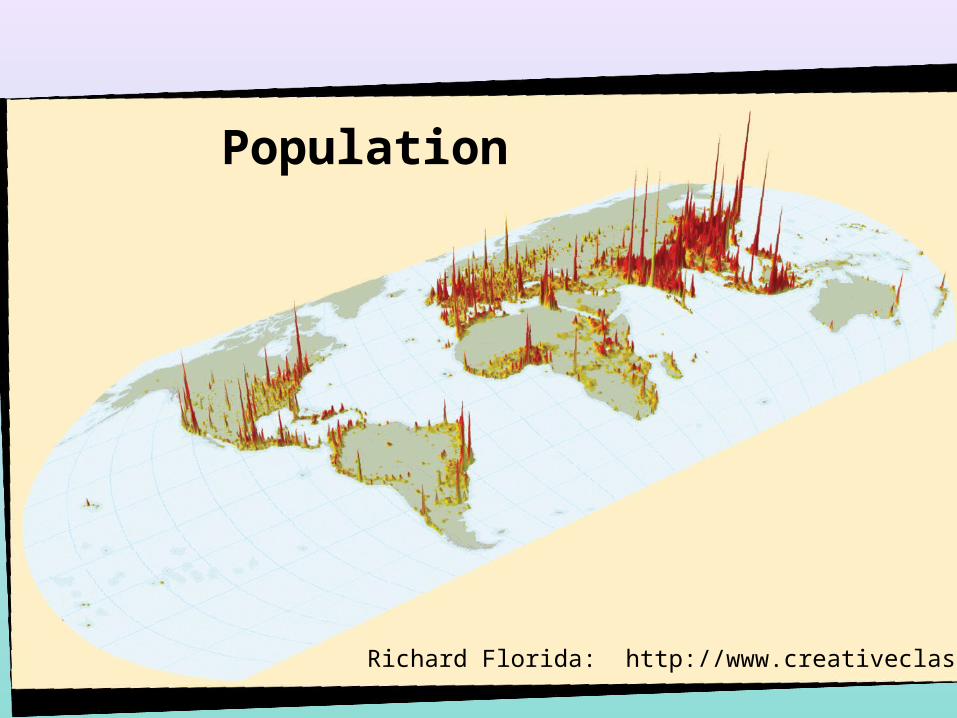
Population
Richard Florida: http://www.creativeclass.org/
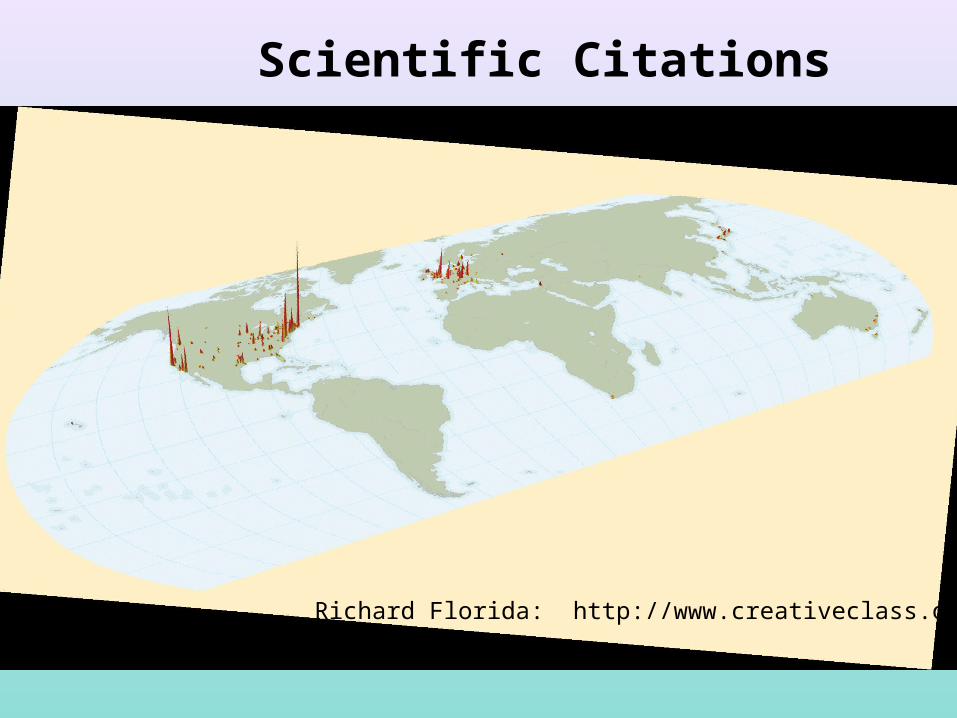
Scientific Citations
Richard Florida: http://www.creativeclass.org/
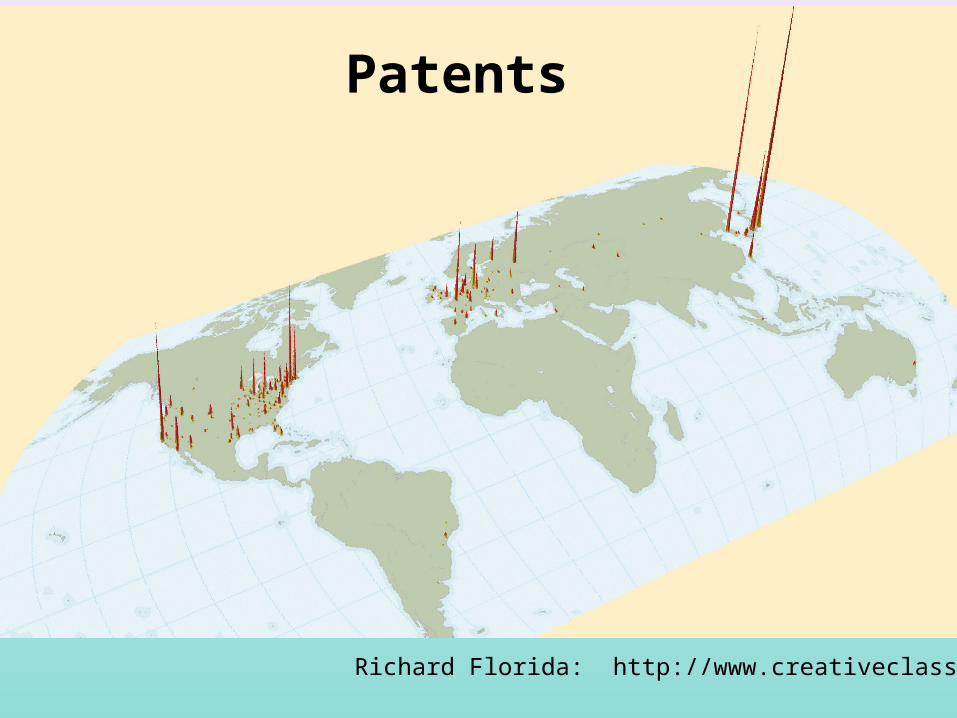
Patents
Richard Florida: http://www.creativeclass.org/

Some questions that were asked
Is political ideology related to type of industry?
A conservative city tried fashion and video and it didn’t work
What attracts creative class?
• Quality of life in area
• Other talent in the area– Clusters are built on this
• Tolerance in the area
Tourism: An island with international tourism, is looking
at manufacturing because tourism is too cyclical
• Transportation costs
• National tourism potential?– Mexico has done this
• Tourism areas have a high quality of life, which attracts the creative class– What options exist?
Everyone is talking about biotechnology
Still new but will be as diverse as manufacturing is:
• Algae producing hydrogen for fuel
• Bacteria cleaning up oil spills
• Plants producing plastic or pharmaceuticals
• DNA computers
• Gene therapy
• Nano-biotechnology for medicine
Everyone is talking about IT
• Everything that we do relies on it
• Friedman, “The World is Flat,” talks about breaking down the IT steps
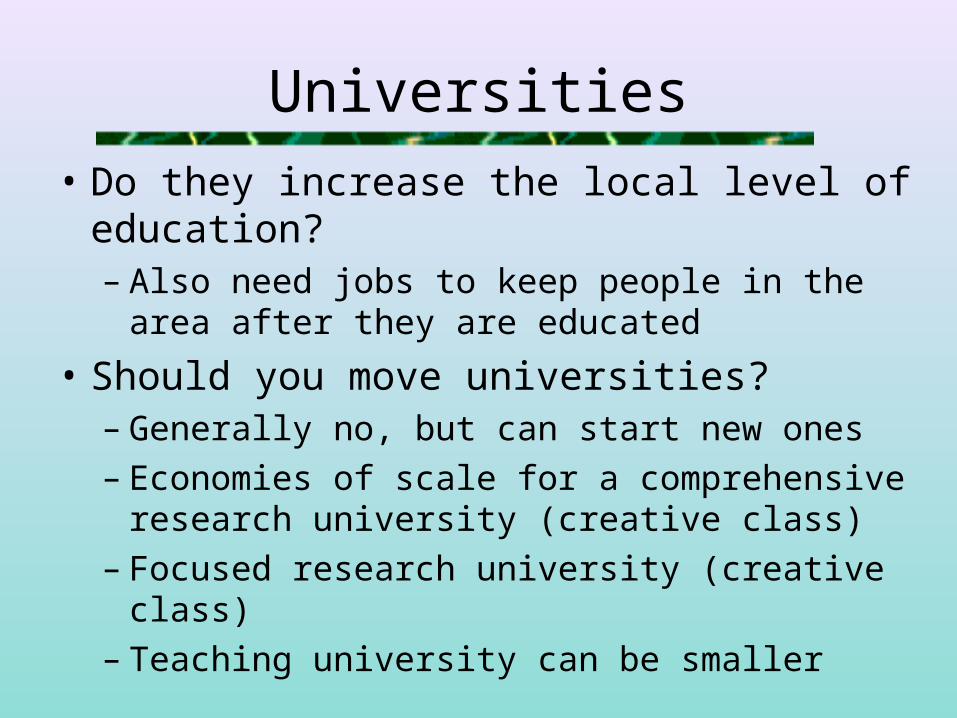
Universities
• Do they increase the local level of education?– Also need jobs to keep people in the area after
they are educated
• Should you move universities?– Generally no, but can start new ones– Economies of scale for a comprehensive
research university (creative class)– Focused research university (creative class)– Teaching university can be smaller
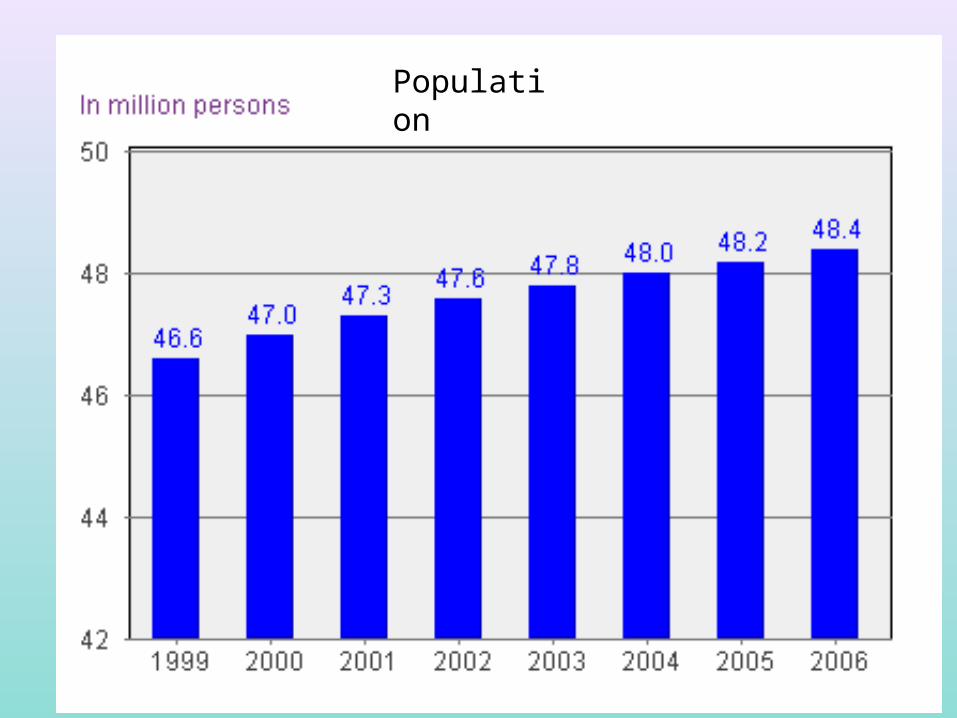
Population
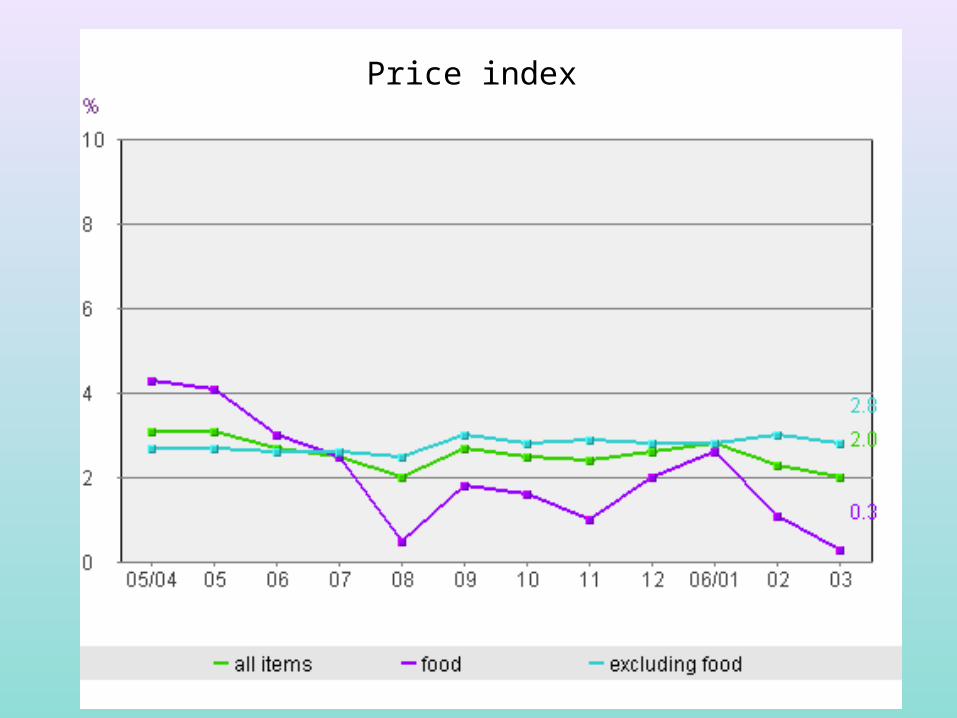
Price index
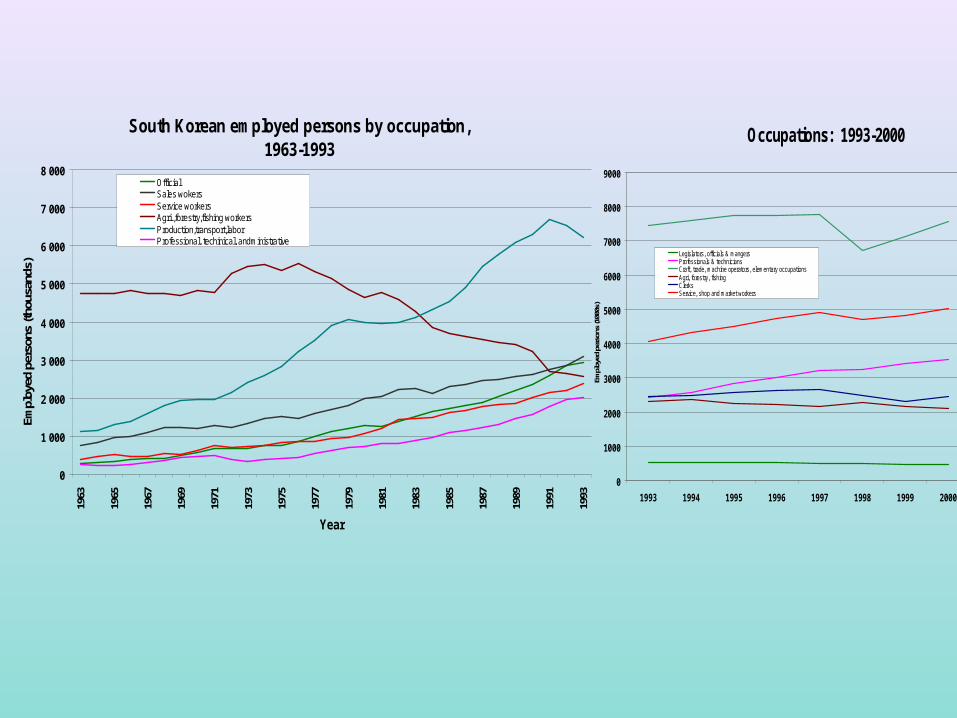
South Korean employed persons by occupation, 1963-1993
0
1 000
2 000
3 000
4 000
5 000
6 000
7 000
8 000
1963
1965
1967
1969
1971
1973
1975
1977
1979
1981
1983
1985
1987
1989
1991
1993
Year
Empl
oyed
per
sons
(tho
usan
ds)
OfficialSales wokersService workersAgri.,forestry,fishing workersProduction,transport,laborProfessional, techinical, andministrative
Occupations: 1993-2000
0
1000
2000
3000
4000
5000
6000
7000
8000
9000
1993 1994 1995 1996 1997 1998 1999 2000
Empl
oyed
per
sons
(100
0s)
Legislators, officials & mangersProfessionals & techniciansCraft, trade, machine operators, elementary occupationsAgri, forestry, fishingClerksService, shop and market workers