Embed Size (px)
Citation preview

1
ECONOMIC EVALUATION OF ENERGY SAVING MEASURES IN A COMMON
TYPE OF GREEK BUILDING
Yiannis Nikolaidis , Petros A. Pilavachi , *, Alexandros Chletsis
Department of Mechanical Engineering
University of Western Macedonia, 50100 - Kozani, Greece
Department of Technology Management
University of Macedonia, 59200 - Naousa, Greece
ABSTRACT
This paper deals with the economic analysis and evaluation of various energy saving measures in
the building sector, focusing on a domestic detached house in Greece, i.e. in a typical Mediterranean
climate. In order to detect the energy saving measures that, in addition to energy benefits, can also
provide economic profits, the study examines the following measures: all kinds of insulation;
upgrading of the heating system; use of thermal solar systems; upgrading of lighting; upgrading of
electric appliances; upgrading of the cooling system. The economic evaluation methods used for
ranking the energy saving measures are the Net Present Value, the Internal Rate of Return, the Savings
to Investment Ratio and the Depreciated Payback Period. It has been found that amongst the most
effective energy saving methods are the upgrading of lighting, the insulation of the roof of the building
and the installation of an automatic temperature control system.
Key words: Detached house; Energy saving measures; Economic evaluation; Ranking of measures;
Greece
* Corresponding author. tel: +30–24610–56640, fax: +30–24610–56641.
E-mail address: [email protected]

2
1. INTRODUCTION
One of the most important problems which global community has to face is the increasing rate in
the destruction of the environment, which unfortunately has reached a critical point nowadays. At the
same time, decrease in fossil fuels results in a considerable increase in the price of oil and its
derivatives. Moreover, the growing concern for the safe transportation of fossil fuels as well as the
increase in energy demand reinforce the scaling-up of oil prices, leading almost every day to
historically high levels. In Figure 1, the fluctuation of crude oil prices in the last few years is
presented.
Τhe rising price of oil, the excessive use of energy resources and the continuous decrease of
reserves of fossil fuels render imperative the need to consider ways for energy saving in the industrial,
transport and building sectors. Regarding the energy saving in the building sector, there is an ongoing
discussion in Greece on the Directive 2002/91, whose objective is to promote the improvement of the
energy performance of buildings within the EU, taking into account outdoor climatic and local
conditions, as well as indoor climate requirements and cost-effectiveness. Moreover, the feasibility of
renovation measures is also considered.
During the last 30 years, there have been a number of publications, concerning energy
conservation measures in various types of building. A small part of these publications examine the
economic dimension of energy saving measures. Freund [1] was amongst the first who addressed the
cost-effectiveness of energy saving measures in buildings and provided examples for buildings in the
United Kingdom. He mentioned that these measures can be regarded as investments, which should be
evaluated using some general indicators of cost-effectiveness. He proposed the internal rate of return
and produced a ranking by cost-effectiveness of all the measures considered.
Kellow [2] presented Kuwait’s approach and experience in the development, introduction and
implementation of energy-conservation standards in buildings. Although Kuwait is rich in energy
resources, a review of the growth in energy consumption revealed the need for energy conservation,
particularly in the building sector. The Ministry of Electricity and Water of Kuwait responded by
introducing guidelines and a set of regulations and mandatory standards for energy conservation in

3
buildings. Kellow presented the potential energy as well as economic savings of their implementation.
Borsch-Laaks and Pohlmann [3] examined the parameters for an environmentally concerned house
building practice. They developed a building system and philosophy for economic and ecological low-
energy houses. The primary energy requirement of their “Triple-E-house” was only 40% of a typical
German low-energy house, which only takes into account the reduction of the rate of space heating per
floor area.
Balaras et al. [4] investigated the potential for energy conservation in apartment buildings, in three
climatic zones of Greece. They followed the “EPIQR” methodology and used the respective software,
which includes several modules that perform energy related calculations in order to provide the user
with an initial assessment of energy consumption and savings obtained from various retrofit actions.
The proposed actions concentrated on space heating and cooling, domestic hot water production and
lighting.
Omer et al. [5] presented the monitoring of photovoltaic (PV) systems in two buildings at the
University of Nottingham. They concluded that PV systems were not cost effective. On the contrary, a
few years later Eiffert [6] showed the effectiveness of building-integrated PV (BIPV) systems, after
having identified their economic parameters. He claimed that for designing and sizing BIPV systems,
either Net Present Value or Life Cycle Cost are recommended, even if, in general, all investment
methods can be used to evaluate BIPV economics.
Papadopoulos et al. [7] examined the renovation of existing buildings for the reduction of energy
consumption and the improvement of environmental conditions in urban areas. They mentioned that,
due to low energy prices in the last 15 years and as energy saving measures demand capital-intensive
investments, small progress was noticed in the direction of applying energy saving measures. They
determined the potential of a few energy saving renovation measures (regarding central heating
systems and the buildings’ shell insulation) in a sample of buildings and evaluated the feasibility of
these measures.
An energy audit in a typical military campus was conducted by Stavropoulos and Skodras [8] in
order to evaluate energy saving possibilities in such facilities. For each measure the cost of investment
was provided together with the economic evaluation, while audit results and recommendations lead to
4
a series of proposals for energy saving measures.
Motivated by the worldwide requirement for substantial further reduction in gas emissions, Ecofys
for EURIMA [9] examined the economics of suitable measures for the building sector. They found
that most measures that reduce energy consumption can be carried out in a cost-effective way,
particularly in warm and moderate climatic zones.
Georgopoulou et al. [10] analysed the economic attractiveness of potential emission reduction
measures in the Greek building sector, adopting the end-user’s point of view. They proposed a
methodological framework, which incorporates crucial parameters such as local climate, use and age
of buildings, etc. that affect the potential energy conservation and consequently the economic
performance of available measures. They evaluated the various emission reduction measures using
Cost-Effectiveness Analysis, which is a special type of Cost-Benefit Analysis.
Ouyang et al. [11] use an urban existing residential building in China and analyze the economic
benefits of certain energy-saving renovation measures through the simplified Life Cycle Cost method.
Their study is based on the energy-saving effects of those measures calculated by thermal simulation,
which they finally revised by applying the actual heating and cooling loads of the subject building.
Of course, if the study is not limited to the economic evaluation of energy saving measures, but is
broadened into any type of evaluation, then a lot more studies that have been conducted for the
evaluation of the energy saving potential in the building sector will be found. An indicative list of
recent studies consists of Blok [12], Lin and Wang [13], Kaklauskas et al. [14], Sjögren et al. [15],
Yilmaz [16], Doukas et al. [17] and Ginevičius et al. [18].
The objective and at the same time the contribution of this paper is to propose a variety of energy
saving measures in an existing building with specific construction and energy characteristics, the type
of which is frequent not only in the Greek countryside but also in city suburbs, and then to study their
economic viability conducting an in-depth economic analysis. The aim is to classify the various
interventions according to their significance and to identify those which, except for the energy profit,
could also offer economic benefits. It should be noted that all prices mentioned and used at the present
evaluation, are prices of 2005.
The characteristics of the reference building and the energy saving measures that were examined

5
are presented in Section 2. A brief presentation of the evaluation methods is given in Section 3. In
Section 4, the results of the numerical investigation are analysed and, finally, the main conclusions are
presented.
2. EXAMINED ENERGY SAVING MEASURES
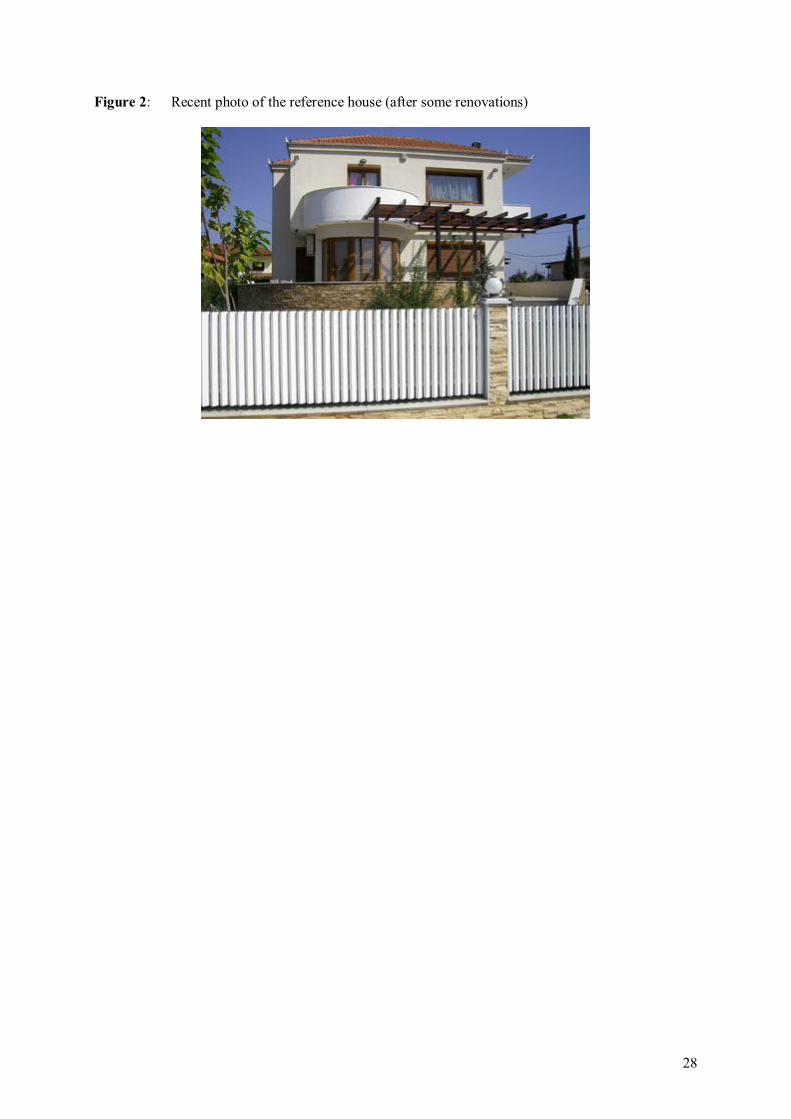
This paper focuses on a detached house in Central Greece, in the town of Larissa, which can be
considered as a widely met type of building especially in Greek provincial regions (Figure 2). The
reference house has a liveable surface area of 100 m2 and a pilotis, i.e. a roofed surface, which is
typically used for car parking. As far as the heating equipment is concerned, the reference house is
heated with a 20-year-old oil burner - boiler, which consumes roughly 1 m3 of oil/yr, while an electric
water heater is used to cover the need for hot water. In addition, all lamps are incandescent, while
electric appliances and the air- conditioning system are of an old technology (more than 10 years old).
Since the building is relatively old, it has no insulation (the U value of the building’s envelope is about
2.3 W/m2 oC). It also has single glazing windows and doorframes (the respective U value is about 5.6
W/m2 oC).
Although the examined building can not be considered to be a typical Greek building -
Papadopoulos et al. [19] as well as Papadopoulos et al. [20] describe the typical residential building in
Greece - some of its characteristics coincide with the main characteristics of the latter: it is built above
a pilotis, it is a detached building and its surface is approximately 100 m2. Moreover, detached houses
in Greece constitute about 30% of the entire houses’ stock and the overwhelming majority of houses in
the Greek provinces [21]. Consequently, considering the applicability of the examined energy saving
measures one can easily see the great effectiveness of a potential large - scale application of those
measures.
The energy saving measures that have been studied could be easily applied to the reference house,
while the biggest possible energy savings could be obtained, in the most economic way. These
measures are divided into five categories. Specifically:
Energy savings with insulation. Here, it is attempted to limit the negative effects of the external
environment in the desirable internal microclimate of a building with as much as possible rational
6
use of thermal or electric energy sources.
Energy savings via upgrading of heating systems. The existing burner and/or the oil boiler are
replaced with new, more economical and environmental friendly burner and/or boiler of natural
gas (NG). Furthermore, the potential use of automatic temperature control systems ensures higher
fuel savings.
Energy savings with the use of thermal solar systems and more specifically solar heaters. This is
considered to be the most economic energy saving solution in Greece since, as a Mediterranean
country, it has the privilege of sunshine almost all year round.
Energy savings from upgrading of lighting and electric home appliances. In this case, the old-
technology incandescent lamps are replaced with low energy (fluorescence) lamps. In addition, the
old electric appliances are upgraded with new, energy efficient ones, according to the European
Council Directive 92/75/EEC [22].
Energy savings from upgrading the cooling system. Here, the old air-conditioning system is
replaced by a new one of recent technology, ranked in category A, which is more effective,
economical and environmental friendly.
At this point, it is worth making the following remarks regarding energy saving in buildings:
Nowadays, the price of electricity produced by PV cells is five times higher than the price of
electricity from the grid. However, progress in PV systems has started to limit this difference. If
environmental benefits are also considered, e.g. the reduction by 1 kWh saves 1.12 kg of CO2
emissions, then the specific investment will soon be worth considering.
It is remarkable that the behaviour of the residents of buildings differentiates positively or
negatively the thermal behaviour of buildings and, consequently, the evaluation of energy saving
measures. For instance, the potential demands of residents for excessively increased internal
temperature or a thoughtless ventilation of rooms can lead to an unreasonable increase of heating
expenses. On the other hand, reduction of the required room temperature or of the frequency of
ventilation, beyond acceptable thermal limits or limits of hygiene, even if it leads to energy
saving, degrades the quality of life in buildings. Normally, the conditions of thermal comfort and
7
hygiene should not become unfavourable. Perhaps someone should only proceed in such energy
reductions in periods of intensive energy crisis and after having exhausted all other energy saving
methods.
2.1. Energy savings with insulation
The types of insulation examined in this paper are for a) the external walls, b) the pilotis and c) the
roof. The replacement of the single glazing windows and doorframes with double glazing ones (that
have a U value of about 2.8 W/m2 oC) has also been examined. Table 1 presents the costs and the
benefits that result from the implementation of various insulation measures. For the insulation of
external walls it is necessary to cover all four sides of the reference house, namely a total area of 4x30
m2 = 120 m2. The replacement of windows and doorframes in a building such as the reference house
includes the front door, three large French windows and three windows.
Regarding the insulation - of the external walls as well as the pilotis and the roof - a novel
approach, whose application started in Greece after 2004, has also been considered. This insulation
policy which is nowadays very popular for the application of additional thermal insulation to existing
buildings’ envelopes, is based on extruded polystyrene and is described in detail by Theodosiou and
Papadopoulos [23].
An oil burner - boiler is used for heating the reference house and the energy savings are from the
oil consumed. Considering the calorific value of oil (4.29.1010 J/m3) and the annual quantity of fuel
consumed (1 m3/yr), 11,920 kWh/yr are required for heating the reference house. Taking into account
the energy savings that result from insulation (Table 1) and the average price of electricity
(approximately 0.1 €/kWh), the benefit of energy saving interventions is also presented in Table 1.
2.2. Energy savings via upgrading of heating systems
Upgrading heating systems is achieved by using more economic and simultaneously
environmental friendly fuels (for example NG), or by using an automatic temperature control system,
to regulate the temperature of rooms.
The costs and the benefit obtained from various measures of upgrading heating systems are given

8
in Table 2. If the heating systems are used exclusively for heating, it is best to replace the oil burner
only with a NG burner, and not to replace simultaneously the oil boiler with a NG boiler. The cost of
this type of upgrading includes the cost of a) the NG burner, b) the materials of internal installation
(e.g. pipes, hinges from the meter till the burner, etc.), c) the connection of the building with the NG
network, d) the guarantee and e) the monthly fixed charge. According to two Greek gas supply
companies (GSCs), namely “Gas Supply Company of Thessaly” [24] and “Attiki Gas Supply
Company” [25], if the oil burner is replaced with a NG one, in any building that is similar to the
reference house, energy savings of 94 €/yr are achieved.
However, if the heating systems are used both for heating and for hot water production, it is
advisable to replace both the oil burner and the boiler with NG ones. The respective cost includes all
costs mentioned before and in addition the cost of purchasing and installing the NG boiler. According
to the aforementioned GSCs, for a detached house such as the one examined in the present study,
which additionally uses electricity for its needs for hot water, the energy requirements are
approximately 2,000 kWh/yr, while the total of energy savings due to the use of NG equipment is
estimated to 213 €/yr.
In the most complex case, where NG is used not only for heating and hot water production, but
also for cooking, apart from the already mentioned replacement of the oil equipment, it is also
necessary to replace the electric cooker with a NG one. The additional cost in the case of this
particular upgrading is for the cost of purchasing a NG cooker. From the same GSCs, for a building
such as the reference house, the energy needs of its electric cooker are 2,000 kWh/yr, while the total
savings are 388 €/yr.
Note that in the last two choices of upgrading heating systems, the need to clean the NG burner -
boiler system from deposits every year has also been considered, mainly for safety reasons. This
maintenance costs approximately 50 €.
Finally, upgrading of heating systems can be achieved with an automatic temperature control
system. Here energy savings are about 30%, while the improvement of the burner’s efficiency is
approximately 20%. In the examined building, the aforementioned intervention leads to an annual
saving of 378 €/yr. Table 2 presents the cost of purchasing and installing an automatic temperature

9
control system.
2.3. Energy savings with the use of thermal solar systems
The use of thermal solar systems for the replacement of the electric water heater leads to saving
electricity while protecting the environment at the same time. The heater of the reference house has a
power of 4,000 W, a capacity of 0.08 m3 and consumes 2.6 kWh in order to heat the aforementioned
quantity of water to 50o C, with a cost of 0.26 € per use. An individual needs 25 to 50 litres of hot
water daily, consequently a family of four members needs to turn on the heater twice a day on average,
thus consuming 1,898 kWh/yr or equivalently meeting a cost of 190 €/yr.
The cost of solar heater equipment, together with the installation costs, is roughly 820 €. The solar
heater saves 80% of the cost of heating water, which represents approximately 152 €/yr.
2.4. Energy savings from lighting and electric appliances
Two of the easiest and most effective ways of saving energy is a) the replacement of incandescent
lamps with fluorescent (low energy) lamps as well as b) the replacement of old technology electric
appliances with new ones that consume less electricity and are more environmentally friendly. In its
general effort for energy saving, the European Union established Council Directive 92/75/EEC with a
mandatory sign (Ecolabel) that all new models of electric appliances should carry. The Ecolabel ranks
an appliance in one of the eight categories, i.e. from A (the most efficient appliance) to G (a not at all
efficient appliance) and mentions its annual energy consumption. In Greece electricity is mainly
produced from lignite or oil. Thus, energy consumption releases CO2, which causes the greenhouse
effect. Consequently, from an energy point of view, the more effective an electric home appliance is,
the more eco-friendly it is.
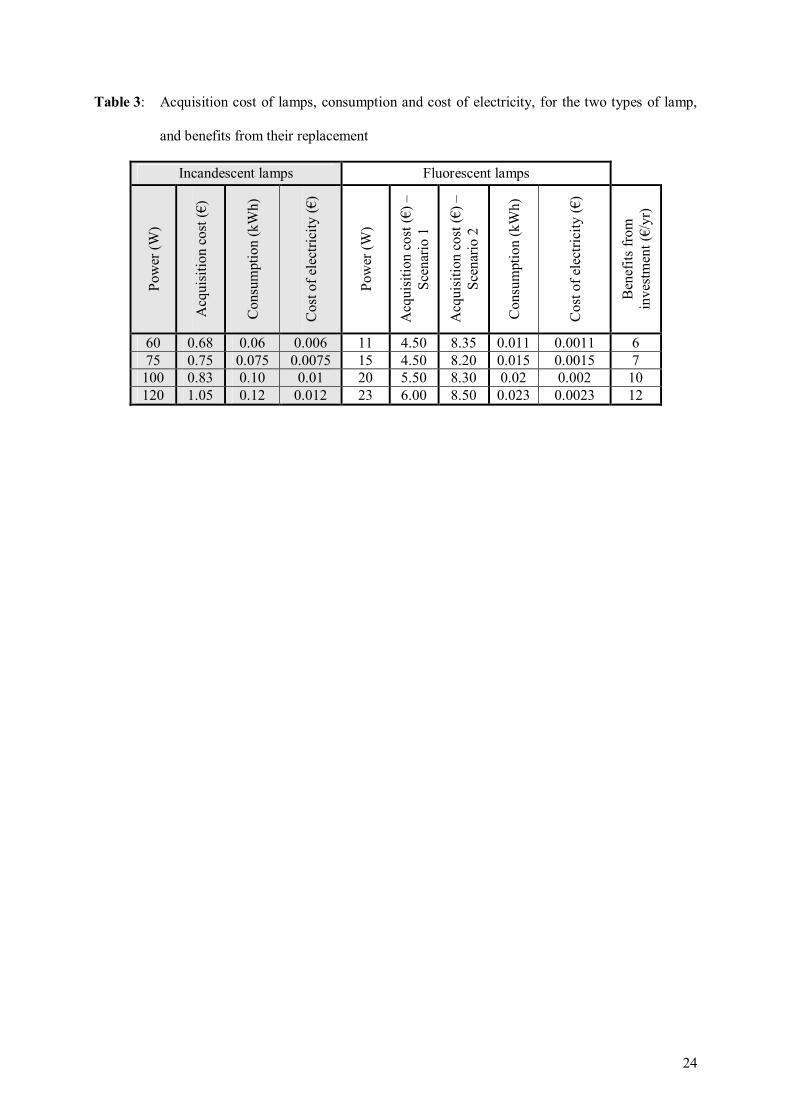
In the economic analysis that follows the subsequent information was taken into consideration:
first the consumption and cost of electricity, both for the incandescent lamps and for the low energy
lamps (Table 3) and second the lifetime of both types of lamp, namely 1,000 and 10,000 hours
respectively. Ιt has been assumed that every lamp is used on average for three hrs/day, i.e. for 1,095
hrs/yr. Consequently, every nine years a new fluorescent lamp should be purchased. Thus, the

10
replacement of incandescent lamps with low energy ones, apart from electricity savings, gives also a
benefit due to the longer life of the latter. For example, the annual benefit from the replacement of an
incandescent lamp of 120 W with the equivalent low energy lamp of 23 W, is around 12 €/yr.
Considering the number of lamps that exist in any residence, one can easily see the significance of this
energy saving measure. Regarding the acquisition cost of low energy bulbs, prices vary a lot
depending on the sales outlet and on the manufacturer. Therefore, an elementary sensitivity analysis of
the economic evaluation of the specific energy saving measure was conducted by examining two
(utmost) prices - acquisition costs (Table 3) for the lamps of every examined power category.
The replacement of old electric appliances with appliances of new technology and lower electric
consumption, constitutes another efficient method for energy saving. One of the most “energy
consuming” home appliances is the refrigerator. The replacement of an old technology refrigerator,
with a mixed capacity of 365 litres (freezer and refrigerator) and a consumption of 1,432 kWh/yr, with
a refrigerator of new technology, of the same type and capacity, ranked in category A and consuming
522 kWh/yr has been examined. The benefit of this replacement is about 91 €/yr, while the cost of
purchasing a low consumption refrigerator is about 600 €.
2.5. Energy savings from upgrading the cooling system
Nowadays the most efficient modern cooling systems in the market can be up to 70% more
efficient than any conventional, old air-conditioning system already installed in buildings. Note that
the efficiency of an air conditioner depends on the dimensions of the room where it is installed, the
potential shading of the latter, the size of windows and the local climate. Moreover, the proper
positioning of an air conditioner is crucial for the efficient cooling of a room. Finally, a large cooling
system is not necessarily more efficient than a smaller one that works longer during the day.
The aforementioned factors should be examined thoroughly in order to choose an air conditioner.
It should also be considered that any cooling system needs about 2.64.105 J/hr.m2 (or equivalently 250
Btu/hr.m2).
Therefore, the replacement of the old technology air-conditioning system of the reference house
with a new technology one, ranked in category A, has been thoroughly examined. Specifically, two

11
scenarios have been studied depending on the type of air conditioners that could be used in this
replacement. According to Scenario 1, two air conditioners of 9,000 Btu and one air conditioner of
12,000 Btu are used, while according to Scenario 2 only two air conditioners of 9,000 Btu are
considered.
Considering the prices of the local market, an air conditioner of 9,000 Btu (or equivalently
9.50.106 J) ranked in category A and accompanied by an inverter costs about 700 €, while the
respective system of 12,000 Btu (or equivalently 1.27.107 J) costs about 800 €. In addition, the
consumption of electricity per hour for new technology air conditioners of 9,000 and 12,000 Btu, is
about 1 and 1.2 kW respectively, while the energy consumption of the old technology air conditioners
is about 1.7 and 2 kW respectively. Finally, considering that the air-conditioning system is used from
mid-June until mid-September, for 12 hrs/day, i.e. for 1,104 hrs/yr, it comes out that the annual profit
of Scenario 1 is about 247 €/yr, while the respective profit of Scenario 2 is about 155 €/yr.
3. EVALUATION METHODS
The methods used for the economic evaluation of energy saving measures are the Net Present
Value (NPV), the Internal Rate of Return (IRR), the Savings to Investment Ratio (SIR) and the
Depreciated Payback Period (DPP). These methods are presented in detail in many books such as the
one of Au and Au [26].
3.1. Net Present Value
The NPV sums the discounted cash flows; it integrates and converts at the same time amounts of
money (e.g. incomes, expenses, etc.) of various time periods. The formula that is used for the
determination of the NPV is:
n
tt
t
)p(FCNPV
10 1
(1)
where
t: time period, usually a year
Ft: net cash flow for year t, i.e. Ft = Bt - Ct
12
Bt: benefit (inflows) for year t
Ct: cost (outflows) for year t; the value C0 reflects the initial investment
p: cost of capital
n: number of years of the investment’s lifetime or, differently, the number of years for which the
economic evaluation is requested.
It is assumed that the various net cash flows of (1) are collected at the end of the time periods, i.e.
at the end of years.
An investment should be realised only if NPV > 0, while in case alternative investments are
compared, the best of them would be the one with the higher NPV. Finally, it is worth mentioning that
there is an inverse relation between the cost of capital p and NPV: the increase of p results in a
decrease of NPV, when all other parameters remain constant.
3.2. Internal Rate of Return
The IRR evaluation method aims at the determination of the discount rate p* that renders the
present value of future discounted net cash flows of an investment equal to the initial cash outflow
(initial investment), for the total years of evaluation. The discount rate p* is determined from the
following equation:
011
0
n
tt*
t
)p(FCNPV (2)
The IRR is the discount rate p* that renders the examined investment marginal and constitutes the
higher interest that can be paid by an investor for finding the capital that is required for an investment.
When the examined investments are economically independent, then, by evaluating them with this
method, one can find attractive all investments that present an IRR greater than the minimum
acceptable interest rate. Besides, the most attractive investment is the one that presents the higher IRR.
3.3. Savings to Investment Ratio
The SIR of an investment is calculated by dividing the present value of the future inflows for the
years of the evaluation, by the present value of the future outflows for the same period:

13
n
tt
t
n
tt
t
)p(C
)p(B
SIR
0
1
1
1 (3)
If the present value of inflows is equal to the present value of outflows, i.e. NPV = 0, then SIR = 1,
while if it is greater (smaller) than the present value of outflows, i.e. NPV > 0 (NPV < 0), then SIR > 1
(SIR < 1). When the examined investments are economically independent, then each of them
presenting an SIR > 1 is considered to be attractive. Moreover, when the investments are reciprocally
excluded, then the most attractive of them is the one with the higher SIR.
3.4. Depreciated Payback Period
The DPP constitutes a variant of the determination of the payback period of the initial investment
C0. This method determines the number of time periods (usually years) that are required until an
investor recovers the initial outflow C0 of an investment. This happens through net cash flows Ft that
are expected as a result of this investment. However, this method is unable to measure directly the
“value” of an investment; it simply aims at measuring the time that is required for the recovery of the
initial outflow of a particular investment. According to DPP, the present value of the expected net
cash flows Ft is calculated based on the cost of capital p, and then set equal to the initial investment
C0. The depreciated payback period is given by:
plnFCp
lnDPP t
1
1 0
, (4)
where it is assumed that the net cash flows Ft remain constant for every t.
4. NUMERICAL INVESTIGATION AND RESULTS
4.1. Economic evaluation with deterministic parameters
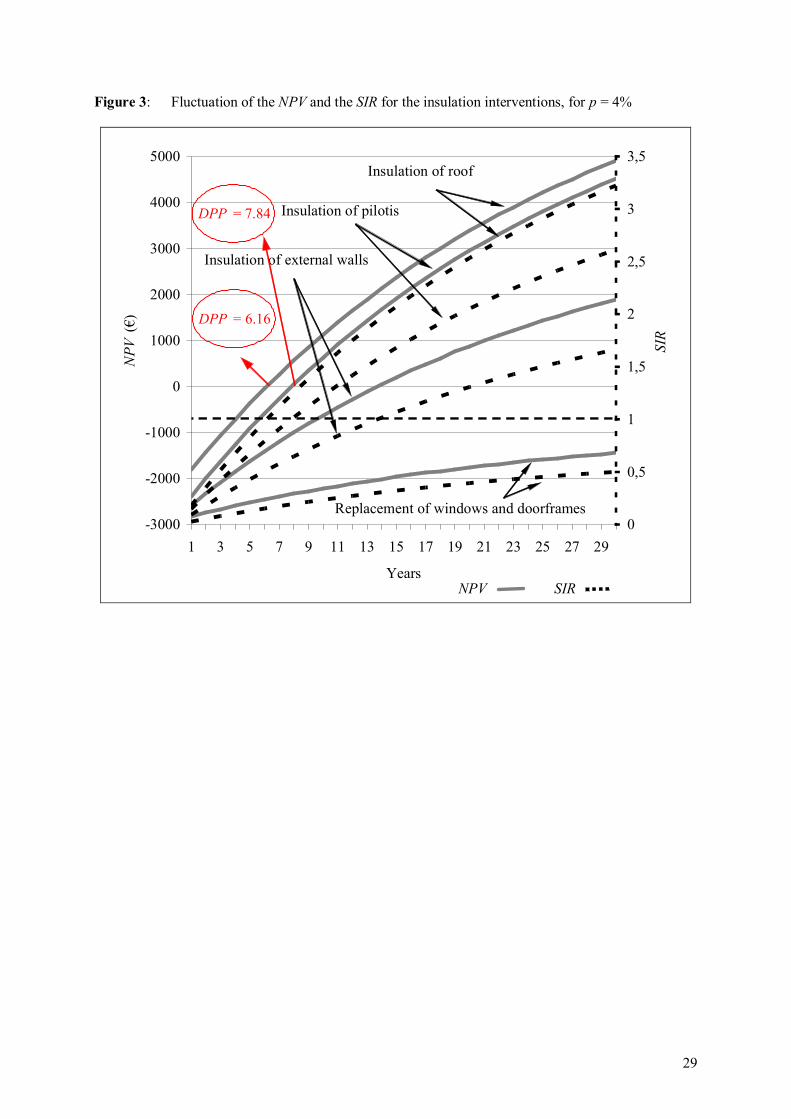
In Figure 3, the fluctuation of the NPV (continuous lines) and the SIR (discontinuous lines) for
various insulation measures are presented, considering a cost of capital of 4%. As shown, by replacing

14
the windows and doorframes of the reference house, the necessary capital for their purchase and
installation is much greater than the benefit obtained from the total energy saved. As a result, the
specific investment is never depreciated. Furthermore, it can be seen from Figure 3 that mainly the
heat insulation of the roof and the pilotis of the reference house constitute choices that ensure return in
a relatively small time period, in comparison with their lifetime; the calculation of each intervention’s
DPP - using (4) - gives 6.16 and 7.84 years, respectively. Summarising, it is obvious that the
insulation of the roof of any building should constitute the preferable method of heat insulation, in
contrast with the replacement of windows and doorframes, which funnily enough constitutes the most
popular energy saving intervention in Greece.
In this study, all energy saving measures are evaluated by calculating the four evaluation methods
for a value of p from 4% up to 8%. The results of the evaluation according to the DPP are presented in
Table 4 and, amongst other things, reveal the sensitivity of the DPP in potential differentiations of p.
In the last column of this table, the lifetime of each alternative energy saving intervention is
mentioned, to facilitate one’s drawing of conclusions. In addition, Figure 4 presents the fluctuation of
the NPV of the external walls insulation of the reference house according to the values of p. It is
evident that the effect of p values is very important i.e. the smaller the cost of capital, the faster the
depreciation of an investment. From approximately 23 years when p = 8%, the depreciated period of
the investment is decreased to 14 years, when p = 4%.
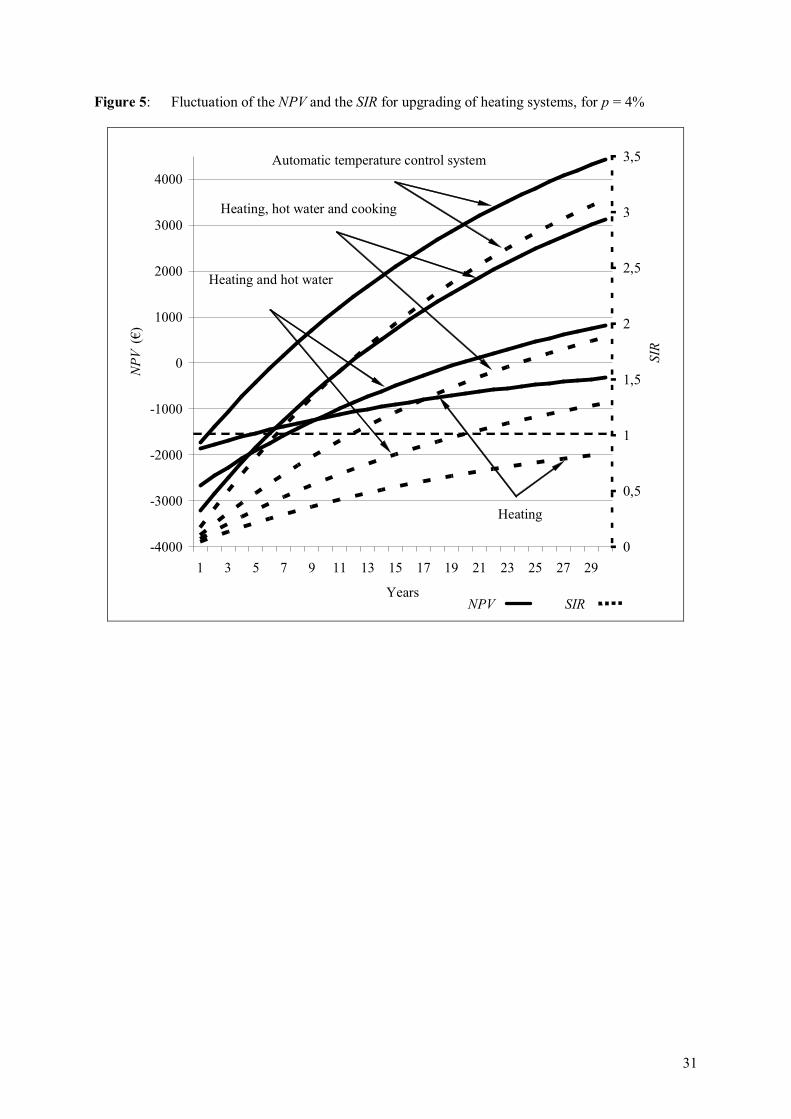
Evaluating the various choices for upgrading heating systems (Figure 5), it is noticed that the
installation of an automatic temperature control system at the burner - boiler system constitutes the
economically most attractive option. On the contrary, the replacement of the oil burner or/and the oil
boiler with NG ones, becomes economically optimal under certain conditions. Thus, if the heating
systems are used exclusively for heating then there is no profit, while if they are used for heating, hot
water production and cooking, profit becomes important. In addition, NG involves serious
environmental advantages, e.g. reduction of CO2 emissions and reduction of oil dependence, which,
however, have not been taken into consideration in the present economic evaluation.
Furthermore, the use of solar heaters is a good solution (Figure 6). As already mentioned, the
particular energy saving method is favoured by the Greek climate. It is not accidental that Greece was

15
one of the first countries of the European Union that used solar heaters for hot water. From Figure 6
one can see that a solar heater starts being depreciated after a period of nearly six years, when p = 4%.
By examining the fourth category of energy saving measures, it becomes obvious, from Figure 6,
that an electric home appliance (i.e. a refrigerator in this study) of category A, even if it is more
expensive than an appliance of inferior category, becomes profitable very soon (the initial investment
is depreciated in less than eight years, when p = 4%), because its electric consumption is much
smaller.
Regarding the upgrading of artificial lighting, it should be pointed out that it constitutes one of the
most economic and effective investments. Taking into consideration the NPV of all four kinds of bulbs
(concerning their power), the replacement of incandescent lamps with low energy ones involves profit
9 to 15 times the initial investment according to Scenario 1 (Figure 7a), while according to Scenario 2
(Figure 7b) it involves profit 4 to 10 times the initial investment. Moreover, in most cases the
depreciation of the initial investment starts from as early as the first year of the investment.
In Figure 8, the fluctuations of the NPV and of the SIR for both scenarios of upgrading the cooling
system of the reference house are presented, considering again a cost of capital of 4%. Here it is
noticed that both investments are depreciated at approximately the same time, namely during the
twelfth year of the investment. However, the higher value of the annual net cash flow of Scenario 1
makes the latter much more profitable at the end of the investment, i.e. after 15 years.
Conclusions on various energy saving measures applied to buildings can be drawn from Table 5.
All measures are evaluated according to the IRR that is presented in the last column of this table. Note
that the various measures are ranked from the best to the worst. The second column of Table 5
displays the initial investment of each measure, while the third one presents the sum of all initial
investments mentioned earlier in the table. The data of this column can be used to choose the best
measures. For example, if someone has 5,000 € available, it is preferable to choose and realise at his
own house the first six energy saving measures.
Helcké [27] analysed a partially different variety of energy saving measures and compared the
results in order to find the most cost-effective ones. Assuming an annual interest of 8% and an annual
fuel price inflation rate of 12% (this type of rate has not been taken into consideration in the present

16
study) he concluded that the order of measures according to their cost-effectiveness is the following:
a) Insulation of roof, b) Insulation of external walls, c) Replacement of windows and doorframes and
d) Installation of solar heater. His rating is similar with the rating of the present study, except for the
differentiation in the installation of solar heater, which can be attributed to the significantly different
climate of the UK, which was the reference country for his study.
4.2. Economic evaluation with stochastic parameters
For a more advanced economic evaluation of the examined set of energy saving measures, a
sensitivity analysis on the NPV has been carried out by considering various parameters as stochastic
and not deterministic, as it was done in the first part of the numerical investigation. More specifically,
the following have been taken into account: a fluctuation of ±10% for all costs and benefits, assuming
that they all follow the uniform distribution in a width of ±10% on the values presented in Section 2;
an evaluation period of 30/10 years for all investments; a cost of capital of 4%. All stochastic
parameters have been simulated 1,000 times1 and the NPV has been calculated for all measures, 1,000
times. The results, namely the boxplots2, of all energy saving measures are presented in Figures 9 and
10, where the various measures are ranked according to their cost-effectiveness. The NPV values of all
energy saving measures are distributed according to the indicative histogram presented in Figure 11,
obviously with different mean (or generally central tendency) and standard deviation (or generally
dispersion), depending on the energy saving measure.
From both Figures 9 and 10, it can be noticed that the ranking of the examined energy saving
measures differs significantly from the ranking that arises considering IRR (Table 5). This difference
can be attributed to the combination of (some times large and some other times small) values of the
cash flows of every energy saving measure combined with the evaluation period that is used in both
cases: in order to compute the IRR of the measures their lifetime is used, while in order to compute the
NPV a specific interval of time is used, i.e. 30/10 years respectively. Concisely, it can be seen from
both Figures 9 and 10 that two types of insulation are between the most cost-effective energy saving 1 using “Crystal Ball”, which is a special add-in software of Microsoft Office Excel 2 which have been developed using MINITAB 15

17
measures, while the replacement of windows and doorframes is, once again, the worst energy saving
measure. Another interesting observation has to do with the significant decline of the replacement of
incandescent lamps, which can be attributed to the small absolute size of the annual net cash flow of
this investment and the large evaluation period, which offers advantage to other energy saving
measures that have large annual net cash flows.
Since the stochasticity of the parameters (costs and benefits) introduces a dispersion of the NPV
values, a differentiation of the ranking in practice should not be excluded: every NPV value depends
on the specific values of the stochastic parameters that are taken into consideration for its calculation.
Therefore, an overlap of NPV values is frequently noticed. For instance, considering the NPV of 30
years, some combinations of parameter values can lead to the superiority of the insulation of pilotis -
which fluctuates between 4099.27 € and 4936.32 € - while some other combinations of values can lead
to the dominance of the use of a temperature control system - which fluctuates between 4041.65 € and
4836.91 € (Figure 9, encircled area).
5. CONCLUSIONS
In this study, many energy saving measures that can be realised in a common Greek type of
building have been evaluated from an economic point of view. The four most popular evaluation
methods have been used, while results have been presented in tables and figures. Using the IRR as
evaluation criterion it has been shown that the upgrading of artificial lighting is the most effective
investment, while the insulation as well as the installation of an automatic temperature control system
at the burner - boiler system follow next. The use of solar heaters is economic enough and profitable,
contrary to the replacement of windows and doorframes and the partial upgrading of heating systems
that constitute very low return investments.
Using the NPV as evaluation criterion and a uniform evaluation period, it becomes evident that the
insulation of the roof or the pilotis of the building constitute the most effective interventions. The
replacement of windows and doorframes are once again very low return investments.

18
Acknowledgment
The authors would like to thank Lecturer Theodore Theodosiou and Mrs Elsa Plakida for their
valuable contribution to this study.
19
References
[1] Freund, P., The Cost-Effectiveness of Some Measures for Energy Conservation in Buildings in
the UK, Proc. the CIB (Conseil International du Bâtiment pour la Recherche, l'Etude et la
Documentation/International Council for Building Research, Studies and Documentation)
Symposium on Energy Conservation in the Built Environment, Copenhagen, 1979.
[2] Kellow, M., 1989, Kuwait's Approach to Mandatory Energy-Conservation Standards for
Buildings, Energy, 1989;14(8):491-502.
[3] Borsch-Laaks, R., and Pohlmann, R., 1993, The Triple-E-House: Energy-efficient, Economical,
Ecological, Proc. the ACEEE 1994 Summer Study on Energy Efficiency in Buildings,
1993;9(9.51).
[4] Balaras, C.A., Droutsa, K., Argiriou, A.A., and Asimakopoulos, D.N., 2000, Potential for Energy
Conservation in Apartment Buildings, Energy and Buildings, 2000;31(2):143-154.
[5] Omer, S.A., Riffat, S.B., and Wilson, R., BIPV Design Study for Renewable Energy Centre and
Eco-Energy House, ETSU S/P2/00325/REP1, 2000.
[6] Eiffert, P., Guidelines for the Economic Evaluation of Building-Integrated Photovoltaic Power
Systems, NREL/TP-550-31977, 2003.
[7] Papadopoulos, A.M., Theodosiou, T.G., and Karatzas, K.D., Feasibility of Energy Saving
Renovation Measures in Urban Buildings. The Impact of Energy Prices and the Acceptable Pay
Back Time Criterion, Energy and Buildings, 2002;34(5):455-466.
[8] Stavropoulos, G.G., and Skodras, G., Energy Savings at Military Installations: a Case Study,
OPET Special Issue No. 1 of “Energy Engineering”, 2003.
[9] Ecofys for EURIMA, 2005, Cost-Effective Climate Protection in the EU Building Stock.
[10] Georgopoulou, E., Sarafidis, Y., Mirasgedis, S., Balaras, C.A., Gaglia, A., and Lalas, D.P.,
Evaluating the need for economic support policies in promoting greenhouse gas emission
reduction measures in the building sector: The case of Greece, Energy Policy, 2006;34(15):2012-
2031.
[11] Ouyang, J., Ge, J., and Hokao, K., Economic analysis of energy-saving renovation measures for
urban existing residential buildings in China based on thermal simulation and site investigation,

20
Energy Policy, 2009;37(1):140-149.
[12] Blok, K., Improving energy efficiency by 5% and more per year, Journal of Industrial Ecology,
2004;8(4):87-99.
[13] Lin, W.-B., and Wang, L., Evaluation of energy-saving benefits for green buildings using natural
daylight strategy, Series on Energy and Power Systems, PES 2005, no. 492-062:246-250.
[14] Kaklauskas, A., Zavadskas, E.K., Raslanas, S., Ginevicius, R., Komka, A., and Malinauskas, P.,
Selection of low-e windows in retrofit of public buildings by applying multiple criteria method
COPRAS: A Lithuanian case, Energy and Buildings, 2006:38(5);454-462.
[15] Sjögren, J.-U., Andersson, S., and Olofsson, T., An approach to evaluate the energy performance
of buildings based on incomplete monthly data, Energy and Buildings, 2007;39(8):945-953.
[16] Yilmaz, Z., Evaluation of energy efficient design strategies for different climatic zones:
comparison of thermal performance of buildings in temperate-humid and hot-dry climate,
Energy and Buildings, 2007; 39(3):306-316.
[17] Doukas, H., Nychtis, C., and Psarras, J., Assessing energy-saving measures in buildings through
an intelligent decision support model, Building and Environment, 2009;44(2):290-298.
[18] Ginevičius, R., Podvezko, V., and Raslanas, S., Evaluating the alternative solutions of wall
insulation by multicriteria methods, Journal of Civil Engineering and Management,
2008;14(4):217-226.
[19] Papadopoulos, A.M., Oxizidis, S., and Papandritsas, G., Energy, economic and environmental
performance of heating systems in Greek buildings, Energy and Buildings, 2008;40(3):224-230.
[20] Papadopoulos, A.M., Oxizidis, S., and Papathanasiou, L., Developing a new library of materials
and structural elements for the simulative evaluation of buildings’ energy performance, Building
and Environment, 2008;43(5):710-719.
[21] Hellenic National Statistical Service, Statistical Index—Census of Buildings’ Inventory, Athens,
2001.
[22] Council Directive 92/75/EEC, On the indication by labelling and standard product information of
the consumption of energy and other resources by household appliances, 1992:16-19.
[23] Theodosiou T.G., and Papadopoulos A.M., The impact of thermal bridges on the energy demand

21
of buildings with double brick wall constructions, Energy and Building, 2008;40(11):2083-2089.
[24] Gas Supply Company of Thessaly S.A., 2007 - www.epathessalia.gr
[25] Attiki Gas Supply Company S.A., 2007 - www.aerioattikis.gr
[26] Au, T., and Au, T.P., Engineering Economics for Capital Investment Analysis, Allyn and Bacon,
Newton, MA, 1983.
[27] Helcké, G., The Energy Saving Guide, Pergamon, Oxford, England, 1981.

22
Table 1: Costs and benefits for various energy saving insulation measures
Cost
Type of insulation M
ater
ials
(€)
Seco
ndar
y m
ater
ials
(€)
Labo
ur (€
)
Tota
l ini
tial
inve
stm
ent (
€)
Ener
gy sa
ving
s (%
)
Ben
efits
from
in
vest
men
t (€/
yr)
Insulation of external walls 620 70 2,160 2,850 23.0 274 Insulation of pilotis 770 50 1,980 2,800 35.5 423 Insulation of roof 715 50 1,440 2,205 34.5 411
Replacement of windows and doorframes 2,8551 - 45 2,900 7.0 84
1 One front door costs 1,070 €, three large French windows cost 1,070 € totally and three windows cost 715 € totally.

23
Table 2: Costs and benefits from upgrading of heating systems
Cost
Type of upgrading of heating systems N
G b
urne
r – b
oile
r (€
)
Seco
ndar
y m
ater
ials
(€)
Con
nect
ion
(€)
Gua
rant
ee a
nd
fixed
cha
rge
for 1
2 m
onth
s (€)
Tota
l ini
tial
inve
stm
ent (
€)
Ben
efits
from
in
vest
men
t (€/
yr)
Use: heating => replacement of oil burner with a NG burner 810 475 525 135 1,945 94
Use: heating & hot water production => replacement of both oil burner -
boiler with NG ones 1,725 475 525 135 2,860 213
Use: heating, hot water production & cooking => replacement of a) both oil burner - boiler with NG ones and b) the electric cooker with a NG one
1,725 1,190 525 135 3,575 388
Installing an automatic temperature control system - 2,100 - - 2,100 378
24
Table 3: Acquisition cost of lamps, consumption and cost of electricity, for the two types of lamp,
and benefits from their replacement
Incandescent lamps Fluorescent lamps Po
wer
(W)
Acq
uisi
tion
cost
(€)
Con
sum
ptio
n (k
Wh)
Cos
t of e
lect
ricity
(€)
Pow
er (W
)
Acq
uisi
tion
cost
(€) –
Sc
enar
io 1
Acq
uisi
tion
cost
(€) –
Sc
enar
io 2
Con
sum
ptio
n (k
Wh)
Cos
t of e
lect
ricity
(€)
Ben
efits
from
in
vest
men
t (€/
yr)
60 0.68 0.06 0.006 11 4.50 8.35 0.011 0.0011 6 75 0.75 0.075 0.0075 15 4.50 8.20 0.015 0.0015 7
100 0.83 0.10 0.01 20 5.50 8.30 0.02 0.002 10 120 1.05 0.12 0.012 23 6.00 8.50 0.023 0.0023 12

25
Table 4: DPP for all energy saving measures for various values of p
DPP (yrs) Energy saving measure
p = 4% p = 5% p = 6% p = 7% p = 8 % Life
time
(yrs
)
Insulation of external walls 13.72 15.05 16.79 19.25 23.19 30
Insulation of pilotis 7.84 8.24 8.69 9.20 9.80 30
Insulation of roof 6.16 6.40 6.67 6.96 7.29 30 Replacement of windows and doorframes - - - - - 30
Replacement of oil burner with a NG burner => use: heating 44.83 - - - - 30
Replacement of both oil burner and boiler with NG ones => use: heating & hot water
production 19.64 22.81 28.11 41.56 - 30
Replacement of a) both oil burner - boiler with NG ones and b) the electric cooker
with a NG one => use: heating, hot water production & cooking
11.72 12.66 13.81 15.31 17.36 30
Installation of an automatic temperature control system 6.41 6.67 6.96 7.28 7.64 30
Installation of solar heater 6.20 6.44 6.71 7.01 7.34 10 Replacement of an incandescent lamp (60 W) with a low energy one (11 W)
2.03 2.06 2.10 2.13 2.16 10
Replacement of an incandescent lamp (75 W) with a low energy one (15 W)
1.89 1.92 1.94 1.97 2.00 10
Replacement of an incandescent lamp (100 W) with a low energy one (20 W)
1.36 1.38 1.39 1.41 1.43 10
Replacement of an incandescent lamp (120 W) with a low energy one (23 W)
1.31 1.32 1.34 1.35 1.37 10
Replacement of old technology electric appliances, with new ones of category Α
(refrigerator) 7.81 8.20 8.64 9.15 9.74 12
Replacement of old technology cooling system, with new one of category Α
(Scenario 1) 11.23 12.08 13.12 14.44 16.20 15
Replacement of old technology cooling system, with new one of category Α
(Scenario 2) 11.43 12.31 13.40 14.79 16.66 15

26
Table 5: Ranking of energy saving measures according to IRR
Energy saving measure Initial investment (€)
Sum of initial investments (€) IRR (%)
Replacement of an incandescent lamp (120 W) with a low energy one (23 W) 15.00 15.00 79.54
Replacement of an incandescent lamp (100 W) with a low energy one (20 W) 13.00 28.00 76.40
Replacement of an incandescent lamp (75 W) with a low energy one (15 W) 12.50 40.50 54.58
Replacement of an incandescent lamp (60 W) with a low energy one (11 W) 11.50 52.00 50.45
Insulation of roof 2,205 2,257 18.53 Installing an automatic temperature control
system 2,100 4,357 17.87
Insulation of pilotis 2,800 7,157 14.87 Installation of solar heater 820 7,977 13.15
Replacement of old technology electric appliances, with new ones of category Α
(refrigerator) 600 8,577 10.68
Replacement of a) both oil burner - boiler with NG ones and b) the electric cooker with a NG one => use: heating, hot water production &
cooking
3,575 12,152 10.28
Insulation of external walls 2,850 15,002 8.86 Replacement of old technology cooling system,
with new one of category Α (Scenario 1) 2,200 17,202 7.36
Replacement of old technology cooling system, with new one of category Α (Scenario 2) 1,400 18,602 7.13
Replacement of both oil burner - boiler with NG ones => use: heating & hot water
production 2,860 21,462 6.23
Replacement of oil burner with a NG burner => use: heating 1,945 23,407 2.59
Replacement of windows and doorframes 2,900 26,307 -0.88

27
Figure 1: Fluctuation of crude oil prices from November 2003 till February 2009
20
40
60
80
100
120
140
160N
ovem
ber 2
003
Mar
ch 2
004
July
200
4
Nov
embe
r 200
4
Mar
ch 2
005
July
200
5
Nov
embe
r 200
5
Mar
ch 2
006
July
200
6
Nov
embe
r 200
6
Mar
ch 2
007
July
200
7
Nov
embe
r 200
7
Mar
ch 2
008
July
200
8
Nov
embe
r 200
8
Months
Cru
de o
il pr
ice
($ p
er b
arel
l)
28
Figure 2: Recent photo of the reference house (after some renovations)
29
Figure 3: Fluctuation of the NPV and the SIR for the insulation interventions, for p = 4%
-3000
-2000
-1000
0
1000
2000
3000
4000
5000
1 3 5 7 9 11 13 15 17 19 21 23 25 27 29
Years
NPV
(€)
0
0,5
1
1,5
2
2,5
3
3,5
SIR
Insulation of external walls
Replacement of windows and doorframes
Insulation of roof
Insulation of pilotis
NPV SIR
DPP = 6.16
DPP = 7.84

30
Figure 4: Fluctuation of the NPV for the insulation of external walls according to the values of p
-3000
-2500
-2000
-1500
-1000
-500
0
500
1000
1500
2000
1 3 5 7 9 11 13 15 17 19 21 23 25 27 29
Years
NPV
(€)
p = 4%
p = 6%p = 7%
p = 8%
p = 5%
31
Figure 5: Fluctuation of the NPV and the SIR for upgrading of heating systems, for p = 4%
-4000
-3000
-2000
-1000
0
1000
2000
3000
4000
1 3 5 7 9 11 13 15 17 19 21 23 25 27 29
Years
NPV
(€)
0
0,5
1
1,5
2
2,5
3
3,5
SIR
Automatic temperature control system
Heating, hot water and cooking
Heating and hot water
Heating
NPV SIR

32
Figure 6: Fluctuation of the NPV and the SIR for the use of solar heater and the upgrading of an
electric home appliance (refrigerator), for p = 4%
-700
-600
-500
-400
-300
-200
-100
0
100
200
300
400
500
1 2 3 4 5 6 7 8 9 10 11 12
Years
NPV
(€)
0
0,2
0,4
0,6
0,8
1
1,2
1,4
1,6
SIR
Solar heater
Upgrade of an electric appliance (refrigerator)
NPV SIR
DPP = 6.20
DPP = 7.81

33
Figure 7a: Fluctuation of the NPV and the SIR for upgrading of artificial lighting, for p = 4% -
Scenario 1
0
10
20
30
40
50
60
70
80
90
1 2 3 4 5 6 7 8 9 10
Years
NPV
(€)
0
2
4
6
8
10
12
14
16
SIR
Low energy lamp-11W
Low energy lamp-15W
Low energy lamp-20W
Low energy lamp-23W
NPV SIR

34
Figure 7b: Fluctuation of the NPV and the SIR for upgrading of artificial lighting, for p = 4% -
Scenario 2
-10
0
10
20
30
40
50
60
70
80
90
1 2 3 4 5 6 7 8 9 10
Years
NPV
(€)
-1
1
3
5
7
9
11
SIR
Low energy lamp-11W
Low energy lamp-15W
Low energy lamp-20W
Low energy lamp-23W
NPV SIR

35
Figure 8: Fluctuation of the NPV and the SIR for the upgrading of the cooling system, for p = 4%
-2500
-2000
-1500
-1000
-500
0
500
1000
1 2 3 4 5 6 7 8 9 10 11 12 13 14 15
Years
NPV
(€)
0.1
0.3
0.5
0.7
0.9
1.1
1.3
SIR
NPV SIR
Upgrade of cooling system(Scenario 1)
Upgrade of cooling system(Scenario 2)
DPP = 11.23
DPP = 11.43

36
Figure 9: Ranking of energy saving measures according to the NPV for 30 years, for p = 4%
Insulatio
n of ro
of
Insulat
ion of pilo
tis
Temperat
ure contro
l syste
m
Heating sy
stems-S
cenario
3
Cooling sy
stem-Sce
nario 1
Insulat
ion of exte
rnal wall
s
Solar heate
r
Cooling s yste
m-Scena
rio 2
Upgrade of re
frigerator
Hea ting sy
stems-S
cenari
o 2
Lamp 23W
-Scenario
1
Lamp 20
W-Sce
nario 1
Lamp 15W
-Scen
ario 1
Lamp 11W
-Scenari
o 1
Heating sy
s tems-Sce
nario
1
Replace
ment of w
indows/doors
6000
5000
4000
3000
2000
1000
0
-1000
-2000
NPV (€)

37
Figure 10: Ranking of energy saving measures according to the NPV for 10 years, for p = 4%
Insulatio
n of ro
of
Tempera
ture contro
l s ystem
Insulat
ion of pilo
tis
Sola r heate
r
Upgrade o
f refrig
erator
Lamp 23
W-Sc
enari
o 1
Lamp 20
W-Sce
nario 1
Lamp 15 W
-Scena
rio 1
Lamp 11
W-Scen
ario 1
Cooling sy
stem-Sce
nario 2
Cooling sy
s tem-Sce
nario 1
Heating s ys
tems-S
cenari
o 3
Insulat
ion of exte
rnal wall
s
Heating sy
stems-S
cenari
o 2
Heating sy
s tems-Sce
nario
1
Replace
ment of w
indows/doors
2000
1000
0
-1000
-2000
-3000
NPV (€)

38
Figure 10: Histogram of the NPV (€) for 30 years for the insulation of the roof, for p = 4
Trials 1,000 Mean 4,903 €
Median 4,898 € Standard Deviation 155 €
Variance 24,091 €2 Skewness 0.0203 Kurtosis 2.31
Coefficient of Variability 0.0317 Minimum 4,502 € Maximum 5,307 €
Mean Std. Error 5
NPV €