Embed Size (px)
Citation preview
Economic Growth and Environmental degradation nexus in Sri Lanka
Sri Lanka Journal of Social Sciences and Humanities Volume 1 Issue 2, August 2021: 135-145 ISSN: 2773 692X (Online), 2773 6911 (Print) Copyright: © 2021 The Author(s) Published by Faculty of Social Sciences and Languages, Sabaragamuwa University of Sri Lanka Website: https://www.sab.ac.lk/sljssh DOI: http://doi.org/10.4038/sljssh.v1i2.45
Alabi, M.K.1,* Ojuolape, M.A.1 and Yaqoob, J.2
1 Department of Economics, University of Ilorin, Ilorin, P.M.B 1515, Nigeria. 2 Department of Business Administration and Management, Oyo State College of Agriculture and Technology, Igboora, Nigeria.
Received: 23 January, 2020, Revised: 28 February, 2021, Accepted: 30 March, 2021. How to Cite this Article: Alabi, M.K., Ojuolape, M.A. and Yaqoob, J. (2021). Economic Growth and Environmental degradation nexus in Sri Lanka. Sri Lanka Journal of Social Sciences and Humanities, 1(2), 135-145.
Abstract
The environmental Kuznet curve (EKC) hypothesis suggests that at the initial stage of development, as the economy grows, environ-mental degradation rises until a turning point is reached whereby the pollution and degradation begins to decline while the economy continues to grow (it follows an inverted U curve). Is the environmental Kuznet curve (EKC) hypothesis applicable to Sri Lanka? What factors are responsible for environmental degradation in Sri Lanka? This study seeks to provide answers to these fundamental ques-tions. Sri Lanka is one of the emerging economies in South Asia with an average annual growth rate of 4.16% in the last five years and the industrial sector contributing 25% of Gross Domestic Product (GDP). This hypothesis is tested for Sri Lanka. This study also investigated the major factors behind environmental pollution and degradation in Sri Lanka. Annual data from 1971-2014 was used in estimating the relationship between economic growth and environmental degradation. Carbon (CO2) emission was used as a proxy for environmental degradation while real per capita income was used as a proxy for growth along with other explanatory variables. An autoregressive distributed lag model was used. Results showed that neither the EKC hypothesis nor the pollution haven hypothesis are applicable to Sri Lanka. Long term estimates revealed that increasing energy consumption leads to increasing CO2 emissions. Secondly, it was observed that energy consumption, urbanization, trade openness, tourism and financial development are among the key factors responsible for the quality of the environment. The policy implication is that the Sri Lankan Government, in conjunction with the private sector must adopt energy saving and environmental friendly technologies and production processes in order to save the environment.
Keywords: Carbon emission, Energy consumption, Environmental Kuznets curve, Financial Development, Foreign Direct Investment, Urbanization
INTRODUCTION
One of the leading issues receiving global attention from world leaders today, especially in the developed countries, is the issue of climate change and greenhouse gas emissions. The environment is witnessing various forms of pollution such as air, water and land pollution. These can be at-tributed to the rising population and the accelerated level of industrialization and urbanization. Pollution has resulted in global warming and degradation of the environment. While there are various forms of pollution, the focus of this study shall be on carbon emissions. According to Ozturk and Acaravci (2010), carbon emissions represent about 60% of the world’s total greenhouse gas emission. Some of the rea-sons for this include the high level of industrialization, high level of energy consumption and increasing economic growth rates. The environmental Kuznet curve hypothesis (EKC) is actually an extension of Kuznets (1955) hypothesis on the relationship between economic growth and income inequality. The EKC hypothesis posits that as the economy develops, at the initial stage, the environment begins to wit-ness pollution and degradation until a turning point is
* Corresponding author: Tel.: +234 (81) 333 56400; Email: [email protected] https://orcid.org/0000-0001-5604-6188
reached whereby, even as the economy continues to grow, there is a decline in the negative impact on the environment.
Sri Lanka, which was formerly classified as a lower-middle income country has now been classified as an upper-middle income country (World Bank, 2019). The South Asian coun-try is one of the emerging and developing countries of the region with an annual average growth rate of 4.16% in the past five years (2015-2019) and a modest inflation rate of 2.1% in 2018. With such growth rate, it is no surprise that energy consumption has almost doubled from 298kg of oil equivalent per capita in 1971 to 516kg in 2014 (World Bank WDI, 2019). Also, in 2018, Sri Lanka had a population of 21.6 million, an urban population of 18.5% of the total popula-tion, a Human development index of 0.770 and the Indus-trial sector contributed 26.1% of Gross Domestic Product (GDP) (Central Bank of Sri Lanka, 2019).
Tourist arrivals have risen remarkably from 39,654 tourists in 1971 to 1.9 million tourists in 2019 generating gross tour-ist receipts as at the end of 2019 of $US 3.6 billion (Sri Lanka Tourism Development Authority, 2019). With such encour-
This article is published under the Creative Commons CC-BY-ND License (http://creativecommons.org/licenses/by-nd/4.0/). This license permits use, distribution, and reproduction, commercial and non-commercial, provided that the original work is properly cited and is not changed in anyway.
136 Sri Lanka Journal of Social Sciences and Humanities
aging macroeconomic statistics and the fact that the indus-trial sector contributes a quarter of the GDP, it becomes im-portant to find out if an emerging economy like this is grow-ing without huge cost to the environment. This is so because it is known from the theoretical and empirical literature that industrialization leads to increase in economic growth, ac-companied by increased energy consumption and this could contribute to a decline in the quality of the environment.
Meanwhile, the country continues to attract foreign direct investment (FDI). From $US 300,000 in 1971, FDI net inflow rose to $US 1.6 billion in 2018 but Carbon emissions, CO2, have also risen from 0.29 metric tons per capita in 1971 to 0.89 metric tons per capita in 2014 (World Bank WDI, 2019). With such huge investments coming in and a decrease in the environmental quality, it would be good to know if Sri Lanka has become a pollution haven. The pollution haven hypoth-esis states that if inward FDI leads to a decline in the quality of the environment of the host country, then such country has become a pollution haven. On the contrary, it is quite possible for the host country not to be a pollution haven pro-vided foreign firms bring in advanced technologies and make use of environmental friendly methods of production.
The objectives of this study are: (1) To test the applicability of the EKC hypothesis to Sri Lanka, (2) To identify the major factors responsible for carbon emissions in the country and (3) To find out if Sri Lanka is a pollution haven.
This study contributes to the knowledge gap in two ways. First, it brings together, in a single study for Sri Lanka, thelargest number of explanatory variables known in the litera-ture to contribute to carbon emissions. Such factors include:energy consumption, real per capita GDP, the square of real per capita GDP, urbanization, financial development, tour-ism and foreign direct investment (FDI). Secondly, it tests the pollution haven hypothesis for Sri Lanka. The findings ofthis study will help policy makers identify those key factors responsible for environmental degradation and allow themtake appropriate steps to address the problem. In additionto that, while the government attracts foreign direct invest-ment, policy makers will be better informed on how best to manage FDI inflow without polluting the environment.
The rest of the paper is as follows: Section 2 gives a briefreview of the relevant empirical literature, Section 3 talksabout the data and methodology used. In Section 4 resultsare presented and discussed while Section 5 gives the con-clusion and policy implications.
LITERATURE REVIEW AND HYPOTHESIS
The environmental Kuznet Curve (EKC) hypothesis was pos-tulated based on the perceived relationship between eco-nomic growth and the quality of the environment. The EKC hypothesis was named after Simon Kuznet (1955) because of its similarity to Kuznets economic growth-income inequal-ity relationship. The EKC states that at the initial stage of economic growth, the emphasis is on boosting production and income and so very little or no attention is paid to what-ever adverse effects such development may have on the en-vironment leading to degradation of the environment. This leads to environmental pollution of all kinds like air, water and soil pollution. What this implies, is that as the economy grows, environmental degradation rises. In the next stage of economic growth, by that time, output and income must have increased, and now, the emphasis is gradually shifting from just mere production and economic growth but to-wards clean and safe methods of production that are healthy for the environment. It is believed that at that stage,
as the economy continues grow, environmental degradation declines due to the use of environmental friendly advanced technology (Shahbaz and Sinha, 2019). In essence, EKC, which captures the economic growth-environmental pollu-tion nexus can be illustrated graphically as an “inverted U curve”.
The findings of Grossman and Krueger (1991) paved the way for various studies to come up and assess the relationship between economic growth and environmental degradation. Gross domestic product (GDP) was used as a proxy for eco-nomic growth while carbon emission, CO2, was often used as a proxy for the quality of the environment. Over time, au-thors began to introduce more explanatory variables into the model such as energy consumption, population, urbani-zation, institutional factors, trade (exports, imports, trade openness), financial development, tourism and foreign di-rect investment (FDI). There have been country specific studies and panel studies; studies using time series data and others using panel data; studies that have found the EKC to be valid and others that found no evidence of EKC.
From the literature, it is possible to classify the studies on the economic growth-environmental degradation relation-ship into five. The first classification of the literature focused mainly on the impact of economic growth (GDP) on environ-mental pollution (CO2). Some of them include Holtz-Eakin and Selden (1995), Tutulmaz (2015), Fan and Zheng (2013). The second classification of the literature devoted time to studying the impact of energy consumption on environmen-tal pollution. Examples are Cialani (2007), Ahmad et al. (2016). The third classification were studies that investi-gated the link between energy consumption and economic growth. Such studies include Ho and Siu (2007), Ang (2008), Payne (2009), Zhang and Cheng (2009).
In the fourth classification, authors were interested in un-derstanding the effect of both economic growth and energy consumption on environmental degradation. Examples in-clude Cole, Rayner and Bates (1997), Ang (2007), Saboori, Suleiman and Mohd (2012), Baek (2015), Boluk and Mert (2015), Ozturk and Al-Mulali (2016), Li, Wang and Zhao (2016) Nasreen, Anwar and Ozturk (2017), Alvarez-Herranz, Balsalobre and Cantos (2017).
The fifth classification of the literature focused on introduc-ing more explanatory variables in addition to energy use and economic growth. Such variables include urbanization, trade (or trade openness), financial development, foreign direct investment (FDI) and tourism. For FDI we have Seker, Ertugul and Cetin (2015), Tang and Tan (2015), Alshehry (2015), Pal and Mitra (2017), Zhang, Liu and Bae (2017). For Financial development we have Youssef, Hammoudeh and Omri (2016), Dogan and Turkekul (2016), Nassani et al., (2017) Moghadam and Dehbashi (2017). For Urbanization we have Farhani and Ozturk (2015), Lin et al., (2016), Hao et al., (2016). For tourism we have Qureshi et al., (2017), Katir-cioglu (2014), Azam, Alam and Hafeez (2018). For Trade we have Halicioglu (2009), Bouznit and Pablo-Romero (2016).
Some studies have used alternative variables to represent environmental pollution instead of the commonly used car-bon emission. For instance, Stern (2004) used sulphur rather than carbon emission while Liu et al., (2018) used waste soot and dust, waste water and sulphur dioxide. Al-Mulali et al., (2015), Boutaud, Natacha and Christian, (2006) and Caviglia-Harris, Chambers and Khan (2009) used ecological footprint. In other studies, energy consumption was disaggregated into renewable energy consumption and non-renewable en-ergy. Examples include Richmond and Kaufmann (2006),
137 Alabi, Ojuolape and Yaqoob, 2021
Lopez-Menendez, Perez and Moreno (2014), Iwata, Okada and Samreth (2011), Pata (2018).
On the validity of the EKC hypothesis, the following studies have given evidence in support of it. They include: Apergis and Payne (2009), Bilgili, Kocak and Bulut (2016), Apergis and Ozturk (2015), Atici (2009), Gene and Alan (1995), Hei-dari, Katircioglu and Saeidpour (2015), Ibrahim and Law (2014), Iwata, Okada and Samreth (2012), Nasir and Rehman (2011), Robalino-Lopez et al., (2015), Al-Mulali and Ozturk (2016), Ozatac, Gokmenoglu and Taspinar (2017), Nasreen, Anwar and Ozturk (2017), Pata (2018).
Meanwhile the following studies found no evidence in sup-port of the EKC hypothesis. They are Apergis et al., (2010), Baek and Pride (2014), Begum et al., (2015), Jebli, Youssef and Ozturk (2015), Lantz and Feng (2006), Soytas, Sari and Ewing (2007), Jaforullah and King (2017), Gamage, Kurup-puge and Haq (2017), Gasimli et al., (2019).
The economic growth-energy consumption-environmental degradation relationship has also been analyzed for Sri Lanka by Azam and Khan (2016), Uddin, Bidisha and Ozturk (2016), Gamage, Kuruppuge and Haq (2017), Sriyalatha (2019) and Gasimli et al., (2019). Azam and Khan (2016) in-vestigated the relationship between urbanization and envi-ronmental degradation using GDP, energy consumption, to-tal population, urban population and arable land as explan-atory variables. From their findings, urbanization contrib-utes to environmental degradation. Uddin, Bidisha and Ozturk (2016) explored granger causality between carbon emission on one hand and energy use, GDP and trade open-ness on the other. The results indicated that economic growth granger causes carbon emission and economic growth granger causes energy use, with both results being unidirectional.
Gamage, Kuruppuge and Haq (2017) introduced tourism into their model. The explanatory variables used were GDP, the square of GDP, energy consumption and tourism. Based on their results, they concluded that the EKC hypothesis does not hold in Sri Lanka although energy use and tourism contributes to environmental degradation. Similarly, Sri-yalatha (2019) while using GDP, trade openness and capital stock, found no evidence to support the EKC hypothesis in Sri Lanka. Finally, Gasimli et al., (2019), included GDP, the square of GDP, energy consumption, urbanization and trade openness in their model. Just like the findings of previous studies, their results gave no evidence in support of the EKC in the country. However, energy consumption, trade open-ness and urbanization did contribute to carbon emission. From the empirical literature reviewed, it was observed that no study has been conducted yet for Sri Lanka which in-cludes financial development and foreign direct investment among the explanatory variables. Also, the applicability of the pollution haven hypothesis is yet to be tested for Sri Lanka. This study hopes to fill that gap by using as many ex-planatory variables as identified in the literature such as en-ergy consumption, real per capita GDP, the square of real per capita GDP, urbanization, financial development, tour-ism and foreign direct investment.
MATERIALS AND METHOD
Following the model specifications used by Ozatac, Gokmen-oglu and Taspinar (2017), Sakiru et al. (2017) and Katircioglu
(2014), this study examined the impact of energy consump-tion, economic growth (GDP), financial development, urban-ization, foreign direct investment (FDI), tourism and trade openness on environmental degradation (represented by carbon emissions CO2). With this model, we are able to test the applicability of the EKC hypothesis to Sri Lanka, identify the major factors causing environmental pollution and as-sess the validity of the pollution haven hypothesis. The model is given in equation 1 as:
CO2 = f(ENC, GDP, GDP2, FD, URB, FDI, TRM, TO)……………………………(1)
All variables have been converted to their natural logarithm. With this, the model becomes:
LnCO2t = αo + β1 LnENCt + β2 LnGDPt + β3 LnGDPt2 + β4 LnFDt
+ β5 LnURBt + β6 LnFDIt + β7 LnTOt + β8 LnTRMt + ut ………(2)
where LnCO2t is Carbon emission measured as metric tons per capita. It was used as a proxy for environmental degra-dation. LnENCt is Energy consumption measured in kg of oil equivalent per capita, LnGDPt is real GDP per capita (at con-stant 2010 US$), LnGDPt
2 is real GDP per capita squared, LnFDt is financial development, represented by the domestic credit provided to the private sector as a percentage of GDP, LnURBt is Urbanization ratio. It is the ratio of the urban pop-ulation to the total population, LnTOt is Trade Openness ra-tio. It is the ratio of the sum of imports and exports to GDP, LnFDI is Foreign direct investment net inflow as a percentage of GDP, LnTRM is Tourism, represented by the number of tourist arrivals, ut is the error term. Annual data from 1971-2014 for these variables were obtained from the World Bank World Development Indicator (2019) and the Sri Lanka Tour-ism Development Annual report (2019).
Descriptive statistics of the data are presented in Table 1 while the correlation analysis is shown in Table 2. The EKC hypothesis can be said to exist in Sri Lanka if β2, the coeffi-cient of GDP is greater than zero (β2>0) and β3, the coeffi-cient of GDP2 is less than zero (β3<0). A rise in energy con-sumption is expected to lead to a rise in carbon emissions and so the coefficient of energy consumption is expected to be positive (β1>0). Similarly, an increased level or urbaniza-tion is likely to be associated with an increased carbon emis-sion level and so the coefficient of urbanization ratio is ex-pected to be positive (β5>0). Tourism coefficient is expected to be positive (β8>0). The coefficient for financial develop-ment (β4) may be positive or negative, depending on how the domestic credit provided to the private sector is utilized. The private sector may either invest in energy efficient tech-nology and mode of production, and this will help to im-prove environmental quality or they may just choose any method of production which might be injurious to the envi-ronment. For trade openness (β7) and FDI (β6), the coeffi-cients may be positive or negative. This is because trade lib-eralization attracts not only foreign goods and services but foreign companies may also decide to set up industries in the host country in the form of FDI. If the foreign companies come along with advanced and environmental friendly tech-nology, carbon emissions will reduce, otherwise emissions will go up, especially if the host country government does not mandate foreign companies to use low carbon emitting methods of production and technology. If carbon emissions and all other forms of pollution rise due to increased FDI, then it means the pollution haven hypothesis is applicable to the host country.
138
Sri Lanka Journal of Social Sciences and Humanities
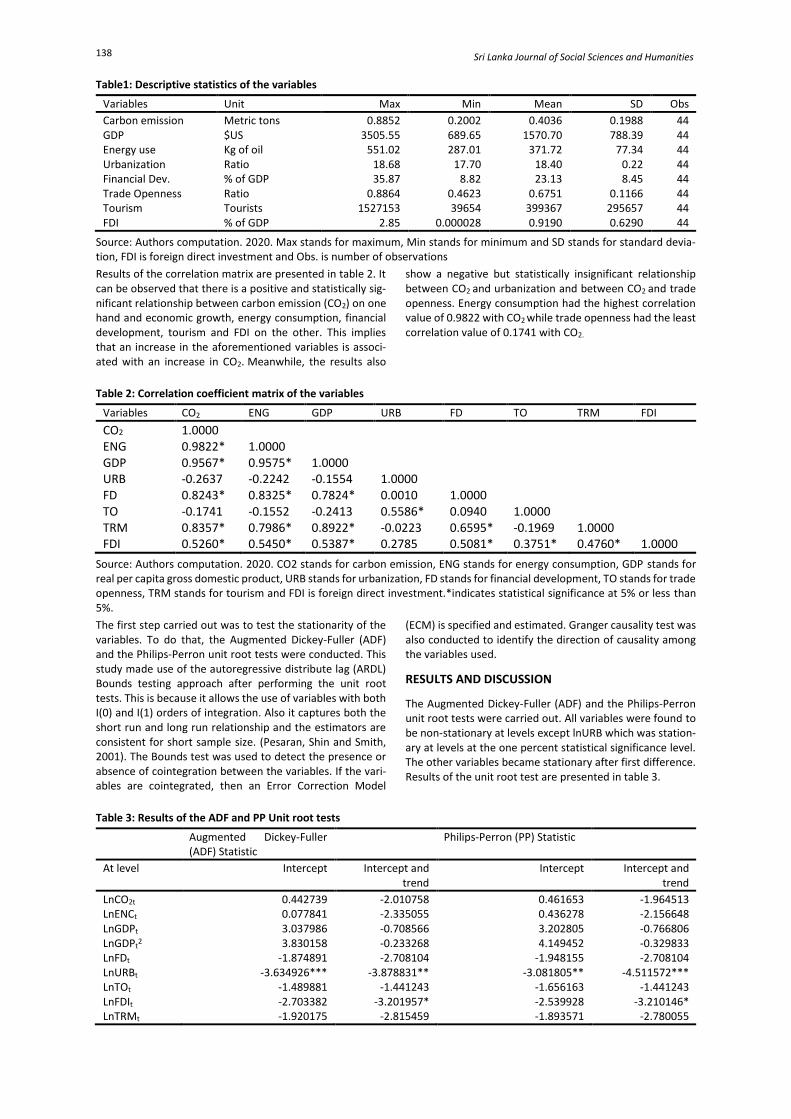
Table1: Descriptive statistics of the variables
Variables Unit Max Min Mean SD Obs
Carbon emission Metric tons 0.8852 0.2002 0.4036 0.1988 44 GDP $US 3505.55 689.65 1570.70 788.39 44 Energy use Kg of oil 551.02 287.01 371.72 77.34 44 Urbanization Ratio 18.68 17.70 18.40 0.22 44 Financial Dev. % of GDP 35.87 8.82 23.13 8.45 44 Trade Openness Ratio 0.8864 0.4623 0.6751 0.1166 44 Tourism Tourists 1527153 39654 399367 295657 44 FDI % of GDP 2.85 0.000028 0.9190 0.6290 44
Source: Authors computation. 2020. Max stands for maximum, Min stands for minimum and SD stands for standard devia-tion, FDI is foreign direct investment and Obs. is number of observations
Results of the correlation matrix are presented in table 2. It can be observed that there is a positive and statistically sig-nificant relationship between carbon emission (CO2) on one hand and economic growth, energy consumption, financial development, tourism and FDI on the other. This implies that an increase in the aforementioned variables is associ-ated with an increase in CO2. Meanwhile, the results also
show a negative but statistically insignificant relationship between CO2 and urbanization and between CO2 and trade openness. Energy consumption had the highest correlation value of 0.9822 with CO2 while trade openness had the least correlation value of 0.1741 with CO2.
Table 2: Correlation coefficient matrix of the variables
Variables CO2 ENG GDP URB FD TO TRM FDI
CO2 1.0000 ENG 0.9822* 1.0000 GDP 0.9567* 0.9575* 1.0000 URB -0.2637 -0.2242 -0.1554 1.0000 FD 0.8243* 0.8325* 0.7824* 0.0010 1.0000 TO -0.1741 -0.1552 -0.2413 0.5586* 0.0940 1.0000 TRM 0.8357* 0.7986* 0.8922* -0.0223 0.6595* -0.1969 1.0000 FDI 0.5260* 0.5450* 0.5387* 0.2785 0.5081* 0.3751* 0.4760* 1.0000
Source: Authors computation. 2020. CO2 stands for carbon emission, ENG stands for energy consumption, GDP stands for real per capita gross domestic product, URB stands for urbanization, FD stands for financial development, TO stands for trade openness, TRM stands for tourism and FDI is foreign direct investment.*indicates statistical significance at 5% or less than 5%.
The first step carried out was to test the stationarity of the variables. To do that, the Augmented Dickey-Fuller (ADF) and the Philips-Perron unit root tests were conducted. This study made use of the autoregressive distribute lag (ARDL) Bounds testing approach after performing the unit root tests. This is because it allows the use of variables with both I(0) and I(1) orders of integration. Also it captures both the short run and long run relationship and the estimators are consistent for short sample size. (Pesaran, Shin and Smith, 2001). The Bounds test was used to detect the presence or absence of cointegration between the variables. If the vari-ables are cointegrated, then an Error Correction Model
(ECM) is specified and estimated. Granger causality test was also conducted to identify the direction of causality among the variables used.
RESULTS AND DISCUSSION
The Augmented Dickey-Fuller (ADF) and the Philips-Perron unit root tests were carried out. All variables were found to be non-stationary at levels except lnURB which was station-ary at levels at the one percent statistical significance level. The other variables became stationary after first difference. Results of the unit root test are presented in table 3.
Table 3: Results of the ADF and PP Unit root tests
Augmented Dickey-Fuller (ADF) Statistic
Philips-Perron (PP) Statistic
At level Intercept Intercept and trend
Intercept Intercept and trend
LnCO2t 0.442739 -2.010758 0.461653 -1.964513 LnENCt 0.077841 -2.335055 0.436278 -2.156648 LnGDPt 3.037986 -0.708566 3.202805 -0.766806 LnGDPt
2 3.830158 -0.233268 4.149452 -0.329833 LnFDt -1.874891 -2.708104 -1.948155 -2.708104 LnURBt -3.634926*** -3.878831** -3.081805** -4.511572*** LnTOt -1.489881 -1.441243 -1.656163 -1.441243 LnFDIt -2.703382 -3.201957* -2.539928 -3.210146* LnTRMt -1.920175 -2.815459 -1.893571 -2.780055
139 Alabi, Ojuolape and Yaqoob, 2021
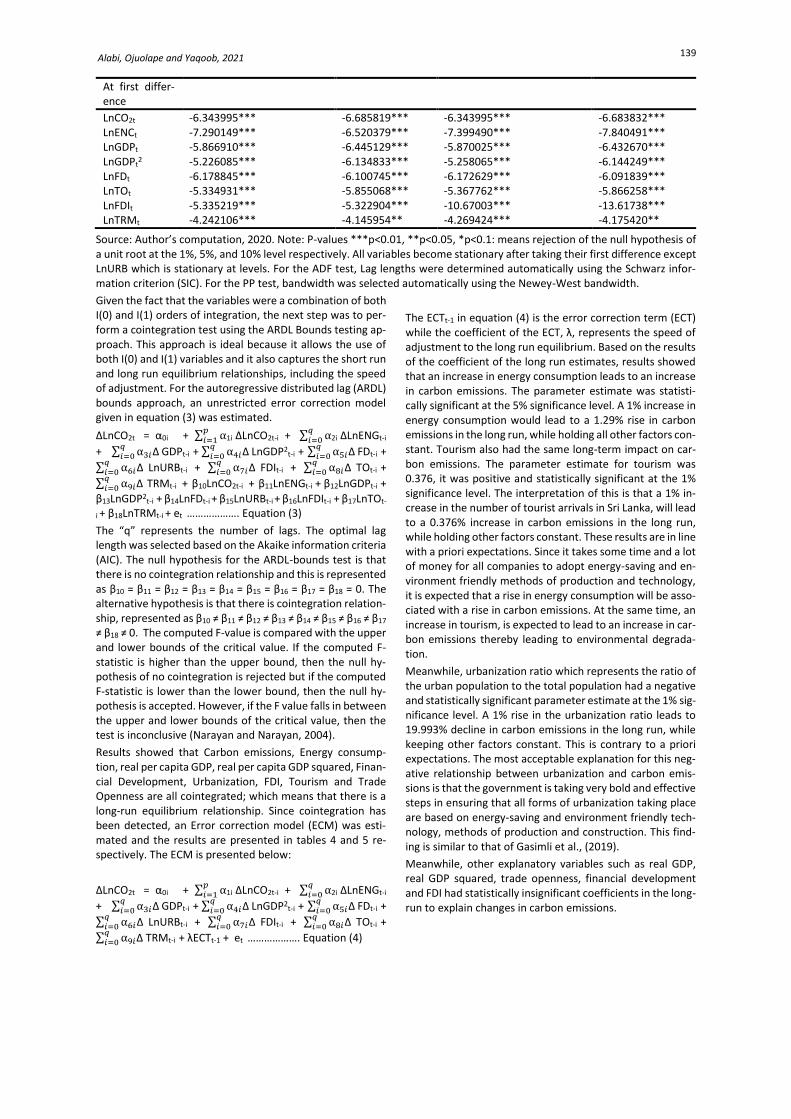
At first differ-ence
LnCO2t -6.343995*** -6.685819*** -6.343995*** -6.683832*** LnENCt -7.290149*** -6.520379*** -7.399490*** -7.840491*** LnGDPt -5.866910*** -6.445129*** -5.870025*** -6.432670*** LnGDPt
2 -5.226085*** -6.134833*** -5.258065*** -6.144249*** LnFDt -6.178845*** -6.100745*** -6.172629*** -6.091839*** LnTOt -5.334931*** -5.855068*** -5.367762*** -5.866258*** LnFDIt -5.335219*** -5.322904*** -10.67003*** -13.61738*** LnTRMt -4.242106*** -4.145954** -4.269424*** -4.175420**
Source: Author’s computation, 2020. Note: P-values ***p<0.01, **p<0.05, *p<0.1: means rejection of the null hypothesis of a unit root at the 1%, 5%, and 10% level respectively. All variables become stationary after taking their first difference except LnURB which is stationary at levels. For the ADF test, Lag lengths were determined automatically using the Schwarz infor-mation criterion (SIC). For the PP test, bandwidth was selected automatically using the Newey-West bandwidth.
Given the fact that the variables were a combination of both I(0) and I(1) orders of integration, the next step was to per-form a cointegration test using the ARDL Bounds testing ap-proach. This approach is ideal because it allows the use of both I(0) and I(1) variables and it also captures the short run and long run equilibrium relationships, including the speed of adjustment. For the autoregressive distributed lag (ARDL) bounds approach, an unrestricted error correction model given in equation (3) was estimated.
∆LnCO2t = α0i + ∑ α𝑝𝑖=1 1i ∆LnCO2t-i + ∑ α
𝑞𝑖=0 2i ∆LnENGt-i
+ ∑ α3𝑖𝑞𝑖=0 ∆ GDPt-i + ∑ α4𝑖
𝑞𝑖=0 ∆ LnGDP2
t-i + ∑ α5𝑖𝑞𝑖=0 ∆ FDt-i +
∑ α6𝑖𝑞𝑖=0 ∆ LnURBt-i + ∑ α7𝑖
𝑞𝑖=0 ∆ FDIt-i + ∑ α8𝑖
𝑞𝑖=0 ∆ TOt-i +
∑ α9𝑖𝑞𝑖=0 ∆ TRMt-i + β10LnCO2t-i + β11LnENGt-i + β12LnGDPt-i +
β13LnGDP2t-i + β14LnFDt-i + β15LnURBt-i + β16LnFDIt-i + β17LnTOt-
i + β18LnTRMt-i + et ………………. Equation (3)
The “q” represents the number of lags. The optimal lag length was selected based on the Akaike information criteria (AIC). The null hypothesis for the ARDL-bounds test is that there is no cointegration relationship and this is represented as β10 = β11 = β12 = β13 = β14 = β15 = β16 = β17 = β18 = 0. The alternative hypothesis is that there is cointegration relation-ship, represented as β10 ≠ β11 ≠ β12 ≠ β13 ≠ β14 ≠ β15 ≠ β16 ≠ β17 ≠ β18 ≠ 0. The computed F-value is compared with the upper and lower bounds of the critical value. If the computed F-statistic is higher than the upper bound, then the null hy-pothesis of no cointegration is rejected but if the computed F-statistic is lower than the lower bound, then the null hy-pothesis is accepted. However, if the F value falls in between the upper and lower bounds of the critical value, then the test is inconclusive (Narayan and Narayan, 2004).
Results showed that Carbon emissions, Energy consump-tion, real per capita GDP, real per capita GDP squared, Finan-cial Development, Urbanization, FDI, Tourism and Trade Openness are all cointegrated; which means that there is a long-run equilibrium relationship. Since cointegration has been detected, an Error correction model (ECM) was esti-mated and the results are presented in tables 4 and 5 re-spectively. The ECM is presented below:
∆LnCO2t = α0i + ∑ α𝑝𝑖=1 1i ∆LnCO2t-i + ∑ α
𝑞𝑖=0 2i ∆LnENGt-i
+ ∑ α3𝑖𝑞𝑖=0 ∆ GDPt-i + ∑ α4𝑖
𝑞𝑖=0 ∆ LnGDP2
t-i + ∑ α5𝑖𝑞𝑖=0 ∆ FDt-i +
∑ α6𝑖𝑞𝑖=0 ∆ LnURBt-i + ∑ α7𝑖
𝑞𝑖=0 ∆ FDIt-i + ∑ α8𝑖
𝑞𝑖=0 ∆ TOt-i +
∑ α9𝑖𝑞𝑖=0 ∆ TRMt-i + λECTt-1 + et ………………. Equation (4)
The ECTt-1 in equation (4) is the error correction term (ECT) while the coefficient of the ECT, λ, represents the speed of adjustment to the long run equilibrium. Based on the results of the coefficient of the long run estimates, results showed that an increase in energy consumption leads to an increase in carbon emissions. The parameter estimate was statisti-cally significant at the 5% significance level. A 1% increase in energy consumption would lead to a 1.29% rise in carbon emissions in the long run, while holding all other factors con-stant. Tourism also had the same long-term impact on car-bon emissions. The parameter estimate for tourism was 0.376, it was positive and statistically significant at the 1% significance level. The interpretation of this is that a 1% in-crease in the number of tourist arrivals in Sri Lanka, will lead to a 0.376% increase in carbon emissions in the long run, while holding other factors constant. These results are in line with a priori expectations. Since it takes some time and a lot of money for all companies to adopt energy-saving and en-vironment friendly methods of production and technology, it is expected that a rise in energy consumption will be asso-ciated with a rise in carbon emissions. At the same time, an increase in tourism, is expected to lead to an increase in car-bon emissions thereby leading to environmental degrada-tion.
Meanwhile, urbanization ratio which represents the ratio of the urban population to the total population had a negative and statistically significant parameter estimate at the 1% sig-nificance level. A 1% rise in the urbanization ratio leads to 19.993% decline in carbon emissions in the long run, while keeping other factors constant. This is contrary to a priori expectations. The most acceptable explanation for this neg-ative relationship between urbanization and carbon emis-sions is that the government is taking very bold and effective steps in ensuring that all forms of urbanization taking place are based on energy-saving and environment friendly tech-nology, methods of production and construction. This find-ing is similar to that of Gasimli et al., (2019).
Meanwhile, other explanatory variables such as real GDP, real GDP squared, trade openness, financial development and FDI had statistically insignificant coefficients in the long-run to explain changes in carbon emissions.
140
Sri Lanka Journal of Social Sciences and Humanities
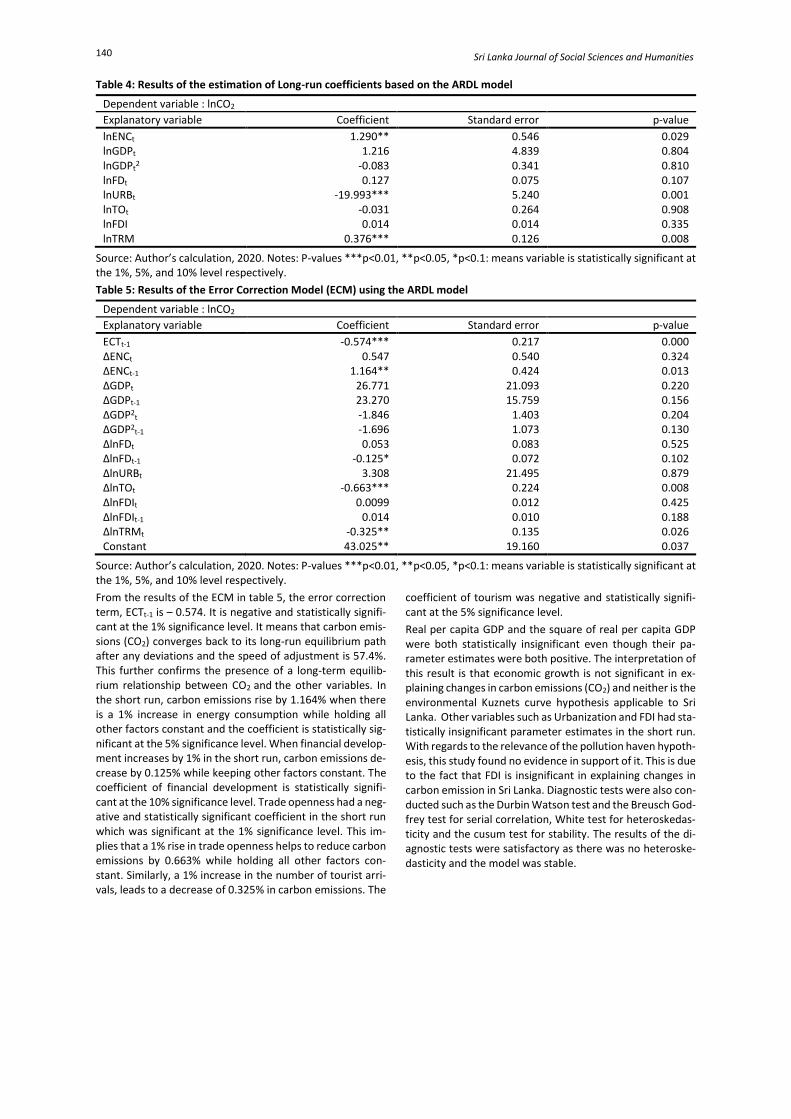
Table 4: Results of the estimation of Long-run coefficients based on the ARDL model
Dependent variable : lnCO2
Explanatory variable Coefficient Standard error p-value
lnENCt 1.290** 0.546 0.029 lnGDPt 1.216 4.839 0.804 lnGDPt
2 -0.083 0.341 0.810 lnFDt 0.127 0.075 0.107 lnURBt -19.993*** 5.240 0.001 lnTOt -0.031 0.264 0.908 lnFDI 0.014 0.014 0.335 lnTRM 0.376*** 0.126 0.008
Source: Author’s calculation, 2020. Notes: P-values ***p<0.01, **p<0.05, *p<0.1: means variable is statistically significant at the 1%, 5%, and 10% level respectively.
Table 5: Results of the Error Correction Model (ECM) using the ARDL model
Dependent variable : lnCO2
Explanatory variable Coefficient Standard error p-value
ECTt-1 -0.574*** 0.217 0.000 ∆ENCt 0.547 0.540 0.324 ∆ENCt-1 1.164** 0.424 0.013 ∆GDPt 26.771 21.093 0.220 ∆GDPt-1 23.270 15.759 0.156 ∆GDP2
t -1.846 1.403 0.204 ∆GDP2
t-1 -1.696 1.073 0.130 ∆lnFDt 0.053 0.083 0.525 ∆lnFDt-1 -0.125* 0.072 0.102 ∆lnURBt 3.308 21.495 0.879 ∆lnTOt -0.663*** 0.224 0.008 ∆lnFDIt 0.0099 0.012 0.425 ∆lnFDIt-1 0.014 0.010 0.188 ∆lnTRMt -0.325** 0.135 0.026 Constant 43.025** 19.160 0.037
Source: Author’s calculation, 2020. Notes: P-values ***p<0.01, **p<0.05, *p<0.1: means variable is statistically significant at the 1%, 5%, and 10% level respectively.
From the results of the ECM in table 5, the error correction term, ECTt-1 is – 0.574. It is negative and statistically signifi-cant at the 1% significance level. It means that carbon emis-sions (CO2) converges back to its long-run equilibrium path after any deviations and the speed of adjustment is 57.4%. This further confirms the presence of a long-term equilib-rium relationship between CO2 and the other variables. In the short run, carbon emissions rise by 1.164% when there is a 1% increase in energy consumption while holding all other factors constant and the coefficient is statistically sig-nificant at the 5% significance level. When financial develop-ment increases by 1% in the short run, carbon emissions de-crease by 0.125% while keeping other factors constant. The coefficient of financial development is statistically signifi-cant at the 10% significance level. Trade openness had a neg-ative and statistically significant coefficient in the short run which was significant at the 1% significance level. This im-plies that a 1% rise in trade openness helps to reduce carbon emissions by 0.663% while holding all other factors con-stant. Similarly, a 1% increase in the number of tourist arri-vals, leads to a decrease of 0.325% in carbon emissions. The
coefficient of tourism was negative and statistically signifi-cant at the 5% significance level.
Real per capita GDP and the square of real per capita GDP were both statistically insignificant even though their pa-rameter estimates were both positive. The interpretation of this result is that economic growth is not significant in ex-plaining changes in carbon emissions (CO2) and neither is the environmental Kuznets curve hypothesis applicable to Sri Lanka. Other variables such as Urbanization and FDI had sta-tistically insignificant parameter estimates in the short run. With regards to the relevance of the pollution haven hypoth-esis, this study found no evidence in support of it. This is due to the fact that FDI is insignificant in explaining changes in carbon emission in Sri Lanka. Diagnostic tests were also con-ducted such as the Durbin Watson test and the Breusch God-frey test for serial correlation, White test for heteroskedas-ticity and the cusum test for stability. The results of the di-agnostic tests were satisfactory as there was no heteroske-dasticity and the model was stable.
141 Alabi, Ojuolape and Yaqoob, 2021
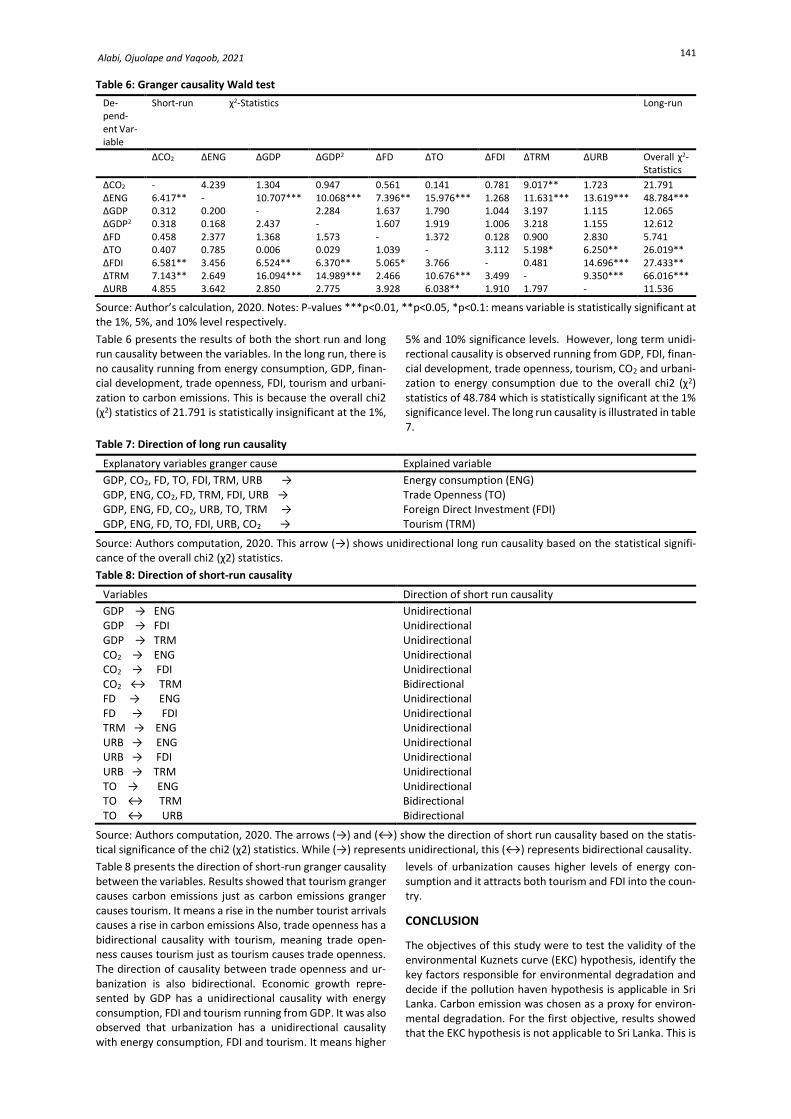
Table 6: Granger causality Wald test
De-pend-ent Var-iable
Short-run ꭓ2-Statistics Long-run
∆CO2 ∆ENG ∆GDP ∆GDP2 ∆FD ∆TO ∆FDI ∆TRM ∆URB Overall ꭓ2-Statistics
∆CO2 - 4.239 1.304 0.947 0.561 0.141 0.781 9.017** 1.723 21.791 ∆ENG 6.417** - 10.707*** 10.068*** 7.396** 15.976*** 1.268 11.631*** 13.619*** 48.784*** ∆GDP 0.312 0.200 - 2.284 1.637 1.790 1.044 3.197 1.115 12.065 ∆GDP2 0.318 0.168 2.437 - 1.607 1.919 1.006 3.218 1.155 12.612 ∆FD 0.458 2.377 1.368 1.573 - 1.372 0.128 0.900 2.830 5.741 ∆TO 0.407 0.785 0.006 0.029 1.039 - 3.112 5.198* 6.250** 26.019** ∆FDI 6.581** 3.456 6.524** 6.370** 5.065* 3.766 - 0.481 14.696*** 27.433** ∆TRM 7.143** 2.649 16.094*** 14.989*** 2.466 10.676*** 3.499 - 9.350*** 66.016*** ∆URB 4.855 3.642 2.850 2.775 3.928 6.038** 1.910 1.797 - 11.536
Source: Author’s calculation, 2020. Notes: P-values ***p<0.01, **p<0.05, *p<0.1: means variable is statistically significant at the 1%, 5%, and 10% level respectively.
Table 6 presents the results of both the short run and long run causality between the variables. In the long run, there is no causality running from energy consumption, GDP, finan-cial development, trade openness, FDI, tourism and urbani-zation to carbon emissions. This is because the overall chi2 (ꭓ2) statistics of 21.791 is statistically insignificant at the 1%,
5% and 10% significance levels. However, long term unidi-rectional causality is observed running from GDP, FDI, finan-cial development, trade openness, tourism, CO2 and urbani-zation to energy consumption due to the overall chi2 (ꭓ2) statistics of 48.784 which is statistically significant at the 1% significance level. The long run causality is illustrated in table 7.
Table 7: Direction of long run causality
Explanatory variables granger cause Explained variable
GDP, CO2, FD, TO, FDI, TRM, URB → Energy consumption (ENG) GDP, ENG, CO2, FD, TRM, FDI, URB → Trade Openness (TO) GDP, ENG, FD, CO2, URB, TO, TRM → Foreign Direct Investment (FDI) GDP, ENG, FD, TO, FDI, URB, CO2 → Tourism (TRM)
Source: Authors computation, 2020. This arrow (→) shows unidirectional long run causality based on the statistical signifi-cance of the overall chi2 (ꭓ2) statistics.
Table 8: Direction of short-run causality
Variables Direction of short run causality
GDP → ENG Unidirectional GDP → FDI Unidirectional GDP → TRM Unidirectional CO2 → ENG Unidirectional CO2 → FDI Unidirectional CO2 ↔ TRM Bidirectional FD → ENG Unidirectional FD → FDI Unidirectional TRM → ENG Unidirectional URB → ENG Unidirectional URB → FDI Unidirectional URB → TRM Unidirectional TO → ENG Unidirectional TO ↔ TRM Bidirectional TO ↔ URB Bidirectional
Source: Authors computation, 2020. The arrows (→) and (↔) show the direction of short run causality based on the statis-tical significance of the chi2 (ꭓ2) statistics. While (→) represents unidirectional, this (↔) represents bidirectional causality.
Table 8 presents the direction of short-run granger causality between the variables. Results showed that tourism granger causes carbon emissions just as carbon emissions granger causes tourism. It means a rise in the number tourist arrivals causes a rise in carbon emissions Also, trade openness has a bidirectional causality with tourism, meaning trade open-ness causes tourism just as tourism causes trade openness. The direction of causality between trade openness and ur-banization is also bidirectional. Economic growth repre-sented by GDP has a unidirectional causality with energy consumption, FDI and tourism running from GDP. It was also observed that urbanization has a unidirectional causality with energy consumption, FDI and tourism. It means higher
levels of urbanization causes higher levels of energy con-sumption and it attracts both tourism and FDI into the coun-try.
CONCLUSION
The objectives of this study were to test the validity of the environmental Kuznets curve (EKC) hypothesis, identify the key factors responsible for environmental degradation and decide if the pollution haven hypothesis is applicable in Sri Lanka. Carbon emission was chosen as a proxy for environ-mental degradation. For the first objective, results showed that the EKC hypothesis is not applicable to Sri Lanka. This is
142
Sri Lanka Journal of Social Sciences and Humanities
similar to the findings of Gamage, Kuruppuge and Haq (2017) and Gasimli et al., (2019). It means the relationship between economic growth and carbon emissions does not follow the inverted “U” curve as speculated by the EKC hy-pothesis. Although economic growth (GDP) had a positive relationship with carbon emission (CO2), it was statistically insignificant. The square of GDP, (GDP2) had a negative rela-tionship with CO2 but it was also statistically insignificant.
For the second objective, findings of this study identified the major factors responsible for the quality of the environment in Sri Lanka to be energy consumption, tourism, urbaniza-tion, trade openness and financial development. Energy consumption was found to be a key factor both in the short run and in the long run, responsible for the decline in the quality of the environment. Higher energy use resulted in lower quality of the environment. Gamage, Kuruppuge and Haq (2017) and Gasimli et al., (2019) also reported similar result. The policy implication of this is for the government of Sri Lanka to work towards adopting energy saving and envi-ronmental friendly technologies and production processes. This can be achieved if government, in conjunction with the private sector, invests heavily into research and develop-ment. Also, regulations should be put in place to enforce this. Various incentives can be given to companies and indi-vidual that comply with the government initiative to cut down carbon emissions.
Tourism, represented by the number of tourist arrivals, in the short run, had a negative relationship with carbon emis-sions. The implication of this is that as more tourists arrive into the country, the quality of the environment improves. However, in the long run, the relationship changes to posi-tive, meaning tourism no longer becomes friendly to the en-vironment rather it becomes harmful. More tourist arrivals leads to increased carbon emission. This study recommends that government should study the tourism industry, its play-ers and the tourists with a view to reducing pollution from the industry in the long run. As for urbanization, in the long run, it improves the quality of the environment. This is prob-ably due to increased efficiency in the provision of public utilities. This finding is similar to that of Gasimli et al., (2019). As the country develops and opens up more urban areas, it is imperative for government to make sure that right from the beginning, all technologies and methods of production and construction in these new urban areas are environment friendly.
Trade openness helps to improve the quality of the environ-ment as it has a negative relationship with carbon emissions. This is contrary to the findings of Sriyalatha (2019) who re-ported that trade causes more damage to the environmen-tal quality. The implication of this finding is that as Sri Lanka opens up to trade, it has put in place measures to ensure that all forms of trade and production coming from outside the country are energy-saving and environment friendly. In addition to that, it means majority of the foreign firms that are into trade with Sri Lanka are already using green tech-nology. Financial development, which was represented by domestic credit provided to the private sector also helped to boost the quality of the environment. With improved finan-cial development, environmental degradation decreased. This is most likely due to the fact that the private sector is gradually beginning to adopt energy-saving and environ-mental friendly technologies. This study recommends that government should strive to make more domestic credit available and accessible to the private sector.
Lastly, the third objective was to test the applicability of the pollution haven hypothesis in the country. Going by the find-ings of this study, it can be concluded that the pollution ha-ven hypothesis is not applicable to Sri Lanka. This is because the hypothesis postulates that increased FDI leads to in-creased pollution for the host country. However, in the case of Sri Lanka, FDI was found not to be a statistically significant variable in explaining the changes in environmental pollu-tion. By extension, it means that at the moment, FDI is not a source of concern to the government with regards to its im-pact on the quality of the environment. In the meantime, government can begin to implement FDI policies that would ensure that foreign companies bring in and make use of ad-vanced and environmental friendly technologies in their production process. Long run granger causality revealed a unidirectional causality running from GDP, FDI, carbon emis-sions, urbanization, financial development, trade openness, and tourism to energy consumption. In the short run, bidi-rectional causality was observed between carbon emissions and tourism; between trade openness and tourism and be-tween trade openness and urbanization. As expected, there was unidirectional causality from GDP to energy use. In con-clusion, this study has succeeded in achieving its research objectives.
This study contributes to the knowledge gap in two ways. First, it brings together, in a single study for Sri Lanka, the largest number of explanatory variables known in the litera-ture to contribute to carbon emissions. Such factors include: energy consumption, real per capita GDP, the square of real per capita GDP, urbanization, financial development, tour-ism and foreign direct investment (FDI). Secondly, it tests the pollution haven hypothesis for Sri Lanka.
REFERENCES
Ahmad, N., Du, L., Lu, J., Wang, J., Li, H. Z. & Hashmi, M. Z. (2016). Mod-elling the
CO2 emissions and Economic growth in Croatia: Is there any Environmen-tal Kuznets Curve? Energy, 123, 164–172.
Al-Mulali, U. & Ozturk, I. (2016). The investigation of environmental Kuz-nets curve
hypothesis in the advanced economies: The role of energy prices, Re-newable and Sustainable Energy Reviews, 54, 1622-1631.
https://doi.org/10.1016/j.rser.2015.10.131
Al-Mulali, U., Weng-Wai, C., Sheau-Ting, L. & Mohammed, A. H. (2015).
Investigating the environmental Kuznets curve (EKC) hypothesis by uti-lizing the ecological footprint as an indicator of environmental degra-dation, Ecological Indicators, 48, 315–23.
Alshehry, A. S. (2015). Economic Growth and Environmental Degrada-tion in Saudi
Arabia, Journal of Economics and Sustainable Development, 6(2), 33-44.
Alvarez-Herranz, A., Balsalobre, D., Cantos, J. M. & Shahbaz, M. (2017). Energy
Innovations-GHG Emissions Nexus: Fresh Empirical Evidence from OECD Countries, Energy Policy, 101, 90-100.
https://doi.org/10.1016/j.enpol.2016.11.030
Ang, J. B. (2007). CO2 emissions, energy consumption, and output in France, Energy
Policy, 35(10), 4772–4778.
Ang, J. B. (2008). Economic development, pollutant emissions and en-ergy
consumption in Malaysia, Journal of Policy Modeling, 30, 271–278.
Apergis, N. & Ozturk, I. (2015). Testing environmental Kuznets curve hy-pothesis in
Asian countries, Ecological Indicators, 52, 16–22.
143 Alabi, Ojuolape and Yaqoob, 2021
Apergis, N. & Payne J. E. (2009). CO2 emissions, energy usage, and output in Central
America, Energy Policy, 37(8), 3282–3286.
https://doi.org/10.1016/j.enpol.2009.03.048
Apergis, N., Payne, J. E., Menyah, K. & Wolde-Rufael, Y. (2010). On the causal
dynamics between emissions, nuclear energy, renewable energy, and economic growth, Ecological Economics, 69, 2255–2260.
Atici, C. (2009). Carbon emissions in Central and Eastern Europe: envi-ronmental
Kuznets curve and implications for sustainable development, Sustaina-ble Development, 17(3), 155–160.
Azam, M. & Khan, A. (2016). Urbanization and Environmental Degrada-tion:
Evidence from Four SAARC Countries—Bangladesh, India, Pakistan, and Sri Lanka, Environmental Progress and Sustainable Energy, 35(3), 823-852.
https://doi.org/10.1002/ep
Azam, M., Alam, M. M. & Hafeez, M. H. (2018). Effect of Tourism on En-vironmental
Pollution: Further Evidence from Malaysia, Singapore and Thailand, Jour-nal of Cleaner Production, 190, 330-338.
https://doi.org/10.1016/j.jclepro.2018.04.168
Baek, J. (2015). A panel cointegration analysis of CO2 emissions, nuclear energy and
income in major nuclear generating countries, Applied Energy, 145, 133–138.
Baek, J. & Pride, D. (2014). On the income-nuclear energy-CO2 emissions nexus
revisited, Energy Economics, 43, 6–10.
Begum, R. A., Sohag, K., Abdullah, S. M. S. & Jaafar M. (2015). CO2 emis-sions, energy
consumption, economic and population growth in Malaysia, Renewable and Sustainable Energy Reviews, 41, 594–601.
Bilgili, F., Kocak, E. & Bulut, U. (2016). The dynamic impact of renewable energy
consumption on CO2 emissions: A revisited Environmental Kuznets Curve approach, Renewable and Sustainable Energy Reviews, 54, 838–845.
https://doi.org/10.1016/j.rser.2015.10.080
Boluk, G. & Mert, M. (2015). The renewable energy, growth and environ-mental
Kuznets curve in Turkey: An ARDL approach, Renewable and Sustainable Energy Reviews, 52, 587–595.
https://doi.org/10.1016/j.rser.2015.07.138 Boutaud, A., Natacha, G. & Christian, B. (2006). Local environmental
quality versus
(global) ecological carrying capacity: what might alternative aggregated indicators bring to the debates about Environmental Kunzites curves and sustainable development, International Journal of Sustainable Development, 9(3), 297–310.
https://doi.org/10.1504/ijsd.2006.012850
Bouznit, M. & Pablo-Romero, M. P. (2016). CO2 emission and economic growth in
Algeria, Energy Policy, 96, 93–104.
https://doi.org/10.1016/j.enpol.2016.05.036
Caviglia-Harris, L. J., Chambers, D. & Kahn, R. J. (2009). Taking the “U” out of
Kuznets: A comprehensive analysis of the EKC and environmental degra-dation, Ecological Economics, 68, 1149–59.
Central Bank of Sri Lanka (2019). Annual Report
Cialani, C. (2007). Economic growth and environmental quality: An econ-ometric and
a decomposition analysis. Management of Environmental Quality, 18(5), 568–577.
https://doi.org/10.1108/14777830710778328
Cole, M. A., Rayner, A. J. & Bates, J. M. (1997). The environmental Kuz-nets curve: an
empirical analysis, Environment and Development Economics, 2(4), 401-416.
Dogan, E. & Turkekul, B. (2016). CO2 emissions, real output, energy con-sumption,
trade, urbanization and financial development: Testing the EKC hypoth-esis for the USA, Environmental Science and Pollution Research, 23(2), 1203-1213.
Fan, C. & Zheng, X. (2013). An empirical study of the environmental Kuz-nets curve
in Sichuan Province, China, Environment and Pollution, 2(3), 107-116.
https://doi.org/10.5539/ep.v2n3p107 Farhani, S. & Ozturk, I. (2015). Causal relationship between CO2 emis-
sions, real GDP,
energy consumption, financial development, trade openness, and ur-banization in Tunisia, Environmental Science and Pollution Research, 22(20), 15663-15676.
Gamage, S. K. N., Kuruppuge, R. H. & Haq, I. (2017). Energy consumption, tourism
development and environmental degradation in Sri Lanka. Energy Sources Part B: Economics, Planning and Policy, 12, 910–916.
Gasimli, O., Haq, I. Gamage S. K. N., Shihadeh, F., Rajapakshe P. S. K. & Shafiq, M.
(2019). Energy, Trade, Urbanization and Environmental Degradation Nexus in Sri Lanka: Bounds Testing Approach, Energies, 12(1655), 1-15.
https://doi.org/10.3390/en12091655
Gene, M. G. & Alan, B. (1995). Economic Growth and the Environment, The
Quarterly Journal of Economics, 110(2), 353–377, [Online] Available from: http://www.jstor.org/stable/2118443 [Accessed: 20th August 2020].
Grossman, G. M. & Krueger, A. B. (1991). Environmental Impacts of a North
American Free Trade Agreement, Working paper no. w3914, Cambridge: National Bureau of Economic Research.
Halicioglu, F. (2009). An econometric study of CO2 emissions, energy consumption,
income and foreign trade in Turkey, Energy Policy, 37(3), 1156–1164.
http://doi.org/10.1016/j.enpol.2008.11.012
Hao, Y., Chen, H., Wei, Y. M. & Li, Y. M. (2016). The influence of climate change on
CO2 (carbon dioxide) emissions: An empirical estimation based on Chi-nese provincial panel data, Journal of Cleaner Production, 131, 667–677.
Heidari, H., Katircioglu, S. & Saeidpour, L. (2015). Economic growth, CO2 emissions,
and energy consumption in the five ASEAN countries, International Jour-nal of Electrical Power and Energy Systems, 64, 785–791.
Ho, C-Y. & Siu, K. W. (2007). A dynamic equilibrium of electricity con-sumption and
GDP in Hong Kong: An empirical investigation, Energy Policy, 35(4), 2507–2513.
Holtz-Eakin, D. & Selden, T. M. (1995). Stoking the fires? CO2 emissions and
economic growth, Journal of Public Economics, 57(1), 85-101.
Ibrahim, M. H. & Law S. H. (2014). Social capital and CO2 emission–out-put relations:
A panel analysis, Renewable and Sustainable Energy Reviews, 29, 528–534.
Iwata, H., Okada, K. & Samreth, S. (2011). A note on the environmental Kuznets curve
for CO2: A pooled mean group approach, Applied Energy, 88(5), 1986-1996.
Iwata, H., Okada, K. & Samreth, S. (2012). Empirical study on the deter-minants of
144
Sri Lanka Journal of Social Sciences and Humanities
CO2 emissions: Evidence from OECD countries, Applied Economics, 44, 3513–3519.
Jaforullah, M. & King, A. (2017). The econometric consequences of an energy
consumption variable in a model of CO2 emissions, Energy Economics, 63, 84-91.
Jebli, M. B., Youssef, M. B. & Ozturk, I. (2015). The Role of renewable energy
consumption and trade: Environmental Kuznets Curve Analysis for Sub-Saharan African Countries, African Development Review, 27(3), 288–300.
Katircioglu, S. T. (2014). Testing the tourism-induced EKC hypothesis: The case of
Singapore, Economic Modelling, 41, 383–391.
https://doi.org/10.1016/j.econmod.2014.05.028
Kuznets, S. (1955). Economic Growth and Income Inequality. The Ameri-can
Economic Review, 45(1), 1-28.
Lantz, V. & Feng, Q. (2006). Assessing income, population, and technol-ogy impacts
on CO2 emissions in Canada: Where's the EKC? Ecological Economics, 57(2), 229–238.
Li, T., Wang, Y. & Zhao, D. (2016). Environmental Kuznets Curve in China: New
Evidence from Dynamic Panel Analysis, Energy Policy, 91, 138–147.
Lin, B., Omoju, O. E., Nwakeze, N. M., Okonkwo, J. U. & Megbowon, E. T. (2016). Is
the environmental Kuznets curve hypothesis a sound basis for environ-mental policy in Africa? Journal of Cleaner Production, 133, 712–724.
Liu, Q., Wang, S., Zhang, W., Zhan, D. & Li, J. (2018). Does foreign direct investment
affect environmental pollution in China's cities? A spatial econometric perspective, Science of the Total Environment, 613, 521–529.
Liu, X. & Bae, J. (2018). Urbanization and industrialization impact of CO2 emissions
in China, Journal of Cleaner Production, 172, 178–186.
https://doi.org/10.1016/j.jclepro.2017.10.156
Lopez-Menendez, A. J., Perez, R. & Moreno, B. (2014). Environmental costs and
renewable energy: Re-visiting the Environmental Kuznets Curve, Journal of Environmental Management, 145, 368-373.
https://doi.org/10.1016/j.jenvman.2014.07.017
Moghadam, H. E. & Dehbashi, V. (2017). The impact of financial devel-opment and
trade on environmental quality in Iran. Empirical Economics, 54(4), 1777-1799.
Narayan, P. K. & Narayan, S. (2004). The J-curve: Evidence from Fiji, In-ternational
Journal of Applied Economics, 18, 369–380.
Nasir, M. & Rehman F. U. (2011). Environmental Kuznets Curve for car-bon emissions
in Pakistan: an empirical investigation, Energy Policy, 39(3), 1857–1864.
https://doi.org/10.1016/j.enpol.2011.01.025
Nasreen, S., Anwar, S. & Ozturk, I. (2017). Financial stability, energy con-sumption
and environmental quality: Evidence from South Asian economies, Re-newable and Sustainable Energy Reviews, 67, 1105-1122.
Nassani, A. A., Aldakhil, A. M., Abro, Q. M. & Zaman, K. (2017). Environ-mental
Kuznets curve among BRICS countries: Spot lightening finance, transport, energy and growth factors, Journal of Cleaner Production, 154, 474–487.
http://doi.org/10.1016/j.jclepro.2017.04.025
Ozatac, N., Gokmenoglu, K. K. & Taspinar, N. (2017). Testing the EKC hy-pothesis by
considering trade openness, urbanization, and financial development: The case of Turkey, Environmental Science and Pollution Research, 24(20), 16690-16701.
https://doi.org/10.1007/s11356-017-9317-6
Ozturk, I. & Acaravci, A. (2010). CO2 Emissions, Energy Consumption and Economic
Growth in Turkey, Renewable and Sustainable Energy Reviews, 14, 3220-3225.
Pal, D. & Mitra, S. K. (2017). The environmental Kuznets curve for carbon dioxide in
India and China: Growth and pollution at crossroad, Journal of Policy Modeling, 39(2), 371-385.
Pata, U. K. (2018). Renewable Energy Consumption, Urbanization, Finan-cial
Development, Income and CO2 Emissions in Turkey: Testing EKC Hypoth-esis with Structural Breaks, Journal of Cleaner Production, 187, 770-779
https://doi.org/10.1016/j.jclepro.2018.03.236
Payne, J. E. (2009). On the dynamics of energy consumption and output in the US,
Applied Energy, 86(4), 575–577.
Pesaran, M. H., Shin, Y. & Smith, R. (2001). Bounds testing approaches to the analysis
of level relationships, Journal of Applied Econometrics, 16(3), 289–326.
https://doi.org/10.1002/jae.616
Qureshi, M. I., Hassan, M. A., Hishan, S. S., Rasli, A. M. & Zaman, K. (2017). Dynamic
linkages between sustainable tourism, energy, health and wealth: Evi-dence from top 80 international tourist destination cities in 37 coun-tries, Journal of Cleaner Production, 158, 143–155.
Robalino-Lopez, A., Mena-Nieto, A., Garcia-Ramos, J-E. & Golpe, A. A. (2015).
Studying the relationship between economic growth, CO2 emissions, and the environmental Kuznets curve in Venezuela (1980–2025), Renew-able and Sustainable Energy Reviews, 41, 602–614.
Richmond, A. K. & Kaufmann, R. K. (2006). Is there a turning point in the
relationship between income and energy use and/or carbon emissions? Ecological Economics, 56(2), 176-189.
Saboori, B., Sulaiman, J. B. & Mohd, S. (2012). An Empirical Analysis of the
Environmental Kuznets Curve for CO2 Emissions in Indonesia: The Role of Energy Consumption and Foreign Trade, International Journal of Economics and Finance, 4(2), 243–251.
Seker, F., Ertugul, H. M. & Cetin, M. (2015). The impact of foreign direct investment
on environmental quality: A bounds testing and causality analysis for Turkey, Renewable and Sustainable Energy Reviews, 52, 347–356.
https://doi.org/10.1016/j.rser.2015.07.118
Shahbaz, M. & Sinha, A. (2019). Environmental Kuznets curve for CO2 emissions: A
literature survey, Journal of Economic Studies, 46(1), 106-168.
https://doi.org/10.1108/JES-09-2017-0249
Solarin, S. A., Al-Mulali, U., Musah, I, & Ozturk, I. (2017). Investigating the Pollution
Haven Hypothesis in Ghana: An Empirical Investigation, Energy, 124, 706-719.
https://doi.org/10.1016/j.energy.2017.02.089
Soytas, U., Sari, R. & Ewing, B. T. (2007). Energy consumption, income, and carbon
emissions in the United States, Ecological Economics, 62(3), 482–489.
Sri Lanka Tourism Development Authority (2019). Annual report for 2019.
Sriyalatha, M. A. K. (2019). An empirical study of the relationships be-tween CO2
emissions, trade openness and economic growth in south Asian coun-tries, Sri Lankan Journal of Business Economics, 8(1), 24-45.
145 Alabi, Ojuolape and Yaqoob, 2021
Stern, D. I. (2004). The rise and fall of the environmental Kuznets curve, World
Development, 32(8), 1419–1439.
Tang, C. F. & Tan, B. W. (2015). The impact of energy consumption, in-come and
foreign direct investment on carbon dioxide emissions in Vietnam, En-ergy, 79, 447-454.
Tutulmaz, O. (2015). Environmental Kuznets curve time series applica-tion for
Turkey: Why controversial results exist for similar modes? Renewable and Sustainable Energy Reviews, 50, 73–81.
Uddin, G. S., Bidisha, S. H. & Ozturk, I. (2016). Carbon Emissions, Energy
Consumption, and Economic Growth Relationship in Sri Lanka, Energy Sources, Part B: Economics, Planning and Policy, 11(3), 282-287.
https://doi.org/10.1080/15567249.2012.694577
Youssef, A. B., Hammoudeh, S. & Omri, A. (2016). Simultaneity modeling analysis of
the environmental Kuznets curve hypothesis, Energy Economics, 60, 266–274.
Zhang, S., Liu, X. & Bae, J. (2017). Does trade openness affect CO2 emis-sions:
evidence from ten newly industrialized countries? Environmental Sci-ence and Pollution Research, 24, 17616-17625.
Zhang, X-P. & Cheng, X-M. (2009). Energy consumption, carbon emis-sions, and
economic growth in China, Ecological Economics, 68(10), 2706–2712.
World Bank (2019). World Development Indicators [Online] Available from:
http://data.worldbank.org/data-catalog/world-development-indicators (Accessed 20th August 2020).