Embed Size (px)
Citation preview
Economic Impact Assessment of KoebergPower StationEskom Holdings SOC Ltd.
March 2017
2

3
DisclaimerThis report has been prepared by KPMG Services (Pty) Ltd (“KPMG”) exclusively for thebenefit, information use of ESKOM for the exclusive purposes of/in order to assist ESKOMto estimate the socio-economic impact of the Koeberg nuclear power plant’s capital andoperational infrastructure expenditure between 2012/13 to 2024/25.
KPMG has been informed and requested by ESKOM that this report may be published, aswell as shared individually with third parties. Notwithstanding the provisions of theEngagement Letter and Terms and Conditions, KPMG is willing to give its consent forESKOM to do so on the following basis:• KPMG accepts no liability to any third party in connection with the Services; and• KPMG does not have a duty of care or any legal obligation to any third party in
connection with the Services.
4
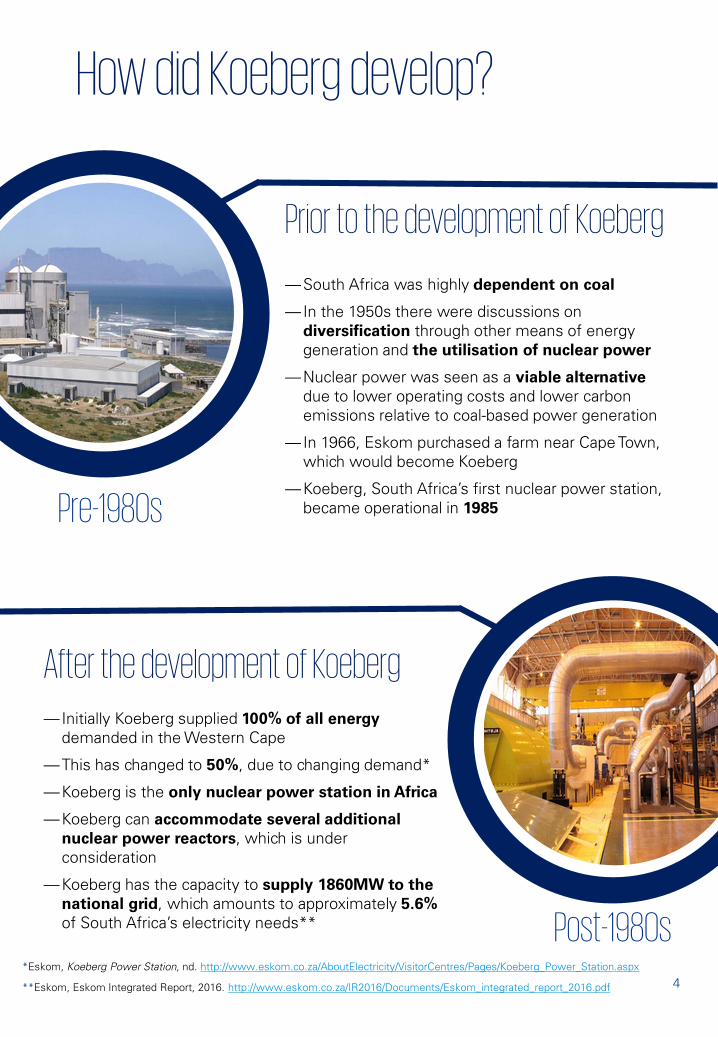
Prior to the development of Koeberg
—South Africa was highly dependent on coal
—In the 1950s there were discussions on diversification through other means of energy generation and the utilisation of nuclear power
—Nuclear power was seen as a viable alternative due to lower operating costs and lower carbon emissions relative to coal-based power generation
—In 1966, Eskom purchased a farm near Cape Town, which would become Koeberg
—Koeberg, South Africa’s first nuclear power station, became operational in 1985Pre-1980s
After the development of Koeberg—Initially Koeberg supplied 100% of all energy
demanded in the Western Cape
—This has changed to 50%, due to changing demand*
—Koeberg is the only nuclear power station in Africa
—Koeberg can accommodate several additional nuclear power reactors, which is under consideration
—Koeberg has the capacity to supply 1860MW to the national grid, which amounts to approximately 5.6%of South Africa’s electricity needs** Post-1980s
How did Koeberg develop?
*Eskom, Koeberg Power Station, nd. http://www.eskom.co.za/AboutElectricity/VisitorCentres/Pages/Koeberg_Power_Station.aspx
**Eskom, Eskom Integrated Report, 2016. http://www.eskom.co.za/IR2016/Documents/Eskom_integrated_report_2016.pdf

5
Electricity is a key input for the majority of products and processes in our economy, making Koeberg a
direct contributor to economic growth, both in the Western Cape and South Africa
Koeberg’s forward and backward linkages with other industries expands on this
direct impact in the form of indirect and induced impacts
IRP key targets
Increase generation capacity to 81 350MWby 2030*
Through Koeberg’s planned investment, Eskom is on track to
contribute to achieving this target
Integrated Resource Plan (IRP)
Koeberg’s investment in infrastructure contributed positively towards improving economic development in the Western Cape, as well as the rest of
South Africa over the past few years
2012/13
to
2015/16
Koeberg’s electricity generation and operations contributed to a more efficient and productive economy through the long-term nature of the economic benefit streams it created, especially in downstream user industries
It is also evident that future investment in Koeberg will continue to have a positive impact on the Western Cape and South African economies
Koeberg and economic growth
Koebergproduces
energy in a cheap and
reliable way
*Integrated Resource Plan, IRP 2010-2030. http://www.energy.gov.za/files/irp_frame.html

6
Koeberg’s estimated combined impact
16 647on average per year, in the rest of South Africa
19 086on average per year, in Western Cape
Estimated economic activity of
R53.3 billion
Estimated government revenue
of R16.4 billion
R23.1 billionin the rest of South Africa
R30.2 billionin Western Cape
R8.6 billionin the rest of South Africa
R7.8 billionin Western Cape
Sustained on average per year, 1 786 direct jobs
and created 14 110 indirect and 19 837 induced
jobs
Current (2012/13 – 2015/16)
Source: KPMG analysis from 2014 Social Accounting Matrix for South Africa and Western Cape

7
Estimated economic activity of
R52.9 billion
Estimated government revenue
of R16.4 billion
R23.3 billionin the rest of South Africa
R29.6 billionin Western Cape
17 190on average per year, in the rest of South Africa
19 538on average per year, in Western Cape
R8.7 billionin the rest of South Africa
R7.7 billionin Western Cape
Estimated to sustain on average per year 1 564
direct jobs and create 14 852 indirect and 20 312
induced jobs
Planned (2016/17 – 2019/20)
through investment and operations
Source: KPMG analysis from 2014 Social Accounting Matrix for South Africa and Western Cape

8
Koeberg’s estimated contribution to long-…through future capital investments
Capital investment is important to ensure Koeberg’s sustained existence which includes operational projects as well as plant and machinery
Potential poverty alleviation as 14% of household income generated in the
Western Cape and 17% in the rest of South Africa will flow to low-income households
Every R1 new investment
potentially adds 36 cents to national government revenue
3 jobs in the Western Cape
and 1 job in the rest of South
Africa per R1 millioninvested
Every R1 of new investment
potentially adds 70 cents to the Western Cape
economy and another 50 cents to the rest of South Africa’s GDP
Source: KPMG analysis from 2014 Social Accounting Matrix for South Africa and Western Cape

9
term economic development
Since GDP represents the total value of all final goods and services produced in the country, it is fundamental to estimate Koeberg’s contribution through day-to-day operations towards economic growth
Potential poverty alleviationas 12% of household income generated in the Western Cape and
15% in the rest of South Africa will flow to low-income households
Every R1 of spend potentially
adds 45 cents to national government revenue
2 jobs in the Western Cape
and 2 jobs in the rest of South
Africa per R1 million spent
Every R1 of spend on
operational cost adds 83 cents to the Western Cape
economy and another 64 cents to the rest of South Africa’s GDP
…through day-to-day operations
Source: KPMG analysis from 2014 Social Accounting Matrix for South Africa and Western Cape
10

11
Quality of jobs
Mining, manufacturing and utilities sector
R100
Eskom
R367
Koeberg
R522
The government’s identification of the top 100 occupations in high demand in South Africa features many skills associated with the electricity sector that are in short supply
WANTED
The semi-skilled and skilled jobs offered by Eskom comes with above-average salaries in order to recruit and retain these employees with scarce skills
United Nations Development Programme: “full and productive employment, and decent work, for all women and men by 2030.”
National Development Plan 2030 envisages building a developmental state with
skilled managers and workers in the labour force
National
Across all sectors in the Western Cape, Eskom employees –and in particular those working at Koeberg – earn
more than the industry average
For each R100 earned for a semi-skilled worker:
Source: Eskom data and KPMG calculations
Mining, manufacturing and utilities sector
R100
Eskom
R524
Koeberg
R621For each R100 earned for a skilled worker:
goals

12
What happens with waste at Koeberg?
Low-level
waste
Intermediate-
level waste
High-level
waste
Koeberg produces nuclear waste, thus careful waste management and disposal is critical
Was
te di
spos
al
Compressed into sealed and marked steel drums
Solidified by mixing it with a cement mixture and then poured into concrete drums
Initially stored at Koeberg in steel drums
Initially stored at Koeberg in concrete drums
Transported from Koeberg to Vaalputsin specially designed trucks for disposal in 10 meter deep trenches
Transported from Koeberg to Vaalputs in specially designed trucks for disposal
500 steel drums arrive at Vaalputs each year
1 000 concrete drums disposed each year in 10 meter trenches
Intermediate storage through underwater storage in fuel racks in the reactor fuel pools or in dry storage casks at Koeberg
Eventual disposal method of high-level waste is likely to be deep, underground geological disposal
Koeberg
Vaalputs
—Northern Cape, 500km from Koeberg
—The national shallow land disposal site for Koeberg’s low and intermediate-level radioactive waste
—Necsa manages Vaalputs, while it is financed by fees paid by Eskom
Vaalp
uts
Was
te m
anag
emen
t

13
Regulator engagementDe
partm
ent o
f Ene
rgy
Natio
nal N
uclea
r Reg
ulato
r
Koeberg is well equipped to handle the safety regulations of their nuclear plants and has operated safely for over 33 years, emphasising their nuclear
safety culture
—Takes the lead governance role in nuclear technology and safety
—Minister of Energy is responsible for overseeing Necsa and the NNR
—Eskom’s operations of Koeberg are commended by the Director General of the DoE especially in terms of its nuclear safety record
—Oversees the safe operation of nuclear installations at Koeberg and Vaalputs
—Committed to protect people, property and the environment against any nuclear damage by establishing safety standards and regulatory practices
—Prescribes protective measures, such as frequent public safety forums, a 24 hour emergency line and safety procedures to follow
Source: KPMG, Economic Impact Assessment of Koeberg Power Station, 2017.
Source: KPMG, Economic Impact Assessment of Koeberg Power Station, 2017.

14
The way forward
As South Africa looks to intensify productivity and bolster economic growth, the full range of role players need to draw on their strengths and synergies.
With so many linkages in the economy through its various activities, Koeberg has an important role to play by contributing to the country’s energy needs and thus, to economic growth more broadly.
For example, the government is currently considering the addition of nuclear capacity as an option to add up to 9 600MW*to the national grid by 2030 in tranches that are affordable.
This highlights Koeberg’s role in the South African economy at present, as well as going forward.
In addition, it provides the knowledge base to expand the country’s nuclear capacity through new plants. This is clearly noted in the Nuclear Energy Policy Framework of 2008.
Koeberg, with its current capacity to supply 1 860MW,**aligns with South Africa’s energy policy and demands.
*BMI, ‘Company Brief - Eskom Secures New Power Plant Funding’, 2015
**Eskom, The Koeberg nuclear experience, 2016. http://www.eskom.co.za/news/Pages/Mar29.aspx

15

16
© 2017 KPMG Services Pty Ltd a South African company and a member firm of the KPMG network of independent member firms affiliated with KPMG InternationalCooperative (“KPMG International”), a Swiss entity. All rights reserved.No third party may rely on this report, either in whole or in part. KPMG and/or KPMG Inc, including its directors, employees and agents, and any body or entity controlledby or owned by or associated with KPMG or KPMG Inc (collectively “KPMG”) accepts no liability or responsibility whatsoever, resulting directly or indirectly from thedisclosure or referral of this report to any third party and/or the reliance of any third party upon this report or the contents thereof, either in whole or in part.The KPMG name and logo are registered trademarks or trademarks of KPMG International Cooperative (“KPMG International”).
Contact usLullu KrugelChief Economist and Director
T +27 (0)82 712 40 49
www.kpmg.com