Embed Size (px)
Citation preview

GEF/UNDP PIMS 4279: Catalyzing Financial Sustainability of Protected Areas in Montenegro
THE ECONOMIC VALUE OF PROTECTED AREAS IN MONTENEGRO
September 2011


i
EXECUTIVE SUMMARY 10 reasons for public investment in Protected Areas
1. PAs generate considerable values
The value of tourism and recreational activities, other uses of PA lands and resources, water supply services and watershed/flood protection services is estimated at just under €68 million in 2010.
2. PAs play an appreciable role in the national economy and development
In 2010, the quantified value of PAs equated to some 2.2% of GDP, or economic benefits of €106 generated per capita of Montenegro’s population.
3. PA values accrue to multiple sectors, at many different levels of scale
In 2010, just under a half of PA values accrued to the general public (worth more than €32 million), more than a third generated earnings and cost savings to businesses and industries (€25 million), and around 15% earned revenues for the government (€11 million). PA goods and services supported the output of many different sectors of the economy, including tourism, energy, water, agriculture, infrastructure and disaster risk reduction.
4. The values generated by PAs have a substantial multiplier effect across the economy
For example, PAs protect the source of existing and planned hydropower generation worth almost €80 million a year in public revenues. PAs generate total income, investment and spending for the tourist sector of €172 (or 5.7% of GDP), including gross visitor spending of
more than €220 million and capital investment in excess of €60 million, as well as some 7,700 full-time job equivalents.
5. There is significant public under-investment in PAs
At €2 million a year in total or €1,800/km2, current funding to the PAS is insufficient to manage the PA network effectively. It is lower than in many other Central and Eastern European countries, and less than half of the actual financing needs for effective PA management in Montenegro.
6. Continuing to accorded PAs a low policy and investment priority will incur economic losses
Continuing to carry out “business as usual” may cost Montenegro’s economy and population more than €30 million over the next 25 years.

ii
7. Investing adequately in PAs will generate value-added to the economy
Choosing to “invest in natural capital” may create a steady, and increasing, value-added to Montenegro’s economy and population over continuing “business as usual”, generating incremental benefits worth more than €1.5 billion over the next 25 years.
8. There is a high economic return to public investment in PAs
Although choosing to “invest in natural capital” implies a considerably higher level of public investment than continuing “business as usual”, these expenditures are far outweighed by the economic benefits generated. Net benefits will more than double over the next 25 years, and PAs will generate a total return of almost €29 per €1 of public funds invested.
9. PAs are not being managed to their full economic potential
The public income earned from PAs is currently less than €1 million a year. There is low cost recovery − this equates to only around 15% of projected funding needs. In many cases there are unmet consumer demands for sustainable PA products and services, and the bulk of PA
goods and services are being provided at a low or zero price to users. Increased public investment and policy action can help to realise these economic opportunities.
10. There remain untapped opportunities to increase the levels of revenues generated from PAs
Tourists and recreational visitors are, for example, willing to contribute almost €19 million a year more than they are currently being charged as entry fees, and there is a potential market for PA authorities to provide hikes and guided tours which is worth up to €3 million a year in public earnings. Increased public investment and policy action is required to capture these potential revenue streams.

Table of Contents
EXECUTIVE SUMMARY 10 reasons for public investment in Protected Areas ................................................. i
1. Introduction ................................................................................................................................................... 1
Background to the study ............................................................................................................................................... 1
Sources of data and information .................................................................................................................................. 1
Content of the report .................................................................................................................................................... 2
2. Understanding the economic footprint of Protected Areas ........................................................................... 3
Why PA under-valuation is a problem .......................................................................................................................... 3
Framing the links between ecosystem services and human wellbeing ........................................................................ 4
Accounting for total economic value ............................................................................................................................ 4
Investing in PAs as economic assets ............................................................................................................................. 5
3. What Protected Areas are worth to the economy......................................................................................... 6
The contribution of PAs to key sectors ......................................................................................................................... 6
Summary of the distribution of PA values across the economy ................................................................................. 13
Measuring the broader economic impacts of PAs ...................................................................................................... 14
4. Trends in Protected Area investment ......................................................................................................... 17
Self-generated income ................................................................................................................................................ 17
Public budget transfers ............................................................................................................................................... 17
Total funding to PAs .................................................................................................................................................... 18
Comparing actual and required PA investment levels ................................................................................................ 18
5. Weighing up the public costs and benefits of Protected Areas .................................................................. 19
Modelling alternative PA investment and management futures ................................................................................ 19
Business as usual and investing in natural capital ...................................................................................................... 19
The economic implications of continuing business as usual ....................................................................................... 20
The economic implications of investing in natural capital .......................................................................................... 21
Winners and losers ...................................................................................................................................................... 21
The value-added by investing in natural capital ......................................................................................................... 22
The returns from investing in natural capital .............................................................................................................. 23
6. Summary of findings and conclusions: the economic rationale for public investment in Protected Areas 25
7. References ................................................................................................................................................. 27
Annex: assumptions made in modelling scenarios ......................................................................................... 30
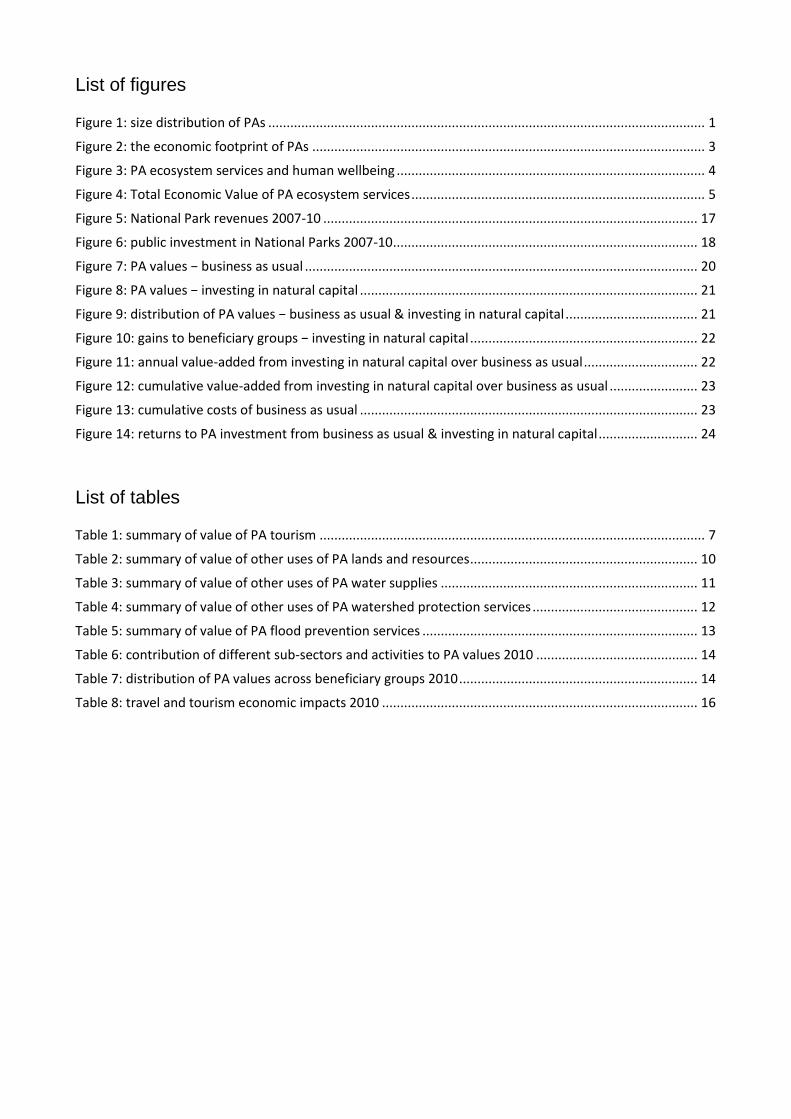
List of figures
Figure 1: size distribution of PAs ....................................................................................................................... 1
Figure 2: the economic footprint of PAs ........................................................................................................... 3
Figure 3: PA ecosystem services and human wellbeing .................................................................................... 4
Figure 4: Total Economic Value of PA ecosystem services ................................................................................ 5
Figure 5: National Park revenues 2007-10 ...................................................................................................... 17
Figure 6: public investment in National Parks 2007-10 ................................................................................... 18
Figure 7: PA values − business as usual ........................................................................................................... 20
Figure 8: PA values − investing in natural capital ............................................................................................ 21
Figure 9: distribution of PA values − business as usual & investing in natural capital .................................... 21
Figure 10: gains to beneficiary groups − investing in natural capital .............................................................. 22
Figure 11: annual value-added from investing in natural capital over business as usual ............................... 22
Figure 12: cumulative value-added from investing in natural capital over business as usual ........................ 23
Figure 13: cumulative costs of business as usual ............................................................................................ 23
Figure 14: returns to PA investment from business as usual & investing in natural capital ........................... 24
List of tables
Table 1: summary of value of PA tourism ......................................................................................................... 7
Table 2: summary of value of other uses of PA lands and resources .............................................................. 10
Table 3: summary of value of other uses of PA water supplies ...................................................................... 11
Table 4: summary of value of other uses of PA watershed protection services ............................................. 12
Table 5: summary of value of PA flood prevention services ........................................................................... 13
Table 6: contribution of different sub-sectors and activities to PA values 2010 ............................................ 14
Table 7: distribution of PA values across beneficiary groups 2010 ................................................................. 14
Table 8: travel and tourism economic impacts 2010 ...................................................................................... 16
List of acronyms
CPI Consumer price index
GDP Gross domestic product
GEF Global Environment Facility
HPP Hydropower plant
ISSP Institute for Strategic Studies and Prognoses
MEA Millennium Ecosystem Assessment
NBSAP National Biodiversity Strategy and Action Plan
NPV Net present value
PA Protected Area
PAS Protected Area system
PENP Public Enterprise National Parks of Montenegro
PPP Purchasing power parity
TEV Total economic value
UNDP United Nations Development Programme
Acknowledgements
This report relied on support, information and ideas from many individuals, although any errors remain
those of the author alone. Much of the data used in the report was collected by the Institute for Strategic
Studies and Prognoses (ISSP), by Jadranka Kaludjerovic (Project Director), Ivan Jovetic (Project Coordinator),
Slavica Nikolic, Marija Orlandic, Andjelija Babic, Jovana Drobnjak, Vukasin Pejovic, Nikola Soldo and
Nemanja Katnic. Recognition should be accorded to ISSP, especially Jadranka and Ivan, for their ground-
breaking work on PA valuation in Montenegro and for the many insights they provided to the current
report. Thanks are also due to Borko Vulikic of UNDP Montenegro, who coordinated this study. Last, but
not least, mention should be made of (and gratitude expressed to) Peter McCarter, who generously
contributed his time and energy to collect information on the market prices of key products and services in
Podgorica.


1
1. Introduction
Background to the study
The UNDP-GEF-Government of Montenegro project “Catalyzing financial sustainability of protected areas in
Montenegro’’ aims to improve the financial sustainability of the national Protected Area System (PAS),
through fostering a more enabling legal and policy environment, building institutional and individual
capacity to improve the cost-effectiveness of protected areas (PAs), and securing new revenue streams.
One of the project’s outputs is concerned specifically with generating information about the economic
value of the national Protected Area System:
“an economic valuation of the PAS supports the case for sustained public investment in
protected area establishment and management.”
The intention is to provide data that can be used to convince public decision-makers of the economic
rationale to investing in PAs. It is anticipated that this will help to improve the current situation, where
there is little or no practical and policy-relevant information on the economic value of PAs, and PAs are
accorded a low budgetary and economic policy priority.
Sources of data and information
Preliminary work on scoping out the economic valuation study was carried out during the Project
Preparation Grant phase, focusing on five pilot PAs (Durmitor, Biogradska gora and Skadarsko jezero
National Parks, Tivat Saltpan Nature Reserve, and the proposed Komovi National Park). Detailed studies
were subsequently carried out by a team from the Institute for Strategic Studies and Prognoses (ISSP) to
determine a monetary quantification of the ecosystem products and services in each PA. These are
documented in a separate report “Economic Valuation of Montenegro’s Protected Area System”.
The current document relates the findings of the ISSP study to the entire national PAS. It assesses the
public benefits and costs of establishing and managing PAs as an economically viable form of land use. The
report focuses primarily (although not exclusively) on National Parks. These contribute the majority of the
national PAS (around 80%), form by far the largest contiguous areas (with just four exceptions, all other PAs
are below 10 km2 in size: see Figure 1) and generate some of the most significant ecosystem services.
Figure 1: size distribution of PAs
Source: ISSP 2011, UNDP-GEF project
The analysis was carried out as a desk study, and did not involve any fieldwork. It is based on the results of
the ISSP studies (ISSP 2011), supplemented by a review of literature on the economic value of PAs in
Montenegro and elsewhere, and of key national development and economic statistics.
2
It should be noted at the outset that there are few or no available data on which to base an analysis of the
economic value of PAs in Montenegro. The ISSP study was the first attempt to systematically collect and
collate information on the economics of ecosystems and biodiversity across different PAs and types of
values − and as such it was an extremely useful exercise, yielding important new information. The paucity
of available data and statistical records however meant that it was simply not possible to quantify many
economic values and benefits, aside from those for which records are routinely kept by PA authorities
(mainly tourism receipts and revenues from other licences, charges and fees levied on the use of PA land
and resources). In particular, it was impossible to generate any meaningful estimates of the value of
supporting and regulating ecosystem services (indirect values) – even though these potentially comprise
the most significant contribution made by PAs to the Montenegro economy.
For these reasons, the figures presented in the current report are not comprehensive, and depend on many
assumptions. They omit consideration of several important PA values because there simply was not
sufficient information to enable them to be calculated. The study also relies heavily on extrapolating the
few data that are available for Montenegro, and of necessity employs “benefit transfer” techniques.
Benefit transfer involves applying values estimates from studies which have been carried out elsewhere to
the study site in question. There are many hazards in using such an approach, which are mainly to do with
the credibility of applying data about a particular site or ecosystem to another context which might have
very different biological, ecological and socio-economic characteristics.
Where benefit transfer techniques have been used, a conservative approach has been taken. The primary
source of data is valuation studies that have been carried out in Central, South and Eastern European
countries with similar economic, institutional and ecological conditions to Montenegro. All values have
been adjusted to bring them to 2010 Montenegro price levels, applying a consumer price index (CPI)
deflator to account for domestic inflation, and using appropriate Gross Domestic Product Purchasing Power
Parity (GDP PPP) conversion rates to equalise differences between Montenegro and other countries.
The resulting analysis should therefore be seen as being very much a first (and incomplete) attempt to
assess the economic contribution of Montenegro’s PAs, and to weigh up the public costs and benefits of
investing in the PAS. The estimates presented remain highly speculative, and involve many assumptions
and approximations. It is to be hoped that when new data become available, or as more detailed studies
are undertaken, the figures presented in this report can be supplemented, improved and updated.
Content of the report
The report contains six chapters, in addition to this introductory section:
Chapter 2 provides an overview of the economic value of PAs, biodiversity and ecosystem services;
Chapter 3 describes the current value of PAs to Montenegro’s economy;
Chapter 4 reviews recent trends in public spending on PAs;
Chapter 5 models the public costs and benefits of PAs under different future scenarios;
Chapter 6 summarises the main findings and conclusions from the study;
Chapter 7 presents a full list of documents referred to in the report; and
An Annex lists the detailed assumptions that have been made in modelling scenarios.

3
2. Understanding the economic footprint of Protected Areas
Although the primary goal of PAs is biodiversity and ecosystem conservation, they typically leave a
substantial economic footprint: locally, nationally and globally (Figure 2).
Figure 2: the economic footprint of PAs
It is not the role of this document to provide a detailed overview of the economics of PAs, biodiversity and
ecosystems, or to describe how ecosystem valuation techniques and tools should be applied. This can be
found elsewhere: for example in work carried out under The Economics of Ecosystems and Biodiversity
initiative (TEEB 2008, 2010) and the South East Europe Transnational Cooperation Programme (Ruzzier et al
2010), or by the Convention on Biological Diversity (SCBD 2008) and IUCN’s World Commission on
Protected Areas (Philips 1998).
Before presenting data on the value of Montenegro’s PAs, it is however useful to summarise the economic
thinking that underpins this study, and to present the broad framework within which the links between PAs
and the economy should be understood.
Why PA under-valuation is a problem
As this document will describe, Montenegro’s biodiversity and ecosystems generate substantial economic
values, which accrue across many sectors and stakeholder groups. The national PAS is therefore an
important and productive asset, because it provides a flow of economically valuable goods and services.
Unfortunately, decision-makers rarely perceive PAs in these terms. Very little attention has traditionally
been paid to these values by either the economists who provide the figures which inform policy
formulation and decision-making, the financial planners who calculate and allocate budgets, the businesses
whose economic activities impact on PAs, or the environmental planners and policy-makers who are
responsible for managing PAs as economically-viable conservation units.
One of the major reasons for PA under-valuation is that many biodiversity and ecosystem services are not
priced and do not have a market. They therefore do not usually enter into the monetary calculations or
profits and losses that determine how people choose to produce, consume, trade and invest. Because PAs
are not seen as generating economic benefits, and because the costs and losses associated with PA
degradation and loss remain largely unaccounted for, they tend to be allocated a low budgetary and policy
priority as compared to those sectors which are considered “productive” in development terms. It is thus
almost inevitable that PAs do not appear as an economically desirable or financially profitable use of land,

4
resources and funds when policies are formulated, investments and business opportunities analysed, or
projects appraised.
It is hardly surprising that it has been difficult for conservation planners to justify PAs as an economically
beneficial land use option, to advocate for higher budgets, or to optimise and capture the values that PAs
generate. Perhaps more seriously, PA under-valuation has also meant that many potentially profitable
development opportunities and business possibilities have been missed, and wide-ranging economic costs
and losses have often been incurred.
Framing the links between ecosystem services and human wellbeing
The last few years have seen a shift in the way that PA goods and services are conceptualised. In particular,
the publication of the Millennium Ecosystem Assessment (MEA) in 2005 stimulated a much greater
awareness of the links between ecosystem services and the economy. The MEA provided a framework for
tracing the links between ecosystem
services and human wellbeing, which is
now widely-accepted in conservation and
sustainable development planning.
Ecosystem services can be defined as “the
benefits people obtain from ecosystems”.
According to the MEA framework
(Millennium Ecosystem Assessment 2005),
there are four basic categories of
ecosystem services: provisioning,
regulating, cultural and supporting services
(Figure 3). Understanding these linkages is
an important first step in PA valuation.
Accounting for total economic value
Being able to express these economic linkages requires that PA goods and services can be adequately
valued. As we have described above, this has traditionally posed something of a problem to economists.
One important reason for undervaluation is that the economists who generate the statistics and
calculations that inform decision-making have conventionally taken account only of those values for which
there is a clear market and price. The problem is, many ecosystem services are not priced or marketed.
Over the last two decades, a suite of methods have however been developed for dealing with the economic
value of biodiversity and ecosystems. Total Economic Value (TEV) has become the most commonly-used
framework for identifying and categorising PA values. Importantly, it takes account of those values that
have traditionally been omitted from economic and financial decision-making.
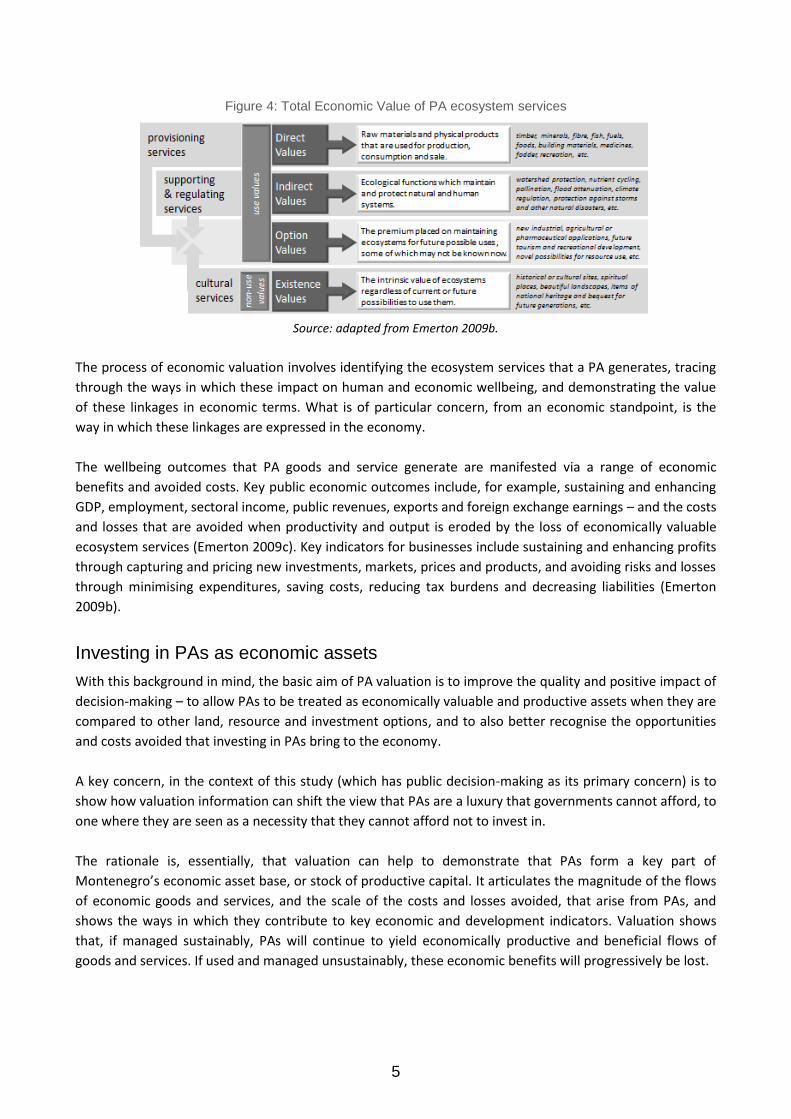
The TEV framework extends beyond just physical products and marketed commodities, and considers the
full range of economically important ecosystem services associated with PAs, categorising them into direct,
indirect, option and existence values. As shown in Figure 4, TEV also looks at their ecological functions, the
possibilities of future as yet unknown uses, and the intrinsic values they hold for humans regardless of
actual use. Assessing the total economic value of a PA involves considering its complete range of
characteristics as an integrated system resource stocks or assets, flows of environmental services, and
the attributes of the ecosystem as a whole.
Source: adapted from Millennium Ecosystem Assessment 2005.
Figure 3: PA ecosystem services and human wellbeing
5
Figure 4: Total Economic Value of PA ecosystem services
Source: adapted from Emerton 2009b.
The process of economic valuation involves identifying the ecosystem services that a PA generates, tracing
through the ways in which these impact on human and economic wellbeing, and demonstrating the value
of these linkages in economic terms. What is of particular concern, from an economic standpoint, is the
way in which these linkages are expressed in the economy.
The wellbeing outcomes that PA goods and service generate are manifested via a range of economic
benefits and avoided costs. Key public economic outcomes include, for example, sustaining and enhancing
GDP, employment, sectoral income, public revenues, exports and foreign exchange earnings – and the costs
and losses that are avoided when productivity and output is eroded by the loss of economically valuable
ecosystem services (Emerton 2009c). Key indicators for businesses include sustaining and enhancing profits
through capturing and pricing new investments, markets, prices and products, and avoiding risks and losses
through minimising expenditures, saving costs, reducing tax burdens and decreasing liabilities (Emerton
2009b).
Investing in PAs as economic assets
With this background in mind, the basic aim of PA valuation is to improve the quality and positive impact of
decision-making – to allow PAs to be treated as economically valuable and productive assets when they are
compared to other land, resource and investment options, and to also better recognise the opportunities
and costs avoided that investing in PAs bring to the economy.
A key concern, in the context of this study (which has public decision-making as its primary concern) is to
show how valuation information can shift the view that PAs are a luxury that governments cannot afford, to
one where they are seen as a necessity that they cannot afford not to invest in.
The rationale is, essentially, that valuation can help to demonstrate that PAs form a key part of
Montenegro’s economic asset base, or stock of productive capital. It articulates the magnitude of the flows
of economic goods and services, and the scale of the costs and losses avoided, that arise from PAs, and
shows the ways in which they contribute to key economic and development indicators. Valuation shows
that, if managed sustainably, PAs will continue to yield economically productive and beneficial flows of
goods and services. If used and managed unsustainably, these economic benefits will progressively be lost.

6
3. What Protected Areas are worth to the economy
The contribution of PAs to key sectors
Tourism
Tourism is an important and rapidly-growing sector in Montenegro’s economy, and one of the key
development priorities (MTE 2008). In 2009 and 2010, around 1.2 million visitors were recorded,
accounting for 7.6 million and 8.0 million bednights respectively; 85% were international arrivals
(MONSTAT 2011). Both domestic and international tourism is concentrated in the coastal region (Olters
2008, Tarchiani 2011) – in 2010 coastal resorts accounted for around 90% of visitors and 96% of bednights
(MONSTAT 2011).
Protected areas are also an important location for both domestic and international tourism. Visitor data are
available for only six PAs: the four National Parks, Long beach Ulcinj Monument of Nature and Kotor-Risan
Bay World Heritage Site. Almost 275,000 visits were made to these PAs in 2009, and more than 308,000 in
2010 (ISSP 2011). These numbers are equivalent to just under a quarter of all recorded domestic and
international visitor arrivals in Montenegro in 2010 (MONSTAT 2011). In reality, the number of people
visiting PAs is far higher than this, as these calculations are based only on those sites for which visitor
records are kept. Other PAs are also important recreational and visitor destinations, for example beaches,
caves and parks that are designated as Monuments of Nature, as well as Areas with Exceptional Natural
Features. To account for this, the study makes a conservative estimate that half as many tourists again are
visiting PAs for which visitor numbers are not recorded. This revised estimate account for just over one
third of all domestic and international arrivals, according to MONSTAT figures.
While many of these visits are made as “side-trips”, some holidays are motivated purely by the wish to visit
a PA. A study on the attitudes of Europeans towards tourism for example states that, throughout the EU,
more than 6% of respondents declared the prime motivation for their holiday to be nature; this is especially
the case for tourists from Western Europe (Stolton 2009). This also holds true for visitors to Montenegro. A
recent survey found that visits to scenic natural landscapes and National Parks are key determinants of
both domestic and international tourists’ trips. Durmitor and Biogradska gora National Parks are two of the
top three destinations in northern Montenegro in terms of popularity and visits made, Skadar Lake is one of
the most popular in the south, and National Parks received the second highest rating of national tourism
assets and services, according to visitor surveys, (CSTI 2007).
One important source of economic impact is from the expenditures that are made by visitors. In 2010,
National Parks generated direct revenues (from entry fees and other charges) of some €415,857 (ISSP
2011). Visitors to PAs also spent money on hotels and restaurants. The Central Bank of Montenegro has
calculated that average expenditures on food and accommodation is just under €43 per guest day (MTE
2008). These estimates accord well with data collected at Durmitor National Park, which find a gross
turnover of €1.6 million for hotels and restaurants, translating into an average accommodation fee of
€12.6, plus typical spending on food, drinks and other services of €46.0 per visitor day (ISSP 2011). They
also appear to be consistent with data from nearby countries. In Tatra National Park in Poland visitors
spend on about €45 per day, and in Slovakia’s Slovensky Raj National Park total visitor expenditure
averages €54 per person day (Getzner 2009)
Assuming that 75% of tourists are visiting PAs as part of longer stays or holidays, direct spending on hotels
may therefore account for annual revenues of €14.9 million. This is a conservative estimate, as there is
evidence that spending on hotels in areas with attractive natural landscapes tend to be greater than that in
other places. Work carried out in Croatia by the Institute of Tourism has for example found that there is a
7
premium of as much as 24-32% attached to the price that visitors are willing to pay for hotels located in
forest areas, and that landscape is a decisive factor in visitors’ choice of hotels (Pagiola 1998). A portion of
these revenues accrue to PA authorities, where camping or accommodation is offered within PAs. For
example, Biogradska gora National Park authorities earned revenues of some €19,400 in 2010 from the sale
of just over 1,000 bednights in Park bungalows and 700 nights of camping fees (ISSP 2011).
The total economic value of PA tourism is however greater than the amount of money that people spend.
Expenditures on entry fees, hotels and restaurants, travel costs and other purchases only tell us the
minimum amount that visitors are willing to pay to visit PAs. For most tourists, the total value they ascribe
to their visit to PAs exceeds the market prices they pay. The net economic benefit or “consumer surplus” to
PA visitors is their total willingness to pay for PA tourism less expenditures actually made on their trip.
Although there is a relatively large body of literature on consumers’ willingness to pay for PA tourism, no
studies have as yet been carried out in Montenegro. In Romania, for example, a study carried out in 5 PAs
finds an average consumer surplus per visitor of €42, including an average willingness to pay for
conservation of €15 (Dumitras 2008, DUmitras et al 2011). Visitors to seven National Parks in coastal areas
of Croatia state an average willingness to pay for biodiversity and ecosystem conservation of between €13
(for domestic visitors) and €16 (for overseas visitors) per visit, in addition to actual expenditures made
(Spurgeon and Gallagher 2010). In Tatra National Park in Poland visitors are willing to contribute an
additional €14 to secure PA conservation activities, and for Slovakia’s Slovensky Raj National Park average
willingness to pay for conservation is €23 (Getzner 2009). In Maramures Mountains Natural Park just under
60% of visitors expressed their willingness to contribute between €18 (for the conservation of traditional
landscapes) and €21 (for wildlife conservation programmes) to PA funding (Ceroni 2007).
Although the visitor profile of the people interviewed in these studies is similar to those visiting
Montenegro, there is of course a large degree of variation in the characteristics of individual PAs. However,
if we use the appropriate CPI and PPP conversions and apply these broad figures to Montenegro (a
consumer surplus of €42.6 per visit, including a willingness to contribute to conservation funding of €12.2),
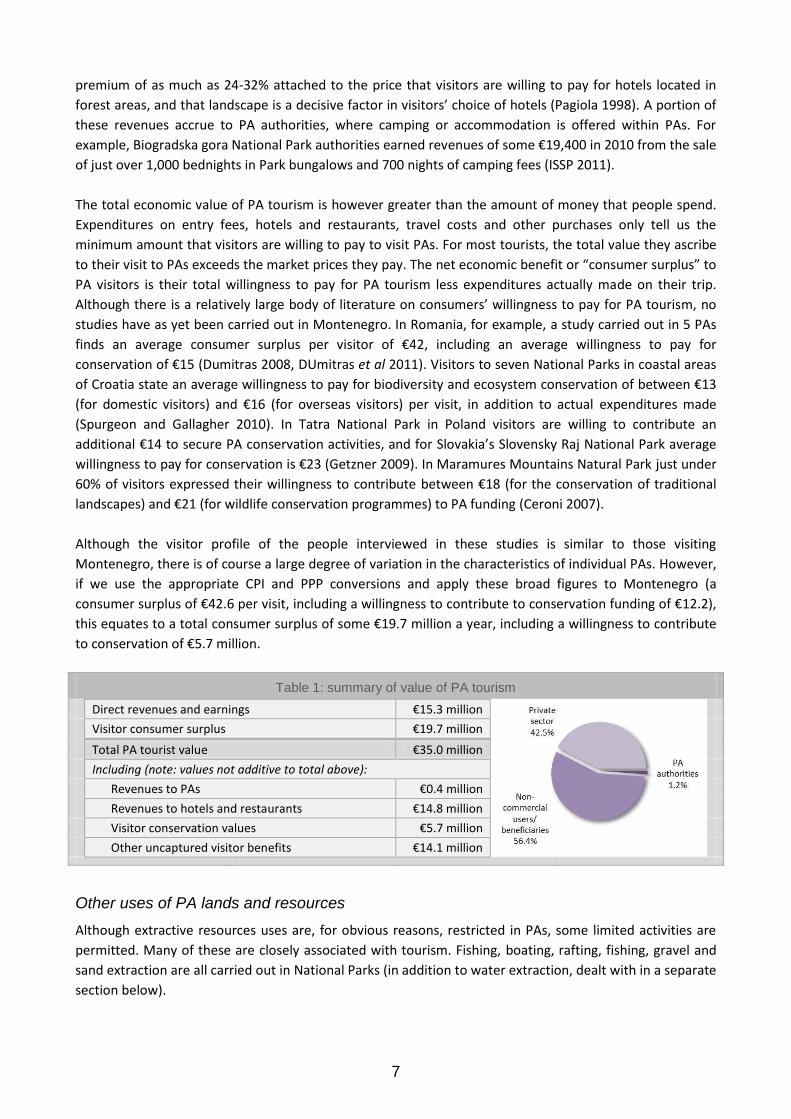
this equates to a total consumer surplus of some €19.7 million a year, including a willingness to contribute
to conservation of €5.7 million.
Table 1: summary of value of PA tourism
Direct revenues and earnings €15.3 million
Visitor consumer surplus €19.7 million
Total PA tourist value €35.0 million
Including (note: values not additive to total above):
Revenues to PAs €0.4 million
Revenues to hotels and restaurants €14.8 million
Visitor conservation values €5.7 million
Other uncaptured visitor benefits €14.1 million
Other uses of PA lands and resources
Although extractive resources uses are, for obvious reasons, restricted in PAs, some limited activities are
permitted. Many of these are closely associated with tourism. Fishing, boating, rafting, fishing, gravel and
sand extraction are all carried out in National Parks (in addition to water extraction, dealt with in a separate
section below).

8
Fishing
Licensed fishing is carried out in three PAs: Biogradska gora, Durmitor and Skadarsko jezero National Parks.
Work carried out by WWF elaborates the economic impacts of sport fishing activities in Durmitor and
Biogradska gora (Mrdak 2005), while detailed records are available from PA authorities on sport and
commercial fishing in Lake Skadar (ISSP 2011):
In Biogradska gora National Park, 229 sport fishing permits were issued in 2010 at a price of €20 each,
generating revenues for the PA authorities of €4,580 (ISSP 2011).
In Durmitor National Park, PA authorities generated €11,570 in revenues from the sale of sport fishing
permits in 2010 (ISSP 2011). If these are costed at the same price as permits in Biogradska gora, this
translates into approximately 580 anglers.
Both sport and commercial fishing takes place in Skadarsko jezero National Park. In 2010, 500 sport
fishing permits and 250 commercial fishing permits were issued, earning revenues of €85,702 for the PA
authorities (ISSP 2011).
For commercial fishing, it is possible to estimate the market value of fish caught. There are 300 bleak
(Alburnus spp.) fishers, each fishing for 95 days a year and landing an average of 16 kg per trip
(translating into a total catch of 456 tonnes); the 100 carp fishers operate for 190 days a year, landing an
average of 5 kg of carp per trip (translating into a total catch of 95 tonnes) (ISSP 2011). At a market price
of €3/kg for bleak and €5/kg for carp, this equates to total income of some €1.8 million a year. Around
200 tonnes of bleak and 70 tonnes of carp are sold on to “Ribarstvo” in nearby Rijeka Crnojevica, which
produces canned smoked fish. With a conversion factor of 0.5 kg carp and 0.18 kg bleak to produce 1
can, these sales are used to produce around 0.82 million cans of bleak using 147 tonnes, and 0.14
million cans of carp using 70 tonnes (MAFWM 2006). At a retail price of €4 for a can of carp and €1 for a
can of bleak, the gross market value added from this production is in the region of €1.4 million a year.
In addition to the revenues generated for PA authorities from the sale of permits and the market value
of the catch, sport fishing generates a range of other expenditures in the economy. Work carried out by
WWF suggests that domestic anglers make average expenditures of €6 per trip on food and other
fishing-related expenses, while for foreign anglers the amount is up to €121 (from Mrdak 2005, updated
to 2010 price levels). Sport-fishing in the three National Parks mentioned above may therefore generate
an additional €14,500 a year in secondary economic impacts.
As already described above in the section on tourism, PAs also generate economic values for
recreational visitors over and above their direct expenditures. For sport fishers, this may equate to a
total consumer surplus of €55,700, including gross willingness to pay for conservation of €16,000 a year.
Water sports
Biogradska gora, Durmitor and Skadarsko jezero National Parks are popular locations for water sports:
In Biogradska gora National Park, various options for renting boats on Biogradsko Lake exist, with prices
ranging between €5-8 per hour; in 2010, PA authorities earned revenues of €5,043 from boat rental, and
additional revenues of €2,104 (presumably for the private sector) are also cited (ISSP 2011).
Durmitor National Park is famous for white-water rafting. In 2010, more than 8,700 tourists went white-
water rafting, generating revenues for the PA authorities of €150,074 from the fee that is levied for
rafting through the region under their protection (ISSP 2011). Most of these are engaged in two to three
day trips, priced at an average of €272 at 2010 levels, and about 80% are foreign tourists (Mrdak 2005).
The total income generated is €2.4 million. Indirect economic impacts include income accruing to travel

9
agencies, spending on refreshments and other incidental expenditures, estimated at just under €55 per
trip at 2010 levels, and totals just under €0.5 million (Mrdak 2005)
Just over 40,000 cruise boat tourists visited Skadarsko jezero National Park in 2010 (ISSP 2011).
Approximately 30 entrepreneurs operate up to 50 boats on the lake, offering trips to visitors. At a price
charged of €10 per boat trip per person, the income generated to boat operators was €0.4 million.
As above, PAs also generate economic values for recreational visitors over and above their direct
expenditures. For visitors engaging in water sports, this may equate to a total consumer surplus of €2.2
million including willingness to pay for conservation of more than €630,000 a year.
Other economic activities and revenue sources
Various other economic uses of PA lands and resources are made, and generate revenues for both PA
authorities and for users. These include (in addition to PA entry fees, which are already covered above):
Souvenirs and publications are a source of revenues for PA authorities. In 2010, Skadarsko jezero
National Park generated €9,756 in sales from its information centre, Biogradska gora National Park
earned €12,101, and Durmitor National Park earned €13,692 (ISSP 2011).
Guided tours include sales of 82 bird-watching tickets, which generated €328 for Skadarsko jezero
National Park authorities in 2010 (ISSP 2011). For these visitors, consumer surplus may total just under
€14,000, including €4,000 willingness to pay for conservation. There is however evidence that visitor
interest in specialist guided tours is greater than those actually offered. Although no detailed
information exists for Montenegro, recent surveys in Romania found that around 75% of visitors were
willing to pay between €13-15 on guided tours (such as bird watching, nature hikes or cultural heritage
trips) during their visit to Maramures Mountains Natural Park, and in Macin Mountains National Park
around €1-2 (Ceroni 2007, Ceroni and Dragoi 2008). If we use the appropriate CPI and PPP conversions
and apply these figures to Montenegro (an average willingness to pay for guided tours of €8.4 among
75% of visitors), this equates to a total uncaptured annual visitor benefit of some €2.9 million a year.
Wood harvesting generated revenues for Durmitor National Park of €14,097 in 2010 through sales of
fuelwood (ISSP 2011)
Collection of non-timber forest products is recorded in Biogradska gora National Park, with an estimated
total value to collectors of €1.1 million in 2010, composed of collections of wild berries, herbs and
mushrooms (ISSP 2011). Around 150 honey producers maintain 7,500 hives in Skadarsko jezero National
Park, generating production to a market value of €0.83 million a year (ISSP 2011).
Sand and gravel extraction concession fees for sand and gravel earned an average of €69,404 a year in
revenues for Skadarsko jezero National Park authorities between 2008-10, generating production with a
direct sales price of €138,530 and a full market value of €346,326 for the concession holders (ISSP 2011).
Licence fees for filming generated €4,274 in revenues for Skadarsko jezero National Park authorities in
2010 (ISSP 2011).
Land rental from the wine producer "Plantaze" generated €61,878 in revenues for Skadarsko jezero
National Park authorities in 2010 and yielded grapes and wine to a total market value of €350,000 for
the producer (ISSP 2011). Revenues from the lease of land to a restaurant earned €10,382 for
Biogradska gora National Park, and general revenues from rent and leases generate €78,306 for
Durmitor National Park (ISSP 2011).
10
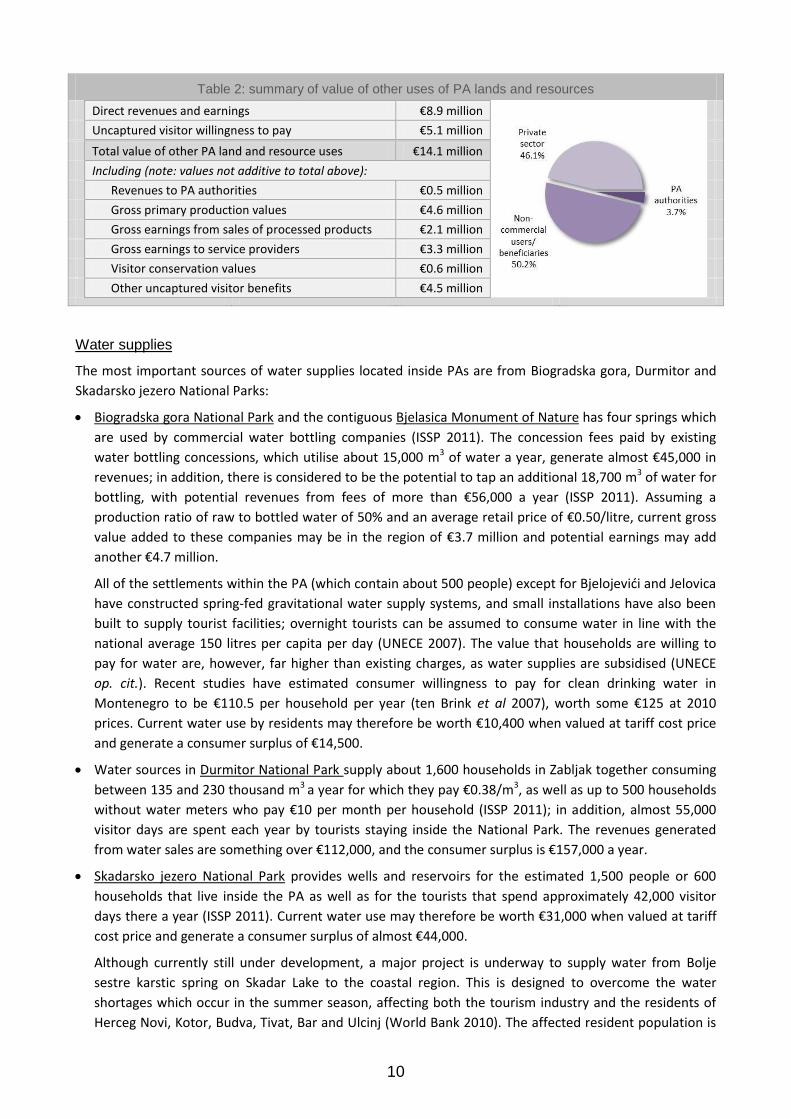
Table 2: summary of value of other uses of PA lands and resources
Direct revenues and earnings €8.9 million
Uncaptured visitor willingness to pay €5.1 million
Total value of other PA land and resource uses €14.1 million
Including (note: values not additive to total above):
Revenues to PA authorities €0.5 million
Gross primary production values €4.6 million
Gross earnings from sales of processed products €2.1 million
Gross earnings to service providers €3.3 million
Visitor conservation values €0.6 million
Other uncaptured visitor benefits €4.5 million
Water supplies
The most important sources of water supplies located inside PAs are from Biogradska gora, Durmitor and
Skadarsko jezero National Parks:
Biogradska gora National Park and the contiguous Bjelasica Monument of Nature has four springs which
are used by commercial water bottling companies (ISSP 2011). The concession fees paid by existing
water bottling concessions, which utilise about 15,000 m3 of water a year, generate almost €45,000 in
revenues; in addition, there is considered to be the potential to tap an additional 18,700 m3 of water for
bottling, with potential revenues from fees of more than €56,000 a year (ISSP 2011). Assuming a
production ratio of raw to bottled water of 50% and an average retail price of €0.50/litre, current gross
value added to these companies may be in the region of €3.7 million and potential earnings may add
another €4.7 million.
All of the settlements within the PA (which contain about 500 people) except for Bjelojevidi and Jelovica
have constructed spring-fed gravitational water supply systems, and small installations have also been
built to supply tourist facilities; overnight tourists can be assumed to consume water in line with the
national average 150 litres per capita per day (UNECE 2007). The value that households are willing to
pay for water are, however, far higher than existing charges, as water supplies are subsidised (UNECE
op. cit.). Recent studies have estimated consumer willingness to pay for clean drinking water in
Montenegro to be €110.5 per household per year (ten Brink et al 2007), worth some €125 at 2010
prices. Current water use by residents may therefore be worth €10,400 when valued at tariff cost price
and generate a consumer surplus of €14,500.
Water sources in Durmitor National Park supply about 1,600 households in Zabljak together consuming
between 135 and 230 thousand m3 a year for which they pay €0.38/m3, as well as up to 500 households
without water meters who pay €10 per month per household (ISSP 2011); in addition, almost 55,000
visitor days are spent each year by tourists staying inside the National Park. The revenues generated
from water sales are something over €112,000, and the consumer surplus is €157,000 a year.
Skadarsko jezero National Park provides wells and reservoirs for the estimated 1,500 people or 600
households that live inside the PA as well as for the tourists that spend approximately 42,000 visitor
days there a year (ISSP 2011). Current water use may therefore be worth €31,000 when valued at tariff
cost price and generate a consumer surplus of almost €44,000.
Although currently still under development, a major project is underway to supply water from Bolje
sestre karstic spring on Skadar Lake to the coastal region. This is designed to overcome the water
shortages which occur in the summer season, affecting both the tourism industry and the residents of
Herceg Novi, Kotor, Budva, Tivat, Bar and Ulcinj (World Bank 2010). The affected resident population is

11
currently some 170,000 people (ITSC 2006) and the number of tourist nights spent is up to 7.6 million
(MONSTAT 2011). Exact supply figures are not available, but it has been estimated that the annual
summer water deficit in the six coastal municipalities is in the region of 24.5 million m3, projected to rise
to 27.5 million m3 in 2020 and 38 million m3 in 2033; meanwhile the scheme is planned with a 1,500
l/sec or 47.3 million m3 a year maximum capacity (ITSC 2006). Assuming that the new water supply
system will be sufficient to meet this deficit, this will translate into water values worth €9.3 million when
valued at tariff cost price and generate a consumer surplus of €5.5 million a year.
Table 3: summary of value of other uses of PA water supplies
Public revenues €9.5 million
Market earnings €3.7 million
User consumer surplus €5.8 million
Total value of PA water supplies €19.0 million
Including (note: values not additive to total above):
Revenues to PA authorities €0.1 million
Revenue to other public agencies €9.5 million
Gross production values €3.7 million
Consumer willingness to pay €15.2 million
Watershed protection
PAs secure water supplies for downstream users. Several PAs cover mountainous watershed areas, contain
major rivers or water bodies, or comprise canyons and gorges through which important water courses flow.
The protected status of PAs, and the good quality of the natural habitats they contain (such as forest,
grasslands or wetlands), provide important watershed protection services, helping to safeguard
downstream waterflow and quality. A large population relies on this water, including domestic and
industrial consumers, hydropower and irrigated agriculture.
The most significant PAs as far as watershed protection are concerned are Durmitor and (to a lesser extent)
Biogradska gora National Parks, as well as Tara River Man and Biosphere Reserve, which help to protect the
upper reaches of the Tara River as well as lakes which recharge groundwater aquifers which feed the Piva
River; Piva River Canyon and Komarnica River Canyon Monuments of Nature, which help to protect the Piva
and Komarnica Rivers. The upper and middle catchment of the Morača River includes Platije Canyon,
Mrtvica Canyon and Mala Rijeka Canyon Proposed Natural Monuments, Morača Catchment and Canyon
Proposed Area of Special Natural Characteristics and Sinjajevina/Saranci Proposed Regional Park (which is
contiguous with Durmitor National Park).
Unfortunately, little or no information is available for Montenegro on the economic value of watershed
protection. It is only possible to make very approximate estimates, based on studies from nearby countries
in sites with similar characteristics. As explained above, these figures must be treated with caution: the
capacity of an ecosystem to retain sediments and prevent erosion depends on a series of specific
characteristics, such as vegetation cover, soil erodibility, slope, weather conditions and management
practices. Work carried out in Poland’s Tatra National Park uses public expenditures saved due to the
existence of functioning forest ecosystems are to estimate PA water retention, flood control and erosion
control at €48/hectare; for Slovensky Raj national park in Slovakia, a figure of €54/hectare is given (Getzner
2009). In Maramures Mountains Natural Park, Romania, the value of erosion control in forested ecosystems
was estimated from the costs for maintenance of infrastructure that are associated with each ton of soil
12
loss (set at €2/tonne); the figures used for average sediment loss per hectare were 10 tons for of non-
vegetated and agricultural land, 0.25 tons for functional forest, and 0.07 tons for meadows (Ceroni 2007).
Unfortunately, comprehensive data are not available on forest cover in Durmitor and Biogradska gora
National Parks, Tara River Man and Biosphere Reserve, Piva River Canyon and Komarnica River Canyon
Monuments of Nature, or the proposed Platije Canyon, Mrtvica Canyon and Mala Rijeka Canyon Natural
Monuments, Morača Catchment and Canyon Area of Special Natural Characteristics or Sinjajevina/Saranci
Regional Park. Area figures are only available for Biogradska gora forest (1,600 ha), and for forests and
canyons of the Tara and Susica in Durmitor National Park (9,637 ha). According to FAO’s Global Forest
Resource Assessment for 2010, Montenegro contains 543,000 ha of forest, of which 67,000 is under public
ownership, 10,000 ha is designated for soil and water protection and 5,000 ha for the protection of
biodiversity, and 13,000 is found within PAs (FAO 2010).
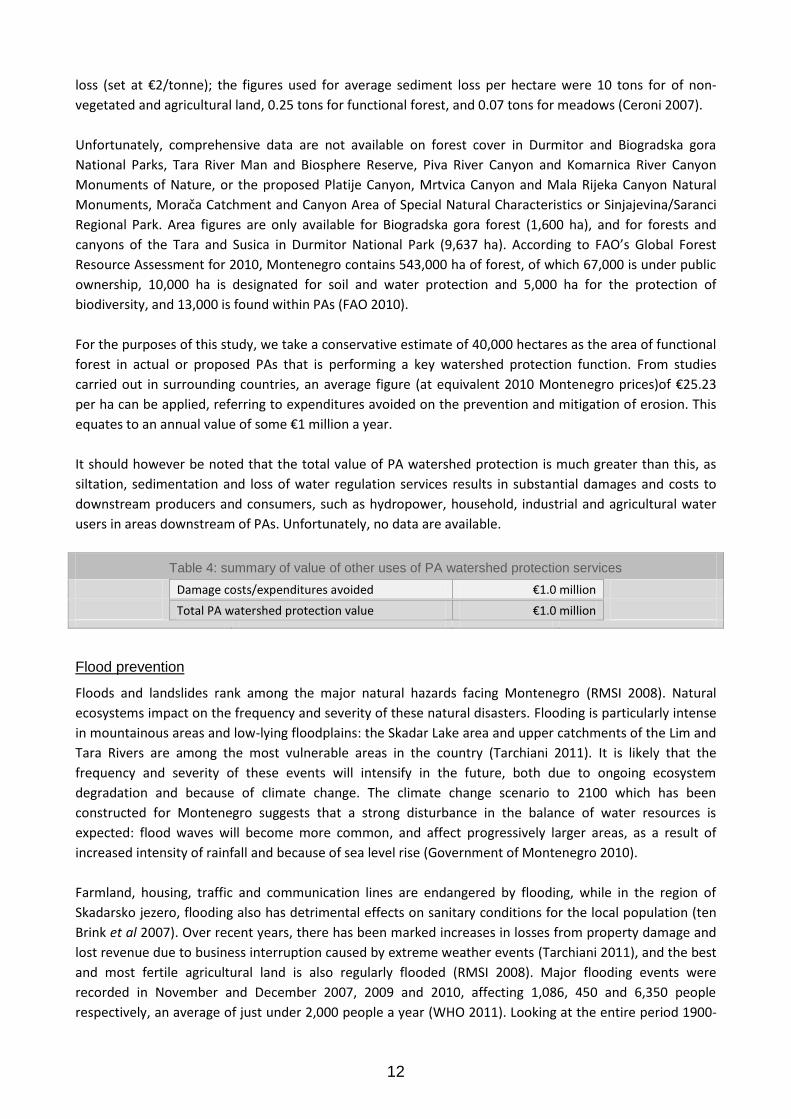
For the purposes of this study, we take a conservative estimate of 40,000 hectares as the area of functional
forest in actual or proposed PAs that is performing a key watershed protection function. From studies
carried out in surrounding countries, an average figure (at equivalent 2010 Montenegro prices)of €25.23
per ha can be applied, referring to expenditures avoided on the prevention and mitigation of erosion. This
equates to an annual value of some €1 million a year.
It should however be noted that the total value of PA watershed protection is much greater than this, as
siltation, sedimentation and loss of water regulation services results in substantial damages and costs to
downstream producers and consumers, such as hydropower, household, industrial and agricultural water
users in areas downstream of PAs. Unfortunately, no data are available.
Table 4: summary of value of other uses of PA watershed protection services
Damage costs/expenditures avoided €1.0 million
Total PA watershed protection value €1.0 million
Flood prevention
Floods and landslides rank among the major natural hazards facing Montenegro (RMSI 2008). Natural
ecosystems impact on the frequency and severity of these natural disasters. Flooding is particularly intense
in mountainous areas and low-lying floodplains: the Skadar Lake area and upper catchments of the Lim and
Tara Rivers are among the most vulnerable areas in the country (Tarchiani 2011). It is likely that the
frequency and severity of these events will intensify in the future, both due to ongoing ecosystem
degradation and because of climate change. The climate change scenario to 2100 which has been
constructed for Montenegro suggests that a strong disturbance in the balance of water resources is
expected: flood waves will become more common, and affect progressively larger areas, as a result of
increased intensity of rainfall and because of sea level rise (Government of Montenegro 2010).
Farmland, housing, traffic and communication lines are endangered by flooding, while in the region of
Skadarsko jezero, flooding also has detrimental effects on sanitary conditions for the local population (ten
Brink et al 2007). Over recent years, there has been marked increases in losses from property damage and
lost revenue due to business interruption caused by extreme weather events (Tarchiani 2011), and the best
and most fertile agricultural land is also regularly flooded (RMSI 2008). Major flooding events were
recorded in November and December 2007, 2009 and 2010, affecting 1,086, 450 and 6,350 people
respectively, an average of just under 2,000 people a year (WHO 2011). Looking at the entire period 1900-

13
2011, 1,000 people were affected by each flash flood event and 2,300 people by each general flood event
(PreventionWeb 2011).
Durmitor, Biogradska gora, and Skadarsko jezero National Parks all provide important floods control
services. Unfortunately, no comprehensive national-level data are available on either the damage costs
associated with floods and landslides, or of the expenditures that are made to prevent or mitigate them.
Detailed studies have however been carried out around Skadarsko jezero National Park on the impacts of
the November/December 2010 floods (ISSP 2011). Damage due to floods was reported by 839 households
in Golubovci and Tuzi municipalities, 287 households in Cetinje and Bar and 136 households living inside
the National Park: a total of some 3,200 people. The total compensation paid was €2.1 million, or an
average of just under €1,700 per household. In addition, damage to public and commercial infrastructure
was estimated to total €1.9 million, and just over €0.4 million was paid in compensation from government
funds.
We can see that the number of households affected by flooding around Skadarsko jezero National Park
accounts for just under half of the total population impacted by the 2010 flood events in Montenegro. If it
is assumed that a third of the remaining flood-affected population live in mountainous areas of the Tara,
Piva, Komarnica and Morača basins, then existing or planned PAs may play an appreciable role in providing
flood mitigation to just under two thirds of the people in Montenegro which are regularly affected by
flooding. Extrapolating the historical data on the frequency and impact of flooding events, we can assume
that a flash flood (affecting 1,000 people) occurs every year and a general flood event (affecting 2,300
people) every 3 years. If the upstream protection functions of PAs serve to minimise the affected
population in these areas by just 25% below what it would have been in the absence of the protective
functions of PAs, then the value of flood control in terms of damage costs avoided (projected on a pro rata
basis from those recorded around Skadarsko jezero National Park in 2010) equates to for a flash flood
event and for a general flood event, an average of €0.5 million a year.
These figures refer to the expenditures which are made to deal with the effects of flooding events. It is also
possible to look at the preventive expenditures which are saved. No data are available for Montenegro, but
work carried out in Maramures Mountains Natural Park in Romania estimates the value of water regulation
and flood control services provided by forested ecosystems from the public expenditures avoided, coming
up with a figure of €150/hectare – equivalent to €164 at 2010 Montenegro price levels (Ceroni 2007). It
should be noted that this figure can only be applied to forested mountain PAs, not to the Lake Skadar
region. If half of the PA forest area that has already been ascribed for the calculation of watershed
protection benefits also serves an important flood mitigation function, then this translates into annual
benefits of some €3.3 million a year.
Table 5: summary of value of PA flood prevention services
Damage costs avoided €0.5 million
Preventive expenditures avoided €3.3 million
Total PA flood protection value €0.5-3.3 million
Summary of the distribution of PA values across the economy
The sections above have described in detail how Montenegro’s PAs generate economic benefits for a wide
range of groups and economic sectors. Taking out the benefits that are presented in more than one section
(for example visitor consumer surplus is shown both under “tourism” and under sub-sections such as
boating, rafting and guided tours) gives us a total estimated value of the PAS of €67.8 million

14
The bulk of this value is associated with tourism and recreation (some two thirds), followed by water supply
services (Table 6). However, it should be reiterated that this is an extremely conservative, and incomplete,
estimate of the value of PAs. It covers only those benefits that could actually be quantified on the basis of
available data. Tourism earnings and income are undoubtedly a key value generated by Montenegro’s PAs,
and their importance should not be under-emphasised. At the same time, it is necessary to bear in mind
that it is tourism-related activities for which there were the greatest amount of information available to
this study (as well as being the main economic benefit for which records are kept and statistics gathered at
the PA level) − and that they have therefore been able to be valued fairly comprehensively as compared to
other PA benefits. It is therefore hardly surprising that the values calculated are so large, as compared to
other PA goods and services (such as, for example, watershed and flood protection services, for which it
has been impossible to fully value the wide range of economic impacts, contribution to income, and costs
and losses avoided), for which much less information was available.
Table 6: contribution of different sub-sectors and activities to PA values 2010
Value
(€ mill)
Guided tours, hiking and land sports 2.9
Water sports and recreational fishing 5.7
Other PA tourist values and sales 35.2
Use of other PA land and resources 3.5
Water supply services 19.0
Watershed/flood protection services 1.5
Total quantified value 67.8
In turn, these PA values contribute to production, output and income in many different sectors, and benefit
a wide range of stakeholder groups. With similar caveats concerning the availability of information and
focus of the valuation study to those mentioned above, we can see that a large share – almost half – of
quantified PA values accrue to non-commercial users and beneficiaries: mainly local communities and PA
visitors (Table 7). The private sector, ranging from small-scale entrepreneurs to larger companies and
industries, is also a significant beneficiary of PA goods and services, which also make a substantial
contribution to government revenues.
Table 7: distribution of PA values across beneficiary groups 2010
Value
(€ mill)
PA authorities 1.0
Other government 9.5
Non-commercial users/ beneficiaries 32.3
Private sector 25.0
Total quantified value 67.8
Measuring the broader economic impacts of PAs
Although a lack of data prevents any meaningful sectoral or macroeconomic-level analysis, it is important
to underline that the economic footprint of PAs is wide-ranging (as has been explained in Chapter 2). The
goods, services and activities that PAs generate in turn support and protect a large amount of production,

15
consumption and output off-site, and in other parts of the economy. It has not been possible to quantify in
monetary terms the economic multipliers and secondary effects of PA goods and services in terms of the
multipliers and induced spending and earnings that are generated in this study, although – as below –
partial data can be presented, referring to hydropower and tourism sectors.
Hydropower
One example, that has been touched on above, is the watershed protection services that enable and
protect activities in the hydropower, irrigated agriculture and domestic water supply sectors. Although it
has only been possible in this study to provide partial estimates of their value, essentially of public damage
costs/expenditures avoided, the watershed protection afforded by PAs also has substantial economic
impacts via costs avoided and revenues sustained for the private sector, food and energy supplies for
domestic consumers, national employment, investment flows, export earnings and GDP for the country as a
whole. In reality, the figure of €1 million a year that is presented above is only the tip of the iceberg.
Durmitor and (to a lesser extent) Biogradska gora National Parks, as well as Tara River Man and Biosphere
Reserve, Piva River Canyon and Komarnica River Canyon Monuments of Nature, Platije Canyon, Mrtvica
Canyon and Mala Rijeka Canyon Proposed Natural Monuments, Morača Catchment and Canyon Proposed
Area of Special Natural Characteristics and Sinjajevina/Saranci Proposed Regional Park all serve to protect
the watersheds which feed existing or planned hydropower schemes.
Hydropower plants (HPP) that depend on watersheds protected by the PAs mentioned above include the
existing Piva hydroelectric scheme as well as planned large-scale and small-scale hydropower plants (HPP)
on the on the Morača River. The total hydropower potential in Montenegro is estimated to be 9,846 GWh,
and a “moderate construction” scenario envisages the development of new hydropower facilities totalling
just over 486 GWh up to 2025 (MED 2008a) − a total of 2,190 GWh, when existing schemes (867 GWh of
large-scale hydropower and 836 GWh of small schemes) are included (EPCG 2009).
Piva HPP has an installed capacity of 342 MW (Government of Montenegro 2010). In 2010 it produced
about 1,286 GWh of electricity, or 34.5% of Montenegro’s total net electricity production (EPCG 2011). In
2008 (the latest year for which figures are available), direct consumers accounted for approximately 31% of
gross electricity consumption, and distributive consumers 41%, paying average prices of 4.1¢/kWh and
9.6¢/kWh respectively (EPCG 2009). Applying these figures to the amount of electricity generated by Piva
HPP in 2010, and adjusting for the proportion of generated power actually sold, suggests an annual value of
some €56.2 million.
A cascade of four hydropower schemes has been proposed for the Morača River. These are anticipated to
have a combined installed capacity of 238.4 MW and a generation of about 700 GWh/year; in addition, the
eleven reservoirs that may be created in the upper catchment area (to intercept sediments and prevent
siltation of the downstream dams) have potential for small-scale hydropower generation, with an installed
capacity of 313 MW and an annual generating capacity of 520 GWh (NVE 2010). It should be noted that the
main impact of PA watershed protection services will be on these small-scale hydropower facilities, as the
reservoirs would effectively mitigate any further silt and sediment transport downstream. Applying the
same assumptions as have been used for Piva HPP, this suggests that the potential gross sales value from
small-scale HPP that are protected by PAs is something in the region of €22.7 million a year.

16
Tourism
One sector for which these secondary, induced and multiplier effects can be calculated is tourism. As is also
the case with other sectors and PA goods and services, the total economic impact of PA tourism is far
greater than just direct spending on entry fees, hotels and restaurants (MTE 2008).
The production and consumption associated with the tourism sector also includes visitor expenditures on
secondary and support services (such as transport, travel agents and other purchases) and government
spending on travel and tourism services linked directly to visitors. As well as its direct economic impact, the
industry has significant indirect and induced impacts. These include capital inflows and investments on
infrastructure and equipment, collective government spending (for example on tourism marketing and
promotion, aviation, administration, security services, resort area security services and sanitation, etc.),
and domestic purchases of goods and services by the sectors dealing directly with tourists (for example,
food and cleaning services by hotels, fuel and catering services by airlines, and IT services by travel agents).
Last, but not least, the induced contribution includes the income and jobs supported by the spending of
those who are directly or indirectly employed by the travel and tourism industry.
The World Travel and Tourism Council has constructed a set of “tourism satellite accounts” for
Montenegro, which measure these broader economic impacts (MTE 2008, WTTC 2011). These show that
around 90% of visitor spending is on leisure travel. If we assume that these figures can be assigned on a pro
rata basis to the estimated 463,000 PA visitors, then we can estimate that PA tourism made a total direct,
indirect and induced contribution to GDP of some €172 million in 2010 (Table 8). This includes gross visitor
spending of more than €220 million, public expenditures of almost €8 million and capital investment in
excess of €60 million, as well as some 7,700 full-time job equivalents.
Table 8: travel and tourism economic impacts 2010
All domestic and
international tourism[1]
All leisure
travel[2]
PA
tourism[3]
Visitor exports (foreign visitor spending) 545.0 490.5 179.7
Domestic expenditure 127.5 114.8 42.0
Government individual spending 1.5 1.4 0.5
Purchases by tourism providers -435.4 -391.9 -143.6
Direct contribution to GDP (€ million) 238.6 214.7 78.7
Domestic supply chain 78.3 70.5 25.8
Capital investment 187.9 169.1 62.0
Government collective spending 21.7 19.5 7.2
Imported goods from indirect spending -96.0 -86.4 -31.7
Induced 92.5 83.3 30.5
Indirect and induced contribution to GDP (€ million) 284.4 256.0 93.8
Total contribution to GDP (€ million) 523.0 470.7 172.4
Direct employment 10.2 9.2 3.4
Indirect employment 13.1 11.8 4.3
Total employment (‘000 jobs) 23.3 21.0 7.7
Source: [1] WTTC 2011, [2] imputed from WTTC figures for 2009 and 2010, [4] imputed on a pro rata basis based on MONSTAT and PA records of visitor arrivals and overnights.

17
4. Trends in Protected Area investment
The previous chapter described the substantial contribution that PA goods and services make to selected
sectors and to key economic and development indicators. An important question that now arises is: if PAs
are so valuable to the economy, and to so many groups in Montenegro, then how much is actually being
invested in maintaining this important asset, and by whom?
Although they are by no means comprehensive, some data are available to enable us to answer this
question. Funding to PAs comes from two main sources: the State budget, and the reinvestment of income
generated from charges levied on the use of PA goods and services. However, as we shall see below, these
investments are extremely small, when compared either to the level of benefits that PAs generate for the
economy or to the basic requirements of the PAS.
Self-generated income
First, we can look at the revenues that are
generated by PAs and reinvested in their
management.
It is only National Parks that earn income. This
averages around €0.9 million a year, although
has been steadily falling over the last four years
– from just over €1 million in 2007 and 2008 to
some €800,000 in 2009 and 2010 (Figure 5).
About half of these revenues are earned from
tourism. The remainder come from sales of
publications, and other uses of PA lands and
resources.
Public budget transfers
PAs are funded from the public budget, including donor contributions. Again, it is only National Parks that
receive direct transfers from national government, channelled through Public Enterprise National Parks of
Montenegro (PENP). This averages just over €0.4 million a year, although has fluctuated quite considerably
over the last four years.
Various other public funding sources also contribute towards the maintenance of the PAs a whole (i.e.
including other categories of PAs than National Parks), although these are relatively small in comparison,
and do not comprise regular, direct allocations. They include spending made by the Nature Protection
Institute, and recent occasional allocations to activities such as (to take examples from recent years) the
development of secondary legislation for Nature Protection Law, establishment of a framework for Natura
2000, implementation of the Law on National Parks, development of MPAs, and the initiation of Eco-Fund,
among others. Data are not available on the exact amount or composition of this funding.
Source: ISSP 2011, UNDP-GEF project
Figure 5: National Park revenues 2007-10
0
0.2
0.4
0.6
0.8
1
1.2
2007 2008 2009 2010
€ m
illio
n

18
Total funding to PAs
Adding together the income earned and direct
transfers from national government shows that,
in total, National Parks received average direct
investments of just under €1.4 million a year, or
€1,600/km2 between 2007 and 2010.
Around one third of this is typically contributed
through transfers from the national budget, and
two thirds from revenues and other contributions
from PENP.
Overall, funding has been falling over the last four
years, and in 2010 total investments were worth
only just over half of what they had been in 2008
(Figure 6).
Also taking into account indirect or occasional funding from the public budget (as outlined above), and
considering all categories of PAs, increases this figure slightly. A financial scorecard analysis was carried out
during the Project Preparation Grant phase of the project. This calculated total funding to all categories of
PAs from all sources to be in the region of €2 million a year, or an average of €1,800/km2. Just under half of
this came from public budgets, with the balance funded through reinvested revenues.
Comparing actual and required PA investment levels
PA investment figures for Montenegro (an average of €1,600/km2 of direct funding to National Parks or a
total of €1,800/km2 across the entire PA system) do not compare particularly well with middle-income
countries and economies in transition in the region. Data generated for other Central and Eastern European
countries for example indicates that over recent years public funding to PAs averaged €4,170/km2 in
Hungary, €2,890/km2 in the Czech Republic and €1,900/km2 in Croatia (Mansourian and Dudley 2007).
Funding is also not sufficient to maintain the PA network. The on-the-ground reality is that the majority of
PAs are operating on a budget that is effectively zero. Only National Parks are under active management
and staffing – and even they face a pressing shortage of funds for essential conservation activities and
investments. For other categories of PA, the situation is even more critical.
The financial scorecard analysis mentioned above looks at the actual financing needs for Montenegro’s
terrestrial PAs. These figures cover both the existing 1,089 km2 national PA network and an estimated
including 650 km2 of new PAs. It recommends that a minimum of €5.3 million a year is required for basic
management of terrestrial PAs, and €6.3 million is needed for improved management (€3,000-€3,600/km2
averaged across the entire national PA network). This is up to twice the amount that is actually being
invested.
Source: calculated from ISSP 2011, UNDP-GEF project
Figure 6: public investment in National Parks 2007-10
0
250
500
750
1,000
1,250
1,500
1,750
2,000
2,250
-
0.25
0.50
0.75
1.00
1.25
1.50
1.75
2.00
2.25
2007 2008 2009 2010
€/km
2
€ m
illio
n
National budget Own income €/km2

19
5. Weighing up the public costs and benefits of Protected Areas
Modelling alternative PA investment and management futures
Chapter 3 described the value of PAs to Montenegro’s economy in 2010, while Chapter 4 reviewed recent
trends in public spending on PAs. These analyses provide a useful snapshot of the current situation as
regards the economic costs and benefits of the PAS. Our concern is however now to look at the longer-term
public costs and benefits of establishing and managing PAs as an economically viable form of land use.
In order to do this, the current chapter develops scenarios or alternative futures for PA management and
investment (and, by implication of the status of biodiversity and ecosystem services). The aim is to give a
broad indication of the economic costs and benefits associated with public policy and investment choices as
regards Montenegro’s PAS.
No comprehensive scenarios or projections for PAs, biodiversity and ecosystems in Montenegro exist,
although various public policy documents (such as the National Biodiversity Strategy and Action Plan for
2010-15, Protection and Development Strategies for individual National Parks, Spatial Plan to 2020, Tourist
Development Strategy to 2020 and National Strategy for Sustainable Development and Action Plan for
2007-12) present some predictions of likely future trends in selected parameters. The scenarios developed
below have been informed by these, and other, documents on Montenegro (particularly those relating to
EU accession and integration – for example see ten Brink et al 2007), as well as by the recent work carried
out by ISSP on the economic value of pilot PAs and of course a review of actual statistical data. They have
also been guided by recent work carried out under The Economics of Ecosystems and Biodiversity initiative
(Braat and ten Brink 2008, TEEB 2008, 2010) which looked at models for assessing the costs of policy
inaction as regards biodiversity and ecosystems, and by a recent European Commission study on “scenarios
and models for exploring future trends of biodiversity and ecosystem services changes” (IEEP et al 2009).
For this reason, the scenarios that are modelled are highly speculative, and rely on many assumptions. The
Annex to this document lists the detailed assumptions used. The figures presented in the current chapter
should therefore be seen as a broad indication of what might occur under different alternative PA
investment and management futures, rather than a definitive statement of what will happen.
Business as usual and investing in natural capital
We consider two basic scenarios for Montenegro’s PAS: a baseline trend scenario (assuming that current
trends in PA investment, management and use will continue), and an explorative scenario (forecasting the
effect of improved PA investment and management effectiveness).
Business as Usual − continuing under-investment in PAs: This corresponds to a situation where current
trends in PA investment, management and use continue. As a result, although the area of the PAS expands
as planned, existing and new PAs suffer from a chronic lack of funding, and weak management
effectiveness. The recreational use of PAs increases, as national tourism develops, at least initially, but over
the longer-term stagnates as the quality of PAs and visitor experiences decline. Insufficient spending also
translates into an inability to manage threats to biodiversity and ecosystems: while PAs continue to provide
important ecosystem services (such as water supplies, watershed protection and flood control), the quality
and impact of these services decreases progressively over time.

20
Investing in Natural Capital − adequate investment in PA conservation and sustainable use: This
corresponds to a situation where PA investment is gradually increased and policy implementation is
improved, eventually meeting the financing needs that are required for “optimal” (as defined in the
financial scorecard) management. The recreational use of PAs continues to increase steadily, in line with
development of the national tourism market, and visitor experience improves as the quality of both natural
ecosystems and the facilities and services offered by PAs advances. Better management effectiveness
means that the status and integrity of biodiversity and ecosystems in PAs and their broader landscapes is
maintained and improved: the quality and impact of PA ecosystem services is sustained and in many cases
grows.
Analysis is made of the public costs and benefits of these two alternative scenarios over the next 25 years
(starting from a baseline year of 2010, and continuing up to 2035). The public costs and benefits of
“business as usual” and “investing in natural capital” are compared, and the value-added by undertaking
adequate investments in PA conservation and sustainable use is demonstrated.
As mentioned above, the scenario models are highly speculative, due to a lack of both biophysical and
economic data. This also means that (as in Chapter 3) it is also not possible to include all of the economic
benefits associated with PAs. An important omission on the cost side, which should be noted, is that the
opportunity costs of PAs could not be calculated on the basis of available information. These comprise the
production, income and other land and resource use/development benefits foregone by choosing to
conserve and sustainably utilise land and resources in the PAS. These are likely to be substantial, and wide-
ranging in their effects. In this case, the exclusion of opportunity costs is not however considered to have a
major impact on the resulting figures, as both scenarios refer to the same land area in the PAS under the
same basic management regime – it is conservation management effectiveness that varies between the
two scenarios – and so will imply similar opportunity costs.
The economic implications of continuing business as usual
Continuing business as usual will result, initially, in an increase in PA values, as growth in biodiversity and
ecosystem use outweighs the progressive decline in the quality and value of services generated. However,
over time, values will start to decrease, as the ability of PAs to provide key goods and services is gradually
eroded (Figure 7).
Under the business as usual scenario, the net present value (NPV) of the gross economic contribution of the
PAS over the next 25 years is just over €662 million. This compares to a total public investment of just
under €63 million (with a NPV of €21 million).
Figure 7: PA values − business as usual

21
The economic implications of investing in natural capital
Investing in natural capital will result in a progressive increase in PA values, as both levels of biodiversity
and ecosystem and the quality and value of services generated improve. Although this increase will be
sustained, the rate of growth will slow over time as ecosystem and biodiversity status is restored and as PA
management effectiveness targets are reached (Figure 8).
Under the investing in natural capital scenario, the net present value (NPV) of the gross economic
contribution of the PAS over the next 25 years is just under €958 million. This compares to a total public
investment of just under €114 million (with a NPV of €35 million).
Figure 8: PA values − investing in natural capital
Winners and losers
We can differentiate four main groups that are economically impacted by PAs: PA authorities, other
government agencies, the private sector, and non-commercial users. As explained above, in Chapter 2,
these cover most sectors and population groups in the country; they include beneficiaries at local, regional
and national levels.
Under both business as usual and investing in natural capital scenarios, the primary beneficiaries of PA
values are non-commercial users, gaining from a share of around a half of the total values generated,
followed by the private sector at around a third (Figure 9).
Figure 9: distribution of PA values − business as usual & investing in natural capital

22
Although there is little change in the broad distribution of benefits between the two scenarios, investing in
natural capital implies small gains in the relative share accruing at household and company levels, and a
small decrease for public revenues (Figure 9). However, the absolute value of PA benefits generates
substantial gains for all beneficiary groups, more than doubling the total values received by the private
sector and non-commercial users over the 25 year period of analysis, and increasing public revenues by 15-
30% (Figure 10).
Figure 10: gains to beneficiary groups − investing in natural capital
The value-added by investing in natural capital
It is clear that investing in natural capital implies sustained, and increasing, PA economic values for all
beneficiary groups, while continuing business as usual will result in the steady erosion of PA economic
values. Although the value-added by investing in natural capital as compared to continuing business as
usual is relatively small over the short-term, it progressively increases as the gap widens between the two
scenarios (Figure 11).
Figure 11: annual value-added from investing in natural capital over business as usual
Investing in natural capital shows a steady, and increasing, value-added over continuing business as usual.
After 25 years, the cumulative gain will be more than €1.5 billion (Figure 12), with a NPV of €296 million.
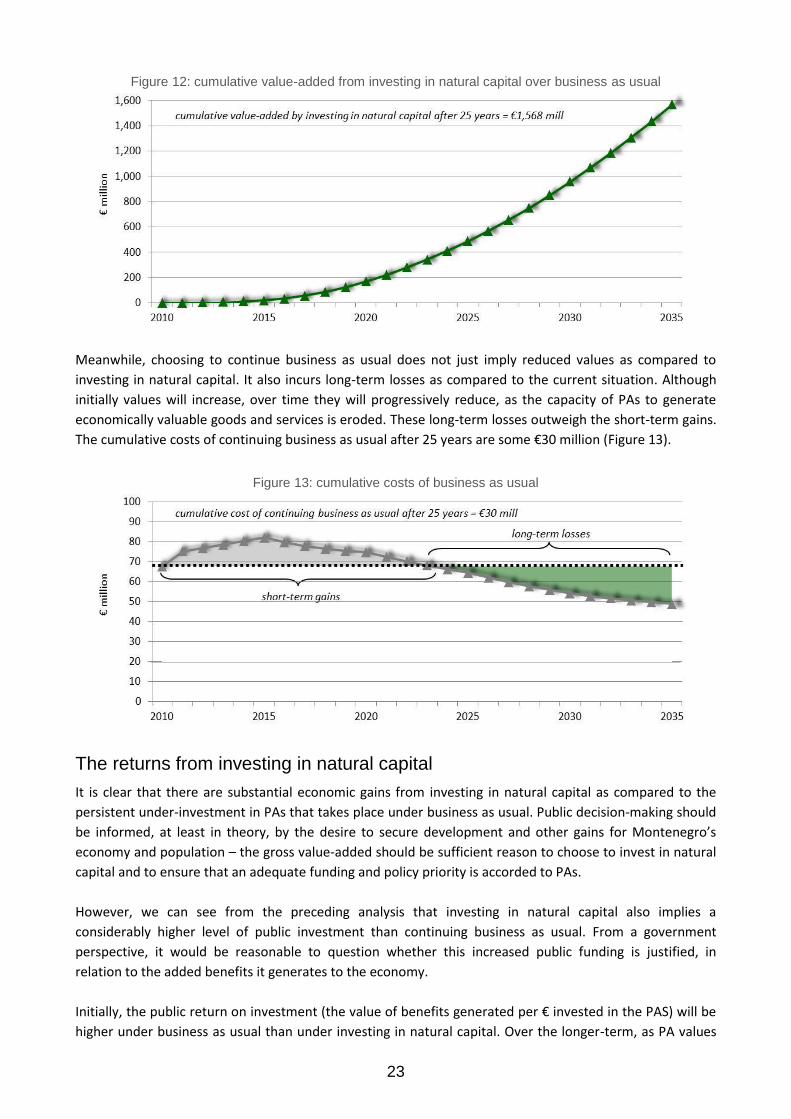
23
Figure 12: cumulative value-added from investing in natural capital over business as usual
Meanwhile, choosing to continue business as usual does not just imply reduced values as compared to
investing in natural capital. It also incurs long-term losses as compared to the current situation. Although
initially values will increase, over time they will progressively reduce, as the capacity of PAs to generate
economically valuable goods and services is eroded. These long-term losses outweigh the short-term gains.
The cumulative costs of continuing business as usual after 25 years are some €30 million (Figure 13).
Figure 13: cumulative costs of business as usual
The returns from investing in natural capital
It is clear that there are substantial economic gains from investing in natural capital as compared to the
persistent under-investment in PAs that takes place under business as usual. Public decision-making should
be informed, at least in theory, by the desire to secure development and other gains for Montenegro’s
economy and population – the gross value-added should be sufficient reason to choose to invest in natural
capital and to ensure that an adequate funding and policy priority is accorded to PAs.
However, we can see from the preceding analysis that investing in natural capital also implies a
considerably higher level of public investment than continuing business as usual. From a government
perspective, it would be reasonable to question whether this increased public funding is justified, in
relation to the added benefits it generates to the economy.
Initially, the public return on investment (the value of benefits generated per € invested in the PAS) will be
higher under business as usual than under investing in natural capital. Over the longer-term, as PA values

24
are eroded under a situation of continuing under-investment, the returns per unit of public funding will
however start to decline. This is as compared to an immediate decrease in return on investment under
investing in natural capital (as the initial investments required to expand the PAS and improve PA
management effectiveness) followed by a sustained increase in public returns (Figure 14).
After 25 years, PAs will have generated a total return on public investment of almost €29 per €1 of funding
under the investing in natural capital scenario, as compared to €27.5 under business as usual. The total
benefits generated over and above public funding invested shows a pronounced difference: €3.2 billion
with a NPV of €923 million under investing in natural capital as compared to €1.7 billion with a NPV of €641
million under business as usual.
Figure 14: returns to PA investment from business as usual & investing in natural capital
25
6. Summary of findings and conclusions: the economic rationale for public investment in Protected Areas
This report has demonstrated that, even on the basis of only a very superficial and partial valuation
exercise, the protected area system generates substantial values for Montenegro’s economy. It has shown
that:
PAs generate considerable values. The value of tourism and recreational activities, other uses of PA
lands and resources, water supply services and watershed/flood protection services is estimated at just
under €68 million in 2010.
PAs play an appreciable role in the national economy and development. In 2010, the quantified value of
PAs equated to some 2.2% of GDP, or economic benefits of €106 generated per capita of Montenegro’s
population.
PA values accrue to multiple sectors, at many different levels of scale. In 2010, just under a half of PA
values accrued to the general public (worth more than €32 million), more than a third generated
earnings and cost savings to businesses and industries (€25 million), and around 15% earned revenues
for the government (€11 million). PA goods and services supported the output of many different sectors
of the economy, including tourism, energy, water, agriculture, infrastructure and disaster risk reduction.
The values generated by PAs have a substantial multiplier effect across the economy. For example, PAs
protect the source of existing and planned hydropower generation worth almost €80 million a year in
public revenues. PAs generate total income, investment and spending for the tourist sector of €172 (or
5.7% of GDP), including gross visitor spending of more than €220 million and capital investment in
excess of €60 million, as well as some 7,700 full-time job equivalents.
There is significant public under-investment in PAs. At €2 million a year in total or €1,800/km2, current
funding to the PAS is insufficient to manage the PA network effectively. It is lower than in many other
Central and Eastern European countries, and less than half of the actual financing needs for effective PA
management in Montenegro.
Continuing to accorded PAs a low policy and investment priority will incur economic losses. Continuing
to carry out “business as usual” may cost Montenegro’s economy and population more than €30 million
over the next 25 years.
Investing adequately in PAs will generate value-added to the economy. Choosing to “invest in natural
capital” may create a steady, and increasing, value-added to Montenegro’s economy and population
over continuing “business as usual”, generating incremental benefits worth more than €1.5 billion over
the next 25 years.
There is a high economic return to public investment in PAs. Although choosing to “invest in natural
capital” implies a considerably higher level of public investment than continuing “business as usual”,
these expenditures are far outweighed by the economic benefits generated. Net benefits will more than
double over the next 25 years, and PAs will generate a total return of almost €29 per €1 of public funds
invested.
PAs are not being managed to their full economic potential. The public income earned from PAs is
currently less than €1 million a year. There is low cost recovery − this equates to only around 15% of
projected funding needs. In many cases there are unmet consumer demands for sustainable PA
products and services, and the bulk of PA goods and services are being provided at a low or zero price to
users. Increased public investment and policy action can help to realise these economic opportunities.
There remain untapped opportunities to increase the levels of revenues generated from PAs. Tourists
and recreational visitors are, for example, willing to contribute almost €19 million a year more than they

26
are currently being charged as entry fees, and there is a potential market for PA authorities to provide
hikes and guided tours which is worth up to €3 million a year in public earnings. Increased public
investment and policy action is required to capture these potential revenue streams.
From a public perspective, we can therefore see that PAs help to sustain income, output and consumption
across the economy, generate employment and earn the government fiscal revenues. Because of the
important and economically valuable services that that it provides, maintaining the PAS is also a way of
avoiding the losses that are associated with ecosystem and biodiversity degradation, and are manifested
through reduced earnings, increased costs and expenditures and declining economic wellbeing. These
economic benefits and costs avoided accrue to the government, the general public and to many different
sectors of the economy, such as tourism, energy, water, agriculture, infrastructure and disaster risk
reduction.
The overriding message is clear: using the PAS to conserve biodiversity and ecosystems is not just a
biological or ecological issue, but is also a major economic concern. It generates immense values, costs
saved and losses avoided in other parts of the economy. These range from the economic activities that
underpin local economies, through the life support services that protect human settlements and enable
production, the outputs and production of both small businesses and large-scale industries, the goods and
services that are traded on national and export markets, and the key development indicators that underpin
GDP and sustain and enhance the growth of Montenegro’s economy.
The implication is that PAs should be treated, in public policy and investment terms, in the same way as any
other component of productive infrastructure: as a stock of equipment, facilities and services that are
required for Montenegro’s economy and human population to function, prosper and grow. Just as the PAS
should be seen as an economic asset, so there are tangible economic returns from investing in it.
Conversely, running down this stock of natural capital imposes costs and losses on most sectors of the
economy, and undermines economic growth. If managed sustainably, PAs can continue to yield
economically productive and beneficial flows of goods and services. If used and managed unsustainably,
these economic benefits will progressively be lost – to the cost of Montenegro’s economy and population.
27
7. References
Braat, L. and ten Brink, P. (eds.). 2008. The Cost of Policy Inaction: The case of not meeting the 2010
biodiversity target. study for the European Commission, DG Environment, Brussels.
Ceroni, M. 2007. Ecosystem services and the local economy in Maramures Mountains Natural Park,
Romania. Report submitted to United Nations Development Programme (UNDP), Bucharest.
Ceroni, M. and M. Dragoi. 2008. Assessing and capturing ecosystem benefits in Macin Mountains National
Park, Romania. Report submitted to United Nations Development Programme (UNDP), Bucharest.
CSTI. 2007. The Experience of Tourists in Northern and Southern Montenegro. Centre for Sustainable
Tourism Initiatives (CSTI) and the Center for Entrepreneurship and Economic Development (CEED),
Podgorica.
Dumitras, D. 2008 Comparing welfare estimates from travel cost and contingent valuation - application to
the recreation value of Romanian parks. Lucrari Stiintifice, Seria I, 10(4).
Dumitras, D., Arion, F. and E. Merce. 2011. A Brief Economic Assessment on the Valuation of National and
Natural Parks: the Case of Romania. Not. Bot. Hort. Agrobot. Cluj 39(1): 134-138.
Emerton, L. 2009a. Corporate Ecosystem Valuation: A Scoping Study. World Business Council for
Sustainable Development (WBCSD), Geneva.
Emerton, L. 2009b. Economic Valuation of Protected Areas: Options for Macedonia. GEF/UNDP PIMS 3728:
Strengthening the Ecological, Institutional and Financial sustainability of Macedonia’s Protected Area
System and Ministry of Environment and Physical Planning, Skopje.
Emerton, L. 2009c. Making the Economic Case: A Primer on the Economic Arguments for Mainstreaming
Poverty-Environment Linkages into Development Planning. Poverty-Environment Initiative, United
Nations Development Programme (UNDP) and United Nations Environment Programme (UNEP),
Nairobi.
EPCG. 2009. Report on Business Operations of Elektroprivreda Crne Gore A.D. Nikšid for Year 2008.
Elektroprivreda Crne Gore A.D. Nikšid (EPCG), Podgorica.
EPCG. 2009. Electricity consumption. http://www.epcg.co.me/en01_03_03.html, accessed 22 August 2011.
FAO. 2010. Global Forest Resources Assessment 2010. FAO Forestry Paper 163, Food and Agriculture
Organisation of the United Nations (FAO), Rome.
Getzner, M. 2009. Economic and cultural values related to Protected Areas Part A: Valuation of Ecosystem
Services in Tatra (PL) and Slovensky Raj (SK) national parks. WWF World Wide Funds for Nature Danube
Carpathian Programme (DCP), Vienna.
Government of Montenegro. 2010. The Initial National Communication on Climate Change of Montenegro
to the United Nations Framework Convention on Climate Change (UNFCCC). Ministry for Spatial
Planning and Environment, Podgorica.
IEEP, Alterra, Ecologic, PBL and UNEP-WCMC. 2009. Scenarios and models for exploring future trends of
biodiversity and ecosystem services changes. Final report to the European Commission, DG Environment
on Contract ENV.G.1/ETU/2008/0090r. Institute for European Environmental Policy, Alterra Wageningen
UR, Ecologic, Netherlands Environmental Assessment Agency, United Nations Environment Programme
World Conservation Monitoring Centre.
ISSP. 2011. Economic Valuation of Montenegro’s Protected Area System. Report prepared for “GEF/UNDP
PIMS 4279: Catalyzing Financial Sustainability of the PA System” project, Institute for Strategic Studies
and Prognoses (ISSP), Podgorica.

28
ITSC.2006. Environmental Impact Assessment Study on Regional Water Supply System of Montenegrin
Coast from Water Source Bolje Sestre. Report prepared for Government of Montenegro by ITSC Ltd,
Podgorica.
MAFWM. 2006. Montenegro’s Fisheries Development Strategy and capacity building for implementation of
EU Common Fisheries Policy Ministry of Agriculture, Forestry and Water Management, Podgorica.
Mansourian, S. and N. Dudley. 2008. Public Funds to Protected Areas. WWF International, Gland.
MED. 2008a. Investment Opportunities: Energy Sector of Montenegro. Ministry of Economic Development,
Podgorica.
MED. 2008b. Spatial Plan Of Montenegro until 2020. Ministry of Economic Development, Podgorica.
Millennium Ecosystem Assessment. 2005. Ecosystems and Human Well-being: Synthesis. Island Press,
Washington DC.
Mrdak, D. 2005. Economic valuation of Tara river (Montenegro). Annex 2 in WWF. The Northern
Montengro Greedn Belt: Biodiversity Assessment Study on Durmitor-Tara-Prokletije Landscape.
WorldWide Fund for Nature Mediterranean Programme, Rome.
MONSTAT. 2008. Demografski trendovi u Crnoj Gori od sredine 20. Vijeka i perspektive do 2050. Godine.
Statistical Office of Montenegro (MONSTAT), Podgorica.
MONSTAT. 2011. Arrivals and overnight stays: monthly releases. Statistical Office of Montenegro.
http://www.monstat.org/eng/page.php?id=44&pageid=44 Accessed September 1 2011.
MTE. 2008. Montenegro Tourism Development Strategy to 2020. Ministry of Tourism and Environment,
Podgorica.
NVE. 2010. Strategic Environmental Impact Assessment for Detailed Spatial Plan for Hydro Power Projects
(HPPs) on the Morača River. Norwegian Water Resources and Energy Directorate on behalf of
Montenegro Ministry of Spatial Planning and Environment, Podgorica.
Olters, J. 2008. The Restorative Power of Nature. Monitor 19(903): 32-33.
Pagiola, S. 1996. Republic of Croatia Coastal Forest Reconstruction and Protection Project: Annex J.
Economic Analysis. Staff Appraisal Report: Report: Republic of Croatia Coastal Forest Reconstruction and
Protection Project, World Bank, Washington DC.
Philips. A. (ed.) 1998. Economic Values of Protected Areas: Guidelines for Protected Area Managers. Task
Force on Economic Benefits of Protected Areas of the World Commission on Protected Areas (WCPA),
the Economics Service Unit of IUCN International Union for Conservation of Nature (IUCN), Gland.
PreventionWeb. 2011. Montenegro - Disaster Statistics: Data related to human and economic losses from
disasters that have occurred between 1980 and 2010.
http://www.preventionweb.net/english/countries/statistics/?cid=266 accessed 1 September 2011.
RMSI. 2008. Risk Assessment for South Eastern Europe: Desk Study Review. South Eastern Europe Disaster
Risk Mitigation and Adaptation Initiative. Report prepared by RMSI for the Global Facility for Disaster
Reduction and Recovery (GFDRR), UN International Strategy for Disaster Risk Reduction (UN/ISDR),
Geneva.
Ruzzier, M., Žujo, J., Marinšek, M. and S. Sosič. 2010. Guidelines for economic evaluation of the natural
assets of the PAs. South East Europe Transnational Cooperation Programme, Institute of the Republic of
Slovenia for Nature Conservation, Ljubljana.
SCBD. 2008. Protected Areas in Today’s World: Their Values and Benefits for the Welfare of the Planet.
Technical Series No. 36, Secretariat of the Convention on Biological Diversity, Montreal.

29
Spurgeon, J. and D. Gallagher. 2010. Valuation of Tourism Benefits for Croatia’s Protected Areas. Report
prepared by Environmental Resources Management Ltd. for the Program on Forests (PROFOR), World
Bank, Washington DC.
Stolton, S. (ed.) 2009. Communicating values and benefits of protected areas in Europe. Results of a
seminar organised by BfN and EUROPARC Federation at the International Academy for Nature
Conservation, Isle of Vilm.
Tarchiani, V. 2011. National Assessment Report of the national capacities, gaps and needs in flood and
drought risk assessments: Montenegro. World Meteorological Organization (WMO), Regional
Programme on Disaster Risk Reduction in the South East Europe.
TEEB. 2008. The Economics of Ecosystems and Biodiversity. An Interim Report.
TEEB. 2010. The Economics of Ecosystems and Biodiversity: Mainstreaming the Economics of Nature: A
synthesis of the approach, conclusions and recommendations of TEEB.
ten Brink, P., Avramovski, L., Vermoote, S., Bassi, S., Callebaut, K., Lust, A. and A. Hunt. 2007. Benefits for
fYRoM and other countries of SEE of compliance with the environmental acquis. Final Report Part II:
Country-specific report Montenegro. Report prepared for the European Commission – DG Environment,
Arcadis ECOLAS N.V., Berchem and Institute of European Environmental Policy, Brussels.
UNECE. 2007. Environmental performance reviews: Republic of Montenegro. Environmental Performance
Reviews No. 25, United Nations Economic Commission for Europe, Geneva.
WHO. 2011. EM-DAT International Disasters Database: Montenegro Country Profile. World Health
Organization (WHO) Collaborating Centre for Research on the Epidemiology of Disasters Emergency
Events Database EM-DAT, maintained by Université catholique de Louvain, Brussels.
http://www.emdat.be/result-country-profile accessed 11 July 2011.
World Bank. 2010. Report No: ICR00001484. Implementation Completion and Results Report (IDA-43220)
on a Credit in the Amount of SDR6.6 million (US$ 10.0 million equivalent) to Montenegro for a
Montenegro Sustainable Tourism Development Project. Sustainable Development Department, South
East Europe Country Unit, Europe and Central Asia Region, World Bank, Washington DC.
WTTC. 2011. Travel and Tourism Impact 2011: Montenegro. World Travel & Tourism Council, London.
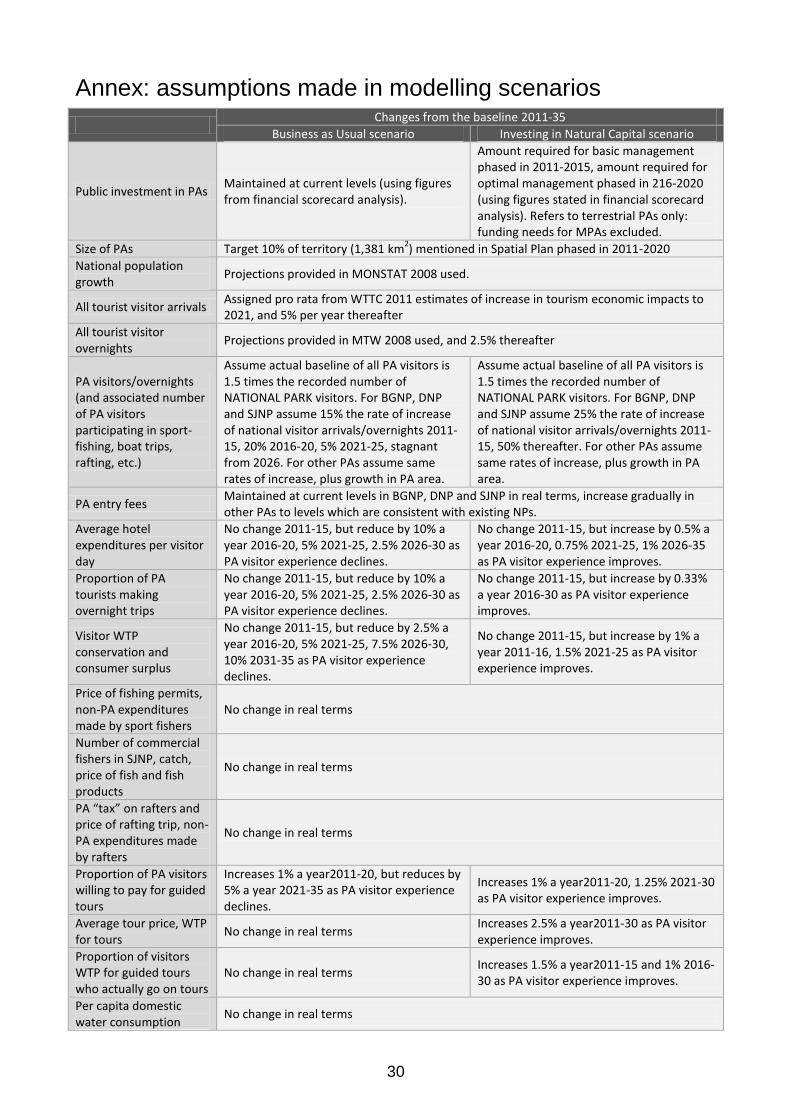
30
Annex: assumptions made in modelling scenarios
Changes from the baseline 2011-35
Business as Usual scenario Investing in Natural Capital scenario
Public investment in PAs Maintained at current levels (using figures from financial scorecard analysis).
Amount required for basic management phased in 2011-2015, amount required for optimal management phased in 216-2020 (using figures stated in financial scorecard analysis). Refers to terrestrial PAs only: funding needs for MPAs excluded.
Size of PAs Target 10% of territory (1,381 km2) mentioned in Spatial Plan phased in 2011-2020
National population growth
Projections provided in MONSTAT 2008 used.
All tourist visitor arrivals Assigned pro rata from WTTC 2011 estimates of increase in tourism economic impacts to 2021, and 5% per year thereafter
All tourist visitor overnights
Projections provided in MTW 2008 used, and 2.5% thereafter
PA visitors/overnights (and associated number of PA visitors participating in sport-fishing, boat trips, rafting, etc.)
Assume actual baseline of all PA visitors is 1.5 times the recorded number of NATIONAL PARK visitors. For BGNP, DNP and SJNP assume 15% the rate of increase of national visitor arrivals/overnights 2011-15, 20% 2016-20, 5% 2021-25, stagnant from 2026. For other PAs assume same rates of increase, plus growth in PA area.
Assume actual baseline of all PA visitors is 1.5 times the recorded number of NATIONAL PARK visitors. For BGNP, DNP and SJNP assume 25% the rate of increase of national visitor arrivals/overnights 2011-15, 50% thereafter. For other PAs assume same rates of increase, plus growth in PA area.
PA entry fees Maintained at current levels in BGNP, DNP and SJNP in real terms, increase gradually in other PAs to levels which are consistent with existing NPs.
Average hotel expenditures per visitor day
No change 2011-15, but reduce by 10% a year 2016-20, 5% 2021-25, 2.5% 2026-30 as PA visitor experience declines.
No change 2011-15, but increase by 0.5% a year 2016-20, 0.75% 2021-25, 1% 2026-35 as PA visitor experience improves.
Proportion of PA tourists making overnight trips
No change 2011-15, but reduce by 10% a year 2016-20, 5% 2021-25, 2.5% 2026-30 as PA visitor experience declines.
No change 2011-15, but increase by 0.33% a year 2016-30 as PA visitor experience improves.
Visitor WTP conservation and consumer surplus
No change 2011-15, but reduce by 2.5% a year 2016-20, 5% 2021-25, 7.5% 2026-30, 10% 2031-35 as PA visitor experience declines.
No change 2011-15, but increase by 1% a year 2011-16, 1.5% 2021-25 as PA visitor experience improves.
Price of fishing permits, non-PA expenditures made by sport fishers
No change in real terms
Number of commercial fishers in SJNP, catch, price of fish and fish products
No change in real terms
PA “tax” on rafters and price of rafting trip, non-PA expenditures made by rafters
No change in real terms
Proportion of PA visitors willing to pay for guided tours
Increases 1% a year2011-20, but reduces by 5% a year 2021-35 as PA visitor experience declines.
Increases 1% a year2011-20, 1.25% 2021-30 as PA visitor experience improves.
Average tour price, WTP for tours
No change in real terms Increases 2.5% a year2011-30 as PA visitor experience improves.
Proportion of visitors WTP for guided tours who actually go on tours
No change in real terms Increases 1.5% a year2011-15 and 1% 2016-30 as PA visitor experience improves.
Per capita domestic water consumption
No change in real terms

31
Changes from the baseline 2011-35
Business as Usual scenario Investing in Natural Capital scenario
WTP for water Decreases 5% a year2016-20, 7.5% 2021-25, 10% 2026-30 as ecosystem water services decline.
Decreases 1% a year2016-35 as ecosystem water services improves
Domestic water consumers
Increase in line with population growth for permanent residents, for tourist increase in line with growth in visitor overnights
Regional Water Project water supply
From projections given in ITSC 2006
Bottled water concession fees and market prices
No change in real terms
Bottled water extraction No change in real terms Identified existing potential water concessions are utilised by 2020
Watershed forest area Increases in line with expansion of PAs, but balanced by 1% decline a year to account for reduction in forest quality
Increases in line with expansion of PAs, and 1% increase a year to account for improvement in forest quality
Value per hectare of watershed forest
Increases at the same rate as population growth plus a factor of 2 to account for increasing density of settlement and infrastructure
Increases at the same rate as population growth plus a factor of 2 to account for increasing density of settlement and infrastructure, and 0.5% a year 2011-15, 1% 2016-20, 1.5% 2026-35 due to improved service provision
Number of people affected by floods
Increases at the same rate as population growth plus a factor of 2 to account for increasing density of settlement and infrastructure
Increases at the same rate as population growth plus a factor of 2 to account for increasing density of settlement and infrastructure, and 0.5% a year 2011-15, 1% 2016-20, 1.5% 2026-35 due to improved service provision
Frequency of floods Increases by 5% 2011-15, 10% 2016-20, 15% 2021-35 due to progressive ecosystem degradation.
Decreases by 1% 2011-15, 2.5% 2016-20, 5% 2021-35 due to progressive ecosystem improvements.
Proportion of flood-affected population protected by PAs
Increases as PAs expands
Proportion of flood-affected population which avoid damages due to PA protection services
Reduces by 25% 2011-15, 33% 2016-20, 50% 2021-25, 75% 2026-30, 85% 2031-35 due to progressive ecosystem degradation.
Increases by 1.5% 2011-15, 2% 2016-20, 2.5% 2021-35 due to progressive ecosystem improvement.
Per capita costs and expenditures due to floods
Increases at the same rate as population growth plus a factor of 2 to account for increasing density of settlement and infrastructure