Embed Size (px)
Citation preview
TOBB ETÜ
Economical Analysis of Measures for Economical Analysis of Measures for
Improving Energy Efficiency and ReducingImproving Energy Efficiency and Reducing
Greenhouse Gas Emissions of the TurkishGreenhouse Gas Emissions of the Turkish
Cement, and Iron and Steel IndustriesCement, and Iron and Steel Industries
THE TEAMTHE TEAM
Project LeadersProject Leaders
YYüücel ERCANcel ERCAN SSüüleyman SARITAleyman SARITAŞŞ
Cement Group:Cement Group:
Y. ERCANY. ERCAN A. DURMAZA. DURMAZ M. M. ÇÜÇÜRRÜÜKSULU KSULU ŞŞ. DALO. DALOĞĞLULU
Iron and Steel Group:Iron and Steel Group:
S. SARITAS. SARITAŞŞ N. DURLUN. DURLU M. M. ÜÜBEYLBEYLİİ E. TEKE. TEKİİN
TOBB ETÜ
N
TOBB ETÜ
Detailed measures for two industrial Detailed measures for two industrial sectors were reported in sectors were reported in TURKEYTURKEY’’S FIRST S FIRST NATIONAL COMMUNICATION TO THE NATIONAL COMMUNICATION TO THE UNFCCCUNFCCC because of their high energy because of their high energy intensities and their strong impact on intensities and their strong impact on climate change, namely climate change, namely the cement the cement industryindustry and and the iron and steel industrythe iron and steel industry..
TOBB ETÜ
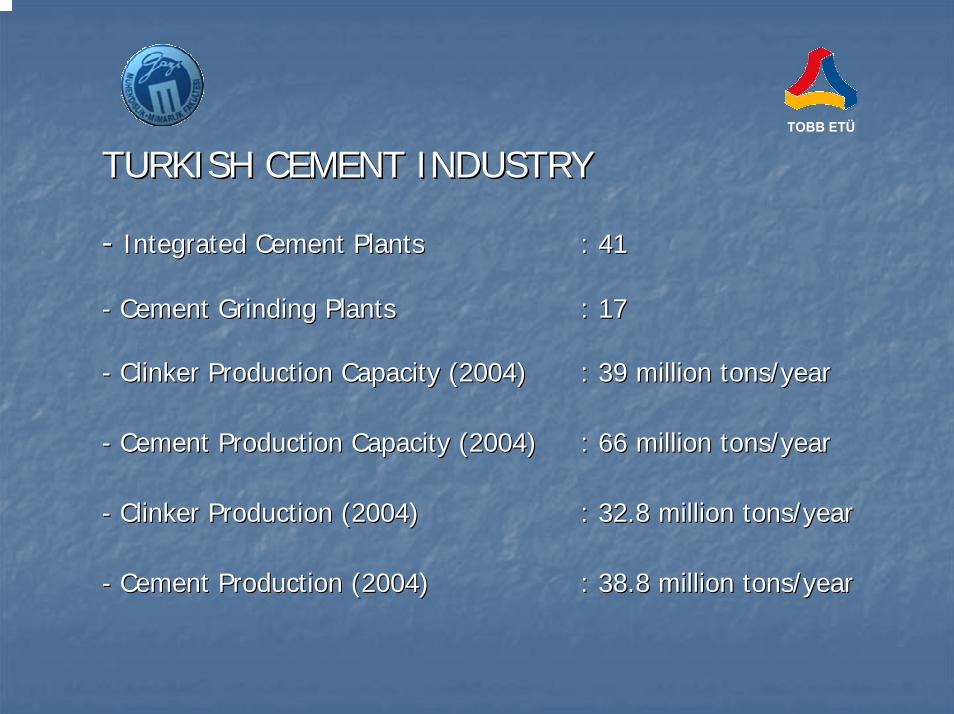
TURKISH CEMENT INDUSTRYTURKISH CEMENT INDUSTRY
-- Integrated Cement PlantsIntegrated Cement Plants : 41: 41
-- Cement Grinding PlantsCement Grinding Plants : 17: 17
-- Clinker Production Capacity (2004)Clinker Production Capacity (2004) : 39 million tons/year: 39 million tons/year
-- Cement Production Capacity (2004)Cement Production Capacity (2004) : 66 million tons/year: 66 million tons/year
-- Clinker Production (2004)Clinker Production (2004) : 32.8 million tons/year: 32.8 million tons/year
-- Cement Production (2004)Cement Production (2004) : 38.8 million tons/year: 38.8 million tons/year
TOBB ETÜ
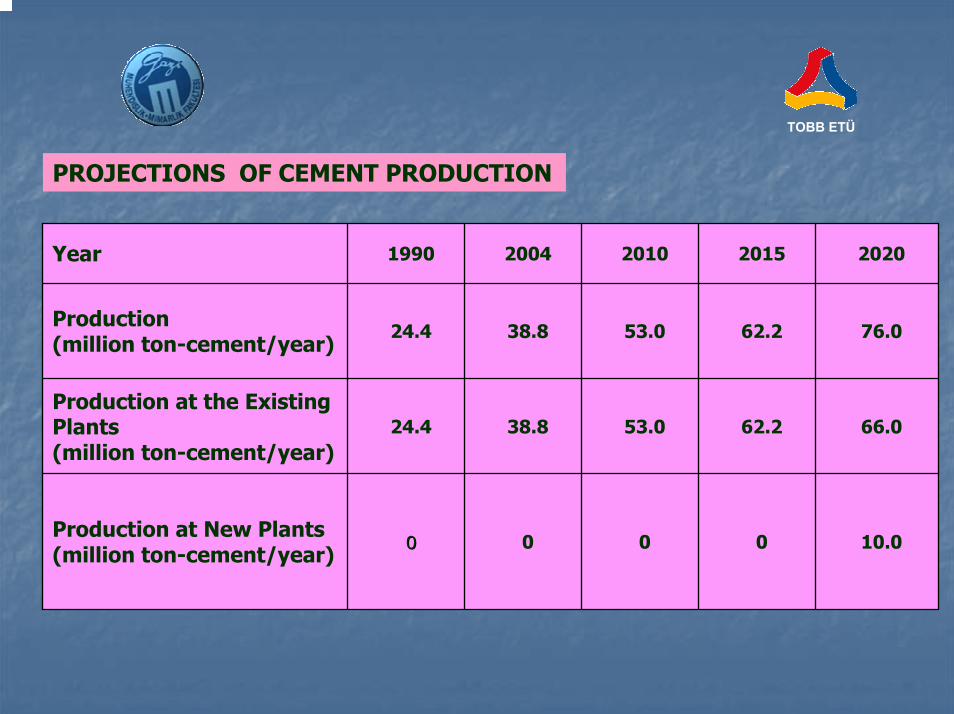
PROJECTIONS OF CEMENT PRODUCTION
Year 1990 2004 2010 2015 2020
Production (million ton-cement/year)
24.4 38.8 53.0 62.2 76.0
Production at the Existing Plants(million ton-cement/year)
24.4 38.8 53.0 62.2 66.0
Production at New Plants(million ton-cement/year) 00 0 0 0 10.0
TOBB ETÜ
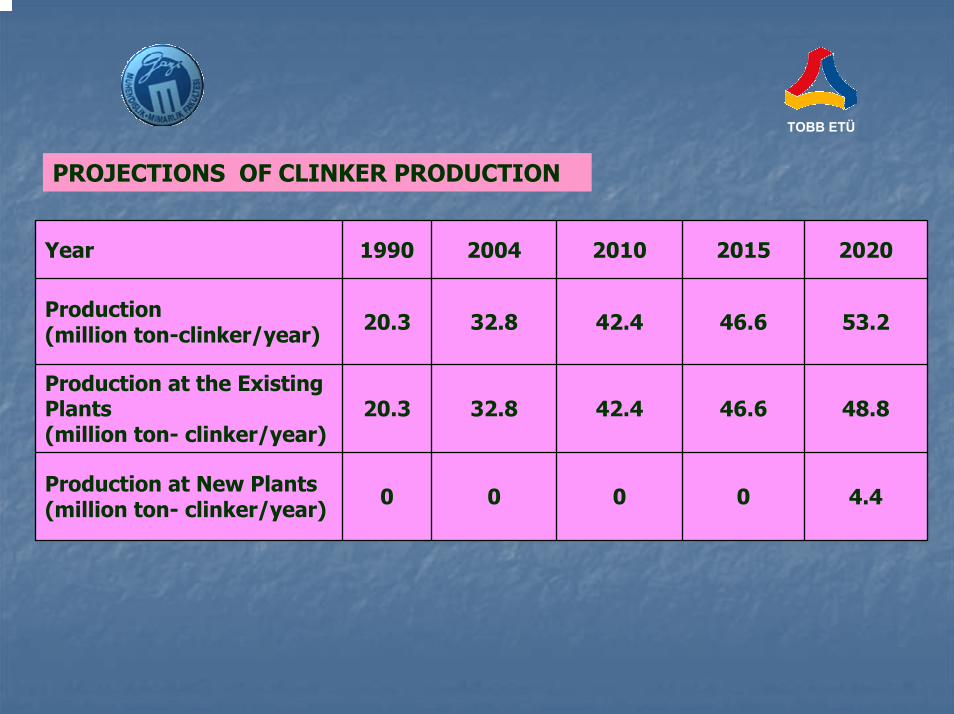
PROJECTIONS OF CLINKER PRODUCTION
Year 1990 2004 2010 2015 2020
Production (million ton-clinker/year) 20.3 32.8 42.4 46.6 53.2
Production at the Existing Plants(million ton- clinker/year)
20.3 32.8 42.4 46.6 48.8
Production at New Plants(million ton- clinker/year) 0 0 0 0 4.4
TOBB ETÜ
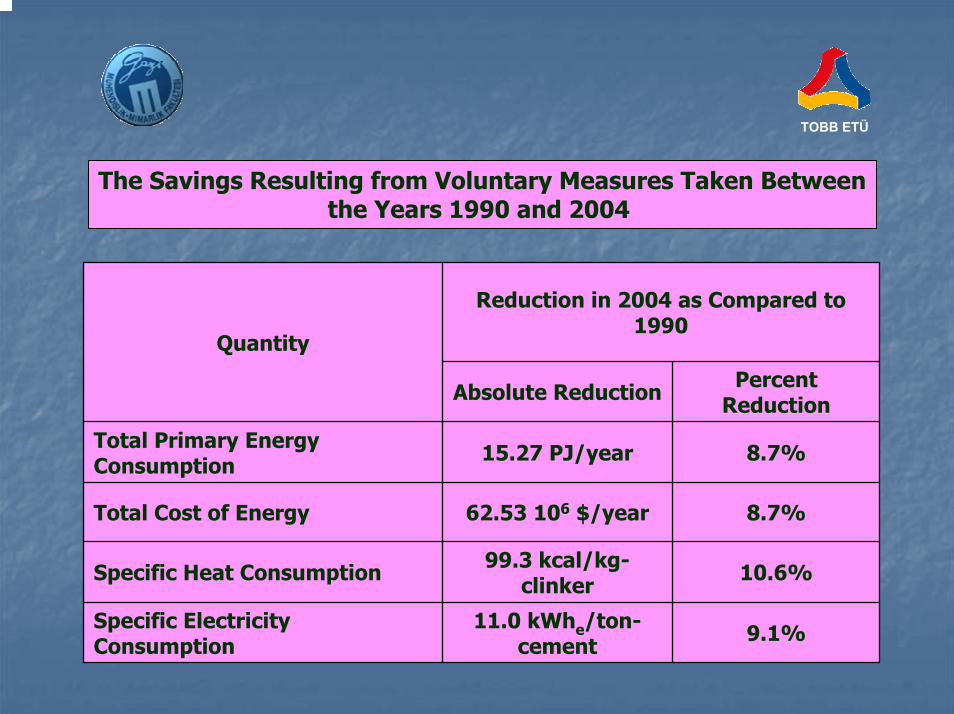
The Savings Resulting from Voluntary Measures Taken Betweenthe Years 1990 and 2004
Reduction in 2004 as Compared to 1990
Quantity
Absolute Reduction Percent Reduction
Total Primary Energy Consumption 15.27 PJ/year 8.7%
Total Cost of Energy 62.53 106 $/year 8.7%
Specific Heat Consumption 99.3 kcal/kg-clinker 10.6%
Specific Electricity Consumption
11.0 kWhe/ton-cement 9.1%
TOBB ETÜ
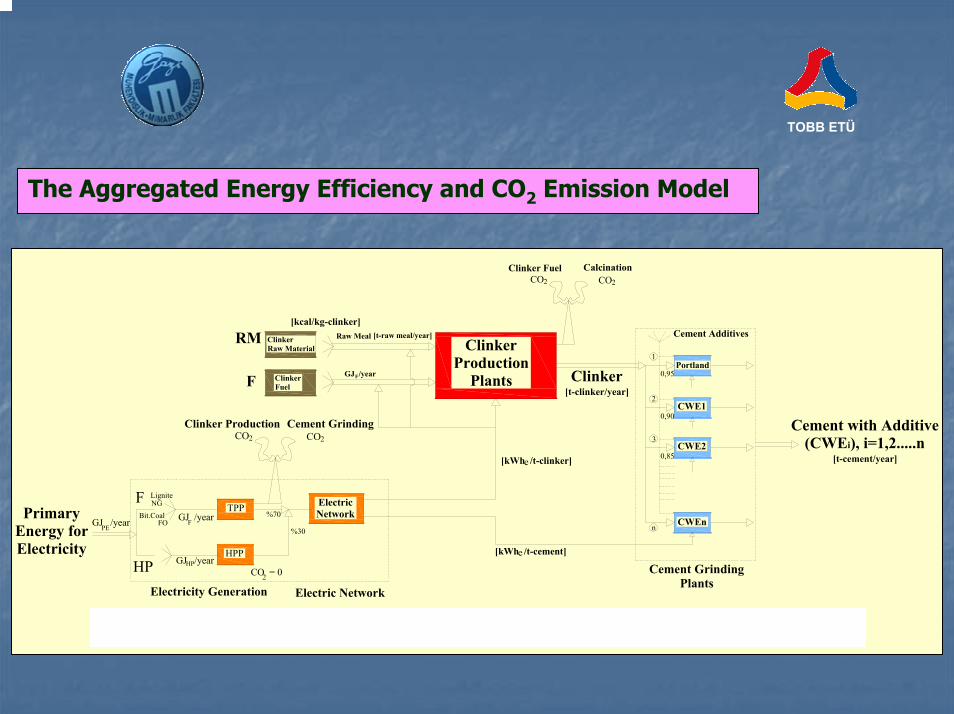
The Aggregated Energy Efficiency and CO2 Emission Model
TPP
1
2
3
n
HPP
FGJ /year
GJ /yearHP
0,95
0,90
0,85
%70
%30
CO2
LigniteNG
Bit.CoalFO
CO = 02
CO2
CO2CO2Cement with Additive
(CWEi), i=1,2.....n[t-cement/year]
[kWh /t-cement]e
[kWh /t-clinker]e
[kcal/kg-clinker]
ClinkerProduction
Plants
PrimaryEnergy forElectricity
ClinkerRaw Material
ClinkerFuel
RM
F
F
HP
Clinker[t-clinker/year]
[t-raw meal/year]
2
Raw Meal
GJ /yearF
Clinker Fuel Calcination
Cement Additives
Portland
CWE1
CWE2
CWEn
Cement GrindingPlants
PEGJ /year
ElectricNetwork
Electric NetworkElectricity Generation
Clinker Production Cement Grinding
Figure 2.1. The Aggregated Energy Efficiency and CO Emission Model of The Turkish Cement Industry3
TOBB ETÜ
The Aggregated Energy Efficiency andCO2 Emission Model
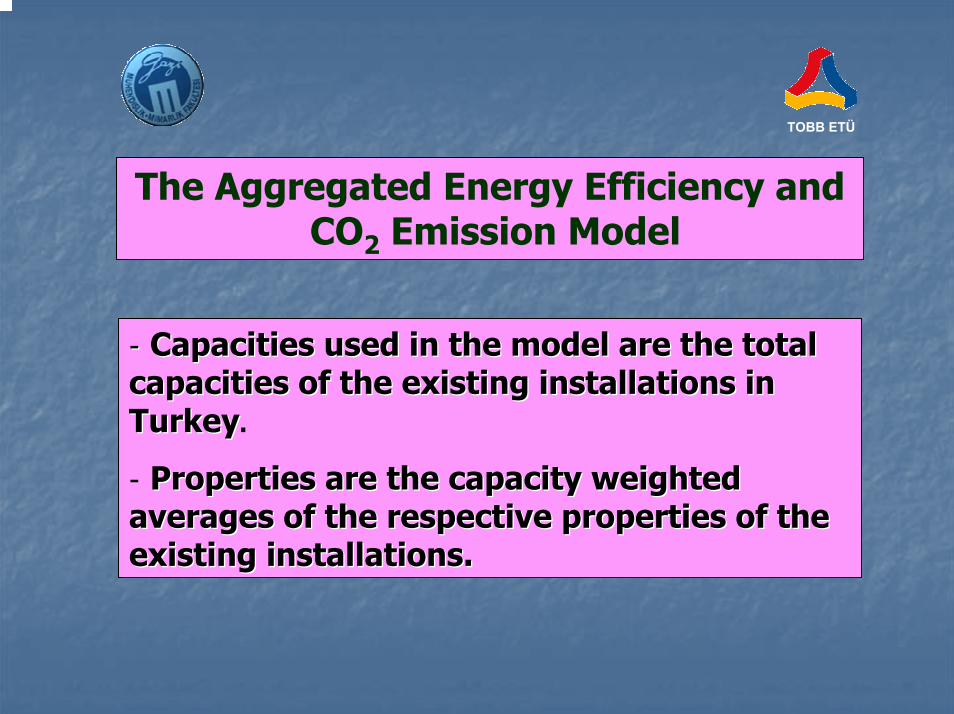
-- Capacities used in the model are the total Capacities used in the model are the total capacities of the existing installations in capacities of the existing installations in TurkeyTurkey.
- Properties are the capacity weighted Properties are the capacity weighted averages of the respective properties of the averages of the respective properties of the existing installations.existing installations.
TOBB ETÜ
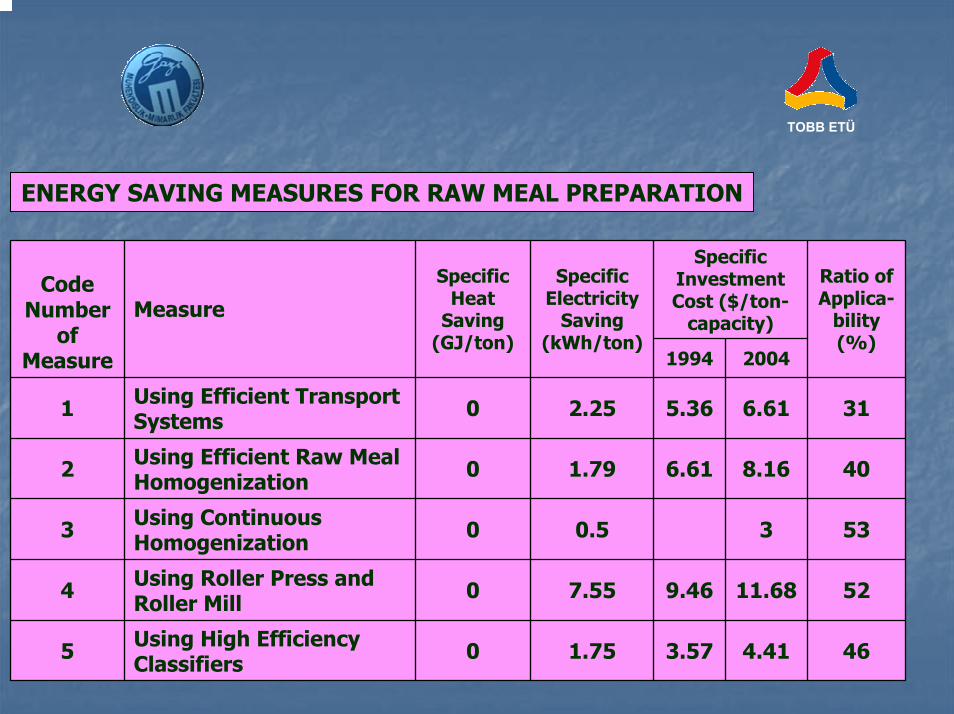
ENERGY SAVING MEASURES FOR RAW MEAL PREPARATION
Specific Investment Cost ($/ton-
capacity)
Code Number
of Measure
Measure
Specific Heat
Saving(GJ/ton)
Specific Electricity
Saving(kWh/ton)
1994 2004
1 Using Efficient Transport Systems 0 2.25 5.36 6.61 31
2 Using Efficient Raw Meal Homogenization 0 1.79 6.61 8.16 40
3 Using Continuous Homogenization 0 0.5 3 53
4 Using Roller Press and Roller Mill 0 7.55 9.46 11.68 52
5 Using High Efficiency Classifiers 0 1.75 3.57 4.41 46
Ratio of Applica-
bility(%)
TOBB ETÜ
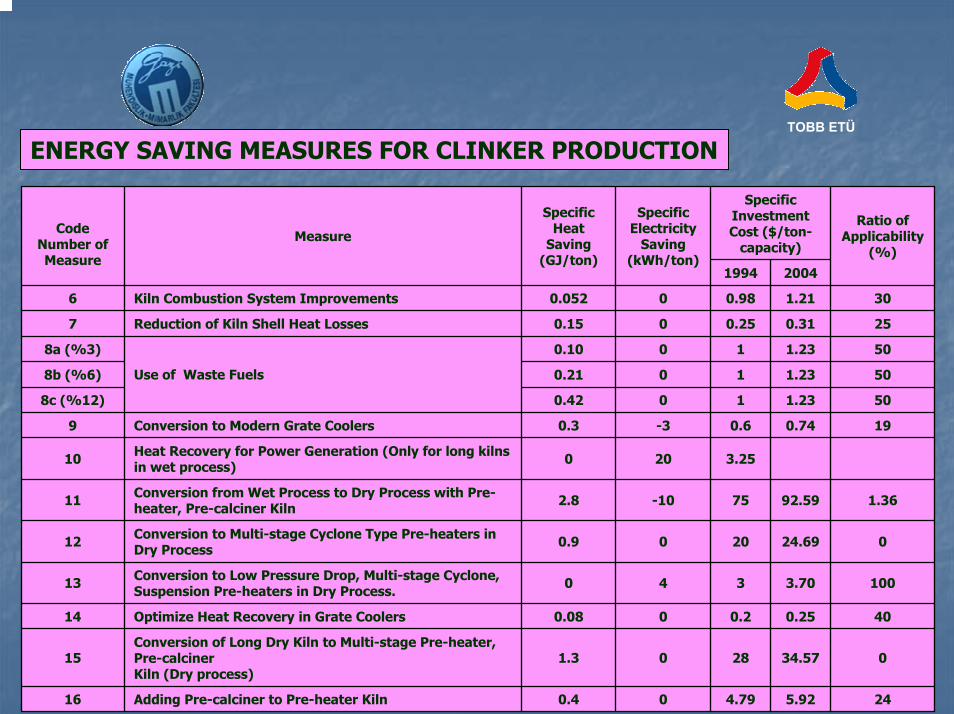
ENERGY SAVING MEASURES FOR CLINKER PRODUCTION
Specific Investment Cost ($/ton-
capacity)Code
Number of Measure
Measure
Specific Heat
Saving(GJ/ton)
Specific Electricity
Saving(kWh/ton)
1994 2004
6 Kiln Combustion System Improvements 0.052 0 0.98 1.21 30
7 Reduction of Kiln Shell Heat Losses 0.15 0 0.25 0.31 25
8a (%3) 0.10 0 1 1.23 50
8b (%6) 0.21 0 1 1.23 50
8c (%12) 0.42 0 1 1.23 50
9 Conversion to Modern Grate Coolers 0.3 -3 0.6 0.74 19
10 Heat Recovery for Power Generation (Only for long kilns in wet process) 0 20 3.25
11 Conversion from Wet Process to Dry Process with Pre-heater, Pre-calciner Kiln 2.8 -10 75 92.59 1.36
12 Conversion to Multi-stage Cyclone Type Pre-heaters in Dry Process 0.9 0 20 24.69 0
13 Conversion to Low Pressure Drop, Multi-stage Cyclone, Suspension Pre-heaters in Dry Process. 0 4 3 3.70 100
14 Optimize Heat Recovery in Grate Coolers 0.08 0 0.2 0.25 40
15Conversion of Long Dry Kiln to Multi-stage Pre-heater, Pre-calcinerKiln (Dry process)
1.3 0 28 34.57 0
16 Adding Pre-calciner to Pre-heater Kiln 0.4 0 4.79 5.92 24
Use of Waste Fuels
Ratio of Applicability
(%)
TOBB ETÜ
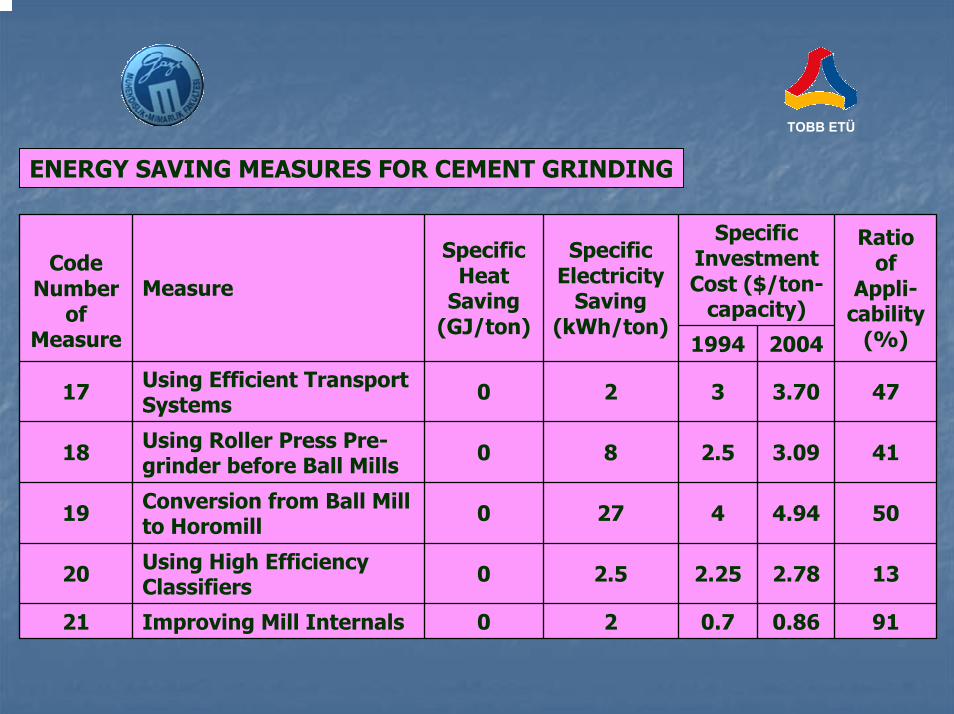
ENERGY SAVING MEASURES FOR CEMENT GRINDING
Specific Investment Cost ($/ton-
capacity)
Code Number
of Measure
Measure
Specific Heat
Saving(GJ/ton)
Specific Electricity
Saving(kWh/ton)
1994 2004
17 Using Efficient Transport Systems 0 2 3 3.70 47
18 Using Roller Press Pre-grinder before Ball Mills 0 8 2.5 3.09 41
19 Conversion from Ball Mill to Horomill 0 27 4 4.94 50
20 Using High Efficiency Classifiers 0 2.5 2.25 2.78 13
21 Improving Mill Internals 0 2 0.7 0.86 91
Ratio of
Appli-cability
(%)
TOBB ETÜ
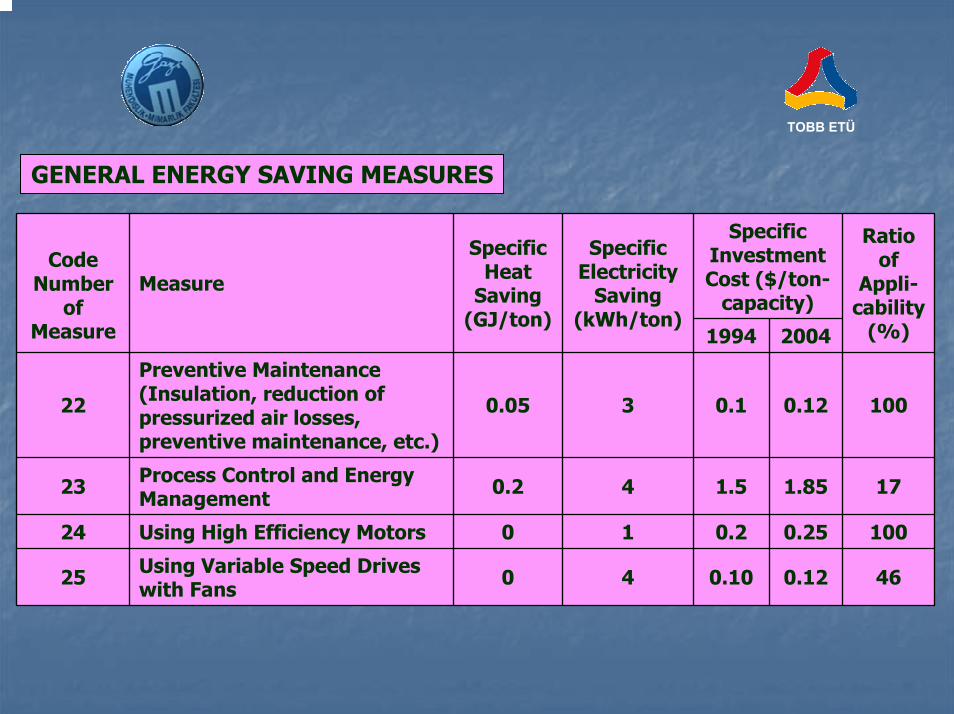
GENERAL ENERGY SAVING MEASURES
Specific Investment Cost ($/ton-
capacity)
Code Number
of Measure
Measure
Specific Heat
Saving(GJ/ton)
Specific Electricity
Saving(kWh/ton)
1994 2004
22
Preventive Maintenance (Insulation, reduction of pressurized air losses, preventive maintenance, etc.)
0.05 3 0.1 0.12 100
23 Process Control and Energy Management 0.2 4 1.5 1.85 17
24 Using High Efficiency Motors 0 1 0.2 0.25 100
25 Using Variable Speed Drives with Fans 0 4 0.10 0.12 46
Ratio of
Appli-cability
(%)
TOBB ETÜ
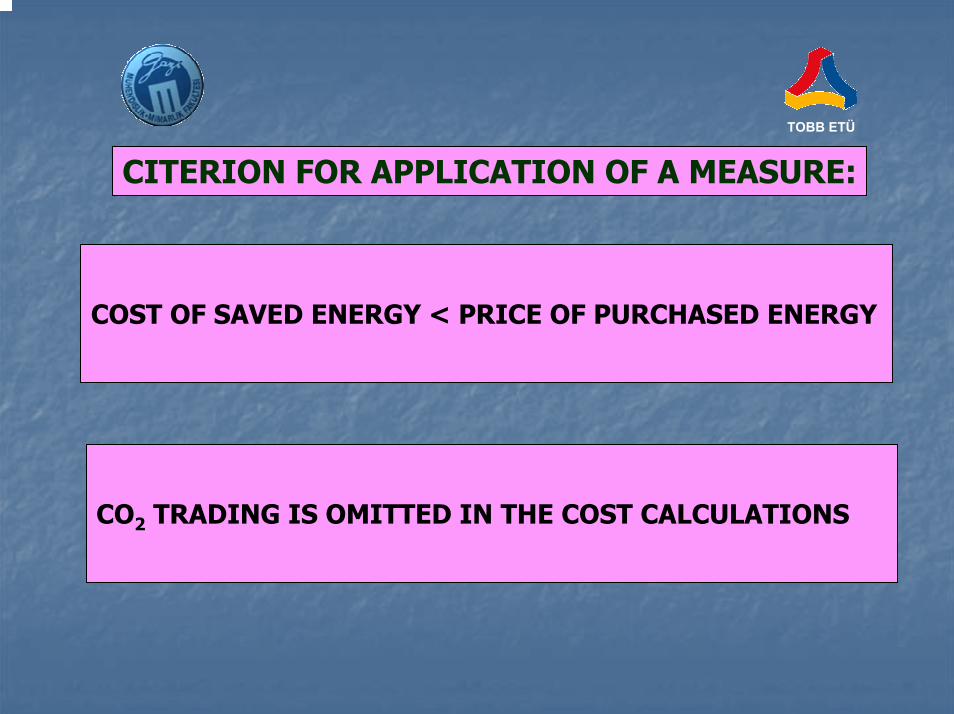
CITERION FOR APPLICATION OF A MEASURE:
COST OF SAVED ENERGY < PRICE OF PURCHASED ENERGY
CO2 TRADING IS OMITTED IN THE COST CALCULATIONS
TOBB ETÜ
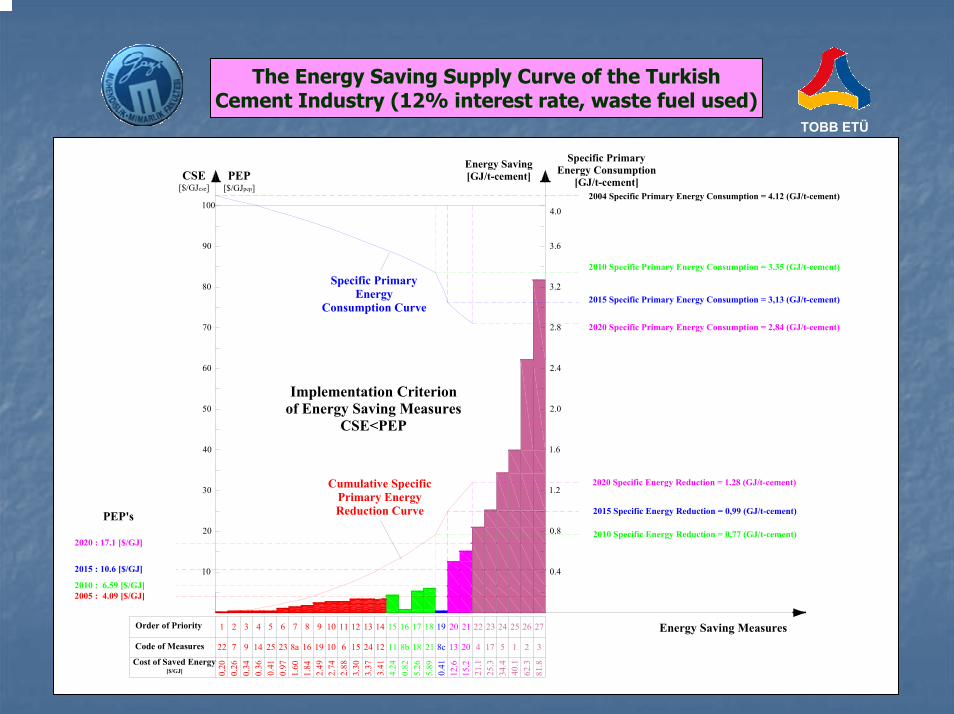
The Energy Saving Supply Curve of the Turkish Cement Industry (12% interest rate, waste fuel used)
1 2 3 4 5 6 7 8 9 10 11 12 13 14 15 16 17 18 19 20 21 22 23 24 25 26 27
22 7 9 14 25 23 8a 16 19 10 6 15 24 12 11 8b 18 21 8c 13 20 4 17 5 1 2 3
Order of Priority
Code of Measures
2005 : 4.09 [$/GJ]2010 : 6.59 [$/GJ]
2015 : 10.6 [$/GJ]
2020 : 17.1 [$/GJ]
0.20
0.26
0.34
0.36
0.41
0.97
1.60
1.84
2.49
2.74
2.88
3.30
3.37
3.41
4.24
0.82
5.26
5.89
0.41
12.6
15.2
21.1
25.3
34.4
40.1
62.3
81.8Cost of Saved Energy
[$/GJ]
CSE[$/GJcse]
PEP's
PEP[$/GJpep]
Implementation Criterionof Energy Saving Measures
CSE<PEP
Specific PrimaryEnergy Consumption
[GJ/t-cement]
20
30
40
50
60
70
80
90
10
0.8
1.2
1.6
2.0
2.4
2.8
3.2
3.6
0.4
1004.0
Energy Saving[GJ/t-cement]
Cumulative SpecificPrimary EnergyReduction Curve
Specific PrimaryEnergy
Consumption Curve
Energy Saving Measures
2010 Specific Energy Reduction = 0,77 (GJ/t-cement)
2015 Specific Energy Reduction = 0,99 (GJ/t-cement)
2020 Specific Energy Reduction = 1.28 (GJ/t-cement)
2020 Specific Primary Energy Consumption = 2,84 (GJ/t-cement)
2015 Specific Primary Energy Consumption = 3,13 (GJ/t-cement)
2010 Specific Primary Energy Consumption = 3.35 (GJ/t-cement)
2004 Specific Primary Energy Consumption = 4.12 (GJ/t-cement)

TOBB ETÜCost of Saved Energy (CSE)
Priority of Implementation
CodeNumber ofMeasure
CSE ($/GJ)(12% interest rate)
CSE ($/GJ)(30% interest rate)
1 22 0.198 0.479
2 7 0.255 0.618
3 9 0.337 0.815
4 14 0.367 0.886
5 25 0.409 0.989
6 23 0.972 2.351
7* 8a 1.602 3.873
8 16 1.836 4.439
9 19 2.494 6.030
10 10 2.736 6.614
11 6 2.875 6.949
12 15 3.301 7.980
13 24 3.367 8.140
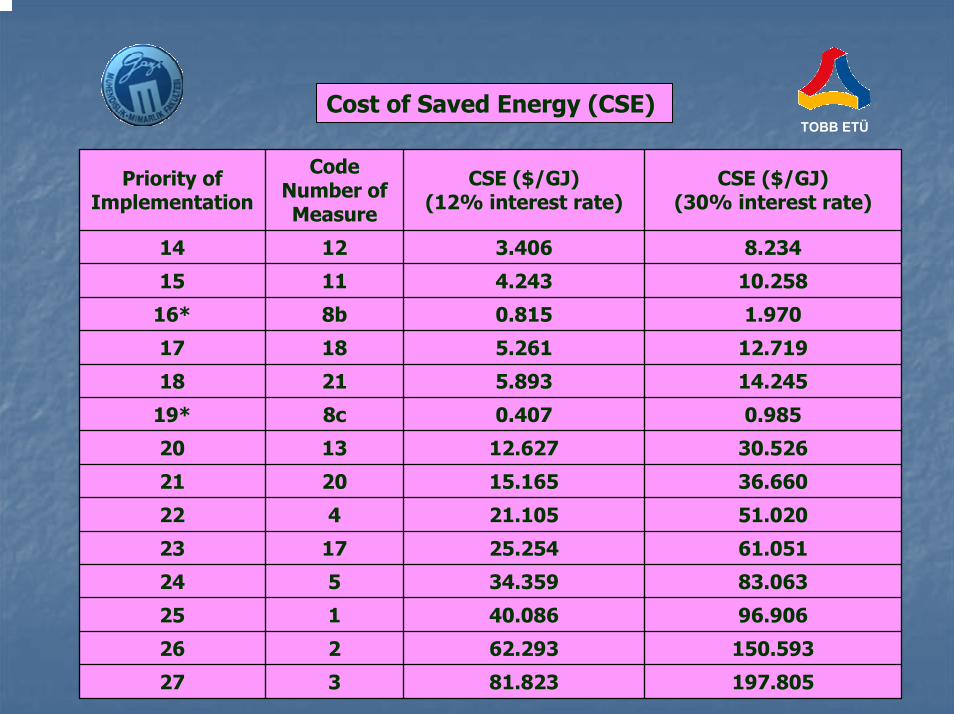
TOBB ETÜCost of Saved Energy (CSE)
Priority of Implementation
CodeNumber ofMeasure
CSE ($/GJ)(12% interest rate)
CSE ($/GJ)(30% interest rate)
14 12 3.406 8.234
15 11 4.243 10.258
16* 8b 0.815 1.970
17 18 5.261 12.719
18 21 5.893 14.245
19* 8c 0.407 0.985
20 13 12.627 30.526
21 20 15.165 36.660
22 4 21.105 51.020
23 17 25.254 61.051
24 5 34.359 83.063
25 1 40.086 96.906
26 2 62.293 150.593
27 3 81.823 197.805
TOBB ETÜ
SCENARIO STUDIES:SCENARIO STUDIES:-- Scenario 1: Scenario 1: Using the Technology of 1990 Using the Technology of 1990
for Productionfor Production
-- Scenario 2: Scenario 2: Using the Technology of 2004 Using the Technology of 2004 for Productionfor Production
-- Senaryo 3: Senaryo 3: Implementing Energy Saving Implementing Energy Saving Measures After the Year 2004Measures After the Year 2004
TOBB ETÜ
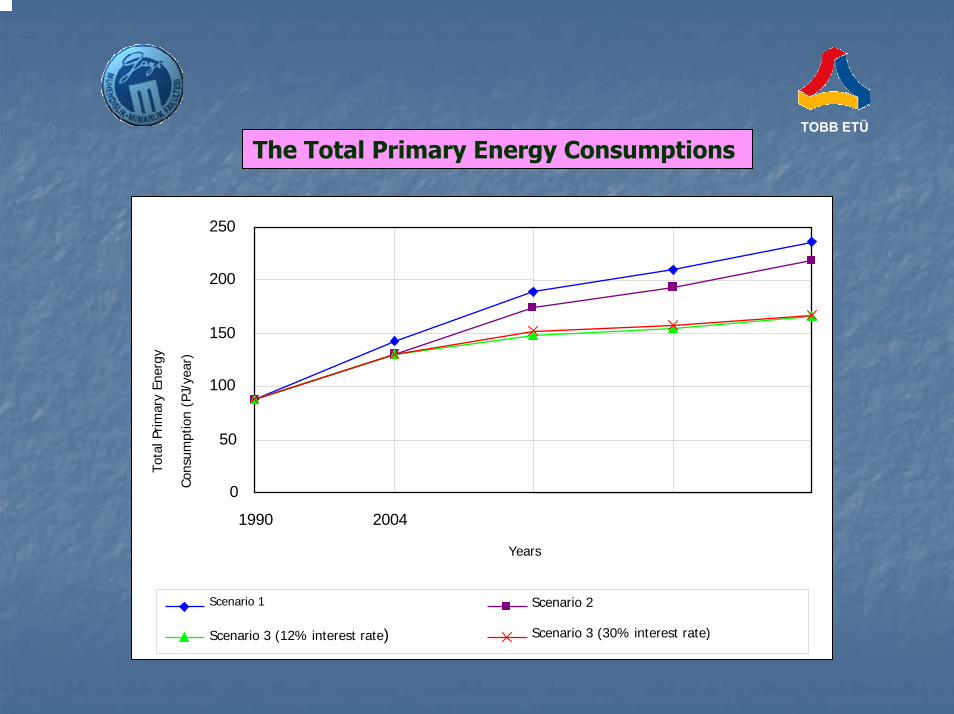
The Total Primary Energy Consumptions
0
50
100
150
200
250
1990 2004 2010 2015 2020
Years
Tota
l Prim
ary
Ener
gy
Cons
umpt
ion
(PJ/
year
)
Scenario 1 Scenario 2
Scenario 3 (12% interest rate) Scenario 3 (30% interest rate)
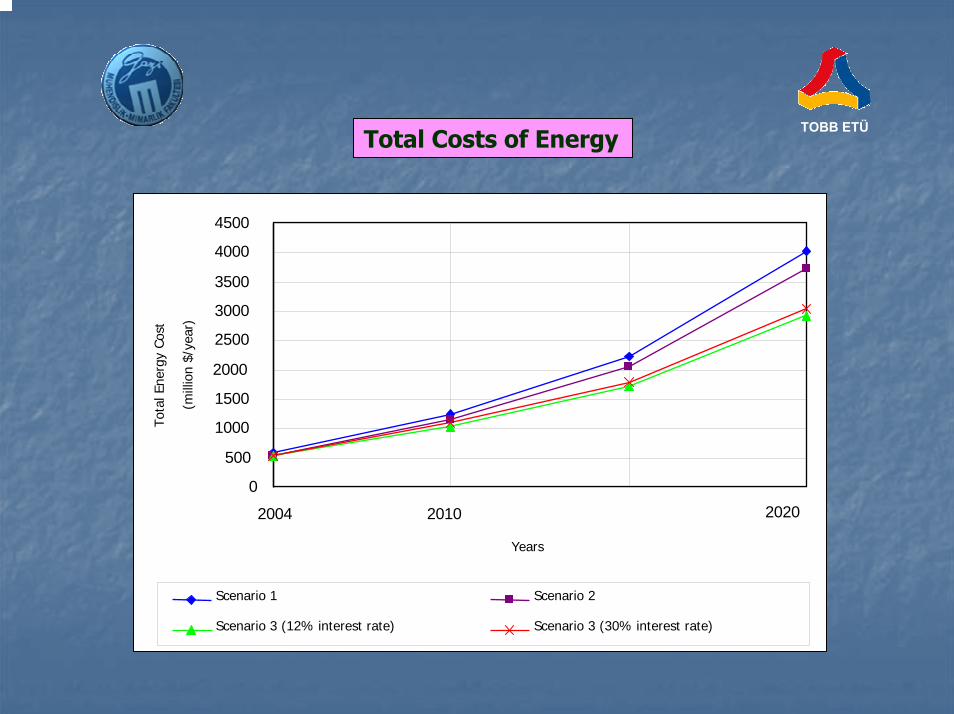
TOBB ETÜTotal Costs of Energy
0
500
1000
1500
2000
2500
3000
3500
4000
4500
2004 2010 2015 2020
Years
Tota
l Ene
rgy
Cost
(mill
ion
$/ye
ar)
Scenario 1 Scenario 2
Scenario 3 (12% interest rate) Scenario 3 (30% interest rate)
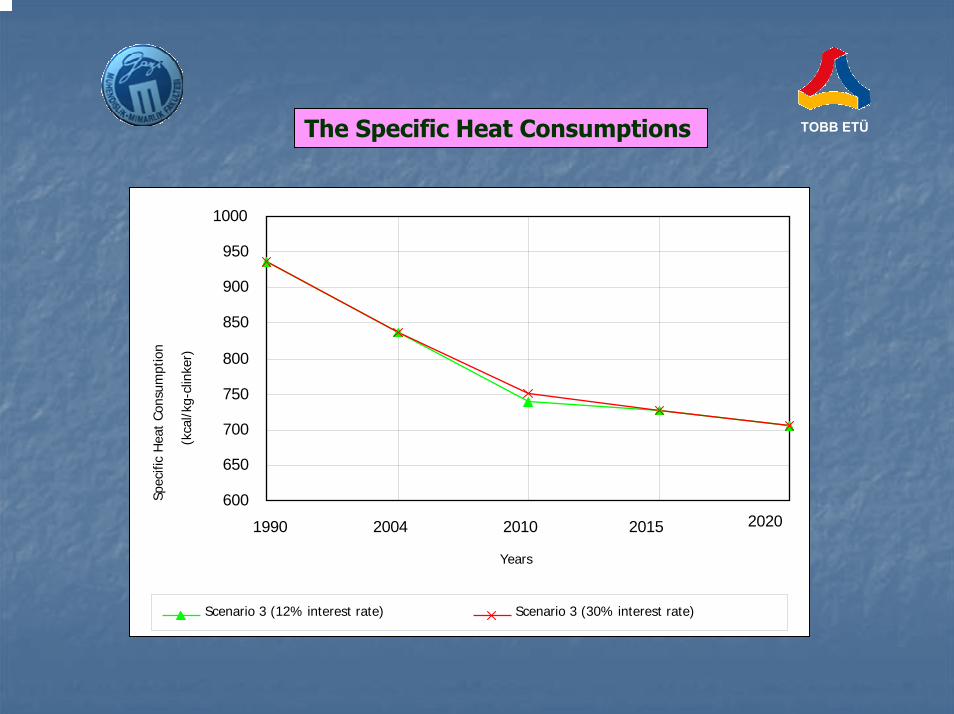
TOBB ETÜThe Specific Heat Consumptions
600
650
700
750
800
850
900
950
1000
1990 2004 2010 2015 2020
Years
Spec
ific
Hea
t Co
nsum
ptio
n
(kca
l/kg-
clin
ker)
Scenario 3 (12% interest rate) Scenario 3 (30% interest rate)
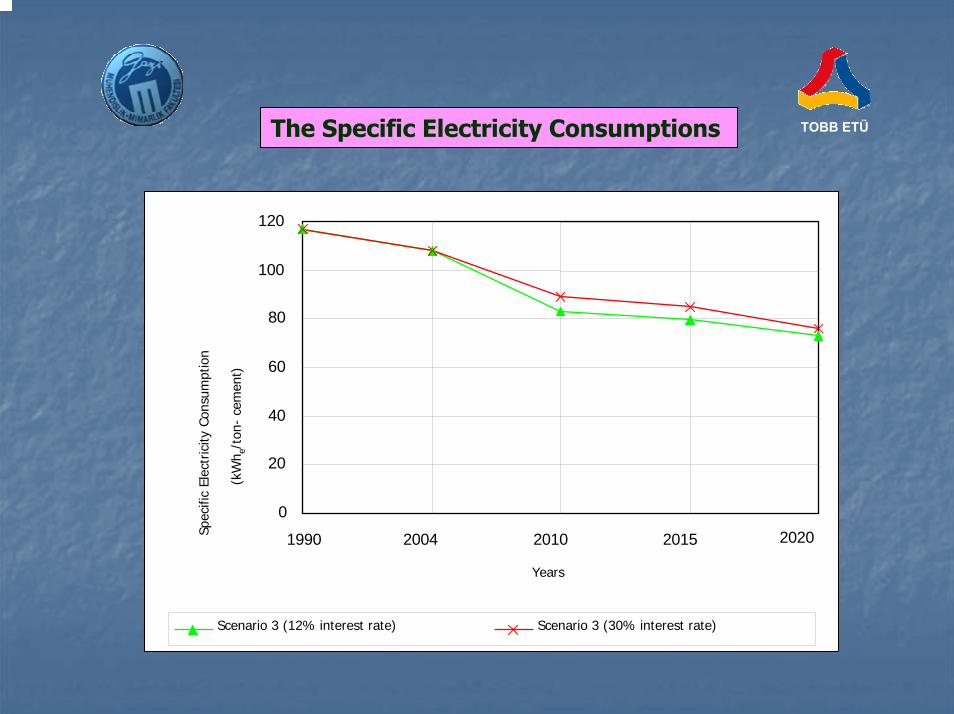
TOBB ETÜThe Specific Electricity Consumptions
0
20
40
60
80
100
120
1990 2004 2010 2015 2020
Years
Spec
ific
Elec
tric
ity C
onsu
mpt
ion
(kW
h e/t
on-
cem
ent)
Scenario 3 (12% interest rate) Scenario 3 (30% interest rate)
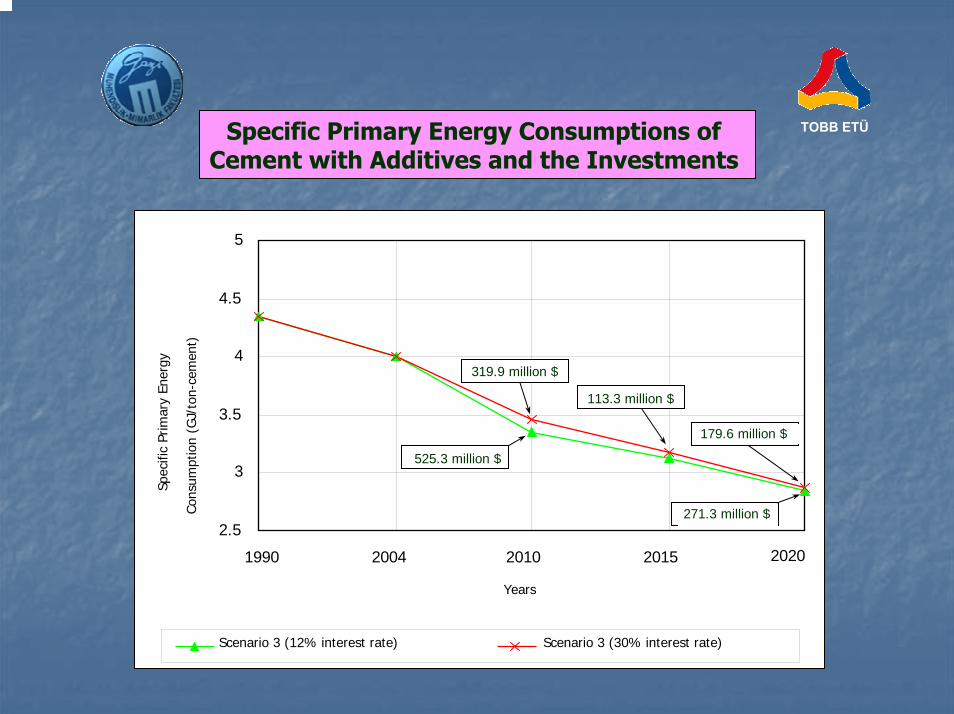
TOBB ETÜSpecific Primary Energy Consumptions of Cement with Additives and the Investments
2.5
3
3.5
4
4.5
5
1990 2004 2010 2015 2020
Years
Spec
ific
Prim
ary
Ener
gy
Cons
umpt
ion
(GJ/
ton-
cem
ent)
Scenario 3 (12% interest rate) Scenario 3 (30% interest rate)
525.3 million $
271.3 million $
319.9 million $
113.3 million $
179.6 million $
525.3 million $
271.3 million $
319.9 million $
113.3 million $
179.6 million $
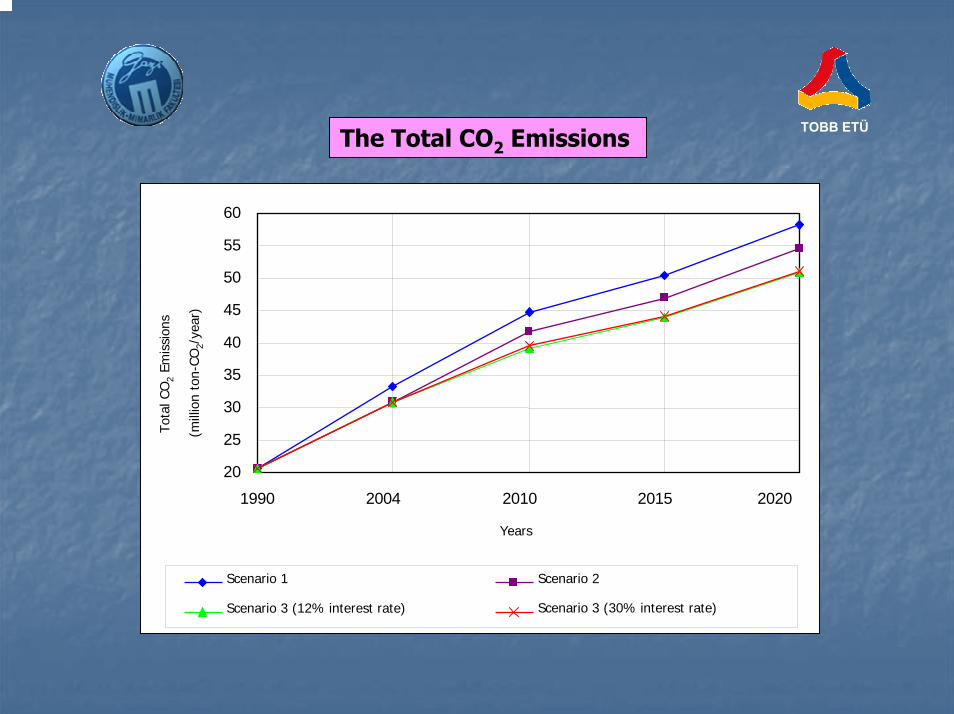
TOBB ETÜThe Total CO2 Emissions
20
25
30
35
40
45
50
55
60
1990 2004 2010 2015
Years
Tota
l CO
2Em
issi
ons
(mill
ion
ton-
CO2/
year
)
Scenario 1 Scenario 2
Scenario 3 (12% interest rate) Scenario 3 (30% interest rate)
2020
TOBB ETÜ
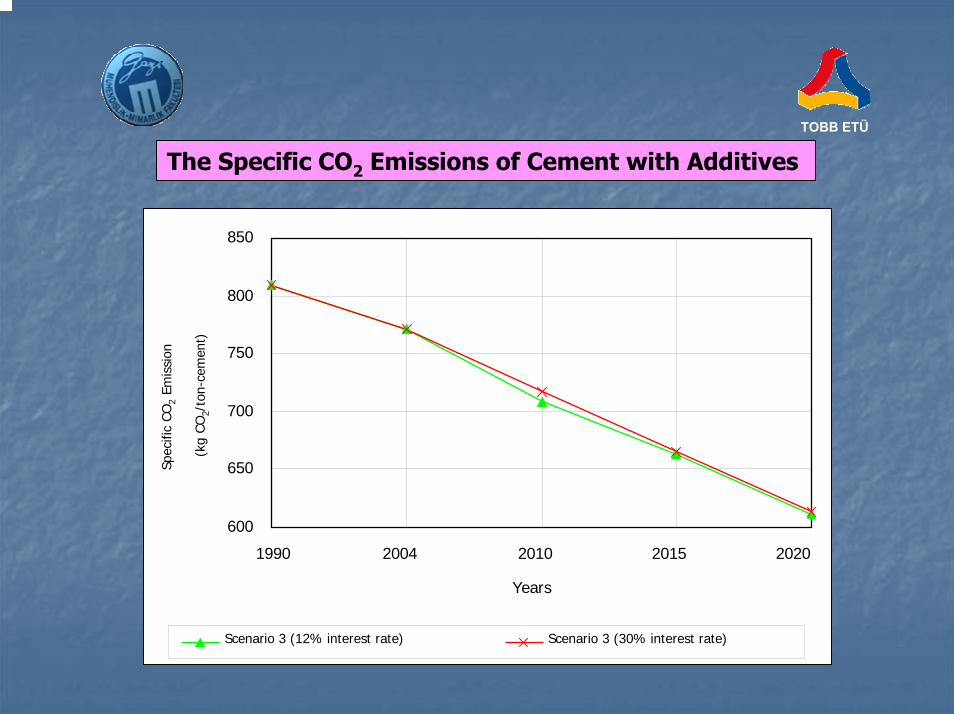
The Specific CO2 Emissions of Cement with Additives
600
650
700
750
800
850
1990 2004 2010 2015 2020
Years
Spec
ific
CO2
Emis
sion
(kg
CO2/
ton-
cem
ent)
Scenario 3 (12% interest rate) Scenario 3 (30% interest rate)
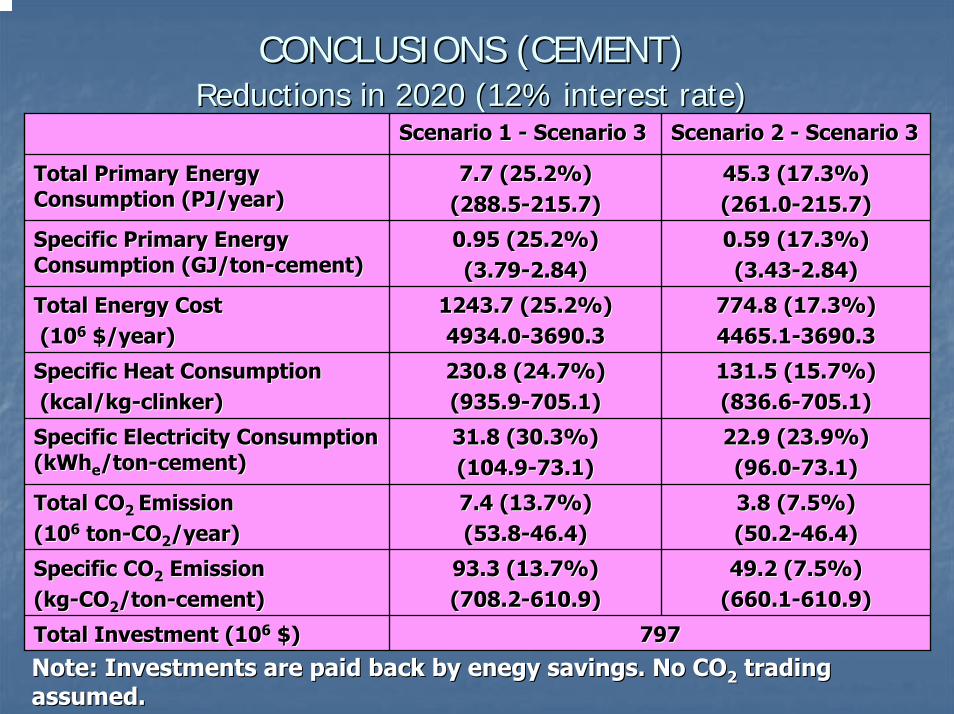
CONCLUSIONS (CEMENT)CONCLUSIONS (CEMENT)Reductions in 2020 (12% interest rate)Reductions in 2020 (12% interest rate)
Scenario 1 Scenario 1 -- Scenario 3Scenario 3 Scenario 2 Scenario 2 -- Scenario 3Scenario 3
Total Primary Energy Total Primary Energy Consumption (PJ/year)Consumption (PJ/year)
7.7 (25.2%)7.7 (25.2%)(288.5(288.5--215.7)215.7)
45.3 (17.3%)45.3 (17.3%)(261.0(261.0--215.7)215.7)
Specific Primary Energy Specific Primary Energy Consumption (GJ/tonConsumption (GJ/ton--cement)cement)
0.95 (25.2%)0.95 (25.2%)(3.79(3.79--2.84)2.84)
0.59 (17.3%)0.59 (17.3%)(3.43(3.43--2.84)2.84)
Total Energy CostTotal Energy Cost(10(1066 $/year)$/year)
1243.7 (25.2%)1243.7 (25.2%)4934.04934.0--3690.33690.3
774.8 (17.3%)774.8 (17.3%)4465.14465.1--3690.33690.3
Specific Heat ConsumptionSpecific Heat Consumption(kcal/kg(kcal/kg--clinker)clinker)
230.8 (24.7%)230.8 (24.7%)(935.9(935.9--705.1)705.1)
131.5 (15.7%)131.5 (15.7%)(836.6(836.6--705.1)705.1)
Specific Electricity Consumption Specific Electricity Consumption (kWh(kWhee/ton/ton--cement)cement)
31.8 (30.3%)31.8 (30.3%)(104.9(104.9--73.1)73.1)
22.9 (23.9%)22.9 (23.9%)(96.0(96.0--73.1)73.1)
Total COTotal CO2 2 Emission Emission (10(1066 tonton--COCO22/year)/year)
7.4 (13.7%)7.4 (13.7%)(53.8(53.8--46.4)46.4)
3.8 (7.5%)3.8 (7.5%)(50.2(50.2--46.4)46.4)
Specific COSpecific CO22 EmissionEmission(kg(kg--COCO22/ton/ton--cement)cement)
93.3 (13.7%)93.3 (13.7%)(708.2(708.2--610.9)610.9)
49.2 (7.5%)49.2 (7.5%)(660.1(660.1--610.9)610.9)
Total Investment (10Total Investment (1066 $)$) 797797
Note: Investments are paid back by enegy savings. No CONote: Investments are paid back by enegy savings. No CO22 trading trading assumed.assumed.
TTÜÜRKRKİİYE YE ÇÇELELİİK K ÜÜRETRETİİMMİİ ve COve CO22 SALIMLARISALIMLARI
Türkiye'deki çelik üretimi tümleşik çelik tesislerindeki bazik oksijen fırınlarda ve elektrik ark fırınlarında yapılmaktadır.
Bu şirketlerden üçü Erdemir, İsdemir ve Kardemir tümleşik çelik tesislerinde bazik oksijen fırın ile çelik üretimi, diğer 18'i ise elektrik ark fırınlarında çelik üretimi yapmaktadır.
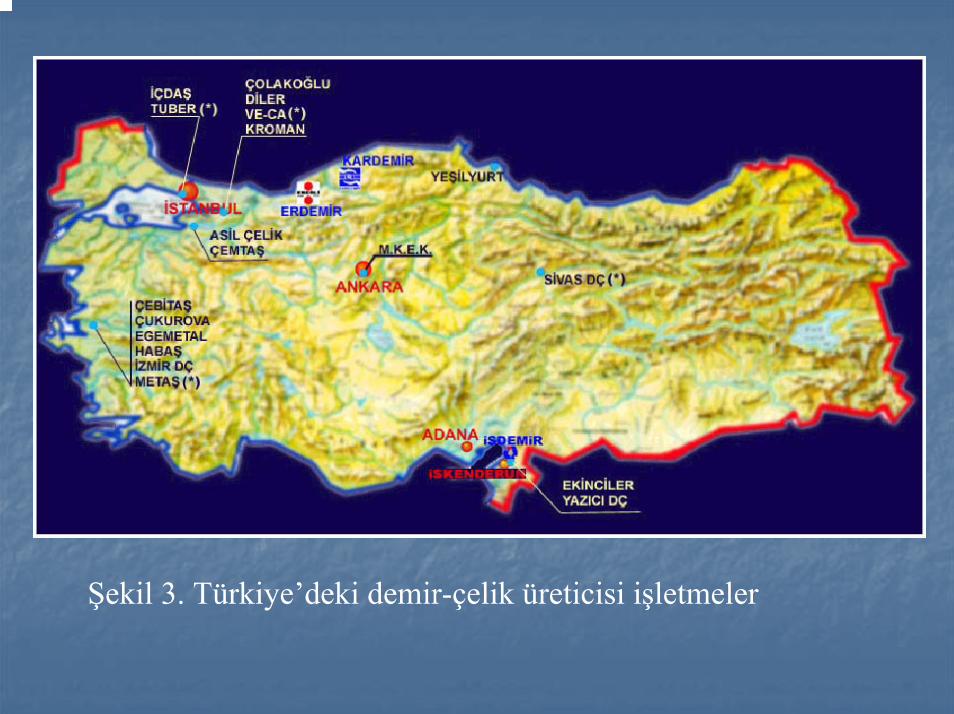
Şekil 3. Türkiye’deki demir-çelik üreticisi işletmeler
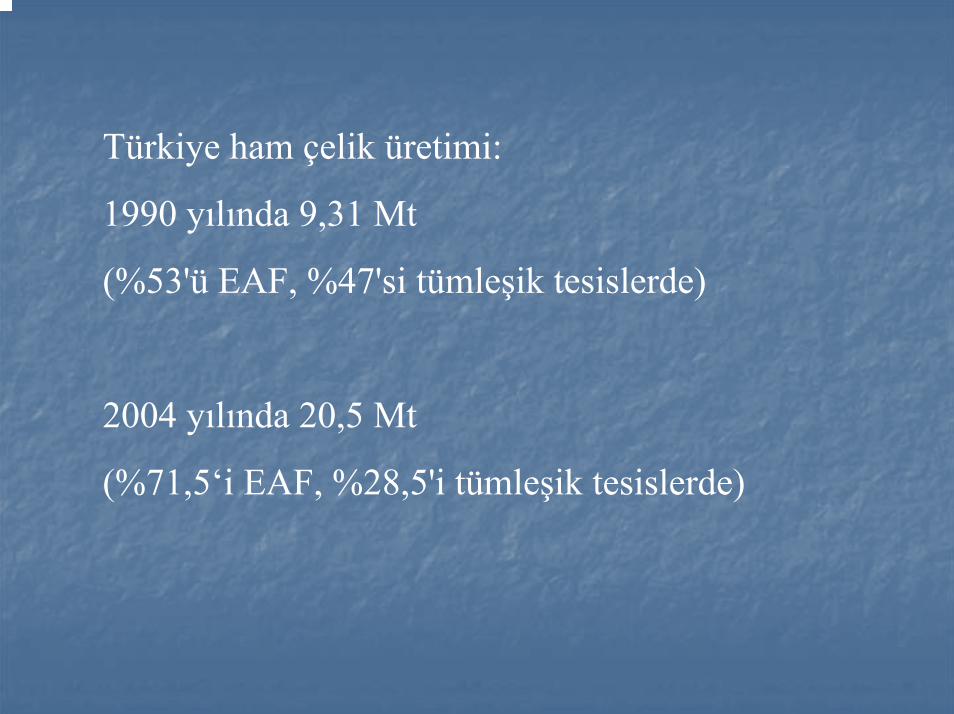
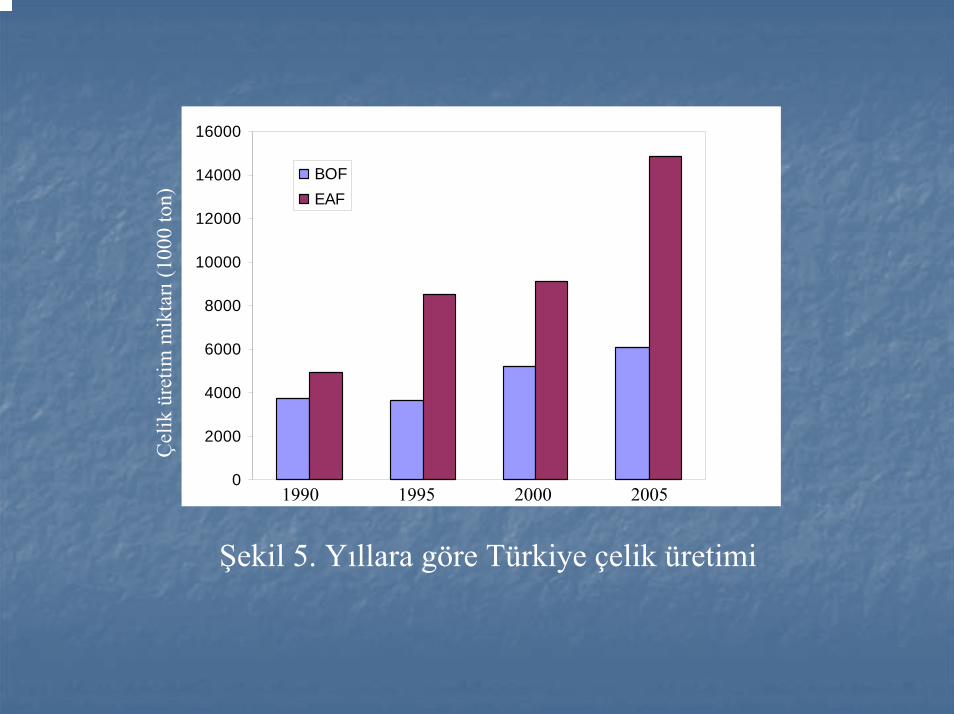
Türkiye ham çelik üretimi:
1990 yılında 9,31 Mt
(%53'ü EAF, %47'si tümleşik tesislerde)
2004 yılında 20,5 Mt
(%71,5‘i EAF, %28,5'i tümleşik tesislerde)
0
2000
4000
6000
8000
10000
12000
14000
16000
BOFEAF
1990 1995 2000 2005
Şekil 5. Yıllara göre Türkiye çelik üretimi
Çel
ik ü
retim
mik
tarı
(100
0 to
n)
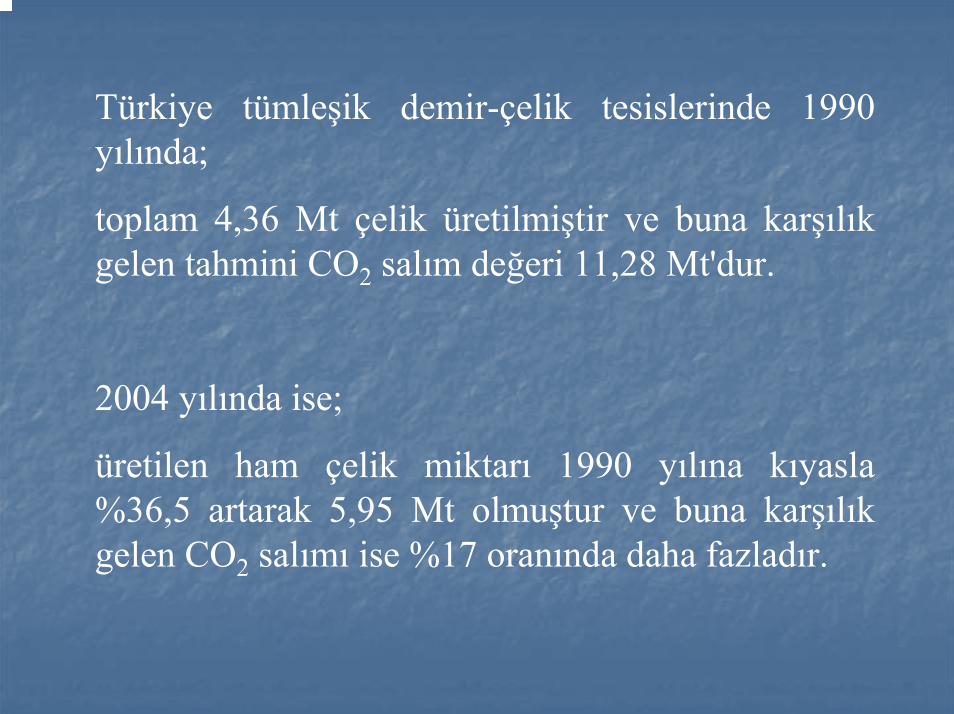
Türkiye tümleşik demir-çelik tesislerinde 1990 yılında;
toplam 4,36 Mt çelik üretilmiştir ve buna karşılık gelen tahmini CO2 salım değeri 11,28 Mt'dur.
2004 yılında ise;
üretilen ham çelik miktarı 1990 yılına kıyasla %36,5 artarak 5,95 Mt olmuştur ve buna karşılık gelen CO2 salımı ise %17 oranında daha fazladır.
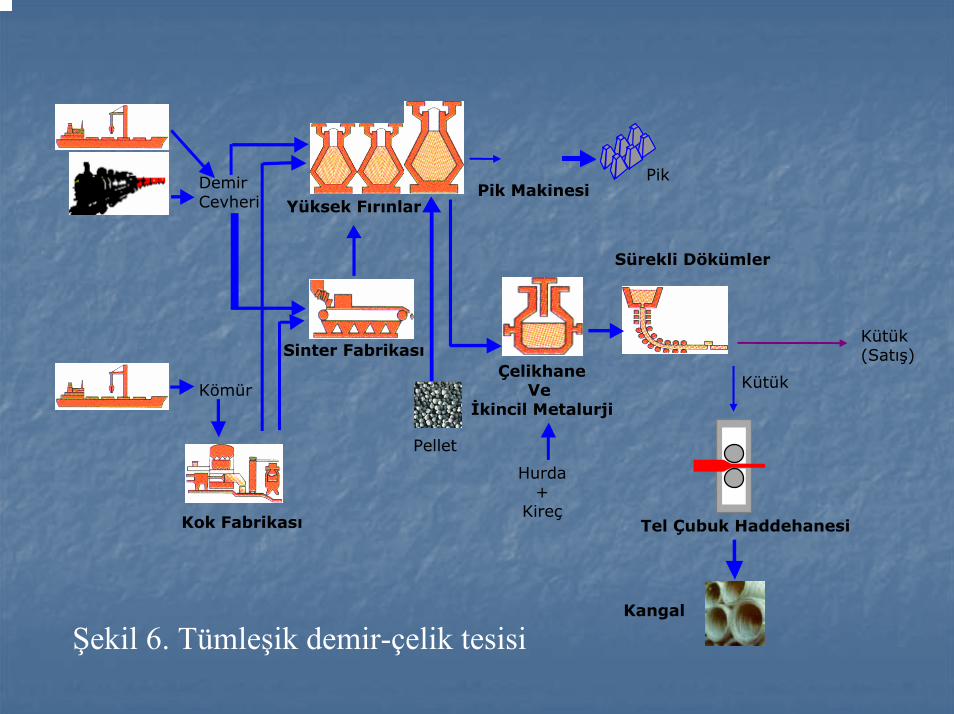
Demir Cevheri
Pik MakinesiPik
Yüksek Fırınlar
Kütük(Satış)Sinter Fabrikası
ÇelikhaneVe
İkincil MetalurjiKömür
Hurda+
Kireç
Pellet
Tel Çubuk Haddehanesi
Sürekli Dökümler
Kütük
Kok Fabrikası
Kangal
Şekil 6. Tümleşik demir-çelik tesisi
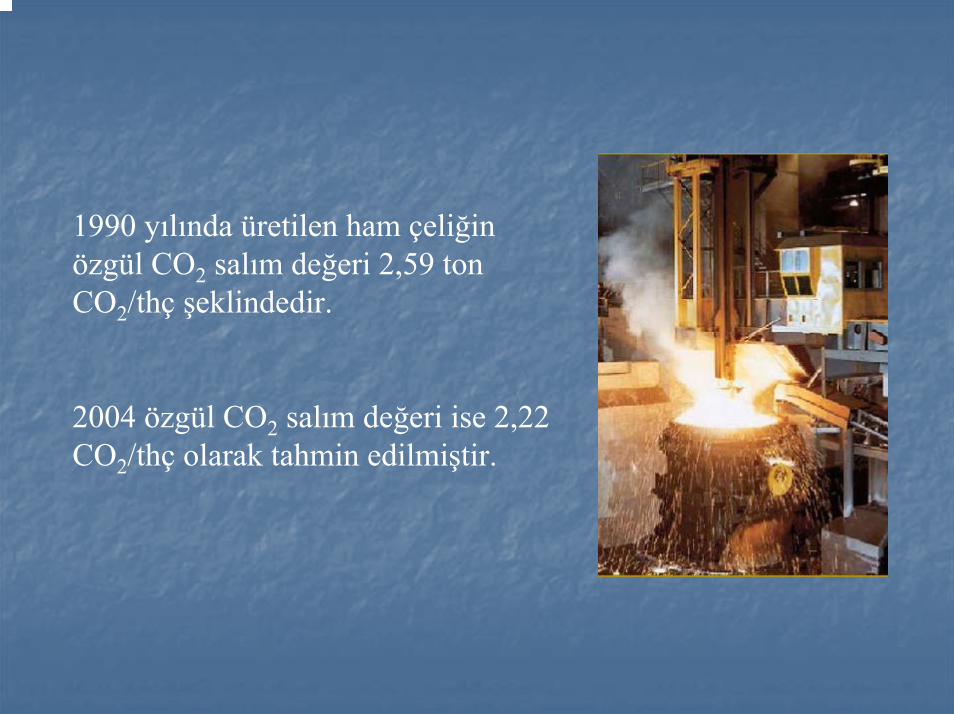
1990 yılında üretilen ham çeliğin özgül CO2 salım değeri 2,59 ton CO2/thç şeklindedir.
2004 özgül CO2 salım değeri ise 2,22 CO2/thç olarak tahmin edilmiştir.
Yapılan öngörülere göre, tümleşik çelik tesislerinde üretilen ham çelik miktarı 2010 yılında 10,62 Mt, 2015 yılında 13,41 Mt, 2020 yılında ise 14,16 Mt olarak gerçekleşecektir.
Bu yıllara göre tahmini CO2 miktarları sırasıyla, 20,27 Mt, 25,06 Mt ve 26,54 Mt olarak verilmiştir.
DEMDEMİİRR--ÇÇELELİİK ENDK ENDÜÜSTRSTRİİSSİİNDENDE
ENERJENERJİİ VERVERİİMLMLİİLLİĞİİĞİ ÇÇALIALIŞŞMALARIMALARI
Erdemir'de 1990 yılından bu yana yapılan enerji verimliliğini arttırıcı çalışmalar iki ana başlıkta incelenebilir.
1. Enerji tasarrufu alanında yapılan çalışma ve yatırımlar,
2. Yan ürün gazlarının kullanımının artırılmasına yönelik yapılan çalışma ve yatırımlardır.
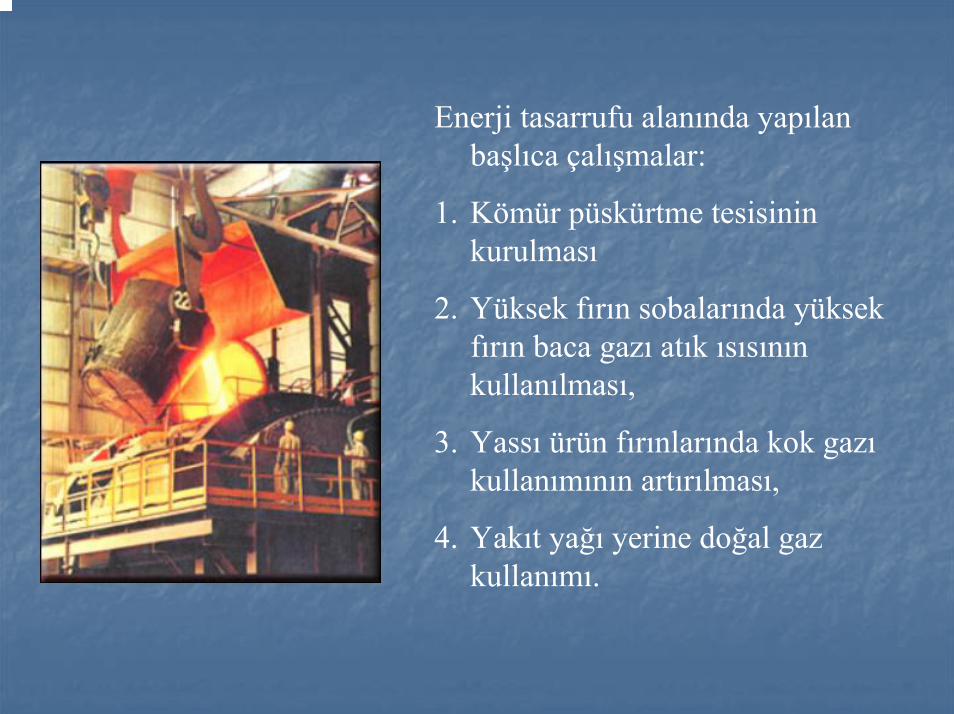
Enerji tasarrufu alanında yapılan başlıca çalışmalar:
1. Kömür püskürtme tesisinin kurulması
2. Yüksek fırın sobalarında yüksek fırın baca gazı atık ısısının kullanılması,
3. Yassı ürün fırınlarında kok gazıkullanımının artırılması,
4. Yakıt yağı yerine doğal gaz kullanımı.
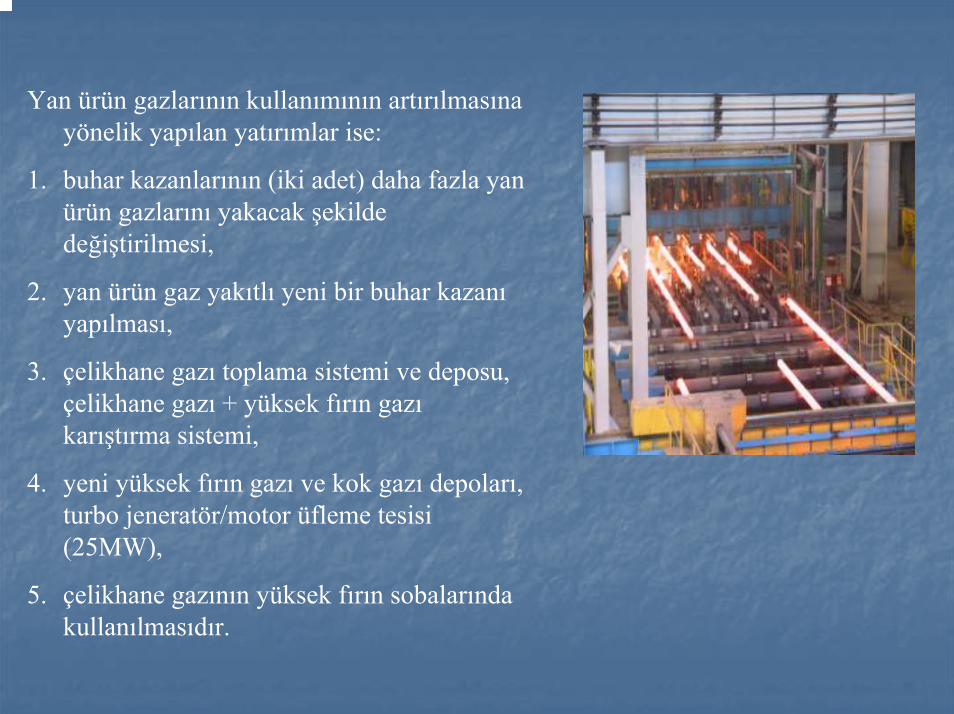
Yan ürün gazlarının kullanımının artırılmasına yönelik yapılan yatırımlar ise:
1. buhar kazanlarının (iki adet) daha fazla yan ürün gazlarını yakacak şekilde değiştirilmesi,
2. yan ürün gaz yakıtlı yeni bir buhar kazanıyapılması,
3. çelikhane gazı toplama sistemi ve deposu, çelikhane gazı + yüksek fırın gazıkarıştırma sistemi,
4. yeni yüksek fırın gazı ve kok gazı depoları, turbo jeneratör/motor üfleme tesisi (25MW),
5. çelikhane gazının yüksek fırın sobalarında kullanılmasıdır.
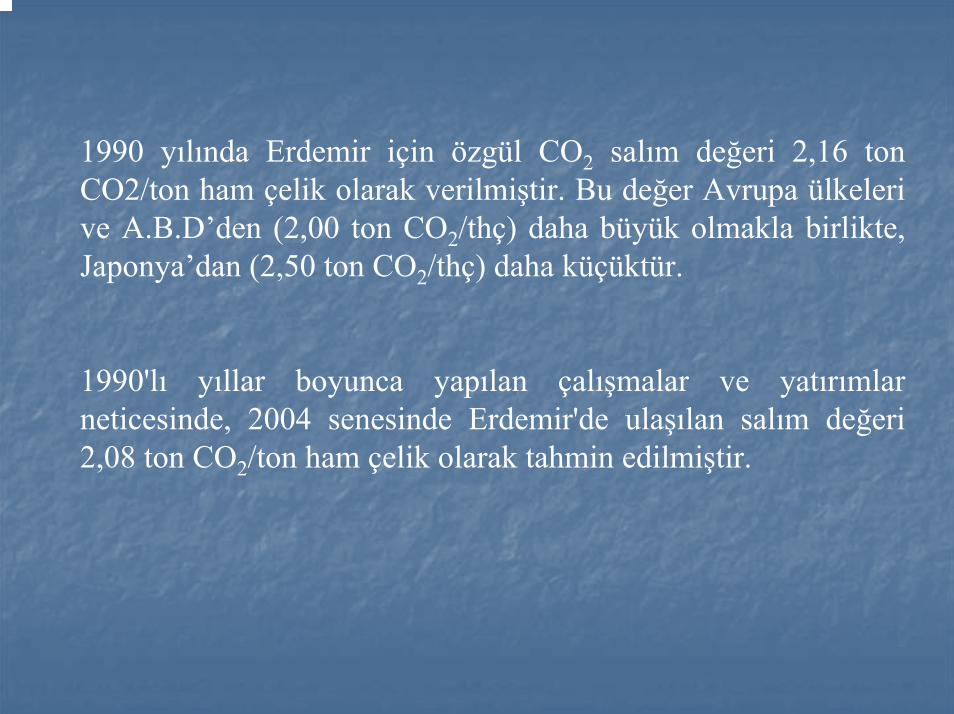
1990 yılında Erdemir için özgül CO2 salım değeri 2,16 ton CO2/ton ham çelik olarak verilmiştir. Bu değer Avrupa ülkeleri ve A.B.D’den (2,00 ton CO2/thç) daha büyük olmakla birlikte, Japonya’dan (2,50 ton CO2/thç) daha küçüktür.
1990'lı yıllar boyunca yapılan çalışmalar ve yatırımlar neticesinde, 2004 senesinde Erdemir'de ulaşılan salım değeri 2,08 ton CO2/ton ham çelik olarak tahmin edilmiştir.
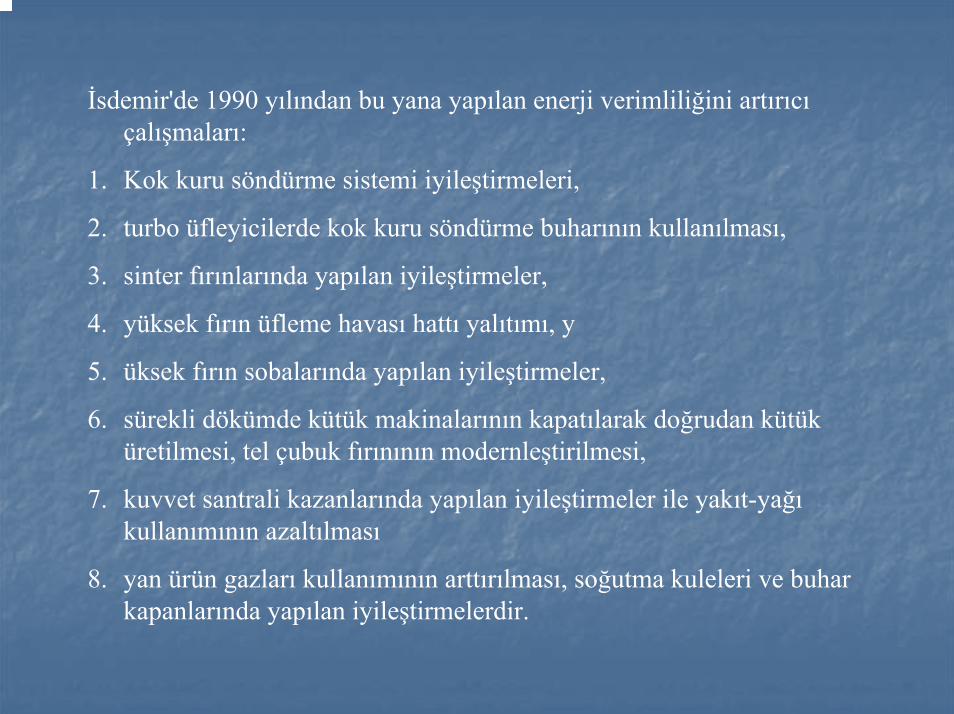
İsdemir'de 1990 yılından bu yana yapılan enerji verimliliğini artırıcıçalışmaları:
1. Kok kuru söndürme sistemi iyileştirmeleri,
2. turbo üfleyicilerde kok kuru söndürme buharının kullanılması,
3. sinter fırınlarında yapılan iyileştirmeler,
4. yüksek fırın üfleme havası hattı yalıtımı, y
5. üksek fırın sobalarında yapılan iyileştirmeler,
6. sürekli dökümde kütük makinalarının kapatılarak doğrudan kütük üretilmesi, tel çubuk fırınının modernleştirilmesi,
7. kuvvet santrali kazanlarında yapılan iyileştirmeler ile yakıt-yağıkullanımının azaltılması
8. yan ürün gazları kullanımının arttırılması, soğutma kuleleri ve buhar kapanlarında yapılan iyileştirmelerdir.
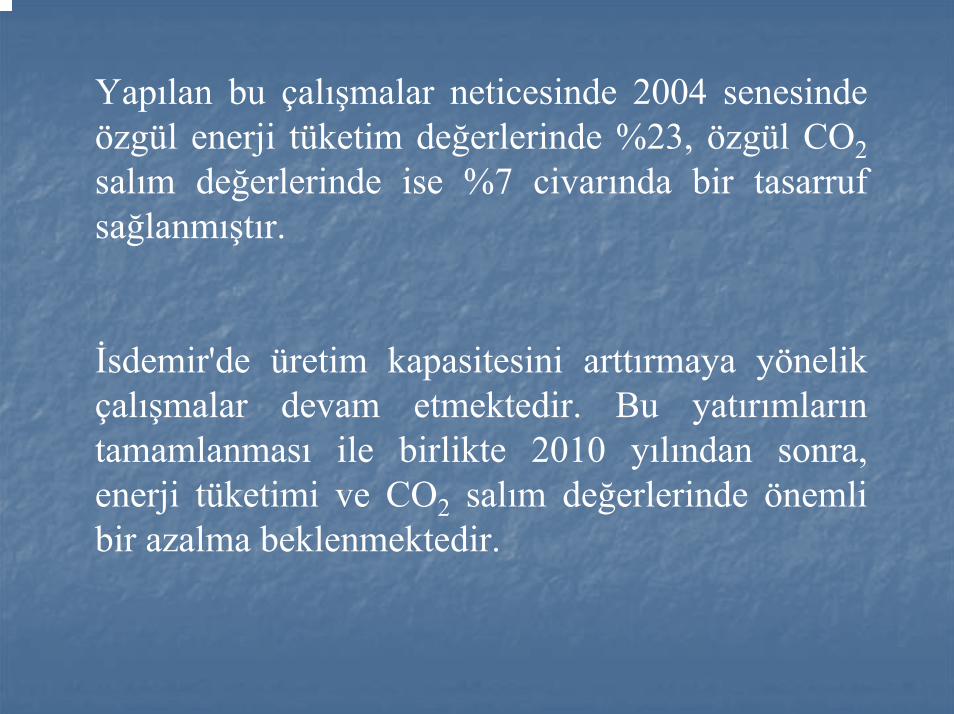
Yapılan bu çalışmalar neticesinde 2004 senesinde özgül enerji tüketim değerlerinde %23, özgül CO2salım değerlerinde ise %7 civarında bir tasarruf sağlanmıştır.
İsdemir'de üretim kapasitesini arttırmaya yönelik çalışmalar devam etmektedir. Bu yatırımların tamamlanması ile birlikte 2010 yılından sonra, enerji tüketimi ve CO2 salım değerlerinde önemli bir azalma beklenmektedir.
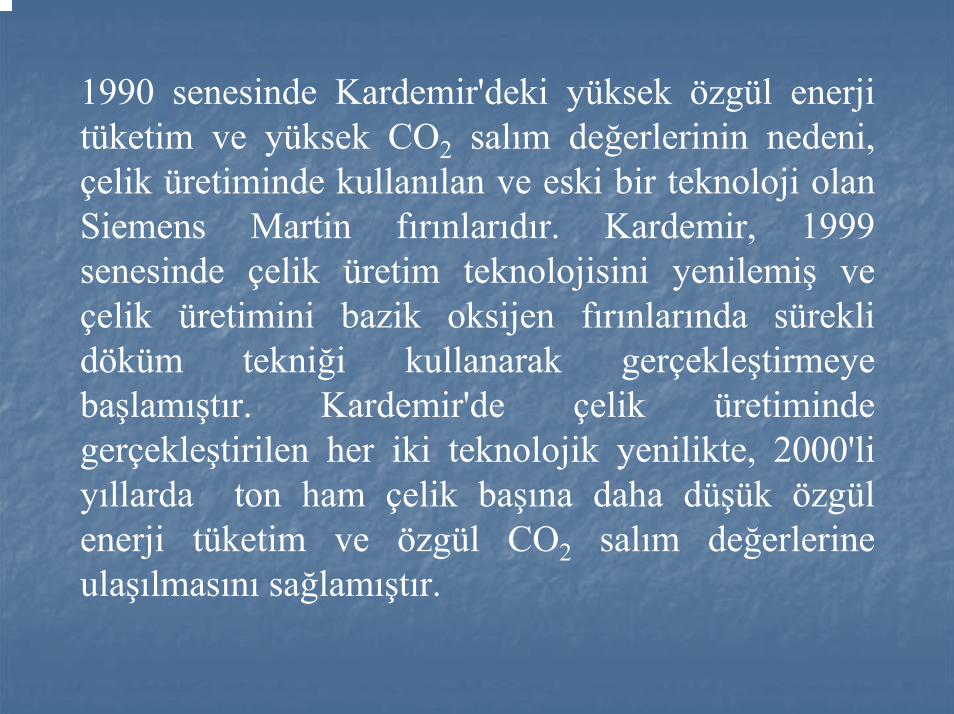
1990 senesinde Kardemir'deki yüksek özgül enerji tüketim ve yüksek CO2 salım değerlerinin nedeni, çelik üretiminde kullanılan ve eski bir teknoloji olan Siemens Martin fırınlarıdır. Kardemir, 1999 senesinde çelik üretim teknolojisini yenilemiş ve çelik üretimini bazik oksijen fırınlarında sürekli döküm tekniği kullanarak gerçekleştirmeye başlamıştır. Kardemir'de çelik üretiminde gerçekleştirilen her iki teknolojik yenilikte, 2000'li yıllarda ton ham çelik başına daha düşük özgül enerji tüketim ve özgül CO2 salım değerlerine ulaşılmasını sağlamıştır.
Bazik oksijen fırın gaz geri kazanım ünitesinin 2007 senesinde devreye girmesi ile, Kardemir'de 2010-2020 yılları arasında gerek çelik üretiminde kullanılan enerjide gerekse de CO2 salım değerlerinde üretim maliyetleri ve çevre açısından daha iyi bir koşullar beklenmektedir.
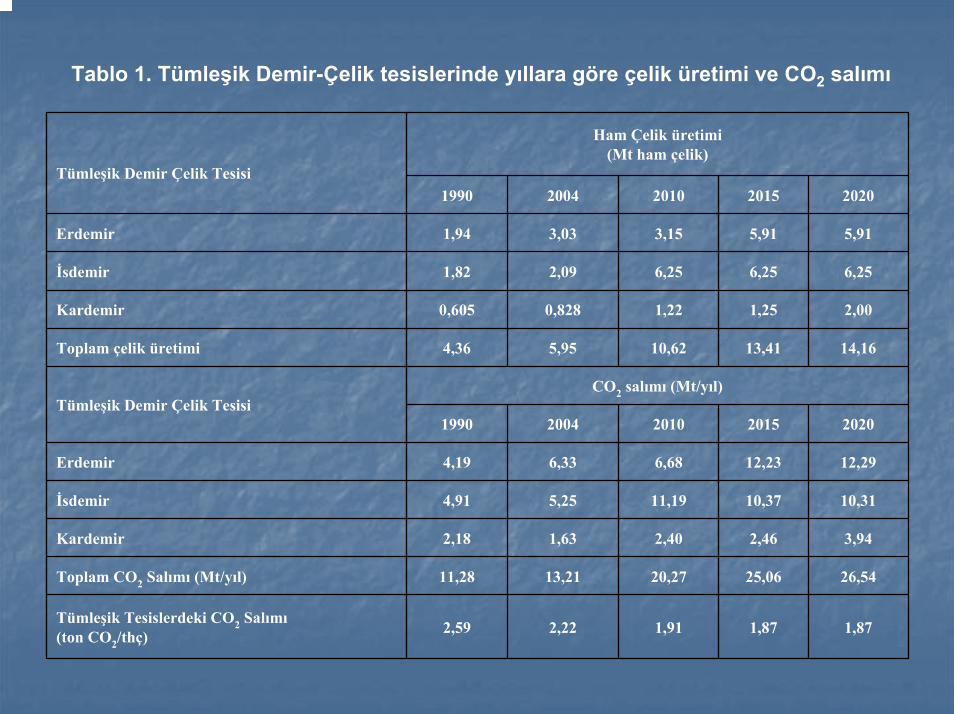
Tablo 1. Tümleşik Demir-Çelik tesislerinde yıllara göre çelik üretimi ve CO2 salımı
Ham Çelik üretimi(Mt ham çelik)
Tümleşik Demir Çelik Tesisi1990 2004 2010 2015 2020
Erdemir 1,94 3,03 3,15 5,91 5,91
İsdemir 1,82 2,09 6,25 6,25 6,25
Kardemir 0,605 0,828 1,22 1,25 2,00
Toplam çelik üretimi 4,36 5,95 10,62 13,41 14,16
CO2 salımı (Mt/yıl)Tümleşik Demir Çelik Tesisi
1990 2004 2010 2015 2020
Erdemir 4,19 6,33 6,68 12,23 12,29
İsdemir 4,91 5,25 11,19 10,37 10,31
Kardemir 2,18 1,63 2,40 2,46 3,94
Toplam CO2 Salımı (Mt/yıl) 11,28 13,21 20,27 25,06 26,54
Tümleşik Tesislerdeki CO2 Salımı(ton CO2/thç) 2,59 2,22 1,91 1,87 1,87
SONUÇLAR (DEMİR-ÇELİK)Tümleşik demir çelik tesislerinde 2004 ve 2010-2020 yıllarına ait özgül CO2salım değerleri incelendiğinde önümüzdeki dönemde ham çelik başına gerçekleşen CO2 salım miktarının 2,22 ton CO2/thç değerinden, 1,87 ton CO2/thç değerine düşeceği görülmektedir. Bunun anlamı, önümüzdeki 14 yıllık dönemde tümleşik demir çelik tesislerinde üretilecek ham çeliğin özgül enerji tüketim değerlerinin daha düşük olacağı ve buna bağlı olarak ton ham çelik başına CO2 salım miktarının daha az olacağıdır. Ancak, bu dönemde tümleşik çelik tesislerinde üretilen çeliğin miktarındaki artışa bağlı olarak, toplam CO2 salım değerlerinde de bir artış olacaktır.

Thank you for Thank you for your attention!your attention!


TOBB ETÜ
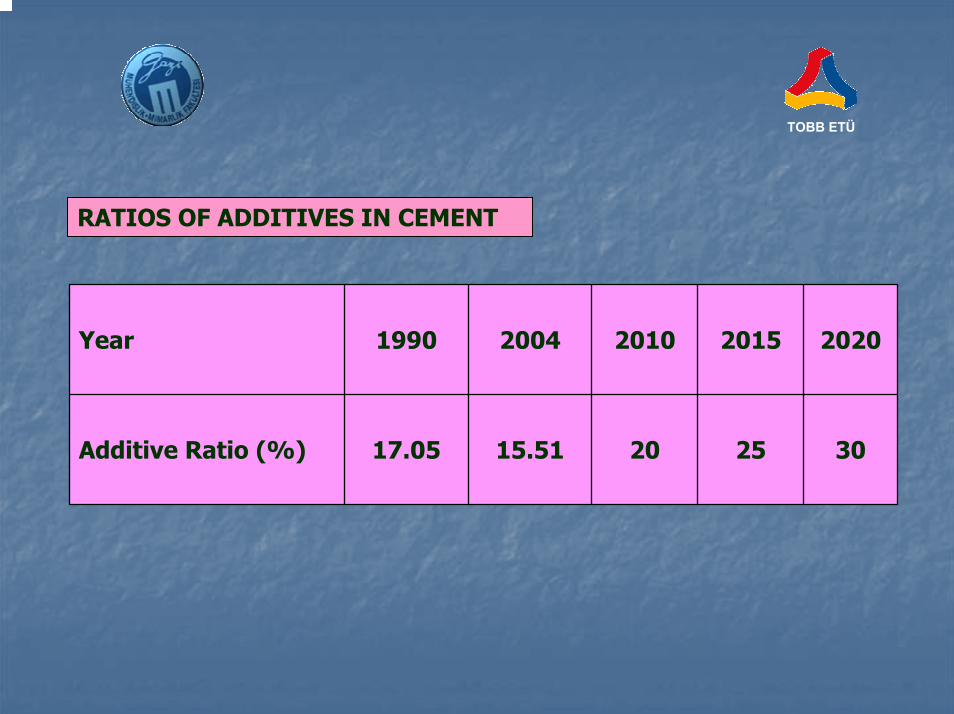
RATIOS OF ADDITIVES IN CEMENT
Year 1990 2004 2010 2015 2020
Additive Ratio (%) 17.05 15.51 20 25 30

TOBB ETÜMOTIVEMOTIVE
Turkey joined the United Nations Turkey joined the United Nations Framework Convention on Climate Framework Convention on Climate Change on 24 May 2004, and started Change on 24 May 2004, and started the EU accession negotiations in the the EU accession negotiations in the year 2005. year 2005.

UNDPUNDP--GEF Project:GEF Project:TOBB ETÜ
ENABLING ACTIVITIES FOR THE ENABLING ACTIVITIES FOR THE PREPARATION OF TURKEY'S INITIAL PREPARATION OF TURKEY'S INITIAL NATIONAL COMMUNCIATION TO THE NATIONAL COMMUNCIATION TO THE UNFCCCUNFCCC
TOBB ETÜ
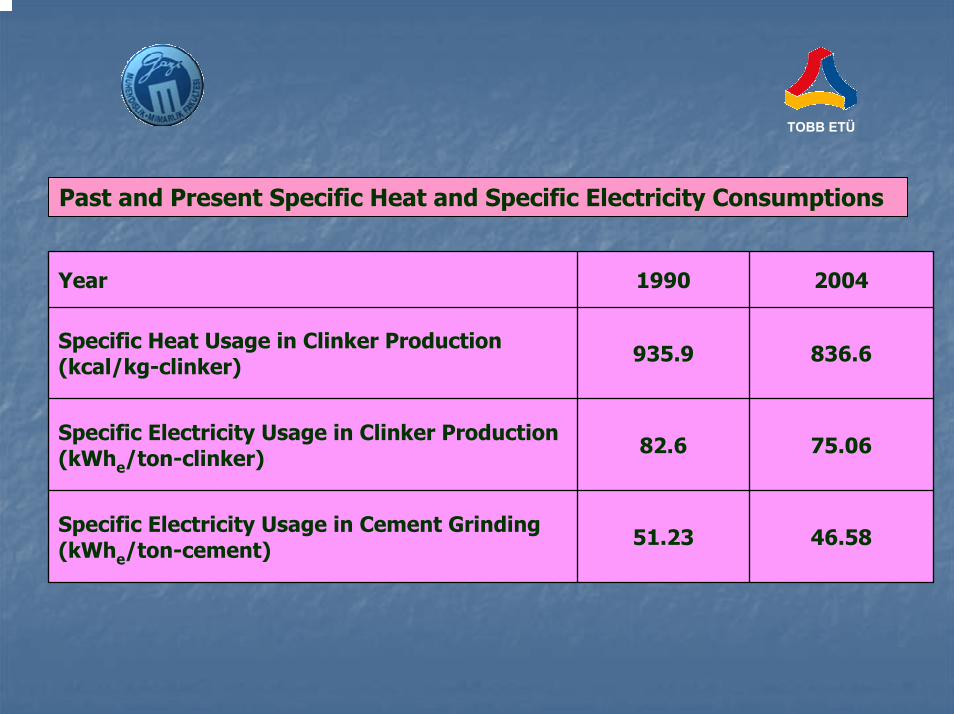
Past and Present Specific Heat and Specific Electricity Consumptions
Year 1990 2004
Specific Heat Usage in Clinker Production (kcal/kg-clinker) 935.9 836.6
Specific Electricity Usage in Clinker Production (kWhe/ton-clinker) 82.6 75.06
Specific Electricity Usage in Cement Grinding(kWhe/ton-cement) 51.23 46.58