Embed Size (px)
Citation preview

Forthcoming Handbook of International Economics, Vol. II Edited by James Hartigan. London: Blackwell, 2004.
Modern Commercial Policy: Managed Trade or Retaliation?*
Thomas J. Prusa Susan Skeath
Abstract In this paper we study worldwide antidumping (AD) case filing patterns in order to determine
the extent to which economic versus strategic incentives explain the behavior of countries
employing AD actions. We compare four main hypotheses: big supplier, big change in imports,
tit-for-tat and the club effect. We find strong support that AD actions are directed at big
suppliers, but far weaker evidence that AD actions are filed against suppliers whose imports
have surged. We also find very strong evidence that AD actions are used strategically to deter
further use of AD and/or to punish trading partners who have used AD. Our findings reject the
notion that the rise in AD activity is solely explained by an increase in unfair trading.
* Prusa: Department of Economics, Rutgers University, New Brunswick, NJ, email: [email protected]. Skeath: Department of Economics, Wellesley College, Wellesley, MA 02481, email: [email protected]. We would like to thank Kyle Bagwell, Tom Pugel and Bernie Yeung for helpful conversations as well as seminar participants at the University of Otago, Australia National University, Hong Kong University of Science and Technology, and NYU for comments and suggestions on an earlier draft. Work on this project was started while Skeath was a Commerce Divisional Visiting Fellow at the University of Otago. Financial support from the Class of ‘32 Social Sciences Fund at Wellesley College is gratefully acknowledged. We would also like to thank WTO Rules Division and Jorge Miranda in particular and for making the WTO AD Measures Database available. JEL Classification Number: F13

1. Introduction Modern commercial policy has been influenced significantly by the global movement toward
freer trade and more open borders. Where tariffs and quotas once held sway over policy makers,
antidumping and countervailing duty cases are now the path to WTO-legal protection.
Antidumping in particular has become increasingly prevalent worldwide.
To say that antidumping is now the most popular form of international trade protection
is an understatement. In terms of the quantity of trade litigation, antidumping has lapped the
field – several times over. In 1999 for instance, WTO members reported 360 antidumping
disputes. By contrast, they reported only 42 countervailing duty disputes. More astounding
perhaps is the fact that countervailing duty law has long been the second most commonly used
trade statute. Countervailing duty law takes the silver medal, but it is a far distant second.
The preeminence of antidumping is neither an entirely recent phenomenon nor simply a
one-year anomaly. In the United States, for instance, over the past twenty-five years there have
been more than twice as many antidumping disputes as countervailing duty allegations. In fact,
there have been more disputes filed under the U.S. antidumping statute than under all other U.S.
trade statutes put together. The same is true for the E.U. Antidumping (AD) is simply the 900-
pound gorilla of trade laws.
The rise in AD activity was not entirely unexpected. Ethier (1982, p. 488) warned that
antidumping would be “the principal battleground for the ‘new protectionism’ as concerns trade
in manufactures among the developed economies.” But throughout most of the post-war era, it
was easy for GATT negotiators to look the other way when it came to AD. After all, during that
period, AD was really only a significant trade impediment for a handful of countries. Most
countries either did not have an AD statute or chose not to use the law.
However, Ethier’s words now ring true and low levels of AD use are no longer the norm.
As a number of more recent authors have pointed out, the dramatic proliferation in the use of
Page 2
antidumping since 1980 is a particularly alarming development (Miranda, Torres and Ruiz,
1998; Prusa, 2001). More than three times the number of countries have been involved in AD
disputes – both in terms of those filing cases and those being filed against – during the 1990s as
compared with the 1980s.
One of the most disconcerting aspects of the growth, and certainly the most crucial for
the issues examined in this paper, is the fact that the “traditional” users of antidumping
(Australia, Canada, the E.U., New Zealand, and the U.S.) have been joined by an ever-growing
group of “new” users, including South Africa, Brazil, and Mexico among others. Most of the
new users did not even have their own antidumping statutes until the late-1980s.
As the number of users and cases filed annually grow, it is increasingly difficult to
identify the motives of the users of AD and to argue that increased usage signals merely an
increase in unfair trade. We are concerned, for example, that antidumping is increasingly being
used as pure protectionism rather than as a valid trade remedy. It appears that AD’s seductive
lure of “WTO legitimate” protectionism is hard to resist and that an increasingly large number of
countries are beginning to abuse the rules.
In Prusa and Skeath (2002), we provide some non-parametric evidence to suggest that
the recent rise in AD activity cannot be explained solely by an increase in unfair trading
practices. Here, we probe more deeply and examine whether there is any more significant
empirical support for the proposition that AD filings are motivated by factors other than pure
economics – by factors other than dollars and pesos so to speak. For the purposes of this paper,
economic motivations include, say, filing AD complaints after a surge in imports, or perhaps
even simpler, filing AD complaints against countries who hold the biggest import market share.
In other words, we are willing to be agnostic as to whether such possibly benign patterns imply
any unfair behavior. It is certainly possible that these patterns are consistent with unfairly low
priced imports.
Page 3

By contrast, “non-economic” factors behind AD use include what we refer to as strategic
or retaliatory motivations. For instance, when a country tends to file AD complaints against
precisely those countries that have previous filed cases against it, we argue that its AD use is at
least partially motivated by retaliation. Such behavior is completely inconsistent with the notion
of AD as a way to combat unfair import practices. In fact, it suggests that countries view AD as
a way to combat unfair governmental policies rather than a private firm’s unfair practices.
In this paper we study worldwide AD filing patterns in order to determine whether we
can identify the motivations for the increased use of AD disputes. In order to do so, we have
compiled a database of all AD actions filed worldwide between 1980 and 1997 supplemented by
trade statistics for each country filing cases.
Our analysis provides strong support for the view that strategic incentives influence AD
filings. In particular, we find that, all else equal, AD users are far more likely to investigate
suppliers who are also AD users. In other words, there appears to be a “club” effect, where
countries that have used the law are also more likely to be subject to investigations. Further, we
find some evidence that countries are also more likely to use AD specifically against those
countries that investigated them in the past. This is the type of pattern one might expect from
game players employing tit-for-tat strategies. All things considered, we believe our findings
reject the notion that the rise in AD activity is solely explained by an increase in unfair trading.
The remainder of the paper proceeds as follows. In the next section we present a brief
history of AD legislation along with a discussion of the growth in AD activity over the past two
decades. In section 3 we review the theoretical models motivating our empirical approach. In
section 4 we present parametric results. Concluding comments are made in section 5.
Page 4
2. History and Background
Short History of Antidumping Legislation
Although opinions regarding AD vary, the facts regarding the laws and their use are clear. The
focus of recent attention on AD has been the upsurge in use in the past two decades. However,
antidumping laws have been in place for considerably longer and have an interesting history.
The first modern AD law (Act to Amend the Customs Tariff, 1897) was passed in Canada
in 1904. Antidumping provisions were formally passed soon after in New Zealand (Agricultural
Implement Manufacture, Importation and Sale Act, 1905) and Australia (Australian Industries
Preservation Act, 1906). Both the United States and Britain passed their own statutes within the
next fifteen years (the U.S. Revenue Act of 1916, and the Safeguarding of Industries Act of 1921,
respectively) as did several European countries (e.g. France, in 1908) and most of the British
Commonwealth (Finger, 1993, p. 16).
Some of the original antidumping laws were industry-specific, as in New Zealand, or
based loosely on earlier competition law, as in the U.S. The 1916 American law used the ‘intent
to restrain competition’ language of the Sherman Act of 1890. Such laws were relatively
quickly replaced with statutes more similar to the Canadian one in which a more general “injury
from imports” standard prevails (Finger, 1993, p. 21). The New Zealand Customs Amendment
Act (1921) and the U.S. Antidumping Act (1921) both allowed broader administrative authority
in the imposition of antidumping penalties with evidence of injury than did earlier acts.
Over the intervening years, these statutes have been variously amended, repealed, and
replaced with more modern laws up to and through the period of negotiation of the GATT. In
the United States, the most major changes occurred with the Tariff Act of 1930 and the Trade
Agreements Acts of 1974 and 1979, although there were additional changes made in both 1984
(Trade and Tariff Act) and 1988 (Omnibus Trade Act). Many of the later changes made it easier
Page 5

for domestic firms both to prove the existence of dumping and to obtain relief under the law,
including extensions of the definition of “less than fair value” to include both international price
discrimination and sales below cost (Hufbauer and Elliott, 1994, p. 113). Elsewhere, in Europe,
Canada and the British Commonwealth countries in particular, similar changes were being made
to antidumping statutes throughout the century.
As individual nations tinkered with existing antidumping statutes or passed new ones
during the latter half of the 20th century, antidumping also became institutionalized in Article VI
of the original formulation of the GATT in 1947. Article VI does not, however, specify how
signatory countries should identify dumping behavior nor how they should make injury
determinations. As a result, GATT member countries negotiated an additional agreement aimed
at providing pertinent information on the implementation of Article VI. This “Agreement on the
Implementation of Article VI” (more commonly called the Antidumping Agreement or the
Antidumping Code), most recently revised during the 1994 Uruguay Round, regulates the use
and application of Article VI by member countries. In particular, it details procedures for much
of the antidumping process, including the determination of injury, collection of evidence, and
imposition of duties.
The original version of the Code, negotiated during the Kennedy Round (1967), was of
limited significance due in part to the fact that the U.S. did not sign that document. The Tokyo
Round (1979) then produced some amendments to the Code that helped to transform what had
been a little-used trade statute into the workhorse of international trade protection that is modern
antidumping law. First, the definition of “less than fair value” sales was broadened to
incorporate both price discrimination and below-cost sales, as had been done in the U.S. some
years earlier. In addition, the Tokyo Round Agreement removed the provision that dumped
imports be demonstrated as the “principal cause of material injury” before duties could be
imposed.
Page 6

The Tokyo Round “improvements” in the AD Code were significant in opening the door
to AD case filings. They also provided an important and useful general framework for
investigations. Even the Tokyo Round agreement, however, bound only the 27 GATT member
countries. It was not until the Uruguay Round (1994) that the AD Agreement came into force
for a broader set of countries worldwide.
Trends in Antidumping Filing Behavior
Despite the amount of legislative time and paperwork devoted to AD in the U.S., Europe, and
the British Commonwealth over the first six decades of the twentieth-century, and by GATT
signatories after 1947, AD disputes were not very common until the 1970s. Hufbauer (1999)
notes that the U.S. filed a total of only 246 cases between 1934 and 1974, an average of only six
per year. Worldwide, fewer than a dozen cases were filed by GATT member countries each
year between 1948 and the early 1960s (Finger and Fung, 1994).
This relatively low level of activity began to change in the 1970s, due in part to the
amendments made to the GATT antidumping code in 1979 and to country-specific changes in
antidumping legislation. In the U.S., for example, an average of 35 cases were filed each year in
the second half of the 1970s (Finger and Fung, 1994, p. 199). Looking more broadly at the
antidumping case filing history, we see that AD actions went on to become even more common
during the 1980s; an average of 139 cases were filed each year from 1980 through 1989.
Despite the increase in its use in the two decades between 1970 and 1990, many did not
view AD as a trading-system problem because it was an instrument still actually wielded by only
a handful of countries. Prior to the late-1980s, essentially all AD actions were initiated by the
five “traditional” users: the U.S., Canada, the European Union, Australia, and New Zealand.
Specifically, traditional users were responsible for a total of 99.4% of all of the AD cases filed
Page 7
between 1980 and 1985 as well as for more than 95% of the cases filed during the entire decade
of the 1980s.
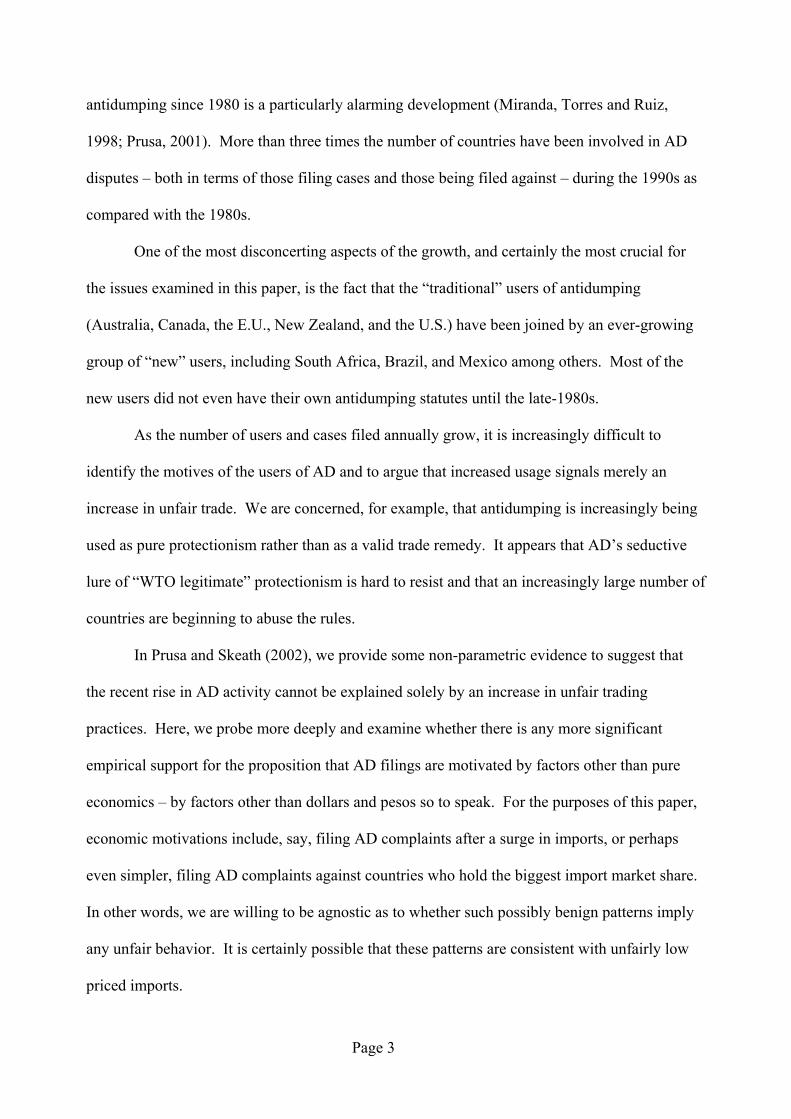
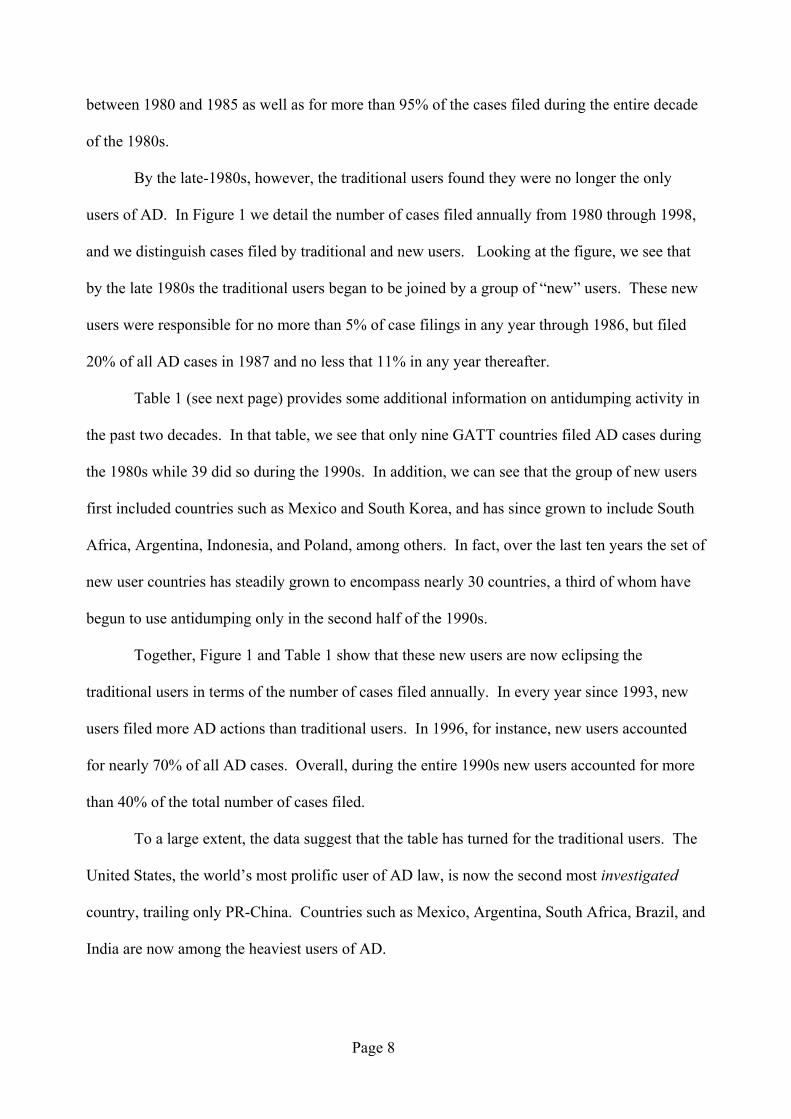
By the late-1980s, however, the traditional users found they were no longer the only
users of AD. In Figure 1 we detail the number of cases filed annually from 1980 through 1998,
and we distinguish cases filed by traditional and new users. Looking at the figure, we see that
by the late 1980s the traditional users began to be joined by a group of “new” users. These new
users were responsible for no more than 5% of case filings in any year through 1986, but filed
20% of all AD cases in 1987 and no less that 11% in any year thereafter.
Table 1 (see next page) provides some additional information on antidumping activity in
the past two decades. In that table, we see that only nine GATT countries filed AD cases during
the 1980s while 39 did so during the 1990s. In addition, we can see that the group of new users
first included countries such as Mexico and South Korea, and has since grown to include South
Africa, Argentina, Indonesia, and Poland, among others. In fact, over the last ten years the set of
new user countries has steadily grown to encompass nearly 30 countries, a third of whom have
begun to use antidumping only in the second half of the 1990s.
Together, Figure 1 and Table 1 show that these new users are now eclipsing the
traditional users in terms of the number of cases filed annually. In every year since 1993, new
users filed more AD actions than traditional users. In 1996, for instance, new users accounted
for nearly 70% of all AD cases. Overall, during the entire 1990s new users accounted for more
than 40% of the total number of cases filed.
To a large extent, the data suggest that the table has turned for the traditional users. The
United States, the world’s most prolific user of AD law, is now the second most investigated
country, trailing only PR-China. Countries such as Mexico, Argentina, South Africa, Brazil, and
India are now among the heaviest users of AD.
Page 8

Table 1 also shows that virtually none of the new users were strangers to antidumping
actions before filing their own cases. Only two of the 27 countries that began using AD
consistently after 1985 had never had AD cases filed against any domestic interests. Well over
half of the countries had been named in at least 13 AD cases before adopting their own statutes.
Such striking trends certainly raise the specter that countries are using AD law for reasons other
than punishing unfair trade.
Schools of Thought Regarding Antidumping
Broadly speaking, positions toward AD fall into three main camps. In the first camp are those
who believe that AD simply protects against unfair trade and hence that the increase in AD
actions reflects an increase in unfair trade. For example, McDonald (1998) and Mastel (1998)
claim that the increased use of AD actions is largely due to liberalization and not an indication
that AD is “out of control.” Their argument is that as traditional trade barriers are lowered
previously benign or irrelevant unfair pricing behavior becomes injurious and must be
disciplined.
In the second camp are those who argue that AD facilitates trade liberalization by
allowing countries to raise tariffs for those industries that are more significantly injured by
imports than trade negotiators anticipated (Corden, 1974; Bagwell and Staiger, 1990). From this
perspective, without the ability to resort to “special protection” countries could never have
negotiated the wide-ranging reductions in tariff rates such as those achieved during the Tokyo
and Uruguay Rounds of GATT. In other words, AD acts as a de facto safeguard mechanism.1
1 Given that the injury standard under AD is much lower than under safeguard protection and
that most countries do not have a national interest clause in their AD statute, the fact that AD
acts as de facto safeguard protection raises concerns. Nevertheless, this observation is consistent
Page 9

Given the greater degree of economic interdependence and the increased volatility of exchange
rates and trade volumes now observed worldwide, the increase in AD activity may simply reflect
the greater need for ex post flexibility with respect to tariffs (Fischer and Prusa, 2003).
Finally, in the third camp are those who believe that AD is essentially a strategic or
protectionist policy. For instance, it has been shown that AD promotes collusion by serving as a
punishment device (Staiger and Wolak, 1991) and by coordinating pricing and quantity
decisions (Prusa, 1992). There is also ample evidence that AD protection is most often granted
to politically powerful industries (Finger, Hall and Nelson, 1982; Hansen and Prusa, 1995,
1996).
Whether the growth of AD activity raises or lowers welfare depends on what perspective
is most accurate. From the perspective of the first two camps AD measures raise welfare;
therefore, the growth of AD activity reflects how vital it is to the liberal trading system. On the
other hand, from the perspective of the third camp AD is a loophole in the GATT/WTO rules;
consequently, the growth of AD activity is a threat to free trade.
In the following section, we present a more comprehensive review of the various theories
used to explain antidumping behavior. We then proceed, in Section IV, to test the hypotheses
generated by these theories.
3. Theory
In its purest form, an AD action should occur only after an incident of dumping. There are
problems with this conclusion, however, due in large part to the manner in which AD statutes
are written. Countries generally have significant discretion in the use of AD law, and
with the view that AD facilitates trade liberalization. A subtler question is whether the abuse of
AD is necessary for trade liberalization.
Page 10

implementation by the authorities is often poor. Thus, countries and individual industries within
countries have learned that they can use the laws to their advantage in a variety of ways. As
discussed above, we can classify explanations for AD actions into three broad schools of
thought: (i) AD as a response to unfair trade, (ii) AD as special or safeguard protection, and (iii)
AD as a strategic weapon, to punish those who have used it or to deter others from abusing it.
These three “camps” serve to motivate the hypotheses to be tested.
Unfair Trade
AD actions may be filed in response to unfair trade practices by importers. The standard
theoretical explanation for AD is based on the existence of dumped imports, goods that are sold
either at a price below that set in the importer’s domestic market or at a price below the
importer’s cost of production, implying that goods are not sold at “fair value.”
Brander and Krugman (1983) provide a formal theoretical treatment of dumping as
international price discrimination.2 Their model shows that oligopolistic firms in segmented
markets have profit-maximizing incentives to sell into each other’s markets. Further,
equilibrium export prices for each firm can fall below their domestic prices making their foreign
sales qualify as dumped.
The first formal model of dumping as pricing below production cost appears in Ethier
(1982). His model shows that factor market considerations in unfavorable periods can lead to
below-cost export pricing in the international equilibrium. In both this case and that analyzed by
Brander and Krugman (1983), domestic producers may experience losses due to the existence of
dumped imports. Arguably, these are the losses that are the concern of international AD
statutes. The GATT code provides for the imposition of AD duties in cases in which dumped
imports are found to have caused such material injury to domestic firms. 2 This definition of dumping is that traditionally found in the literature. It can be traced at least
to Viner who argued “for confining the term dumping to price-discrimination between national
markets.” (1923, p. 3)
Page 11
Given the level of detail at which we were able to construct our data set, we are
constrained to use country-level data. Therefore, we cannot determine whether there have been
actual instances of dumping or unfair trade practices. Instead, we will use indirect measures of
unfair practices. For example, one could expect that exporting at unfairly low prices would
result in large import volumes and/or large increases in imports and thus that AD cases would be
directed at countries with such trends.3
Special Protection
It has long been argued that overall trade liberalization can only be achieved if countries have
the ability to suspend their obligations for those industries that are more significantly injured by
imports than trade negotiators anticipated. This view was formalized by Bagwell and Staiger
(1990), who developed a game-theoretic model in which “special protection” arises as a short-
term cooperative remedy for changes in underlying trade flows.
Their basic structure is that of a repeated prisoners’ dilemma game in which cooperative
behavior is defined as imposing low tariff rates, while high tariff rates represent defection. In a
repeated game, players could solve the dilemma by using contingent strategies, like tit-for-tat,
that incorporate punishment schemes to handle instances of defection from the cooperative
outcome, or by the creation of formal agreements that include third-party punishment
mechanisms, such as the GATT.4 However, as Bagwell and Staiger (1990) argue, these schemes
cannot account for the growing incidence of the use of “special protection,” such as escape
clause actions, VERs and AD.
3 The injury requirement also makes it more likely that one would name countries with large
imports or large changes in imports since such trends are usually taken as evidence of economic
harm.
4 Papers by Dixit (1987), Jensen and Thursby (1984), Mayer (1981), and Riezman (1982)
explore these issues.
Page 12

To better explain the existence of special protection, Bagwell and Staiger use a simple
two-country partial equilibrium model of trade in one sector with a prisoners’ dilemma payoff
structure. They then assume that each country’s output is subject to (observed) random shocks
where positive shocks lead to higher volumes of trade. In the repeated game, cooperation can be
sustained by means of a credible threat to revert forever to the static Nash equilibrium in the
event of any defection. Crucially, Bagwell and Staiger show that the level of cooperation, that
is, the value of the cooperative tariff, depends on the volume of trade and on the variance of the
shocks (i.e., the size of the import “surge”). They show that the cooperative tariff rate is
increasing in both import size and variance. In other words, Bagwell and Staiger formalize
Corden’s (1974) argument that special protection may be a tacitly agreed method to maintain
cooperation in volatile trade periods.
From an empirical perspective, the “special protection” hypothesis implies two testable
outcomes. First, AD cases are more likely to be filed against a country’s largest trading
partners. And, second, AD cases should be more likely to be filed against those trading partners
with recent surges in import volume.
Strategic Use of AD – Punishment and/or Deterrence
According to Bagwell and Staiger, special protection is a (symmetric) cooperative response to a
changing trade environment that allows countries to maintain cooperation in times of volatile
trade volumes. Within their model, the changes in tariff levels are equilibrium responses to
changes in the size or variance of imports. Yet, there are reasons to believe that there may be
additional factors that should be considered when studying AD filing behavior. For example,
Finger (1993) argues that the countries that use AD form a type of “club,” in that they tend to
apply AD against one another rather than against non-club members. Similarly, Prusa (2001)
Page 13

argues that many countries appear to file AD actions against countries that have previously
investigated them, suggesting a type of tit-for-tat behavior.5
Both of these arguments suggest that countries may be using AD in a strategic fashion to
punish defectors (or perhaps to deter defection). Without any further elaboration, however, both
patterns are inconsistent with AD as protection against unfair trade and are outside the Bagwell-
Staiger special protection framework. Here we suggest two extensions to the Bagwell-Staiger
model that would generate the club effect and/or tit-for-tat filing in equilibrium: (i) imperfect
monitoring of demand shocks and (ii) political economy incentives to misuse AD. A third
possibility discussed below is that the punishment strategies are in fact evidence that countries
are “out of equilibrium” (in the Bagwell-Staiger notion of cooperative equilibrium).
One extension to the Bagwell-Staiger framework would broaden the basic prisoners’
dilemma game to allow for the demand shock to be unobserved. As shown by Green and Porter
(1984) this type of unobservable shock can induce a cartel to enter into a “punishment” phase
even if no player has deviated from the cooperative outcome. Applying the Green and Porter
logic to our application generates filing patterns consistent with punishment strategies. In
particular, we could consider AD users as members of a type of cartel or club, in which
monitoring the behavior of each club member is not possible. Then, when club members
experience trade-related economic difficulties, they respond by filing AD cases, whether or not
the named countries have actually “dumped.”
A pattern of Green and Porter reversion to high duties could give rise to either direct
punishment or indirect punishment. If, for example, country A’s use of AD against Country B
leads country B to file its own AD case against Country A, then we will observe direct
punishment. For convenience we will refer to this type of behavior as “tit-for-tat” punishment
5 Messerlin and Reed (1995, p. 1573) suggest a similar effect by which the AD Code, in
encouraging the standardization and spread of AD law across WTO-member countries “may
tempt countries to take AD measures as disguised retaliation.”
Page 14
even though we are intending a somewhat broader than usual interpretation of the term.6 On the
other hand, if country A’s use of AD against Country B leads other countries (country C, D, E,
etc.) to file AD cases against Country A, then we will observe indirect punishment, or what we
will refer to as “club effect” punishment. Finger (1993) was the first (to our knowledge) to
suggest this type of behavior and we follow his lead in referring to it as a club effect.
A second potential extension to the Bagwell-Staiger model would allow political
motivations for offering protection. For instance, in the Grossman and Helpman (1994)
framework politicians care not just about national welfare but also about the financial
contributions they raise. They show that politicians will offer more protection than is optimal
(from a national point of view) because doing so allows them to raise additional funds to finance
future campaigns.
Applied to our model, Grossman-Helpman’s political economy story would suggest that
politics would lead governments to apply AD more aggressively than simple economics would
predict. In order to deter politicians from abusing this flexibility, trading partners may want to
raise the cost to applying AD. They do so by filing their own AD actions in response to seeing
others using AD. In equilibrium, one would expect that politicians would design AD so only
industries with a high willingness to pay for protection will file AD actions, since doing so
induces other countries to respond with their own AD actions. As with the Green and Porter
extension, this extension would give rise to observing AD cases being filed as indirect and/or
direct punishment.
Finally, it may be the case that worldwide AD use is not in “equilibrium.” That is, the
heavy use of AD law during the late-1970s and early-1980s may have been too aggressive, and
rather than maintaining the cooperative tariff level as implied by Bagwell and Staiger, such 6 True tit-for-tat strategies punish the original defector for only so long as she continues to
defect. Instances of cooperation by the original defector are rewarded by cooperative play on
the part of a true tit-for-tat player. Our tit-for-tat player reverts to the Nash equilibrium, and
therefore defects, for all remaining periods following a defection.
Page 15

heavy use may have been perceived as a defection to the high protection regime. If this is the
case, then recent AD actions might be “out of equilibrium” responses to the earlier defection.
As with the above two scenarios, depending on the punishment strategy such defections could
give rise to either direct or indirect punishment.
4. Estimating the Strategic Motives for AD Filings
In order to investigate the motives for filing AD cases, we have compiled a database of all AD
cases filed from 1980 through 1998 by GATT/WTO members. The filing trends were depicted
in Figure 1 and reported in Table 1 as well as discussed briefly in Section II.B. above. The most
salient facts are as follows: (i) over 3500 AD cases were filed worldwide over the 19 year
period; (ii) two-thirds of the cases were filed by traditional users, although the percentage has
been falling in recent years; (iii) only nine countries filed AD cases during the 1980s, but 29
countries filed AD cases during the 1990s, suggesting that many countries are beginning to catch
the AD bug; and (iv) about one-fifth of the cases were filed against non-market economies.
This final point is noteworthy since the rules for determining the existence of dumping
are quite different when the affected country is a non-market economy (Boltuck and Litan,
1991). As a result, the motivation for filing against a non-market economy is likely to be quite
different than that for filing against a market economy. For this reason, we drop cases against
non-market economies from our analysis.7
Another issue that is worth mentioning is that our data is based on aggregate filing data.
In most cases and in most countries, petitions are initiated by firms, trade unions or trade
associations. Our discussion of clubs and retaliation was couched in language that suggested
that governments make the decisions to file, and effectively, it may be that they are, in the sense 7 We also debated whether to drop countries that are members of a preferential trade agreement
(e.g., drop Mexico and Canada from U.S. filing data). Although we were concerned about
preferential treatment, we were unable to gather complete data on which FTA have special rules
pertaining to AD actions against member countries. As a result, we do not control for FTA.
Page 16
that governments communicate with the pertinent firms about the possibility of filing. On the
other hand, it may be that firms themselves retaliate. See Maur (1998) for a evidence of
retaliation at the industry-level. Regardless of one’s preferred interpretation, we are interested in
whether there is any evidence of retaliatory filings.
As discussed in the preceding section, there are four main hypotheses that we examine in
our analysis of AD filing behavior. These hypotheses are: big supplier, big change in imports,
tit-for-tat, and club effect. The first two are motivated by the Bagwell-Staiger model of special
protection and are consistent with the view that AD actions are used to prevent unfair trade. The
last two are outside the basic Bagwell-Staiger model and are consistent with the belief that
strategic considerations influence AD actions.
The “big supplier” hypothesis is that AD cases are filed against a country’s largest
import suppliers (based on aggregate country data). The “big change” hypothesis is that AD
cases are filed against suppliers who have the largest percentage change in imports. The tit-for-
tat hypothesis is that a country is more likely to file AD cases against those suppliers who
previously have filed an AD case against it. For example, under the tit-for-tat hypothesis if the
U.S. and Australia have filed cases against Mexico in the past, then Mexico will be more likely
to file cases against the U.S. and Australia than against, say, South Korea and Venezuela. The
club hypothesis is that a country is more likely to file AD cases against countries that also use
AD, regardless of whether it has been directly named in the past. Continuing with the above
example, if South Korea has used AD against countries other than Mexico, under the club
hypothesis Mexico would be more likely to name South Korea than Uruguay (i.e., a country that
had not used AD at all).
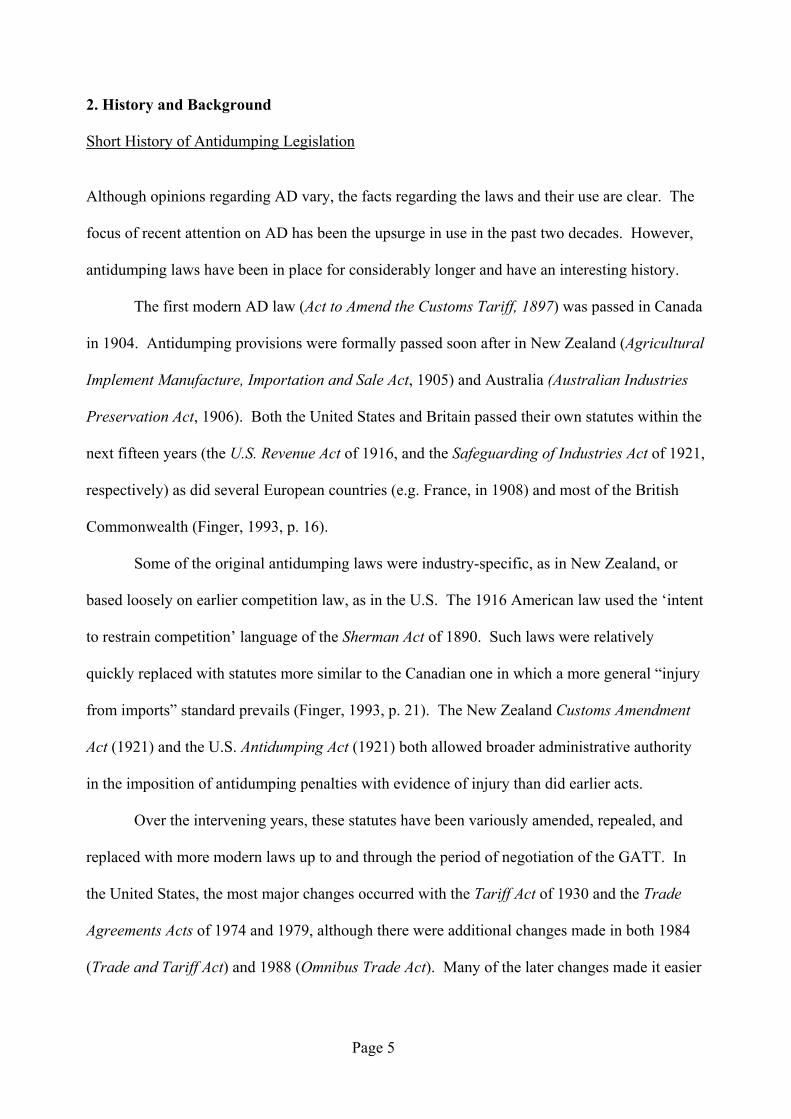
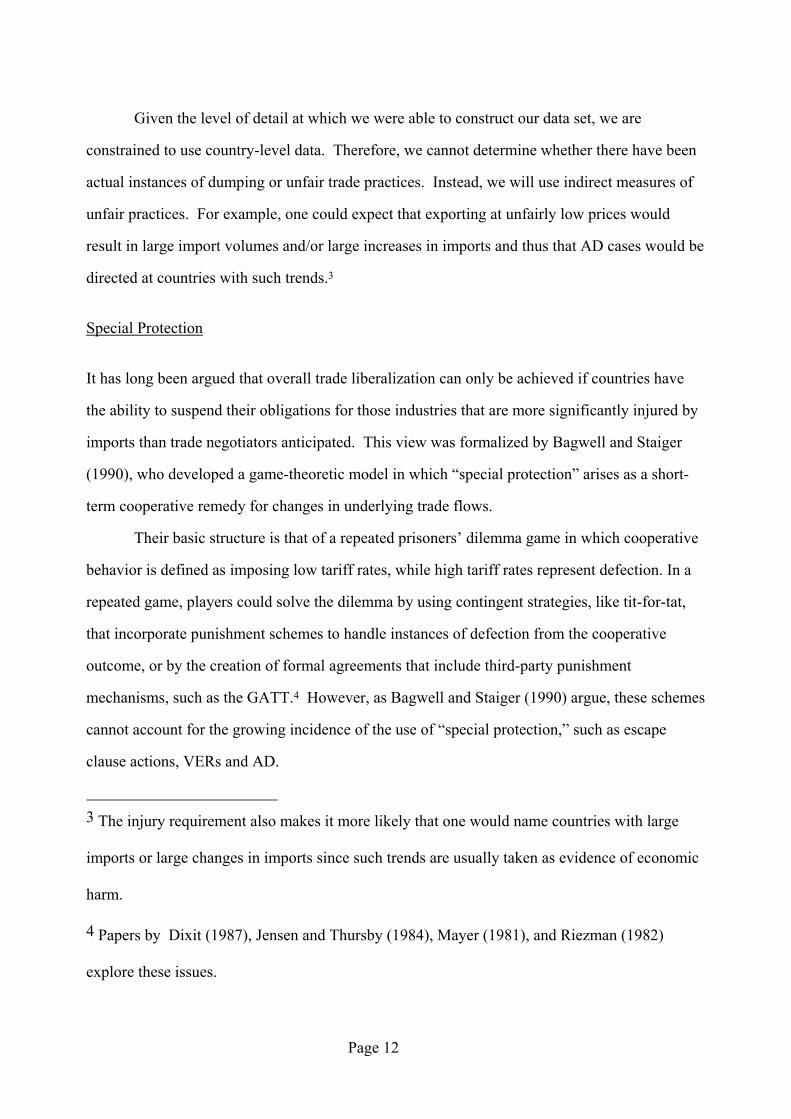
Figure 2 gives a broad picture of how the four hypotheses are reflected in the data.
Overall, 47% of AD cases are filed in a manner consistent with tit-for-tat and 62% are consistent
with the club effect. Thus, it appears that these two strategic hypotheses find substantial support
in the data.
Economic incentives also receive strong support. For instance, overall 99% of AD cases
are filed against big suppliers, where we have defined big suppliers as those countries with
Page 17

import shares greater than that of the median supplier. The big change hypothesis also seems
reasonably consistent with the data, as 54% of AD cases are filed against suppliers whose
percentage change in imports is greater than that of the supplier with the median percentage
change.
There also appear to be substantial differences in the patterns between new and
traditional users. For instance, the filing patterns of new users seem to more strongly support
the strategic hypotheses, tit-for-tat and club, than those of traditional users. While new users
may indeed use AD more strategically than do traditional users, this may be due to the fact that a
different proportion of countries supplying new and traditional users were AD users. For
instance, if all of a new user’s suppliers were AD users, then we would report 100% of this
country’s cases were consistent with the club effect.
In order to identify the individual effects of each hypothesis, we proceed with parametric
estimation of the AD filing decision.8 To do so, we model each country’s decision to file an AD
action against each trading partner in each year as a function of the economic and strategic
incentives. Let Fijt be a binary variable that denotes whether country i files an AD case against
country j in year t. We can then express the filing decision as
Fijt = f(TFTijt, Clubjt, Importsijt, %∆Importsijt, All_Importsit) ,
where TFTijt denotes whether country j has ever filed an AD case against country i prior to year
t, Clubjt denotes whether country j is a member of the “AD club” prior to year t, Importsijt
denotes imports from j to i at time t, and %∆Importsijt denotes the percentage change in imports
from j to i between t-1 and t. The final variable, All_Importsit, is not directly related to the
proposed hypotheses but rather captures the intuition that overall filing patterns might
systematically vary across users. That is, everything else equal, some users may use AD more
8 Note that Prusa and Skeath (2002) present non-parametric tests of the hypotheses presented
above. The results there show variation in effects across user types and suggest that strategic
motives for AD use cannot be dismissed.
Page 18

aggressively than other users. A natural way countries might differ in their use of AD is in their
exposure to imports. Thus, the variable All_Importsit denotes country i’s import in year t from
all sources.9
We estimate this decision function using probit.10 In Tables 2 through 5 we present the
parameter estimates for the model. A different specification is presented in each table. We begin
with the simplest specification (Table 2) and move to the most general specification (Table 5).
In all specifications we measure the strategic hypotheses (tit-for-tat and club) using simple
dummy variables. In addition, we allow the strategic incentives to vary by the level of imports;
both linear and quadratic specifications are investigated. Moreover, in specifications B and D
(Tables 3 and 5) we allow the hypotheses to have different impacts for new or traditional users.
In all specifications we estimate (but do not report) year effects.
Finally, we note that in each table we report two sets of results, one based on data for all
years and the other based on data only for each country’s first three years of AD use. The
restricted dataset, including information only on each country’s first three years of AD activity,
was constructed in order to control for potential endogeneity problems with respect to our tit-
for-tat and club effect tests. The following example clarifies our concern.
Suppose that in 1981 the U.S. filed an AD case against Mexico. Next assume that
Mexico filed an AD case against the U.S. in 1983. According to our definitions we would say
Mexico’s filing was consistent with tit-for-tat (and also the club effect). Now, suppose that the
U.S. filed a case against Mexico in 1986. Once again, according to our definitions we would say
this filing is consistent with tit-for-tat (and the club effect). But, this tit-for-tat finding was the
result of Mexico responding to the U.S.’s earlier filing, and hence is endogenous. In this
scenario, our measures of the tit-for-tat and club effects would both be distorted by such
endogeneity. In an attempt to mitigate this potential problem, we chose to report statistics on
9 Miranda, Torres, and Ruiz (1998) suggest that small importers use AD more aggressively.
10 We also estimated using logit and found that the results are not significantly different.
Page 19

only the first three years of each country’s use of AD in addition to reporting results for the full
dataset.
Given that the results do differ somewhat across the two datasets we will need to keep in
mind that that the results based on the “first three years” data are probably best interpreted as
capturing the incentives during a country’s initial years of using AD. The results based on the
“all years” data should be interpreted as capturing a country’s long-run strategic use of AD.
Our most straightforward specification is presented in Table 2. In this specification we
constrain the strategic and economic motives to be the same for new and traditional users. The
non-linear nature of the probit estimates makes it difficult to easily interpret the economic
significance of the coefficients. Thus, to address the economic significance, we also calculate
the “change in probability” implied by the estimates and report these results within our
discussion below.11
In reviewing the results from our simplest specification, Specification A, as reported in
Table 2, we see first that almost all included variables are statistically significant. This result
holds true for the tests run on both datasets and for both the linear and quadratic forms of our
model. Importantly, there is support here for all four of our hypotheses, both strategic and
economic. The largest observed effect is from the “big supplier” hypothesis but both strategic
hypotheses receive considerable support in the data. Curiously, the “import surge” hypothesis,
measured by the impact of changes in import volumes, appears to have a significant negative
11 The “economic” impact estimates are not reported in the text for all regressions or variables.
They are available from the authors upon request.
Page 20

(albeit small) effect on AD use. This result appears in all specifications of our model and
suggests that our hypothesis related to import surges is not upheld in the data.12
Looking more closely at the impact of the strategic incentives, we note that the club
effect is relatively large. Across the four regressions reported in Table 2, AD club members are
about 15-20% more likely than non-club members to be investigated by other countries.13
Second, and surprisingly, the tit-for-tat (TFT) effect appears with the wrong sign in every
regression in this specification. Our hypotheses above suggested that TFT retaliation incentives
would increase the likelihood of AD actions and we therefore expected a positive coefficient on
this variable. We note, however, that the estimated TFT impact is quite small, lowering the
probability of being named by only about 1%.
The negative sign on the TFT variable is sufficiently curious to warrant further
investigation. In particular, it is possible that the unanticipated sign results from the fact that
Specification A does not allow new and traditional users to differ in their strategic and economic
incentives to use AD. If the two types of users do differ systematically in their filing patterns,
the parameters reported in Table 2 would reflect the weighted average of the traditional and new
users impact. Thus, the results from Specification A may be significantly skewed and may not
accurately capture either the strategic or economic incentives for AD use.
In Specifications B, C, and D we address this issue by allowing for separate new and
traditional user estimates. The three specifications incorporate different levels of variation
12 In later specifications (C and D, see below) we allow the economic impact parameters to vary
according to type of user (traditional versus new). In those specifications, the “percentage
change in imports” variable is still consistently estimated with a negative coefficient although
the measured effect is smaller and less significant for new users than for traditional users.
13 As is standard practice, evaluation of the club and TFT effects are done at the mean values of
all other exogenous variables. As we will discuss below, this average impact may not reflect the
impact at other points in the distribution.
Page 21
across the user types. In particular, in Specification B (Table 3) we allow the strategic effects to
vary by type of user but we hold the Bagwell-Staiger economic effects common across the users.
In Specification C we do the opposite, allowing the Bagwell-Staiger economic effects to vary by
type of user but holding the strategic effects common across users (Table 4). Finally, in
Specification D we allow all the parameters to vary by type of user (Table 5).
Given our interest in strategic filing issues, specification B (reported in Table 3) is our
preferred specification. As in Specification A, almost all of the parameters are statistically
significant. In particular, there is statistical support for all four AD use hypotheses. We also
see, as in Specification A, that there is strong support for the “big supplier” hypothesis and that
the effect of this parameter on one’s chance of being named in an AD case is quite large. At the
same time, the “import surge” hypothesis receives much weaker support and appears with the
wrong sign, as discussed above.
Importantly, distinguishing between new and traditional users in this specification allows
us to refine our understanding of tit-for-tat and club incentives. In particular, the estimates
indicate that the TFT incentive for traditional users ranges from moderate (in the all years
dataset) to strong (in the first three years dataset). Traditional users are between 0.5% and 5%
more likely to file AD cases against countries that have filed against them in the past. By
contrast, we find that the TFT effect of new users is consistently negative and strongly
significant in the first three years dataset. The change in probability in this case is small, but the
results indicate that new users are about 0.5% less likely to file against countries that had filed
against them (in the first three years or overall). These contrasting results suggest that our
concerns about the results in Specification A were justified and that it is important to estimate
separate effects for traditional and new users.
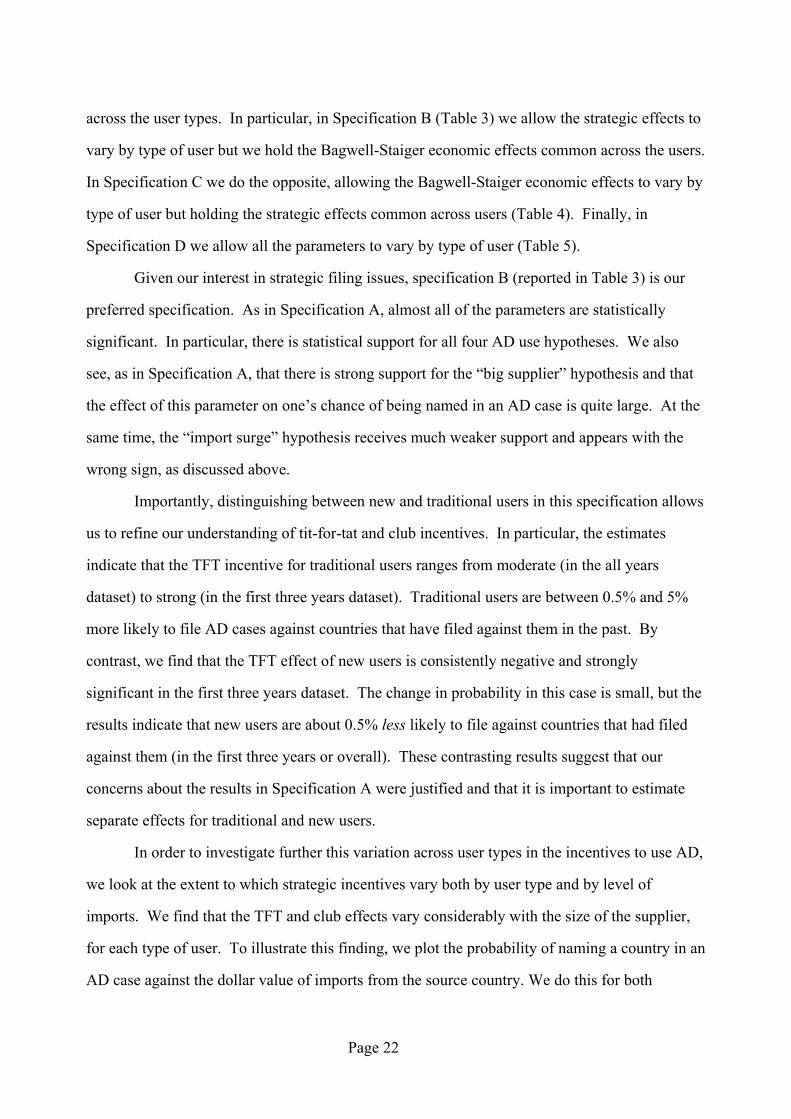
In order to investigate further this variation across user types in the incentives to use AD,
we look at the extent to which strategic incentives vary both by user type and by level of
imports. We find that the TFT and club effects vary considerably with the size of the supplier,
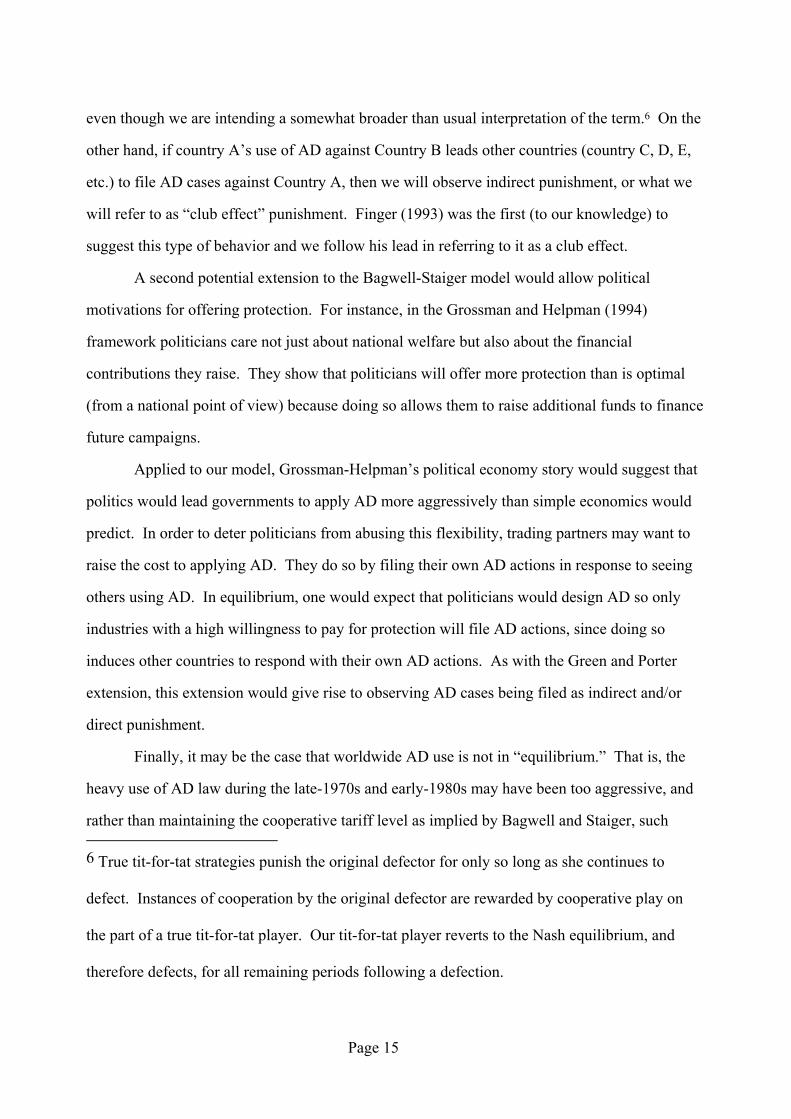
for each type of user. To illustrate this finding, we plot the probability of naming a country in an
AD case against the dollar value of imports from the source country. We do this for both
Page 22
traditional and new users for the linear version of our model for both the “all years” and “first
three years” datasets in Figures 3 through 6. For example, Figure 3 shows the estimated filing
behavior of traditional users using the linear specification and the “all years” dataset. In the
figure, we separately plot the incentive to name a country that is not a club member (“base”
curve), a country that is a club member, and a country that is a club member that has also used
AD against a traditional user.
Precisely as one would expect, we see in all of the plots in Figures 3 through 6 that the
probability of naming a country is increasing in imports. Exactly how the probability varies
depends, however, on the different strategic incentives. It also depends on the type of user under
consideration.
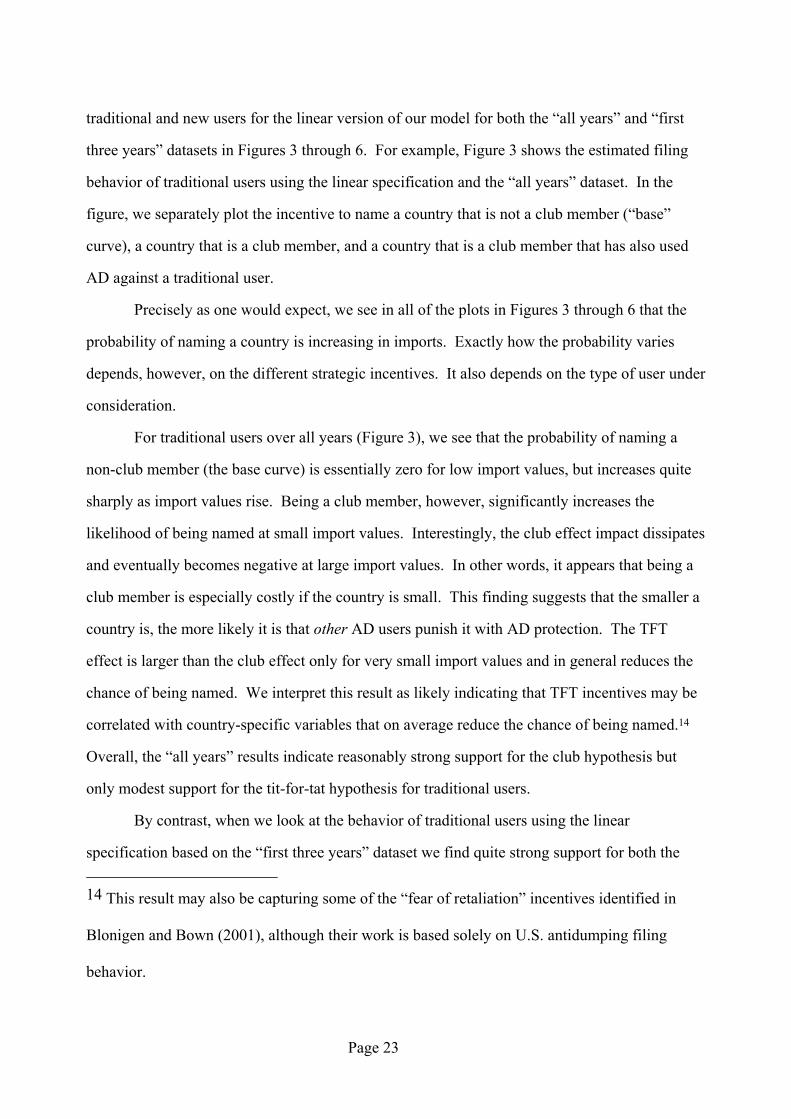
For traditional users over all years (Figure 3), we see that the probability of naming a
non-club member (the base curve) is essentially zero for low import values, but increases quite
sharply as import values rise. Being a club member, however, significantly increases the
likelihood of being named at small import values. Interestingly, the club effect impact dissipates
and eventually becomes negative at large import values. In other words, it appears that being a
club member is especially costly if the country is small. This finding suggests that the smaller a
country is, the more likely it is that other AD users punish it with AD protection. The TFT
effect is larger than the club effect only for very small import values and in general reduces the
chance of being named. We interpret this result as likely indicating that TFT incentives may be
correlated with country-specific variables that on average reduce the chance of being named.14
Overall, the “all years” results indicate reasonably strong support for the club hypothesis but
only modest support for the tit-for-tat hypothesis for traditional users.
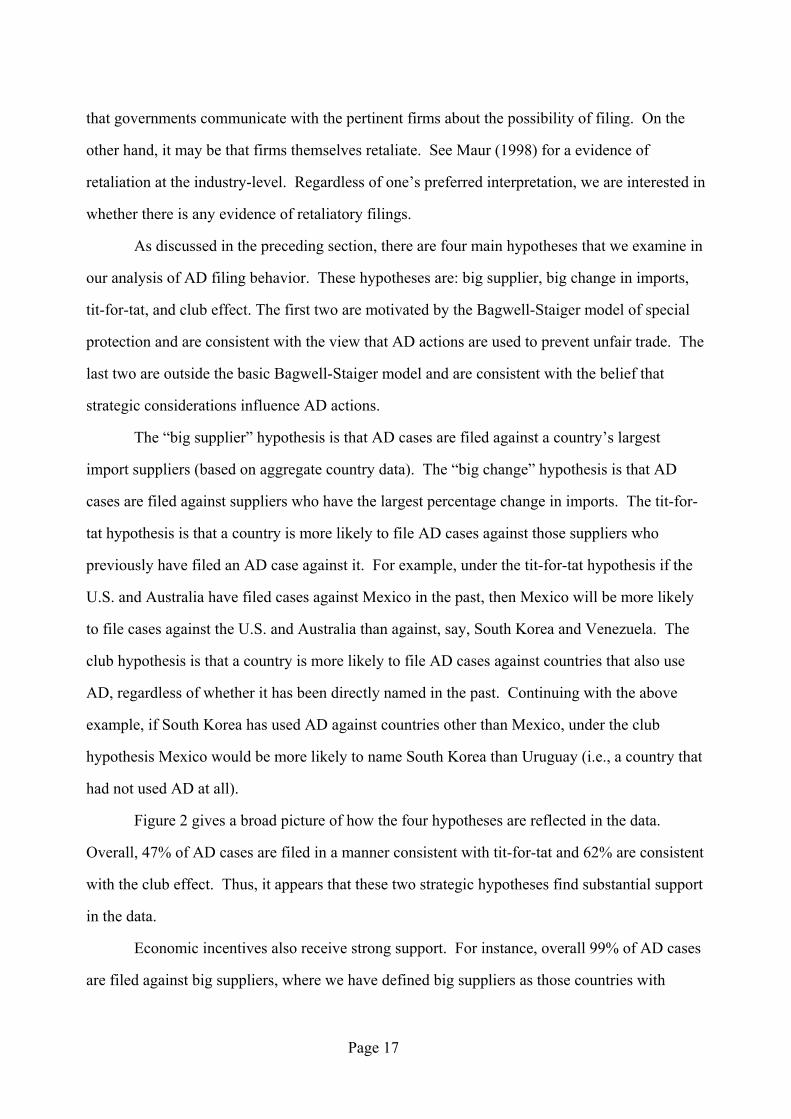
By contrast, when we look at the behavior of traditional users using the linear
specification based on the “first three years” dataset we find quite strong support for both the 14 This result may also be capturing some of the “fear of retaliation” incentives identified in
Blonigen and Bown (2001), although their work is based solely on U.S. antidumping filing
behavior.
Page 23

club and TFT hypotheses (Figure 4). For small import volumes, club and TFT each increase the
likelihood of being named by about 20 percentage points. To be precise, the tit-for-tat effect is
economically significant, increasing the likelihood of being named upwards of 30-40% (at low
import values). As we saw in Figure 3, club and TFT both dampen the import size effect for
large importers. Ultimately, beyond a critical size (about $27 million), TFT incentives do not
appear important; similar club incentives become unimportant beyond about $17 million.
Nevertheless, the estimates indicate that traditional users’ filing patterns in this restricted sample
are heavily influenced by strategic considerations.
In Figures 5 and 6 we look at the behavior of new users using the linear specification
based on the “all years” and “first three years” datasets, respectively. For new users, the two
figures tell very similar stories. For both datasets the club effect is economically large and
significant, increasing the likelihood of being investigated by about 20% at low import volumes.
As we saw was true for traditional users, this effect dissipates as import volume grows. For both
datasets we also find TFT incentives to be negative and small for the new users.
Combining the insights of all four figures, we conclude that traditional and new users do
have significantly different patterns of AD use. Thus, it appears that the probit results based on
Specification A are misleading because they constrain a single parameter to capture the
incentives of these two very different sets of users. New users appear to have a more
pronounced club effect and traditional users appear to be more influenced by tit-for-tat (at least
in the restricted sample). Finally, given the consistency of the results across new and traditional
users and across datasets, we believe that strategic considerations are outweighed by economic
factors in motivating AD cases filed against big suppliers.
Our third specification of the model, Specification C (reported in Table 4), allows the
parameters associated with the economic hypotheses to vary across users while constraining the
parameters associated with the strategic hypotheses to be the same for both new and traditional
users. As in the earlier specifications, we find considerable statistical significance for most
variables across both types of users. The exception is that the percentage change in import
parameters is insignificant for new users (and relatively small in magnitude for traditional
Page 24

users). Notice, however, that unlike the Specification B results in which we saw a clear
difference between new and traditional users in the strategic incentives, there is very little
difference here between the estimated impact of economic factors for the two types of users.
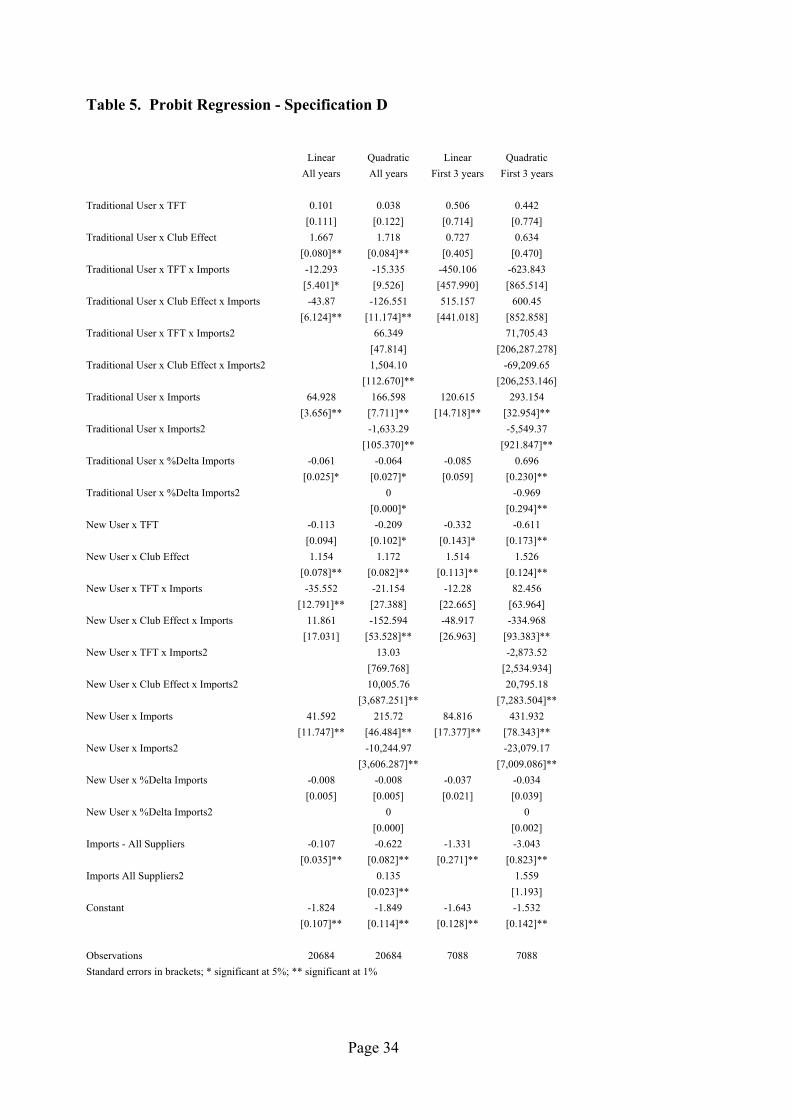
Finally, in specification D (Table 5) we allow both strategic and economic hypotheses to
vary by user. This is the most flexible specification, but we are a bit concerned that there is
insufficient variation among the exogenous variables. Thus, we may not be meaningfully
identifying the separate strategic and economic incentives. We note that the TFT impact
estimated here is very similar to that estimated in Specification B (Table 3). Namely, traditional
users filing patterns are consistently estimated to indicate the presence of positive club and TFT
incentives. Both effects increase the likelihood that traditional users will file AD actions. New
users demonstrate a strong club effect, but a very small TFT incentive. In other words, the club
effect is more pronounced for new users, but offsetting this stronger club effect is a negative tit-
for-tat effect.
5. Concluding Comments
The worldwide upsurge in AD use in the past two decades has begun to receive considerable
attention. Concerns have arisen in part because the increased antidumping activity is evident not
only in the number of cases filed annually but also in the range of countries now actively using
AD policies. With the intensified use of this WTO-legal protection comes a need to identify the
motives underlying the changes in patterns of behavior. In particular, it is increasingly difficult
to argue that the changes in AD use reflect only an increase in unfair trading behavior that has
taken hold since 1980.
Our findings suggest that antidumping use is not just about protecting domestic
industries from the unfair trade behavior of foreign entities. Although we find strong support for
the economic hypothesis that AD actions are directed at big suppliers, we find far weaker
evidence that AD actions are filed against importers with recent surges in their import volume.
If antidumping filings were primarily aimed at combating unfair trading practices, we would
Page 25

expect that suppliers with large import surges would generally be the targets of those filings.
Our evidence implies that this is not the case and that there are other incentives that play a
significant role in national use of AD policy.15
Following recent literature that suggests that strategic, particularly retaliatory, incentives
may play a role in AD use, we test for evidence of such behavior in case filings from the last two
decades. In our results, we find evidence of a strong strategic component in the use of AD
worldwide. Further, there seems to be ample evidence from our analysis that the traditional and
new users of AD employ the antidumping laws in different ways. We observe strong strategic
incentives for AD use particularly (but not exclusively) for traditional users, who show evidence
of using AD for both club effect and tit-for-tat reasons. New users have a more significant club
effect, but a negative tit-for-tat effect that mutes the club effect somewhat. In addition, our
results suggest that strategic considerations are outweighed by economic factors in motivating
AD cases filed against big suppliers.
Overall, our evidence is consistent with results beginning to be reported elsewhere in the
literature. The econometric evidence provided here bolsters the results of the non-parametric
tests performed in our earlier work (Prusa and Skeath, 2002), for example, and we find evidence
of the type of retaliatory behavior that Blonigen and Bown (2001) argue may reduce the
likelihood of U.S. AD cases being filed against certain countries. Indeed, we provide evidence
to support Messerlin and Reed’s (1995) contention that AD measures may be used as a form of
“disguised retaliation.” Our findings reject the notion that the rise in AD activity is solely
explained by an increase in unfair trading and support the view that strategic incentives play a
critical role in the motivation of individual countries to file AD complaints against their
suppliers.
15 In future research we are also interested in analyzing whether the patterns we find based on
filing data are confirmed in if we based our on duties levied or measures taken (i.e., an outcome
based measure of protection).
Page 26

References Bagwell, Kyle and Robert Staiger, “A Theory of Managed Trade,” American Economic Review
80 (1990): 779-95.
Blonigen, Bruce A. and Chad P. Bown, “Antidumping and Retaliation Threats,” NBER
Working Paper No. 8576, October 2001.
Boltuck, Richard and Robert E. Litan (eds.), Down in the Dumps: Administration of the Unfair
Trade Laws, Washington, DC: Brookings Institute, 1991.
Brander, James A. and Paul Krugman, “A ‘Reciprocal Dumping’ Model of International Trade,”
Journal of International Economics 15 (1983): 313-21.
Corden, W. Max, Trade Policy and Economic Welfare, Oxford: Clarendon Press, 1974.
Dixit, Avinash K., “Strategic Aspects of Trade Policy,” in Truman F. Bewley (ed.), Advances in
Economic Theory: Fifth World Congress, New York: Cambridge University Press, 1987,
329-62.
Ethier, Wilfred J., “Dumping,” Journal of Political Economy 90 (1982): 487-506.
Finger, J. Michael (ed.), Antidumping, Ann Arbor, MI: University of Michigan Press, 1993.
Finger, J. Michael and Kwok-Chiu Fung, “Will GATT Enforcement Control Antidumping?”,
Journal of Economic Integration 9 (1994): 198-213.
Finger, J. Michael, H. Keith Hall, and Douglas R. Nelson, “The Political Economy of
Administered Protection,” American Economic Review 72 (1982): 452-66.
Fischer, Ronald D. and Thomas J. Prusa, “Contingent Protection as Better Insurance,” Review of
International Economics 11 (2003): 758-769.
Green, Edward J. and Robert H. Porter, “Noncooperative Collusion Under Imperfect Price
Information,” Econometrica 52 (1984): 87-100.
Page 27

Grossman, Gene and Elhanan Helpman, “Protection for Sale,” American Economic Review 84
(1994): 833-50.
Hansen, Wendy and Thomas J. Prusa, “The Road Most Traveled: The Rise of Title VII
Protection,” The World Economy 18 (1995): 295-313.
________, “Cumulation and ITC Decision-Making: The Sum of the Parts is Greater than the
Whole,” Economic Inquiry 34 (1996): 746-69.
Hufbauer, Gary, “Antidumping: A Look at U.S. Experience – Lessons for Indonesia.” Report to
the Ministry of Industry and Trade, Republic of Indonesia,
http://www.iie.com/papers/hufbauer0899-1.htm, August 1999.
Hufbauer, Gary, and Kimberly Elliott, Measuring the Costs of Protection in the United States,
Washington, DC: Institute for International Economics, 1994.
Jensen, Richard and Marie Thursby, “Free Trade: Two Noncooperative Approaches.” Ohio
State University Working Paper, 1984.
Mastel, Greg, Antidumping Laws and the U.S. Economy, Armonk, NY: M.E. Sharpe, 1998.
Maur, Jean-Christophe, “Echoing antidumping cases: Regulatory competitors, imitation and
cascading protection,” World Competition, 21 (1998): 51-84.
Mayer, Wolfgang, “Theoretical Considerations on Negotiated Tariff Adjustments,” Oxford
Economic Papers 33 (1981): 135-53.
McDonald, Brian, The World Trading System: The Uruguay Round and Beyond, New York: St.
Martin’s Press, 1998.
Messerlin, Patrick A. and Geoffrey Reed, “Antidumping Policies in the United States and the
European Community,” The Economic Journal 105 (1995): 1565-75.
Miranda, Jorge, Raul A. Torres and Mario Ruiz, “The International Use of Antidumping: 1987-
1997,” Journal of World Trade 32 (1998): 5-71.
Page 28

Prusa, Thomas J., “Why Are So Many Antidumping Petitions Withdrawn?”, Journal of
International Economics 33 (1992): 1-20.
________, “On the Spread and Impact of Antidumping,” Canadian Journal of Economics 34
(2001): 591-611.
Prusa, Thomas J. and Susan Skeath, “The Economic and Strategic Motives for Antidumping
Filings,” Weltwirtschaftliches Archiv, 138 (2002): 389-413.
Riezman, Raymond, “Tariff Retaliation from a Strategic Viewpoint,” Southern Economic
Journal 48 (1982): 583-93.
Staiger, Robert W. and Frank A. Wolak, “The Effect of Domestic Antidumping Law in the
Presence of Foreign Monopoly,” Journal of International Economics 32 (1991): 265-87.
Page 29

Table 1. Antidumping Activity: 1980s vs. 1990s
Percent of total AD
cases (worldwide) 1980-89 1990-98
Year country began using AD
(GATT/WTO reports)
No. AD actions against country prior to the
adoption of own AD statuteUSA 28.2% 16.4% --- --- Australia 25.5% 16.0% --- --- Canada 21.3% 6.5% --- --- EU 19.8% 14.6% --- --- New Zealand 0.7% 2.4% --- --- Finland 1.4% 0.1% --- --- Mexico 2.6% 7.8% 1987 10 South Korea 0.4% 2.6% 1985 39 Brazil 0.1% 5.5% 1988 55 Argentina 6.3% 1991 16 South Africa 6.1% 1994 20 India 4.2% 1992 16 Turkey 1.6% 1993 15 Colombia 1.2% 1991 4 Poland 1.2% 1991 43 Israel 1.1% 1993 13 Indonesia 1.1% 1996 31 Venezuela 1.0% 1993 18 Peru 0.9% 1994 1 Malaysia 0.7% 1995 32 Philippines 0.7% 1993 9 Chile 0.5% 1993 5 Egypt 0.3% 1997 7 Thailand 0.3% 1993 35 Costa Rica 0.3% 1996 1 Trin-Tobago 0.2% 1996 3 Japan 0.2% 1991 164 Czechoslovakia 0.1% 1998 69 Nicaragua 0.1% 1998 2 Panama 0.1% 1998 0 Singapore 0.1% 1994 34 Ecuador 0.1% 1998 2 Guatemala 0.1% 1996 0 TOTAL # 1401 2113
Page 30
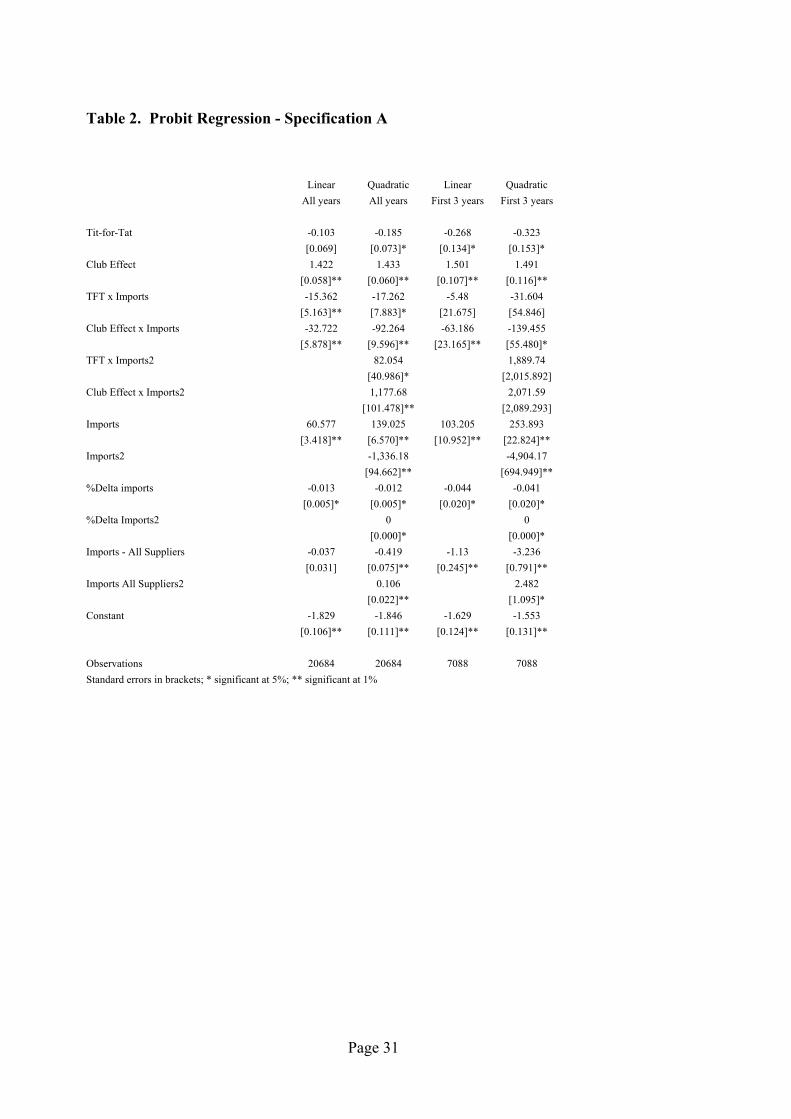
Table 2. Probit Regression - Specification A
Linear Quadratic Linear Quadratic All years All years First 3 years First 3 years Tit-for-Tat -0.103 -0.185 -0.268 -0.323 [0.069] [0.073]* [0.134]* [0.153]* Club Effect 1.422 1.433 1.501 1.491 [0.058]** [0.060]** [0.107]** [0.116]** TFT x Imports -15.362 -17.262 -5.48 -31.604 [5.163]** [7.883]* [21.675] [54.846] Club Effect x Imports -32.722 -92.264 -63.186 -139.455 [5.878]** [9.596]** [23.165]** [55.480]* TFT x Imports2 82.054 1,889.74 [40.986]* [2,015.892] Club Effect x Imports2 1,177.68 2,071.59 [101.478]** [2,089.293] Imports 60.577 139.025 103.205 253.893 [3.418]** [6.570]** [10.952]** [22.824]** Imports2 -1,336.18 -4,904.17 [94.662]** [694.949]** %Delta imports -0.013 -0.012 -0.044 -0.041 [0.005]* [0.005]* [0.020]* [0.020]* %Delta Imports2 0 0 [0.000]* [0.000]* Imports - All Suppliers -0.037 -0.419 -1.13 -3.236 [0.031] [0.075]** [0.245]** [0.791]** Imports All Suppliers2 0.106 2.482 [0.022]** [1.095]* Constant -1.829 -1.846 -1.629 -1.553 [0.106]** [0.111]** [0.124]** [0.131]** Observations 20684 20684 7088 7088 Standard errors in brackets; * significant at 5%; ** significant at 1%
Page 31
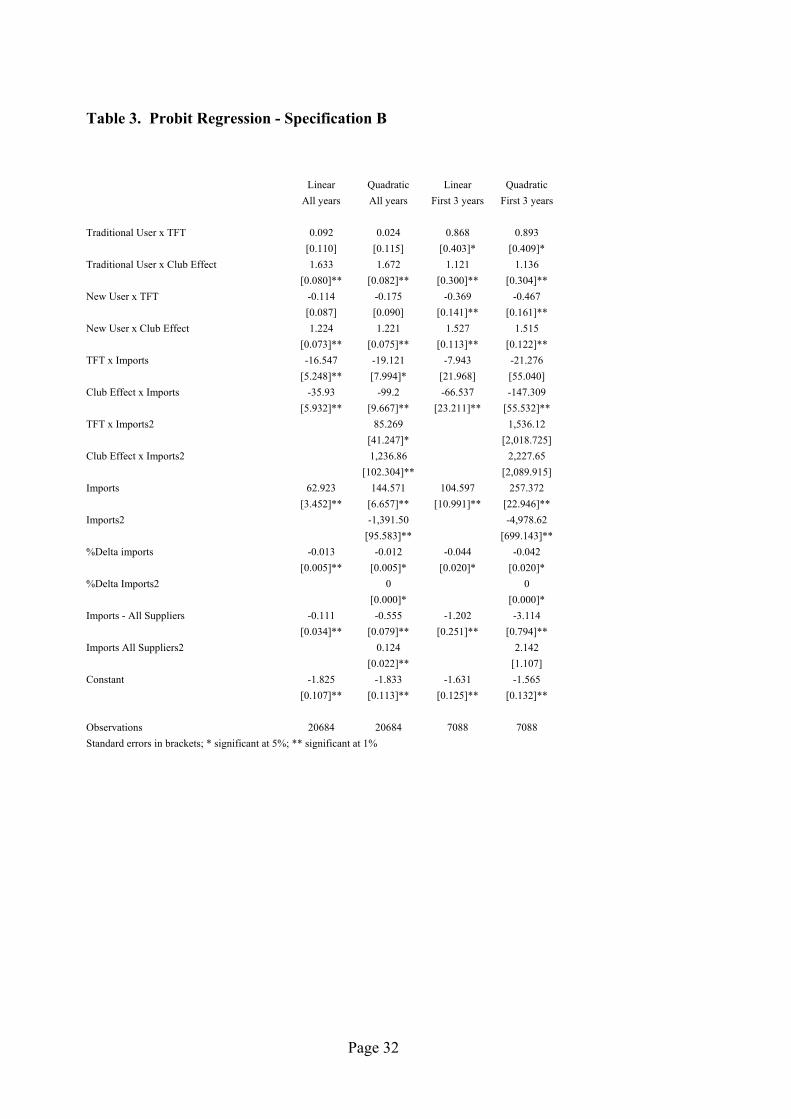
Table 3. Probit Regression - Specification B
Linear Quadratic Linear Quadratic All years All years First 3 years First 3 years Traditional User x TFT 0.092 0.024 0.868 0.893 [0.110] [0.115] [0.403]* [0.409]* Traditional User x Club Effect 1.633 1.672 1.121 1.136 [0.080]** [0.082]** [0.300]** [0.304]** New User x TFT -0.114 -0.175 -0.369 -0.467 [0.087] [0.090] [0.141]** [0.161]** New User x Club Effect 1.224 1.221 1.527 1.515 [0.073]** [0.075]** [0.113]** [0.122]** TFT x Imports -16.547 -19.121 -7.943 -21.276 [5.248]** [7.994]* [21.968] [55.040] Club Effect x Imports -35.93 -99.2 -66.537 -147.309 [5.932]** [9.667]** [23.211]** [55.532]** TFT x Imports2 85.269 1,536.12 [41.247]* [2,018.725] Club Effect x Imports2 1,236.86 2,227.65 [102.304]** [2,089.915] Imports 62.923 144.571 104.597 257.372 [3.452]** [6.657]** [10.991]** [22.946]** Imports2 -1,391.50 -4,978.62 [95.583]** [699.143]** %Delta imports -0.013 -0.012 -0.044 -0.042 [0.005]** [0.005]* [0.020]* [0.020]* %Delta Imports2 0 0 [0.000]* [0.000]* Imports - All Suppliers -0.111 -0.555 -1.202 -3.114 [0.034]** [0.079]** [0.251]** [0.794]** Imports All Suppliers2 0.124 2.142 [0.022]** [1.107] Constant -1.825 -1.833 -1.631 -1.565 [0.107]** [0.113]** [0.125]** [0.132]** Observations 20684 20684 7088 7088 Standard errors in brackets; * significant at 5%; ** significant at 1%
Page 32

Table 4. Probit Regression - Specification C Linear Quadratic Linear Quadratic All years All years First 3 years First 3 years Tit-for-Tat -0.105 -0.169 -0.239 -0.531 [0.069] [0.074]* [0.136] [0.167]** Club Effect 1.422 1.422 1.466 1.444 [0.058]** [0.060]** [0.107]** [0.117]** TFT x Imports -15.377 -17.089 -16.553 77.365 [5.179]** [8.064]* [22.458] [63.465] Club Effect x Imports -32.605 -91.968 -32.839 -222.225 [5.894]** [9.679]** [26.418] [83.002]** TFT x Imports2 91.023 -2,900.63 [40.954]* [2,573.625] Club Effect x Imports2 1,221.62 13,050.37 [102.898]** [6,149.566]* Traditional User x Imports 60.54 145.988 125.591 308.348 [3.446]** [6.936]** [14.159]** [32.491]** Traditional User x Imports2 -1,411.83 -5,955.52 [97.939]** [915.737]** Traditional User x %Delta Imports -0.051 -0.052 -0.086 0.68 [0.022]* [0.024]* [0.060] [0.229]** Traditional User x %Delta Imports2 0 -0.966 [0.000] [0.295]** New User x Imports 60.309 128.926 72.991 336.01 [4.303]** [7.678]** [16.780]** [67.138]** New User x Imports2 -1,392.98 -15,861.96 [103.353]** [5,857.828]** New User x %Delta Imports -0.008 -0.008 -0.036 -0.034 [0.005] [0.005] [0.021] [0.039] New User x %Delta Imports2 0 0 [0.000] [0.002] Imports - All Suppliers -0.032 -0.461 -1.28 -3.002 [0.032] [0.077]** [0.264]** [0.817]** Imports All Suppliers2 0.108 1.536 [0.022]** [1.180] Constant -1.825 -1.848 -1.656 -1.554 [0.106]** [0.112]** [0.128]** [0.143]** Observations 20684 20684 7088 7088 Standard errors in brackets; * significant at 5%; ** significant at 1%
Page 33
Page 34
Table 5. Probit Regression - Specification D Linear Quadratic Linear Quadratic All years All years First 3 years First 3 years Traditional User x TFT 0.101 0.038 0.506 0.442 [0.111] [0.122] [0.714] [0.774] Traditional User x Club Effect 1.667 1.718 0.727 0.634 [0.080]** [0.084]** [0.405] [0.470] Traditional User x TFT x Imports -12.293 -15.335 -450.106 -623.843 [5.401]* [9.526] [457.990] [865.514] Traditional User x Club Effect x Imports -43.87 -126.551 515.157 600.45 [6.124]** [11.174]** [441.018] [852.858] Traditional User x TFT x Imports2 66.349 71,705.43 [47.814] [206,287.278] Traditional User x Club Effect x Imports2 1,504.10 -69,209.65 [112.670]** [206,253.146] Traditional User x Imports 64.928 166.598 120.615 293.154 [3.656]** [7.711]** [14.718]** [32.954]** Traditional User x Imports2 -1,633.29 -5,549.37 [105.370]** [921.847]** Traditional User x %Delta Imports -0.061 -0.064 -0.085 0.696 [0.025]* [0.027]* [0.059] [0.230]** Traditional User x %Delta Imports2 0 -0.969 [0.000]* [0.294]** New User x TFT -0.113 -0.209 -0.332 -0.611 [0.094] [0.102]* [0.143]* [0.173]** New User x Club Effect 1.154 1.172 1.514 1.526 [0.078]** [0.082]** [0.113]** [0.124]** New User x TFT x Imports -35.552 -21.154 -12.28 82.456 [12.791]** [27.388] [22.665] [63.964] New User x Club Effect x Imports 11.861 -152.594 -48.917 -334.968 [17.031] [53.528]** [26.963] [93.383]** New User x TFT x Imports2 13.03 -2,873.52 [769.768] [2,534.934] New User x Club Effect x Imports2 10,005.76 20,795.18 [3,687.251]** [7,283.504]** New User x Imports 41.592 215.72 84.816 431.932 [11.747]** [46.484]** [17.377]** [78.343]** New User x Imports2 -10,244.97 -23,079.17 [3,606.287]** [7,009.086]** New User x %Delta Imports -0.008 -0.008 -0.037 -0.034 [0.005] [0.005] [0.021] [0.039] New User x %Delta Imports2 0 0 [0.000] [0.002] Imports - All Suppliers -0.107 -0.622 -1.331 -3.043 [0.035]** [0.082]** [0.271]** [0.823]** Imports All Suppliers2 0.135 1.559 [0.023]** [1.193] Constant -1.824 -1.849 -1.643 -1.532 [0.107]** [0.114]** [0.128]** [0.142]** Observations 20684 20684 7088 7088 Standard errors in brackets; * significant at 5%; ** significant at 1%

65
149
169
166
186
170
128
119
122
96
165
228
320
297
234
156
224
243
246
050100
150
200
250
300
350
1980
1982
1984
1986
1988
1990
1992
1994
1996
1998
Number of Antidumping Complaints
0%10%
20%
30%
40%
50%
60%
70%
Percent Filed by New Users
Figu
re 1
. Wor
ldw
ide
Use
of A
ntid
umpi
ng, 1
980-
1998

56%
80%
96%
43%
44%
56%
100%
58%
47%
62%
99%
54%
0%20%
40%
60%
80%
100%
Tit-f
or-T
atC
lub
Effe
ctBi
g Su
pplie
r%
Cha
nge
Impo
rts
New
Use
rsTr
aditi
onal
Use
rsAl
l Use
rs
Figu
re 2
. AD
act
ions
con
sist
ent w
ith a
ltern
ativ
e hy
poth
eses

0.00
7.50
15.0
022
.50
30.0
037
.50
45.0
00%20%
40%
60%
80%
100%
Impo
rts fr
om S
ourc
e C
ount
ry (m
illio
ns $
)
Bas
eTr
aditi
onal
Use
r - C
lub
Effe
ctTr
aditi
onal
Use
r - C
lub
Effe
ct &
TFT
Figu
re 3
- Tr
aditi
onal
Use
rs (S
peci
ficat
ion
B, A
ll Ye
ars)

0.00
7.50
15.0
022
.50
30.0
037
.50
45.0
00%20%
40%
60%
80%
100%
Impo
rts fr
om S
ourc
e C
ount
ry (m
illio
ns $
)
Bas
eTr
aditi
onal
Use
r - C
lub
Effe
ctTr
aditi
onal
Use
r - C
lub
Effe
ct &
TFT
Figu
re 4
- Tr
aditi
onal
Use
rs (S
peci
ficat
ion
B, F
irst T
hree
Yea
rs)

0.00
7.50
15.0
022
.50
30.0
037
.50
45.0
00%20%
40%
60%
80%
100%
Impo
rts fr
om S
ourc
e C
ount
ry (m
illio
ns $
)
Bas
eN
ew U
ser -
Clu
b Ef
fect
New
Use
r - C
lub
Effe
ct &
TFT
Figu
re 5
- N
ew U
sers
(Spe
cific
atio
n B,
All
Year
s)

0.00
7.50
15.0
022
.50
30.0
037
.50
45.0
00%20%
40%
60%
80%
100%
Impo
rts fr
om S
ourc
e C
ount
ry (m
illio
ns $
)
Bas
eN
ew U
ser -
Clu
b Ef
fect
New
Use
r - C
lub
Effe
ct &
TFT
Figu
re 6
- N
ew U
sers
(Spe
cific
atio
n B,
Firs
t Thr
ee Y
ears
)