Embed Size (px)
Citation preview
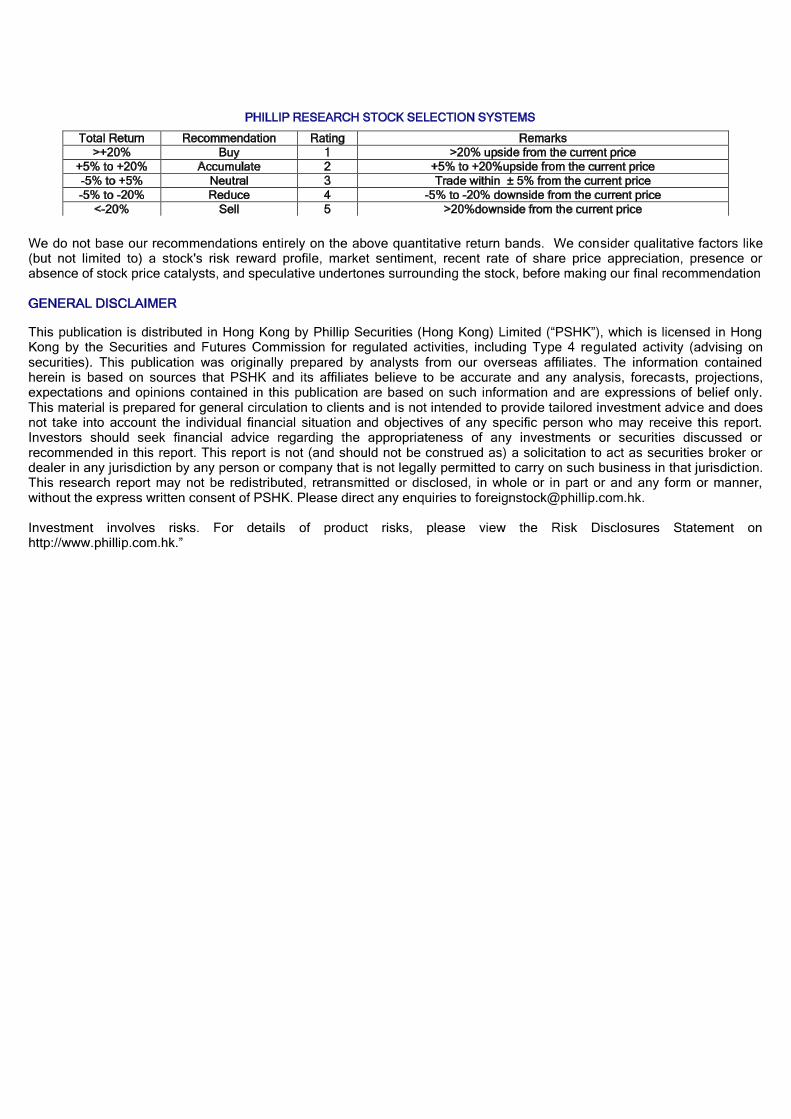
THAILAND EQUITY RESEARCH
Page | 1 | PHILLIP SECURITIES (THAILAND)
Thanachart Capital Loan and earnings look gloom in 4QF15
THAILAND | SET | BANK | COMPANY PREVIEW BLOOMBERG TCAP TB l REUTERS TCAP.BK
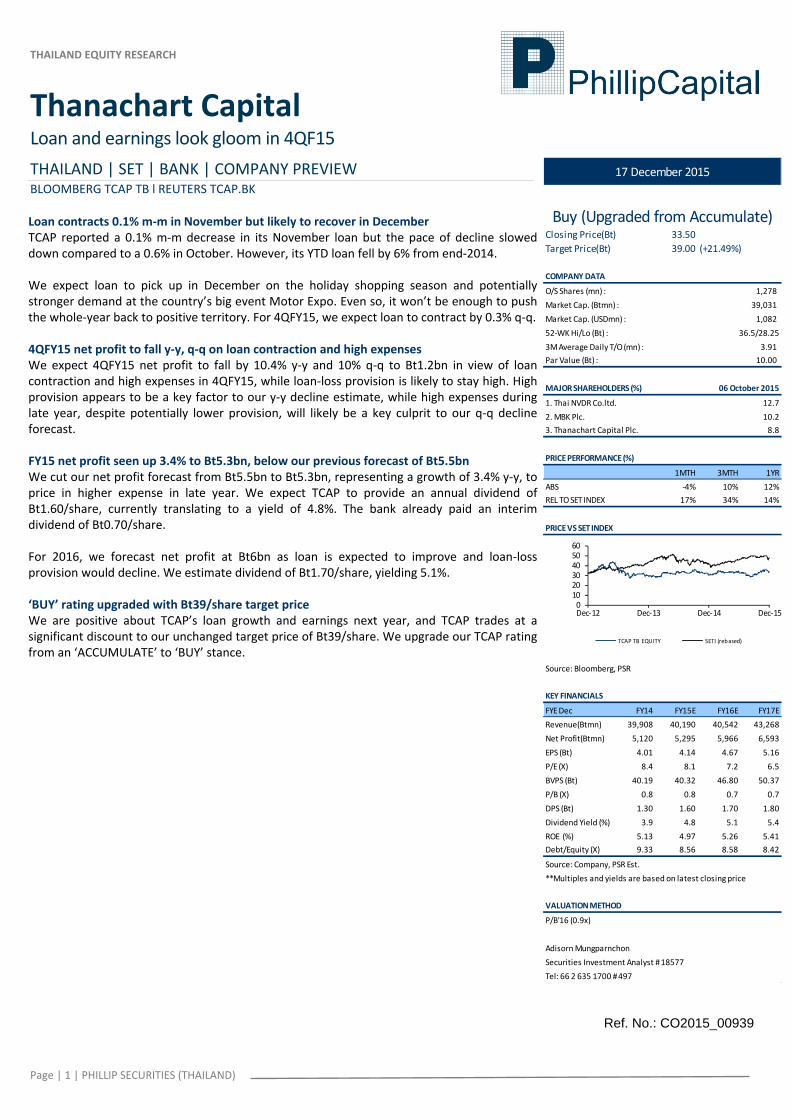
Loan contracts 0.1% m‐m in November but likely to recover in December TCAP reported a 0.1% m‐m decrease in its November loan but the pace of decline slowed down compared to a 0.6% in October. However, its YTD loan fell by 6% from end‐2014. We expect loan to pick up in December on the holiday shopping season and potentially stronger demand at the country’s big event Motor Expo. Even so, it won’t be enough to push the whole‐year back to positive territory. For 4QFY15, we expect loan to contract by 0.3% q‐q. 4QFY15 net profit to fall y‐y, q‐q on loan contraction and high expenses We expect 4QFY15 net profit to fall by 10.4% y‐y and 10% q‐q to Bt1.2bn in view of loan contraction and high expenses in 4QFY15, while loan‐loss provision is likely to stay high. High provision appears to be a key factor to our y‐y decline estimate, while high expenses during late year, despite potentially lower provision, will likely be a key culprit to our q‐q decline forecast. FY15 net profit seen up 3.4% to Bt5.3bn, below our previous forecast of Bt5.5bn We cut our net profit forecast from Bt5.5bn to Bt5.3bn, representing a growth of 3.4% y‐y, to price in higher expense in late year. We expect TCAP to provide an annual dividend of Bt1.60/share, currently translating to a yield of 4.8%. The bank already paid an interim dividend of Bt0.70/share. For 2016, we forecast net profit at Bt6bn as loan is expected to improve and loan‐loss provision would decline. We estimate dividend of Bt1.70/share, yielding 5.1%. ‘BUY’ rating upgraded with Bt39/share target price We are positive about TCAP’s loan growth and earnings next year, and TCAP trades at a significant discount to our unchanged target price of Bt39/share. We upgrade our TCAP rating from an ‘ACCUMULATE’ to ‘BUY’ stance.
Ref. No.: CO2015_00939
Closing Price(Bt) 33.50
Target Price(Bt) 39.00 (+21.49%)
COMPANY DATA
O/S Shares (mn) : 1,278
Market Cap. (Btmn) :
Market Cap. (USDmn) :
52‐WK Hi/Lo (Bt) : 36.5/28.25
3M Average Daily T/O (mn) : 3.91
Par Value (Bt) : 10.00
MAJOR SHAREHOLDERS (%)
1. Thai NVDR Co.ltd. 12.7
2. MBK Plc. 10.2
3. Thanachart Capital Plc. 8.8
PRICE PERFORMANCE (%)
1MTH 3MTH 1YR
ABS ‐4% 10% 12%
REL TO SET INDEX 17% 34% 14%
PRICE VS SET INDEX
Source: Bloomberg, PSR
KEY FINANCIALS
FYE Dec FY14 FY15E FY16E FY17E
Revenue(Btmn) 39,908 40,190 40,542 43,268
Net Profit(Btmn) 5,120 5,295 5,966 6,593
EPS (Bt) 4.01 4.14 4.67 5.16
P/E (X) 8.4 8.1 7.2 6.5
BVPS (Bt) 40.19 40.32 46.80 50.37
P/B (X) 0.8 0.8 0.7 0.7
DPS (Bt) 1.30 1.60 1.70 1.80
Dividend Yield (%) 3.9 4.8 5.1 5.4
ROE (%) 5.13 4.97 5.26 5.41
Debt/Equity (X) 9.33 8.56 8.58 8.42
Source: Company, PSR Est.
**Multiples and yields are based on latest closing price
VALUATION METHOD
P/B'16 (0.9x)
Adisorn Mungparnchon
Securities Investment Analyst # 18577
Tel: 66 2 635 1700 # 497
39,031
1,082
06 October 2015
Buy (Upgraded from Accumulate)
17 December 2015
0102030405060
Dec‐12 Dec‐13 Dec‐14 Dec‐15
TCAP TB EQUITY SETI (rebased)
THAILAND EQUITY RESEARCH
PHILLIP SECURITIESS (THAILAND) | 2 | P a g e
Thanachart Capital COMPANY PREVIEW
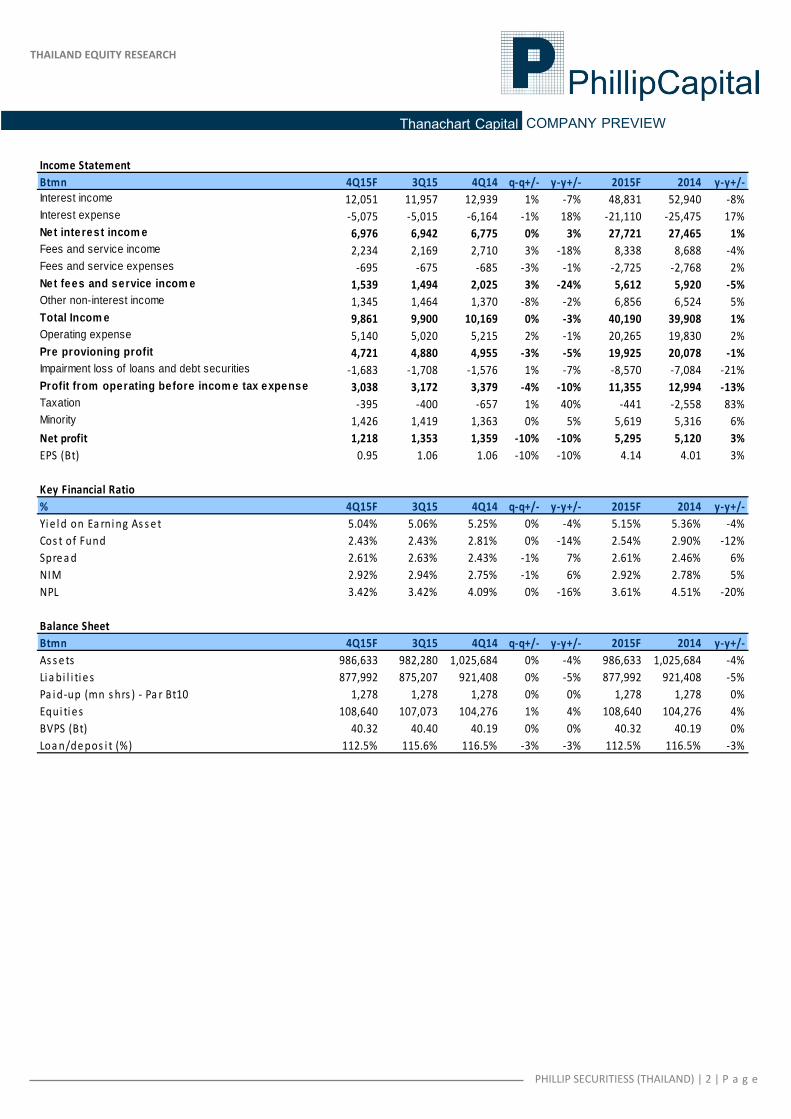
Income Statement
Btmn 4Q15F 3Q15 4Q14 q‐q+/‐ y‐y+/‐ 2015F 2014 y‐y+/‐Interest income 12,051 11,957 12,939 1% ‐7% 48,831 52,940 ‐8%Interest expense ‐5,075 ‐5,015 ‐6,164 ‐1% 18% ‐21,110 ‐25,475 17%Net interest incom e 6,976 6,942 6,775 0% 3% 27,721 27,465 1%Fees and service income 2,234 2,169 2,710 3% ‐18% 8,338 8,688 ‐4%Fees and service expenses ‐695 ‐675 ‐685 ‐3% ‐1% ‐2,725 ‐2,768 2%Net fees and service incom e 1,539 1,494 2,025 3% ‐24% 5,612 5,920 ‐5%Other non-interest income 1,345 1,464 1,370 ‐8% ‐2% 6,856 6,524 5%Total Incom e 9,861 9,900 10,169 0% ‐3% 40,190 39,908 1%Operating expense 5,140 5,020 5,215 2% ‐1% 20,265 19,830 2%Pre provioning profit 4,721 4,880 4,955 ‐3% ‐5% 19,925 20,078 ‐1%Impairment loss of loans and debt securities ‐1,683 ‐1,708 ‐1,576 1% ‐7% ‐8,570 ‐7,084 ‐21%Profit from operating before incom e tax expense 3,038 3,172 3,379 ‐4% ‐10% 11,355 12,994 ‐13%Taxation ‐395 ‐400 ‐657 1% 40% ‐441 ‐2,558 83%Minority 1,426 1,419 1,363 0% 5% 5,619 5,316 6%
Net profit 1,218 1,353 1,359 ‐10% ‐10% 5,295 5,120 3%
EPS (Bt) 0.95 1.06 1.06 ‐10% ‐10% 4.14 4.01 3%
Key Financial Ratio
% 4Q15F 3Q15 4Q14 q‐q+/‐ y‐y+/‐ 2015F 2014 y‐y+/‐
Yie ld on Ea rning As s e t 5.04% 5.06% 5.25% 0% ‐4% 5.15% 5.36% ‐4%
Cos t of Fund 2.43% 2.43% 2.81% 0% ‐14% 2.54% 2.90% ‐12%
Spread 2.61% 2.63% 2.43% ‐1% 7% 2.61% 2.46% 6%
NIM 2.92% 2.94% 2.75% ‐1% 6% 2.92% 2.78% 5%
NPL 3.42% 3.42% 4.09% 0% ‐16% 3.61% 4.51% ‐20%
Balance Sheet
Btmn 4Q15F 3Q15 4Q14 q‐q+/‐ y‐y+/‐ 2015F 2014 y‐y+/‐
As s e ts 986,633 982,280 1,025,684 0% ‐4% 986,633 1,025,684 ‐4%
Lia bi l i ti e s 877,992 875,207 921,408 0% ‐5% 877,992 921,408 ‐5%
Pa id ‐up (mn s hrs ) ‐ Pa r Bt10 1,278 1,278 1,278 0% 0% 1,278 1,278 0%
Equi ti e s 108,640 107,073 104,276 1% 4% 108,640 104,276 4%
BVPS (Bt) 40.32 40.40 40.19 0% 0% 40.32 40.19 0%
Loan/depos i t (%) 112.5% 115.6% 116.5% ‐3% ‐3% 112.5% 116.5% ‐3%
THAILAND EQUITY RESEARCH
PHILLIP SECURITIESS (THAILAND) | 3 | P a g e
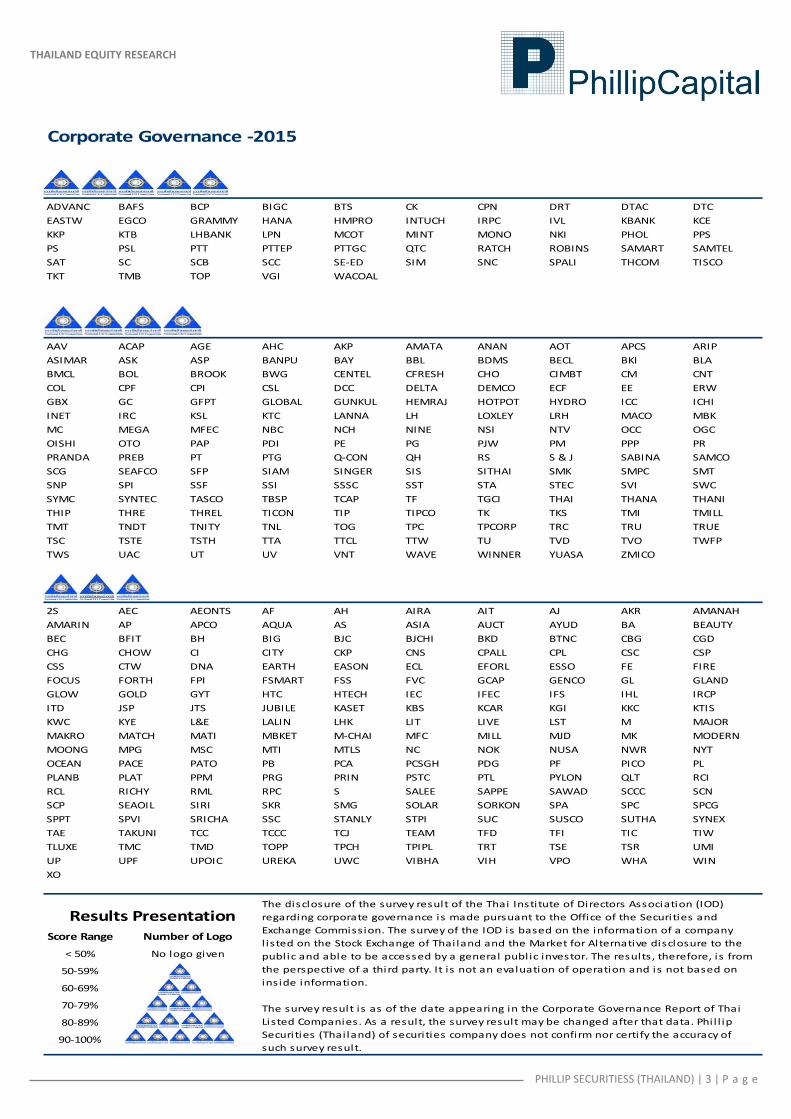
Corporate Governance ‐2015
ADVANC BAFS BCP BIGC BTS CK CPN DRT DTAC DTC
EASTW EGCO GRAMMY HANA HMPRO INTUCH IRPC IVL KBANK KCE
KKP KTB LHBANK LPN MCOT MINT MONO NKI PHOL PPS
PS PSL PTT PTTEP PTTGC QTC RATCH ROBINS SAMART SAMTEL
SAT SC SCB SCC SE‐ED SIM SNC SPALI THCOM TISCO
TKT TMB TOP VGI WACOAL
AAV ACAP AGE AHC AKP AMATA ANAN AOT APCS ARIP
ASIMAR ASK ASP BANPU BAY BBL BDMS BECL BKI BLA
BMCL BOL BROOK BWG CENTEL CFRESH CHO CIMBT CM CNT
COL CPF CPI CSL DCC DELTA DEMCO ECF EE ERW
GBX GC GFPT GLOBAL GUNKUL HEMRAJ HOTPOT HYDRO ICC ICHI
INET IRC KSL KTC LANNA LH LOXLEY LRH MACO MBK
MC MEGA MFEC NBC NCH NINE NSI NTV OCC OGC
OISHI OTO PAP PDI PE PG PJW PM PPP PR
PRANDA PREB PT PTG Q‐CON QH RS S & J SABINA SAMCO
SCG SEAFCO SFP SIAM SINGER SIS SITHAI SMK SMPC SMT
SNP SPI SSF SSI SSSC SST STA STEC SVI SWC
SYMC SYNTEC TASCO TBSP TCAP TF TGCI THAI THANA THANI
THIP THRE THREL TICON TIP TIPCO TK TKS TMI TMILL
TMT TNDT TNITY TNL TOG TPC TPCORP TRC TRU TRUE
TSC TSTE TSTH TTA TTCL TTW TU TVD TVO TWFP
TWS UAC UT UV VNT WAVE WINNER YUASA ZMICO
2S AEC AEONTS AF AH AIRA AIT AJ AKR AMANAH
AMARIN AP APCO AQUA AS ASIA AUCT AYUD BA BEAUTY
BEC BFIT BH BIG BJC BJCHI BKD BTNC CBG CGD
CHG CHOW CI CITY CKP CNS CPALL CPL CSC CSP
CSS CTW DNA EARTH EASON ECL EFORL ESSO FE FIRE
FOCUS FORTH FPI FSMART FSS FVC GCAP GENCO GL GLAND
GLOW GOLD GYT HTC HTECH IEC IFEC IFS IHL IRCP
ITD JSP JTS JUBILE KASET KBS KCAR KGI KKC KTIS
KWC KYE L&E LALIN LHK LIT LIVE LST M MAJOR
MAKRO MATCH MATI MBKET M‐CHAI MFC MILL MJD MK MODERN
MOONG MPG MSC MTI MTLS NC NOK NUSA NWR NYT
OCEAN PACE PATO PB PCA PCSGH PDG PF PICO PL
PLANB PLAT PPM PRG PRIN PSTC PTL PYLON QLT RCI
RCL RICHY RML RPC S SALEE SAPPE SAWAD SCCC SCN
SCP SEAOIL SIRI SKR SMG SOLAR SORKON SPA SPC SPCG
SPPT SPVI SRICHA SSC STANLY STPI SUC SUSCO SUTHA SYNEX
TAE TAKUNI TCC TCCC TCJ TEAM TFD TFI TIC TIW
TLUXE TMC TMD TOPP TPCH TPIPL TRT TSE TSR UMI
UP UPF UPOIC UREKA UWC VIBHA VIH VPO WHA WIN
XO
Score Range
< 50%
50‐59%
60‐69%
70‐79%
80‐89%
90‐100%
The disclosure of the survey result of the Thai Institute of Directors Association (IOD)
regarding corporate governance is made pursuant to the Office of the Securities and
Exchange Commission. The survey of the IOD is based on the information of a company
l isted on the Stock Exchange of Thailand and the Market for Alternative disclosure to the
public and able to be accessed by a general public investor. The results, therefore, is from
the perspective of a third party. It is not an evaluation of operation and is not based on
inside information.
The survey result is as of the date appearing in the Corporate Governance Report of Thai
Listed Companies. As a result, the survey result may be changed after that data. Phil l ip
Securities (Thailand) of securities company does not confirm nor certify the accuracy of
such survey result.
No logo given
Number of Logo
Results Presentation

THAILAND EQUITY RESEARCH
PHILLIP SECURITIESS (THAILAND) | 4 | P a g e
Industry Group Name Sector Name Sector Index
Agro & Food Industry[AGRO] Agribusiness AGRI
Food & Beverage FOOD
Consumer Products[CONSUMP] Fashion FASHION
Home & Office Products HOME
Personal Products & Pharmaceuticals PERSON
Financials [FINCIAL] Banking BANK
Finance & Securities FIN
Insurance INSUR
Industrials [INDUS] Automotive AUTO
Industrial Materials & Machinery IMM
Packaging PKG
Paper & Printing Materials PAPER
Petrochemicals & Chemicals PETRO
Steel STEEL
Property & Construction[PROPCON] Construction Materials CONMAT
Construction Services CONS
Property Development PROP
Property Fund & REITs PF&REIT
Resources [RESOURC] Energy & Util ities ENERG
Mining MINE
Services [SERVICE] Commerce COMM
Media & Publishing MEDIA
Health Care Services HELTH
Tourism & Leisure TOURISM
Professional Services PROF
Transportation & Logistics TRANS
Technology [TECH] Electronic Components ETRON
Information & Communication Technology ICT
PSR Rating SystemCapital Gain Recommendation
> 15% BUY
> 5% ‐ 15% ACCUMULATE / TRADING BUY
> 0% ‐ 5% NEUTRAL
0 <= SELL
Remarks
We do not base our recommendations entirely on the above quantitative return bands. We consider qualitative factors l ike (but
not l imited to) a stock's risk reward profi le, market sentiment, recent rate of share price appreciation, presence or absence of
stock price catalysts, and speculative undertones surrounding the stock, before making our final recommendation
22776846