Embed Size (px)
Citation preview
THAILAND EQUITY RESEARCH
Page | 1 | PHILLIP SECURITIES (THAILAND)
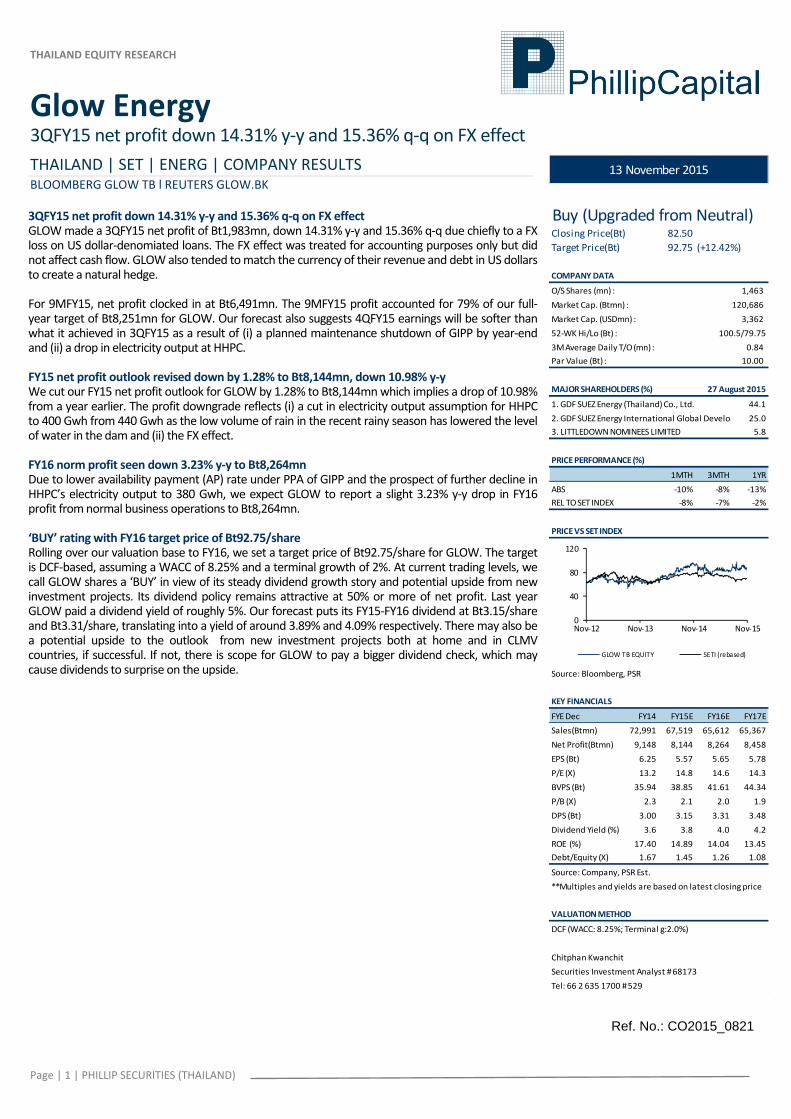
Glow Energy
3QFY15 net profit down 14.31% y‐y and 15.36% q‐q on FX effect
THAILAND | SET | ENERG | COMPANY RESULTS BLOOMBERG GLOW TB l REUTERS GLOW.BK
3QFY15 net profit down 14.31% y‐y and 15.36% q‐q on FX effect GLOW made a 3QFY15 net profit of Bt1,983mn, down 14.31% y‐y and 15.36% q‐q due chiefly to a FX loss on US dollar‐denomiated loans. The FX effect was treated for accounting purposes only but did not affect cash flow. GLOW also tended to match the currency of their revenue and debt in US dollars to create a natural hedge. For 9MFY15, net profit clocked in at Bt6,491mn. The 9MFY15 profit accounted for 79% of our full‐year target of Bt8,251mn for GLOW. Our forecast also suggests 4QFY15 earnings will be softer than what it achieved in 3QFY15 as a result of (i) a planned maintenance shutdown of GIPP by year‐end and (ii) a drop in electricity output at HHPC. FY15 net profit outlook revised down by 1.28% to Bt8,144mn, down 10.98% y‐y We cut our FY15 net profit outlook for GLOW by 1.28% to Bt8,144mn which implies a drop of 10.98% from a year earlier. The profit downgrade reflects (i) a cut in electricity output assumption for HHPC to 400 Gwh from 440 Gwh as the low volume of rain in the recent rainy season has lowered the level of water in the dam and (ii) the FX effect. FY16 norm profit seen down 3.23% y‐y to Bt8,264mn Due to lower availability payment (AP) rate under PPA of GIPP and the prospect of further decline in HHPC’s electricity output to 380 Gwh, we expect GLOW to report a slight 3.23% y‐y drop in FY16 profit from normal business operations to Bt8,264mn. ‘BUY’ rating with FY16 target price of Bt92.75/share Rolling over our valuation base to FY16, we set a target price of Bt92.75/share for GLOW. The target is DCF‐based, assuming a WACC of 8.25% and a terminal growth of 2%. At current trading levels, we call GLOW shares a ‘BUY’ in view of its steady dividend growth story and potential upside from new investment projects. Its dividend policy remains attractive at 50% or more of net profit. Last year GLOW paid a dividend yield of roughly 5%. Our forecast puts its FY15‐FY16 dividend at Bt3.15/share and Bt3.31/share, translating into a yield of around 3.89% and 4.09% respectively. There may also be a potential upside to the outlook from new investment projects both at home and in CLMV countries, if successful. If not, there is scope for GLOW to pay a bigger dividend check, which may cause dividends to surprise on the upside.
Ref. No.: CO2015_0821
Closing Price(Bt) 82.50
Target Price(Bt) 92.75 (+12.42%)
COMPANY DATA
O/S Shares (mn) : 1,463
Market Cap. (Btmn) :
Market Cap. (USDmn) :
52‐WK Hi/Lo (Bt) : 100.5/79.75
3M Average Daily T/O (mn) : 0.84
Par Value (Bt) : 10.00
MAJOR SHAREHOLDERS (%)
1. GDF SUEZ Energy (Thailand) Co., Ltd. 44.1
2. GDF SUEZ Energy International Global Develop 25.0
3. LITTLEDOWN NOMINEES LIMITED 5.8
PRICE PERFORMANCE (%)
1MTH 3MTH 1YR
ABS ‐10% ‐8% ‐13%
REL TO SET INDEX ‐8% ‐7% ‐2%
PRICE VS SET INDEX
Source: Bloomberg, PSR
KEY FINANCIALS
FYE Dec FY14 FY15E FY16E FY17E
Sales(Btmn) 72,991 67,519 65,612 65,367
Net Profit(Btmn) 9,148 8,144 8,264 8,458
EPS (Bt) 6.25 5.57 5.65 5.78
P/E (X) 13.2 14.8 14.6 14.3
BVPS (Bt) 35.94 38.85 41.61 44.34
P/B (X) 2.3 2.1 2.0 1.9
DPS (Bt) 3.00 3.15 3.31 3.48
Dividend Yield (%) 3.6 3.8 4.0 4.2
ROE (%) 17.40 14.89 14.04 13.45
Debt/Equity (X) 1.67 1.45 1.26 1.08
Source: Company, PSR Est.
**Multiples and yields are based on latest closing price
VALUATION METHOD
DCF (WACC: 8.25%; Terminal g:2.0%)
Chitphan Kwanchit
Securities Investment Analyst # 68173
Tel: 66 2 635 1700 # 529
13 November 2015
120,686
3,362
27 August 2015
Buy (Upgraded from Neutral)
0
40
80
120
Nov‐12 Nov‐13 Nov‐14 Nov‐15
GLOW TB EQUITY SETI (rebased)

THAILAND EQUITY RESEARCH
PHILLIP SECURITIESS (THAILAND) | 2 | P a g e
Glow Energy COMPANY RESULTS
Income Statement
Btmn 3Q15 2Q15 3Q14 q‐q+/‐ y‐y+/‐ 9M15 9M14 y‐y+/‐
Sa le s and s e rvi ces 17,584 17,020 17,721 3% ‐1% 49,614 55,564 ‐11%
Cos ts of s a l e s 13,260 12,771 13,820 4% ‐4% 38,313 43,257 ‐11%
Gross profit 4,323 4,249 3,901 2% 11% 11,301 12,307 ‐8%
Se l l i ng expenses 0 0 0 n.m. n.m. 0 0 n.m.
Admini s tra ti ve expenses 169 198 177 ‐14% ‐5% 502 534 ‐6%
Operating profit 4,154 4,051 3,724 3% 12% 10,799 11,773 ‐8%
Other i ncome 23 22 22 4% 5% 77 248 ‐69%
Ga in/los s from a ffi l i a te s 0 0 0 21% 33% 0 0 10%
Other expense 4 1 1 151% 147% 7 5 39%
EBIT 4,174 4,072 3,744 2% 11% 10,869 12,017 ‐10%
Inte re s t expense 738 771 837 ‐4% ‐12% 2,297 2,554 ‐10%
EBT 3,435 3,301 2,907 4% 18% 8,572 9,463 ‐9%
Ta xa ti on 248 228 210 8% 18% 900 814 11%
EAT 3,188 3,072 2,698 4% 18% 7,671 8,648 ‐11%
Minori ty 194 441 426 ‐56% ‐55% 946 1,472 ‐36%
Net profit before extra 2,994 2,631 2,271 14% 32% 6,726 7,177 ‐6%
Extraordina ry i tems ‐1,011 ‐288 43 ‐251% n.m. ‐232 249 ‐193%
Net profit 1,983 2,343 2,314 ‐15% ‐14% 6,494 7,425 ‐13%
EPS (Bt) 1.36 1.60 1.58 ‐15% ‐14% 4.44 5.08 ‐13%
Key Financial Ratio
% 3Q15 2Q15 3Q14 q‐q+/‐ y‐y+/‐ 9M15 9M14 y‐y+/‐
Cos t of s a l e s /s a l e s 75.41% 75.04% 77.99% 1% ‐3% 77.22% 77.85% ‐1%
SG&A exp/s a le s 0.96% 1.16% 1.00% ‐17% ‐4% 1.01% 0.96% 5%
Gros s margin 24.59% 24.96% 22.01% ‐2% 12% 22.78% 22.15% 3%
Opera ting profi t ma rgin 23.63% 23.80% 21.01% ‐1% 12% 21.77% 21.19% 3%
Net profi t margin 11.28% 13.77% 13.06% ‐18% ‐14% 13.09% 13.36% ‐2%
Balance Sheet
Btmn 3Q15 2Q15 3Q14 q‐q+/‐ y‐y+/‐ 9M15 9M14 y‐y+/‐
As s e ts 118,233 117,089 122,735 1% ‐4% 118,233 122,735 ‐4%
Lia bi l i ti e s 63,806 62,907 71,443 1% ‐11% 63,806 71,443 ‐11%
Pa id ‐up (mn s hrs ) ‐ Pa r Bt10 1,463 1,463 1,463 0% 0% 1,463 1,463 0%
Equi ti e s 54,427 54,182 51,292 0% 6% 54,427 51,292 6%
BVPS (Bt) 37.21 37.04 35.06 0% 6% 37.21 35.06 6%
Debt/equi ty (x) 1.2 1.2 1.4 1% ‐16% 1.2 1.4 ‐16%
THAILAND EQUITY RESEARCH
PHILLIP SECURITIESS (THAILAND) | 3 | P a g e
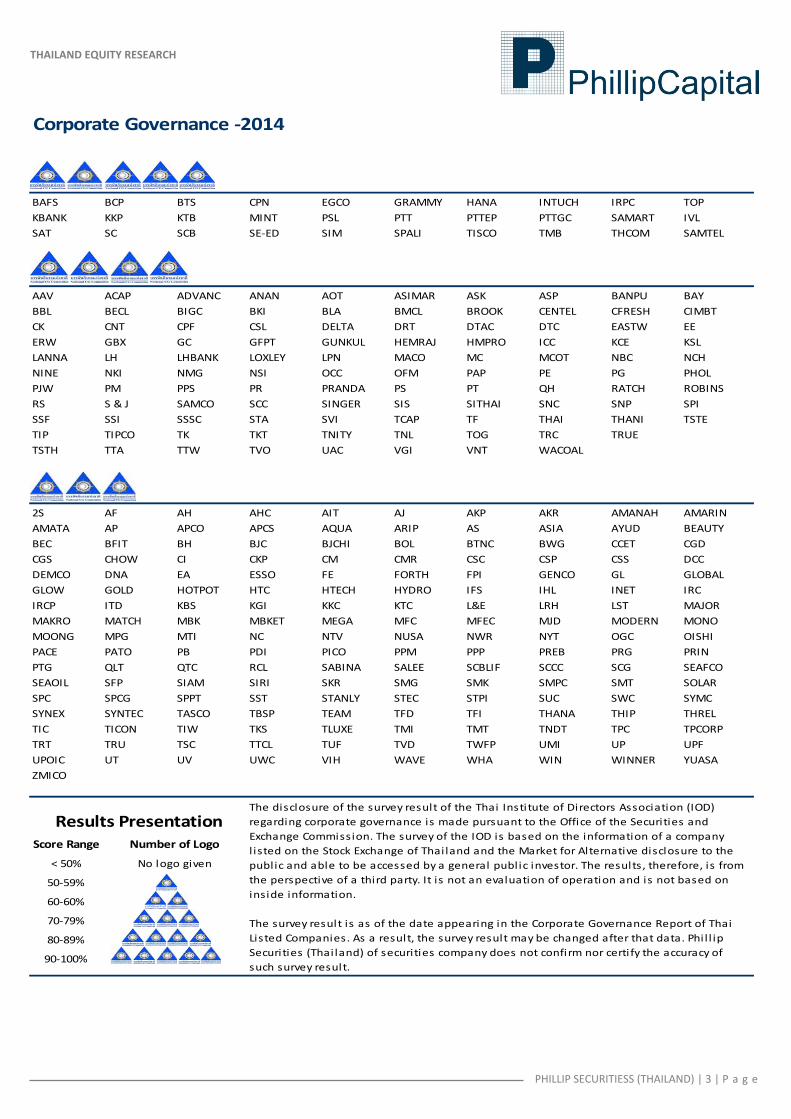
Corporate Governance ‐2014
BAFS BCP BTS CPN EGCO GRAMMY HANA INTUCH IRPC TOP
KBANK KKP KTB MINT PSL PTT PTTEP PTTGC SAMART IVL
SAT SC SCB SE‐ED SIM SPALI TISCO TMB THCOM SAMTEL
AAV ACAP ADVANC ANAN AOT ASIMAR ASK ASP BANPU BAY
BBL BECL BIGC BKI BLA BMCL BROOK CENTEL CFRESH CIMBT
CK CNT CPF CSL DELTA DRT DTAC DTC EASTW EE
ERW GBX GC GFPT GUNKUL HEMRAJ HMPRO ICC KCE KSL
LANNA LH LHBANK LOXLEY LPN MACO MC MCOT NBC NCH
NINE NKI NMG NSI OCC OFM PAP PE PG PHOL
PJW PM PPS PR PRANDA PS PT QH RATCH ROBINS
RS S & J SAMCO SCC SINGER SIS SITHAI SNC SNP SPI
SSF SSI SSSC STA SVI TCAP TF THAI THANI TSTE
TIP TIPCO TK TKT TNITY TNL TOG TRC TRUE
TSTH TTA TTW TVO UAC VGI VNT WACOAL
2S AF AH AHC AIT AJ AKP AKR AMANAH AMARIN
AMATA AP APCO APCS AQUA ARIP AS ASIA AYUD BEAUTY
BEC BFIT BH BJC BJCHI BOL BTNC BWG CCET CGD
CGS CHOW CI CKP CM CMR CSC CSP CSS DCC
DEMCO DNA EA ESSO FE FORTH FPI GENCO GL GLOBAL
GLOW GOLD HOTPOT HTC HTECH HYDRO IFS IHL INET IRC
IRCP ITD KBS KGI KKC KTC L&E LRH LST MAJOR
MAKRO MATCH MBK MBKET MEGA MFC MFEC MJD MODERN MONO
MOONG MPG MTI NC NTV NUSA NWR NYT OGC OISHI
PACE PATO PB PDI PICO PPM PPP PREB PRG PRIN
PTG QLT QTC RCL SABINA SALEE SCBLIF SCCC SCG SEAFCO
SEAOIL SFP SIAM SIRI SKR SMG SMK SMPC SMT SOLAR
SPC SPCG SPPT SST STANLY STEC STPI SUC SWC SYMC
SYNEX SYNTEC TASCO TBSP TEAM TFD TFI THANA THIP THREL
TIC TICON TIW TKS TLUXE TMI TMT TNDT TPC TPCORP
TRT TRU TSC TTCL TUF TVD TWFP UMI UP UPF
UPOIC UT UV UWC VIH WAVE WHA WIN WINNER YUASA
ZMICO
Score Range
< 50%
50‐59%
60‐60%
70‐79%
80‐89%
90‐100%
The disclosure of the survey result of the Thai Institute of Directors Association (IOD)
regarding corporate governance is made pursuant to the Office of the Securities and
Exchange Commission. The survey of the IOD is based on the information of a company
l isted on the Stock Exchange of Thai land and the Market for Alternative disclosure to the
public and able to be accessed by a general public investor. The results, therefore, is from
the perspective of a third party. It is not an evaluation of operation and is not based on
inside information.
The survey result is as of the date appearing in the Corporate Governance Report of Thai
Listed Companies. As a result, the survey result may be changed after that data. Phil l ip
Securities (Thai land) of securities company does not confirm nor certify the accuracy of
such survey result.
No logo given
Number of Logo
Results Presentation
THAILAND EQUITY RESEARCH
PHILLIP SECURITIESS (THAILAND) | 4 | P a g e
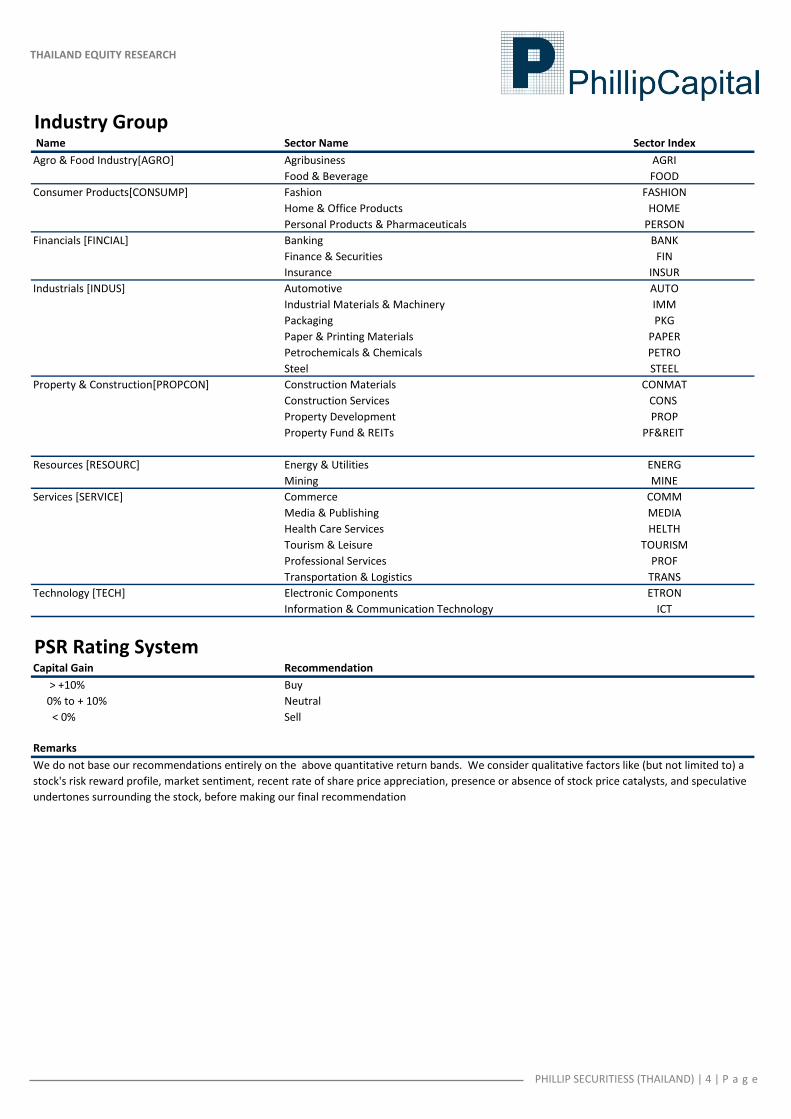
Industry Group Name Sector Name Sector Index
Agro & Food Industry[AGRO] Agribusiness AGRI
Food & Beverage FOOD
Consumer Products[CONSUMP] Fashion FASHION
Home & Office Products HOME
Personal Products & Pharmaceuticals PERSON
Financials [FINCIAL] Banking BANK
Finance & Securities FIN
Insurance INSUR
Industrials [INDUS] Automotive AUTO
Industrial Materials & Machinery IMM
Packaging PKG
Paper & Printing Materials PAPER
Petrochemicals & Chemicals PETRO
Steel STEEL
Property & Construction[PROPCON] Construction Materials CONMAT
Construction Services CONS
Property Development PROP
Property Fund & REITs PF&REIT
Resources [RESOURC] Energy & Utilities ENERG
Mining MINE
Services [SERVICE] Commerce COMM
Media & Publishing MEDIA
Health Care Services HELTH
Tourism & Leisure TOURISM
Professional Services PROF
Transportation & Logistics TRANS
Technology [TECH] Electronic Components ETRON
Information & Communication Technology ICT
PSR Rating SystemCapital Gain Recommendation
> +10% Buy
0% to + 10% Neutral
< 0% Sell
Remarks
We do not base our recommendations entirely on the above quantitative return bands. We consider qualitative factors like (but not limited to) a
stock's risk reward profile, market sentiment, recent rate of share price appreciation, presence or absence of stock price catalysts, and speculative
undertones surrounding the stock, before making our final recommendation
22776846