Embed Size (px)
Citation preview

Education andTraining
Education and Training Monitor 2017
Lithuania

Europe Direct is a service to help you find answers to your questions about the European Union.
Freephone number (*):00 800 6 7 8 9 10 11
(*) The information given is free, as are most calls (though some operators, phone boxes or hotels may charge you).
More information on the European Union is available on the internet (http://europa.eu).Cataloguing data can be found at the end of this publication.
Luxembourg: Publications Office of the European Union, 2017
© European Union, 2017Reuse is authorised provided the source is acknowledged. The reuse policy of European Commission documents is regulated by Decision 2011/833/EU (OJ L 330, 14.12.2011, p. 39).For any use or reproduction of photos or other material that is not under the EU copyright, permission must be sought directly from the copyright holders.
PDF ISBN 978-92-79-70022-4 - ISSN 2466-9997 - DOI 10.2766/681540 - NC-AN-17-022-EN-N
Cover image: © Shutterstock.com
EUROPEAN COMMISSION 1
2017 Directorate-General for Education and Culture EN
Education and Training Monitor 2017
Lithuania

2 LATVIA
Education and Training Monitor 2017 – Country analysis November 2017
Volume 2 of the Education and Training Monitor 2017 includes twenty-eight individual country reports. It builds on the most up-to-date quantitative and qualitative evidence to present and assess the main recent and ongoing policy measures in each EU Member State, with a focus on
developments since mid-2016. It therefore complements other sources of information which offer descriptions of national education and training systems. Section 1 presents a statistical overview of the main education and training indicators. Section 2 briefly identifies the main strengths and challenges of the country’s education and training system. Section 3 focuses on drivers of inequalities in education and measures to promote inclusion, building in particular on evidence from the OECD's 2015 Programme for International Skills
Assessment (PISA), as well as recent developments in early school leaving and early childhood education and care. Section 4 looks at investment in education and training. Section 5 deals with policies to modernise school education, covering, inter alia, the teaching profession, digital and language skills. Section 6 discusses measures to modernise higher education. Finally, section 7 covers vocational education and adult learning.
The manuscript was completed on 15 September 2017. Additional contextual data can be found online (ec.europa.eu/education/monitor)

LITHUANIA 3
Education and Training Monitor 2017 – Country analysis November 2017
1. Key indicators
Sources: Eurostat (see section 9 for more details); OECD (PISA). Notes: data refer to weighted EU average, covering a different
numbers of Member States depending on the source; b = break in time series, d = definition differs, e = estimated, p =
provisional, u = low reliability, 12 = 2012, 14 = 2014, 15 = 2015. On learning mobility, the EU average is calculated by DG
EAC based on available country data in all years. Further information is found in the respective section of Volume 1 (ec.europa.eu/education/monitor).
Figure 1. Position in relation to strongest (outer ring) and weakest performers (centre)
Source: DG Education and Culture calculations, based on data from Eurostat (LFS 2016) and OECD (PISA 2015). Note: all
scores are set between a maximum (the strongest performers visualised by the outer ring) and a minimum (the weakest
performers visualised by the centre of the figure).
2013 2016 2013 2016
6.3% 4.8% 11.9% 10.7%
51.3% 58.7% 37.1% 39.1%
84.8% 12 90.8% 15 93.9% 12 94.8% 15
21.2% 12 25.1% 15 17.8% 12 19.7% 15
26.0% 12 25.4% 15 22.1% 12 22.2% 15
16.1% 12 24.7% 15 16.6% 12 20.6% 15
ISCED 3-8 (total) 75.5% 82.4% 75.4% 78.2%
5.9% 6.0% 10.7% 10.8%
5.6% 5.4% 15 5.0% 4.9% 15
ISCED 1-2 €3 582 €3 729 14 : : 14
ISCED 3-4 €4 446 €4 364 14 : : 14
ISCED 5-8 €6 418 €7 362 14 : : 14
6.3% 4.8% 11.0% 9.8%
: : 21.9% 19.7%
51.0% 58.2% 37.8% 39.9%
: : 33.4% 35.3%
63.2% 70.3% 69.4% 72.6%
84.6% 91.1% 80.7% 82.8%
1.2% 1.0% 15 5.5% 6.0% 15
2.2% 5.3% 15 13.6% 15.1% 15Learning mobility
Inbound graduates mobility (bachelor)
Inbound graduates mobility (master)
Early leavers from education and
training (age 18-24)
Native-born
Foreign-born
Tertiary educational attainment
(age 30-34)
Native-born
Foreign-born
Employment rate of recent graduates
by educational attainment
(age 20-34 having left education 1-3
years before reference year)
ISCED 3-4
ISCED 5-8
Employment rate of recent graduates
by educational attainment
(age 20-34 having left education 1-3
years before reference year)
Adult participation in learning
(age 25-64)ISCED 0-8 (total)
Other contextual indicators
Education investment
Public expenditure on education
as a percentage of GDP
Expenditure on public
and private institutions
per student in € PPS
Tertiary educational attainment
(age 30-34)Total
Early childhood education and care (ECEC)
(from age 4 to starting age of compulsory education)
Proportion of 15 year-olds with
underachievement in:
Reading
Maths
Science
Early leavers from education and
training (age 18-24)Total
Lithuania EU average
ET 2020 benchmarks

4 LITHUANIA
Education and Training Monitor 2017 – Country analysis November 2017
2. Highlights
Depopulation due to demographic trends and emigration is a big challenge for the
efficiency of spending in education. In this context, low participation of adults in lifelong learning is a concern.
Key challenges in early childhood education and care are to expand participation and to
establish a system of external quality assurance.
Large disparities between schools in urban centres and rural regions affect funding levels, quality of infrastructure, quality of teaching and, ultimately, educational outcomes.
The set-up of the working conditions for teachers is having a negative effect both on the quality of teaching and the supply of young teachers to the profession.
The higher education sector delivers the highest tertiary education attainment in the EU,
but there is evidence of quality and efficiency challenges. These are expected to be addressed by major reforms.
3. Tackling inequalities and promoting inclusion
There is stagnation in educational outcomes, as evidenced by international surveys. According to the OECD Programme for International Student Assessment (PISA) 2015, the performance of Lithuanian 15-year-olds in mathematics, reading and science was below the EU
average, which continues a general trend from 2009. Compared to 2012, in 2015 the proportion of low achievers increased in science and reading and remained broadly unchanged in mathematics — just above 25 % and above the EU average of 22.1 %. Between 2012 and 2015 the share of top
performers decreased and remained well below 10 % across the board, suggesting that excellence is not being adequately fostered1. Around 15 % of students are low achievers in all PISA domains, which makes them likely to face serious problems in their further education and work, and later in
life. The performance gap between girls and boys narrowed in science and reading over the reference period, while it remained more or less unchanged in mathematics.
Socioeconomic status and school location play a big role in student performance. The extent of educational inequality is highlighted by PISA 2015, which found that 38.8 % of students in the bottom socioeconomic quartile fail to meet basic reading skills (compared with 11.9 % for students in the top socioeconomic quartile). The source of this disadvantage lies mainly in the large differences in performance between urban centres and rural regions. PISA 2015 shows that the difference between children studying in rural and urban areas is 57 points in science, 65 points in
reading and 53 points in mathematics2. The results of the OECD’s survey of adult skills (PIAAC) highlighted the concentration of highly skilled adults in Vilnius, who scored higher in literacy, numeracy and digital problem-solving than adults in smaller cities and rural areas.
Participation in early childhood education and care (ECEC) has been increasing, but the large urban-rural disparity in enrolment rates is not diminishing. In 2015, 90.8 % of pupils aged between 4 years old and the starting age of compulsory education attended pre-school and
pre-primary education, up from 86.5 % in 2013 but still below the EU average of 94.8 %.The national target of 95 % participation by 2020 could be still attained thanks to a new measure in place since September 2016 making a pre-primary education programme of a minimum of 640 hours compulsory for all 6-year-olds. (Ministry of Education and Science 2016). The marked disparity in enrolment rates between urban and rural areas — 45 % and 12.3 % respectively for children under 3 years old and 98.2 % and 47.6 % for 4-6-year-olds in 2015 (Statistics Lithuania 2016) — poses a serious policy challenge. One solution has been to encourage more municipalities
1 6.9 % in maths, 4.4 % in reading and 4.2 % in science (PISA 2015). 2 30 points in PISA correspond to around one year of schooling.

LITHUANIA 5
Education and Training Monitor 2017 – Country analysis November 2017
to offer transportation services, including through European Structural and Investment Funds (ESIF)-financed projects. As a result, the share of municipalities providing transport to ECEC facilities increased from 67 % in 2012 to 88 % in 2014 (Education Supply Centre 2015).
Quality assurance of institutions offering ECEC is insufficient, even though the child-teacher ratio in ECEC is low. In 2014, there were 7 children per contact staff and 10 children per teaching staff, both of which are lower than the OECD averages of 11 and 14 respectively (OECD 2016a). However, due to the lack of external evaluation mechanisms, there is a lack of comparable data on the quality of ECEC institutions, carers and teachers, which could drive improvement (National Audit Office 2016).
Rates of early school leaving (ESL) are traditionally low and declining. Low participation in early childhood education and care is not translating into high ESL rates. With an ESL rate of 4.8 %, Lithuania is the second best performer in the EU in 2016 (after Croatia) and is below the EU average of 10.7 %. When broken down by gender and school location, the early school leaving rate
is highest among boys from rural areas (12.5 %).
4. Investing in education and training
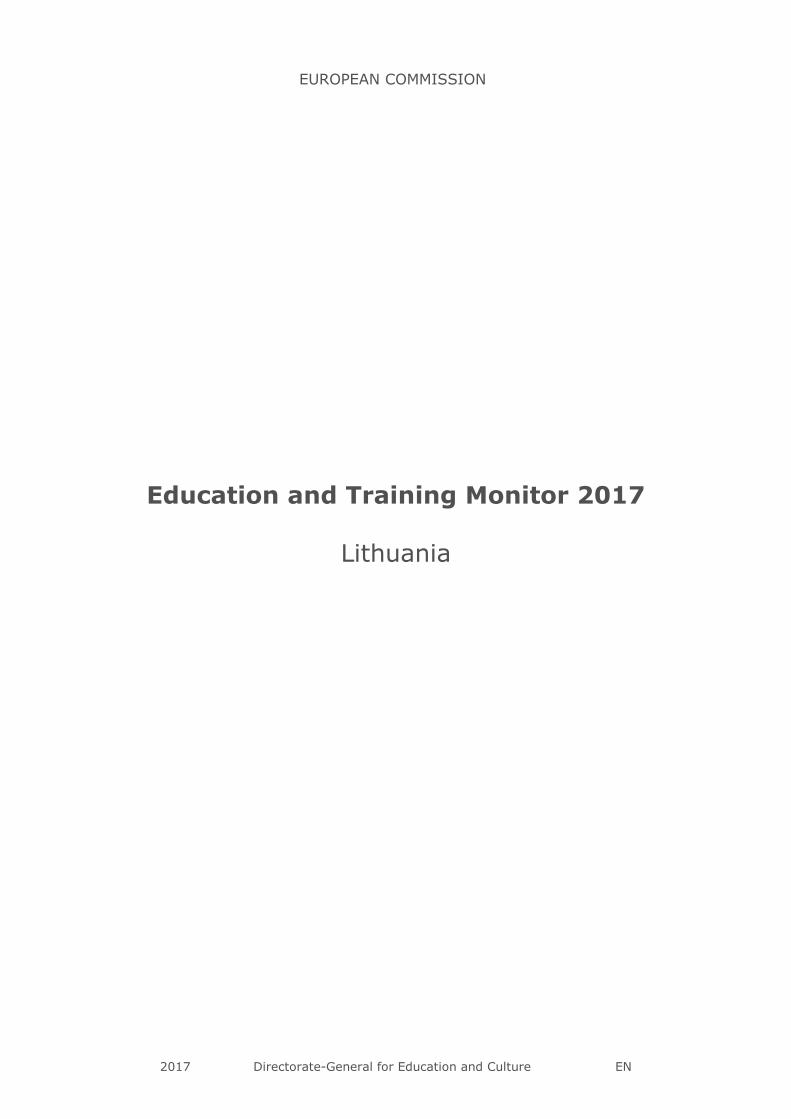
Education expenditure has decreased but remains high by EU standards. In 2015, Lithuania spent 5.4 % of GDP on education, down from 6.4 % in 2010 but still significantly higher than the
EU average of 4.9 %. As a percentage of total public government expenditure, at 15.4% Lithuania had the second highest share spent on education in the EU after Latvia (EU average: 10.3 %). The real level of expenditure when corrected for inflation dropped by 2 % between 2010 and 2015, after a decade of rapid growth (by nearly 40 % over 2000-2010). Spending per pupil has increased steadily as the number of pupils/students enrolled has decreased by around one quarter since 2000.
Comparatively high levels of spending on education are not translating into high teacher salaries. In 2015/2016, Lithuania was one of only three EU countries where the highest possible
statutory teacher salary at all three levels of school education was lower than GDP per capita (European Commission/EACEA/Eurydice, 2016). New recruits to teaching earn less than experienced teachers because salaries are set on the basis of the workload, the years of service and the teachers' qualification category. It has been argued that the reason for low teacher salaries
lies in the size of the teacher workforce and the dissipation of resources across a high number of schools in the country (IMF, 2017). At nearly 10 % of all employment in the country, Lithuania has historically had one of the highest concentrations of teachers in the active population in Europe (OECD 2016b) and a comparably large support staff (LFMI, 2016). The declining student numbers are a challenge for the efficiency of funding of education. In the past decade there has been a sharp decline in the size of the school-age population (6- to
19-year-olds): in 2015 there were 36% less students than in 20053. Because of the low student numbers, the student-teacher ratio is constantly among the lowest in the EU — in 2015 it was 8.2 pupils per teacher in primary and lower secondary education and 8.1 in upper secondary education. The average class size also decreased — national data showed that class sizes in rural areas dropped from around 13 students per class to 11.4 in 2015, whereas in urban areas they dropped steadily from 23.3 in 2005 to 20.6 in 2015 (Shewbridge, C. et al. 2016, p.42). Consequently,
expenditure per student has been rising very fast in the last 5 years (by around 3 % per year in
real terms), although from a very low base.
3 Source: Eurostat data on Population on 1 January by age 2005 and 2015, online data code: demo_pjan

6 LITHUANIA
Education and Training Monitor 2017 – Country analysis November 2017
Figure 2. Expenditure per student (all International Standard Classification of Education
(ISCED) levels at 2010 prices) in relation to number of students
Source: Lithuanian Statistical Office, Pupils and students by level of education, https://osp.stat.gov.lt/web/guest/statistiniu-
rodikliu-analize?hash=8c0ea1bd-5177-4b3a-845a-e20d46d9717c#/ and Eurostat (GOFOF 2010 - 2016). Online data code:
gov_10a_exp
5. Modernising school education
The demographic structure of the teaching workforce in Lithuania is a cause for concern, while medium-term shortages are likely. The teaching workforce is ageing, while the supply of young teachers is insufficient. As many as 44 % of lower secondary education teachers were aged 50 years or older in 2014 (higher than the same indicator in the neighbouring countries4) and there
is ample evidence that the teaching profession is not attractive to young talented people (Research and Higher Education Monitoring and Analysis Centre (MOSTA), 2015; Lithuanian Education Council, 2015). For example, in the last 3 years no students have applied to physics and chemistry teacher training programmes (Lithuanian Education Council, 2015). A significant proportion of entrants into initial teacher education, estimated as high as 85 %, end up not entering the teaching profession (Shewbridge, C. et al., 2016). This suggests that in the medium to long term schools are likely to face teacher shortages.
The gender gap in the Lithuanian teaching force is pronounced. In 2015, women accounted for 87.5 % of all teachers. Gender differences persist in choice of subject, profession and future occupation: women comprise a large majority of students studying in colleges to become a teacher (94.7 %) (Lithuania Statistics 2016). There are more women than men serving as directors of
general schools (61.7% are women) but more men than women in charge of vocational schools (37.1% are women). Lithuania's State education strategy 2013-2022 has set the target of
increasing the share of male teachers from 16 % in 2012 to 20 % in 2022. Funding for continuous professional development is scarce. Obligatory in-school practice during initial teacher education is limited, and innovative teaching methods remain underutilised. There are also large discrepancies in the funding of continuous professional development with some municipalities allocating three times as much budget as others, thanks to their autonomy in the
allocating resources (Shewbridge, C. et al., 2016).
4 For example, 22 % in Poland, 31.9 % in Latvia, 39.9 % in Estonia in 2014 (the calculations are based on
OECD data: https://stats.oecd.org/Index.aspx?DataSetCode=EAG_PERS_SHARE_AGE#)
580,000
600,000
620,000
640,000
660,000
680,000
700,000
720,000
740,000
760,000
780,000
2.1
2.2
2.3
2.4
2.5
2.6
2.7
2.8
2.9
2010-2011 2011-2012 2012-2013 2013-2014 2014-2015 2015-2016
Thousand E
UR/y
ear
Expenditure per pupil (at 2010 prices, adjusted for inflation) Total nr of students (ISCED level 0-8)
Tota
l num
ber
of
stu
dents
(IS
CED
0-8
)

LITHUANIA 7
Education and Training Monitor 2017 – Country analysis November 2017
The government has taken some steps to improve the attractiveness of the teaching profession. It raised salaries for novice teachers and allocated funding for early retirement
compensation to create more vacancies and provide more employment opportunities for young teachers. The take-up was fairly successful — 900 teachers in 2015 and 814 in 2016 took advantage of the scheme. While this may indeed be a positive step in some respects, it requires careful planning to avoid future teacher shortages and a loss of accumulated expertise. In addition, scholarships for teaching degrees and a mentoring programme supporting young teachers have been set up. The government is currently negotiating a new way of structuring teacher salaries with the trade unions, moving away from payment per contact hours to a full-time scheme of 36
working hours, which include teaching, preparation and other duties.
6. Modernising higher education
Lithuania tops the EU charts for tertiary educational attainment, but has a gender-unbalanced higher education system. Compared with the EU average of 39.1 %, in Lithuania as many as 58.7 % of 30-34-year-olds have a higher education degree; the expansion over the past decade has also been much faster than in the EU overall (Figure 3). As in most Member States, more women graduate than men — 68.8 % of women of the same age group hold a tertiary degree, compared with 48.1 % of men. This makes Lithuanian women the most highly qualified in Europe, followed by Cyprus, Sweden and Ireland. In recent years, however, there has
been some redistribution of enrolments across study fields and a small increase in the number of entrants into natural sciences (MOSTA 2016). This is a positive development, as skills forecasts predict that by 2025 around 27% of job opportunities will be for high-level occupations in science, engineering and healthcare, but also business and teaching.
Figure 3. Tertiary educational attainment of 30-34-year-olds
Source: Eurostat (LFS, 2007 - 2016). Online data code: edat_lfse_03
Labour-market outcomes for higher education graduates are very good. Lithuania's
employment rate of tertiary graduates is one of the highest in the EU, reaching 91.1 % in 2016, significantly higher than the EU average of 82.2 %. The employment rate advantage compared to upper secondary education graduates (70.3%) shows the clear value of attaining higher education.
The higher education sector is characterised by a large network of institutions and a declining student body. There are currently 21 universities and 22 colleges operating in Lithuania. While tertiary attainment among 30-34-year-olds is very high, the number of young people entering higher education has for demographic reasons decreased by 21 % since 2012,
including a 9 % decrease between 2015 and 2016 alone (MOSTA, 2016). Consequently, in 2016, one third of all study programmes had no more than 10 enrolled students (MOSTA 2016). In order
0%
10%
20%
30%
40%
50%
60%
70%
80%
2007 2008 2009 2010 2011 2012 2013 2014 2015 2016
LT average EU 28 average LT males LT females

8 LITHUANIA
Education and Training Monitor 2017 – Country analysis November 2017
to attract students from a shrinking pool of young people and receive a corresponding amount of state funding according to the ‘money follows student’ principle, higher education institutions were encouraged to expand their offer of study courses and to lower the quality threshold for admitting
students. However, as of the 2017 academic year, the government introduced minimum entry requirements to increase the quality of entrants into higher education5.
The reform and rationalisation of tertiary education is high on the political agenda. In December 2016, Parliament adopted a resolution urging the government to work out a restructuring plan. A working group set up for this purpose proposed a wider higher education reform. The blueprint, accepted by the government and adopted by Parliament in June 2017, contains proposals for abolishing bachelor’s tuition fees while raising entry requirements and
reforming the higher education funding system. Setting up and negotiating the institutions’ financial incentives in a way that primarily promotes quality and efficiency of higher education will be the key challenge for the reform.
Box 1: Optimisation of the higher education network in Lithuania
The Lithuanian Parliament adopted the plan for consolidation of Lithuanian universities in June
2017. According to this plan, Lithuania should have two universities offering a wide range of
studies in Vilnius and Kaunas, as well as universities with specialised missions focusing on
technology, health sciences and arts in Vilnius and Kaunas. University level science centers that
correspond to regional needs would be maintained in Klaipeda and Siauliai, with a possibility of
integration into other universities. This will replace the current network of 21 universities and 22
colleges.
However, universities are autonomous and can propose their own mergers to Parliament, as
Vytautas Magnus University (VDU) has done, proposing to become a national ‘umbrella’
university. It launched the merger process with the Lithuanian University of Educational
Sciences (LEU), while Aleksandras Stulginskis University (ASU) later joined the initiative. VDU
also said that they expected to conclude integration talks with the Lithuanian Sports University
(LSU). The government's reform plan calls for merging VDU, LSU, ASU, LEU and the Kaunas
University of Technology (KTU) into a single university in Kaunas. It remains to be seen how the
plan will interact with the universities’ own plans for consolidation and how the reform of the
funding and quality assurance systems can be combined with the consolidation plans.
7. Modernising vocational education and training and promoting adult learning
The government aims to improve the quality and attractiveness of vocational education and training, yet challenges remain. The proportion of upper secondary students (ISCED 3) in initial vocational education and training (IVET) remained stable in 2015 at 26.8 %, substantially below the EU average of 47.3 %. The employment rate of recent IVET graduates in 2016 of 74.9 %
was almost the same as the EU average of 75 %. A work-based learning component in IVET is lacking. With falling student numbers, another challenge is ensuring the sustainability of sectoral practical training centres, which benefited from substantial European Regional Development Fund (ERDF) and European Social Fund (ESF) investments of more than EUR 100 million during 2007-2013.
Lithuania is reforming the concept of IVET curricula to make them more labour-market relevant. The intention is for IVET programmes to be based on qualifications profiles, to be
defined by sectoral qualifications standards and transformed into a modular structure. 10 sectoral qualification standards (out of the total of 24) and 60 modular programmes were developed under
5 Scores of not less than 3 out of 10 points for universities and not less than 1.6 out of 10 points for
colleges.

LITHUANIA 9
Education and Training Monitor 2017 – Country analysis November 2017
a dedicated ESF project that ran from 2010 to 2015. Major social partners and employers’ organisations took part in developing the standards and worked with expert groups that designed IVET programmes. In 2016 the first modular programmes were piloted. Based on the lessons
learned, the second wave of modular programmes is to be launched.
Lithuania struggles to increase participation in adult learning, in particular among groups that are the least likely to participate. Adult participation in learning remained low in 2016 at 6.0 %, well below the EU average of 10.8 % and the national target of 15 %. The system for quality assurance seems to be inefficient, with overall fragmentation of the system and insufficient involvement of stakeholders in planning and development of adult learning. As indicated in the Lithuanian Republic Ministry of Education and Science Activity report 2016, low
levels of participation in adult education were caused by gaps in legislation and insufficient investment in adult non-formal education.
New legislation in force since 2015, coupled with EU funding, are opening the way to
positive developments for increased participation in adult education. As well as addressing quality, funding and governance aspects, changes to the Labour Code have introduced an entitlement to training leave for non-formal education activities for each person. The leave can be up to 5 days per year and must be agreed with the employer. A European Structural Fund call for
proposals to develop formal and non-formal learning possibilities was launched in February with a total budget of EUR 12 164 041. The support is planned to be given to the following groups:
adult school leavers who are willing to finish their secondary education;
teachers willing to acquire higher education qualification;
senior learners;
non-formal learning for vocation teachers so that they can up-skill.
Box 2: Skills monitoring and anticipation in Lithuania A set of projects collecting and analysing data on skills supply and demand are contributing to a
clearer picture of where policy intervention is needed to reduce skills mismatches in the
economy.
Specialist Qualification Map
In 2014, the Ministry of Education and Science launched a one-off pilot initiative called the
‘Specialist Qualification Map’ (Specialistų kvalifikacijųžemėlapis). The initiative was run by
MOSTA. The purpose was to assess the level of mismatch between qualifications attained and
those required in jobs by combining administrative data from three national databases. It
covered 75 000 higher education graduates and around 150 000 VET graduates from 2012 and
2013. The result of the analysis was a report which provides information on the graduates’
integration into the labour market, broken down by type of studies, date of recruitment,
occupation and earnings6. Among other things, the Map gave an insight into the pay gap
between public- and private-sector employment, inter-regional migration and the gender pay
gap. As a next step, MOSTA is working on a project entitled ’Development and implementation of
the system for education supply analysis and evaluation’ (ESF, 2016).
National Human Resources Monitoring (NHRM)
The ‘Human resources demand forecasting’ project (2013-2015), funded by the European Social
Fund (ESF), sought to implement an econometric skills forecasting model based on labour
demand and supply by extracting data from three different sources. The resulting forecasts and
snapshots were presented online at www.zips.lt. To ensure continuity with this project, in
February 2016 the government provided the legal basis for the creation of a system of skills
monitoring — National Human Resources Monitoring. The NHRM, coordinated by a cross-
6 http://mosta.lt/images/leidiniai/Specialistu_kvalifikaciju_zemelapio_pirmine_analize_2015.pdf

10 LITHUANIA
Education and Training Monitor 2017 – Country analysis November 2017
ministerial committee, will integrate various national registers on educational, employment,
social security, migration and other data in order to provide a comprehensive system for
assessing current and future demand and supply of skills.
Source: Cedefop, Skills anticipation in Lithuania.
http://skillspanorama.cedefop.europa.eu/en/analytical_highligths/skills-anticipation-lithuania
8. References
Education Supply Centre (2015), Research report on the developments of ECEC municipal facilities in Lithuania (20212/13 and 2014), EU-funded project ‘The development of pre-school and pre-primary education’. http://www.ikimokyklinis.lt/index.php/naujienos/ipup-projekto-naujienos/institucinio-ikimokyklinio-ir-priesmokyklinio-amziaus-vaiku-ugdymosi-salygu-kaitos-savivaldybese-tyrimo-rezultatu-pristatymas/19212
European Commission/EACEA/Eurydice (2016) Teachers’ and School Heads’ Salaries and Allowances in Europe — 2015/16. Eurydice Facts and Figures. Luxembourg: Publications Office of the European Union. https://webgate.ec.europa.eu/fpfis/mwikis/eurydice/images/2/22/Teacher_salaries.pdf
International Monetary Fund (IMF) (2016) World Economic Outlook Database, October 2016. http://www.imf.org/external/pubs/ft/weo/2016/02/weodata/weorept.aspx?sy=2015&ey=2021&scc=1&ssd=1&
sort=country&ds=.&br=1&c=946&s=NGDP_R,NGDP_RPCH,NGDP,NGDPD,NGDP_D,NGDPRPC,NGDPPC,NGDPDPC,PPPGDP,PPPPC&grp=0&a=&pr1.x=59&pr1.y=18
International Monetary Fund (IMF) (2017) Republic of Lithuania: Staff Concluding Statement of the 2017 Article IV Mission. https://www.imf.org/en/News/Articles/2017/05/15/ms051617-republic-of-lithuania-staff-concluding-statement-of-the-2017-article-iv-mission
LFMI – Lithuanian Free Market Institute (2016), How much does a teacher earn in Lithuania? (Kiek uždirba mokytojas Lietuvoje?), Vilnius. Retrieved from http://www.llri.lt/naujienos/ekonomine-politika/z-silenas-kiek-uzdirba-mokytojas-lietuvoje/zilvinas-silenas
Lithuanian Education Council (2015), Dėl pedagogų rengimo politikos tobulinimo (Improvement of Teachers’ Training Policy). http://www3.lrs.lt/pls/inter/w5_show?p_r=9495&p_k=1
Lithuanian Government (2017), Lietuvos Respublikos Vyriausybės programos įgyvendinimo planas (Implementation Plan for the Government's Programme of the Republic of Lithuania), 2017. https://e-seimas.lrs.lt/portal/legalAct/lt/TAP/3cbc070007b511e78352864fdc41e502?jfwid=-wd7z6mxg5
Ministry of Education and Science (2016), Priešmokyklinio ugdymo tvarkos aprašas (The Description of the Pre-primary Education Procedure), V-674. http://www.smm.lt/web/lt/teisesaktai/listing?actual=1
MOSTA (2016) — Research and Higher Education Monitoring and Analysis Centre (2016a), General admission to the first cycle and integrated studies (Bendrasis priėmimas į pirmos pakopos ir vientisąsias studijas, 2016 m), Vilnius. Retrieved from http://www.mosta.lt/images/Priemimas_2016_09_27.pdf
National Audit of Lithuania (2016), Valstybinio audito ataskaita Švietimo stebėsena (Public Audit Report Education Monitoring). https://www.vkontrole.lt/audito_ataskaitos.aspx?tipas=2
OECD (2016a) Education at a Glance 2016: OECD Indicators:Lithuania. http://dx.doi.org/10.1787/eag-2016-68-en
OECD (2016b), PISA 2015 Results (Volume I): Excellence and Equity in Education, OECD Publishing, Paris.
DOI: http://dx.doi.org/10.1787/9789264266490-en
Shewbridge, C. et al. (2016), OECD Reviews of Schools Resources: Lithuania 2016, OECD Reviews of Schools
Resources, OECD publishing, Paris.
Statistics Lithuania (2016), Education 2015, published June 2016, Vilnius. http://osp.stat.gov.lt/statistikos-
leidiniu-katalogas?publication=23298
Cedefop (2016a), Skills Panorama Lithuania: Mismatch priority occupations, October 2016. Retrieved from
http://skillspanorama.cedefop.europa.eu/en/analytical_highligths/lithuania-mismatch-priority-occupations
Cedefop (2016b), Skills Panorama. http://skillspanorama.cedefop.europa.eu/en/countries/lithuania

LITHUANIA 11
Education and Training Monitor 2017 – Country analysis November 2017
9. Annex I. Key indicator sources
Indicator Eurostat online data code
Early leavers from education and training edat_lfse_02 + edat_lfse_14
Tertiary educational attainment edat_lfse_03 + edat_lfs_9912
Early childhood education and care educ_uoe_enra10 + tps00179
Employment rate of recent graduates edat_lfse_24
Adult participation in learning trng_lfse_03
Public expenditure on education as a percentage of GDP gov_10a_exp
Expenditure on public and private institutions per student educ_uoe_fini04
Learning mobility educ_uoe_mobg03
10. Annex II. Structure of the education system
Age of students Programme duration (years)
Note: Gimnazija may cover both primary education programme (ISCED 1) and basic educational
programmes.
Source: European Commission/EACEA/Eurydice, 2016. The Structure of the European Education Systems
Comments and questions on this report are welcome and can be sent by email to: Luka JUROS [email protected]

HOW TO OBTAIN EU PUBLICATIONS
Free publications:• one copy:
via EU Bookshop (http://bookshop.europa.eu);• more than one copy or posters/maps:
from the European Union’s representations (http://ec.europa.eu/represent_en.htm); from the delegations in non-EU countries (http://eeas.europa.eu/delegations/index_en.htm); by contacting the Europe Direct service (http://europa.eu/europedirect/index_en.htm) or calling 00 800 6 7 8 9 10 11 (freephone number from anywhere in the EU) (*).
(*) The information given is free, as are most calls (though some operators, phone boxes or hotels may charge you).
Priced publications:• via EU Bookshop (http://bookshop.europa.eu).

ISBN 978-92-79-70022-4
NC-AN
-17-022-EN-N


![Lg l172wal Lcd Monitor Training Manual [ET]](https://img.pdfslide.net/doc/110x75/54ffa0074a7959b9108b4782/lg-l172wal-lcd-monitor-training-manual-et.jpg)