Embed Size (px)
Citation preview

Education Technology (EdTech) Survey 2020-21 Research report
May 2021
CooperGibson Research

2
Contents
List of figures 5
List of tables 8
Glossary of terms 12
Executive summary 13
1. Introduction 23
1.1 Aims and objectives of the research 24
1.2 Methodology 24
1.2.1 Sample 25
1.2.2 Fieldwork 26
1.2.3 Survey response 26
1.2.4 Sample profile 27
1.2.5 Respondent roles 28
1.2.6 Weighting 29
1.3 Methodological considerations 30
1.4 Analysis 31
2. Benefits of EdTech 33
2.1 Perceptions of the impact on costs 33
2.2 Perceptions of the impact on pupil attainment 34
2.3 Perceptions of the impact on workload 34
2.4 Impact of EdTech on time 35
3. Remote education and schools’ response to COVID-19 38
3.1 Technology changes in response to COVID-19 38
3.2 Use of Government support programmes 40
3.3 Delivery of remote education 42
3.3.1 Use of new technology to deliver remote education 43
3.3.2 Delivery of remote education 44
3.4 Perceptions of remote education delivery effectiveness 47
3.5 Barriers to the use of technology for remote learning 48
3.6 Additional support requirements 50

3
4. EdTech infrastructure 52
4.1 Wired end user bandwidth performance 52
4.2 Storage and systems 53
4.2.1 On-premise and cloud-based storage 53
4.2.2 On-premise and cloud-based systems 54
4.2.3 Benefits of cloud-based storage and systems 55
4.2.4 Future implementation of cloud-based storage and systems 57
4.2.5 Barriers to fully implementing cloud-based storage and systems 58
4.3 Main operating systems 59
4.4 Backups of critical data 61
4.5 Devices 62
4.5.1 Devices for teachers to use 62
4.5.2 Number of devices for teachers to use 63
4.5.3 Ratio of devices for teachers to use 66
4.5.4 Devices for pupils to use 68
4.5.5 Number of devices for pupils to use 69
4.5.6 Ratio of devices for pupils to use 71
4.5.7 Technologies used in school 72
4.5.8 Assistive technologies used in school 73
4.5.9 Use of mainstream accessibility features 74
5. Use of EdTech in schools 76
5.1 School EdTech strategy 76
5.2 Suitability of EdTech 77
5.2.1 Software for school administration 78
5.2.2 Software for teaching 80
5.2.3 Software for remote, blended and independent learning 83
5.2.4 Software for other school functions 84
5.2.5 Impact of experience on perceptions of software 86
5.2.6 Devices 87
5.2.7 Storage and networks 89
5.2.8 Unified threat protection 91

4
6. Barriers 93
6.1 Financial barriers 93
6.2 Pupil barriers 94
6.3 Staff barriers 94
6.4 Connectivity barriers 97
6.5 Other barriers 98
7. Future Investment in EdTech 99
7.1 Technology investment 99
7.2 Sources of information about EdTech 102
7.2.1 Sources of education efficacy information 102
7.2.2 Recommendation sources – headteachers 103
7.2.3 Recommendation sources – teachers 105
7.3 Training and CPD 106
8. Conclusions 109
8.1 Areas for future development 109
Appendix 1: Survey sample details 111
Appendix 2: Additional data 119

5
List of figures Figure 1: Contribution of technology to financial cost savings – headteachers ................ 33
Figure 2: Contribution of technology to pupil attainment – headteachers and teachers ... 34
Figure 3: Contribution of technology to workload – headteachers and teachers .............. 35
Figure 4: Impact of technology on time taken to complete tasks – headteachers ............ 36
Figure 5: Impact of technology on time taken to complete tasks – teachers .................... 37
Figure 6: Changes to technology in the past 12 months - headteachers ......................... 38
Figure 7: Types of technology introduced, increased or upgraded due to COVID-19 - headteachers ................................................................................................................... 39
Figure 8: Perceptions of the impact of new technologies learned to use - teachers ........ 43
Figure 9: Provision of work for pupils learning from home - headteachers ...................... 44
Figure 10: Provision of work for pupils learning from home who lack digital access - headteachers ................................................................................................................... 46
Figure 11: Estimate of amount of regular curriculum delivered to pupils learning from home – headteachers and teachers ................................................................................ 47
Figure 12: Agreement with statements – headteachers and teachers ............................. 48
Figure 13: Barriers to the effective use of technology for remote learning – headteachers ......................................................................................................................................... 50
Figure 14: Extent to which additional support is required with using technology when pupils are learning from home - teachers ......................................................................... 51
Figure 15: Bandwidth delivered to wired end users – technical survey ............................ 53
Figure 16: Type of storage – technical survey ................................................................. 54
Figure 17: Type of systems – technical survey ................................................................ 55
Figure 18: Benefits of cloud-based storage or systems experienced – technical survey . 56
Figure 19: Challenges to fully implementing cloud-based storage and systems (all schools) – technical survey .............................................................................................. 58
Figure 20: Retention of offline backups of critical data – technical survey ....................... 61

6
Figure 21: Devices used in school – technical survey ..................................................... 63
Figure 22: Number of devices for teachers to use in school (teachers) – technical survey ......................................................................................................................................... 64
Figure 23: Devices for pupils to use in school – technical survey .................................... 68
Figure 24: Number of devices for pupils to use – technical survey .................................. 69
Figure 25: Use of mainstream accessibility features – headteachers .............................. 75
Figure 26: Proportion of schools with a digital technology strategy ................................. 76
Figure 27: Extent to which software meets schools’ needs for administration – headteachers ................................................................................................................... 79
Figure 28: Extent to which software meets needs for teaching – teachers ...................... 81
Figure 29: Extent to which software meets needs for teaching – teachers ...................... 82
Figure 30: Extent to which software meets needs for teaching – teachers ...................... 84
Figure 31: Extent to which software meets needs for other functions – teachers ............ 86
Figure 32: Extent to which devices are fit for purpose - headteachers ............................ 87
Figure 33: Extent to which storage and networks are fit for purpose – technical survey .. 90
Figure 34: Confidence in aspects of unified threat protection – technical survey ............. 91
Figure 35: Staff cyber security training – technical survey ............................................... 92
Figure 36: Financial barriers to increased uptake of EdTech – headteachers and teachers ......................................................................................................................................... 93
Figure 37: Pupil barriers to increased uptake of EdTech – teachers ............................... 94
Figure 38: Proportion of teaching staff who are confident in using EdTech in the classroom – headteachers ............................................................................................... 95
Figure 39: Staff barriers to increased uptake of EdTech – headteachers and teachers .. 96
Figure 40: Connectivity barriers to increased uptake of EdTech – headteachers and teachers ........................................................................................................................... 97
Figure 41: Other barriers to increased uptake of EdTech – headteachers and teachers . 98

7
Figure 42: Other barriers to increased uptake of EdTech – headteachers....................... 98
Figure 43: Technologies plan to invest in within the next three years - headteachers ... 100
Figure 44: Technologies plan to invest in within the next three years – technical survey ....................................................................................................................................... 101
Figure 45: Channels used for understanding EdTech efficacy - headteachers .............. 103
Figure 46: Top three most valued sources of recommendation when choosing EdTech – headteachers ................................................................................................................. 104
Figure 47: Top three most valued sources of recommendation when choosing EdTech – teachers ......................................................................................................................... 105
Figure 48: Preferred ways to access to training on how to use EdTech - teachers ....... 107

8
List of tables Table 1: Number of schools and respondents per role type in the survey sample ........... 26
Table 2: Responses received by survey/respondent type................................................ 27
Table 3: Responses received by survey/respondent type and school phase ................... 27
Table 4: Respondent roles (headteacher survey) ............................................................ 28
Table 5: Respondent roles (teacher survey) .................................................................... 29
Table 6: Respondent roles (technical survey) .................................................................. 29
Table 7: Awareness and use of Government support programmes - headteachers ........ 41
Table 8: Future plans to implement any cloud-based admin or curriculum storage – technical survey ............................................................................................................... 57
Table 9: Future plans to implement any cloud-based systems – technical survey ........... 58
Table 10: Main operating systems used for user / desktop infrastructure – technical survey .............................................................................................................................. 60
Table 11: Main operating systems used for server infrastructure – technical survey ....... 61
Table 12: Distribution data for number of devices for teachers to use in school (primary) – technical survey ............................................................................................................... 65
Table 13: Distribution data for number of devices for teachers to use in school (secondary) – technical survey ........................................................................................ 66
Table 14: Ratio of devices to teachers (primary) – technical survey ................................ 67
Table 15: Ratio of devices to teachers (secondary) – technical survey ........................... 67
Table 16: Distribution data for number of devices for pupils to use in school – technical survey .............................................................................................................................. 70
Table 17: Ratio of devices to pupils (primary) – technical survey .................................... 71
Table 18: Ratio of devices to teachers (secondary) – technical survey ........................... 72
Table 19: Technologies used in school - headteachers ................................................... 73
Table 20: Assistive technologies used in school - headteachers ..................................... 74

9
Table 21: Type of school digital technology strategy ....................................................... 77
Table 22: Use of software for school administration - headteachers ............................... 78
Table 23: Use of software for teaching – headteachers and teachers ............................. 80
Table 24: Use of software for remote, blended and independent learning – headteachers and teachers .................................................................................................................... 83
Table 25: Use of software for other school functions – headteachers and teachers ........ 85
Table 26: Main reason devices not fit for purpose – technical survey .............................. 89
Table 27: Region and school phase (national and by survey type, unweighted) ........... 111
Table 28: School profile (national and by survey type, unweighted) .............................. 112
Table 29:Survey respondent profile – headteachers and teachers (unweighted) .......... 113
Table 30: Survey respondent role – headteachers (unweighted) ................................... 114
Table 31: Survey respondent role – teachers (unweighted)........................................... 115
Table 32: Survey respondent role – technical survey (unweighted) ............................... 117
Table 33: Job role - Contributed to technical survey (unweighted) ................................ 118
Table 34: Mean number of devices available for teachers to use – technical survey .... 119
Table 35: Mean number of devices available for pupils to use – technical survey ......... 125
Table 36: Use of any assistive technologies by region - headteachers ......................... 126
Table 37: Proportion of schools with a digital technology strategy by phase and size of school - headteachers ................................................................................................... 126
Table 38: Proportion of schools with a digital technology strategy by region - headteachers ................................................................................................................. 127
Table 39: Extent to which software meets needs for teaching – headteachers ............. 128
Table 40: Extent to which software meets needs for other school functions – headteachers ................................................................................................................. 129
Table 41: Software sometimes / rarely meets needs for functions by length of time in teaching (significant differences) – teachers .................................................................. 129

10
Table 42: Use of devices - headteachers ....................................................................... 130
Table 43: Devices partially / not at all fit for purpose by school phase and type – headteachers ................................................................................................................. 130
Table 44: Extent to which devices are fit for purpose – technical survey ....................... 131
Table 45: Number of major cyber security incidents – technical survey ........................ 131
Table 46: Number of minor cyber security incidents – technical survey ........................ 132
Table 47: Impact of COVID-19 on schools between September 2020 and 4th January 2021 – headteachers ..................................................................................................... 119
Table 48: Use of Government programmes to support remote teaching and learning during COVID-19 - headteachers .................................................................................. 120
Table 49: Use of Government programmes to support remote teaching and learning during COVID-19 (pre and post-closure) - headteachers............................................... 121
Table 50: Used Government programmes to support remote teaching and learning during COVID-19 by location (significant differences) – headteachers ..................................... 122
Table 51: Used Government programmes to support remote teaching and learning during COVID-19 by FSM (significant differences) – headteachers .......................................... 122
Table 52: Used Government programmes to support remote teaching and learning during COVID-19 by size of school (significant differences) – headteachers ........................... 122
Table 53: Provision of work for pupils learning from home by timing of survey completion (significant differences) – headteachers ........................................................................ 123
Table 54: Provision of work for pupils learning from home by timing of survey completion (by phase) – headteachers ............................................................................................ 123
Table 55: Estimate of amount of regular curriculum delivered to pupils learning from home by timing of survey completion – headteachers and teachers ............................. 124
Table 56: Extent to which additional support is required with using technology when pupils are learning from home – headteachers .............................................................. 124
Table 57: Pupil barriers to increased uptake of education technology – teachers ......... 132
Table 58: Barriers to increased uptake of EdTech by experience and age - teachers ... 133

11
Table 59: Impact of teacher’s own skills and confidence on perceptions of software used (significant differences) – teachers ................................................................................ 133
Table 60: High priority areas for technology funding for school in the next three years - teachers ......................................................................................................................... 134

12
Glossary of terms AI - Artificial intelligence
AR – Augmented reality
COVID-19 – Coronavirus
CPD – Continuing professional development
EdTech – Education technology
FSM – Free school meals
GIAS – Get Information About Schools
HR – Human resources
ICT – Information and communication technology
INSET – In-service training
IT – Information technology
MI – Management information
SEND – Special educational needs and disabilities
VR – Virtual reality

13
Executive summary Education Technology (EdTech) refers to the practice of using technology to support teaching and the effective day-to-day management of education institutions. In 2019, the Department for Education (DfE) set out its vision to support schools and colleges to embed technology effectively by supporting them to better understand the opportunities and help tackle the barriers to effective adoption and use of EdTech.1
To support the EdTech Strategy and to inform future technology policy development, the DfE commissioned CooperGibson Research (CGR) to conduct research to establish the state and usage of technology across schools in England.
The Department for Education began the commissioning process for a survey of the EdTech landscape in schools in early March 2020. The aim of the survey was to understand the current state of technology in schools, in order to: inform the steps government should take to helps schools embed and use technology to support cost savings, workload reductions and improved pupil outcomes; and to help the EdTech sector to understand the technology landscape of the school sector so that they can adapt and develop their tools in ways that reflect the current conditions within schools. Following the decision to close schools in England, Scotland, Wales and Northern Ireland, the commissioning process for the survey was paused. The commissioning process resumed in July 2020 and, while the original aims remained, the survey included an additional focus on how technology was being used to support remote teaching and learning. This report presents the findings of this research.
Methodology Fieldwork took place between 25th November 2020 and 29th January 2021. During the first part of the fieldwork – between 25th November 2020 and 4th January 2021 – schools were open, although most had some pupils learning from home. During the second part of the fieldwork – 5th January 2021 to 29th January 2021 – all schools were closed to most pupils due to the national lockdown. The data therefore covers a period of changing circumstances for schools, which will affect some survey measures more than others. Where relevant, data have been analysed by pre/post lockdown period; any significant differences are highlighted in the report.
A quantitative online survey approach was employed, incorporating:
1 Realising the potential of technology in education: a strategy for education providers and the technology industry (2019).

14
• The development of three surveys for completion by schools: a headteacher survey, a teacher survey and a technical survey.
• Cognitive testing of the questions with 30 school staff members (senior leaders, teachers and IT leads) prior to survey distribution.
• An engagement stage with a stratified random sample of 12,000 maintained primary and secondary schools in England, to provide schools with the opportunity to opt in to the survey process. This engagement stage resulted in 1,012 schools which agreed to take part.
• Completion of 2,555 online surveys as follows:
• 897 headteacher surveys. • 854 teacher surveys. • 804 technical surveys.
Key findings
Benefits of EdTech
Perceptions of the impact of technology on pupil attainment were positive:
• The majority of headteachers (88%) and teachers (84%) indicated that technology had or would contribute to improved pupil attainment. Over half believed that this positive impact had already been experienced (headteachers 55%, teachers 57%).
• The majority of headteachers (74%) and teachers (65%) also indicated that technology already had, or would in the future, contribute to reduced workload.
• Headteachers in particular believed that the use of technology had saved them time on key tasks, most commonly for financial management, engaging with parents and governance, plus pupil data management and timetabling for secondary schools.
• Teachers were also broadly positive about the impact of technology on the time taken to complete teaching-related tasks, especially for collaborating and sharing resources with other teachers, tracking pupil progress, planning lessons or curriculum content, and delivering lessons.
But, technology was perceived to have had less impact on the time they spent on conducting formative and summative assessments and supporting pupils with SEND.
15
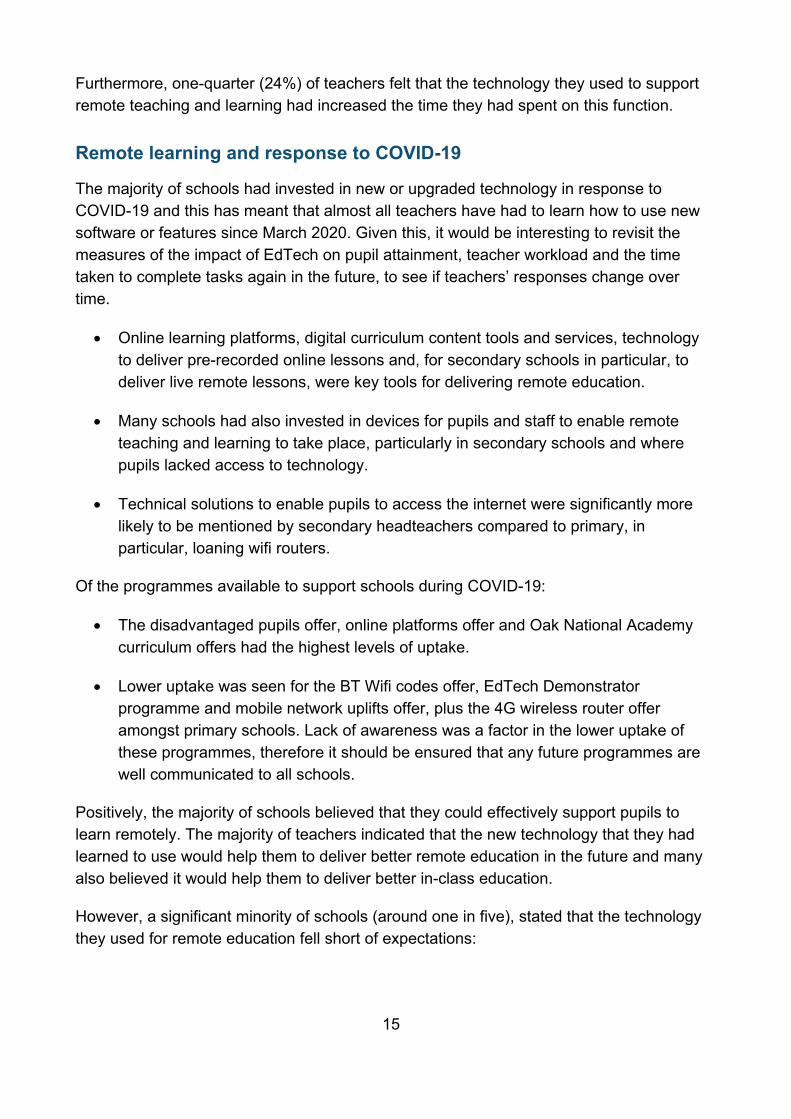
Furthermore, one-quarter (24%) of teachers felt that the technology they used to support remote teaching and learning had increased the time they had spent on this function.
Remote learning and response to COVID-19
The majority of schools had invested in new or upgraded technology in response to COVID-19 and this has meant that almost all teachers have had to learn how to use new software or features since March 2020. Given this, it would be interesting to revisit the measures of the impact of EdTech on pupil attainment, teacher workload and the time taken to complete tasks again in the future, to see if teachers’ responses change over time.
• Online learning platforms, digital curriculum content tools and services, technology to deliver pre-recorded online lessons and, for secondary schools in particular, to deliver live remote lessons, were key tools for delivering remote education.
• Many schools had also invested in devices for pupils and staff to enable remote teaching and learning to take place, particularly in secondary schools and where pupils lacked access to technology.
• Technical solutions to enable pupils to access the internet were significantly more likely to be mentioned by secondary headteachers compared to primary, in particular, loaning wifi routers.
Of the programmes available to support schools during COVID-19:
• The disadvantaged pupils offer, online platforms offer and Oak National Academy curriculum offers had the highest levels of uptake.
• Lower uptake was seen for the BT Wifi codes offer, EdTech Demonstrator programme and mobile network uplifts offer, plus the 4G wireless router offer amongst primary schools. Lack of awareness was a factor in the lower uptake of these programmes, therefore it should be ensured that any future programmes are well communicated to all schools.
Positively, the majority of schools believed that they could effectively support pupils to learn remotely. The majority of teachers indicated that the new technology that they had learned to use would help them to deliver better remote education in the future and many also believed it would help them to deliver better in-class education.
However, a significant minority of schools (around one in five), stated that the technology they used for remote education fell short of expectations:

16
• Software for offering independent or online learning or for supporting blended learning were highlighted as areas which could be improved.
• Schools were also less confident about their ability to support pupils with SEND or those with reduced digital access to learn remotely.
• A substantial proportion of teachers lacked confidence in their own ability to deliver the full curriculum to pupils whilst learning from home.
The main barriers to the effective use of EdTech for remote learning cited by schools were not within the school itself, rather they were challenges around pupils’ ability to engage with EdTech at home (access to devices, connectivity and skills). Key in-school challenges were the cost of EdTech, quality or availability of technology in the school, and broadband connectivity for staff (more commonly cited by rural schools).
Requests for additional support with using technology when pupils are learning from home were high. Teachers’ greatest needs were for support with monitoring pupil progress and engaging with pupils. Although somewhat less prevalent, a substantial proportion also said they required support with using technology for setting pupil work.
EdTech Infrastructure
The technical survey collected a range of data on school infrastructure, including wired end user bandwidth delivery performance, use of on-premise versus cloud-based storage and systems, information on the main operating systems used by schools, critical data backups and the devices schools had available for teachers and pupils to use.
Wired end user bandwidth delivery
The bandwidth performance delivered to wired end users was typically 1Gbps or less. Primary schools (49%), especially local authority maintained primaries (51%), were significantly more likely to experience lower bandwidth delivery of up to 100Mbps compared to secondary schools (21%).
Storage and systems
Overall, the majority of schools used a mixture of cloud-based and on-premise storage and systems.
• Of the schools that responded to the technical survey, 4% of primary schools and none of the secondary schools indicated that they had fully cloud-based storage and systems.
• 10% of primary schools and 5% of secondary school were fully on-premise.

17
Common benefits of using the cloud included improvements in remote teaching and learning (primary 78%, secondary 94%), collaboration and communication between staff (primary 73%, secondary 82%), cross-site working or working on the go (primary 74%, secondary 79%), and many schools also experienced improved in-school learning (primary 49%, secondary 63%).
Barriers to fully implementing cloud-based storage and systems
There is an opportunity to further support schools to move their storage and systems to the cloud and many already have plans to do so in the future, especially secondary schools. The main barriers to fully implementing cloud-based storage and systems were:
• Affordability: 74% of schools cited affordability as a barrier (39% a ‘big barrier’) and this was more likely to be seen as a ‘big barrier’ for local authority maintained schools (45%) compared to academies (35%).
• Time required to migrate to the cloud: this was seen as a barrier for secondary schools in particular (87% versus 71% for primary schools).
Other key barriers mentioned included implementation guidance, which was mentioned by over half of schools (55%). Security concerns were especially a concern for secondary schools (63% versus primary 50%). Support and guidance in these areas may help schools to overcome these challenges. There also appears to be an opportunity to support schools with the procurement process for migrating storage and systems to the cloud, as almost half (46%) felt that procurement guidance was a barrier.
Operating systems and backups
The main operating systems used by schools were Windows products:
• Windows 10 for user or desktop infrastructure (primary 91%, secondary 97%)
• Windows 2012 (primary 21%, secondary 55%), 2016 (primary 21%, secondary 66%) or 2019 (primary 14%, secondary 58%) for server infrastructure.
A significant minority of schools (18%) did not retain offline backups of critical data or were unable to answer and of those, over half had on-premise only storage or systems. This potentially leaves these schools vulnerable to critical data loss.
Devices
Schools had a range of devices for teachers and pupils to use, however the number of devices they had available varied widely and increased with school size.

18
• The vast majority of schools had interactive whiteboards or blackboards (primary 97%, secondary 91%).
• Primary schools were more likely to use tablet devices (teachers and pupils), whereas secondary schools were more likely to use laptops and desktop computers.
• Whilst the majority (86%) of primary schools had at least one mobile device (tablets or laptops) for every teacher (ratio of 1:1), the figure amongst secondary schools was lower (69%). Conversely, secondary schools were more likely to have a 1:1 ratio for access to desktop computers for teachers compared to primary schools (66% versus 40% respectively).
• In contrast, 1:1 access to mobile devices for pupils was extremely low. Just 1% of primary schools and 2% of secondary schools provided access to at least one mobile device (tablet or laptop) for every pupil.
• Amongst primary schools, 15% had access to one mobile device for every two pupils and 21% for every three pupils. Three-fifths of primary schools (61%) had access to one mobile device for every four pupils or less (ratio of 1:4 or lower).
• Pupil access to mobile devices amongst secondary schools was much lower. Just 3% had access to one mobile device for every two pupils and 9% for every three pupils. Eighty-four percent of secondary schools had access to one mobile device for every four pupils or less (ratio of 1:4 or lower).
• Device ratios for desktop computers were higher amongst secondary schools, with two-fifths having a device ratio of 1:5 or more (compared to 2% for primary schools).
• Use of other technologies was significantly lower. Assistive technology was the most commonly used, followed by learner analytics and secondary schools were significantly more likely to use these technologies compared to primary schools. A minority of schools used any artificial intelligence (AI), virtual reality (VR) or augmented reality (AR) technologies. Use of accessibility features built into mainstream devices and software was particularly low in primary schools.
Suitability of EdTech software
Overall the software used for school administration was perceived to work well:
• Financial management and pupil data management software was viewed most positively.

19
• Software used for communicating with or engaging parents also worked well, especially for primary schools.
• However, software aimed at supporting flexible working practices, and timetabling software for primary schools was viewed comparatively less favourably.
Teachers and headteachers were broadly positive about the software used for teaching functions:
• Software for planning and delivering lessons, tracking pupil progress, collaborating or sharing resources and supporting remote teaching and learning, met the needs of the majority of teachers and headteachers.
• The software used for independent/online learning, blended learning/innovative teaching, delivering teacher training or CPD, formative assessment or summative assessment, and engaging or communicating with parents (for secondary teachers), was somewhat less suitable for schools’ needs.
• However, the area where school staff felt that software was least likely to meet their needs was in supporting pupils with SEND. Almost three out of five (57%) teachers and half (49%) of headteachers stated that it sometimes or rarely met their needs.
Teachers who had been in the profession for longer (or older teachers) were significantly more likely to report that the software they used for schools’ functions met their needs only sometimes or rarely. Whilst the reasons for this were not explicit from this survey, this suggests that teachers who have been in the profession longer would benefit from additional CPD to ensure they are skilled and confident in their use of EdTech.
Suitability of EdTech devices
Overall, the majority of headteachers felt that the devices they used in school were completely or mostly fit for purpose. However, there remained a significant minority who said their devices were only partially or not at all fit for purpose:
• Specialised assistive devices and VR or AR headsets were the most likely to be deemed as only partially or not at all fit for purpose, suggesting that this technology has not worked well in schools.
• Furthermore secondary school headteachers were significantly more likely to state that the tablets, laptops and interactive whiteboards or blackboards used were only partially or not at all fit for purpose.

20
• Age and wear and tear were the main reasons that devices were deemed not fit for purpose, although in terms of tablet devices, schools also experienced issues with outdated, incompatible or unsupported software. This was likely to be a greater issue for primary schools as they were much more likely to use tablets compared to secondary schools.
It is clear that schools need to have a strategy and budget for the replenishment and upgrading of EdTech to ensure it meets their needs, now and in the future. However, given a large proportion of schools did not have an EdTech strategy in place (primary 62%, secondary 46%), there is an opportunity for DfE to further support schools in their strategy development.
Barriers
Headteachers and teachers indicated a number of barriers to the increased uptake of EdTech:
• Financial barriers were by far perceived as the biggest barriers, especially cost and budgetary constraints, although availability of technology in school (which is also likely to be linked to school budgets), was also cited.
• Pupil barriers were perceived by teachers to be major barriers and the availability of technology (94%) and internet connectivity (90%) in pupils’ homes were perceived to be the biggest barriers to increased uptake of EdTech after cost and budget. Secondary school teachers (in particular those from local authority maintained schools) perceived these factors to be ‘big barriers’. Pupils’ digital skills were also perceived as a barrier, although to a lesser degree.
• Staff barriers, including teachers’ skills, confidence and appetite for using EdTech also represented a substantial barrier. Almost nine out of ten headteachers (88%) and three-fifths of teachers (58%) cited teacher skills and confidence as a barrier to the increased uptake of EdTech. Teachers who mentioned this was a barrier for them were less likely to say that EdTech met their needs, saved them time and reduced their workload. These teachers were also less confident in their ability to deliver remote education.
• Connectivity barriers in school were also commonly mentioned, although they were more likely to be cited as ‘small’ barriers rather than ‘big’ barriers.
• Safeguarding and data concerns were also mentioned, especially by secondary school teachers, however overall this represented a ‘small barrier’ to the increased uptake of technology.

21
EdTech investment
School staff cited a number of key priorities for future investment:
• Supporting remote teaching and learning, offering blended learning and delivering lessons were priorities for headteachers and teachers.
• Teachers also suggested there should be a focus on supporting pupils with SEND, offering independent or online learning, planning lessons or curriculum content, and tracking pupil progress.
• Secondary schools were significantly more likely to have plans to invest in technology for blended learning, delivering lessons and for conducting formative and summative assessment.
• Technical survey respondents from secondary schools were more likely than those from primary schools to say they planned to invest in their networking, broadband or cyber security.
Headteachers tended to gain information on the efficacy of EdTech prior to making procurement decisions from education sector publications or websites, in-house evaluations (particularly for secondary) and user reviews. Sources of EdTech recommendations valued by headteachers and teachers were research bodies, leadership, teaching staff, technical staff and other schools specialising in technology.
INSET or face-to-face was the preferred route for future training or CPD on EdTech, particularly for teachers who lacked skills and confidence. Perceptions of the suitability of EdTech were lower for teachers who have been in the profession for longer and older teachers, which suggests they would benefit from additional training on effective EdTech use.
COVID-19 restrictions clearly presented a challenge to the delivery of face-to-face training, however online courses and webinars were also requested. There is also potential to support schools with cyber security training, as half of schools did not provide this type of training for staff.
Areas for future development
Some key areas to consider for future development emerged:
• Further research to better understand the underlying reasons that digital technology does not meet the needs of some schools, with in-depth understanding across different contexts to guide the targeting and development of future support programmes.

22
• Development of support and guidance for schools on creating their own sustainable digital strategy would be beneficial.
• Development of support for schools to overcome their key challenges around moving to the cloud, and development and provision of cyber security training materials for schools.
• Improvement in communications to schools about the digital technology support programmes available to them, both during COVID-19 and beyond.
• Facilitation of peer-to-peer training and support, especially to build teachers’ skills and confidence in using digital technology, with real-life examples of how EdTech is used in schools.
• Development of strategies to support schools with the procurement of EdTech, in particular technologies around offering guidance on transitions, careers support or health and wellbeing were also potential areas for future development, as these were less likely to be meeting schools’ needs.
• A review of the digital technology used for supporting pupils with SEND. Guidance on the use of accessibility features built into mainstream devices and software would be beneficial, especially for primary schools.

23
1. Introduction Education Technology (EdTech) refers to the practice of using technology to support teaching and the effective day-to-day management of education institutions. It includes hardware, software, digital resources and services that aid teaching, help meet specific needs, and support the daily running of education institutions (such as management information systems).
The use of technology in education has the potential to support reductions in teacher workload, cost savings, inclusive teaching practice and improved pupil outcomes, both within classrooms and to support remote teaching practice during emergency measures, such as COVID-19 related closures. In 2019, the Department for Education (DfE) published an Education Technology (EdTech) Strategy, Realising the potential for technology in education2. This set out DfE’s vision to support schools and colleges to embed technology effectively by supporting schools to better understand the opportunities and help tackle the barriers to effective adoption and use of EdTech.
To support the EdTech Strategy and to inform future technology policy development, the DfE commissioned CooperGibson Research (CGR) to conduct research to establish the state of technology across schools in England. The Department for Education began the commissioning process for a survey of the EdTech landscape in schools in early March 2020. The aim of the survey was to understand the current state of technology in schools, in order to: inform the steps government should take to helps schools embed and use technology to support cost savings, workload reductions and improved pupil outcomes; and to help the EdTech sector to understand the technology landscape of the school sector so that they can adapt and develop their tools in ways that reflect the current conditions within schools.
Following the Prime Minister’s announcement on 16th March of government measures to tackle the impact of coronavirus COVID-19, and the subsequent decision to close schools in England, Scotland, Wales and Northern Ireland, the Department determined that there was an ethical imperative to reduce the burden on schools during the crisis. In light of this, the commissioning process for the survey was paused. In June 2020, the Department reviewed this decision, in light of the dramatic shift towards remote teaching and learning, the increasing importance of technology to enable this, and concerns about an emerging digital divide. The commissioning process resumed in July 2020 and, while the original aims remained, the survey included an additional focus on how technology was being used to support remote teaching and learning. This would inform EdTech
2 Realising the potential of technology in education: a strategy for education providers and the technology industry (2019).

24
policy as well as policy for disadvantaged children and their families without digital access. This report presents the findings of this research.
1.1 Aims and objectives of the research The research aimed to understand the current technology landscape in schools to help inform steps taken to better support:
• Schools to embed and use technology well in ways that promote cost savings, workload reductions, improved pupil outcomes and resilience to future system shocks.
• The EdTech sector to understand the technology landscape of the school sector so that they can better adapt and develop their tools in ways that reflect the current conditions within schools.
The research was designed around the following objectives:
• Provide a nationally representative estimate of the scale of technology use in schools.
• Provide robust baseline data, against which the impact of policy can be measured going forwards.
• Identity statistically significant differences between school phase (primary and secondary schools) and respondent role (headteacher, teacher, technical lead) where relevant, to ensure that activity can be targeted appropriately.
1.2 Methodology The decision was taken to focus on maintained primary and secondary schools and to exclude colleges and special schools. Special schools and colleges have different mechanisms of support and are likely to experience different barriers. For example, colleges are more likely to report better broadband provision because Jisc provides practical support and guidance on this front. And the needs and demands are also likely to be very different for special schools compared to mainstream schools. As such, a questionnaire that works for mainstream schools would be unlikely to work effectively for special schools; and engaging special schools through a survey developed for mainstream schools would be a missed opportunity.
An online survey approach was utilised for the research. Due to the range of issues addressed, three surveys were developed in partnership with the DfE: a headteacher survey, a teacher survey and a technical survey.

25
The surveys were cognitively tested with 30 school staff members (senior leaders, teachers and IT leads) prior to distribution, to ensure that the questions across the three surveys were clear, unambiguous and that schools were able to select appropriate responses.
1.2.1 Sample
An engagement stage was used to provide schools with the opportunity to opt into the survey process. A sample of 12,000 schools was selected from the register of schools and colleges in England, ‘Get information about schools’ (GIAS), using a stratified random sampling approach. The sample of 12,000 was drawn randomly, stratified by region and school phase.
Each school was contacted by email to request their participation and nomination of appropriate members of staff who would be able to participate. Schools were asked to nominate up to five members of staff to take part:
• Headteacher survey: the Headteacher or other senior leader with strategic overview of EdTech within the school.
• Technical survey: a staff member with knowledge of EdTech capacity in school.
• Teacher survey: up to three teachers, with a mix of length of teaching experience, subject expertise and perceived proficiency with technology.
To minimise potential bias in the teacher survey (where those more IT proficient were nominated), schools were asked to nominate a mix of up to three teachers (as described above). The research team then purposively selected one teacher per school to be included in the survey sample, to ensure a spread of length of service, subject area and perception of IT skill level.
The recruitment of schools to the survey was undertaken between Monday 12th October and Friday 11th December 2020.
As a result of the engagement stage, 1,012 schools agreed to take part in the survey. Although schools were encouraged to provide the details of five staff members (one headteacher, one technical lead and three teachers), there was variability in the number of schools that provided all the contact details needed.
Table 1 presents the number of surveys that were disseminated to each role type across the sample of schools.

26
Table 1: Number of schools and respondents per role type in the survey sample
Number of schools
Number of headteacher
surveys
Number of technical surveys
Number of teacher surveys
1012 1001 975 943
1.2.2 Fieldwork
The survey fieldwork period ran from the 25th November 2020 to 29th January 2021.
Ahead of full launch, the surveys were tested via a soft launch, where survey links were distributed to a small sample of school contacts. The surveys were disseminated in rolling batches to account for the ongoing recruitment of schools. This ensured that there were no major time lags in schools being sent the surveys to complete once they had opted in. Survey invitations with unique survey links were emailed directly to respondents at each school.
Email reminders were used to encourage respondents to complete the survey. Where appropriate, respondents who had not completed the surveys were contacted by telephone to encourage their involvement.
1.2.3 Survey response
As shown in Table 2 below, 897 headteacher surveys, 854 teacher surveys and 804 technical surveys were received. The number of survey responses varied across schools:
• Responses were received for all three surveys in 654 schools.
• Responses were received for two surveys in 253 schools.
• Responses were received for one survey in 87 schools.
There were 18 schools which had originally agreed to participate that did not complete any of the surveys.

27
Table 2: Responses received by survey/respondent type
Survey type Number of survey responses
Response rate3
(opted in)
Response rate4
(schools invited to participate)
Headteacher survey 897 90% 8%
Technical survey 804 83% 7%
Teacher survey 854 91% 7% Table 3 provides a breakdown of the responses by respondent type and school phase.
Table 3: Responses received by survey/respondent type and school phase
Survey type Primary Secondary
Headteacher survey 687 210
Technical survey 619 185
Teacher survey 661 193
1.2.4 Sample profile
The profile of the schools which responded to the survey was compared to the national profile of schools. This then informed the data weighting approach that was undertaken. Further information on the school profile of the responses received can be found in Appendix 1.
Broadly, in terms of school type the sample achieved across the three surveys was similar to the national profile (see Appendix 1). The survey sample had a slightly lower proportion of academies (between 37% and 38% across the three surveys) compared to the national profile (41%), and a higher proportion of local authority maintained schools (between 60% and 61%) compared to the national profile (57%).
Small primary schools were under-represented in the survey sample (between 20% and 21% across the three surveys), compared to the national profile (28%), and large primary schools were over-represented (between 31% and 33%), compared to the national profile (28%). The survey sample included a higher proportion of large secondary schools (between 9% and 10%) than nationally (6%).
3 Response rate calculated from the number of each role type that opted into each survey (1,001 headteachers, 975 technical leads, 943 teachers). 4 Response rate calculated from the total number of schools (12,000) that were originally invited to take part in the survey.

28
Schools were represented across all Government Office Regions and this was broadly representative of the national profile (Appendix 1). In terms of Ofsted rating, the survey sample was also broadly similar with slightly more outstanding schools than nationally, and fewer schools rated as requires improvement.
1.2.5 Respondent roles
For the headteacher survey, most respondents were headteachers or equivalent (45%).
Over half of those responding to the teacher survey were qualified teachers on either the main pay range (30%) or the upper pay range (21%). Around one in eight (12%) were senior leaders and 27% held middle leader roles (such as head of subject or key stage).
The technical survey had a broad range of respondents with both technical and non-technical backgrounds. A full breakdown of the job roles of the technical respondents can be found in Appendix 1. However, as shown in Table 6 below, two-thirds (67%) of those who completed the technical survey were ICT leads or specialists, and 38% were middle leaders. A third (33%) of those who completed the technical survey were non-specialists.
Table 4: Respondent roles (headteacher survey)
Number of responses
% of responses
Executive headteacher / executive principal / CEO 37 4%
Headteacher / principal / head of school 408 45%
Vice principal / deputy headteacher 212 24%
Assistant headteacher / assistant principal 174 19%
Other 66 7%

29
Table 5: Respondent roles (teacher survey)
Number of responses
% of responses
Senior leader (e.g. deputy headteacher, assistant headteacher)
106 12%
Head of year 23 3%
Head of department 63 7%
Head of subject 89 10%
Head of key stage 59 7%
Qualified teacher (QTS/QTLS) on the upper pay range
180 21%
Qualified teacher (QTS/QTLS) on the main pay range who is not serving statutory induction
260 30%
NQT: Qualified teacher who is serving statutory induction
44 5%
Other 30 4%
Table 6: Respondent roles (technical survey)
Number of responses
% of responses
ICT/IT lead/specialist 538 67%
Middle leader 307 38%
Non-specialists 266 33%
Senior leadership team 180 22%
Learning support 16 2%
1.2.6 Weighting
Prior to analysis, data was weighted to match the profile for region within phase for the total population of primary and secondary schools on the GIAS database when the sample was extracted.

30
As noted in section 1.2.4, the profiles of the final sample achieved for all three surveys was also checked against the profile of the total population of primary and secondary schools for other key characteristics:
• School type.
• Size of school within phase.
• Ofsted rating.
• Proportion of pupils eligible for FSM.
It was noted that small schools were under-represented in the survey sample and large schools were over-represented, compared to the national profile. The data was therefore also weighted based on size of school within phase.5
1.3 Methodological considerations There are five important methodological considerations to note when considering the findings provided in this report:
• Self-selection response bias: schools were asked to opt-in to the survey process and to nominate staff to take part in each of the three surveys. The findings therefore, may be subject to self-selection bias. For example, schools which were more advanced users of educational technology or were more supportive and positive about the use of education technology may have been more likely to respond to the survey.
• Teacher selection and generalisability of views: teachers were sampled for involvement in the survey by the research team with the aims of ensuring there was a mix of subject taught, teaching expertise and confidence in the use of technology. However, there is still the potential for some bias in the teacher sample due to schools’ involvement in initially nominating teachers to participate in the survey.
• Interpretation of perception-based questions in the technical survey: respondents to the technical survey had varied roles, including both technical and non-technical ICT roles. This should be considered when interpretating the perception-based questions within the technical survey, particularly questions around fitness for purpose of devices. Views on such questions are likely to differ
5 See appendix 1.

31
dependent on whether the respondent has come from a technical or non-technical background.
• Impact of COVID-19: the COVID-19 global pandemic has caused significant disruption to schools over the last year, including the need for schools to move to remote learning at various times. This may make the EdTech Survey 2020/21 less comparable to any EdTech surveys that may take place in the future.
• Sample size for regional and phase analysis: analysis of sub-groups was conducted for region, phase, school type, school size within phase, rural vs urban and FSM levels. However, it was not possible to undertake sub-group analysis by phase within region, due to small base sizes achieved in some of these sub-groups. This meant it was not possible to robustly and confidently identify statistical differences between the sub-groups. Further analysis was undertaken by combining regions (e.g. North vs. Midlands vs. South). Where there are less than 50 respondents in a sub-group, this is highlighted as a low base throughout the report.
1.4 Analysis For the purposes of the analysis presented throughout the report, it is important to note:
• Responses from academies and free schools have been combined and are referred to as ‘academies’ throughout.
• School sizes by phase have been calculated using the national profile6 of schools from GIAS, for each phase (primary or secondary) these were banded into small, medium or large schools. Free school meal (FSM) levels were also calculated using the national profile of schools from GIAS, with each respondent school banded into a low, medium or high FSM school.7
• Different colour pallets have been used to represent the key sample groups displayed in the figures. Where two colour pallets are displayed on the same chart, the legend will reflect the first colour pallet only:
• Black / greys for data representing all schools which responded to the headteacher survey.
• Reds for data representing all schools which responded to the teacher survey. • Blues for data representing primary school respondents.
6 Excluding independent schools, special schools and alternative provision. 7 See appendix 1 for details.

32
• Oranges for data representing secondary school respondents.
• Where survey response codes have been combined (netted) in the report, there may be small differences compared to the data presented in the figures or tables due to rounding.
33
2. Benefits of EdTech This section describes perceptions of the impact of EdTech on cost savings, pupil attainment and workload. It also includes headteachers’ and teachers’ perceptions of the impact of EdTech on the time taken to complete key school administration and teaching functions.
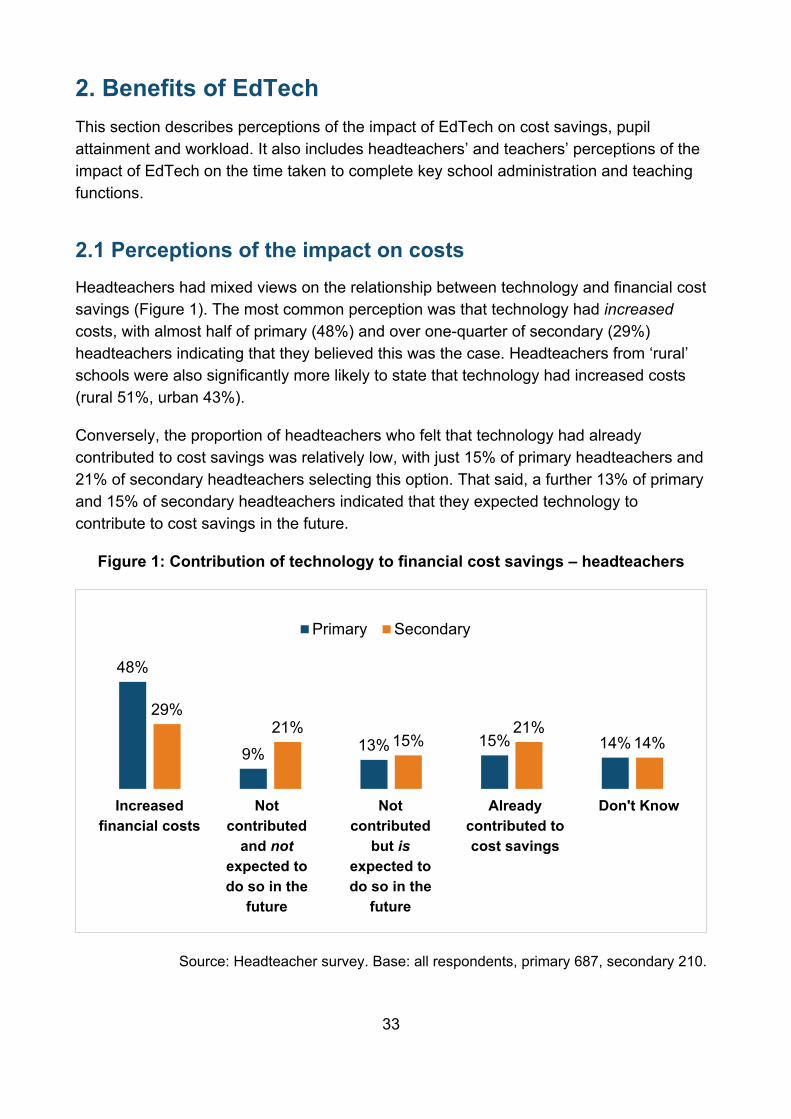
2.1 Perceptions of the impact on costs Headteachers had mixed views on the relationship between technology and financial cost savings (Figure 1). The most common perception was that technology had increased costs, with almost half of primary (48%) and over one-quarter of secondary (29%) headteachers indicating that they believed this was the case. Headteachers from ‘rural’ schools were also significantly more likely to state that technology had increased costs (rural 51%, urban 43%).
Conversely, the proportion of headteachers who felt that technology had already contributed to cost savings was relatively low, with just 15% of primary headteachers and 21% of secondary headteachers selecting this option. That said, a further 13% of primary and 15% of secondary headteachers indicated that they expected technology to contribute to cost savings in the future.
Figure 1: Contribution of technology to financial cost savings – headteachers
Source: Headteacher survey. Base: all respondents, primary 687, secondary 210.
48%
9% 13% 15% 14%
29%21%
15%21%
14%
Primary Secondary
Increased financial costs
Not contributed
and not expected to do so in the
future
Not contributed
but is expected to do so in the
future
Already contributed to cost savings
Don't Know

34
2.2 Perceptions of the impact on pupil attainment Perceptions of the impact of technology on pupil attainment were positive. Overall, the majority of headteachers (88%) and teachers (84%) believed that technology had or would contribute to improved pupil attainment (Figure 2). Over half (headteachers 55%, teachers 57%) believed that this positive impact had already been experienced and this was the most common response to this question. Furthermore, very few survey respondents believed that technology would not contribute to improved pupil attainment or that it had impacted negatively.
Figure 2: Contribution of technology to pupil attainment – headteachers and teachers
Source: Headteacher and teacher surveys. Base: all respondents, headteachers 897, teachers 854.
2.3 Perceptions of the impact on workload Headteachers and teachers were also broadly positive about the impact of technology on workload (Figure 3). Overall, three-quarters of headteachers (74%) believed that technology had already or would in the future reduce workload.
However, teachers were significantly less positive about this aspect compared to headteachers. Whilst overall the majority (65%) indicated that that their workload had already reduced or would do so in the future, a minority of teachers believed that technology had contributed to increased workload (16%). This was particularly the case amongst secondary teachers, who were significantly more likely than primary teachers to provide this response (secondary 22%, primary 14%). Given that almost all teachers had
0%7%
33%
55%
5%1% 4%
27%
57%
10%
Headteachers Teachers
Contributed negatively
Not improved and not
expected to do so in the
future
Not improved but is
expected to do so in the
future
Already contributed to
improved attainment
Don't Know

35
learned to use new technology in the past year (section 3.3.1), it would be interesting to revisit this measure again in the future to see if teachers’ responses change over time.
Figure 3: Contribution of technology to workload – headteachers and teachers
Source: Headteacher and teacher surveys. Base: all respondents, headteachers 897, teachers 854.
2.4 Impact of EdTech on time Headteachers and teachers were asked about the impact of the technology used in their school on the amount of time it takes to complete various tasks.
Overall, the majority of headteachers believed that the use of technology reduced the time spent on tasks (Figure 4). Very few stated that technology increased the time they spent on these tasks (5% or fewer for each task).
Positive impact was most likely to be mentioned for financial (92%) and pupil data management (92%). Over nine out of ten respondents indicated that technology saved them time on these tasks and over three-fifths indicated that it saved them ‘a lot of time’ (64% and 61% respectively). The vast majority of primary and secondary headteachers also stated that technology saved time on parental engagement (91%) and governance (88%).
The proportion of headteachers who stated that technology saved them time was lowest for supporting flexible working (76%), supporting pupils with SEND (72%) and timetabling (72%).
Some significant differences by phase were noted:
11% 13%
27%
47%
2%
16% 15%22%
43%
4%
Headteachers Teachers
Increased workload
Not contributed
and not expected to do so in the
future
Not contributed
but is expected to do so in the
future
Already contributed to
reduced workload
Don't Know

36
• Secondary school headteachers in particular believed that technology saved them ‘a lot of time’ on pupil data management (70%, significantly higher than seen for primary schools, 59%).
• A reduction in the time spent on timetabling was significantly more likely to be mentioned by secondary school headteachers (93%) compared to primary schools (65%). Furthermore, secondary school headteachers were significantly more likely to perceive that technology used for timetabling saved them ‘a lot of time’ compared to primary schools (secondary 75%, primary 27%). This is perhaps not surprising as timetabling is much more complex for secondary schools than for primary schools.
Figure 4: Impact of technology on time taken to complete tasks – headteachers
Source: Headteacher survey. Base: all able to rate technology used for task (variable for each statement) 591-888.8
Teachers were broadly positive about the impact of technology on the time taken to complete teaching-related tasks (Figure 5). The use of technology was most likely to save time on collaborating and sharing resources with other teachers (84%). More than
8 Not used and don’t know responses not included.
1%
3%
4%
2%
2%
3%
5%
7%
5%
4%
10%
26%
21%
23%
28%
31%
33%
42%
33%
45%
54%
64%
61%
58%
46%
39%
31%
18%
Financial management
Pupil data management
Parental engagement / communication
Communication with and delivery ofgovernance
Timetabling
Supporting flexible working practices
Supporting pupils with SEND
Increases time spent No difference Saves a little time Saves a lot of time

37
seven out of ten teachers felt that technology saved them time on tracking pupil progress (74%), planning lessons or curriculum content (73%) and delivering lessons (71%).
Whilst overall two-thirds (68%) of teachers believed that the technology they used to support remote teaching and learning had saved them time, one-quarter (24%) felt that it had increased the time they had spent.9
Figure 5: Impact of technology on time taken to complete tasks – teachers
Source: Teacher survey. Base: all able to rate technology used for task (variable for each statement) 759-841. 10
9 See section 6.3 for discussion of the impact of teacher skills and confidence on perceptions of the time spent on tasks. 10 Not used and don’t know responses not included.
4%
11%
11%
24%
12%
12%
11%
13%
12%
16%
15%
8%
17%
21%
29%
32%
35%
34%
37%
31%
36%
39%
38%
40%
49%
39%
37%
37%
35%
28%
22%
15%
Collaborating and sharing resources withother teachers
Planning lessons / curriculum content
Tracking pupil progress
Supporting remote teaching and learning
Delivering lessons
Conducting summative assessment
Conducting formative assessment
Supporting pupils with SEND
Increases time spent No difference Saves a little time Saves a lot of time

38
3. Remote education and schools’ response to COVID-19 On 20 March 2020, in response to rapidly escalating case numbers of COVID-19, English schools closed for all but the children of essential workers and those children deemed most vulnerable. Schools in England re-opened to all pupils from September 2020. However, from 5th January 2021, schools in England were closed to most pupils again due to COVID-19, for the majority of pupils. These school closures resulted in the majority of pupils being transitioned to remote learning.
This section explores the changes in technology that schools have made in response to COVID-19, utilisation of Government support programmes, approaches to delivery of remote learning and perceptions of how effectively schools can deliver remote education.11
3.1 Technology changes in response to COVID-19 Almost all headteachers (primary 94%, secondary 97%) indicated that their school had introduced, increased or upgraded technology in the previous 12 months (Figure 6). A minority had removed or decreased technology.
Figure 6: Changes to technology in the past 12 months - headteachers
Source: Headteacher survey. Base: all respondents, primary 687, secondary 210.
Almost two-thirds (64%) of headteachers indicated that the technology their school had introduced, increased or upgraded in the previous 12 months was partly due to COVID-
11 The survey fieldwork period ran from the 25th November 2020 to 29th January 2021. See appendix 2, Table 34, for data on impact of COVID-19 on schools between September 2020 and 4th January 2021 prior to their closure.
80%59%
2% 6%
84%66%
2% 3%
Introduced orincreasedtechnology
Upgraded existingtechnology
Removed ordecreasedtechnology
None of the above
Primary Secondary

39
19. A further quarter (28%) said all of the changes were made in response to COVID-19. A minority (7%) had already planned to make the changes before the pandemic. The response was similar across primary and secondary phases, although primary schools were significantly more likely than secondary schools to have already planned to make the changes prior to COVID-19.12
Schools had typically improved multiple types of technology in response to COVID-19 (Figure 7).
• Primary schools were most likely to have introduced, increased or upgraded a learning platform to set and receive pupils’ work (86%) due to COVID-19 and this was significantly higher than seen amongst secondary schools (63%).
• Conversely, secondary schools were most likely to have introduced, increased or upgraded technology to enable live remote lessons (89%) and digital devices for pupils to learn remotely (86%) due to COVID-19. The proportion of secondary schools that had invested in technology in these areas was significantly higher compared to primary schools. Secondary schools were also significantly more likely than primary schools to have improved the digital devices for staff to tech remotely.
Figure 7: Types of technology introduced, increased or upgraded due to COVID-19 - headteachers
Source: Headteacher survey. Base: all who have introduced, increased or upgraded technology in the past 12 months, primary 590, secondary 202.
12 All changes due to COVID-19 primary 28%, secondary 33%. Changes partly due to COVID-19 primary 64%, secondary 66%. Not due to COVID-19 primary 8%, secondary 2%.
86%68% 59% 52%
63%
86% 89%68%
A learning platform to set and receive
pupils’ work
Digital devices forpupils to learn
remotely
Technology toenable live remote
lessons
Digital devices forstaff to teach
remotely
Primary Secondary

40
Schools based in ‘urban’ locations were significantly more likely than those in ‘rural’ locations to have invested in digital devices for staff to teach remotely (urban 57%, rural 48%) and for pupils to learn remotely (urban 75%, rural 62%).
Differences also related to the timing of the survey. Headteachers who completed the survey after 4th January 2021 when all schools were closed to most pupils, were significantly more likely to say that the school had invested in technology to enable live remote lessons to take place (71%) compared to those who completed the survey before the school closures (62%).13 This suggests that the closure of schools to most pupils resulted in an increase in the proportion of schools investing in technology to enable them to offer live lessons to pupils learning from home.
3.2 Use of Government support programmes Almost all schools (primary 98%, secondary 99%) had taken up at least one of the Government support programmes presented in the headteacher survey (Table 7).
The programmes most commonly used by primary schools were the Oak National Academy offer (84%), the Online Platforms offer (75%) and the disadvantaged pupils devices offer (72%). Almost three-fifths (57%) of primary schools had utilised the curriculum resources list on Gov.uk.
The top three most commonly used programmes amongst secondary schools were the same as those used by primary schools: the disadvantaged pupils devices offer (94%), the Online Platforms offer (76%) and the Oak National Academy offer (72%). Almost three-fifths (56%) of secondary schools used the 4G wireless routers offer and over two-fifths (45%) used the curriculum resource list on Gov.uk.
Lack of awareness could be a barrier to update for some support programmes as programmes with lower uptake also tended to be those which schools were least aware of. Furthermore, a relatively large proportion of headteachers were unsure whether these programmes had been used. Increased communications with schools about these programmes would help to raise awareness and ensure that all schools are able to access the support that is available to them.
13 See section 3.3.2.

41
Table 7: Awareness and use of Government support programmes - headteachers
Used Not needed
Unaware Do not qualify
Don’t know
Oak National Academy curriculum offer
Primary 84% 13% 1% 1% 2%
Secondary 72% 23% 1% 1% 4%
Disadvantaged pupils devices offer
Primary 72% 10% 2% 14% 3%
Secondary 94% 2% 2% 2% 1%
Online Platforms offer Primary 75% 17% 2% 2% 3%
Secondary 76% 13% 2% 6% 4%
Curriculum resource list on Gov.UK
Primary 57% 22% 11% 1% 10%
Secondary 45% 26% 10% - 18%
4G wireless routers offer
Primary 16% 24% 26% 16% 18%
Secondary 56% 10% 11% 5% 19%
Mobile network data uplifts offer
Primary 23% 22% 29% 10% 16%
Secondary 26% 15% 22% 4% 33%
Other internet connectivity offers
Primary 20% 21% 27% 8% 24%
Secondary 27% 15% 17% 2% 38%
EdTech Demonstrator Programme
Primary 19% 29% 27% 3% 21%
Secondary 16% 29% 17% 2% 35%
BT Wifi codes offer Primary 6% 24% 42% 8% 20%
Secondary 10% 17% 31% 4% 38%
Source: Headteacher survey. Base: all respondents primary 687, secondary 210.
Some significant differences between primary and secondary schools emerged. Primary schools were significantly more likely to have taken up resources offers:
• Oak National Academy offer (primary 84%, secondary 72%).
• Curriculum resource list on Gov.uk (primary 57%, secondary 45%).

42
In comparison, secondary schools were significantly more likely to have taken up technology or connectivity offers:
• Disadvantaged pupils devices offer (primary 72%, secondary 94%).
• 4G wireless router offer (primary 16%, secondary 56%).
• Other internet connectivity offers (primary 20%, secondary 27%).
• BT wifi codes offer (primary 6%, secondary 10%).
Technology or connectivity offers were significantly more likely to have been taken up by schools which had completed the survey after schools closed to most pupils on 4th January 202114:
• Disadvantaged pupils devices offer (before closure 72%, after closure 84%).
• 4G wireless router offer (before closure 19%, after closure 30%).
• Mobile network data uplifts offer (before closure 16%, after closure 40%).
• BT wifi codes offer (before closure 4%, after closure 12%).
• Other internet connectivity offers (before closure 17%, after closure 30%).
Other differences in take up of some offers emerged across schools with different characteristics. Schools located in ‘urban’ locations, those with a high percentage of pupils eligible for free school meals (FSM) or larger primary schools were more likely to have taken up certain offers, in particular the disadvantaged pupils devices offer, 4G wireless routers offer or mobile network data uplifts offer.15
3.3 Delivery of remote education Headteacher survey responses received before the second school closure indicated that in the period between September 2020 and 4th January 2021 the vast majority of primary (83%) and secondary schools (95%) had experienced pupils learning from home.16 Around two-thirds of primary schools (66%) and secondary schools (66%) had experienced full or partial school closure or whole ‘bubbles’17, year or class groups
14 See appendix 2, Table 36. 15 See appendix 2, Tables 37-39 16 See appendix 2, Table 36. 17 Staff and / or pupils maintained in distinct groups that do not mix.

43
learning from home. Furthermore, 75% of primary and 96% of secondary schools had pupils learning from home at the time of completion of the headteacher survey.
3.3.1 Use of new technology to deliver remote education
Almost all teachers across both phases (primary 97%, secondary 96%) had learned to use new technology or features to enable them to deliver remote learning since March 2020.
Teachers were asked the extent to which they agreed that the new technologies or features they had learned to use since March 2020 would help them to deliver better remote and in-class education in the future.
The majority of primary (91%) and secondary (93%) teachers surveyed agreed that it would help them to deliver better remote education in the future (Figure 8). Secondary teachers in particular felt this was the case and were significantly more likely to ‘agree strongly’ with this statement compared to primary teachers.
It is encouraging to note that a substantial proportion of teachers expect that the technology which had been introduced to support remote learning would have an ongoing positive impact in the classroom. Just under half (47%) of primary school teachers and almost three-fifths (59%) of secondary school teachers agreed that it would help them to deliver better in-class education in the future.
Figure 8: Perceptions of the impact of new technologies learned to use - teachers
Source: Teacher survey. Base: all who have learned to use new technology or features since March 2020, primary 639, secondary 186.18
18 Don't know responses not shown.
2% 3%18% 15%6% 4%
34% 25%45% 35%
35%40%
46% 58%
13% 19%
Primary Secondary Primary Secondary
Strongly disagree / disagree Neither agree nor disagree Agree Strongly agree
Deliver better remote education in the future
Deliver better in-class education in the future

44
3.3.2 Delivery of remote education
Headteachers were asked how they had provided or planned to provide work for pupils who were learning from home (Figure 9).
Delivery via an online learning platform was the most common approach for both primary (83%) and secondary (94%) schools. The majority of secondary schools (83%) were also delivering work to pupils via live online lessons, however this approach was significantly less likely to be mentioned by primary headteachers (41%). By comparison, primary schools were significantly more likely to provide hard copy workbooks or worksheets than secondary schools (primary 68%, secondary 46%).
Figure 9: Provision of work for pupils learning from home - headteachers19
Source: Headteacher survey. Base: all respondents, primary 687, secondary 210.
Similar proportions of primary and secondary schools were utilising digital curriculum content tools and services (primary 62%, secondary 65%) or pre-recorded online lessons (primary 53%, secondary 58%).
19 Other responses included work shared via the school website, platforms for teachers to set work, platforms for pupils to submit completed work and devices for pupils to use.
83%
76%
68%
62%
53%
41%
42%
25%
21%
7%
94%
57%
46%
65%
58%
83%
56%
22%
21%
4%
Online learning platform
Emailing, phoning or messaging parents
Hardcopy workbooks / worksheets
Digital curriculum content tools andservices
Pre-recorded online lessons
Live online lessons
Emailing, phoning or messaging pupils
Online chatting
Home visits
Other
Primary Secondary
45
Communication with parents and pupils via email, telephone or messaging was also common. Primary schools were significantly more likely to communicate with parents in this way compared to secondary schools. Conversely, secondary schools were significantly more likely to communicate directly with pupils to provide work.
Differences also related to the timing of the survey. Headteachers who completed the survey after 4th January 2021 when all schools were closed to most pupils, said their school had used a wider range of approaches to provide work for pupils (mean number of approaches mentioned, 5.9) compared to schools which completed the survey before the school closures (mean number of approaches mentioned, 4.3).20 In particular, the largest increase was seen for providing live online lessons (37% before closure, increasing to 71% after closure) and pre-recorded online lessons (43% before closure, increasing to 76% after closure).
Where pupils lacked access to technology to enable them to use online or digital approaches, schools mainly provided hardcopy resources or loaned devices (Figure 10). Technical solutions to enable pupils to access the internet were significantly more likely to be mentioned by secondary headteachers compared to primary. In particular, secondary schools were almost five times more likely to loan wifi routers to pupils (53%) compared to secondary schools (11%). This was linked to the provision of live online lessons, which was significantly more likely to be mentioned as a method of providing work for pupils by schools which were loaning wifi routers (74%) compared to those which were not (44%).
As previously noted (Figure 9), primary schools were significantly more likely than secondary schools to provide hardcopy resources. A minority of headteachers said they did not have any pupils who lacked digital access, or they were unsure how work would be provided for pupils without digital access.
20 See appendix 2, Tables 40 and 41.

46
Figure 10: Provision of work for pupils learning from home who lack digital access - headteachers21
Source: Headteacher survey. Base: all respondents, primary 687, secondary 210.
3.3.2.1 Curriculum delivery
Overall, the majority of headteachers believed that their school would be able to deliver all or most of the regular curriculum to pupils whilst learning from home (Figure 11). The proportion of headteachers who believed their school could deliver all of the regular curriculum was relatively low, although secondary headteachers (19%) were significantly more likely to say so compared to primary headteachers (7%).22
Teachers were somewhat less confident about this aspect. Whilst the proportion of teachers who said they would be able to deliver all of the regular curriculum to pupils learning from home was similar to headteachers, significantly fewer primary and secondary teachers believed they could deliver most of it. Whilst it is not known from this
21 Other responses included providing SIM cards for pupils, conducting telephone calls to provide pupils with support, generating funding or donations of devices or data from external organisations, providing mobile phone-compatible resources and inviting pupils in to school. 22 The proportion of headteachers and teachers who felt they could deliver all or most of the regular curriculum to pupils learning from home was higher amongst those who completed the survey after schools closed to most pupils due to COVID-19 on January 5th 2021, compared to those who completed the surveys before this date, see appendix 2, Table 42.
77%
83%
38%
19%
11%
6%
3%
1%
91%
62%
38%
27%
53%
4%
4%
1%
Loaning devices (e.g. laptops)
Providing hardcopy resources
Providing technical guidance
Other technical solutions to enableinternet access
Loaning wifi routers
Other
None - all pupils have digital access athome
Don't know
Primary Secondary

47
survey what aspects of the regular curriculum teachers felt they could not deliver, this does suggest that there may be a significant learning gap.
Figure 11: Estimate of amount of regular curriculum delivered to pupils learning from home – headteachers and teachers
Source: Headteacher survey. Base: all respondents, primary 687, secondary 210. Teacher survey. Base: all respondents, primary 661, secondary 193.
3.4 Perceptions of remote education delivery effectiveness Headteachers were asked to what extent they agreed or disagreed with statements about their school’s ability to effectively support pupils to learn remotely. Teachers were also asked to what extent they agreed or disagreed with statements about their own ability to effectively support pupils to learn remotely (Figure 12).
Whilst the majority of headteachers (88%) agreed or strongly agreed that their school could ‘effectively support pupils to learn remotely’, responses from teachers were significantly less positive (68%). This suggests that teachers were less confident in their own ability to deliver the curriculum remotely than headteachers were about their school’s ability. Responses were similar across the phases, although secondary headteachers (31%) were significantly more likely than primary headteachers (21%) to strongly agree with this statement.
Headteachers and teachers were somewhat less confident that they could effectively support pupils with SEND (strongly agree / agree headteachers 60%, teachers 25%) or pupils with reduced digital access (strongly agree / agree headteachers 60%, teachers 21%) to learn remotely. Again, headteachers were significantly more likely than teachers to agree or strongly agree with these statements.
1% 3%30% 40%
16%32%
63% 51%
65%48%
7% 8% 19% 17%
Headteachers Teachers Headteachers Teachers
All of it
Most of it
Some of it
None / Don’t know
Primary Secondary

48
Figure 12: Agreement with statements – headteachers and teachers
Source: Headteacher survey. Base: all applicable respondents (variable for each statement) 893-897. Teacher survey. Base: all applicable respondents (variable for each statement) 850-853.23
3.5 Barriers to the use of technology for remote learning The main barriers to the effective use of technology for remote learning cited by headteachers were the same across primary and secondary phases (Figure 13):
• Pupils' access to digital devices (83%).
• Broadband or connectivity for pupils (75%).
• Parents' or pupils' digital skills (73%).
Cost was also mentioned as a barrier by almost two-thirds of headteachers (65%). More than two-fifths of headteachers (43%) cited the quality or availability of hardware or
23 Don't know responses not shown.
1%
2%
3%
13%
4%
18%
2%
13%
15%
38%
19%
46%
9%
16%
21%
20%
17%
13%
65%
58%
52%
23%
52%
19%
23%
9%
7%
2%
8%
2%
Headteachers
Teachers
Headteachers
Teachers
Headteachers
Teachers
Strongly disagree Disagree Neither Agree Strongly agree
Your school / you can effectively support pupils to learn remotely
Your school / you can effectively support pupils with SEND to learn remotely
Your school / you can effectively support pupils with reduced digital access to learn remotely

49
software as a barrier and broadband connectivity for staff was a barrier for just over one third (35%).
Any teacher-level barriers were mentioned by just over two-fifths of headteachers overall:
• Teachers' ability to incorporate technology into teaching (28%).
• Teachers' safeguarding and data security concerns (23%).
• Teachers' unwillingness to use technology (11%).
Significant differences were seen between primary and secondary phases:
• Primary headteachers were significantly more likely than secondary headteachers to mention parents' or pupils' digital skills and parental concerns as barriers to the effective use of technology for remote learning.
• Secondary headteachers were significantly more likely to mention broadband or connectivity for pupils, or for staff, and teacher level-factors (their ability to incorporate technology into teaching, safeguarding and data security concerns, and unwillingness to use technology).
Broadband or connectivity for staff was also significantly more likely to be mentioned by ‘rural’ schools (44%) compared to ‘urban’ schools (32%).24
24 No significant difference was seen between rural and urban schools for broadband or connectivity for pupils.

50
Figure 13: Barriers to the effective use of technology for remote learning – headteachers
Source: Headteacher survey. Base: all respondents, primary 687, secondary 210.
3.6 Additional support requirements Overall, the majority of teachers indicated that they needed some sort of additional support with using technology when pupils are learning from home (Figure 14).
Teachers’ greatest need was with monitoring pupil progress. Almost three-quarters (73%) indicated that they needed support in this aspect and over one out of ten teachers (12%)
83%
73%
75%
64%
42%
33%
26%
27%
23%
21%
9%
1%
86%
83%
66%
70%
47%
46%
35%
15%
29%
31%
18%
0%
Pupils' access to digital devices
Broadband or connectivity for pupils
Parents' or pupils' digital skills
Cost
Quality or availability of hardware orsoftware
Broadband or connectivity for staff
Teachers' ability to incorporatetechnology into teaching
Parental concerns
Lack of knowledge about whattechnology or approaches work well
Teachers' safeguarding and datasecurity concerns
Teachers' unwillingness to usetechnology
My school has not experienced anybarriers
Primary Secondary

51
said they required support ‘to a great extent’. No significant differences were seen overall between primary and secondary phases, however, teachers from local authority maintained secondary schools were significantly more likely to indicate that they required support with monitoring pupil progress (82%), compared to secondary academies (63%).
The majority of teachers requested support with engaging with pupils. Two-thirds (67%) of those surveyed stated that they needed support in this area, with no significant difference by phase.
Support needs were somewhat less prevalent for setting pupil work, although overall just over half of teachers (52%) said they required this type of support. Teachers working in the secondary phase (38%) were significantly less likely to request this type of support compared to primary teachers (55%), however, this was mainly driven by a lower proportion of secondary academies saying they required support ‘to a great extent’ or ‘to some extent’.25
Responses from headteachers on these measures were very similar to teachers.26
Figure 14: Extent to which additional support is required with using technology when pupils are learning from home - teachers
Source: Teacher survey. Base: all respondents 854.27
25 Although not significant due to the low base for local authority maintained secondary schools (n=45), the proportion of teachers from secondary academies which said they required support ‘to a great extent’ or ‘to some extent’ was 12%, almost half the figure seen for secondary local authority maintained schools (23%) or for primary schools (local authority maintained 23%, academies 23%). 26 See appendix 2, Table 43. 27 Don’t know responses not shown.
47%
32%
25%
30%
33%
29%
17%
27%
32%
4%
6%
12%
Setting pupil work
Engaging with pupils
Monitoring pupil progress
Do not require support Small extent Some extent Great extent

52
4. EdTech infrastructure This section describes the EdTech infrastructure of the schools that responded to the technical and headteacher surveys, including the types of technologies used and the number of devices available for teachers and pupils to use. It covers technical detail on the main operating systems used by schools, backups and wired end user bandwidth performance. It also includes data on the location of school storage and school systems (on-premise or cloud-based), and schools’ plans to implement cloud-based storage and systems in the future. Perceptions of the benefits of using the cloud and barriers to fully implementing the cloud in schools are also covered.
4.1 Wired end user bandwidth performance Technical survey respondents were asked what bandwidth performance was delivered to wired end users. A minority (2%) of primary school respondents indicated that they did not have any wired end users. Of all the (primary and secondary) schools that remained, a significantly larger proportion of primary school respondents were unable to answer this question compared to secondary school respondents (primary 36%, secondary 3%).28
Amongst the schools which were able to answer the question, the bandwidth performance delivered to wired end users was 1Gbps or less for the majority (Figure 15). However the bandwidth delivered was significantly higher for secondary schools compared to primary schools.
• One-fifth (21%) of secondary schools indicated the bandwidth delivered was up to 100Mbps and for almost seven out of ten (67%) the bandwidth was between 101Mbps and 1Gbps.
• By comparison, almost half (49%) of primary schools experienced up to 100Mbps and two-fifths between 101Mbps and 1Gbps (41%).
• Local authority maintained primary schools (51%) were significantly more likely to experience lower end user bandwidth of up to 100Mbps compared to primary academies (40%).
28 Respondents who were not IT specialists were significantly less likely to be able to answer this question (non-specialists 49% ‘don’t know’, IT specialists 18%).

53
Figure 15: Bandwidth delivered to wired end users – technical survey
Source: Technical survey. Base: all able to provide answer, primary 402, secondary 179.29
4.2 Storage and systems Responders to the technical survey provided information on the use of on-premise and cloud-based storage and systems at their school, including their perceptions of the benefits of cloud-based storage and systems, and barriers to full implementation.
4.2.1 On-premise and cloud-based storage
The majority of secondary schools used a mixture of on-premise and cloud-based storage (Figure 16).30 However, the picture was more mixed for primary schools:
• Primary schools (27%) were significantly more likely to use on-premise only curriculum storage compared to secondary schools (18%).
• Primary schools were also significantly more likely to use cloud-based only admin (12%) or curriculum (12%) storage compared to secondary schools (admin 1%, curriculum 6%).
• As a result, the proportion that used a mixture of on-premise and cloud-based admin or curriculum storage was significantly lower amongst primary schools (admin 58%, curriculum 58%) compared to secondary schools (admin 74%, curriculum 76%).
29 Don’t know responses not shown. 30 Local authority maintained secondary schools were significantly more likely to have on-premise only admin storage (36%) or curriculum storage (34%) compared to secondary academies (21% and 12% respectively).
49% 41%
7% 3%21%
67%
11%
Up to 100 Mbps >100Mbps up to1Gbps
>1Gbps up to10Gbps
>10Gbps
Primary Secondary

54
Figure 16: Type of storage – technical survey
Source: Technical survey. Base: all respondents primary 619, secondary 185.
Some differences were noted by school characteristics:
• Rural schools were significantly more likely than urban schools to have cloud-based only admin (14% versus 8% respectively) or curriculum storage (16% versus 10% respectively).
• Local authority maintained secondary schools were significantly more likely than secondary academies to have on-premise only admin (36% versus 21% respectively) or curriculum storage (34% versus 12% respectively).
4.2.2 On-premise and cloud-based systems
Overall, the location of school systems tended to be either on-premise only or cloud based only, rather than a combination of the two as seen for storage (Figure 17). However, it should be noted that a significant proportion of primary school respondents were unable to provide this information.
Some differences by phase and type of school emerged. In secondary schools:
• Management information systems tended to be on-premise only.
• Library management systems were the most likely to be cloud-based only.
• The location of finance and human resources (HR) systems was more mixed, although HR was the most likely to be located in a combination of on-premise and cloud-based systems.
4%
3%
26%
25%
27%
18%
58%
74%
58%
76%
12%
1%
12%
6%
Primary
Secondary
Primary
Secondary
Don't Know On-premise only Mixture Cloud-based only
Admin
Curriculum

55
• However, local authority secondary schools were significantly more likely to have their finance, management information or HR systems based on-premise only.31
Figure 17: Type of systems – technical survey
Source: Technical survey. Base: all respondents primary 619, secondary 185.
4.2.3 Benefits of cloud-based storage and systems
Overall, around nine out of ten schools had some sort of cloud-based storage or systems (primary 89%, secondary 95%), although very few primary schools (4%), were completely cloud-based for both storage and systems.
The vast majority of schools with any cloud-based storage or systems had experienced benefits through their use. The most common benefits reported were (Figure 18):
• Improved remote teaching and learning.
• Improved collaboration and communication between staff.
• Improved cross-site working or working on the go.
31 On-premise only finance (local authority maintained 57%, academies 35%), management information systems (local authority maintained 79%, academies 64%), HR (local authority maintained 46%, academies 29%).
Management information
Finance
Human Resources
Library management
12%
1%
15%
3%
22%
9%
36%
9%
36%
68%
33%
41%
28%
34%
27%
29%
26%
19%
31%
27%
32%
41%
15%
16%
26%
12%
22%
29%
17%
16%
21%
46%
Primary
Secondary
Primary
Secondary
Primary
Secondary
Primary
Secondary
Don't Know On-premise only Mixture Cloud-based only

56
The least common benefits mentioned were time or cost savings.
Secondary school technical survey respondents were significantly more likely to mention that their school had experienced benefits from their use of cloud-based storage or systems (Figure 18), in particular:
• Improved remote teaching and learning.
• Improved collaboration and communication between staff.
• Improved in–school learning.
• Cost savings.
Figure 18: Benefits of cloud-based storage or systems experienced – technical survey
Source: Technical survey. Base: all with any cloud-based storage or systems, primary 552, secondary 176.
78%
73%
74%
49%
39%
19%
5%
6%
94%
82%
79%
63%
41%
33%
1%
2%
Improved remote teaching and learning
Improved collaboration andcommunication between staff
Improved cross site working / working onthe go
Improved in-school learning
Time savings
Cost savings
None of the above
Don't know
Primary Secondary
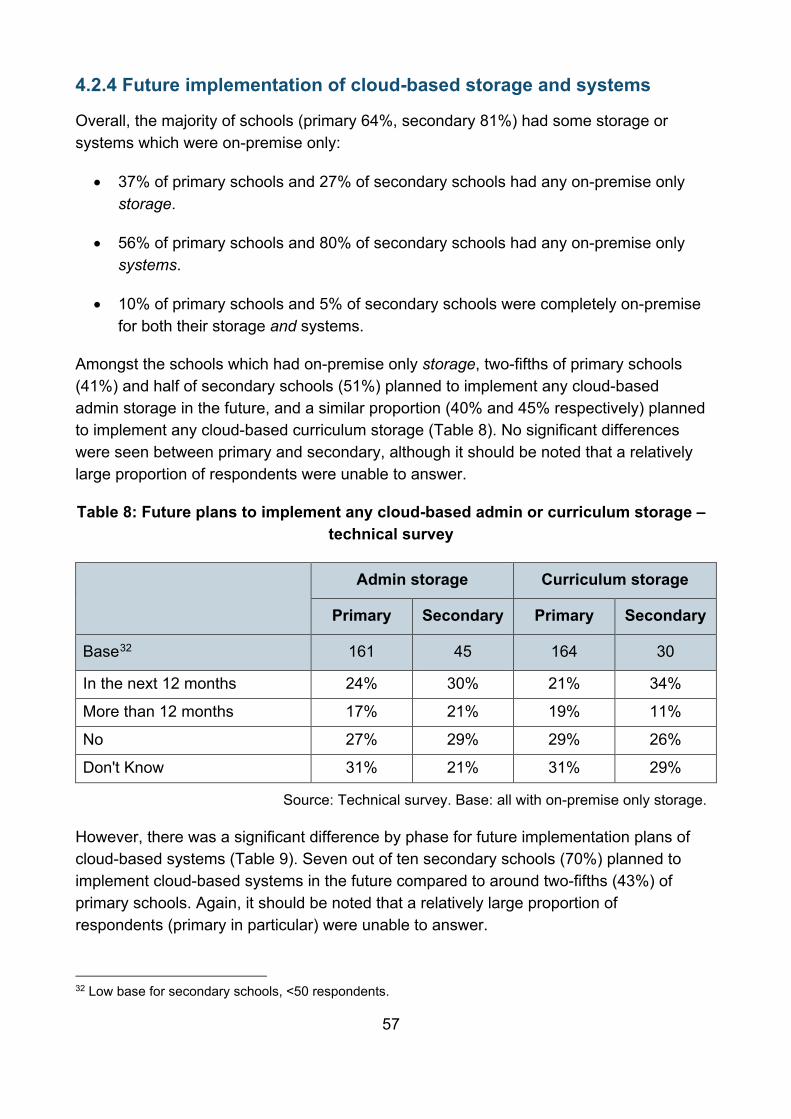
57
4.2.4 Future implementation of cloud-based storage and systems
Overall, the majority of schools (primary 64%, secondary 81%) had some storage or systems which were on-premise only:
• 37% of primary schools and 27% of secondary schools had any on-premise only storage.
• 56% of primary schools and 80% of secondary schools had any on-premise only systems.
• 10% of primary schools and 5% of secondary schools were completely on-premise for both their storage and systems.
Amongst the schools which had on-premise only storage, two-fifths of primary schools (41%) and half of secondary schools (51%) planned to implement any cloud-based admin storage in the future, and a similar proportion (40% and 45% respectively) planned to implement any cloud-based curriculum storage (Table 8). No significant differences were seen between primary and secondary, although it should be noted that a relatively large proportion of respondents were unable to answer.
Table 8: Future plans to implement any cloud-based admin or curriculum storage – technical survey
Admin storage Curriculum storage
Primary Secondary Primary Secondary
Base32 161 45 164 30
In the next 12 months 24% 30% 21% 34%
More than 12 months 17% 21% 19% 11%
No 27% 29% 29% 26%
Don't Know 31% 21% 31% 29%
Source: Technical survey. Base: all with on-premise only storage.
However, there was a significant difference by phase for future implementation plans of cloud-based systems (Table 9). Seven out of ten secondary schools (70%) planned to implement cloud-based systems in the future compared to around two-fifths (43%) of primary schools. Again, it should be noted that a relatively large proportion of respondents (primary in particular) were unable to answer.
32 Low base for secondary schools, <50 respondents.

58
Table 9: Future plans to implement any cloud-based systems – technical survey
Primary Secondary
Base 347 148
In the next 12 months 24% 52%
More than 12 months 19% 18%
No 22% 12%
Don't Know 34% 18%
Source: Technical survey. Base: all with any on-premise only systems.
4.2.5 Barriers to fully implementing cloud-based storage and systems
According to both primary and secondary school technical survey respondents, the biggest challenges they face in fully implementing cloud-based storage and systems were affordability and time (Figure 19).
Figure 19: Challenges to fully implementing cloud-based storage and systems (all schools) – technical survey
Source: Technical survey. Base: all with any on-premise storage or systems 774.
10%
11%
11%
8%
16%
11%
17%
22%
34%
39%
38%
58%
35%
26%
41%
35%
34%
24%
39%
41%
14%
17%
12%
7%
Time required to migrate to the cloud
Affordability of migrating to the cloud
Implementation guidance
Concerns over security
Procurement guidance and frameworks
Benefits are not clear
Don’t know Not a challenge Small challenge Big challenge

59
Affordability was significantly more likely to be cited as a ‘big challenge’ by local authority maintained schools (45%) compared to academies (35%).
The time required to migrate to the cloud was felt to be particularly challenging amongst secondary school respondents:
• Eighty-seven per cent of secondary schools cited the time to migrate to the cloud as being a challenge, and almost half (47%) cited it as a ‘big challenge’.
• By comparison, 71% of primary school respondents felt this was a challenge and 37% cited it as a ‘big challenge’, significantly lower than seen for secondary schools.
Security concerns were significantly more likely to be mentioned by secondary schools (63%) compared to primary schools (50%), although the proportion that noted this as a ‘big challenge’ was the same in both phases (primary 17%, secondary 17%). Support and guidance in these areas may help schools to overcome these challenges.
There also appears to be an opportunity to support schools with the procurement process for migrating storage and systems to the cloud. Almost half (46%) felt that procurement guidance was a challenge, although overall this was felt to be a ‘small challenge’ (34%), rather than a ‘big challenge’ (12%).
4.3 Main operating systems Almost all schools used any Windows product as their main operating system for user or desktop infrastructure (Table 10).
• Windows 10 (primary 91%, secondary 97%) was the most common Windows operating system used for user or desktop infrastructure.
• One-third (33%) of secondary schools and less than one out of ten (8%) primary schools used any type of Mac operating system.
• Other operating systems were mentioned by one-quarter (25%) of primary schools and almost one-fifth (18%) of secondary schools.

60
Table 10: Main operating systems used for user / desktop infrastructure – technical survey
Primary Secondary
NET: Any Windows 97% 99%
Windows 10 91% 97%
Windows 7 9% 7%
Windows 8 3% 6%
Windows XP 4% <1%
NET: Any Mac 8% 33%
Mac OS Sierra 3% 13%
Mac OS Ei Capitan 2% 14%
Mac OS Mojave 2% 10%
Other Mac 2% 5%
Google Chrome OS 23% 15%
Linux <1% 2%
Other33 2% 1%
Don’t know 2% 1%
Source: Technical survey. Base: all respondents primary 619, secondary 185.
The main operating systems used by schools for server infrastructure was also Windows (Table 11).
• Secondary schools typically used a Windows 2016 (66%), Windows 2019 (58%) or Windows 2012 (55%) server infrastructure operating system.
• For primary schools, one-fifth (21%) used a Windows 2016 system, one-seventh (14%) used Windows 2019 and one-fifth (21%) used Windows 2012. However, over two-fifths (43%) of primary school technical survey respondents were unable to provide this information, meaning there is a considerable level of missing data for this aspect.
• A minority of schools used any other operating system for server infrastructure, although mentions were significantly higher amongst secondary schools compared to primary schools.
33 Other mentions included Mac (type not specified) and Windows (mixed types specified).

61
Table 11: Main operating systems used for server infrastructure – technical survey
Primary Secondary
NET: Any Windows 55% 94%
Windows 2016 21% 66%
Windows 2019 14% 58%
NET: Any Windows 2012 21% 55%
NET: Any Windows 2008 6% 15%
Any Linux 1% 13%
Any Mac Server OS 1% 11%
Other34 2% 4%
Don't Know 43% 6%
Source: Technical survey. Base: all respondents primary 619, secondary 185.
4.4 Backups of critical data The majority of primary (80%) and secondary (87%) technical survey respondents agreed that they do retain offline backups of critical data (Figure 20). Although agreement was significantly higher amongst secondary school respondents, just over one-tenth (13%) of primary school respondents were unable to provide this information.
Figure 20: Retention of offline backups of critical data – technical survey
Source: Technical survey. Base: all respondents primary 619, secondary 185.
34 Other mentions included Windows (mixed or not specified), Mac mini and cloud services. Five respondents indicated that they did not have any on-site servers.
Primary Secondary
87%
12%1%
80%
6%13%Yes
No
Don't Know

62
Of the schools which did not retain offline backups of critical data or who were unable to answer (18% of all schools), over half (53%) were using some form of on-premise only storage or systems,35 which suggests they may be vulnerable to critical data loss.
4.5 Devices Technical survey respondents provided data on the types and number of devices they had available for teachers and pupils to use.
4.5.1 Devices for teachers to use
The schools that responded to the technical survey had a range of devices for teachers to use (Figure 21). The vast majority of primary and secondary schools had interactive whiteboards / blackboards and laptops for teachers to use. Most primary and secondary schools also had desktop computers available for teachers.
The proportion of schools which used specialised assistive devices was low, although it should be noted that a significant minority of technical survey respondents were unsure if their school used these devices (primary 15%, secondary 29%).
Some differences in the types of devices used by school phase were evident (Figure 21):
• Primary schools were significantly more likely to have interactive whiteboards / blackboards (primary 97%, secondary 91%) and tablets for teachers to use (primary 89%, secondary 64%) compared to secondary schools.
• Conversely, secondary schools were significantly more likely to have desktop computers for teachers to use (primary 81%, secondary 87%) and specialised assistive devices (primary 13%, secondary 24%) compared to primary schools.
Almost all respondents indicated that teachers were permitted to take portable devices, such as laptops and tablets, home (primary 96%, secondary 93%).
35 Amongst the schools which did not say they retained backups of critical data, the proportion of schools which had on-premise only admin or storage was: admin storage 27%, curriculum storage 26%, finance systems 29%, Management Information systems 28%, HR 22%, library management 28%.

63
Figure 21: Devices used in school – technical survey
Source: Technical survey. Base: all respondents primary 619, secondary 185.
4.5.2 Number of devices for teachers to use
Figure 22 presents the data on the number of devices available for teachers to use amongst the primary and secondary schools that responded to the technical survey. Table 12 and Table 13 summarise the distribution data for these devices (minimum, maximum, mean, median, first quartile, third quartile and the interquartile range).
The number of devices for teachers to use varied widely across the schools surveyed and typically increased with size of school.36 Secondary schools reported significantly more devices available for teachers to use compared to primary schools, which is to be expected given they are typically larger and generally have more teaching staff.
36 See appendix 2, Table 44.
2%
3%
4%
4%
2%
5%
2%
5%
15%
29%
1%
6%
3%
2%
8%
31%
17%
7%
72%
47%
97%
91%
93%
94%
89%
64%
81%
87%
13%
24%
Primary
Secondary
Primary
Secondary
Primary
Secondary
Primary
Secondary
Primary
Secondary
Don't Know No devices Have devices
Interactive whiteboards / blackboards
Teacher laptops
Teacher tablets
Teacher desktops
Specialised assistive devices

64
Figure 22: Number of devices for teachers to use in school (teachers) – technical survey
Source: Technical survey. Base: all respondents, primary 619, secondary 185.
The vast majority of primary schools (88%) had up to 20 interactive whiteboards or blackboards, with a mean of 11.5 and a median of nine amongst the schools that used them. Secondary schools typically had between 21-100 interactive whiteboards / blackboards (73%), with a mean of 44.2 and a median of 40.
The majority of primary schools had up to 50 laptops, tablets or desktops available for primary teachers and the average number of these devices was similar:
• Between 1-50 teacher laptops (85%), mean 25.2, median 15.
55%
10%
29%
5%
36%
33%
30%
8%
12%
21%
33%
8%
30%
9%
29%
7%
23%
5%
2%
9%
42%
26%
22%
16%
10%
21%
9%
1%
30%
6%
26%
5%
7%
5%
22%
1%
1%
2%
33%
3%
5%
2%
44%
Primary
Secondary
Primary
Secondary
Primary
Secondary
Primary
Secondary
Primary
Secondary
1-10 11-20 21-50 51-100 101+
Interactive whiteboards / blackboards
Teacher laptops
Teacher tablets
Teacher desktops
Specialised assistive devices

65
• Between 1-50 teacher tablets (81%), mean 22.7, median 14.
• Between 1-50 teacher desktops (74%), mean 23.4, median 15.
Amongst secondary schools, the number of laptops, tablets and desktop computers for teachers to use varied much more widely compared to primary schools:
• Over 20 teacher laptops (81%), mean 90.4, median 74.
• Between 1-50 teacher tablets (50%), mean 37.1, median 10.
• Over 50 teacher desktops (67%) 185.1 and a median 105.
As previously noted, a minority of technical survey respondents said their school used specialised assistive devices (Figure 21). Almost all primary respondents indicated that they had up to 10 devices, with a mean of 2.4 and a median of 1.0 (Figure 22 and Table 12). Similarly, secondary schools generally had up to 10 specialised assistive devices, although a minority of schools reported them in greater numbers (Figure 22). On average, secondary schools reported a mean of 7.5 devices per school and a median of 2 (Table 13).
Table 12: Distribution data for number of devices for teachers to use in school (primary) – technical survey
Interactive whiteboards / blackboards
Teacher laptops
Teacher tablets
Teacher desktops
Specialised assistive devices
Minimum 1 1 1 1 1
Maximum 150 450 416 416 20
Mean 11.5 25.2 22.7 23.4 2.4
Median 9 15 14 15 1.0
1st quartile 7.0 10.0 8.0 6.6 1.0
3rd quartile 15.0 30.0 22.0 27.8 2.0
Interquartile range
8.0 20.0 14.0 21.2 1.0
Source: Technical survey. Base: all respondents, primary 619.

66
Table 13: Distribution data for number of devices for teachers to use in school (secondary) – technical survey
Interactive whiteboards / blackboards
Teacher laptops
Teacher tablets
Teacher desktops
Specialised assistive devices
Minimum 1 1 1 1 1
Maximum 120 450 946 1500 85
Mean 44.2 90.4 37.1 185.1 7.5
Median 40 74 10 105 2
1st quartile 25.0 30.4 6.0 55.0 1.8
3rd quartile 60.0 120.0 41.4 247.5 9.3
Interquartile range
35.0 89.6 35.4 192.5 7.6
Source: Technical survey. Base: all respondents, secondary 185.
4.5.3 Ratio of devices for teachers to use
Analysis was conducted to establish the ratio of devices to teachers (desktop computers, laptops and tablets) by comparing the number of devices stated within the technical survey to the number of teachers within each school.37 (Tables 14 and 15).
This analysis indicates that the majority (86%) of primary schools which responded to the technical survey had at least one mobile device (tablets or laptops) for every teacher (ratio of 1:1) and it was more common for primary schools to have 1:1 mobile device access for teachers than to have 1:1 access to desktop computers (Table 14). The proportion of secondary schools which had at least a 1:1 ratio of mobile devices was significantly lower (69%) and this was mainly comprised of laptops rather than tablets (Table 15). Conversely, secondary schools were significantly more likely to have a 1:1 ratio for access to desktop computers for teachers compared to primary schools (66% versus 40% respectively).
37 Number of teachers as identified in the School Workforce Census, ‘Total number of teachers head count’. School Workforce in England, November 2019. Available at: School workforce in England, Reporting Year 2019 – Explore education statistics – GOV.UK (explore-education-statistics.service.gov.uk).

67
Table 14: Ratio of devices to teachers (primary) – technical survey
% of teachers
with access to a device
Minimum ratio
equivalent (devices : teachers)
Desktops Tablets Laptops Tablets / laptops
(combined)
None - 17% 8% 3% 1%
<24% <1:4 10% 4% 3% 1%
25%-32% 1:4 2% 3% 1% 2%
33-49% 1:3 5% 4% 3% 1%
50-99% 1:2 23% 33% 27% 8%
100%+ 1:1 40% 43% 57% 86%
Don’t know - 3% 3% 5% 3%
Mean - 135.5% 141.5% 165.8% 302.8%
Source: Technical survey. Base: all respondents primary 619.
Table 15: Ratio of devices to teachers (secondary) – technical survey
% of teachers
with access to a device
Minimum ratio
equivalent (devices : teachers)
Desktops Tablets Laptops Tablets / laptops
(combined)
None - 7% 31% 2% 1%
<24% <1:4 9% 37% 9% 6%
25%-32% 1:4 1% 3% 3% 4%
33-49% 1:3 3% 3% 6% 7%
50-99% 1:2 7% 8% 12% 9%
100%+ 1:1 66% 11% 62% 69%
Don't know - 7% 5% 5% 3%
Mean - 240.8% 35.7% 129.3% 161.7%
Source: Technical survey. Base: all respondents secondary 185.

68
4.5.4 Devices for pupils to use
Significant differences emerged between primary and secondary schools in their devices available for pupils to use (Figure 23).
The majority of secondary schools (94%) and primary schools (86%) had laptops for pupils to use, although the proportion was significantly lower in primary than seen for secondary. Additionally, primary schools tended to use tablets (88%) rather than desktop computers (60%), whereas it was more common for secondary schools to have desktop computers (95%) for pupils to use and less common for them to have tablets (58%).
Secondary schools that had portable devices such as laptops and tablets for pupils to use were significantly more likely than primary schools to report that pupils could take them home:
Figure 23: Devices for pupils to use in school – technical survey
Source: Technical survey. Base: all respondents, primary 619, secondary 185.
• Seven out of ten (71%) secondary schools permitted some pupils to take portable devices home, compared to two out of five (40%) primary schools.
• A small minority of schools allowed all pupils to take these types of devices home (primary 2%, secondary 5%).38
38 No significant differences were noted in the proportion of pupils who could take devices home between schools which completed the survey before schools closed to most pupils from 5th January 2021 due to COVID-19, compared to after schools closed.
2%
4%
3%
6%
2%
4%
12%
2%
9%
36%
38%
1%
86%
94%
88%
58%
60%
95%
Primary
Secondary
Primary
Secondary
Primary
Secondary
Don't Know No devices Have devices
Pupil laptops
Pupil tablets
Pupil desktops

69
• Just over half (55%) of primary schools and around one-quarter (24%) of secondary schools said they did not allow pupils to take any portable devices home.
• A further 3% of primary respondents said they did not know whether pupils could take portable devices home or not.39
Schools in London (61%) and the West Midlands (55%) were the most likely to allow pupils to take portable devices home, whereas schools in the South East (39%), East Midlands (43%), South West (44%), North East (44%) and North West (44%) were least likely. Permission for pupils to take portable devices home also increased with the size of school, with large schools (primary 50%, secondary 86%) significantly more likely to allow pupils to take devices home than small schools (primary 34%, secondary 69%).
4.5.5 Number of devices for pupils to use
Figure 24 presents the data on the number of devices available for pupils to use amongst the primary and secondary schools that responded to the technical survey. Table 16 summarises the distribution data for these devices.
Figure 24: Number of devices for pupils to use – technical survey
Source: Technical survey. Base: all respondents, primary 619, secondary 185.
The number of devices for pupils varied widely. On average, primary schools had a mean of 44.8 laptops, with a median of 30. The figures for tablet devices were similar. The number of desktop computers for pupils was somewhat lower. The majority of primary
39 No secondary respondents gave an answer of ‘Don’t know’ for this question.
11%
2%
9%
13%
21%
17%
6%
20%
10%
16%
1%
35%
9%
32%
12%
21%1%
15%
27%
18%
11%
2%
7%
7%
50%
9%
12%
1%
86%
Primary
Secondary
Primary
Secondary
Primary
Secondary
1-10 11-20 21-50 51-100 101+
Pupil laptops
Pupil tablets
Pupil desktops

70
schools that had pupil desktop computers had less than 50, with a mean of 21.7 devices and a median of 17.
Table 16: Distribution data for number of devices for pupils to use in school – technical survey
Primary Secondary
Pupil laptops
Pupil tablets
Pupil desktops
Pupil laptops
Pupil tablets
Pupil desktops
Minimum 1 1 1 4 1 20
Maximum 416 480 500 1600 1152 1500
Mean 44.8 48.6 21.7 168.7 86.8 279.7
Median 30 30 17 110 40 225
1st quartile 16.0 16.0 7.0 60.0 15.0 150.4
3rd quartile 60.0 60.0 30.0 200.0 90.0 330.0
Interquartile range 44.0 44.0 23.0 140.0 75.0 179.6
Source: Technical survey. Base: all respondents, primary 619, secondary 185.
As seen for devices for teachers to use (section 4.5.2), secondary schools tended to have more devices than primary schools (Figure 24 and Table 16).
• The vast majority of secondary schools which had desktop computers for pupils to use had over 100 devices. On average, secondary schools had 279.7 desktop computers for pupils to use, with a median of 225.
• The number of pupil laptops for pupils to use was somewhat lower, with a mean of 168.7 devices per school and a median of 110.
• Where secondary schools had tablets for pupils to use, the number of devices per school was typically much lower, with a mean of 86.8 devices and a median of 40.
The number of devices available for pupils to use also increased with size of school across both phases.40
40 See appendix 2, Table 45.

71
4.5.6 Ratio of devices for pupils to use
Analysis of the ratio of devices to pupils (desktop computers, laptops and tablets) was conducted by comparing the number of devices for pupils to use stated within the technical survey to the number of pupils within each school.41 (Tables 17 and 18).
The analysis indicates that just one per-cent of primary schools which responded to the technical survey had access to at least one mobile device (tablets or laptops) for every pupil (ratio of 1:1) and three-fifths (61%) had access to one device for every four pupils or less (ratio of 1:4 or lower). Access to desktop computers was much lower within primary schools, with the majority having a ratio of less than 1:10 for desktops (78%).
Table 17: Ratio of devices to pupils (primary) – technical survey
% of pupils with access to a device
Minimum ratio
equivalent (devices :
pupils)
Desktops Tablets Laptops Tablets / laptops
(combined)
None - 38% 9% 12% 1%
<5% <1:20 20% 9% 11% 3%
5%-9% 1:20 20% 20% 18% 5%
10%-12% 1:10 7% 9% 11% 5%
13%-16% 1:8 8% 14% 15% 11%
17%-19% 1:6 2% 7% 7% 9%
20%-24% 1:5 1% 9% 7% 13%
25%-32% 1:4 <1% 10% 8% 15%
33-49% 1:3 <1% 6% 7% 21%
50-99% 1:2 1% 4% 3% 15%
100%+ 1:1 - <1% - 1%
Don’t know - 2% 3% 2% 1%
Mean - 5.1% 16.6% 14.8% 30.9%
Source: Technical survey. Base: all respondents primary 619.
Similarly, the proportion of secondary schools which had access to at least one mobile device for each pupil to use (ratio of 1:1) was also very low (2%) (Table 18). Device ratios
41 Data within GIAS on the ‘NumberOfPupils’ for each school was used to calculate the ratios where available. Where this data was not available, ‘SchoolCapacity’ was used.

72
for desktop computers were higher amongst the secondary schools which responded to the technical survey, with three-fifths (61%) having a device ratio of 1:5 or more (compared to 2% for primary schools).
Table 18: Ratio of devices to teachers (secondary) – technical survey
% of pupils with access to a device
Minimum ratio
equivalent (devices :
pupils)
Desktops Tablets Laptops Tablets / laptops
(combined)
None - 1% 36% 2% 1%
<5% <1:20 0% 33% 13% 9%
5%-9% 1:20 3% 12% 22% 16%
10%-12% 1:10 8% 4% 11% 8%
13%-16% 1:8 10% 2% 16% 14%
17%-19% 1:6 13% 2% 5% 12%
20%-24% 1:5 16% 1% 12% 13%
25%-32% 1:4 21% 2% 7% 11%
33-49% 1:3 16% - 5% 9%
50-99% 1:2 7% 1% 1% 3%
100%+ 1:1 1% 1% 1% 2%
Don’t know - 4% 6% 4% 2%
Mean - 26.9 4.9 16.0 20.4
Source: Technical survey. Base: all respondents secondary 185.
4.5.7 Technologies used in school
Of the range of other technologies presented in the headteacher survey (Table 19), assistive technology was reported to be the most commonly used, followed by learner analytics. Secondary schools were significantly more likely than primary schools to mention using these technologies. Secondary schools were also significantly more likely to mention using artificial intelligence technologies. Virtual reality (VR) and augmented reality (AR) technologies were used by a minority of schools.

73
Table 19: Technologies used in school - headteachers42
Primary Secondary
Assistive technology 29% 56%
Learner analytics 26% 51%
Artificial Intelligence 5% 18%
Virtual reality 6% 3%
Augmented reality 5% 2%
None of the above 52% 21%
Don't Know 2% 3%
Source: Headteacher survey. Base: all respondents, primary 687, secondary 210.
4.5.8 Assistive technologies used in school
The assistive technologies most commonly used by the schools which responded to the headteacher survey were text enlargement tools, followed by accessible / adjustable desks or seating, alternative keyboards, screen reader software and word prediction tools (Table 20).
Secondary schools (73%) were significantly more likely to use any of the assistive technologies compared to primary schools (52%).43 In particular, secondary schools were significantly more likely than primary schools to be using:
• Text enlargement tools.
• Accessible or adjustable desks / seats.
• Screen reader software.
• Electronic augmentative and alternative communication aids.
• Braille devices.
42 Caution should be taken in interpreting these findings as respondents may have differing understanding of what is included within these categories of technologies. 43 It should be noted that the proportion of schools which indicated that they used any of the assistive technologies presented in the survey was significantly higher than indicated in Table 20. This suggests that schools may be aware of the different types of assistive technologies once prompted, but do not necessarily associate all those technologies with the umbrella term of ‘assistive technology’.

74
Table 20: Assistive technologies used in school - headteachers
Primary Secondary
Text enlargement tools 20% 48%
Accessible or height adjustable desking / seating 21% 32%
Alternative keyboards 22% 16%
Screen reader software 14% 54%
Word prediction tools 21% 21%
Electronic augmentative and alternative communication aids
8% 15%
Alternative pointing devices such as trackballs 5% 7%
Eyegaze or headmouse input devices 2% 4%
Braille devices 2% 7%
Switch access devices 2% 1%
Other44 3% 7%
None of the above 43% 14%
Don't Know 4% 11%
Source: Headteacher survey. Base: all respondents, primary 687, secondary 210.
Large (60%) and medium (54%) sized primary schools and secondary schools (large 84%, medium 78%) were significantly more likely to use any assistive technologies compared to small primary (42%) and secondary (57%) schools. Some regional differences were noted. Schools in the South East (62%) were most likely to use any assistive technologies, whereas schools in the North East (43%) and East Midlands (43%) were least likely.45
4.5.9 Use of mainstream accessibility features
There may be an opportunity to support schools with better use of accessibility features built into mainstream devices and software, particularly in primary schools. Around one-third (32%) of primary headteachers indicated that their school already provided this type of support for pupils, with a further one in five (19%) planning to provide this type of support in future (Figure 25).
44 Other responses included text reader pens, hearing support aids, speech-to-text aids and literacy and language software. 45 See appendix 2, Table 46.

75
Support for pupils to use accessibility features was significantly higher in secondary schools, with half (51%) of headteachers indicating that they provided this support already and a further one out of ten (9%) planned to do so in the future.
However, it should be noted that a significant minority of headteachers across both phases did not know whether their school provided support for pupils to enable them to use accessibility features built into mainstream devices and software. Therefore, the actual proportion of schools who do provide this support may be different than reported in this survey.
Figure 25: Use of mainstream accessibility features – headteachers
Source: Headteacher survey. Base: all headteachers primary 687, secondary 210.
Secondary Primary
32%
19%31%
18%Yes
Not yet, but plan to
No
Don't Know
51%
9%17%
23%

76
5. Use of EdTech in schools This section covers headteachers’, teachers’ and technical survey respondents’ perceptions on the suitability of the EdTech used within their school, including the software, hardware, storage and networks. It includes data on the proportion of schools that have a digital technology strategy in place and schools’ cyber security management.
5.1 School EdTech strategy There is potential to support headteachers, particularly in primary schools, with the development of their EdTech strategy. Secondary headteachers were significantly more likely to state that they already had an EdTech strategy in place (54%) compared to primary schools (38%) (Figure 26). Over one-quarter of primary schools (28%) said they did not have or were unsure whether they had an EdTech strategy and a further third (33%) said a strategy was in development.
Figure 26: Proportion of schools with a digital technology strategy
Source: Headteacher survey. Base: primary 687, secondary 210.
Some significant differences were noted:
• Academies (53%) were significantly more likely than local authority maintained schools (34%) to have a strategy in place.
• Urban schools (45%) were significantly more likely than rural (31%) schools to have a strategy in place.
• Small primary schools were significantly less likely to have a strategy in place compared to medium and large primary schools (small 30%, medium / large 43%).
38%
33%
18%10%Yes
In planningNoDon't Know
54%28%
9%9%
Primary Secondary

77
A similar picture was seen for secondary schools (small 44%, medium / large 60%).46
• Schools in London (52%) and the North East (54%)47 were most likely to have a strategy already in place. Schools in the South East (34%), South West (36%) and East Midlands (38%) were least likely.48
Primary and secondary schools with an EdTech strategy typically had a school-specific strategy, although amongst academies a trust-wide strategy was more common (Table 21).
Table 21: Type of school digital technology strategy
School phase School type
Primary Secondary Academies
Local authority
maintained
Base 272 118 197 193
School-specific 59% 53% 40% 77%
Trust-wide 26% 46% 59% 3%
Local authority 15% 1% 1% 20%
Source: Headteacher survey. Base: all with an EdTech strategy.
5.2 Suitability of EdTech Schools were asked to evaluate the suitability of the software and devices they used in school. Headteachers and teachers provided feedback on whether software met their needs across key school administration, teaching and support functions. The extent to which devices were felt to be fit for purpose was evaluated by headteachers and responders to the technical survey, to understand perspectives from both a functional and technical point of view.
46 See appendix 2, Table 47. 47 Low base, <50 respondents. 48 See appendix 2, Table 48.

78
5.2.1 Software for school administration
Overall, the vast majority of schools which responded to the headteacher survey were using software for key school administration tasks (Table 22). A number of differences by phase were noted:
• Primary schools were significantly less likely than secondary schools to say that they used software for school timetabling or to support flexible working practices.
• Secondary schools were significantly less likely to say that they used software for financial management, although it should be noted that 19% of secondary school respondents were unable to answer this question (compared to 7% of primary school respondents).
Table 22: Use of software for school administration - headteachers
Primary Secondary
Timetabling 67% 99%
Financial management 92% 81%
Pupil data management 99% 99%
Parental engagement / communication 99% 100%
Supporting flexible working practices (e.g. part-time working)
85% 97%
Communication with and delivery of governance
94% 91%
Source: Headteacher survey. Base: all respondents, primary 687, secondary 210.
The majority of headteachers who responded to the survey said the software used for administration tasks was broadly sufficient for their needs (Figure 27). The software used for financial management and pupil data management in particular, worked well, with the largest proportion of headteachers across both primary and secondary stating that their needs were always met.
Software used for communicating with or engaging parents worked well overall, however headteachers from primary schools were significantly more likely to say that it met their needs ‘always’ (Figure 27).
There may be some opportunity to improve software aimed at supporting flexible working practices and timetabling.

79
• Around one quarter of primary (24%) and one-fifth of secondary (21%) headteachers indicated that software aimed at supporting flexible working practices met their needs only sometimes or rarely.
• Over one-quarter (26%) of primary headteachers stated that their timetabling software met their needs only sometimes or rarely compared to 6% for secondary schools. Furthermore, the proportion of primary headteachers who felt that it always met their needs was relatively low at 34%, whereas for secondary schools the figure was almost doubled (65%).
Figure 27: Extent to which software meets schools’ needs for administration – headteachers
Source: Headteacher survey. Base: all able to rate software used for task (variable for each statement) primary 464-683, secondary 171-210.49
49 Don’t know and not used responses not included.
Financial management
Pupil data management
Communication with / delivering governance
Parental engagement / communication
Supporting flexible working practices
Timetabling
1%
1%
1%
1%
6%
3%
11%
1%
4%
5%
4%
3%
8%
8%
7%
12%
18%
18%
15%
5%
36%
42%
39%
39%
46%
44%
54%
59%
46%
49%
40%
29%
60%
53%
57%
58%
45%
47%
39%
28%
30%
31%
34%
65%
Primary
Secondary
Primary
Secondary
Primary
Secondary
Primary
Secondary
Primary
Secondary
Primary
Secondary
Rarely Sometimes Mostly Always

80
5.2.2 Software for teaching
The vast majority of headteachers and teachers indicated that they used software for the teaching tasks listed in the survey (Table 23).
Table 23: Use of software for teaching – headteachers and teachers
Headteachers Teachers
Primary Secondary Primary Secondary
Base 687 210 661 193
Planning lessons / curriculum content 98% 99% 98% 99%
Delivering lessons 98% 99% 99% 100%
Conducting formative assessment 94% 99% 92% 96%
Conducting summative assessment 95% 97% 93% 94%
Tracking pupil progress 98% 99% 98% 100%
Collaborating and sharing resources with other teachers
100% 100% 98% 100%
Delivering teacher training / CPD 99% 100% 93% 96%
Supporting pupils with SEND 98% 99% 94% 91%
Communicating and engaging with parents50
- - 98% 97%
Source: Headteacher and teacher surveys. Base: all respondents.
Planning and delivering lessons, tracking pupil progress and collaborating or sharing resources were the teaching tasks that teachers felt were being best met by the software they used (Figure 28). Headteachers gave a very similar response.51
Some significant differences by phase were noted:
• Primary teachers were significantly more likely than secondary teachers to state that the software they used for tracking pupil progress always met their needs (primary 43%, secondary 31%).
• Whereas secondary teachers were significantly more likely to say the software they used for delivering lessons always met their needs (secondary 42%, primary 33%).
50 Data for communicating and engaging with parents for headteachers is detailed in Table 22. 51 See appendix 2, Table 49.

81
Figure 28: Extent to which software meets needs for teaching – teachers
Source: Teacher survey. Base: all able to rate software used for task (variable for each statement) primary 646-652, secondary 192-193.52
The picture was somewhat more mixed for other teaching functions (Figure 29).53 Overall, the majority of teachers said that the software they used for communicating and engaging with parents, delivering training and conducting assessments was broadly sufficient for their needs. However, the proportion of teachers who felt that the software they used for these functions always met their needs was lower than seen for planning and delivering lessons, tracking pupil progress and collaborating and sharing resources (Figure 28 and Figure 29).
52 Don’t know and not used responses not included. 53 Feedback from headteachers on these areas was very similar, see appendix 2, Table 49.
Planning lessons / curriculum content
Tracking pupil progress
Delivering lessons
Collaborating and sharing resources
3%2%
2%5%
3%1%
3%2%
10%12%
13%15%
15%12%
16%13%
37%38%
42%49%
49%45%
39%38%
50%49%
43%31%
33%42%
42%47%
PrimarySecondary
PrimarySecondary
PrimarySecondary
PrimarySecondary
Rarely Sometimes Mostly Always

82
Figure 29: Extent to which software meets needs for teaching – teachers
Source: Teacher survey. Base: all able to rate software used for task (variable for each statement) primary 608-648, secondary 177-187.54
Some differences by phase emerged:
• Whilst almost eight out of ten (78%) primary teachers felt that software used for engaging and communicating with parents met their needs all or most of the time, the figure was significantly lower amongst secondary teachers (64%).
• A significant minority of teachers felt that the software they used for formative assessment (primary 36%, secondary 34%) or summative assessment (primary 29%, secondary 36%) only met their needs sometimes or rarely and secondary headteachers in particular felt that this was the case.55 Furthermore, the proportion
54 Don’t know and not used responses not included. 55 There was a significant difference amongst headteachers for software used for conducting summative assessment. Two out of five (40%) secondary headteachers indicated that summative assessment software met their schools’ needs just sometimes or rarely, compared to 29% of primary headteachers.
Communicating and engaging with parents
4%
11%
4%
3%
9%
12%
11%
8%
14%
20%
18%
25%
22%
22%
21%
24%
25%
27%
42%
41%
47%
49%
48%
48%
42%
44%
39%
45%
32%
29%
31%
15%
27%
27%
28%
19%
25%
21%
11%
10%
Primary
Secondary
Primary
Secondary
Primary
Secondary
Primary
Secondary
Primary
Secondary
Rarely Sometimes Mostly Always
Delivering teacher training / CPD
Conducting summative assessment
Conducting formative assessment
Supporting pupils with SEND

83
who indicated the software always met their needs for these tasks was relatively low, suggesting that these types of software could work better.
The area where schools’ needs were least likely to be met by the software they were using was in supporting pupils with SEND. Almost three out of five (57%) teachers and half (49%) of headteachers believed that it met their needs sometimes or rarely.56
5.2.3 Software for remote, blended and independent learning
Teachers and headteachers were asked to provide their opinion on the extent to which software for remote, blended and independent learning met their needs in general (see section 3 for feedback specific to schools’ response to COVID-19).
The vast majority of schools indicated that they were using software for remote, blended and independent learning (Table 24). However, primary schools were significantly less likely to say that they used software for supporting blended learning and innovative teaching compared to secondary schools.
Table 24: Use of software for remote, blended and independent learning – headteachers and teachers
Headteachers Teachers
Primary Secondary Primary Secondary
Base 687 210 661 193
Offering independent / online learning 99% 99% 98% 97%
Supporting remote teaching and learning
99% 100% 98% 99%
Supporting blended learning and innovative teaching
95% 100% 88% 96%
Source: Headteacher and teacher surveys. Base: all respondents.
Whilst it is positive that the majority of teachers said the software they used to support these teaching functions met their needs all or most of the time, a significant minority stated that it only sometimes or rarely met their needs (Figure 30). The response from headteachers about these functions was similar.57 These responses suggest these could be potential areas for improvement.
56 No significant differences between primary and secondary were seen on this measure for teachers or for headteachers. 57 See appendix 2, Table 49.

84
Figure 30: Extent to which software meets needs for teaching – teachers
Source: Teacher survey. Base: all able to rate software used for task (variable for each statement) primary 583-650, secondary 187-192.58
5.2.4 Software for other school functions
The majority of primary and secondary schools indicated that they used software for tracking pastoral support, safeguarding and offering health and wellbeing support (Table 25). The use of software for other school support and management functions was more variable.
58 Don’t know and not used responses not included.
3%
2%
7%
4%
8%
5%
18%
16%
28%
23%
28%
24%
45%
53%
42%
41%
45%
48%
33%
30%
22%
31%
19%
23%
Primary
Secondary
Primary
Secondary
Primary
Secondary
Rarely Sometimes Mostly Always
Supporting remote teaching and learning
Offering independent / online learning
Supporting blended learning and innovative teaching

85
Table 25: Use of software for other school functions – headteachers and teachers
Headteachers Teachers
Primary Secondary Primary Secondary
Liaison with external support agencies
94% 93% 76% 53%
Tracking pastoral support 85% 97% 72% 79%
Safeguarding 94% 97% 91% 88%
Offering guidance on educational transition
78% 92% 53% 56%
Offering careers support 38% 95% 43% 68%
Offering health and wellbeing support 87% 94% 79% 79%
Source: Headteacher survey. Base: primary 687, secondary 210. Teacher survey. Base primary 661, secondary 193.
The vast majority (86%) of teachers felt that the software used for safeguarding met their needs always or most of the time (Figure 31).
Teachers were less likely to say that software used for the remaining school functions met their needs compared to the software they used for teaching (Figure 30 and Figure 31). In particular, the software used for offering guidance on transitions, careers support or health and wellbeing support were least likely to meet teachers’ needs. Responses from headteachers were similar.59
Given schools have been closed to the majority of pupils for a substantial proportion of the 2020 and 2021 school years, it is possible that schools’ perceptions of the suitability of software for offering guidance and support to pupils has been impacted by challenges around delivering this support remotely. It would be interesting to monitor schools’ perceptions of this software in the future, as they return to in-school teaching.
59 See appendix 2, Table 50.

86
Figure 31: Extent to which software meets needs for other functions – teachers
Source: Teacher survey. Base: all able to rate software used for task (variable for each statement) primary 602-287, secondary 105-169.60
5.2.5 Impact of experience on perceptions of software
More experienced teachers, who had been in the profession for six or more years, were significantly more likely than those who had been in the profession for up to five years to state that the software they used met their needs only sometimes or rarely across a number of school functions.61 These teachers were also significantly more likely to state that their skills and confidence with technology represented a barrier to their increased uptake of EdTech (see section 6.3). Whilst the reasons for this are unknown, this suggests that teachers that have been in the profession longer may benefit from additional CPD to ensure they are skilled and confident in their use of EdTech.
60 Don’t know and not used responses not included. 61 See appendix 2, Table 51.
1%
3%
9%18%
14%10%
14%17%
16%15%
31%1%
13%10%
28%29%
29%28%
36%31%
40%39%
29%38%
33%39%
42%42%
32%46%
35%37%
30%32%
29%30%
53%48%
22%12%
25%16%
15%15%
13%14%
11%12%
PrimarySecondary
PrimarySecondary
PrimarySecondary
PrimarySecondary
PrimarySecondary
PrimarySecondary
Rarely Sometimes Mostly Always
Safeguarding
Liaison with external agencies
Tracking pastoral support
Offering careers support
Offering guidance on educational transitions
Offering health and wellbeing support

87
5.2.6 Devices62
Although the majority of headteachers felt that the devices they used in school were completely or mostly fit for purpose, there was a significant minority who said they were only partially or not at all fit for purpose (Figure 32).
Figure 32: Extent to which devices are fit for purpose - headteachers63
Source: Headteacher survey. Base: all able to rate software used for task (variable for each statement) primary 602-287, secondary 105-169.64
Secondary academy headteachers, in particular, were most likely to say that the tablets, laptops and interactive whiteboards or blackboards they used were only partially or not at all fit for purpose.65
62 See appendix 2 for proportion of schools which stated they used these devices, Table 52. 63 Data for VR / AR headsets is based on primary and secondary combined as the base for secondary is too low to report on it separately (n= 22). 64 Don’t know and not used responses not included. 65 See appendix 2, Table 53.
Desktop computers
Tablet computers
4%2%
5%11%
4%4%
1%8%
11%9%
28%
25%26%
25%32%
29%32%
15%34%
26%19%
29%
47%47%
45%39%
45%44%
49%37%
36%52%
33%
24%26%
24%18%
22%21%
34%21%
27%19%
10%
PrimarySecondary
PrimarySecondary
PrimarySecondary
PrimarySecondary
PrimarySecondary
All schools
Not at all Partially Mostly Completely
Laptops / notebooks
Interactive whiteboards / blackboards
Specialised assistive devices
VR / AR headsets
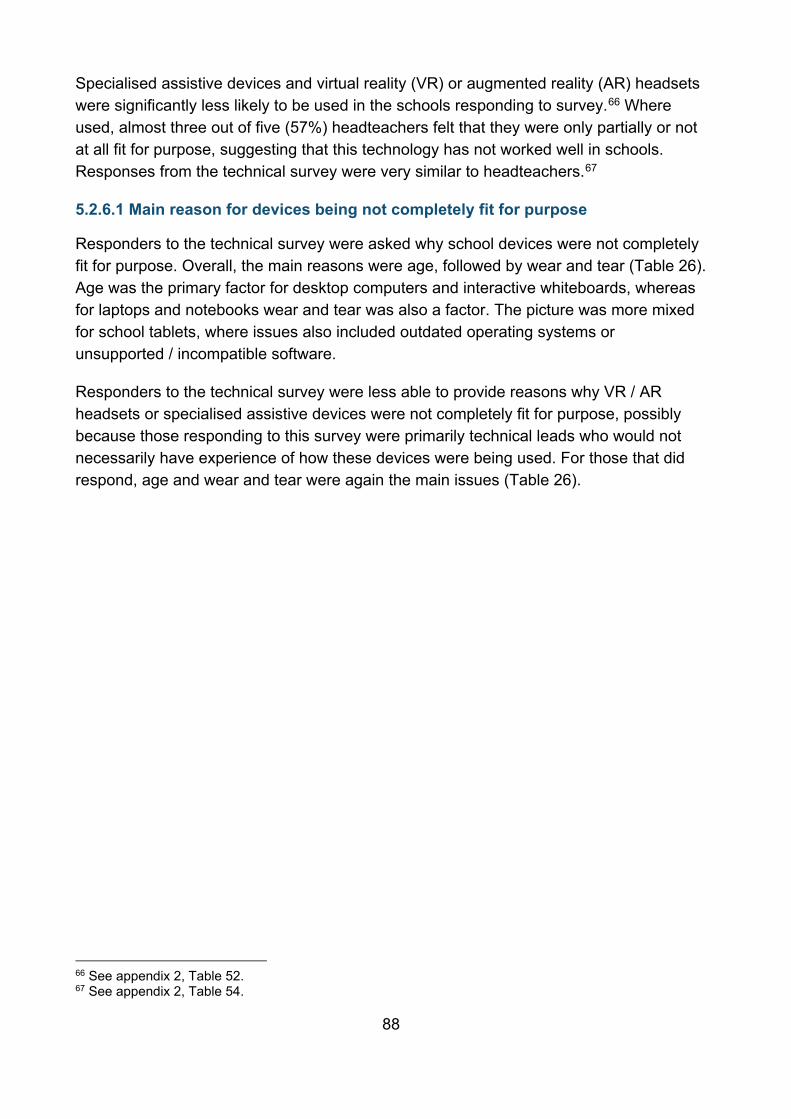
88
Specialised assistive devices and virtual reality (VR) or augmented reality (AR) headsets were significantly less likely to be used in the schools responding to survey.66 Where used, almost three out of five (57%) headteachers felt that they were only partially or not at all fit for purpose, suggesting that this technology has not worked well in schools. Responses from the technical survey were very similar to headteachers.67
5.2.6.1 Main reason for devices being not completely fit for purpose
Responders to the technical survey were asked why school devices were not completely fit for purpose. Overall, the main reasons were age, followed by wear and tear (Table 26). Age was the primary factor for desktop computers and interactive whiteboards, whereas for laptops and notebooks wear and tear was also a factor. The picture was more mixed for school tablets, where issues also included outdated operating systems or unsupported / incompatible software.
Responders to the technical survey were less able to provide reasons why VR / AR headsets or specialised assistive devices were not completely fit for purpose, possibly because those responding to this survey were primarily technical leads who would not necessarily have experience of how these devices were being used. For those that did respond, age and wear and tear were again the main issues (Table 26).
66 See appendix 2, Table 52. 67 See appendix 2, Table 54.

89
Table 26: Main reason devices not fit for purpose – technical survey
Desktops Tablets Laptops / notebooks
Interactive whiteboards / blackboards
VR / AR headsets
Specialised assistive devices
Age 69% 42% 53% 57% 22% 27%
Wear and tear
15% 17% 29% 19% 17% 19%
Outdated operating systems
7% 16% 6% 4% 4% 5%
Unsupported / incompatible software
3% 12% 4% 9% 7% 4%
Other reason 5% 10% 7% 9% 23% 20%
Don't Know 2% 3% 2% 2% 28% 26%
Source: Technical survey. Base: all who indicated devices are not completely fit for purpose (variable for each device).68
5.2.7 Storage and networks
The technical survey respondents at both primary and secondary schools regarded their schools’ digital storage, local area networks and servers to be broadly fit for purpose (Figure 33). Broadband connectivity worked well for the vast majority of secondary schools. However over one in six (16%) primary school respondents deemed it to be only partially or not at all fit for purpose, over double the figure seen for secondary schools. Furthermore, around one in five primary schools (21%) and one-quarter of secondary schools (26%) considered their wifi to be partially or not fit for purpose.
68 Base: desktops 515, tablets 537, laptops / notebooks 589, interactive whiteboards / blackboards 471, VR / AR headsets 50, specialised assistive devices 71.

90
Figure 33: Extent to which storage and networks are fit for purpose – technical survey
Source: Technical survey. Base: all able to rate function (variable for each statement) primary
588-612, secondary 182-185.69
Some differences by school characteristics were noted:
• Urban schools were significantly more likely than rural schools to say their wifi (82% versus 69% respectively), broadband connectivity (88% versus 78% respectively), servers (90% versus 81% respectively) and local area network (92% versus 83% respectively) were completely or mostly fit for purpose.
• Local authority maintained secondary schools were significantly more likely than secondary academies and primary schools to say their broadband connectivity (100% versus 91% and 84% respectively) and servers (97% versus 89% and 86% respectively) were completely or mostly fit for purpose.
• Schools in London were the most likely to say that their wifi (85%) or broadband connectivity (92%) were completely or mostly fit for purpose.
69 Don't know responses not included.
Broadband connectivity
Digital storage
Wifi
Local area networks
Servers
1%1%
1%
2%3%
3%1%
5%2%
8%9%
9%9%
11%6%
13%6%
16%24%
31%25%
40%39%
35%35%
39%28%
39%37%
60%65%
49%52%
51%56%
45%66%
40%37%
PrimarySecondary
PrimarySecondary
PrimarySecondary
PrimarySecondary
PrimarySecondary
Rarely Sometimes Mostly Always

91
• Schools in the North West and in the South West were the least likely to say the wifi (80% and 68% respectively) or broadband connectivity (79% and 77% respectively) were completely or mostly fit for purpose in their school.
5.2.8 Unified threat protection
The majority of technical survey respondents were fairly or very confident that their web filtering and monitoring, email filtering, user logging and up-to-date patching were adequate. Secondary school respondents were significantly more likely than primary school respondents to be confident in these aspects (Figure 34).
Confidence in multi-factor authentication was more mixed. Around two out of five (61%) primary school respondents and just over half (54%) of secondary school respondents were very or fairly confident in this aspect. Conversely, around one in seven (14%) primary respondents and one-third (34%) of secondary respondents were not confident in this aspect. However, it should be noted that those who responded to the technical survey on behalf of primary schools were significantly more likely than secondary school respondents to be unable to rate their confidence across all aspects.
Figure 34: Confidence in aspects of unified threat protection – technical survey
Source: Technical survey. Base: all respondents primary 619, secondary 185.
8%2%
9%2%
13%4%
24%3%
26%12%
1%2%
2%4%
6%8%
4%4%
14%34%
33%32%
38%45%
41%41%
35%45%
33%33%
58%65%
51%49%
40%47%
37%48%
28%21%
PrimarySecondary
PrimarySecondary
PrimarySecondary
PrimarySecondary
PrimarySecondary
Don't Know Not confident Fairly confident Very confident
Web filtering and monitoring
Email filtering
User logging
Up-to-date patching
Multi-factor authentication

92
5.2.8.1 Cyber security incidents
Major cyber security incidents were reported by a minority of schools who responded to the technical survey.70 Respondents reported that they had experienced one or two in the previous 12 months (primary 2%, secondary 5%), although one in five (primary 20%, secondary 18%) were unsure.
Minor cyber security incidents were more common and were significantly more likely to be reported by secondary schools (29%) compared to primary schools (7%).71 Minor incidents were typically experienced only once or twice in the previous 12 months, however almost one out of ten secondary schools (9%) reported three or more incidents. Over one-quarter of schools were unable to report how many minor cyber security incidents they had experienced (primary 27%, secondary 26%), although this may be a reflection of the profile of staff completing the technical survey, rather than an indication that they did not record this information.
5.2.8.2 Cyber security training
There may be an opportunity to support schools with delivery of training around cyber security. Just over one-fifth (22%) of primary schools and around one-third (32%) of secondary schools which responded to the technical survey said they did not provide cyber security training for their staff (Figure 35).
Figure 35: Staff cyber security training – technical survey
Source: Technical survey. Base: all technical survey respondents primary 619, secondary 185.
70 See appendix 2, Table 55. 71 See appendix 2, Table 56.
Primary Secondary
36%
16%7%
22%
20%Compulsory for allCompulsory for someOptionalNoDon't Know
34%
7%10%
32%
16%

93
6. Barriers This section covers headteachers’ and teachers’ perceptions of the barriers to increased uptake of EdTech. It includes headteachers’ perceptions of teacher confidence about using EdTech in the classroom and considers the perceptions of teachers who stated that their own skills and confidence represented a barrier to increased uptake of technology.
6.1 Financial barriers Cost and budgetary constraints were by far perceived as the biggest barriers (Figure 36). Over eight out of ten headteachers (86% and 85% respectively) and seven out of ten teachers (73% and 71% respectively) cited these aspects as ‘big’ barriers. The availability of technology in school (which is also likely to be linked to school budgets) was also cited by over half of headteachers (54%) and teachers (52%) as a ‘big barrier’.
Figure 36: Financial barriers to increased uptake of EdTech – headteachers and teachers
Source: Headteacher and teacher surveys. Base: all respondents, headteachers 897, teachers 854.
The cost of technology was most likely to be mentioned as a ‘big barrier’ by headteachers from rural schools (92%), small primary schools (92%) and those with a low proportion of pupils eligible for free school meals (90%). Similarly, the availability of technology in school was most likely to be mentioned as a ‘big barrier’ by headteachers from rural schools (65%) and small primary schools (64%).
4%
1%
7%
1%
1%
1%
3%
2%
4%
12%
14%
13%
20%
12%
19%
34%
34%
86%
73%
85%
71%
54%
52%
Headteachers
Teachers
Headteachers
Teachers
Headteachers
Teachers
Don’t know Not a barrier Small barrier Big barrier
Cost of technology
Budgetary constraints
Availability of technology in

94
6.2 Pupil barriers Teachers were asked to gauge the extent to which pupil factors represented a barrier to increased use of EdTech (Figure 37).72 Availability of technology (94%) and internet connectivity (90%) in pupils’ homes were perceived as major barriers and teachers believed them to be the biggest barriers to increased uptake of EdTech after cost and budget (Figure 36).
Figure 37: Pupil barriers to increased uptake of EdTech – teachers
Source: Teacher surveys. Base: all respondents, teachers 854.
Secondary school teachers (in particular those from local authority maintained schools) perceived these factors to be ‘big barriers’, significantly more so than primary teachers.73
Pupils’ digital skills were also perceived as a barrier by four-fifths of teachers, although this factor was cited primarily as a ‘small barrier’ (Figure 37). Again, local authority maintained secondary schools (52%) were most likely to perceive this aspect as a ‘big barrier’.74
6.3 Staff barriers Overall, three-quarters (74%) of headteachers estimated that all or most of the teaching staff in their school were confident about using EdTech in the classroom and one-quarter estimated that some or few teachers were confident (Figure 38).
72 Headteachers were not asked about these pupil-centred barriers. 73 See appendix 2, Table 57. 74 Compared to secondary academies (37%), local authority maintained primary schools (30%) and primary academies (29%).
2%
5%
1%
4%
5%
18%
33%
38%
50%
61%
52%
31%
Availability of technology in pupil’s homes
Internet connectivity at pupils’ homes
Pupils’ digital skills
Don’t know Not a barrier Small barrier Big barrier

95
Figure 38: Proportion of teaching staff who are confident in using EdTech in the classroom – headteachers
Source: Headteacher survey. Base: all respondents, primary 687, secondary 210.75
This suggests that one out of four schools in England may have a substantial proportion of their teaching staff lacking in confidence in using technology in their role and, according to one quarter of headteachers (24%), lack of skills and confidence represents a significant barrier to increased uptake of technology in schools (Figure 39).
Overall, almost nine out of ten headteachers (88%) believed that staff skills and confidence with technology was a barrier to increased uptake and responses were similar across phases (primary 87%, secondary 89%). Furthermore, more than two-fifths of headteachers (63%) felt that staff willingness to use technology was a barrier. Secondary headteachers in particular felt this to be the case (secondary 71%, significantly higher than seen for primary, 61%). Although headteachers mainly cited these factors as ‘small barriers’ rather than ‘big barriers’, this feedback suggests that staff factors represent a significant barrier overall.
Furthermore, a substantial proportion of teachers who responded to the survey cited their own skills and confidence (58%) as a barrier to the increased uptake of technology and one out of ten (11%) believed it represented a ‘big barrier’. Willingness to use technology was also cited as a barrier by almost one-third (31%) of teachers. Teachers who had been in the profession for six or more years and older teachers were significantly more likely to feel that their skills and confidence, and willingness to use technology, represented a barrier to their increased uptake of EdTech.76
75 Don’t know responses not included: primary 0%, secondary 1%. 76 See appendix 2, Table 58.
3%
2%
24%
17%
64%
74%
9%
6%
Primary
Secondary
None Few Some Most All

96
Figure 39: Staff barriers to increased uptake of EdTech – headteachers and teachers
Source: Headteacher and teacher surveys. Base: all respondents, headteachers 897, teachers 854.
The data suggests there is a link between teacher confidence and their perceptions of EdTech. Teachers who felt that their own skills and confidence did not represent a barrier to their increased uptake of EdTech were significantly more likely compared to those who said it was a barrier to:
• Say the software they used in the school always met their needs across a range of school functions.77
• Say the technology they used saved a lot of time when they were supporting remote teaching and learning (42% versus 34% respectively) and collaborating and sharing resources with other teachers (54% versus 44% respectively).
• Say that technology had already reduced their workload (49% versus 39% respectively).
These teachers were also more confident in their ability to deliver remote education, being significantly more likely to:
• Strongly agree that the new technologies or features they had learned to use since March 2020 would help them to deliver better remote education in the future (61% versus 39% respectively) and to deliver better in class education in the future (19% versus 10% respectively).
• Agree that they could effectively support pupils to learn remotely (75% versus 62% respectively).
77 See appendix 2, Table 59.
2%
12%
42%
37%
67%
63%
47%
55%
26%
24%
11%
7%
5%
Headteachers
Teachers
Headteachers
Teachers
Don’t know Not a barrier Small barrier Big barrier
Staff / your skills and confidence with technology
Staff / your willingness to use technology

97
Furthermore, those teachers who felt that their skills and confidence did represent a barrier were significantly more likely to say they would only be able to deliver ‘some’ of the regular curriculum to pupils learning from home (42% compared to 33% for those whom it was not a barrier) and less likely to say they could deliver ‘all’ of it (6% compared to 13% respectively).
These differences highlight the importance of teacher skills and confidence in maximising the uptake and effectiveness of EdTech.
6.4 Connectivity barriers Wireless and broadband connectivity in school were also cited as common barriers by a substantial proportion of schools although these aspects were more likely to be cited as ‘small’ barriers rather than ‘big’ barriers (Figure 40).
Figure 40: Connectivity barriers to increased uptake of EdTech – headteachers and teachers
Source: Headteacher and teacher surveys. Base: all respondents, headteachers 897, teachers 854.
No significant differences were seen in the proportion of primary and secondary headteachers who cited wireless connectivity as a barrier. However a significant difference was seen for teachers (primary 59%, secondary 67%). Conversely, no significant difference by phase was seen in the proportion of teachers who cited broadband connectivity as a barrier, but there was a difference for headteachers (primary 62%, secondary 51%).
Headteachers from small primary schools were most likely to cite broadband (31%) or wireless (33%) connectivity in school as being a ‘big barrier’. Headteachers from rural schools (32%) were also significantly more likely to cite broadband connectivity as a ‘big barrier’ compared to those from urban schools (22%).
3%
1%
2%
32%
37%
40%
42%
40%
40%
35%
37%
28%
21%
25%
19%
Headteachers
Teachers
Headteachers
Teachers
Don’t know Not a barrier Small barrier Big barrier
Wireless connectivity in school
Broadband connectivity in school

98
6.5 Other barriers Perceptions of whether safeguarding and data concerns was a barrier to the increased uptake of EdTech were mixed. Where cited as a barrier, overall it represented a ‘small barrier’ and a similar proportion perceived that it was not a barrier (Figure 41). That said, secondary teachers were significantly more likely than primary teachers to cite safeguarding and data concerns as a barrier to their increased uptake of technology (59% and 50% respectively), and local authority maintained secondary school teachers were particularly likely to say it was a ‘big barrier’ (31%).78 Overall, lack of clarity on the benefits of technology was not perceived to be a barrier to the uptake of EdTech.
Figure 41: Other barriers to increased uptake of EdTech – headteachers and teachers
Source: Headteacher and teacher surveys. Base: all respondents, headteachers 897, teachers 854.
Headteachers were also asked whether limited procurement guidance represented a barrier to increased uptake of EdTech. Overall, just over half (53%) of headteachers mentioned this as a barrier, although overall it was primarily seen as a ‘small barrier’ or ‘not a barrier’ (Figure 42).
Figure 42: Other barriers to increased uptake of EdTech – headteachers
Source: Headteacher survey. Base: all respondents 897.
78 Significantly higher than seen for secondary academies (10%), local authority maintained primary schools (9%) and primary academies (5%).
1%
5%
3%
8%
47%
44%
61%
64%
47%
42%
30%
24%
6%
9%
5%
4%
Headteachers
Teachers
Headteachers
Teachers
Don’t know Not a barrier Small barrier Big barrier
13% 35% 40% 13%Limited procurement guidance
Don’t know Not a barrier Small barrier Big barrier
Safeguarding and data concerns
The benefits of technology are unclear

99
7. Future Investment in EdTech This section covers headteachers’ plans to invest in technology in the near future and the functions which teachers consider to be high priority for investment for their school. Sources of information about EdTech and teachers’ CPD needs are also explored.
7.1 Technology investment The majority of headteacher survey respondents (primary 84%, secondary 85%) indicated they planned to invest in technology in the next three years.
The top areas mentioned focussed on technology to support the delivery of teaching and learning either in school or remotely (Figure 43):
• Supporting remote teaching and learning.
• Supporting blended learning.
Almost one-third of primary schools (31%) and two-fifths of secondary schools (38%) planned to invest in technology for delivering lessons and a similar proportion planned to invest in technology for communicating and engaging with parents (primary 31%, secondary 37%). Almost a third of headteachers planned to invest in technology to support pupils with SEND (primary 32%, secondary 29%).
Respondents were least likely to indicate that they planned to invest in technologies for liaising with external support agencies or tracking pastoral support.
Secondary headteachers were significantly more likely than primary headteachers to say that they planned to invest in the following areas:
• Supporting blended learning (secondary 50%, primary 39%).
• Delivering lessons (secondary 38%, primary 31%).
• Conducting formative assessment (secondary 24%, primary 12%).
• Conducting summative assessment (secondary 20%, primary 13%).
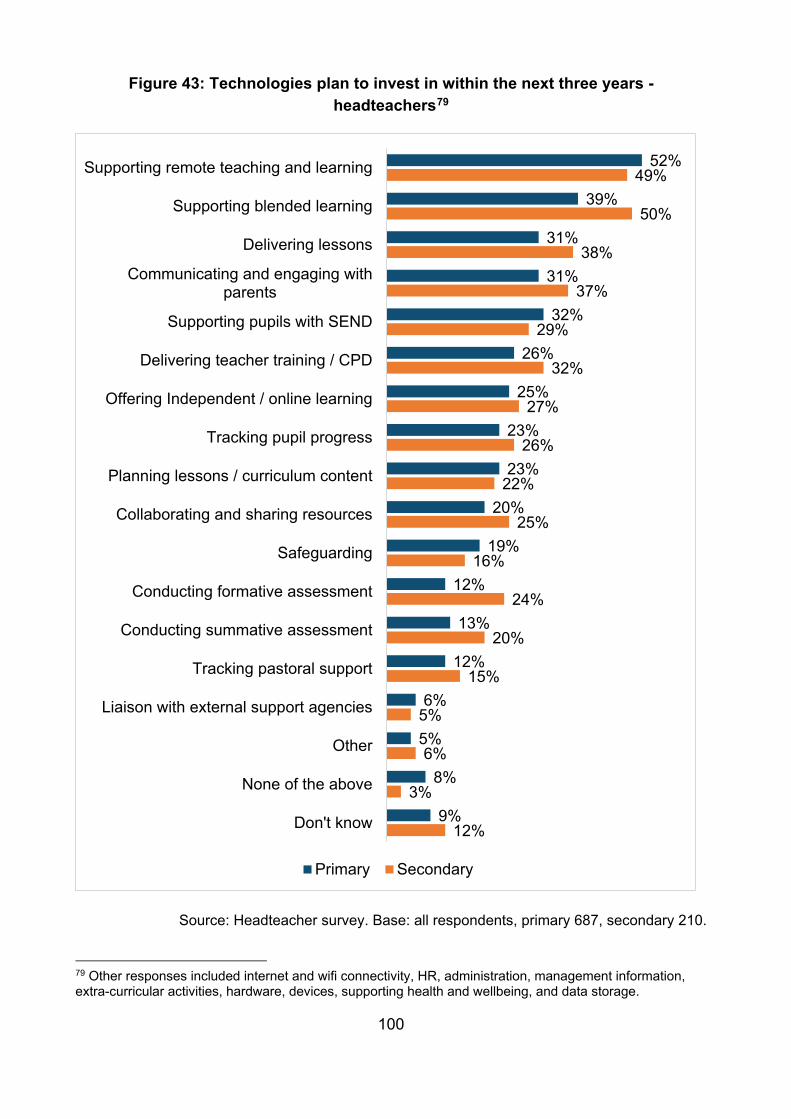
100
Figure 43: Technologies plan to invest in within the next three years - headteachers79
Source: Headteacher survey. Base: all respondents, primary 687, secondary 210.
79 Other responses included internet and wifi connectivity, HR, administration, management information, extra-curricular activities, hardware, devices, supporting health and wellbeing, and data storage.
52%
39%
31%
31%
32%
26%
25%
23%
23%
20%
19%
12%
13%
12%
6%
5%
8%
9%
49%
50%
38%
37%
29%
32%
27%
26%
22%
25%
16%
24%
20%
15%
5%
6%
3%
12%
Supporting remote teaching and learning
Supporting blended learning
Delivering lessons
Communicating and engaging withparents
Supporting pupils with SEND
Delivering teacher training / CPD
Offering Independent / online learning
Tracking pupil progress
Planning lessons / curriculum content
Collaborating and sharing resources
Safeguarding
Conducting formative assessment
Conducting summative assessment
Tracking pastoral support
Liaison with external support agencies
Other
None of the above
Don't know
Primary Secondary

101
Teachers were also asked to indicate the areas they personally regarded as high priority for technology funding for their school in the next three years. 80 Broadly, their priorities were similar to headteachers’, but with an even greater focus on the following:
• Supporting pupils with SEND (primary 50%, secondary 46%).
• Offering independent or online learning (primary 34%, secondary 46%).
• Planning lessons / curriculum content (primary 36%, secondary 34%).
• Tracking pupil progress (primary 30%, secondary 33%).
• Delivering lessons for primary teachers (43%).
Technical survey respondents were asked whether they had plans to invest in networking, broadband or cyber security in the next three years and there was a marked difference seen by phase (Figure 44).
Figure 44: Technologies plan to invest in within the next three years – technical survey
Source: Headteacher survey. Base: all respondents, primary 687, secondary 210.
Secondary school respondents were significantly more likely than primary schools to say they planned to invest in any of these three areas:
80 See appendix 2, Table 60.
27%
22%
11%
29%
30%
55%
32%
31%
11%
21%
Networking
Broadband
Cyber security
None of the above
Don't know
Primary Secondary

102
• Over half of secondary schools (55%) planned to invest in networking, almost one-third (32%) planned to invest in broadband and a similar proportion in cyber security (31%).
• In comparison, around one-quarter (27%) of primary schools planned to invest in networking, one-fifth planned to invest in broadband (22%) and one out of ten planned to invest in cyber security (11%).
Rural schools (30%) were significantly more likely to have plans to invest in their broadband compared to urban schools (22%). Schools that had implemented cloud-based storage or systems either wholly or partly in response to COVID-19 (41%) were significantly more likely to plan to invest in networking in the next three years compared to those which had already planned to implement the cloud (29%).
7.2 Sources of information about EdTech Headteachers were asked which channels they used to understand the efficacy of EdTech before making procurement decisions. Headteachers and teachers were also asked to select up to three sources whose recommendations they were most likely to value when it comes to choosing what EdTech to invest in.
7.2.1 Sources of education efficacy information
Key external channels for headteachers for information on the efficacy of EdTech prior to making procurement decisions were education sector publications or websites, mentioned by almost three-fifths (58%) of headteachers overall. Over two-fifths (43%) of headteachers also cited user reviews.
Over half of headteacher survey respondents (56%) mentioned that they conducted their own in-house evaluations before making procurement decisions, and this was significantly more likely to be mentioned by secondary schools (67%) compared to primary schools (53%) (Figure 45). This suggests that strategies which enable schools to try out technology before procurement would be beneficial.
Overall, around one-quarter of schools used consultancy (26%) or social media (23%) to help them make procurement decisions. However, these sources were significantly more likely to be mentioned by primary schools compared to secondary schools. Schools in rural locations were also significant more likely to use social media (32%) compared to urban schools (20%).

103
Figure 45: Channels used for understanding EdTech efficacy - headteachers81
Source: Headteacher survey. Base: all respondents, primary 687, secondary 210.
7.2.2 Recommendation sources – headteachers
Overall, research bodies (such as the Education Endowment Foundation) were the most common source of valued recommendations mentioned by headteachers, followed by teaching staff and technical staff (Figure 46). Other schools specialising in technology were also common sources of information about EdTech.
Secondary headteachers were significantly more likely to mention teaching staff, technical staff and leadership as their most valued sources of recommendations compared to primary headteachers.
Local authority maintained primary schools (31%) were significantly more likely to mention their local authority as a valued source of recommendations compared to
81 Other responses mainly comprised: other schools / teaching professionals (37 mentions), IT specialists (15 mentions) and the local authority (5 mentions).
59%
53%
43%
28%
24%
19%
9%
8%
4%
55%
67%
44%
18%
17%
26%
14%
5%
5%
Education sector publications /websites
In-house evaluations
User reviews
Consultancy
Social media
Exhibitions / conferences
Academic journals
Other
Don't know
Primary Secondary

104
primary academies (8%), secondary academies (3%) and local authority maintained secondary schools (5%).
Sources least likely to be mentioned were unions (1%), trade bodies (1%) and commercial suppliers or vendors (3%). One out of twenty primary school respondents (5%) mentioned school governors or trustees as a valued source of recommendations about technology, however secondary schools (1%) were significantly less likely to mention this source.
Figure 46: Top three most valued sources of recommendation when choosing EdTech – headteachers
Source: Headteacher survey. Base: all respondents, primary 687, secondary 210.82
82 Other responses included other IT specialists, support or consultants, other schools, education organisations and associations, multi-academy trusts and pupils. Don’t know responses not shown.
56%
45%
42%
41%
31%
25%
16%
7%
5%
3%
0%
1%
52%
58%
52%
36%
45%
3%
16%
5%
1%
3%
1%
0%
Research bodies
Teaching staff
Network, IT or Business Managers
Other schools specialising in technology
Leadership staff
Local authority
EdTech Demonstrator schools orcolleges
Government
Governors / Trustees
Commercial suppliers or vendors
Relevant trade bodies
Unions
Primary Secondary

105
7.2.3 Recommendation sources – teachers
Amongst teachers, colleagues were the most common source of valued EdTech recommendation, followed by leadership and other schools specialising in technology (Figure 47).
Figure 47: Top three most valued sources of recommendation when choosing EdTech – teachers
Source: Teacher survey. Base: all respondents, primary 661, secondary 193.83
83 Other responses included other IT specialists, support or consultants, other schools, education organisations and associations, pupils and parents, education networks and professional trainers / CPD providers. Don’t know responses not shown.
64%
53%
43%
29%
21%
12%
12%
6%
5%
3%
1%
1%
71%
39%
42%
38%
30%
12%
5%
6%
3%
1%
2%
0%
Teaching staff
Leadership staff
Other schools specialising in technology
Research bodies
Network, IT or Business Managers
EdTech Demonstrator schools or colleges
Local authority
Unions
Government
Governors / Trustees
Commercial suppliers or vendors
Relevant trade bodies
Primary Secondary

106
Sources of recommendations significantly more likely to be used by teachers compared to headteachers were:
• Teaching staff, leadership and unions (although mentions of unions were still very low amongst both teachers and headteachers).
• Secondary teachers were significantly more likely to mention other schools specialising in technology compared to secondary headteachers.
Conversely, sources that were significantly less likely to be mentioned by teachers compared to headteachers were:
• Research bodies, Network, IT or Business Managers or EdTech Demonstrator schools or colleges.
• Primary teachers were significantly less likely to mention leadership and the local authority compared to headteachers.
7.3 Training and CPD Teachers were asked how they would like to access training on how to use EdTech (Figure 48).
INSET days or face-to-face training were the most popular approach, followed by training delivered by other teachers or leaders.84 Online courses and webinars were also relatively common mentions.
84 Secondary teachers were significantly more likely to mention training via other teachers / leaders compared to primary teachers (62% versus 53% respectively).

107
Figure 48: Preferred ways to access to training on how to use EdTech - teachers
Source: Teacher survey. Base: all respondents, primary 661, secondary 193.
However, teachers who felt that their skills and confidence were a barrier to their increased technology use were significantly more likely to request training via INSET days / face-to-face (76%) and less likely to say online courses (48%) or webinars (33%) compared to those for whom this was not a barrier (69%, 62% and 46% respectively). This suggests that training for those who are the least confident in using technology may be more effective if it is conducted face-to-face within the school.
Training via the local authority was least likely to be mentioned, although it was significantly more likely to be mentioned by primary schools compared to secondary schools (16% versus 3% respectively).
Teachers were also asked what they felt would improve the quality of CPD in the use of EdTech:
• Half of teachers (50%) indicated that DfE accredited training courses in the use of technology would improve the quality of CPD.
• More than two-fifths (44%) mentioned mandatory CPD on technology use.
73%
55%
54%
38%
21%
19%
18%
14%
1%
1%
INSET days / face to face
Via other teachers / leaders
Online courses
Webinars
Via teacher training programmes
Directly through education technologysuppliers
Via EdTech Demonstrator schools
Via the Local Authority
Other
Don't know

108
• A similar proportion (42%) indicated that more information on what good technology use looks like in the early careers framework would help.
No significant differences were noted between primary and secondary teachers on these aspects. Other suggestions made by teachers included:
• Peer-led training tailored to the tech used in school, including observation and examples of how EdTech is best used in practice.
• Research and evidence-based training, including evidence on the benefits of technology use in education.
• Strategic planning for EdTech and the provision of standards or a framework to work towards.
• Access to high quality technology in sufficient quantities so that it can be used effectively in schools.
• Funding for schools so they could invest in the technology and CPD that is already available.
• Increased planning, preparation and assessment time (PPA) to allow teachers to take part in CPD and embed technology use in their practice.
• Advice on what EdTech there is available and opportunities to trial technology in schools.
• Training and CPD from technology manufacturers and the opportunity to gain accreditations or qualifications.

109
8. Conclusions Evidence from the EdTech Survey 2020-21 suggests that many schools have successfully implemented and used technology to support teaching and learning and help them with their day-to-day management. The past year has been a period of great change and schools have faced new challenges in delivering education remotely due to COVID-19. Schools have responded by investing in technology and this has meant that almost all teachers have had to learn how to use new software or features since March 2020.
Overall, schools perceived that the EdTech they have used has saved them time, reduced teacher workload and contributed to improved pupil attainment. In particular, schools have relied heavily on EdTech to deliver remote education and positively, the majority believed that they could effectively support pupils to learn remotely.
However, some schools reported that the technology they used did not sufficiently meet their needs and schools were less confident about their ability to support certain groups of pupils to learn remotely, such as pupils with SEND or those with reduced digital access. It is also acknowledged that the findings of this research may be presenting an overly positive picture, as the schools which decided to become involved in this research may be those which are more confident or advanced in their use of EdTech.
Key barriers to the use of EdTech were identified which should be considered in developing strategies to support schools, including the cost of EdTech, quality or availability of technology and wireless or broadband connectivity for staff, particularly for small primary schools. Teacher skills and confidence also represented a significant barrier and was associated with poorer perceptions and experiences of using EdTech amongst teachers. The main barriers to the effective use of EdTech for remote learning were not within the school itself, rather they were challenges around pupils’ ability to engage with EdTech at home: pupils' access to digital devices, their broadband or connectivity and parents' or pupils' digital skills. Requests for additional support with using technology when pupils are learning from home were relatively high.
8.1 Areas for future development • There is potential to conduct further research to better understand the underlying
reasons that EdTech does not meet the needs of some schools, to ensure they can be addressed effectively. In-depth exploration of how EdTech is used, barriers to uptake and reasons that it does not meet schools’ needs across different school contexts would be important to guide the development and targeting of future programmes to support schools in using EdTech effectively.

110
• Development of support and guidance for schools on creating their own EdTech strategy would be beneficial. This should include guidance for schools on reviewing and identifying their EdTech needs and advice on forward planning of EdTech renewal and replenishment to ensure it continues to meet their needs in the future.
• Consideration should be given as to how DfE can play a greater role in developing guidance and supporting schools to overcome their key challenges around moving to the cloud. In particular this should address schools’ challenges around affordability, how to migrate to the cloud quickly and efficiently and maintaining security.
• It is important that all schools are aware of any EdTech support programmes available to them, both during COVID-19 and beyond, as lack of awareness was a factor in the lower uptake of some programmes. It is also important to ensure rural schools can effectively access programmes which support improvements to internet or broadband connectivity as they were significantly more likely than urban schools to cite these as barriers.
• There is an opportunity to support schools with the effective use of EdTech though access to training and CPD, particularly for teachers who have been in the profession for longer. Peer-to-peer training and support, with real-life examples of how EdTech is used in schools, would be most relevant. CPD to build teacher skills and confidence in using EdTech would be beneficial as this was associated with improved perceptions of EdTech suitability and impact. The development of cyber security training materials for schools may encourage delivery to more staff.
• Strategies to support schools with the procurement of EdTech in their priority future investment areas may be useful, in particular technologies around the delivery of teaching and learning (remote education, blended learning and lesson delivery). Software for formative and summative assessment for secondary schools and software for offering guidance on transitions, careers support or health and wellbeing were also potential areas for future development, as these were less likely to be meeting schools’ needs.
• It should be a priority to review the EdTech used for supporting pupils with SEND as currently over half of schools perceive that it does not sufficiently meet their needs. Guidance on the use of accessibility features built into mainstream devices and software would be beneficial, particularly for primary schools.
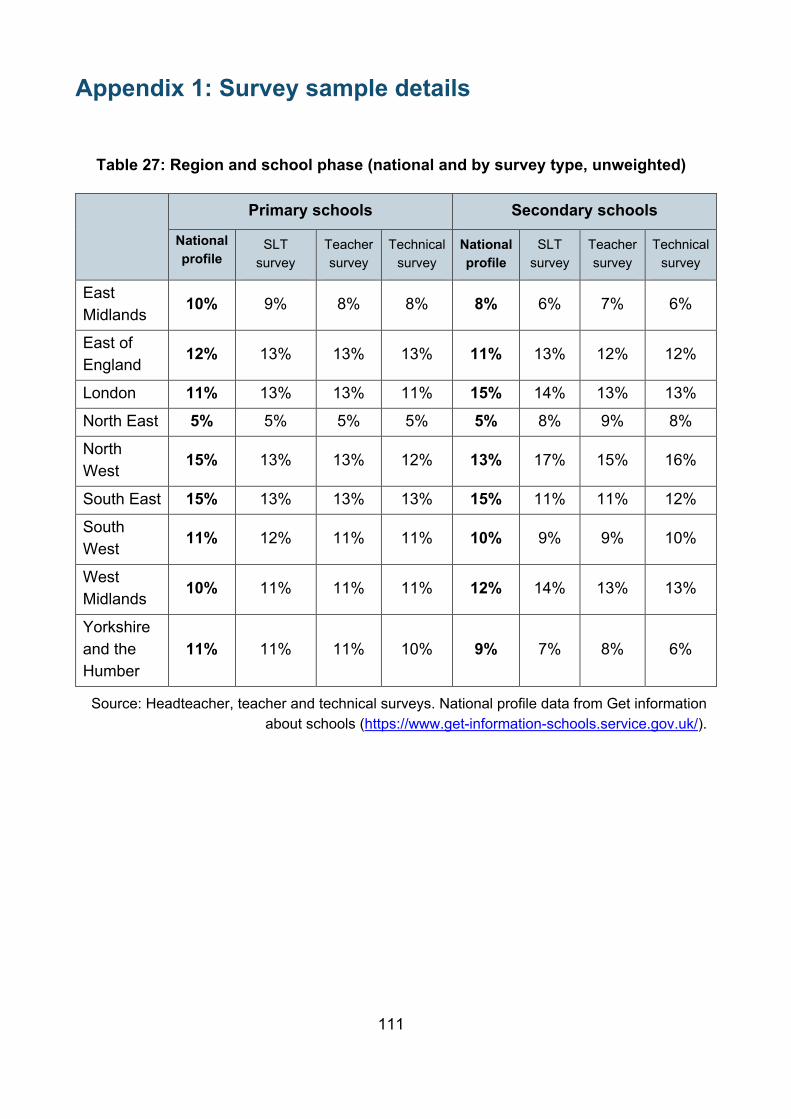
111
Appendix 1: Survey sample details
Table 27: Region and school phase (national and by survey type, unweighted)
Primary schools Secondary schools
National profile
SLT survey
Teacher survey
Technical survey
National profile
SLT survey
Teacher survey
Technical survey
East Midlands
10% 9% 8% 8% 8% 6% 7% 6%
East of England
12% 13% 13% 13% 11% 13% 12% 12%
London 11% 13% 13% 11% 15% 14% 13% 13%
North East 5% 5% 5% 5% 5% 8% 9% 8%
North West
15% 13% 13% 12% 13% 17% 15% 16%
South East 15% 13% 13% 13% 15% 11% 11% 12%
South West
11% 12% 11% 11% 10% 9% 9% 10%
West Midlands
10% 11% 11% 11% 12% 14% 13% 13%
Yorkshire and the Humber
11% 11% 11% 10% 9% 7% 8% 6%
Source: Headteacher, teacher and technical surveys. National profile data from Get information about schools (https://www.get-information-schools.service.gov.uk/).

112
Table 28: School profile (national and by survey type, unweighted)
National profile
Headteacher survey
Teacher survey
Technical survey
School type
Academies 41% 38% 38% 37%
Free schools 2% 2% 2% 2%
Local authority maintained 57% 60% 60% 61%
Ofsted
Outstanding 15% 18% 17% 17%
Good 73% 72% 73% 74%
Requires improvement 10% 8% 8% 8%
Serious weaknesses <0% 1% 1% 1%
Special measures 1% 1% 1% 1%
Free school meals (%)
Low (0-9.7) 33% 34% 34% 35%
Mid (9.8-19.9) 33% 31% 31% 32%
High (20-75.6) 34% 35% 35% 34%
Size within phase (number of pupils)
Primary small (1-201) 28% 21% 20% 21%
Primary medium (202-333) 27% 25% 25% 24%
Primary large (334-1732) 28% 31% 33% 32%
Secondary small (1-813) 6% 5% 5% 6%
Secondary medium (814-1155)
6% 8% 8% 8%
Secondary large (1156-3012)
6% 10% 9% 10%
Source: Headteacher, teacher and technical surveys. National profile data from Get information about schools (https://www.get-information-schools.service.gov.uk/).

113
Table 29:Survey respondent profile – headteachers and teachers (unweighted)
Headteacher survey Teacher survey
Number of responses
% of responses
Number of responses
% of responses
Gender
Male 314 35% 200 23%
Female 566 63% 645 76%
In some other way 1 0% 0 0%
Prefer not to say 16 2% 9 1%
Age
18-24 1 0% 78 9%
25-34 99 11% 316 37%
35-44 355 40% 215 25%
45-54 326 36% 174 20%
55-64 89 10% 58 7%
65+ 2 0% 2 0%
Prefer not to say 25 3% 11 1%
Length of time in teaching
Up to five years 13 1% 284 33%
6-10 years 87 10% 187 22%
11-15 years 202 23% 142 17%
16-20 years 207 23% 98 11%
Over 20 years 377 42% 143 17%
Not applicable 11 1% n/a n/a
Source: Headteacher and teacher surveys. Base: all respondents, headteachers 897, teachers 854.

114
Table 30: Survey respondent role – headteachers (unweighted)
Number of responses
% of responses
Job role
Executive headteacher / executive principal / CEO 37 4%
Headteacher / principal / head of school 408 45%
Vice principal / deputy headteacher 212 24%
Assistant headteacher / assistant principal 174 19%
Other 66 7%
Key stage currently taught
Not applicable – not currently teaching 358 40%
Early years foundation stage 99 11%
Key stage 1 158 18%
Key stage 2 287 32%
Key stage 3 144 16%
Key stage 4 174 19%
Key stage 5 94 10%
Subject mostly teach (Base=192)
English 24 13%
Maths 29 15%
Science 30 16%
Geography 18 9%
History 16 8%
Modern foreign languages 9 5%
Religious studies 4 2%
Physical education 5 3%
Art or drama 2 1%
Music 4 2%
Design & technology 4 2%
Business studies 7 4%
IT or computer science 29 15%
Other 11 6%
Source: Headteacher survey. Base: all respondents, headteachers 897.

115
Table 31: Survey respondent role – teachers (unweighted)
Number of responses
% of responses
Job role Senior leader (e.g. deputy headteacher, assistant headteacher)
106 12%
Head of year 23 3%
Head of department 63 7%
Head of subject 89 10%
Head of key stage 59 7%
Qualified teacher (QTS/QTLS) on the upper pay range 180 21%
Qualified teacher (QTS/QTLS) on the main pay range who is not serving statutory induction
260 30%
NQT: Qualified teacher who is serving statutory induction 44 5%
Other 30 4%
Key stage currently taught Not applicable – not currently teaching 4 0%
Early years foundation stage 108 13%
Key stage 1 242 28%
Key stage 2 413 48%
Key stage 3 178 21%
Key stage 4 187 22%
Key stage 5 101 12%
Subject mostly teach (Base=191)
English 29 15%
Maths 16 8%
Science 32 17%
Geography 8 4%
History 20 10%
Modern foreign languages 11 6%
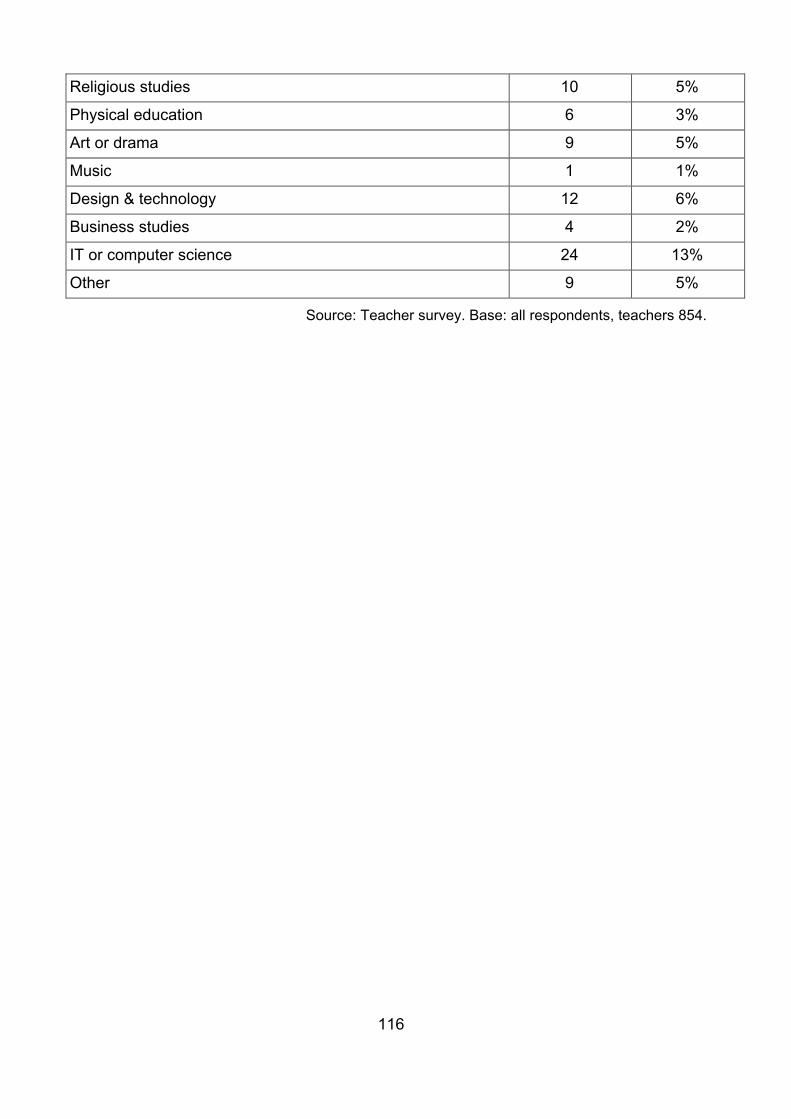
116
Religious studies 10 5%
Physical education 6 3%
Art or drama 9 5%
Music 1 1%
Design & technology 12 6%
Business studies 4 2%
IT or computer science 24 13%
Other 9 5%
Source: Teacher survey. Base: all respondents, teachers 854.

117
Table 32: Survey respondent role – technical survey (unweighted)
Number of responses
% of responses
Subject leader for computing / IT 161 20%
IT lead / manager / co-ordinator 149 19%
(Internal) IT technician / support 129 16%
Teacher 112 14%
Network manager 103 13%
(Outsourced / external) IT technician / support 94 12%
Headteacher / principal / head of school 71 9%
Business / office manager 69 9%
Vice principal / deputy headteacher 47 6%
Middle leader 45 6%
Assistant headteacher / assistant principal 31 4%
Digital lead 29 4%
E-learning lead 27 3%
Curriculum lead 16 2%
School administrator 13 2%
Executive headteacher / executive principal / CEO 12 1%
Learning support assistant 8 1%
SENCo 7 1%
Other 13 2%
Source: Technical survey. Base: all respondents, technical survey 804.

118
Table 33: Job role - Contributed to technical survey (unweighted)
Number of responses
% of responses
IT lead / manager / co-ordinator 110 14%
Headteacher / principal / head of school 108 13%
(Outsourced / external) IT technician / support 99 12%
Subject leader for computing / IT 81 10%
(Internal) IT technician / support 74 9%
Teacher 62 8%
Business / office manager 59 7%
Network manager 50 6%
Vice principal / deputy headteacher 37 5%
School administrator 33 4%
Assistant headteacher / assistant principal 32 4%
Middle leader 27 3%
Curriculum lead 13 2%
Executive headteacher / executive principal / CEO 12 1%
Digital lead 8 1%
E-learning lead 6 1%
SENCo 6 1%
Learning support assistant 3 0%
Other 10 1%
No-one else contributed 333 41%
Source: Technical survey. Base: all respondents, technical survey 804.

119
Appendix 2: Additional data
Table 34: Impact of COVID-19 on schools between September 2020 and 4th January 2021 – headteachers
Primary Secondary
The school is currently fully closed due to COVID-19, with all pupils learning from home
1% -
The school currently has whole ‘bubbles’ / year groups / class groups learning from home due to COVID-19
26% 38%
The school has experienced full or partial closure since September due to COVID-19, but is currently fully open
38% 26%
The school has experienced individual pupils learning from home due to COVID-19 but not whole ‘bubbles’ / year groups / class groups
18% 31%
No full / partial closures 16% 4%
Source: Headteacher survey. Base: all respondents who completed survey before 5th January 2021 primary 465, secondary 150.

120
Table 35: Use of Government programmes to support remote teaching and learning during COVID-19 - headteachers
Used Not needed
Unaware Do not qualify
Don’t know
Oak National Academy curriculum offer
Primary 84% 13% 1% 1% 2%
Secondary 72% 23% 1% 1% 4%
Disadvantaged pupils devices offer
Primary 72% 10% 2% 14% 3%
Secondary 94% 2% 2% 2% 1%
Online Platforms offer Primary 75% 17% 2% 2% 3%
Secondary 76% 13% 2% 6% 4%
Curriculum resource list on Gov.UK
Primary 57% 22% 11% 1% 10%
Secondary 45% 26% 10% - 18%
4G wireless routers offer Primary 16% 24% 26% 16% 18%
Secondary 56% 10% 11% 5% 19%
Mobile network data uplifts offer
Primary 23% 22% 29% 10% 16%
Secondary 26% 15% 22% 4% 33%
Other internet connectivity offers
Primary 20% 21% 27% 8% 24%
Secondary 27% 15% 17% 2% 38%
EdTech Demonstrator Programme
Primary 19% 29% 27% 3% 21%
Secondary 16% 29% 17% 2% 35%
BT Wifi codes offer Primary 6% 24% 42% 8% 20%
Secondary 10% 17% 31% 4% 38%
Source: Headteacher survey. Base: all respondents primary 687, secondary 210.

121
Table 36: Use of Government programmes to support remote teaching and learning during COVID-19 (pre and post-closure) - headteachers85
Used Not needed
Unaware Do not qualify
Don’t know
Oak National Academy curriculum offer
Pre-closure 81% 16% 1% 1% 2%
Post-closure 84% 13% 0% 0% 2%
Disadvantaged pupils devices offer
Pre-closure 72% 11% 2% 13% 3%
Post-closure 84% 4% 1% 9% 2%
Online Platforms offer Pre-closure 75% 16% 3% 3% 3%
Post-closure 77% 17% 1% 2% 3%
Curriculum resource list on Gov.UK
Pre-closure 54% 24% 11% 1% 11%
Post-closure 58% 20% 9% 0% 13%
4G wireless routers offer Pre-closure 19% 19% 28% 15% 20%
Post-closure 30% 27% 15% 13% 15%
Mobile network data uplifts offer
Pre-closure 16% 18% 37% 10% 20%
Post-closure 40% 26% 10% 8% 16%
Other internet connectivity offers
Pre-closure 17% 19% 30% 7% 27%
Post-closure 30% 22% 17% 6% 25%
EdTech Demonstrator Programme
Pre-closure 18% 28% 26% 3% 25%
Post-closure 18% 32% 25% 4% 21%
BT Wifi codes offer Pre-closure 4% 20% 45% 8% 23%
Post-closure 12% 29% 31% 7% 21%
Source: Headteacher survey. Base: all respondents pre-closure 605, post-closure 292.
85 ‘Pre-closure’ refers to schools which had completed the survey before schools closed to most pupils on 4th January 2021 and ‘post-closure’ refers to schools which had completed the survey after this time.

122
Table 37: Used Government programmes to support remote teaching and learning during COVID-19 by location (significant differences) – headteachers
Urban Rural
Disadvantaged pupils devices offer 81% 62%
4G wireless routers offer 25% 14%
Source: Headteacher survey. Base: all respondents primary 693, secondary 204.
Table 38: Used Government programmes to support remote teaching and learning during COVID-19 by FSM (significant differences) – headteachers
Proportion of pupils entitled to FSM
Low Medium High
Disadvantaged pupils devices offer 67% 76% 85%
4G wireless routers offer 19% 19% 28%
Mobile network data uplifts offer 20% 21% 29%
Other internet connectivity offers 16% 19% 27%
BT Wifi codes offer 5% 5% 10%
Source: Headteacher survey. Base: all respondents low 301, medium 278, high 308.
Table 39: Used Government programmes to support remote teaching and learning during COVID-19 by size of school (significant differences) – headteachers
Size of school
Small primary
Medium primary
Large primary
Disadvantaged pupils devices offer 63% 71% 82%
Mobile network data uplifts offer 17% 27% 25%
Source: Headteacher survey. Base: all respondents small primary 183, medium primary 227, large primary 277.
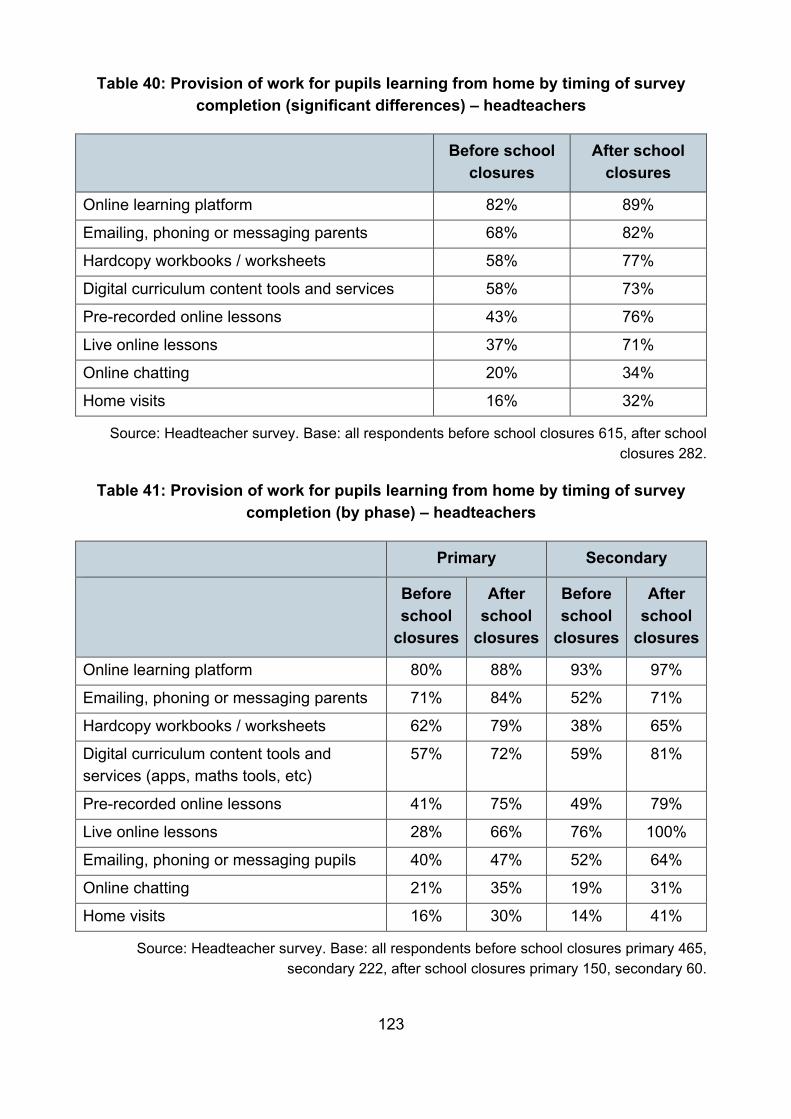
123
Table 40: Provision of work for pupils learning from home by timing of survey completion (significant differences) – headteachers
Before school closures
After school closures
Online learning platform 82% 89%
Emailing, phoning or messaging parents 68% 82%
Hardcopy workbooks / worksheets 58% 77%
Digital curriculum content tools and services 58% 73%
Pre-recorded online lessons 43% 76%
Live online lessons 37% 71%
Online chatting 20% 34%
Home visits 16% 32%
Source: Headteacher survey. Base: all respondents before school closures 615, after school closures 282.
Table 41: Provision of work for pupils learning from home by timing of survey completion (by phase) – headteachers
Primary Secondary
Before school
closures
After school
closures
Before school
closures
After school
closures
Online learning platform 80% 88% 93% 97%
Emailing, phoning or messaging parents 71% 84% 52% 71%
Hardcopy workbooks / worksheets 62% 79% 38% 65%
Digital curriculum content tools and services (apps, maths tools, etc)
57% 72% 59% 81%
Pre-recorded online lessons 41% 75% 49% 79%
Live online lessons 28% 66% 76% 100%
Emailing, phoning or messaging pupils 40% 47% 52% 64%
Online chatting 21% 35% 19% 31%
Home visits 16% 30% 14% 41%
Source: Headteacher survey. Base: all respondents before school closures primary 465, secondary 222, after school closures primary 150, secondary 60.

124
Table 42: Estimate of amount of regular curriculum delivered to pupils learning from home by timing of survey completion – headteachers and teachers
Headteachers Teachers
Before schools closures
After school
closures
Before schools closures
After school
closures
All of it 7% 13% 7% 13%
Most of it 60% 69% 44% 62%
Some of it 32% 18% 46% 25%
None / Don't Know - - 3% <1%
Source: Headteacher survey. Base: all respondents before school closures 615, after school closures 282. Teacher survey. Base: all respondents before school closures 547, after school
closures 307.
Table 43: Extent to which additional support is required with using technology when pupils are learning from home – headteachers
To a great extent
To some extent
To a small extent
Not required
Engaging with pupils 8% 29% 33% 30%
Monitoring pupil progress 10% 30% 32% 28%
Setting pupil work 4% 18% 32% 46%
Source: Headteacher survey. Base: all respondents 897.86
86 Don't know responses not shown.

125
Table 44: Mean number of devices available for teachers to use – technical survey
Primary small
Primary medium
Primary large
Secondary small
Secondary medium
Secondary large
Interactive whiteboards / blackboards
5.9 10.1 18.3 31.8 45.1 56.4
Teacher desktops
14.4 22.4 32.0 102.5 188.7 264.6
Teacher laptops
13.3 24.2 37.9 52.8 94.3 123.9
Teacher tablets
12.2 21.4 34.8 25.2 40.8 44.1
Source: Technical survey. Base: all respondents primary small 166, medium 197, large 256, secondary small 4687, medium 62, large 77.
Table 45: Mean number of devices available for pupils to use – technical survey
Primary small
Primary medium
Primary large
Secondary small
Secondary medium
Secondary large
Pupil desktops 12.3 20.2 31.2 172.4 258.7 402.3
Pupil laptops 25.4 36.1 70.9 117.7 143.0 243.5
Pupil tablets 25.5 46.2 72.8 59.7 74.7 114.2
Source: Technical survey. Base: all respondents primary small 166, medium 197, large 256, secondary small 4688, medium 62, large 77.
87 Low base, <50 respondents. 88 Low base, <50 respondents.

126
Table 46: Use of any assistive technologies by region - headteachers
North East
North West
Yorkshire and the Humber
East Midlands
West Midlands
East of England
London South East
South West
Use Any
43% 58% 56% 43% 59% 56% 55% 62% 57%
None 46% 37% 37% 52% 34% 40% 35% 34% 35%
Don't Know
6% 3% 7% 5% 8% 2% 8% 3% 7%
Source: Headteacher survey. Base: all respondents North East 4889, North West 121, Yorkshire and the Humber 93, East Midlands 74, West Midlands 106, East of England 120, London 120,
South East 114, South West 101.
Table 47: Proportion of schools with a digital technology strategy by phase and size of school - headteachers
Primary Secondary
Small Medium Large Small Medium Large
Yes 30% 40% 45% 44% 61% 59%
In development 37% 36% 27% 33% 23% 28%
No 24% 18% 12% 12% 9% 5%
Don't Know 9% 6% 16% 11% 7% 8%
Source: Headteacher survey. Base: all respondents primary small 183, medium 227, large 227, secondary small 4990, medium 72, large 89.
89 Low base, <50 respondents 90 Low base, <50 respondents.

127
Table 48: Proportion of schools with a digital technology strategy by region - headteachers
North East
North West
York-shire and the Humber
East Midlands
West Midlands
East of England
London South East
South West
Yes 54% 43% 40% 38% 41% 40% 52% 34% 36%
In development
16% 30% 36% 34% 32% 30% 27% 36% 42%
No 20% 19% 13% 19% 12% 20% 12% 21% 12%
Don't Know 10% 8% 11% 9% 15% 10% 9% 10% 10%
Source: Headteacher survey. Base: all respondents North East 4891, North West 121, Yorkshire and the Humber 93, East Midlands 74, West Midlands 106, East of England 120, London 120,
South East 114, South West 101.
91 Low base, <50 respondents

128
Table 49: Extent to which software meets needs for teaching – headteachers
Rarely Sometimes Mostly Always
Planning lessons Primary 2% 10% 49% 39%
Secondary 2% 12% 48% 37%
Tracking pupil progress Primary 1% 9% 44% 47%
Secondary 2% 10% 47% 42%
Delivering lessons Primary 2% 16% 54% 28%
Secondary 0% 14% 52% 33%
Collaborating and sharing resources
Primary 1% 15% 46% 38%
Secondary 0% 14% 49% 37%
Delivering teacher training / CPD Primary 2% 25% 50% 23%
Secondary 0% 21% 54% 25%
Summative assessment Primary 6% 23% 43% 28%
Secondary 10% 31% 39% 21%
Formative assessment Primary 6% 30% 41% 23%
Secondary 4% 36% 39% 20%
Supporting pupils with SEND Primary 6% 42% 40% 11%
Secondary 4% 48% 41% 7%
Offering independent / online learning
Primary 5% 26% 48% 21%
Secondary 1% 21% 54% 24%
Supporting remote teaching and learning
Primary 1% 17% 53% 30%
Secondary 1% 11% 55% 33%
Supporting blended learning and innovative teaching
Primary 4% 24% 51% 20%
Secondary 1% 21% 50% 28%
Source: Headteacher survey. Base: all able to rate software used for task (variable for each task) primary 644-683, secondary 204-210.

129
Table 50: Extent to which software meets needs for other school functions – headteachers
Rarely Sometimes Mostly Always
Liaison with external support agencies
Primary 4% 23% 47% 26%
Secondary 7% 30% 45% 18%
Tracking pastoral support Primary 9% 27% 37% 27%
Secondary 2% 22% 48% 27%
Safeguarding Primary 3% 7% 28% 63%
Secondary 0% 5% 36% 59%
Offering guidance on educational transitions
Primary 12% 40% 35% 13%
Secondary 11% 35% 44% 10%
Offering careers support Primary 30% 34% 24% 12%
Secondary 6% 32% 53% 9%
Offering health and wellbeing support
Primary 17% 41% 30% 12%
Secondary 13% 36% 41% 10%
Source: Headteacher survey. Base: all able to rate software used for task (variable for each task) primary 258-650, secondary 192-203.
Table 51: Software sometimes / rarely meets needs for functions by length of time in teaching (significant differences) – teachers
Up to 5 years 6 or more years
Planning lessons / curriculum 9% 15%
Delivering lessons 12% 19%
Conducting formative assessment 31% 38%
Conducting summative assessment 25% 34%
Offering independent / online learning 28% 38%
Supporting remote teaching and learning 17% 23%
Source: Teacher survey. Base: all able to rate software used for task (variable for each task) up to 5 years 259-280, 6 or more years 533-565.
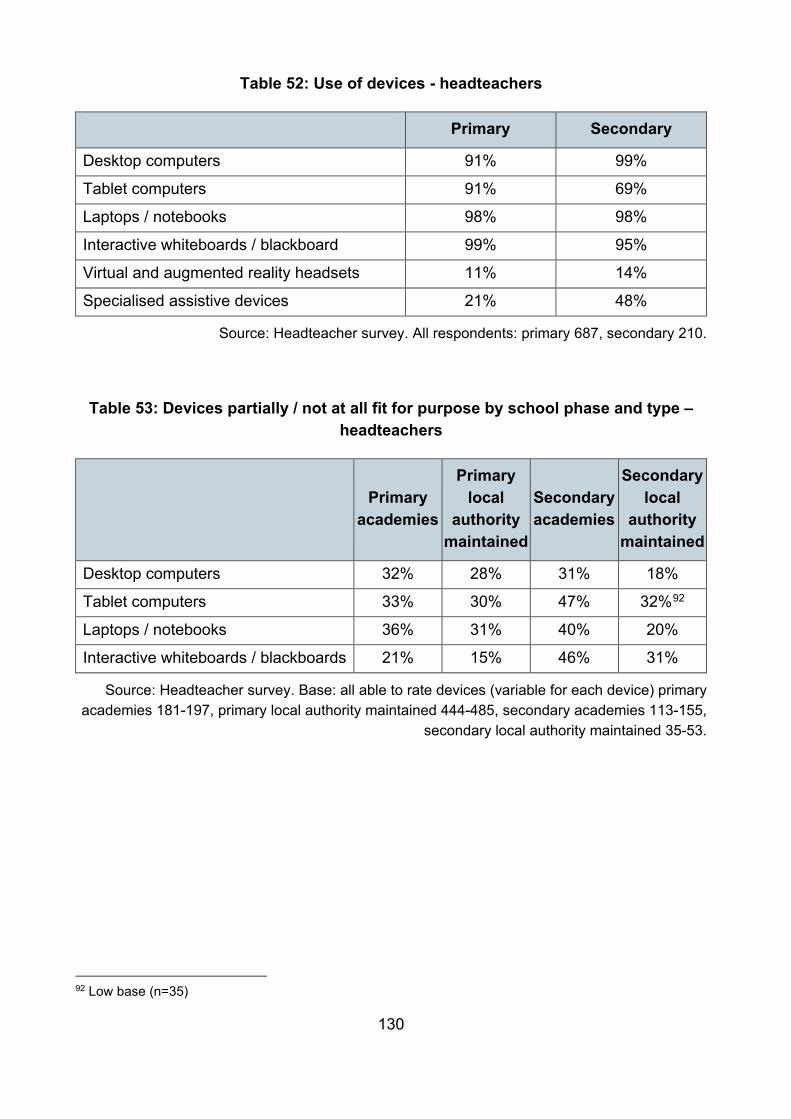
130
Table 52: Use of devices - headteachers
Primary Secondary
Desktop computers 91% 99%
Tablet computers 91% 69%
Laptops / notebooks 98% 98%
Interactive whiteboards / blackboard 99% 95%
Virtual and augmented reality headsets 11% 14%
Specialised assistive devices 21% 48%
Source: Headteacher survey. All respondents: primary 687, secondary 210.
Table 53: Devices partially / not at all fit for purpose by school phase and type – headteachers
Primary
academies
Primary local
authority maintained
Secondary academies
Secondary local
authority maintained
Desktop computers 32% 28% 31% 18%
Tablet computers 33% 30% 47% 32%92
Laptops / notebooks 36% 31% 40% 20%
Interactive whiteboards / blackboards 21% 15% 46% 31%
Source: Headteacher survey. Base: all able to rate devices (variable for each device) primary academies 181-197, primary local authority maintained 444-485, secondary academies 113-155,
secondary local authority maintained 35-53.
92 Low base (n=35)

131
Table 54: Extent to which devices are fit for purpose – technical survey
Not at all Partially Mostly Completely
Desktop computers Primary 7% 26% 38% 30%
Secondary 1% 26% 46% 27%
Tablet computers Primary 7% 26% 41% 26%
Secondary 13% 34% 33% 20%
Laptops / notebooks Primary 5% 22% 46% 26%
Secondary 5% 30% 42% 23%
Interactive whiteboards / blackboard
Primary 4% 14% 38% 44%
Secondary 12% 30% 32% 26%
Virtual and augmented reality headsets
Primary and secondary93
8% 30% 41% 20%
Specialised assistive devices
Primary 5% 23% 28% 44%
Secondary 0% 23% 50% 27%
Source: Technical survey. Base: all able to rate devices (variable for each device) primary 74-613, secondary 43-134.94
Table 55: Number of major cyber security incidents – technical survey
Primary Secondary
None 78% 77%
1 2% 4%
2 <1% 1%
Don't Know / Data unavailable 20% 18%
Source: Technical survey. All respondents, primary 619, secondary 185.
93 Data for primary and secondary combined due to low base for secondary (primary n=52, secondary n=12). 94 Don’t know and not used responses not included.

132
Table 56: Number of minor cyber security incidents – technical survey
Primary Secondary
None 66% 44%
1-2 6% 21%
3-5 1% 6%
6-10 <1% 2%
11+ <1% 1%
Don't Know / Data unavailable 27% 26%
Source: Technical survey. All respondents, primary 619, secondary 185.
Table 57: Pupil barriers to increased uptake of education technology – teachers
Don't Know
Not a barrier
Small barrier
Big barrier
Availability of technology in pupils’ homes
Primary 2% 4% 35% 59%
Secondary - 1% 24% 74%
Secondary academies 1% 2% 27% 71%
Local authority maintained secondary
- - 17% 83%
Internet connectivity at pupils’ homes
Primary 6% 6% 39% 49%
Secondary 2% 1% 30% 66%
Secondary academies 1% 2% 34% 63%
Local authority maintained secondary
6% - 18% 77%
Source: Teacher survey. Base: all respondents, primary 661, secondary 193, secondary academies 148, local authority maintained secondary 4595.
95 Low base <50.

133
Table 58: Barriers to increased uptake of EdTech by experience and age - teachers
NET: Big barrier / small barrier
Length of time in teaching
Age
Up to 5 years
6 or more years
Under 35 35+
Your appetite for using technology 23% 35% 23% 38%
Your skills and confidence with technology 46% 64% 47% 67%
Source: Teacher survey. Base: all respondents up to 5 years 284, 6 or more years 570, under 35 394, 35+ 449.
Table 59: Impact of teacher’s own skills and confidence on perceptions of software
used (significant differences) – teachers
Software always meets needs for… Confidence and skills are not a
barrier
Confidence and skills are a
barrier
Planning lessons / curriculum content 56% 45%
Delivering lessons 43% 29%
Tracking pupil progress 45% 38%
Offering independent / online learning 31% 18%
Supporting remote teaching and learning 38% 29%
Supporting blended learning and innovative teaching
25% 16%
Collaborating and sharing resources with other teacher
50% 38%
Delivering teacher training / CPD 32% 23%
Tracking pastoral support 28% 20%
Safeguarding 56% 48%
Offering health and wellbeing support 18% 10%
Source: Teacher survey. Base: all able to rate software for tasks (variable for each task) are not a barrier 74-613, are a barrier 43-134.
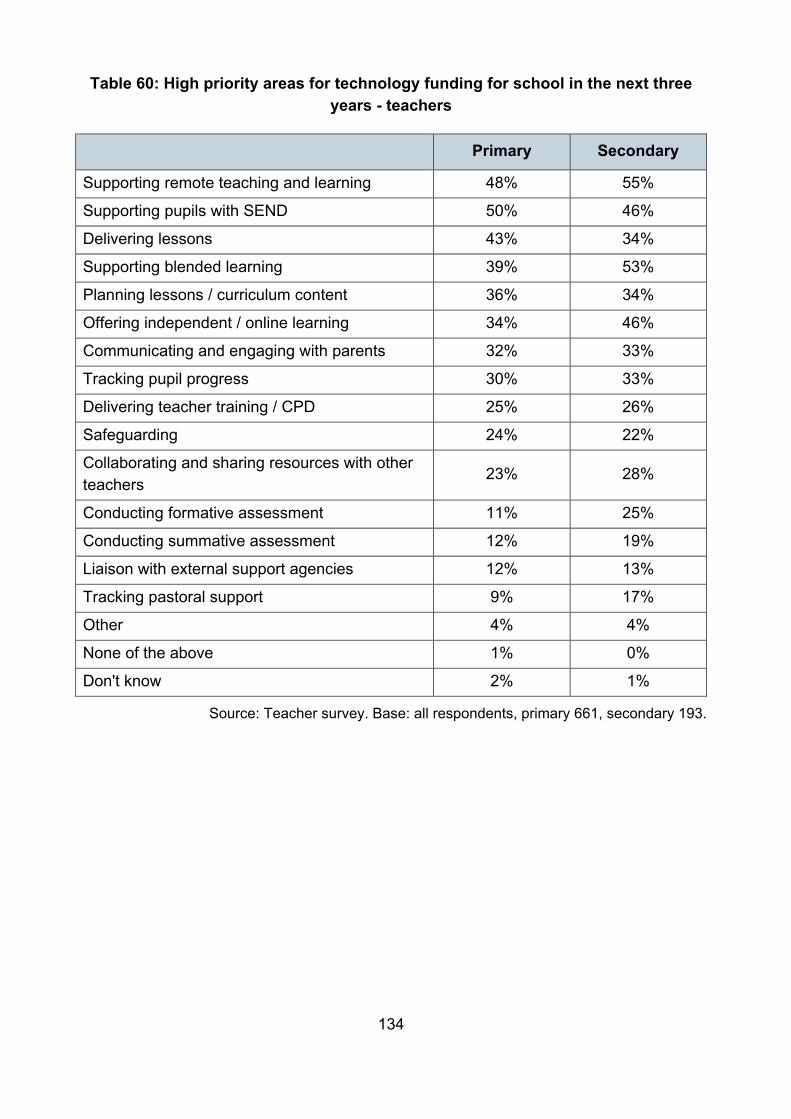
134
Table 60: High priority areas for technology funding for school in the next three years - teachers
Primary Secondary
Supporting remote teaching and learning 48% 55%
Supporting pupils with SEND 50% 46%
Delivering lessons 43% 34%
Supporting blended learning 39% 53%
Planning lessons / curriculum content 36% 34%
Offering independent / online learning 34% 46%
Communicating and engaging with parents 32% 33%
Tracking pupil progress 30% 33%
Delivering teacher training / CPD 25% 26%
Safeguarding 24% 22%
Collaborating and sharing resources with other teachers
23% 28%
Conducting formative assessment 11% 25%
Conducting summative assessment 12% 19%
Liaison with external support agencies 12% 13%
Tracking pastoral support 9% 17%
Other 4% 4%
None of the above 1% 0%
Don't know 2% 1%
Source: Teacher survey. Base: all respondents, primary 661, secondary 193.

135
© Department for Education 2021
Reference: DFE-RR139
ISBN: 978-1-83870-272-4
For any enquiries regarding this publication, contact us at: [email protected] or www.education.gov.uk/contactus
This document is available for download at www.gov.uk/government/publications


![EdTech Europe 2015 [Track 1]: [Samsung], ([Radhika Palany], [Education Lead])](https://img.pdfslide.net/doc/110x75/55cd50febb61ebfa4b8b47b8/edtech-europe-2015-track-1-samsung-radhika-palany-education-lead.jpg)


![EdTech Europe 2015 [Track 1]: [Google], ([Liz Sproat], [Head of Education for Europe])](https://img.pdfslide.net/doc/110x75/55c37202bb61eba8498b471f/edtech-europe-2015-track-1-google-liz-sproat-head-of-education-for-europe.jpg)