Embed Size (px)
Citation preview

DOCUMENT RESUME
ED 111 086 EA 007 458
TITLE Progress of Education in the United States ofAmerica: 1972-73 and 1973-74.
INSTITUTION Institute of International Studies (DHEW/OE),Washington, D.C.
SPONS AGENCY International Bureau of Education, Geneva(Switzerland).
REPORT NO DHEW-OE-76-19104PUB DATE 75NOTE 81p.; Report for the 35th International Conference on
Education, (United Nations Educational, Scientific,and Cultural Organization, International Bureau ofEducation); A related document is ED 083 756
AVAILABLE FROM Superintendent of Documents, U. S. GovernmentPrinting Office, Washington, D. C. 20402 (Stock No.017-080-01469-6, $1.50)
EDRS PRICE MF-$0.76 HC-$4.43 Plus PostageDESCRIPTORS Bibliographies; *Educational Administration;
*Educational Trends; Elementary Secondary Education;Government Role; Post Secondary Education; SchoolDemography; *School Statistics; *Tables (Data);*Teacher Role
IDENTIFIERS *United States
ABSTRACTThis report was prepared primarily to provide a
general overview of education in the United States forrepresentatives of UNESCO member nations attending an InternationalConference on Public Education. Chapter 1 provides a brief summary oftrends in education in the United States today. Chapter 2 presentsbasic background information on the organization and administrationof education in the United States. Chapter 3 contains statistics onAmerican education compiled by the National Center for EducationStatistics. The statistical material covers the 1973-74 school year,some enrollment data for the 1974 fall semester, and assorted datafrom earlier years to indicate trends or comparisons. Chapter 4focuses on the changing role of the teacher and the implication forpreservice and inservice education. A selected bibliography ofapproximately 60 relevant publications is also included.(Author/JG)
************************************************************************ Documents acquired by ERIC include many informal unpublished ** materials not available from other sources. ERIC makes every effort ** to obtain the best copy available. nevertheless, items of marginal ** reproducibility are often encountered and this affects the quality ** of the microfiche and hardcopy reproductions ERIC makes available ** via the ERIC Document Reproduction Service (EDRS). EDRS is not ** responsible for the quality of the original document. Reproductions ** supplied by EDRS are the best that can be made from the original. ************************************************************************

0CO
U.S, DEPARTMENT OP HEALTH,
CD EDUCATION & WELFARENATIONAL INSTITUTE OF
EDUCATIONE-1 THIS DOCUMENT HAS BEEN REPRODUCED EXACTLY AS RECEIVED FROMr--I f HE PERSON OR ORGANIZATION ORIGINATING IT POINTS OF VIEW OR OPINIONS"---1 STATED DO NOT NECESSARILY REPRESENT OFFICIAL NATIONAL INSTITUTE OFEDUCATION PQSITION OR POLICY
DHEW Publication No. (OE) 76-19104
PROGRESS OF EDUCATION IN THE
UNITED STATES OF AMERICA: 1972-73 AND 1973-74
Report for the Thirty-Fifth International Conference on Education,Sponsored by the United Nations Educational,
Scientific, and Cultural Organization,International Bureau of Education
U.S. DEPARTMENT OF HEALTH, EDUCATION, AND WELFARE
Caspar W. Weinberger,Secretary
Virginia Y. Trotter,Assistant Secretary for Education
Office of Education
T. H. Bell,
Citi Commissioner
in Robert Leestma,KV
Associate Commissioner for Institutional Development and International Education
1\0o 2
rzl

U.S. GOVERNMENT PRINTING OFFICEWASHINGTON: 1975
For sale by the Superintendent of Documents, U.S. Government Printing OfficeWashington, D.C. 20402 - Price: $1.50
Stock Number 017-080-01469-6
3

ForewordThis report is the most recent in the series prepared for the International
Conference on Public Education that has been held in Geneva, Switzerland,since 1934 under the auspices of the International Bureau of Education(IBE), now a part of UNESCO.
Chapter 1 provides a brief summary of the trends in education in theUnited States today. Chapter 2 presents basic background information onthe organization and administration of education in the United States.Chapter 3 conta;ns statistics on American education compiled by theEducation Division's National Center for Education Statistics. The statisti-cal material covers the 1973-74 school year, some enrollment data for the1974 fall semester, and assorted data from earlier years to indicate trendsor comparisons. Chapter 4 focuses on the changing role of the teacher andthe implication for preservice and inservice education.
This report is being made available in a number of languages, includingEnglish, French, Spanish, and Russian. The various language versions areuseful not only to the representatives of the 132 member states ofUNESCO who may attend the IBE conference in Geneva, but also to thethousands of visitors from abroad who seek information from the Officeof Education annually and to non-English speaking educators and policy-makers in other countries who are interested in educational development inthe United States.
4
Robert LeestmaAssociate Commissionerfor Institutional Developmentand International Education
Hi

iv
President Gerald R. Ford
Remarks at Ohio State UniversityColumbus, Ohio, August 30, 1974
Although this Administration will not make promises it cannot keep, Ido want to pledge one thing.. .. I will do everything in my power to bringeducation and emplo, ..rs together in a new climate of credibilityanatmosphere in which universities turn out scholars and employers turnthem on.
I propose a great new partnership of labor and educators. . . .
I want to see labor open its ranks to researchers and problem-solversof the campuses whose research can give better tools and methods to theworkman. I want to see a two-way street speeding the traffic of scientificdevelopments, speeding the day of self-sufficiency in energy and speedingan era of increased production for America and the world.
5

Contents
ForewordPage
iii
I. Major Trends in Educational Development 1
Progress Report 2New Trends 8The Current Federal Role 14
Organization and Administration of Education 15
Authority 15Structure 19
III. Statistics on Education 24
An Overview 24Enrollment 24Teachers and Instructional Staff 28School and School Districts 28High School and College Graduates 28School Retention Rates and Educational Attainment 37Income 37Expenditures 39
IV. The Changing Role of Teachers and Teacher Education 49
The Changing Society 49Education in the Changing Society 52Implications of the Changing Role for Preservice
and Inservice Training 59
Selected References 71

Tables
1. Estimated enrollment in educational in-stitutions, by level of instructior and bytype of control: United States, fall 1973and fall 1974
2. Percent of the population 5 to 34 years oldenrolled in school, by age: United States,October 1947 to October 1073
3. Enrollment in grades 9-12 in public andnonpublic schools compared with popula-tion 14-17 years of age: United States,1889-90 to fall 1973
4. Degree-credit enrollment in institutions ofhigher education compared with populationaged 18-24: United States, fall 1950 to fall1973
5. Enrollment in federally aided vocationalclasses, by type of program: United Statesand outlying areas, 1920-1973
6. Estimated number of classroom teachersin elementary and secondary schools, andtotal instructional staff for resident coursesin institutions of higher education : UnitedStates, fall 1973 and fall 1974
7. Selected statistics for public elementaryand secondary schools: United States, fall1968 and fall 1973
8. Number of high school graduates comparedwith population 17 years of age: UnitedStates, 1869-70 to 1972-73
9. Earned degrees conferred by institutionsof higher education : United States, 1869-70 to 1972-73
10. Earned degrees conferred by institutionsof higher education, by field of study andby level: United States, 1971-72
11. Estimated retention rates, 5th gradethrough college entrance, in public andnonpublic schools: United States, 1924-32to 1965-73
VI
Page
25
26
27
29
30
31
32
33
34
36
38
7
Page
12. Level of school completed by persons 25years old and over and 25 to 29 years old,by color: United States, 1910 to 1974 40
13. Percent of illiteracy in the population:United States, 1870 to 1939 41
14. Public elementary and secondary schoolrevenue receipts from Federal, State, andlocal sources: United States, 1919-20 to1372-73 42
15. Federal funds for education and relatedactivities: Fiscal years 1974 and 1975 43
16. Total and per-pupil Expenditures of publicelementary and secondary schools: UnitedStates, 1919-20 to 1973-74 44
17. Gross national product related to total ex-penditures for education: United States,1929.30 to 1973-74 45
18. Expenditures of Federal, State, and localfunds, for vocational education: UnitedStates and outlying areas, 1920 to 1973 . 48
Figures
1. The structure of education in the UnitedStates
2. Number of high school graduates for each100 persons 17 years of age: United States,1869-70 to 1969-70
3. Estimated retention rates, fifth gradethrough college graduation: United States,1965 to 1977
4. Percent of illiteracy in the population, byrace: United States, 1870 to 1969
5. Total expenditures for education as a percentage of the gross national product:United States, 1929-30 to 1973-74
20
35
39
41
46

1. Major Trends in Educational Development
The United States will celebrate its Bi-centennial next year. To mark this period inthe Nation's history. leaders in U.S. educa-tionand those in other segments of thenational lifeare reviewing the accomplish-ments in American education and identifyingthe tasks that remain.
Statistics reflect the success of the educa-tional system to date. Americans stand atthe highest level of educational attainment inthe': history. In 1974, men and women-25ye rs of age and olderhad an averagese fooling of 12.3 years ; illiteracy had beenreduced to about 1 percent; 63.3 percent ofthe population over 25 had completed asecondary school education ; and 14 percenthad completed 4 years of college. (See tables12 and 13, ch. 3, pp. 40, 41). The statisticson enrollment and funding, discussed inchapter 3, illustrate L.; important positioneducation occupies in the U.S. society. (Seetables 1-8 and 14-18, ch. 3, pp. 25-33 and42-48, respectively.)
Promising as these achievements are, how-ever, the United States has not yet fullyattained its goal of universal education.Minority mpulations such as American In-dians, blacks, economically disadvantagedpersons, and the handicapped have not yetachieved the educational level nor the socio-economic status of the white majority be-cause of long-standing discriminatory prac-tices. Confidence in the education system isby no means universal or complete. Schoolsand colleges, along with many students inpostsecondary education, are facing seriousfinancial strain.
An inevitable criticism is the relative slow-ness with which the school system, like otherinstitutions, adapts to changing needs in achanging society. Of particular concern isthe achievement of equality of educationalopportunity for all. Only lately have publicschool educators, as a result of a U.S. Su-preme Court decision, assumed responsibilityfor assuring that children who speak alanguage other than English are offered bi-lingual education programs to enable themto compete effectively with their peer group.Similarly, legislation followed by litigationthroughout the country has given the im-petus for public schools to take new measuresto provide appropriate education for handi-capped children.
One factor in the rate of change is directlyrelated to a basic strength of the Americaneducational systemlocal contrci. Educational responsibility is decentralised (see ch.2). Basic authority for elementary and sec-ondary education resides in the States, eachof which delegates the bulk of the responsi-bility for public school operation to the localschool districts within its jurisdiction. Theability of the community or the State tofinance the educational enterprise can be oneof the important determinants of the curricu-lum. Thus, in times of financial constraint,the concern with educational prioritiesbecomes increasingly sharp.
In general, the major problems and trendsin education during the 1972-73 and 1973-74school years continue to be those describedinthe International Bureau of Education's(IBE's) report of 2 years ago: Inequities in
1

public school finance, financial stress inprivate educational institutions, segregationand relevant curriculums in urban schools,"career education" as a curriculum priorityto help link education to the world of work,the continuing progress toward .equalizingaccess to opportunity in postsecondary edu-cation, and a questioning of the methodsand value of educational research.
In comparison with 1973, however, theproblems in 1974 are aggravated to someextent by uncertainties about the domesticand world economies. Public confidence inthe traditional structure of educational in-stitutions seems weaker than 2 years ago. Asense of pragmatism seems to have temperedmany of the experimental approaches com-mon in recent years, and educators and thegeneral public know that some of the prob-lems are very complex and immediate solu-tions are few. New demands are being madefor alternative forms of schooling and forschooling toward increasingly diverse ends.This is happening at a time when thestrength of teacher organizations, which arethreatened by declining school enrollmentsand a growing teacher surplus, is solidifyingin support of established employment pat-terns. Increasingly, the national educationdebate is beginning to focus on some funda-mental questions : What is the basic purposeof schools? Whom should they serve? Howshould they serve? Who should decide educa-tional policy?
2 9,,
Progress Report
School Finance
Since the early 1970's, equalization ofschool financing has been propounded to helpensure equality of educational opportunity.The rationale is that because communitiesvary greatly in their revenue-raising capa-cities (largely based on local propertytaxes), they are unable to provide equally fortheir children's education. Therefore, sinceeducation is a State responsibility, the Stateought to raise and distribute State funds forschool support on a more equitable basis.Opponents question whether equalization offunding will, in fact, equalize educationalopportunity.
At the time of the 1970-71 and 1971-72report, the issue of equalization of schoolfunds appeared to be on the verge of resolu-tion. Proponents of equalization were expect-ing momentarily that the 'U.S. SupremeCourt would support 1:1!eir position in thelandmark case, Rodriquez v. San AntonioIndependent School District.
However, in spring 1973 the Court ruledagainst the plaintiffs. It upheld the con-stitutionality of the existing Texas law. Al-though the court acknowledged the need formore equitable financing plans, it held that"consideration and initiation of fundamentalreforms with respect to State taxation andeducation are matters reserved for the legis-lative processes of the various States," andbarred direct recourse to the Federal Gov-ernment.

Although the ruling weakened this particu-lar attempt for equalization, several Stateshave developed, or are now developing, theirown financing plans to assume more equit-able distribution of State funds. Stateactivity is expected to increase further whenthe U.S. Congress appropriates the fundsauthorized in the Education Amendments of1974. Under this legislation, the FederalGovernment will reimburse States for thecost of developing and implementing schoolfinance equalization plans.
Economic Stress
Independent or private schools at all levelshave been more seriously affected by con-strained economic conditions than has publiceducation. Approximately 80 smaller colleges(out of some 2,700 higher education institu-tions) have closed in the past 4 years. Othershave merged to survive and to deal with ris-ing costs. Aggressive enrollment campaignsby private colleges are becoming a commonphenomenon. New institutions are findingthe process of becoming established moredifficult than in the past, so that some arelimiting their programs more than originallyplanned ; some are concentrating on servinga particular group of students, primarilythose of one ethnic heritage; and some startas 2-year institutions, hoping to expand theirprogram later to 4 years. Severe financialdifficulties have also been experienced byprivate elementary and secondary schools,including the Roman Catholic schools, whichaccount for about five-sixths of total private
10
school enrollments and serve a significantnumber of students among the disadvan-taged inner-city populations.
In an effort to cover costs, institutions havebeen sharply increasing tuition charges inthe past 2 years. Many colleges have reachedthe point where they risk pricing themselvesout of the market by the burden high tuitionplaces on students from middle income fami-liesa major source of their students andthus their support. Other important sourcesof private college support are also underpressure. The value of university endowmentfunds has declined with the stock market.Contributions from alumni have not keptpace with growing budgets. Many privatefoundations, ordinarily an important sourceof funding for experimentation and innova-tive activities, have reduced their grant allo-cations because of the reduction in value oftheir capital funds.
The Federal role in higher education hasbeen to help equalize educational opportunityby offering financial assistance to those whomight otherwise find the cost prohibitive, tohelp strengthen institutional capability inselected areas through financial and technicalassistance, and to support or strengthen thebasic and applied research critical to highereducation and the national interest.
Desegregation
Wide attention has been given to desegre-gation of urban schoul systems as a methodof equalizing educational opportunity. In the
3

past 2 years, prospects for increasing schooldesegregation have been clouded by severalcourt decisions and continuing congressionaldiscussion directed at limiting the use ofbusing for desegregation purposes.
During 1974, the 20th anniversary of theU.S. Supreme Court's landmark decision onschool desegregation (Brown. v. The Boardof Education, Topeka. Kansas) was high-lighted in the media, in many forums, and inworkshops throughout the Nation. Yet, mostlarge U.S. school systems, particularly innorthern urban areas, remained largelysegregated by race as a result of neighbor-hood school attendance, zones, and lack ofalternative housing and economic patterns.The U.S. Supreme Court has agreed, how-ever, to hear a case during its fall 1975 termon charges of segregated housing policies inChicago, Ill., and in the suburbs of that city.
The majority school population in severalmajor cities is now nonwhite; thus, desegre-gation in these cities is almost impossiblewithin a single school system. The populationin the suburbs surrounding these cities istypically white middle class with an increas-ing flow of minority middle class families aswell. The movement to the suburbs over theyears has, in part, been the result of parents'negative perceptions of the quality of educa-tion offered in many urban schools.
In response to this problem, advocates ofintegration in several cities have focusedtheir efforts on bringing suburban and inner-city schools into a more broadly based metro-politan system and/or by increasing oppor-
4 11
tunities for urban-suburban pupil exchangesor groupings in schools where there has beena decrease in pupil population. Few proposalsfor social reform have met with such con-troversy. The "busing" of students in theseapproaches has become one of the most emo-tion-laden social, political, and educationalissues in the United States today.
In June 1974, integrationists were en-couraged by the U.S. Supreme Court's deci-sion in Keyes v. School District No. 1, Den-ver, Colo. The Court ruled that where a sub-stantial portion of a school district was dejure segregated, it was incumbent upon theschool district to provide a remedy for theentire district, including the de facto por-tions. For the first time since the beginningof legal success against de lure school de-segregation 20 years ago, de facto segrega-tion resulting from racial residential pat-terns was declared illegal when coupledwith substantial de lure segregation in thesame district.
More crucial, however, and a major dis-appointment to integrationists, was the U.S.Supreme Court's decision (a month later) inMilliken v. Bradley. a case affecting a pro-posed lower court ordered metropolitan de-segregation plan for Detroit, Mich., and itssuburbs. In this case the Court majority con-cluded that "the relief ordered by the DistrictCourt and affirmed by the Court of Appealswas based upon an erroneous standard andwas unsupported by record evidence that actsof the outlying districts affected the dis-crimination found to exist in the schools ofDetroit." However, one of the Justices in

this 5-4 decision stated, in effect, that futurecases of this genre might well not bring asimilar riling should it be determined thatState or suburban school district acts of thede jure :ype be detected and proved.
In general, the majority public opinion wasstrongly behind the Court's Detroit decision.Soon afterward, the antibusing resolutionbecame one of the major congressional de-bates on the proposed 1974 EducationAmendments. A modified form of this reso-lution was incorporated into the amendmentswhich became a law in August 1974. As titleII of the 1974 law, it guarantees that anindividual's rights under the 5th and 14thamendments to the U.S. Constitution shallnot be abrogated.
When school opened in fail 1974, tensionand violence accompanied a court-ordereddesegregation plan in Boston, Mass., wherede jure discrimination had been found toexist. Feelings over this issue run high insevera'A other metropolitan areas as well.
Desegregation efforts in some large north-ern urban areas may be unsuccessful becausedemographic and housing patterns in manycities and towns still exclude minoritygroups. (A number of educational and com-munity leaders from minority groups arenow concentrating their attention and energyon improving schools that serve predomi-nantly minority groups.)
Career Education
Development of career education continuesalong the lines reported 2 years ago. There
appears to be widespread support of the con-cept and programs that have been introducedat all levels of the elementary and secondarycurriculum in thousands of school sterns.Good beginnings have been mad r: at thehigher education level also. In addition toallocating funds for developiDg mcdel orexemplary career education programs in ele-mentary and secondary school settings, theFederal Government has increased demon-stration of career education in the post-secondary years and for special segments of
population. State funding of career edu-cation is increasing. As a result of PresidentFord's personal interest and initiative, allFederal agencies, and particularly the U.S.Office of Education and the U.S. Departmentof Labor, are seeking ways to strengthen thelink between the educational system and theworld of work.
Unlike traditional vocational training,which occurs mainly at the secondary level,career education has been conceived as be-ginning in the early grades and continuingthrough all of higher education. At the ele-mentary level, it generally takes the form ofcareer awareness programs. At the second-ary level, observation of actual work places,work experience, and apprenticeships havebeen advocated along with occupational guid-ance programs. This approach reflects anawareness that most classroom experiencesbear little relation to the skills needed on ajob and that the disparities between the twoshould be lessened.
At the postsecondary (nonbaccalaureate)level, emphasis on training for jobs is
5

stronger than at the lower levels, and educa-tion commonly extends beyond initial entryinto the job market. More people are return-ing to college after several years in the jobmarket or in the home. Community collegeshave expanded to serve this clientele, newexternal degree programs have been offeredin a variety of kinds of institutions, and addi-tional proprietary institutions have been es-tablished.
Higher Education
Higher education is becoming increasinglyaccessible to all segments of the population.In 1973 and 1974, one out of every two sec-ondary school graduates went on to some sortof postsecondary education, and nearly halfof these will probably graduate from a col-lege or university. Participation by studentswho are members of minority populationshas increased : In 1973-74, about 10 percentof all students were nonwhites, with enroll-ments of blacks having increased by over 200percent in the previous 8 years. With respectto education of women, in 1963-64 womencomprised only 38.5 percent of total highereducation enrollment, whereas in 1973-74they comprised 44.9 percent. At the sametime, most single-sex institutions have be-come coeducational, reflecting a change inpublic attitudes and in the philosophy ofmany private educational institutions.
Two trends have been emerging that arelikely to continue at least through the end of
6 13
the decade. First, an increasing number ofstudents give priority to obtaining the skillsthey will need for employment rather thanto seeking a general education. This growingdesire to obtain a marketable skill, alongwith the search for an affordable education,spurred the growth of the public 2-year com-munity college during the first 4 years of the1970's. In 1973 alone, enrollment in 2-yearcolleges increased by nearly 12 percent (com-pared to 1.8 percent in 4-year institutions)and preliminary estimates for 1974 showedthat this trend was continuing (9.1 percentand 3.2 percent, respectively). These 2-yearinstitutions currently enroll approximatelyone-third of all postsecondary students.
Second, more and more people beyond theusual college age of the late teen years andearly twenties are enrolling in programs ofpostsecondary education. Acceptance of theidea of recurrent or life-long education isclearly growing. Colleges and universities arebeginning to provide greater flexibility intheir programs and in the ways these pro-grams may be pursued. Off-campus educa-tional programs are now available to studentsof all ages in their communities, at theirplaces of work, and even in their homesthrough various self-study alternatives.Examples of these efforts include honorcourses, tutorial work, intensified use ofseminars, the independent studies programs,special services programs for disadvantagedstudents, cooperative arrangements withlibraries, and experimentation with pro-grammed instruction and educational tele-vision.

A
Educational Research and Evaluation
The past 2 years also presented many prob-lems for educational research and evaluation.Economic constraints led to budget cuts ineducational research as in other fields; andstandardized normative tests, traditionallythe evaluation instruments most widely usedin U.S. schools, are still being questioned.Standardized tests have been attacked asbeing racially and culturally biased ; incap-able of measuring numerous factors thatought to be considered in a truly valid meas-ure of achievement; and useful only to showa student's cognitive skills, reading ability,and skill in taking standardized tests. None-theless, standardized achievement tests arestill being used throughout American schools,but less importance is given to IQ (intelli-gence quotient) testing.
Educational researchers have begun toquestion traditional ideLs about the basicpurposes of schools. For example, somestudies 1 found little correlation betweenschooling and economic achievement, tend-ing to support the contention that a child'sfamily background and social environmentare the crucial factors leading to success inAmerican society. In spite of criticism bysome educational researchers concerning the
' James S. Coleman, Equality of EduationalOpportunity; Frederick Mosteller and Daniel P.Moynihan, eds., On Equality of EducationalOpportunity: Papers Deriving from the HarvardUniversity Faculty Seminar on the Coleman Re-port; and Christopher Jencks, et al. Inequality:A Reassessment of the Effects of Family andSchooling in America.
14
premises or research methodology employed,these studies have contributed to the senseof uncertainty in many quarters about thebasic purposes of schools andby implica-tiona growing skepticism about the returnsto be derived from money spent on educationand on educational research, at least educa-tion in the more traditional modes. But at thesame time, such studies have contributedsignificantly to increasing public awarenessof basic issues and to sharpening the de-bate on examining or reexamining premises,values, and purposes.
However, encouraging efforts continue orare accelerating. For example:
Partly as a result of growing concernabout the effectiveness of conventionaltesting instruments, researchers havemounted a concerted effort to developnew forms of measurement and evalua-tion. Although still in the developmentalstages, approaches such as criterion-referenced testing in which achievementis measured by the ability to perform aspecific task, and the use of classroomobservation instruments that evaluate ateacher's ability to implement a specificteaching methodology have inspiredcautious optimism.
Research related to accountability is in-creasing, stimulated to some extent byincreased educational competition foravailable financial resources. There aregrowing demands for hard data on re-sults achieved by expenditures (input-output studies). This emphasis on ac-
. 7

countability, along with a growing pub-lic impatience with what is often judgedas the poor performance of the existingschool system, has already led to height-ened stress on evaluating educationalresearch efforts as well as educationalprograms. It has contributed also to thepresent focus on the Competency BasedTeacher Education movement discussedin chapter 4.
The pressure from different culturalsubgroups, combined with issues such aschildren's rights and equal access toschool resources, focused attention onthe student's individual needs and onhow differences in cultural backgroundaffect the student's rate of development.Recognition of these factors has led togrowing diversification in teachingmethods and approaches aimed at indi-vidualizing instruction.
Persistent problems with the young ina changing society, their discontent anddifficulties in finding suitable employ-ment, and doubts about the economicutility of traditional education offeredin schools and colleges supply the basisfor questioning the adequacy of thehigher education system and stimulatethe search for alternative solutions.Hence the commitment to research ac-tivity in career education continues andgrowing interest is apparent in linkingmore effectively the world of educationwith the world of work.
On balance, there is considerable interestin the broad field of educational research,
8 15
and the prospects for educational evaluationand research concerning itcan be viewedas generally encouraging. The desire for im-provement in the educational system in atime of social change is serious, widespread,and healthy. There is no substitute for pro-fessionally sound investigation in theory andpractice. The Congress, in the EducationAmendments of 1974, expressed concern thatthe results of research be put into practice,that new ideas and developments be imple-mented, thus adding considerable impetus tothe development and improvement of pro-gram evaluation.
New Trends
Throughout the years Americans have re-garded their school system as the great melt-ing pot and equalizer of society. In a socialsystem characterized by cultural pluralism,the schools have been expected to play amajor role in imparting national culture andtraditions. In the past decade, and particu-larly in the past few years, another interesthas emerged ; that is, having the schoolsdevote specific attention to developing anawareness of the ethnic heritage of all Amer-icans and of each group's contributions tothe national heritage. Since the 1960's,schools have also been called upon increas-ingly to provide equality of opportunity forall of the children of all of the people.
This latter development, enhanced by re-affirmation throughout the country today forlocal autonomy, individualism, and self-de-

termination, is molding new trends in theeducational system. The demands of specialinterest groups are introducing increaseddiversity in educational services, which inturn is necessitating a restructuring of theelementary and secondary schools in effortsto deliver those services.
The increasing influence of the courts inthe educational arena has sharply speededthis trend toward educational diversity in thepast 2 or 3 years. When parents, students,citizens' groups, and other recipients of edu-cational services find the public school systemtoo slow in c:;:nnlying with their requests,they appeal to the courtsa reaction bothwidespread and often suc.;essful in the con-sumer movement in general.
Optional Educational Programs
The demands of different interest groupshave been responsible for the development ofoptional programs that allow parents andstudents to choose from a variety of curricu-lum offerings and learning environments.For example, many elementary schools pro-vide both an open classroom setting and amore structured setting that emphasizes in-struction in basic skills at all grade levels.Such structural pluralism has had the re-lated benefit of reducing, to some extent, thestridency of debates about the superiority ofvarious approaches.
Optional programs may take any numberof forms. Some encompass an entire schoolsystem. Minischools and other alternative
16
approaches within larger schools are themost common, however, and have pro-liferated significantly in secondary schoolsduring the past 2 years. Generally, they focuson particular curriculum areas such as bi-cultural education, career education, or thearts. New Jersey, in cooperation with NewYork, Pennsylvania, Delaware, Connecticut,Puerto Rico, and the Virgin Islands, for thepast 2 years has been studying "alternative"schools as a regional, interstate project un-der Federal funding.
So far, optional educational programs havebeen established mainly within public in-stitutions. Proposals for educational vouch-ers issued by school authorities to permit theoption of obtaining educational services fromprivate as well as from public institutionshave raised complicated legal issues. Teacherorganizations have strongly opposed such adevelopment.
Coincident with the drive toward diversitywithin the public school system has beensome decline in the strength of privateschools as alternative sources of educationalservices. As mentioned earlier, privateschools of all types are facing very seriousproblems because of rising costs. Unlessconstitutional obstacles can be overcome toprovide aid for private schools, they probablywill continue to decline as an educationaloption.
Secondary Education
The past few years have been a period ofunusually significant ferment in reassessing
9

the status and needs of secondary educationin the United States. Momentum appears tobe developing for fundamental reform andrenewal. Five national commissions andpanels (some federally and some privatelysponsored) have attempted to clarify theproblems of contemporary school and society,analyze the needs and options, identify theconditions, and find effective ways of meet-ing the challenges of the last quarter of the20th century. Different reports agree that"authentic learning can take place in a widevariety of settings, many of them remotefrom the schoolhouse. . . . They recognizethat a variety of other institutions and agen-cies are also involved in educating and social-izing youth and propose moving a substan-tial portion of learning opportunities outsidethe school buildii_g."2 Among the commonthemes in the recommendations of the va-rious reports are: increasing program alter-natives, particularly in nonschool settings ;
increasing opportunities for students to exer-cise responsibility; making work experiencean integral part of the education and social-ization of youth ; expanding and improvinglinkages among schools, other institutions,agencies, business, and industry; loweringthe age for compulsory school attendance;and restructuring schools to achieve theseobjectives.
2 A. Harry Passow, "Refoi ming America's HighSchools," Phi Delta Kappa, . May 1975, pp. 587-90.
10 17
Special Education
Largely because of a strong consensusbetween the Exective Branch and the Con-gress, new Federal and State legislation, andcourt decisions, the education of exceptionalchildren has increasingly become a prioritythroughout the country. Within the last de-cade, funds for special education have tripledand are still being increased. During the last2 years, seven States joined the number ofthose that have legislated educational pro-grams for exceptional children. One signifi-cant result is that many exceptional childrenwho only a few years ago would have beenlimited to custodial care and education inresidential institutions for the retarded andemotionally disturbedare now receivingeducational services designed to enhance self-help skills, communication, socialization, and,whenever possible, academic and vocationalskills.
A 1972 citizens' suit on behalf of mentallyretarded children in the State of Pennsyl-vania spurred major policy shifts throughoutthe United States in special education. Thisase, Pennsylvania Association of Retarded
Children v. Commonwealth of Pennsylvania,was the cutting edge of a movement seekingto provide public education for all childrenregardless of their physical or mental limita-tions. A later court ruling in Louisiana (Le-banks v. Spears) in April 1973 specified that"all evaluations and educational plans, hear-ings, and determinations of appropriate pro-grams of education and training . . . shall bemade . in the context of a presumption that

among alternative programs and plans,placement in a regular public school classwith the appropriate support services is pref-erable to placement in special public schoolclasses." Subsequent court decisions havefurther challenged conventional notions oftesting and labeling children for placement inspecial education classes.
Out of this judicial thrust has come amajor new direction for special education.An important feature is the concept of"mainstreaming," or placing children withhandicapping conditions in a normal learn-ing environment whenever possible. To someextent, mainstreaming is part of a moregeneral reaction against the practice oftracking, or ability grouping, in separateclasses on the basis of such indices as intelli-gence test performance or reading achieve-ment scores. Recent research has estimatedthat 1 child out of 10 in school is exceptionalbecause of some learning problem or otherimpairment.
A major innovation, derived in part fromnew legal requirements, is the age rangewhich special education now serves. ManyStates have mandated special educationalprograms that extend services to childrenyounger and older in age than the programsfor normal children. The widest age range isin Michigan. This State provides publicspecial education programs for the handi-capped from birth to 25 years of age. Thoughprecise data are not available, experimentaleducational programs for very young chil-dren, even infants in the first year of life,have increased in the past 2 years. In addi-
Is
tion, higher education institutions (collegesand universities as well as postsecondarytechnical and vocational schools) are in-creasingly providing special education oppor-tunities for the handicapped. Increasedopportunities in higher education, vocationaleducation, and continuing adult educationhave been especially significant for the deafand orthopedically handicapped.
Also of help to the handicapped are theimprovements in educational materials, bothhardware and software, in the past 2 years.Innovations of particular promise includesensory aids for the blind and deaf, com-munication aids for the deaf and nonvocalphysically impaired, and telecommunicationssystems for delivering special education pro-grams to all handicapped groups. Better de-signed and better validated curriculum ma-terials for teaching the handicapped havebeen developed. New materials designedspecifically for teaching self-help skills, socialskills, reading, mathematics, science, andphysical education to the mentally retardedhave become widely available during the pastyear. Other promising materials have beendeveloped to assist blind, deaf, and ortho-pedically handicapped persons, and thosewith multiple handicaps.
Perhaps the most important achievementof all in recent years has been the develop-ment of a nationwide system of regionalcenters for disseminating information aboutthe availability, characteristics, and effec-tiveness of instructional materials. In addi-tion, another set of nationwide regionalcenters are developing model diagnostic and
11

prescriptive education services that are beingemulated by the States. A national specialeducation information service also maintainsa computerized national directory of specialeducation programs and facilities. And 12referral centers around the country helpparents to obtain the services most appro-priate for their handicapped children.
Bilingual Education
An estimated 5 million children in theUnited States need or could profit greatlyfrom the use of a language other than Eng-lish in the classroom-1.8 to 2.5 million lackbasic skills in the English language and 2.5to 3.5 million, although able to speak someEnglish, use another language at home.
Special educational services to this clien-tele have sharply increased during the past 2years, largely as a result of a court decision.Early in 1974 the U.S. Supreme Court in theLau v. Nichols case held that the failure ofthe school district in San Francisco, Calif.,to provide special language instruction tosome 1,800 limited-English-speaking Chinesestudents violated the 1964 Civil Rights Actby denying these students the right to ameaningful education. Congress quicklydoubled the Federal appropriation for bi-lingual education, thus accelerating what hadalready been a promising initiative. Newapproaches to bilingual education includingemphasis on the history and culture of chil-dren's forebears, multicultural classes, andbilingual textbooks, are being put into prac-
112
9
tice throughout the country. Numerous eth-nic subgroupsSpanish-surnamed, Indians,Eskimos, etc.have begun to find new re-sponsiveness to their individual needs withinthe educational system.
During the 1974-75 school year, Federalaid programs helped support nearly 400classroom demonstration projects in bilin-gual education directly serving a populationof a quarter of a million children. Forty-two languages and dialects were represented8 Indo-European (principally Spanish,Portuguese, French, Greek, and Russian), 11Asian, and 23 American Indian. Severalnational projects are spurring the develop-ment of teaching materials and assessmentinstruments for pupil placement and teachertraining. A national network of bilingualeducation specialists is developing and test-ing a wide range of curriculum materials.
One of the newer televised program effortsin the bilingual field is "Villa Alegre," aSpanish and English series aimed at 4- to 8-year olds. It made its debut over some 200stations nationally in fall 1974. "Carras-colendas," another popular Spanish-Englishprogram for young children, expanded itsofferings. The initial showing of an adultprogrlm, produced under the auspices of thenational Right-To-Read project and directedtoward illiterate Spanish-speaking Ameri-cans, has been scheduled for 1975.
Related to bilingual education is the recentgrowing interest in ethnic studies, stimulatedin part by the Ethnic Heritage Studies pro-gram in the Office of Education. The pro-

gram's basic purpose is to give students anopportunity to study their own heritage andthe contributions of other ethnic groups tothe Nation. Approximately 50 Federalgrants were made in 1974 and a similarnumber in 1975, to help support ethnicstudies programs in elementary and second-ary schools, colleges, and universities; andthose sponsored by nonprofit educational or-ganizations at local, State, and nationallevels. Among the ethnic populations servedare: the French-Canadians in Maine; blacksin the State of Washington; the Plateau In-dians in Washington ; Puerto Ricans in Con-necticut; and Caribbean-born Spanish-speaking young people in New York. Ethnicheritage will also be one of the major themesof the American Bicentennial Celebration.
Children's and Women's Rights
Court decisions of the late 1960's on suchrelatively minor issues as the length ofstudents' hair or dress styles showed a pro-found shift in public attitudes toward chil-dren's rights. Later, several court decisionsin cases involving disciplinary action ofstudents by educational personnel have re-duced the authority of public schools todiscipline students without due process.Concern over the issue has intensified at atime when student behavior in school hasemerged in public opinion polls as a highpriority problem.
Another recent development has been thepassage of Federal legislation regarding ac-
20
cess to students' school records. In responseto charges that the use of inaccurate ordisputable information from school recordshad negatively affected students' educationand employment opportunities, the Congresswrote a section into the Education Amend-ments of 1974 barring Federal funding toany school that does not give parents theright of access to their childrens' schoolrecords or that does not limit disclosure ofpersonally identifiable information fromschool records without parental consent. Atthe college level similar rights were given tothe students themselves.
Women's rights, mentioned in the report2 years ago, has emerged as an issue ofconsiderable influence in education. The Edu-cation Amendments of 1972 denied Federalfunds to institutions (with certain excep-tions) that discriminated on the basis of sexin admissions, employment, and the treat-ment of students. The Women's EducationalEquity Act of 1974, authorized under theEducation Amendments of 1974, added anew and positive element to the Federaleffort in respect to women's rights by au-thorizing a program to support the followingactivities: (1) Development, evaluation, anddissemination of educational materials re-lated to educational equity ; (2) preserviceand inservice training for educational per-sonnel, including guidance and counselingwith special emphasis on educational equity ;
(3) research, development, and educationalactivities designed to advance educationalequity ; (4) guidance and counseling activi-ties, including the development of nondis-
13

criminatory tests ; (5) educational activitiesto increase oppertunities for adult women ;and (6) expansion and improvement of edu-cational programs and activities for womenin vocational education, career education,physical education, and educational adminis-tration. Funding is expected in fiscal year1976.
The Current Federal Pole
Federal efforts, through the U.S. Office ofEducation, focus on these priority objec-tives:
To equalize educational opportunity forgroups and individuals who are at aneducational disadvantage by reason oftheir economic situation, race, location,or physical or mental handicaps.
To improve the quality and relevance ofAmerican education, primarily throughassistance to research, development, ex-perimentation, demonstration, dissemi-nation, and training.
To provide relief for areas of specialneedlimited general support to se-lected educational entities, foundations,and activities such as State and localeducation agencies, developing institu-tions, and vocational and adult educa-tion.
Compensatory education programs admin-
2114
istered by the Office of Education receive thelargest proportion of Federal funds. In fiscal1974, about $1.7 billionamounting to one-fourth of the total funds administered by theOffice of Educationwas allocated to ele-mentary and secondary schools in low-incomeareas to provide special services for educa-tionally disadvantaged children. In addition,during the same year, programs for migrantchildren received about $80 million a year inFederal education funds, special programsfor the handicapped about $150 million, andbilingual programs about $70 million.
In other programs administered by theU.S. Office of Education and directed towardequalizing educational opportunity, the Fed-eral Government in 1974 invested nearly $1.5billion in postsecondary student financial aidprograms, more than $63 million in the adulteducation program, and more than $14 mil-lion in the Right-To-Read program.
The Congress underlined its continuinginterest in compensatory efforts as part ofnational policy in the Education Amend-ments of 1974 by: "Recognizing that theNation's economic, political, and social se-curity requires a well-educated citizenry, theCongress (1) reaffirms, as a matter of highpriority, the Nation's goal of equal education-al opportunity, and (2) declares it to be thepolicy of the United States of America thatevery citizen is entitled to an education tomeet his or her full potential without finan-cial barriers."

II. Organization and Administration of Education
Authority
The authority for education in the UnitedStates is decentralized. The 10th amendmentto the Constitution provides that "the powersnot delegated to the United States by theConstitution, nor prohibited by it to theStates, are reserved to the States respective-ly, or to the people." Since responsibility foreducation is not mentioned in the Constitu-tion, it is legally considered delegated to theStates. Thus, each State has the right andresponsibility to organize and operate itseducational system as it deems appropriatesubject to constitutional guarantees of therights and privileges of U.S. citizens.
Federal Responsibility
The educational responsibilities of theFederal Government are both general andspecific. Its general responsibilities are toprovide encouragement, selective financialsupport, and leadership as appropriate with-in constitutional constraints. Its specific re-sponsibilities consist of activities consideredto be especially in the national interest. TheCongress of the United States has constitu-tional powers to allocate funds for education,but it has no direct control over it. In addi-tion to the major educational programsfunded by the U.S. Department of Health,Education, and Welfare, several other de-partments within the Federal Governmentmake large expenditures on specific educa-tional programs. For example, the NationalScience Foundation allocates funds for a
22
variety of research, training, and institution-al development programs in science; theU.S. Department of the Interior, for theeducation of American Indians and supportfor schools in the Trust Territory of thePacific Islands ; and the U.S. Department ofDefense, for its overseas schools for depend-ents of American military personnel.
With passage of the Education Amend-ments of 1972, a new structure in the or-ganization of the education programs withinthe U.S. Department of Health, Education,and Welfare (HEW) was developed. Thislegislation established within HEW an Edu-cation Division that included the Office ofEducation (OE) and the National Instituteof Education (NIE).' The head of the Edu-cation Division has the title of AssistantSecretary for Education and coordinates theactivities of OE and NIE. The AssistantSecretary's Office includes the National Cen-ter for Education Statistics (NCES), whichwas transferred from the Office of Educationby the Education Amendments of 1974, andthe Fund for the Improvement of Postsec-ondary Educ 'ion (FIPSE). The programof this latter office is designed "to improvepostsecondary educational opportunities byproviding assistance to encourage the re-form, innovation, and improvement of post-secondary education." 2 A 14-member ad-visory board makes recommendations on thepolicy direction of the fund.
Public Law 92-318, title III, sec. 401, June 23,1972.
Op. cit., sec. 404 ("Support for Improvementof Postsecondary Education ').
15

The Office of Education is the primaryagency of the Federal Government re-sponsible for administering legislatedprograms of service and assistance to edu-cational agencies, institutions, and organiza-tions with particular reference to broad na-tional concerns.
The National Institute of Education wascreated to provide Federal Government"leadership in the conduct and support ofscientific inquiry into the educational proc-ess." 3 At its establishment, the NIE ab-sorbed the bulk of the programs andfunctions that were previously carried outby the National Center for Educational Re-search and Development in the Office ofEducation. The NIE's functions includebuilding an effective educational researchand demonstration system ; strengtheningthe scientific and technological foundationsof education ; developing ideas and materialsto deal with areas of national concern in theclassroom ; and administering the dissemina-tion program of the Educational ResourcesInformation Center (ERIC) clearinghouses.It is guided by a director and a 15-memberNational Council on Educational Research,all appointed by the President.
State Responsibility and Control
Since each State' is responsible for itsown educational system, their practices and
3 Op. cit., sec. 405.In this context, the term "States" includes the
50 States of the Union, the District of Columbia,and the outlying areas.
16 23
policies differ. Each State's department ofeducation, under policies set by that State'sboard of education and chief State schoolofficer, administers its educational enter-prise. The State legislature is responsiblefor enacting laws pertaining to education forboth public and nonpublic schools in theState, but the State department of educationand local school districts are responsible foroperating the school system.
The State board of education determinesState educational policies in compliance withState laws. In some instances, board mem-bers are elected by the people; in others, theyare appointed by the State Governors andserve for terms ranging from 2 to 6 years.They are empowered to formulate policiesrelating to such educational affairs as allo-cation of school funds, certification of teach-ers, textbooks and library services, provisionfor records and educational statistics, andoverall coordination of the State school sys-tem. The board's responsibility may includenot only elementary and secondary schoolsbut State institutions for teacher educationand special schools for the handicapped.
The key education official and chief execu-tive officer of the State board of education isthe chief State school officer. The title givento this official most frequently is superintend-ent of public instruction or State commis-sioner of education. He may be elected bythe people or appointed by the Governor ofthe State or by the State board of education ;he serves from 1 to 6 years, his term of officeusually determined by the board. He is re-sponsible for administering the Scate school

system and implementing policies adopted bythe board. As the key official of the board, hegives leadership to the staff of the State de-partment of education, which is composed ofsupe' visory, professional, and administrativepersonnel appointed by him or by the board.The State professional personnel of elemen-tary, secondary, and specialized fields ofeducation work with local school officials toprovide directive, consultative, and otherservices.
Local Responsibility and Control
Each State (except Hawaii) has providedfor the establishment of local administrativedistricts, and vested them with extensiveauthority and responsibility for establishingand regulating the schools in their districts.Each local school district has a board ofeducation, usually made up of five to sevenmembers who have been appointed by higherofficials or elected by citizens of the schooldistrict. Within the limits of State policy, theboard operates the local school systemthrough the school superintendent and hisstaff.
The functions of the board of education indetermining educational policies, and of thesuperintendent of schools in executing thesepolicies, include a broad range of duties andresponsibilities. Together, the board and thesuperintendent are responsible for preparingthe school budget. They are responsible forhiring teachers and other school personnel,providing and maintaining school buildings,
24
purchasing school equipment and supplies,and, in most cases, providing transportationfacilities for pupils who live beyond a reason-able walking distance from school. Theirduties also include enacting rules and regula-tions consistent with State law and regula-tions of the State department of educationgoverning operation of the schools. Thus, thelimitations on the actions of school boardsare those established by the State legislatureand by the State education agencies, whichhave in most cases prescribed minimumstandards for all local school districts.
School systems vary in size from smallones in rural areas, with a single one-roomelementary school, to those in metropolitanareas with hundreds of schools of variouskinds and thousands of teachers. In someStates an intermediate school district hassometimes been established between the Statedepartment and the local school districts, notto administer schools but to provide servicesto local school systems that would not other-wise be availableconsultative, advisory,and statistical services, and regulatory func-tions. Some also provide operation of specialclasses, supervision of instruction, healthsupervision, attendance services, and pupiltransportation.
Ability to provide improved educationalfacilities and opportunities more economic-ally in larger school districts than in smallerones, has caused a trend toward reorganiza-tion and consolidation of school districts. In1972-73, the United States had an estimated17,036 school districts, varying among theStates from 1 in Hawaii to 1,350 in Nebraska
17

(a reduction of 48.1 percent in the past 10years).
One unique characteristic of U.S. educa-tion is the degree to which schools areoperated by local school authorities. Thebroad authority given local boards of educa-tion allows public educational programs tobe responsive to the will of the people andthe needs of the community. The teachershares in this authority, enjoying some meas-ure of independence in selecting methods andmaterials under guidelines established bythe State department of education.
The Postsecondary Level
The decentralized character of the educa-tional system is even greater at the post-secondary education level, partly becauseprivate higher education institutions in theUnited States predated State departments ofeducation and the development of publichigher education. Their early autonomy setthem apart from the mainstream of publiclyfinanced schools and established a strongprecedent for their relative independence.
U.S. postsecondary education institutionsoffer dis, erse programs, and vary in size andpattern of organization. Some are operatedby units of local and State government, butmore than half are privately controlled. Theyhave achieved some degree of uniformity instandards and practices by affiliating withregional and national professional associa-tions, and by cooperating with independent
18 25
accrediting agencies and voluntarily accept-ing their evaluation.
Most colleges and universities, whetherunder private or public auspices, are admin-istered by a governing body or board, usuallyknown as a board of trustees, governors, orregents. Members of the board may be ap-pointed or elected for a specified period oftime or for life, normally the former. Aninstitution charter, issued by the State, pre-scribes procedures for naming members ofthe boards of trustees. Board members of apublicly controlled institution usually areelected by the citizens of the State or ap-pointed by the Governor. Board members ofa private institution may be appointed bythe board of trustees and in some collegesand universities the alumni may have a rolein their selection. New organizational pat-terns are emerging that give students andfaculty a share through direct involvementin the decisionmaking process that governsthe operation of colleges and universities.Sometimes they are members of the board.
The board of trustees makes decisions re-garding policies, management, and person-nel, but the president or chancellor of theuniversity, with the administrative staff, isthe executive responsible for operating theinstitution. The board also selects the presi-dent, who, with the assistance of one or morevice presidents, directs the general adminis-tration of the institution. In a small institu-tion, the dean of instruction may haveresponsibilities for administration as well asfor professional development of educationalprograms. He is assisted by department or

division chairmen and by faculty groups,which work as committees on the manyproblems and issue:, that arise. Other ad-ministrative officials include the registrar,the director of admissions, the businessofficer, and the director of student affairs.
Structure
The Basic Framework
Education in the United States comprisesthree levelselementary, secondary, andpostsecondary education. Part of the pro-gram in most States includes kindergartens,vocational education, adult education, andschools or classes for the gifted, the mentallyretarded, the blind, the partially seeing, thedeaf, the hard of hearing, and crippled chil-dren. The organization and curriculum ofprivate schools and universities are similarto those of the free public schools. Throughtransfer of students and other contacts thereare many cooperative relationships betweenpublic and private schools.
Elementary schools provide education forat least 6 years, and in some schools for 8years. The minimum entrance age is 6.Secondary schools provide education for atleast 4 years and in some cases 6 years. Theusual entrance age is 12 or 14. While com-pulsory attendance laws vary slightly fromone State to another, the laws usually requirethat children between the ages of 7 and 16attend school. Completion of 12 grades ofschooling is usually required before entering
26
postsecondary education. Postsecondary edu-cation includes all programs pursued aftergraduation from high school, including pro-grams of less than 4 years in professional,technical, and community colleges, 4-yearundergraduate programs, and graduatestudies.
The school year for public elementary andsecondary schools usually begins in Septem-ber and ends in June; the fiscal year usuallystarts in July. Increasingly, school districtsacross the country strive to make education-al opportunities available to children in avariety of settings and throughout the year,including the summer months.
The elementary school is usually composedof the kindergarten and an additional six oreight grades. 471 some communities, nurseryschools for 3- or 4-year olds may be providedfor a period of 1 or 2 years before the chil-dren enter kindergarten. The kindergartenenrolls 4- or 5-year old children for 1 or 2years, before they enter the first grade. Insome school districts, the two beginning unitsoverlap. Approximately 84.1 percent of the5-year olds in the population were enrolledin kindergarten in 1973.
As shown in figure 1, in the 8-4 plan usedin many schools, students pursue grades 1through 8 in an elementary school, andgrades 9 through 12 in a secondary school.The 6-3-3 plan provides for an elementaryschool of 6 grades and an intermediate(junior) and senior high school of 3 gradeseach. Some communities consider that inter-mediate schools ease the transition from ele-
19
7

Ph. D. orAdvancedProfessionalDegree
Master'sDegree
Bachelor'sDegree
AssociateDegree orCertificate
High SchoolDiploma
Figure 1.The structure of education in the United States
Postdoctoral Study and Research
db*.
Doctor's Degree Study
416`22 Master's Degree Shish?
4111'U4111'ndergraduate:Liberal Arts or General
24
23
21
204.-
19 Junior or'"1*""Community institutes
18 Colleges
17
ProfessionalA, Schools1. (Teaching,
Medicine,Theology,
All.` Law, Etc.)
Undergraduate:Liberal Arts or General
16 4-YearHigh Schools
15
14
13
12
11
10
9
8
7
6
5
4
3
Age
-dr(8-4)
SeniorHigh schools
JuniorHigh Schools
416`
(6-3-3)
tCombined
Junior-SeniorHigh Schools
Elementary (or Primary) Schools
Kindergartens
Nursery Schools
70
6.4)
c in2. =CI
F,
33
03
5
4
3
2
1
12
11
10
9
8
7
6
5
4
3
2
1
K
NS
C)
Q.
C)1.7 8
<a
5' m3ag7,1 g"n3C)
0
m ,ea0
0
Grade
SOURCE. U.S. Department of Health, Education, and Welfare, National Center for Education Statistics, Digest of Education-
al Statistics, 1974.
2720 f

mentary to secondary schools. Smaller com-munities sometimes use the 6-6 plan with 6years each for both the elementary andsecondary school programs. The purpose ofthe different organizational plans is to makethe best use of a school system's physicalfacilities, staff, and instructional tools with-in the framework of established goals.
The secondary level of education in theUnited States is sometimes organized as a4-year program. In some communities a 6-year program, including the intermediateschool grades 7 and 8, is the preferred or-ganizational plan. The usual entrance age forintermediate school is 12, and 14 for seniorhigh school.
After satisfactorily completing 12 yearsof elementary and secondary education, ahigh school graduate is usually 17 or 18years old.
High school graduates may enter a junioror community college, a technical institute,a professional school, a 4-year college, or theundergraduate division of a university. Apublic or private junior or community col-lege normally offers a 2- or 3-year programof study beyond the secondary level. Pro-grams usually include a curriculum leadingto a certificate and students receive creditsthat may be acceptable toward a bachelor'sdegree in a 4-year college. Some programsare terminal in nature, and prepare studentsto become proficient for employment in oneof a wide variety of semiprofessional andtechnical occupations. They also may offergeneral courses of continuing education foradults.
The public community college is supportedand controlled by the community in which itis located. It serves students in the immediatecommunity and those who live within com-muting distance. Fees are comparativelylow, because students live at home and there-fore have no additional expenses for roomand board.
The technical institute is an institutionorganized as an independent institution ofpostsecondary education or as a division ordepartment in a 2- or 4-year higher educationinstitution. It usually offers a 2- or 3-yearterminal program (in such fields as health,mechanics, electrical or electronic engineer-ing, business, or construction) designed tolead to employment in occupations requiringtechnical skills.
The 4-year college offers a curriculum inthe liberal arts and sciences and is authorizedto confer the bachelor's degree upon com-pletion of the 4-year program. The studentmay begin specialization at the undergradu-ate level. A college may be independent or anundergraduate division of a university. In-dependent colleges sometimes offer advanceddegrees, particularly at the master's level.At least 1 year of study beyond the bachelor'sdegree is required for a master's degree ; thedoctor's degree usually requires 3 or 4 yearsof graduate study beyond the baccalaureate.
The university usually includes a collegeof liberal arts and sciences that awardseither a B.A. or B.S. degree ; one or moreprofessional schools ; and a graduate schoolthat offers opportunities for advanced study
28 21

and research. Most universities are au-thorized to confer the bachelor's, master's,and doctor's degrees in liberal arts, profes-sional, and scientific fields. However, nosingle standard designates an institution asa university, and therefore "university" ispart of the name of some colleges or otherinstitutions that do not offer doctorates.
The professional school is either a majordivision of a college or university, or is anindependent institution for study and re-search in professional or technological fieldssuch as architecture, business, education, en-gineering, law, medicine, the physicalsciences, and theology It offers programsthat lead to a degree and fulfill academic re-quirements for certification cr licensure in aspecialized profession. Depending on thespecialty selected, the entrance requirementsvary from secondary school graduation tocompletion of -a preprofessional curriculumin a college of arts and sciences.
Experimentation
Schools in the United States are continuallyexperimenting with different structures andprogram organization. Among those current-ly receiving favorable attention are themultiunit plan, alternative schools, modularscheduling, the open school, the free school,the school without walls, the university with-out walls, the consortium, and experience-based learning.
The multiunit plan has an organizationalpattern that replaces the classroom with a
22 29
nongraded instructional and research unit.Each unit contains 100 to 150 children with-in four age groups (4-6, 6-9, 8-11, and10-12). It also has a unit leader or masterteacher, two or three staff teachers or teach-ing interns, and one or two aides. The secondlevel of organization is the "instructionalimprovement committee," consisting of aschool's unit leaders and principal. The thirdlevel is the "systemwide policy committee."The multiunit school is designed to be thefirst step in a new system of elementaryeducation called "individually guided educa-tion." Some schools are developing their ownprograms to use in multiunit schools.
Alternative schools are often characterizedby strict discipline and a traditional curricu-lum that emphasizes skill acquisition. Theyoffer an option to parents who may preferthe alternative schools to the regular schoolsin the system.
Modular (flexible) scheduling encompassesa variety of plans in both elementary andhigh schools that reorder the traditionalclass time allotments. It provides greaterflexibility built around individual studentneeds.
The open school provides for small clustersor centers of learning within large openspaces in school buildings. This plan iscoupled with individualized instruction, teamteaching, and wide use of audiovisual aids.The open school is able to offer instructionmore tailored to student needs and capabili-ties than can the traditional school.
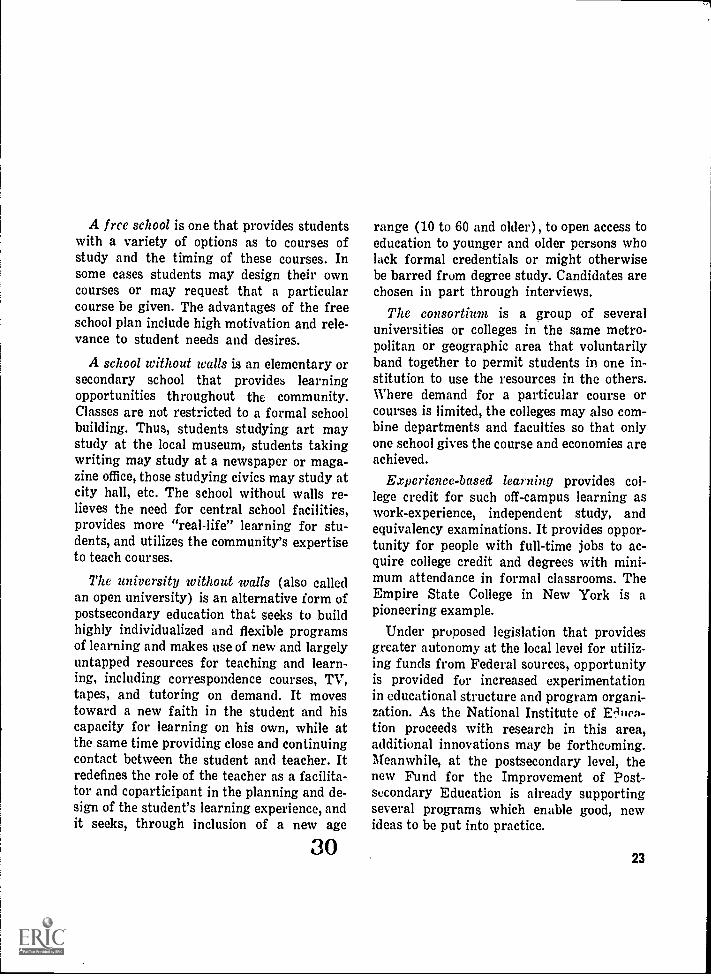
A free school is one that provides studentswith a variety of options as to courses ofstudy and the timing of these courses. Insome cases students may design their owncourses or may request that a particularcourse be given. The advantages of the freeschool plan include high motivation and rele-vance to student needs and desires.
A school without walls is an elementary orsecondary school that provides learningopportunities throughout the community.Classes are not restricted to a formal schoolbuilding. Thus, students studying art maystudy at the local museum, students takingwriting may study at a newspaper or maga-zine office, those studying civics may study atcity hall, etc. The school without walls re-lieves the need for central school facilities,provides more "real-life" learning for stu-dents, and utilizes the community's expertiseto teach courses.
The university without walls (also calledan open university) is an alternative form ofpostsecondary education that seeks to buildhighly individualized and flexible programsof learning and makes use of new and largelyuntapped resources for teaching and learn-ing, including correspondence courses, TV,tapes, and tutoring on demand. It movestoward a new faith in the student and hiscapacity for learning on his own, while atthe same time providing close and continuingcontact between the student and teacher. Itredefines the role of the teacher as a facilita-tor and coparticipant in the planning and de-sign of the student's learning experience, andit seeks, through inclusion of a new age
30
range (10 to 60 and older), to open access toeducation to younger and older persons wholack formal credentials or might otherwisebe barred from degree study. Candidates arechosen in part through interviews.
The consortium is a group of severaluniversities or colleges in the same metro-politan or geographic area that voluntarilyband together to permit students in one in-stitution to use the resources in the others.Where demand for a particular course orcourses is limited, the colleges may also com-bine departments and faculties so that onlyone school gives the course and economies areachieved.
Experience-based learning provides col-lege credit for such off-campus learning aswork-experience, independent study, andequivalency examinations. It provides oppor-tunity for people with full-time jobs to ac-quire college credit and degrees with mini-mum attendance in formal classrooms. TheEmpire State College in New York is apioneering example.
Under proposed legislation that providesgreater autonomy at the local level for utiliz-ing funds from Federal sources, opportunityis provided for increased experimentationin educational structure and program organi-zation. As the National Institute of Dliira-lion proceeds with research in this area,additional innovations may be forthcoming.Meanwhile, at the postsecondary level, thenew Fund for the Improvement of Post-secondary Education is already supportingseveral programs which enable good, newideas to be put into practice.
23

III. Statistics on Education'
An Overview
Education was the primary occupation of62.2 million Americans in the fall of 1974.Included in this total were 58.9 million stu-dents, 3 million teachers, and some 300,000superintendents, principals, supervisors, andother instructional staff members. Thismeans that, in a nation of 212 million people,nearly 3 out of'every 10 persons were direct-ly involved in the educational process. It isnot surprising, therefore, that so much atten-tion is being focused upon our schools andcolleges and that a substantial portion of ourresources is being allocated to this vital en-terprise. Increased support for education inrecent years has come from Federal, State,and local government, as well as from avariety of private sources. The total expendi-tures of educational ;nstitutions amounted toapproximately $100 billion during the schoolyear 1973-74.
Enrollment
Total enrollment in regular educationalprograms from kindergarten through gradu-ate school increased for 27 consecutive yearsbefore reaching an all-time high of 59.7 mil-lion in fall 1971. Subsequently, there havebeen small annual decreases at the elemen-tary school level, reflecting the fact that thereare now fewer children 5 to 13 years of agethan in the recent past. Further reductions
' Prepared by HEW's National Center forEducation Statistics.
24 31
in elementary school enrollment are expectecfor the next several years because fewerchildren will be reaching school age. Enroll-ment is continuing to rise at the high schooland college levels.
Between fall 1973 and fall 1974, enroll-ment in kindergarten (ages 5-6; excludingnursery schools) through grade 8 decreasedfrom 35.1 to 34.4 million, or about 2 percent ;enrollment in grades 9 through 12 increasedfrom 15.4 to 15.6 million, or nearly 11/2 per-cent ; and degree-credit enrollment in highereducation institutions rose from 8.5 to 8.9million, or about 41/2 percent. Additionalenrollment information by level and controlmay be found in table 1.
Since the end of World War II, a dominanttrend in this country has been for more andmore persons to enter the educational systemat an earlier age and to remain in school fora longer period of time than their predeces-sors. This trend is illustrated most dramati-cally in table 2, which shows the percentageof 5-year olds enrolled in school in 1973 withthe comparable percentages one and two de-cades ago. More than 84 percent of the 5-yearolds were enrolled in school in fall 1973, ascompared with 68 percent in 1963 and 58percent in 1953. The enrollment percentagesfor persons in their middle and late teens,while down slightly from the peaks theyattained around 1968, were substantiallyhigher in 1973 than in 1953 and somewhathigher than they were in 1963. At all agesafter 5, peak enrollment percentages camebefore 1973, the greatest decline (7.5 per-cent) being for the group aged 18 and 19.

Table 1.-Estimated enrollment in educational institutions, by level of instruction and by'type of control: United States, fall 1973 and fall 1974'
[In thousands]
Level of instruction and type of control Fall 1973 Fall 1974
1 2 3
Total elementary, secondary, and higher education 59,039 58,910Public
52,038 51,940Nonpublic .......... 7,001 6,970
Kindergarten-grade 12 (regular and other schools)= 50,519 50,010Regular public schools .... 45,409 45,000Regular nonpublic schools
4,800 4,700Other public schools ......... 240 240Other nonpublic schools ..... . , 70 70
Kindergarten-grade 8 (regular and other schools)" 35,133 34,400Regular public schools 31,333 30,700Regular nonpublic schools
3,600 3,500Other public schools ............. 170 170Other nonpublic schools . . ...... 30 30Grades 9-12 (regular and other schools)' 15,386 15,610Regular public schools 14,076 14,300Regular nonpublic schools
1,200 1,200Other public schools . 70 70Other nonpublic schools40 40
Higher education (total degree-credit enrollment in universities, colleges, profes-sional schools, teachers colleges, and junior colleges)' 8,520 8,900
Public6,389 6,700Nonpublic .... 2,131 2,200
Undergraduate' 7,397 7,700Graduate ...... 1,123 1,200
The 1973 figures for regular nonpublic and other elementary and secondary schools, and all 1974 figures, are estimates.Surveys of nonpublic elementary and secondary schools have been conducted at less frequent intervals than those of publicschools and of institutions of higher education. Consequently, the estimates for nonpublic schools are less reliable than thosefor other types of institutions. The estimates for 1974 are derived from the Increases expected from population changes com-bined with the long-range trend in school enrollment rates of the population."Regular" schools include schools which are a part of State and local school systems and also most nonprofit-making non-public elementary and secondary schools, both church- affiliated and nonsectarian "Other" schools include subcollegiate de-partments of institutions of higher education, residential schools for exceptional children, Federal schools for Indians, andFederal schools on military posts and other Federal installations.Excludes undergraduate students in occupational programs which are not ordinarily creditable toward a bachelor's degree.There were approximately 1,082,000 of these nondegree-credit students in fall 1973.Includes students working toward first-professional degrees, such as M.D., D.D.S., LL.B., and B.D.
NOTE.-Fall enrollment is usually smaller than school-year enrollment, since the latter is a cumulative figure which includesstudents who enroll at any time during the year.SOURCES: U.S Department of Health, Education, and Welfare, National Center for Education Statistics, Slataitics of PublicElementary and Secondary bay School*, Fall 1973; Fall Enrollment in Higher Education, 1973; and estimates of the NationalCenter for Education Statistics. 32
25

Table 2.-Percent of the population 5 to 34 years old enrolled in school, by age:United States, October 1947 to October 1973
YearIota!,5-34years
5 years' 6 years' 7-9 10-13years years
14-15 16-17years years
18-19years
20-24 25-29years years
30-34years
1 2 3 4 5 6 7 8 9 10 11 12
1947 42.3 53.4 96.2 98.4 93.6 91.6 67.6 24.3 10.2 3.0 1.01948 43.1 55.0 96.2 98.3 98.0 92.7 71.2 26.9 9.7 2.6 .9
1949 43.9 55.1 96.2 98.5 98.7 93.5 69.5 25.3 9.2 3.8 1.1
1950 44.2 51.8 97.0 98.9 98.6 94.7 71.3 29.4 9.0 3.0 .9
1951 45.4 53.8 96.0 99.0 99.2 94.8 75.1 26.3 8.3 2.5 .7
1952 46.8 57.8 95.8 98.7 98.9 96.2 73.4 28.7 9.5 2.6 1.21953 ....... 48.8 58.4 97.7 99.4 99.4 96.5 74.7 31.2 11.1 2.9 1.71954 50.0 57.7 96.8 99.2 99.5 95.8 78.0 32.4 11.2 4.1 1.51955 50.8 58.1 98.2 99.2 99.2 95.9 77.4 31.5 11.1 4.2 1.61956 52.3 58.9 97.0 99.4 99.2 96.9 78.4 35.4 12.8 5.1 1.9
1957 53.6 60.2 97.4 99.5 99.5 97.1 80.5 34.9 14.0 5.5 1.81958 54.8 63.8 97.3 99.5 99.5 96.9 89.6 37.6 13.4 5.7 2.21959 55.5 62.9 97.5 99.4 99.4 97.5 82.9 36.8 12.7 5.1 2.21950 56.4 63.7 98.0 99.6 99.5 97.8 82.6 38.4 13.1 4.9 2.41961 56.8 66.3 97.4 99.4 99.3 97.6 83.6 38.0 13.7 4.4 2.0
1962 57.8 66.8 97.9 99.2 99.3 98.0 84.3 41.8 15.6 5.0 2.61963 58.5 67.8 97.4 99.4 99.3 93.4 87.1 40.9 17.3 4.9 2.51964 58.7 68.5 98.2 99.0 99.0 98.6 87.7 41.6 16.8 5.2 2.61965 59.7 70.1 98.7 99.3 99.4 98.9 87.4 46.3 19.0 6.1 3.21966 60.0 72.8 97.6 99.3 99.3 98.6 88.5 47.2 19.9 6.5 2.7
1967 60.2 75.0 93.4 99.4 99.1 98.2 88.3 47.6 22.0 6.6 4.01968 60.0 74.9 98.3 99.1 99.1 93.0 90.2 50.4 21.4 7.0 3.91969 60.0 76.2 98.2 99.3 99.1 98.1 89.7 50.2 23.0 7.9 4.81970 58.9 77.7 98.4 99.3 99.2 98.1 90.0 47.7 21.5 7.5 4.21971 58.5 82.5 98.4 99.1 99.2 98.6 90.2 49.2 21.9 8.0 4.9
1972 56.8 83.5 98.1 99.0 99.3 97.6 88.9 46.3 21.6 8.6 4.61973 55.4 84.1 98.5 99.1 99.2 97.5 88.3 42.9 20.8 8.5 4.5
I Includes children enrolled in kindergarten, but excludes those enrolled in nursery schools.NOTE.-Data are based upon sample surveys of the civilian noninstitutional population.SOURCES. U.S. Department of Commerce, Bureau of the Census, r III I ( lit Popithitwil R punt, Series P-20, and U.S. Departmentof Health, Education, and Welfare, Office of Education, reports on Preprimary En, cdment.
Table 3 provides evidence of the long termgrowth of secondary education in the UnitedStates. From 1890 to 1973, the population 14to 17 years of age tripled, enrollment ingrades 9 through 12 increased 43 times, from360,000 to 15.4 million. In 1890 only about 1
26
person in 15 in the 14 to 17 age group wasenrolled in school ; in 1973 the figure wasmore than 9 out of 10.
Within the past 20 years, college enroll-ment in the United States has quadrupled.Part of the increase in college enrollment
33

Table 3.Enrollment in grades 9-12 in public and nonpublic schools compared withpopulation 14-17 years of age: United States, 1889.90 to fall 1973
Enrollment, grades 9-12 and postgraduate
Schoolyear All schools Public schools Nonpublic schools
Totalnumberenrolled
Population per 10014-17 years persons
of age' 14-17yearsof age
1 2 3 4 5 6
1889-90 359,949 3 202,963 3 94,931 5,354,653 6.71899-1900 699,403 3 519,251 3 110,797 6,152,231 11.41909-10 1,115398 3 915,061 3 117,400 7,220,298 15.41919-20 2,500,176 3 2,200,389 3 213,920 7,735,841 32.31929-30 4304,255 3 4399,422 "341,158 9341,221 51.4
1939-40 7,123,009 6,635,337 487,672 9,720,419 73.31941-42 6,933,265 6,420,544 512,721 9,749,000 71.11943-44 6,030517 5584,656 445,961 9,449,000 63.81945-46 6,237,133 5,664,528 572,605 9,056,000 68.91947-48 6,305,168 5575,937 629,231 8,841,000 71.3
1949-50 6,453,009 5,757,810 695,199 8,404,768 76.81951-52 6,596,351 5,917,384 678,967 8,516,000 77.51953-54 7,108,973 6330565 778,408 8,861,000 80.21955-56 7,774375 6,917,790 857,185 9,207,000 84.41957-58 8,869,186 7,905,469 963,717 10,139,000 87.5
1959-60 9,599,810 8531,454 1,068,356 11154,879 86.11961-62 , . 10,768,972 9,616,755 1,152,217 12,046,000 89.4Fall 1963 12,255,496 10,935,536 1,319,960 13,492,000 90.8Fall 1965 .. 13,020,823 11,657,808 1,363,015 14,145,000 92.1Fall 1969 14,518,301 13,084,301 ' 1,434,000 15,550,000 93.4
Fall 1971 15,226,000 13,886,000 '1,340,000 16,279,000 93.5Fall 1973' ... 15,386,000 14,146,000 1,240,000 16,743,000 91.9
Unless otherwise indicated, includes enrollment in subcollegiate departments of institutions of higher education and inresidential schools for exceptional children. Beginning in 1949.50, also includes Federal schools.2 Includes all persons residing in the United States, but excludes Armed Forces overseas. Data from the decennial censuseshave been used when appropriate. Other figures are Bureau of the Census estimates as of July 1 preceding the opening ofthe school year.'Excludes enrollment in subcollegiate departments of institutions of higher education and in residential schools for excep-tional children.4 Data for 1927-28.g Estimated.8 Preliminary data.
NOTE.Beginning in 1959.60, includes Alaska and Hawaii.SOURCES: U.S. Department of Health. Education, and Welfare. National Center for Education Statistics. Statiattes of StateSchool Systems. Stattatien of Public Elementary and Secondary flay Schools, Statistics of 11onpublic Mcmcntary andSecondary Schools; and unpublished data.
34
27

may be accounted for by the increased popu-lation of young people. Table 4 shows, how-ever, that another factor has contributed toincreased college attendance; the proportionof young people attending college has risenfrom about 13 percent in the early 1950's toapproximately one-third today.
For more than half a century the FederalGovernment has assisted State and local gov-ernments in providing vocational educationprograms. In recent years new programshave been added to the traditional classes inagriculture, home economics, and trades andindustry, and the number of participants hasincreased at a rapid rate. As shown in table5, more than 12 million students were en-rolled in federally aided vocational classes in1973.
Teachers and Instructional Staff
The teaching staff in U.S. schools and col-leges grew rapidly during the 1960's, keepingpace with, and frequently exceeding, the risein enrollments. The number of teachers hasnow stabilized at a high level. Table 6 showsthat between the fall of 1973 and 1974 thenumber of teachers remained near 3.0 mil-lion. Small gains in the number of secondaryand college teachers were nearly offset by asmall decline in elementary teachers.
The long-range trend is for the number ofpublic elementary and secondary schoolteachers to grow at a somewhat faster ratethan school enrollment. Consequently, therehas been a slight decline in the past few years
28 35
in the number of pupils per teacher. As table7 indicates, there were 21.4 pupils perteacher in public schools in 1973 as comparedwith 23.2 pupils per teacher 5 years earlier.
Schools and School Districts
There were approximately 16,700 localschool districts in the United States in fall1973. More than 3,700 school districts wereeliminated over a 5-year period, as seen intable 7. The number of school districts isgradually being reduced through a processof reorganization and consolidation.
The number of public elementary schoolsis also declining, reflecting school consolida-tions and some elimination of small ruralschools. In 1972-73 the public school systemincluded 62,900 elementary schools, 23,900secondary schools, and 2,000 combined ele-mentary-secondary schools (organized andadministered as a single unit).
High School and College Graduates
More than 3 million persons graduatedfrom high school in 1973, and about 1.3 mil-lion received earned degrees from U.S. col-leges and universities. Included in thedegrees conferred were 1 million bachelors'degrees and first-professional degrees, andnearly 300,000 masters' and doctors' degrees.Tables 8 and 9 show that within the past 15years the annual number of high schoolgraduates has doubled ; bachelors' and first-

Table 4.Degreecredit enrollment in institutions of higher education compared withpopulation aged 18.24: United States, fall 1950 to fall 1973
YearPopulation
18-24 yearsof age'
Enroll-ment
Number enrolled per 100persons 18-24years of age
YearPopulation
18-24 yearsof age'
Enroll-ment
Number en-rolled per 100persons 18-24years of age
1 2 3 4 1 2 3 4
1950 .. 16,076,000 2,286,500 14.2 1960 16,128,000 3,582,726 22.21951 . . 15,781,000 Z107,109 13.4 1961 17,004,000 3,860,643 22.71952 .... 15,473,000 2,139,156 13.8 1962 17,688,000 4,174,936 23.61953 .... 15,356,000 Z235,977 14.7 1963 18,268,000 4,494,626 24.61954 .... 15,103,000 2,452,466 16.2 1964 18,783,000 4,950,173 26.4
1955 ..,. 14,968,000 Z660,429 17.8 1965 20,293,000 5,526,325 27.21956 14,980,000 2,927,367 19.5 1966 21,376,000 '5,928,000 27.71957 .... 15,095,000 3,047373 20.2 1967 22327,000 *6,406,000 28.71958 ., .. 15,307,000 3,236,414 21.2 1968 22,883,000 6,928,115 30.31959 .. 15,677,000 3,377,273 21.5 1969 23,723,000 7,484,073 31.5
1970 24,683,000 7,920,149 32.119/1 25,776,000 8,116,103 31.51972 25,901,000 8,265,057 31.91973 26,381,000 8,519,750 32.3
2 These Bureau of the Census estimates are as of July 1 preceding the opening ofForces overseas.2 Estimated.NOTE.Data are for 50 States and the District of Columbia. Beginning in 1953,extension students: data for earlier years exclude extension students.SOURCES: U S Department of Health, Education, and Welfare, National Center forhigher Education, U.S. Department of Commerce, Bureau of the Census. Currentand 519.
36
the academic year. They include Armed
enrollment figures include resident and
Education Statistics. Fall Enrollment ixPopulation Reports, Series P-25 Nos. 311
29

Table 5.-Enrollment in federally aided vocational classes, by type of program:United States and outlying areas, 1920 to 1973
Type of program
Fiscal year TotalAgri- Dist ribu-
culture tine occu- Homepations economics
Tradesand
industry
Healthoccupa-tions
Technicaleduca-t ion
Officeoccupa-
tionsOther
programs
1 2 3 4 5 6 7 8 9 10
1920 265,058 31,301 48,938 184,8191930 981,882 188,311 . 174,967 618,6041940 2,290,741 584,133 129,433 818,766 758,4091942 2,624,786 605,099 215,049 954,041 850,5971944 2,001,153 469,959 181,509 806,605 543,080
1946 2,227,663 510,331 174,672 911,816 630,8441948 2,836,121 640,791 292,936 1,139,766 762,6281950 3,364,613 764,975 364,670 1,430,366 804,6021952 3,165,988 746,402 234,984 1,391,389 793,2131954 3,164,851 737,502 220,619 1,380,147 826,533
1956 3,413,159 785,599 257,025 1,486,816 883,719 . . .
*27,423. . .
1958 3,629,339 775,892 282,558 1,559,822 983,644 . . .
1960 3,768,149 796,237 303,784 1,588,109 938,490 40.250 101,2791962 4,072,677 822,664 321,065 1,725,660 1,005,383 48,985 148,9201964 4,566,390 860,605 334,126 2,022,138 1,069,274 59,006 221,241
1966 6,070,059 907,354 420,426 1,897,670 1,269,051 83,677 253,838 1,238,0431968 7,533,936 851,158 574,785 2,283,338 1,628,542 140,987 269,832 1,735,997 49,2971970 8,793,960 852,983 529,365 2,570,410 1,906,133 198,044 271,730 2,111,160 354,1351972 11,710,767 896,460 640,423 3,445,698 2,397,968 336,652 337,069 2,351,878 1,304,6191973 12,283,538 927,591 738,547 3,516,683 2,702,238 421,075 364,044 2,499,095 1,114,265
SOURCES, U S. Department of Health, Education, and Welfare, Office of Education, annual reports on 1 °catmint and 7'echnical Education ; and Summary Data, Vocational Education, Piucal Year 1973.
3730

Table 6.Estimated number of classroom teachers in elementary and secondary schools,and total instructional staff for resident courses in institutions of higher education:
United States, fall 1973 and fall 1974'
[Full-time and part-time teachers and staff]
Level of instruction and type of control Fall 1973 Fall 1974
1 2 3
Total elementary, secondary, and higher education . 2,997,000 3,005,000
Public 2,565,000 2,572,000Nonpublic .. .... .... . 432,000 433,000
Elementary and secondary classroom teachers in regular and other schools' 2,377,000 2,383,000
Public 2,141,000 2,147,000Nonpublic .. ..... . .. 236,000 236,000
Elementary classroom teachers in regular and other schools' 1,300,000 1,290,000
Public 1,146,000 1,135,000Nonpublic 154,000 155,000
Secondary classroom teachers in regular and other schools 2 1,077,000 1,093,000
Public ........ . 995,000 1,012,000Nonpublic 82,000 81,000
Higher education instructional staff for resident courses (first term)' 620,000 622,000PutIlic ......
. ........ 424,000 425,000Nonpublic . 196,000 197,000
The 1973 figures for nonpublic and other elementary and secondary schools and for institutions of higher education, and all1974 figures, are estimates. Data for nonpublic elementary and secondary schools are not as complete as those for publicschools; consequently, the estimates for nonpublic schools are not as reliable as thcse for public schools or for higher edu-cation. The estimates for 1974 are derived from expected enrollment changes combined with the long-term trend in pupil-teacher ratios.2 The figures include elementary and secondary classroom teachers in regular public and nonpublic schools and other schools,such as Federal schools for Indians, federally operated schools on posts, subcollegiate departments of colleges, and residentialschools for exceptional children For 1973. the numbers of such teachers are estimated as 12,000 in public and 2,000 in non-public elementary schools; 4,000 in public and 3,000 in nonpublic secondary schools.Includes full-time and part-time staff with rank of instructor or above, and junior staff, such as graduate assistants, forinstruction in resident courses.SOURCES. Surveys and estimates of the National Center for Education Statistics, U.S. Department of Health, Education, andWelfare.
38
31

Table 7.-Selected statistics for public elementary and secondary schools:United States, fall 1968 and fall 1973
Item Fall1968
Fall1973
Percentagechange,
1968 to 19731 2 3 4
Local school districtsTotal _ .... , .- ..... .. . .., ............ 20,440 16,698 -18.3Operating 19,339 16,338 -15.5Nonoperating .... ....... .... . ..... 1,101 360 -67.3
Number of schools'Total 94,197 88,864 -5.7Elementary only .. . .... . _ . ............ ... . 67,186 62,942 -6.3Secondary only .. , . 23,318 23,919 2.6Combined elementary and secondary 3,693 2,003 -45.8
EnrollmentTotal ..,._ .... ....... ................... ,.., . 44,943,904 45,408,805 1.0Elementary 27,362,858 26,414,389 -3.5Secondary , ....... . .. .. . ,_ ..... 17,581,046 18,994,416 8.0
Percent of total membership in elementary schools , 60.9 58.2
Percent of total membership in secondary schools .. 39.1 41.8
Classroom teachersTotal, full-time and part-time _ .. 1,936,331 2,125,094 9.7Elementary schools . . .. 1,075,927 2 1,134,056 '5,4Secondary schools , .. , ..... . - . . ..... .. 860,404 2991,038 215.2
Percent of total teachers in elementary schools 55.6 253.4Percent of total teachers in secondary schools 44.4 246.6Pupil-teacher ratio
All schools . . . 23.2 21.4Elementary schools 25.4 223.3 ... .......Secondary schools 20.4 '19.2
Public high school graduates'Total graduates of regular day school programs 2,394,535 2,730,000 14.0Boys ,. . 1,193,425 1,353,000 13.4Girls .. , . 1,201,110 1,377,000 14.6Other programs 42,746 34,973 -18.2High school equivalency certificates 96,509 190,713 97.6
Data for previous school year.:Estimated.SOURCE! U S. Department of Health, Education, and Welfare, National Center for Education Statistics, ta :mime of StateSchool Systems 1667 68 and Statistics of Public Elementary and Secondary !my Schools, Fall 1971 and Fall 1973.
39
32

i
Table 8.-Number of high school graduates compared with population 17 years of age:United States, 1869.70 to 1972.73
School year
1
1869-70 ..1879-801889-901899-19001909-101919-20
1929-301939-401941-421943-441945-461947-48
1949-501951-521953-541955-561957-581959-60
1961-621963-641965-661967-681969-701971-721972-73
Population 17years old' Total
High school graduates'
Boys Girls
Numbergraduated per
100 persons17 years of age
2 3 4 5 6
815,000 16,000 7,064 8,936 2.0946,026 23,634 10,605 13,029 2.5
1,259,177 43,731 18,549 25,182 3.51,489,146 94,883 38,075 56,808 6.41,786,240 156,429 63,676 92,753 8.81,855,173 311,266 123,684 187,582 16.8
2,295,822 666,904 300,376 366,528 2S.02,403,074 1,221,475 578,718 642,757 50.82,425,574 1,242,375 576,717 665,658 51.22,410,389 1,019,233 423,971 595,262 42.32,254,738 1,080,033 466,926 613,107 47.92,202,927 1,189,909 562,863 627,046 54.0
2,034,450 1,199,700 570,700 629,000 59.02,040,800 1,196,500 569,200 627,300 58.62,128,600 1,276,100 612,500 663,600 60.02,270,000 1,414,800 679,500 735,300 62.32,324,000 1,505,900 725,500 780,400 64.82,862,005 1,864,000 898,000 966,000 65.1
2,768,000 1,925,000 941,000 984,000 69.53,001,000 2,290,000 1,121,000 1,169,000 76.33,515,000 2,632,000 1,308,000 1,324,000 74.93,521,000 2,702,000 1,341,000 1,361,000 76.73,825,343 2,896,000 1,433,000 1,463,000 75.73,957,000 3,006,000 1,490,000 1,516,000 76.04,024,000 3,037,000 1,501,000 1,536,000 75.5
I Includes graduates of public and nonpublic schools., Data from Bureau of the Census.NOTE-Beginning in 1959.60, includes Alaska and Hawaii.SOURCES. U S Department of Health, Education, and Welfare. National Center fcr Education Statistics, istatigrirs of StateSchool Systems. Statistics of l'ablie Elementary and Secondary hay Schools, fait ,o;.:, Statistics of Au:ay:abbe Ltementaryand Secondary Scbools;and unpublished data.
40
33

Table 9.-Earned degrees conferred by institutions of higher education:United States, 1869-70 to 1972-73
Year
Earned degrees conferredBachelor's Master's
All degrees and first- except first- Doctor'sprofessional professional'
1 2 3 4 5
1869-70 9,372 9,371 0 11879-80 13,829 12,896 879 541889-90 ........... . . . . . . _ ........... 16,703 15,539 1,015 1491899-1900 29,375 27,410 1,583 3821909-10 39,755 37,199 2,113 443
1919-20 53,516 48,622 4,279 6151929-30 139,752 122,484 14,969 2,2991939-40 216,521 186,500 26,731 3,2901941-42 213,491 185,346 24,648 3,4971943-44 141,582 125,863 13,414 2,305
1915-46 157,349 136,174 19,209 1,9661947-48 317,607 271,019 42,400 4,1881949-50 496,661 432,058 58,183 6,4201951-52 ..................... - . . . . . 401,203 329,986 63,534 7,6831953-54 356,608 290,825 56,788 8,995
1955-56 376,973 308,812 59,258 8,9031957-58 436,979 362,554 65,487 8,9381959-60 ........................ ^ 476,704 392,440 74,435 9,8291961-62 514,323 417,846 84,855 11,6221963-64 ...... 614,194 498,654 101,050 14,490
1965-66 709,832 551,040 140,555 18,2371967-68 866,548 666,710 176,749 23,0891969-70 1,065,391 827,234 208,291 29,8661970-71 1,140,292 877,676 230,509 32,107
1971 -72' ...... 1,210,280 926,870 250,080 33,3301972 -73' ..... . . . . ........ 1,295,100 1,004,700 256,300 34,100
2 Beginning in 1965-66, includes all master's degrees.2 Preliminary data.2 Estimated.
NOTE.-Beginning in 1959.60, includes Alaska and Hawaii.SOURCES. U.S. Department of Health, Education, and Welfare, National Center for Education Statistics, /14..nnial Surety ofEducation in the United State!; Earned Degrees Conferred; and unpublished data.
41
34

Figure 2.Number of high school graduates for each 100 persons 17 yearsof age: United States, 1869-70 to 1969-70
80
70
60
NOre 50
ra
; 40vEz
30
20
10
0
1810 1880 1890 1900 1910 1920 1930 1940 1950 1960 1970
SOURCE: U.S. Department of Health, Education, and Welfare, National Center for Educa-tion Statistics, Digest of Educational Statistics, 1974.
professional degrees, tripled ; and advanceddegrees, quadrupled. These monumentalgrowth rates reflect the rise in the numberof young people of high school and collegeage and also a substantial increase in theproportion completing each level of educa-tion. Trends in the proportion of young
42
people completing high school over the pastcentury are indicated in figure 2.
Data on earned degrees conferred by majorfield of study in the year ending in June 1972are shown in table 10. At the bachelor's levelmore degrees were conferred in education,social sciences, and business and management
35

Table 10.---Earned degrees conferred by institutions of higher education, by field of studyand by level: United States, 1971-72
Field of study
Earned degrees conferredBachelor's Firstdegrees professional Second level Doctor's
(requiring degrees (master's) degrees4 or5 (requiring at degrees (Ph.D., Ed.D.,years) least 6 years) etc.)
1 2 3 4 5
All fields 883,460 43,410 250,080 33,330
Agriculture and natural resources . 13,640 2,660 970Architecture and environmental design 6,440 1,900 50Area studies .,.._ .... , .,. ........ 2,980 1,050 160Biological sciences .. . . . .... .. 37,230 6 3,650Business and management .. . 121,830
29:109600
900
Communications 12340 2,200 110Computer and information sciences 3,370 1,850 170Education 190,850 97,730 7,040Engineering 50,310 16,650 3,660Fine and applied arts 33,810 7,540 570
Foreign languages 18,800 4,620 840Health professions 28,420 15,800 7,120 440Home economics 12,070 1,670 100Law , . . . . 500 21,760 620 40Letters' , . 73,200 12,710 2,590
Library science 990 7,380 60Mathematics 23,630 5,190 1,130Military sciences 200Physical sciences 20,390 6,160 4,66""Psychology 43,080 5,290 1,880
Public affairs and services 12,540 9,360 210Social sciences 157,640 17,420 4,080Theology ., 3,880 5,570 2,760 440Interdisciplinary and other fields 15,320 280 2,140 150
I Includes general English: English literature. Comparative literature. Classics; Linguistics; Speech, debate, and forensicscience; Creative writing, Teaching pf English as a foreign language; Philosophy; and Religious studies.SOURCE. U S Department of Health, Education, and Welfare, National Center for Education Statistics, preliminary data fromthe survey of Earned Duren, Conferred, 1971-72,
43
36

than in any other fields. The traditional fieldsof law, health professions, and theology werethe leaders at the first-professional level. Theleading fields for masters' degrees, in termsof number conferred, were education, busi-ness and management, and the social sci-ences. More than 3,600 doctors' degrees wereconferred in each of the following : Educa-tion, physical sciences, social sciences, en-gineering, and biological sciences. Degrees ineducation, at all levels totaled 7,040.
School Retention Rates andEducational Attainment
Table 11 shows the increase in school re-tention rates from the fifth grade throughcollege entrance over the past 40 years. Dur-ing this period the proportion of fifth graderswho went on to graduate from high schoolincreased from about 30 to 75 percent. rnother words, the rate of graduation is nowabout 21/2 times that which prevailed in theearly 1930's. The increase in college attend-ance is even more striking: Approximately43 percent of our young people now entercollege ; in 1932 the comparable figure was 12percent. Retention rates for the high schoolgraduating class of 1973 are shown in figure3.
Since 1940 the U.S. Bureau of the Censushas collected statistics on the educationalattainment of the population in this country.Table 12, derived from Census publications,compares the educational attainment of thepopulation 25 to 29 years of age with the
44
total population 25 years of age and over.The former group in March 1974 had com-pleted one-half year of school more than hadthe total adult population (nonwhites of thatgroup completed 14 years more than thetotal nonwhite group). More than four-fifthsof the 25 to 29 age group reported that theywere high school graduates, as comparedwith slightly over three-fifths of all adults.More than one-fifth of the young adults iden-tified themselves as college graduates, while13 percent of the total adult population hadcompleted 4 or more years of college.
Only 1 percent of the persons 14 years ofage and over was illiterate in 1969, as shownin table 13. In figure 4, this illiteracy ratemay be compared with that of 2.2 percent in1959, 4.3 percent in 1930, and 10.7 percentin 1900 (figure 4). Thus the 20th centuryhas seen a steady reduction in the percentageof persons in this country who are unable toread and write any language.
Income
Public elementary and secondary schoolsin the United States derive virtually all theirrevenue from governmental sources. Incomefrom other sources, such as gifts and fees,amounts to less than 0.5 percent of the totalrevenue receipts. Local governments contrib-ute more than any other source, but in recentyears the proportions from the Federal andState Governments have been increasing.Table 14 indicates that in the school year1972-73 approximately 51 percent of the rev-
37

Table 11.Estimated retention rates,' 5th grade through college entrance, in public andnonpublic schools: United States, 192442 to 19654S
School yearpupils entered
Retention per 1,000 pupils who entered 5th grade High schoolgraduation
First-time
collegestudents
5th grade 5thgrade
6thgrade
7thgrade
8th 9thgrade grade
10thgrade
11thgrade
12th Num-grade ber
Year ofgraduation
1 2 3 4 5 6 7 8 9 10 n 12
1924-25 ...... 1,000 911 798 741 612 470 384 344 302 1932 1131926-27 1,000 919 824 754 677 552 453 400 333 1934 1291928-29 1,000 939 847 805 736 624 498 432 378 1936 1371930-31 1,000 943 872 824 770 652 529 463 417 1938 1481932-33 1,000 935 889 831 786 664 570 510 455 1940 160
1934-35 1,000 953 892 842 803 711 610 512 467 1942 1291936-37 1,000 954 895 849 839 704 554 425 393 1944 1211938-39 1,000 955 908 853 796 655 532 444 419 1946 (a)1940-41 1,000 968 910 836 781 697 566 507 481 1948 (a)1942-43 1,000 954 909 847 807 713 604 539 505 1950 205
1944-45 1,000 952 929 858 848 748 650 549 522 1952 2341946-47 1,000 954 945 919 872 775 641 583 553 1954 2831948-49 1,000 984 956 929 863 795 706 619 581 1956 3011950-51 1,000 981 968 921 886 809 709 632 582 1958 3G81952-53 1,000 974 965 936 904 835 746 667 621 1960 328
1954-55 ._._ 1,000 980 979 948 915 855 759 684 642 1962 3431956-57 1,000 985 984 948 930 871 790 728 676 1964 362Fall 1958 1,000 983 979 961 946 908 842 761 732 1966 384Fall 1960 1,000 980 973 967 952 913 858 787 749 1968 452Fall 1962 1,000 987 977 967 959 928 860 790 750 1970 461Fall 1964 1,000 988 985 976 975 942 865 791 748 1972 433
Fall 1965 1,000 996 983 980 980 947 874 786 749 1973 433
1 Rates for the 5th wade through hir i school graduation are based on enrollments in successive grades in successive yearsIn public elementary and second...y schools and are adjusted to include estimates for nonpublic schools Rates for firsttimecollege enrollment in1/4 lude full time and part-time students enrolled in prcgrams creditable toward a bachelor's degree.2 Data not available.
NOTE Beginning with thl class in the 5th grade in 1958, data are based on fall enrollment and exclude ungraded pupils. Thenet effect of these change- is to increase high school graduation and college entrance rates slightly.
SOURCES U S. Department of Health, Education, and Welfare, National Centel for Education Statistics, Biennial Stacey ofEducation in the United Staten, Statistic. of State School Syaternx, Fall Statesties of Public Elementary and Secondary DaySchools; and unpublished data.
45
38

Figure 3.Estimated retention rates, fifth gradethrough college graduation: United States
1965 to 1977
FOR EVERY 10 PUPILS IN THE 5th GRADE IN FALL 1965
***** **Hit9.8 ENTERED THE 9th GRADE IN FALL 1969
8.7 ENTERED THE 11th GRADE IN FALL 1971
fit ffit tlfi7.5 GRADUATED FROM HIGH SCHOOL IN 1973tom
4.3 ENTERED COLLEGE IN FALL 1973
2.3 ARE LIKELY TO EARN BACHELOR'S DEGREES IN 1977
It 'IF
HISOURCE. U.S. Department of Health, Education Welfare,National Center for Education Statistics, Digest of EducationalStatistics, 1974.
46
enue receipts of public schools came fromlocal sources, 40 percent from State govern-ments, and 9 percent from the Federal Gov-ernment. The Federal contribution between1963-64 and 1972-73 rose from about $900million to $4.5 billion.
Although State and local governmentshave the primary responsibility for publiceducation in the United States (as notedabove), the Federal Government for manyyears has maintained an active interest inthe educational process. In recent years anincreasing amount of Federal support forall levels of education has been providedthrough a variety of programs administeredby a number of Government agencies. Fed-eral grants are expected to reach an all-timehigh of $14.3 billion in the fiscal year endingJune 30, 1975. Table 15 presents a summaryof Federal funds for education, training, andrelated activities for the fiscal years 1974and 1975.
Expenditures
Expenditures for public elementary andsecondary schools in the United States ex-ceeded $56 billion during the school year1973-74, as shown in table 16. This repre-sented an increase of one-sixth over the $48billion expended 2 years earlier. Per-pupilexpenditures have also risen rapidly in re-cent years. The current expenditure per pu-pil in average daily attendance in 1973-74exceeded $1,000; and the total expenditure,including current expenditure, capital out-
39

Table 12.-Level of school completed by persons 25 years old and over and 25 to 29years old, by color: United States, 1910 to 1914
Color, age, and date
Percent, by level of school completed
Less than 4 years 4 or more5 years of of high years ofelementary school or college
school more
1 2 3 4
WHITE AND NONWHITE25 years old and over:
191023.8 13.5 2.7
1920 ...... .... ........ .. . . ... 22.0 16.4 3.31930 . . 17.5 19.1 3.9April 1940 13.5 24.1 4.6April 1950 10.8 33.4 6.0April 1960 .. .... 8.3 41.1 7.7March 1970 . . .. ......... 5.3 55.2 11.0March 1972. 4.6 58.2 12.0March 1974
25 to 29 years old: 4.4 61.2 13.3
April 1940 . 5.9 37.8 5.8April 19504.6 51.7 7.7April 1960 .... ... 2.8 60.7 11.1March 1970 .... 1.1 75.4 16.4March 1972 .8 79.8 19.0March 1974
WHITE1.2 81.9 20.7
25 years old and over:April 1940 10.9 26.1 4.9April 1950 .... 8.7 35.5 6.4April 1960 ..March 1970 .
6.74.2
43.257.4
8.111.6March 1972 3.7 60.4 12.6March 1974
25 to 29 years old:3.5 63.3 14.0
1920'April i940
12.93.4
22.041.2
4.56.4April 1950 3.2 55.2 8.1April 1960
March 19702.2.9
63.777.8
11.817.3March 1972 .
March 1974 . .....NONWHITE
.81.1
81.583.4
19.922.0
25 years old and over:April 1940 . .. .,... ... 41.8 7.7 1.3April 1950 31.4 13.4 2.2April 1960 .. 23.5 21.7 3.5March 1970 14.7 36.1 6.1March 1972March 1974
25 to 29 years old:
12.812.2
39.144.3
6.98.0
1920' .. 44.6 6.3 1.2April 1940 26.7 12.1 1.6April 1950April 1960
15.47.2
23.438.6
2.85.4March 1970 .. 2.2 58.4 10.0March 1972
March 19741.21.8
66.671.3
11.611.0
Medianschoolyears
completed
5
8.18.28.48.69.3
10.512.212.212.3
10.412.112.312.612.712.8
8.79.7
10.812.212.312.4
8.510.712.212.312.612.712.8
5.76.98.2
10.110.511.1
5.47.18.7
10.812.212.412.5
I Estimates based on retrojection of 1940 census data on education by age.NOTE.-Prior to 1950, data exclude Alaska and Hawaii Data for 1972 and 1974 are for the noninstitutional population.SOURCES. U S Department of Commerce, Bureau of the Census, 1960 Census of Population, Vol I. Part 1,corref PopulationReportm Series P20; Series PI9, No. 4; and 1960 Census Monograph, Lifeiconori of the inierieen Population, by John K. Folgerand Charles B. Nam.
40
47

Figure 4.Percent of illiteracy in the population, by race:United States, 1870 to 1969
1870 1900
1 Data for 1969 are for blacks only.
1930 1959 1969
NOTE.Data for 1870 to 1930 are for the population 10 years old and over; data for1959 and 1969 are for the population 14 years old and over.
SOURCE: U.S. Department of Commerce, Bureau of the Census, Current PopulationReports, Series P-20, No. 217.
Table 13.Percent of illiteracy' in the population: United States, 1870 to 1969
Year Percent illiterate= Year Percent illiterate'1 2 1 2
1870 20.0 1930 4.31880 17.0 1940 . '2.91890 13.3 1947 2.71900 , . 10.7 1952 . 2.51910 7.7 1959 2.21920 6.0 1959 1.0Illiteracy is defined as the I n a b I I i ty to read or write a simple message either in English or in any other language.
' Percentages refer to the population 10 years old and over from 1870 to 1940 and to the population 14 years old and overfrom 1947 to 1969.3 Estimated.
SOURCE. U.S Department of Commerce, Bureau of the Census, Current Population Reports, Series P20, No. 217.
4841

Table 14.-Public elementary and secondary school revenue receipts from Federal, State,and local sources: United States, 1919-20 to 1972-73
School year Total Federal StateLocal (includingintermediate)'
1 2 3 4 5
AMOUNT IN THOUSANDS OF DOLLARS
1919-20 .. $970,120 $2,475 $160,085 $807,5611929-30 2,088,557 7,334 353,670 1,727,5531939-40 2,260,527 39,810 684,354 1,536,3631941-42 2,416,580 34,305 759,993 1,622,2811943-44 2,604,322 35,886 859,183 1,709,2531945-46 3,059,845 41,378 1,062,057 1,956,4091947-48 4,311,534 120,270 1,676,362 2,514,9021949-50 5,437,044 155,848 2,165,689 3,115,5071951-52 6,423,816 227,711 2,478,596 3,717,5071953-54 7,866,852 355,237 2,944,1r 4,567,5121955-56 9,686,677 441,442 3,828,886 5,416,3501957-58 12,181,513 486,484 4,800,368 6,894,6611959-60 14,746,618 651,639 5,768,047 8,326,9321961-62 17,527,707 760,975 6,789,190 9,977,5421963-64 20,544,182 896,956 8,078,014 11,569,2131965-66 25,356,858 1,996,954 9,920,219 13,439,6861967-68 31,903,064 2,806,469 12,275,536 16,821,0631969-70 40,266,923 3,219,557 16,062,776 20,984,5891971-72 50,003,645 4,467,969 19,133,256 26,402,4201972-73 52,117,930 4,525,000 20,843,520 26,749,412
PERCENTAGE DISTRIBUTION1919-20 100.0 0.3 16.5 83.21929-30 100.0 .4 16.9 82.71939-40 100.0 1.8 30.3 68.01941-42 . ........... 100.0 1.4 31.5 67.11943-44 ..... ....... . 100.0 1.4 33.0 65.61945-46 100.0 1.4 34.7 63.81947-48 100.0 2.8 38.9 58.31949-50 100.0 2.9 39.8 57.31951-52 100.0 3.5 38.6 57.81953-54 100.0 4.5 37.4 58.11955-56 100.0 4.6 39.5 55.91957-58 100.0 4.0 31.4 56.61959-60 , . .............. 100.0 4.4 39.1 56.51961-62 100.0 4.3 38.7 56.91963-64 . . . .... . . . . .... , .. 100.0 4.4 39.3 56.31965-66 . . . .. , .. _ ............. 100.0 7.9 39.1 53.01967-68 , ......... . . . ........ 100.0 8.8 38.5 52.71969-70 100.0 8.0 39.9 52.11971-72 ....... . ......... ... 100.0 8.9 38.3 52.81972-73 100.0 8.7 40.0 51.3
I Includes a relatively minor amount from other sources (gifts, tuition, and transportation fees from patrons), which accountedfor 0.4 percent of total revenue receipts in 1967.60.NOTE.-Beginning in 1959.60, includes Alaska and Hawaii. Because of rounding, detail may not add to totals.SOURCES- U S, Department of Health, Education, and Welfare, National Center for Education Statistics, Matmtics of StateSchool Systons; and Expenditure8 and Revenneo for Public Elementary and Secondary I:ducat:on, 1972.73.
42 49

Table 15.Federal funds for education and related activities: Fiscal years 1974 and 1975
Level and type of support
Percentagechange,1974
1974 1975 to 1975
1 2 3 4
Federal funds supporting education in educationalinstitutions
Total grants and loans . ...... $13,953,833,000 $14,656,322,000 5.0
Grants, total 13,572,679,000 14,262,241,000 5.1
Elementary-secondary education 4,599,477,000 4,896,057,000 6.5Higher education 6,584,689,000 6,530,844,000 .8Vocational-technical and continuing education 2,388,513,000 2,835,340,000 1.2
Loans, total (higher education) 381,154,000 394,081,000 1.0
Other Federal funds for education and relatedactivities
Total 5425,322,000 5,722,789,000 1.1
Applied research and development ... 1,559,640,000 1,651,000,000 1.1School lunch and milk programs 1,674,155,000 1,789,243,000 1.1Training of Federal personnel 1,153,653,000 1,217,886,000 1.1Library services 225,157,000 192,643,000 14.4International education 79,712,000 78,999,000 .9Other' 733,005,000 793,018,000 1.1
Includes agricultural extension services, educational television facilities, education in Federal correctional institutions, valueof surplus property transferred, and any additional Federal programs.
NOTE.These are preliminary data subject to change when final figures become available.
SOURCE: U.S. Department of Health, Education, and Welfare, National Center for Education Statistics, Digeat of EducationalStatistics, 1974.
5043
,,111111

Table 16.Total aid per-pupil expenditures of public elementary and secondary schools:United States, 1919-20 to 1973.74
Expenditures for public schools (in thousands of dollars) Expenditure per pupil inaverage daily attendance
Schoolyear Total
Currentexpenditures
forday schools
Currentexpenditures
for otherprograms'
CapitalOutlay Interest Total' Current'
1 2 3 4 5 6 7 8
191940 $1,036,151 $861,120 $3,277 $153,543 $18,212 $64 $541929-30 2,316,790 1,843,552 9,825 370,878 92,536 108 871939-40 2,344,049 1,941,799 13,367 257,974 130 909 106 881949-50 5,837,643 4,687,274 35,614 1,014,176 100,578 259 2091959-60 15,613,255 12,329,389 132,566 2,661,786 489,514 472 3751961-62 18,373,339 14,729,270 194,093 2,862,153 587,823 530 4191963-64 21,324,993 17,218,446 427,528 2,977,976 701,044 559 4601965-66 26,248,026 21,053,280 648,304 3,754,862 791,580 654 5371967-68 32,977,182 26,877,162 866,419 4,255,791 977,810 786 6581969-70 40,683,428 34,217,773 635,803 4,659,072 1,170,782 955 8161971-72 48,050,283 41,817,782 395,319 4,458,949 1,378,236 1,128 9901973 -74' 56,031,041 46,956,775 2,127,998 5,259,330 1,686,938 1,281 1,116
Includes expenditures for adult education, summer schools, community colleges, and community services (when separatelyreported).
Includes ent expenditures for day schools, and other programs, capital outlay and interest on school debt.3 Includes day school expenditures only excludes current expenditures for other programs.' Estimated.
NOTE.Beginning in 195960, includes Alaska and Hawaii. Because of rounding, detail may not add to totals.
SOURCES. U.S. Department of Health, Education, and Welfare, National Center for Education Statistics, Statistics of StateSchool Systems; and Statistics of Public Elementary and Secondary Day Schools, Fall 1973.
5144

Table 17.Gross national product related to total expenditures' for education:United States, 1929-30 to 1973.74
Calendar year
1
19291931193319351937
19391941194319451947
194919511953 .. ....19551957
195919611963 . , ...19651967
196919711973
Grossnationalproduct
(in millions)
Schoolyear
Expenditures for educationAs a percent
Total (in of grossthousands) national
product
2 3 4 5
$103,095 1929-30 $3,233,601 3.175,820 1931-32 2,966,464 3.955,601 1933-34 2,294,896 4.172,247 1935-36 2,649,914 3.790,446 1937-38 3,014,074 3.3
90,494 1939-40 3,199,593 3.5124,540 1941-42 3,203,548 2.6191,592 1943-44 3,522,007 1.8212,010 1945-46 4,167,597 2.0231,323 1947-48 6,574,379 2.8
256,484 1949-50 8,795,635 3.4328,404 1951-52 11,312,446 3.4364,593 1953-54 13,949,876 3.8397,960 1955-56 16,811,651 4.2441,134 1957-58 21,119,565 4.8
483,650 1959-60 24,722,464 5.1520,109 1961-62 29,366,305 5.6590,503 1963-64 36,010,210 6.1684,884 1965-66 45,397,713 6.6793,927 1967-68 57,213,374 7.2
930,284 1969-70 70,077,228 7.51,054,915 1971-72 84,748,779 8.01,294,919 1973-74 '100,000,000 7.7
Includes expenditures of public and nonpublic schools at all levels of education (elementary, secondary, and higher educaion).2 Estimated.
NOTE.--Beginning with 195960 school year, includes Alaska and Hawaii.
SOURCES. U S Department of Health, Education, and Welfare, National Center for Education Statistics, Statistics of StateSchool Systems, Firm( ial Statistics of Institutions of Higher Bilticution, and unpublished data, U.S. Department of Com.merce, Bureau of Economic Analysis, Survey of Current Business, August 1965, July 1971, and July 1974.
5245
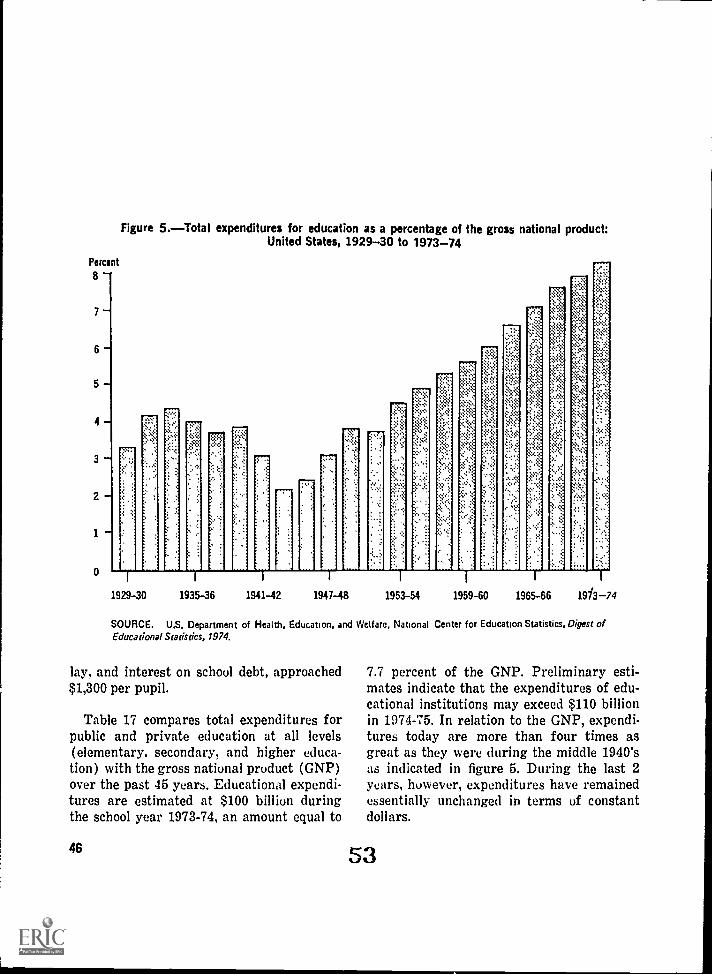
Figure 5.Total expenditures for education as a percentage of the gross national product:United States, 1929-30 to 1973-74
Percent
8
7-
6-
5- :s
4-
2-
1-
01 1 1
1929-30 1935-36 1941-42 1947-48 1953-54 1959-60 1965-66 1913-74
SOURCE. U.S. Department of Health, Education, and Welfare, National Center for Education Statistics, Digest ofEducational Statistics, 1974.
lay, and interest on school debt, approached$1,300 per pupil.
Table 17 compares total expenditures forpublic and private education at all levels(elementary, secondary, and higher educa-tion) with the gross national product (GNP)over the past 45 years. Educational expendi-tures are estimated at $100 billion duringthe school year 1973-74, an amount equal to
46
7.7 percent of the GNP. Preliminary esti-mates indicate that the expenditures of edu-cational institutions may exceed $110 billionin 1974-75. In relation to the GNP, expendi-tures today are more than four times asgreat as they were during the middle 1940'sas indicated in figure 5. During the last 2years, however, expenditures have remainedessentially unchanged in terms of constantdollars.
53

Expenditures for vocational education fromFederal, State, and local funds are shown intable 18. In 1973 the Federal Governmentcontributed 16 percent of the money, andthe remaining 84 percent came from Stateand local sources. A major goal of Americaneducation at the present time is to trainyoung people for useful careers after they
leave the educational system. The increasedemphasis on education for a career is re-flected in the tenfold rise in outlays for vo-cational education over the past decade. Inmany respects vocational education is thefastest growing segment of the Americaneducational system.
Table 18.-Expenditures of Federal, State, and local funds for vocational education:United States and outlying areas, 1920 to 1973
I In thousands of dollars]
Fiscal year
1
19201930194019421944
19461948195019521954
19561958196019621964
19661968197019721973
Total Federal State Local
2 3 4 5
$8,535 $2,477 $2,670 $338829,909 7,404 8,233 14,27255,081 20,004 11,737 2334059,023 20,758 14,045 24,22064,299 19,958 15,016 29,325
72,807 20,628 18,538 33,641103,339 26,200 25,834 51,305128,717 26,623 40,534 61,561146,466 25,863 47,818 72,784151,289 25,419 54,550 71,320
175,886 33,180 61,821 80,844209,748 38,733 72,305 98,710238,812 45,313 82,466 111,033283,948 51,438 104,264 128,246332,785 55,027 124,975 152,784
799,895 233,794 216,583 349,5181,192,863 262,384 400,362 530,1171,841,846 300,046 (I) '1,541,801Z660,759 466,029 (I ) '2,194,7303,033,659 482,259 (I) 2,551,400
1 State funds are included with local funds in column 5.
NOTE.--Because of rounding, detail may not add to totals.
SOURCES. U.S. Department of Health, Education, and Welfare, Office of Education, annual reports on Vocational and Technical Education; and unpublished data.
5447

IV. The Changing Role of Teachers and Teacher Education'
Teacher p Aides in the United States growout of a system of educe in unlike that ofmost Western countries. As explained inchapter 2, authority for education in theUnited States is decentralized. The 10thamendment of the U.S. Constitution statesthat any powers not expressly granted to theFederal Government are reserved to theStates and to the people. Because authorityover education is not expressly granted tothe Federal Government in the Constitution,it remains with the States. They have ple-nary power as long as provisions of the U.S.Constitution are not violated.
The States in turn, through their legisla-tive bodies, have created school districts tooperate the public elementary and secondaryschools. Over 90 percent of these districtsare governed by elected or appointed schoolboards, and are fiscally independent to raiseand collect their own tax funds. States havealso created State boards of education andState superintendents of education. At theState administrative level, education is aquasi-independent, nonpartisan structure.Some State offices exercise strong controlover the operation of schools, but most Stateoffices are regulatory and /or advisory.
As the authority for education is decen-tralized, so is the responsibility for teacherpolicies diffused. Broad policies concerninginitial and continuing education and experi-
' Adapted from the U.S. report to the Organiza-tion for Economic Co-operation and Development(OECD), Intergovernmental Conference, TeacherPolicies. Paris: November 1974.
55
ence qualifications for professional teachers(certification) are set by the State educationdepartment, with decisive input from pro-fessional personnel. Interstate cooperativecertification agreements ensure that mostStates have uniform minimum qualifications.On the other hand, many policies coveringsalaries, conditions of employment, and insome cases minimum education resources tobe made available are negotiated at the locallevel by State boards and State superintend-ents, usually under the broad outlines ofState professional negotiation laws, wherethey exist.
The Changing Society
Population Shifts
Teaching in the United States has beenmarkedly affected by social trends such asthe redistribution of population that has oc-curred in the past few decadesa vast move-ment largely of the poor from rural to urbanareas and of the middle class from urbanareas to the suburbs.
Inevitably these shifts in rural, urban, andsuburban populations have brought about aprofound social depersonalization2jobs out-side the neighborhood, leisure activities awayfrom the family, traditional family functionsperformed by nonfamily organizations, anda decline in identification with the commu-
'Noel P. Gist and Sylvia F. Fava. UrbanSociety. New York: Thomas Y. Crowell. 19G4.
49

nity. Broken homes are now no longer atypi-cal. In 1973, of all children under 18 yearsold, 14 percent lived in mother-headed homes.For example, among blacks, 35 percent of thechildren in this age group and 50 percent ofthose under 6 years were raised by mothersonly.' There are implications for educationin all of these facts, particularly for theinner-city schools, now largely populated bydisadvantaged ethnic minorities.
Many teachers joined in the populationshift. As they began to live in communitiesother than the one in which they taught,traditional links between teachers, pupils,and parents weakened. By 1973, 67 percentof all teachers no longer lived in the districtsin which they taught.' At the same time,particularly in large schools, they foundthemselves increasingly excluded from cur-riculum and program decisions. As the gapbetween administration and teacher widened,teachers experienced depersonalization intheir work." Teacher role redefinition be-came an important issue.
' The New York Times. "14,/c of U.S. ChildrenUnder 18 Are Being Raised by Mothers Alone,"Report by I'nited Statcs Government CensusBureau, Aug. 8, 1974.
'Research Report 1972-73. Status of the Amer-ican Public School Teacher, 1970-71. ProjectDirector, Elizabeth C. Moffat, Research Division,Washington, D.C., National Education Associa-tion, 1972.
`James Cass and Max Birnbaum. "What MakesTeachers Militant," Contemporary American Edu-cation. S. Dropkin, H. Full, and E. Schwarz, eds.New York: The Macmillan Co., J970, p. 436.
50 56
Desegregation
The 1960's saw a major thrust on the partof the Federal Government toward effectingdesegregation in the schools, with varied re-sults in different regions. Small city, ruralarea, and large city trends differed. As notedearlier, many of the poor, black, and otherethnic minority pupils increased in the citiesand the middle classblack and whitemoved to the suburbs. The result was thatmany of the schools became in effect segre-gated again.
To increase school desegregation, trans-portation of children from one area toanother was mandated by the courts. This iscalled "busing." It should be noted that trans-portation of pupils by bus has been accept-able for a long time in the consolidation ofschools in rural areas and small towns. Asthe logistical requirements of integrationand busing for desegregation grew morecomplex, many former supporters began tohave second thoughts about the basic strate-gies used to reach these goals. Busing fordesegregation, where it has occurred, hascaused the pupil population mix to becomemore heterogeneous, increasing the com-plexity of the teacher's task. In addition,many parents did not live in the area wheretheir children attended school, thus furtherweakening the relationship among teachers,pupils, and community. Other strategies,such as community control, reassignment ofadministrators, and redrawing boundariesof school districts have been attempted.
Efforts to maximize desegregation withincertain school systems, such as New York

and Denver, have employed two specificmechanisms : (1) Rezoning, which is realign-ing attendance districts to improve pupil mix(only possible if neighboring areas have con-centrations of majority and minority chil-dren) ; and (2) magnet schools, in whichcertain schools in majority (usually white)areas are given special resources of highquality to help retain the majority studentswhen minority children are bused in.
Decrease in the Number of Private Schools
In the midfifties, many parents sent theirchildren to private schools to avoid integra-tion and to secure what they believed to bequality education for their children. Thus,the number of private schools increasedmarkedly in the 1950's and 1960's. Since themid-1960's (see chapter 1), financial prob-lems have been the major cause for their de-cline. This is particularly true for church-affiliated private schools, since Federal fund-ing is severely limited under laws thatprovide for separation of church and state.High costs are bankrupting many parochialschools in the North.
Increase in the Supply of Teachers
The baby boom at the end of World War IIcontributed to the growth in the number ofchildren attending secondary schools in themidfifties. This created a teacher shortagethat enabled teachers to demand higher sala-ries and greater benefits, which, when coupled
57
with the availability of jobs, attracted manyto the field, including growing numbers ofmen. The 1960's produced a new and largercrop of teachers. Severe shortages of teach-ers during the sixties led to the provision ofmilitary- service exemptions for draft-agemen who trained for the profession. The Na-tional Defense Student Loan program pro-vided further inducement to teach: a 50 per-cent forgiveness on the loan was granted (ata rate of 10 percent each year for 5 years)for those who remained in teaching. Specialprovisions applied to those who teach in low-income areas or teach handicapped childrenin public or nonprofit elementary or second-ary school systems.
The shortage has since abated, especiallyon the elementary school level. In some re-gions, partly as a result of mobility of popu-lation, an actual surplus of teachers has de-veloped. At the same time, the inability topredict pupil-population shifts has forced anumber of relatively new schools to closetheir doors.°
Meanwhile, with the number of teachersincreasing, the supply-demand situation be-coming reversed, and the economic situationchanging, the power of tez.cher organizationshas grown. The American Federation ofTeachers (AFT), largely urban based, had414,000 members in 1974 ; and the older Na-tional Education Association (NEA) listed1.6 million members. The latter has tradi-
" David A. Andelman. "Population Shifts Up-setting the Planning and Use of Suburban SchoolsHere," The New York Times, Apr. 1, 1973.
51

tionally been regarded as more professionallyoriented,/ although this distinction is in-creasingly questioned as the two organiza-tions become more competitive and at thesame time appear to move toward ultimatemerger. The strength of teacher organiza-tions tends further to separate teachers fromadministrative staffs in the schools.
The Demand for Day-Care Centers
Still another social trend is the increase ofworking mothers who now need day-carecenters for their children. Recognizing thatearly childhood is crucial for learning, edu-cators are responding to the demand. TheTeachers' National Field Task Force sug-gests "Early Childhood Centers" rather thanday-care centers. "What is needed are pur-posefully designed educational programswhich provide activities and materials to de-velop understandings, aptitudes and skills.. . ."8 This will require new roles and re-sponsibilities for teachers, paraprofessionals,and the community at large.
Education in the Changing Society
National Goals
Americans assign great importance to ed-ucation. As stated in chapter 3, expenditures
7 James Cass and Max Birnbaum, op. cit., p. 436.Inside Out: The Final Report and Recom-
mendations of the Teachers National Field TaskForce on the Improvement and Reform of Amer-ican Education. Washington, D.C.: U.S. Govern-ment Printing Office, 1974. Pp. 35-46.
52 58
for education at all levels in 1973-74 totaledapproximately $100 billion, about 8 percentof the gross national product. (See table 17,p. 45). Education is the principal occupationof nearly 30 percent of the Nation's popula-tion. Overall funding for public elementaryand secondary education more than doubledin the 1960's. (See table 14, p. 42). Childrenare required to remain in school for 10 to 12years (depending upon State laws), normal-ly from ages 6, 7, or 8 through ages 16, 17,or 18.
The Constitution gives the Federal Gov-ernment, through its duty to protect therights and privileges of U.S. citizens, someauthority over education. The fifth para-graph of the 14th amendment enables theCongress to pass civil rights laws. The Fed-eral courts have acted to secure the rights ofindividuals by implementing provisions ofthe 1st and 14th amendments. The U.S. Su-preme Court mandated school desegregationin 1954 in Brown v. Board of Education, andprohibited arbitrary school-board actionagainst a teacher in Perry v. Sintiermann. Inaddition, the Congress has the power "to layand collect taxes . .. and provide for the . . .
general welfare of the United States." Con-gress can therefore tax and spend to supporteducation and, along with this power, can at-tach conditions to its grants consistent withthe constitutional provisions noted earlier.
Funding of New Programs
Quality universal education remains large-ly a local and State responsibilitysupported

by certain items of Federal or State legisla-tion and their associated funding. Localschool dist' icts wishing to obtain Federalfunds must incorporate State mandatory re-quirements into their programs. Thus, in themajority of federally funded programs, theState decides which local school program andactivities will be approved for funding whileFederal funds serve as a catalyst in imple-menting national education goals.
In recent years the Federal Governmenthas provided substantial assistance to edu-cation, such as the following:
Expansion and improvement of train-ing in science, mathematics, and modernforeign languages (1958).
Education that prepares young peopleand some adults for employment. Legis-lation, first initiated in 1919, has beenmuch strengthened since 1963. To im-prove the chances of the Nation's youthfor obtaining jobs, the Federal Govern-ment has supported manpower pro-grams, on-the-job training, vocationaland career education programs, pro-grams for functionally illiterate adults,and programs to assist adults in post-secondary education.
Improved education for poor children,many of whom are of minority ethnicgroups and living in urban areas (1965).
Increased emphasis on educational re-search, innovation, and improved libraryresources. The Federal Government sup-ports research and development ac-tivities, including studies of learning
59
theory; new instruction techniques ; up-dating, revising, and modernizing curric-ulums ;9 and programs for disseminationof research results through the NationalInstitute of Education and informationcenters such as the Educational Re-sources Information Center (ERIC) andinterstate collaboration programs foreducators."
Education for physically and mentallyhandicapped youngsters, as well as gift-ed and talented children. .-,...leral pro-grams provide extra resources and en-courage integration of these childreninto the regular classroom.
Equality of educational opportunity(desegregation, integration, and pro-gram improvement). This has meantFederal support of busing, preschoolprograms, and attempts to increaseparental involvement in the schools.
Demand for Results
The trend toward accountability. Nega-tive economic forecasts, the impact of the
"Educational Research and Development in theUnited States," Reviews of National Policies forEducation. Paris, Organization for Economic Co-operation and Development, 1971. Pp. 341-52.
'Miriam Clasby. "National Influences on Edu-cational Decisionmaking (Working Draft),"Changing Contexts for Educational Decisionmak-ing: The Evidence of Recent Federal and StateLegislation. Syracuse: Educational Policy Re-search Center, Syracuse University ResearchCorporation, 1973. Pp. 15-18.
53

energy crisis, inflation, and unemploymenthave caused tax bases in many States andmunicipalities to shrink considerably. Thesedeclining tax bases and the need to reducecosts are causing elected officials to scrutinizeclosely the allocations requested for educa-tion. .
Taxpayers, legislators, and State and Fed-eral education agencies wanting to optimizethe tax dollar are demanding to be shownwhat improvements have come from educa-tion innovations and improved salary, pre-requisites, working conditions, and prestigefor teachers. Teachers have been somewhatunique among public employees in being ableto perform duties with relatively little ex-posure to peers, supervisors, or the public,but this generally modest level of unaccount-ability is fast eroding, with a current trendtoward peer review.
At the State level, accountability is be-coming a strong trend. During the 1960'smany parents and parent groups expressedgrowing dissatisfaction with the perform-ance of the schools. Accountability inevi-tably became a public demand. By fall 1972,23 States had some type of accountabilitylegislation ; 10 States had legislation pro-posed in 1973 ; and 8 States required em-ployee evaluation."
" Maureen Webster. "Statewide Testing Legis-lation and Educational Policy," Changing Con-texts for Education Decisionmaking. The Evi-dence of Recent Federal and State Legislation.Syracuse: Educational Policy Research Center,Syracuse University Research Corporation. 1973.
Teaching innovations (such as team teach-ing or differentiated staffing) may also tendto facilitate peer review. Teachers may nowhave to interact more frequently with otherteachers, specia:ists, paraprofessionals, par-ents, and supervisors." This will add strainto already complex activities, and will de-mand greater knowledge and expertise thanin the past. Some teachers may welcome thecontact with coworkers required by theseinnovations ; others may find it difficult toface the scrutiny involved.
The search for criteria.However, thereis relatively little agreement yet on the cri-teria for teacher performance. Some havesuggested that teachers be judged by theperformance of their pupils as measured bytests of cognitive skills. Teachers have ob-jected to this," arguing that pupil achieve-ment is more deeply determined by family,home, peer, and community factors than byteacher performance."
As noted in chapter 1, the use of stand-ardized tests to measure teacher perform-
54 60
" Anna L. Hyer and Robert M. McClure. Chang-ing Teacher Roles and Their Implications: ASummary Paper. 1974. Pp. 5-6.
"Alexander M. Mood. "How Teachers Make ADifference," How Teachers Make A Difference.Washington, D.C.: U.S. Government PrintingOffice, 1971.
"James G. Anderson. Bureaucracy in Educa-tion. Baltimore: Johns Hopkins Press, 1968; andM. Gittell and T. E. Hollander. Six Urban SchoolDistricts. New York: Praeger, 1967; and DavidRogers. 110 Livingston Street: Politics and Bu-reaucracy in the New York Schools. New York:Random House, 1968.

ancethrough the medium of pupil achieve-mentis also fraught with snares. Educa-tors and researchers can point out that asmany as 70 percent of the items on a stand-ardized reading test are culture-biased and,or represent measures of general intelligencerather than taught reading skills. As classesbecome more heterogeneous, the difficulty indesigning tests that reflect pupil achievementin terms of teacher effectiveness becomesgreater. Assessment of test validity and in-terpretation of results has become a compli-cated and sophisticated component of edu-cation research. There must be a fuller un-derstanding of what types of pupil measuresare related to teacher performance and thuscan be used to judge teacher effectiveness.
Assessment of teacher performancewhatever the basis of an accountability sys-temwill remain complex. A number of dis-parate elements within teaching receivedifferent priorities from different groupsof educational researchers. Subject-matterknowledge, teaching-learning skills, curric-ulum-development skills, ability to workwith minority-group parents and communitygroups, capacity for peer-group leadership,expertise in education management, and ex-perience in school-community politicsallare positive and needed elements within thespectrum of teacher skills and performances.No single teacher can hope to have masteredall of those capabilities ; yet, since teachersperform in many roles, there are clearly dif-ficult questions involving the selection of cri-teria by which teachers will be judged andhow the various elements in the mix will beweighted. 61
Teacher organizations stress that teacherscannot be held responsible for results as longas they do not have authority for decision-making with respect to curriculum, teachingpolicies, or other matters affecting pupil per-formance. In general, teachers are willing toparticipate in accountability programs thatthey have helped to develop. Such involve-ment has taken place in New York, Balti-more, Detroit, and several other cities.
Diversification and Integration ofTeaching Personnel
Trends.Developments over the past dec-ades have both diversified and integrated theteacher's roles and functions. On the onehand, technological advances (e.g., in thecomputer field), have given the teacher anew role as manager of learning resourcesand facilitator of learning, thus broadeningand diversifying what had previously been afinite range of tasks. On the other hand, theteacher has become one member within ateam providing services to the pupil ; notonly does the teacher join with other teach-ers in certain instructional approaches, butalso interacts with counselors, psychologists,other specialized professionals, and com-munity representatives on behalf of thepupil. Some trends currently receiving atten-tion include
Individualized instructionpupil diag-nostic-prescription systems, and possibleprogrammed instruction, involving bothpaper-and-pencil methodologies and edu-cational technology. Emphasis is on en-
55

56
abling pupils to do their own work attheir own pace and become, in part, theassessors of their own progress. Muchtechnological innovation in individual-ized instruction has originated in theprivate sector. The kinds of individual-ized instruction now in use vary fromthose keyed to specific series of work tothose that are open-ended. Open-endedpupil diagnostic-prescription systems arethe most flexible means of gearing learn-ing to the individual pupil's pace. To asignificant extent the public sector hasdeveloped individualized instruction inthe field of special education. Recently ithas become apparent that some of thephilosophy, practices, and products fromspecial education are beginning to beintegrated into regular education. Regu-lar classroom teachers have been stimu-lated toward new ways of thinking andproblem-solving and are better servingpupils with learning and behavior prob-lems in the regular classroom.
Open educationopen classrooms, smallgroups on separate projects, schoolswithout walls programs generallyaimed at middle class pupils. Disadvan-taged children frequently require morestructure. Open education implies a give-and -take relationship between teacherand pupil rather than an authoritarianone.
Team teachingalso called horizontaldifferentiated staffing, a collaborationamong teachers of equal status in thesame or different subjects, in one or
62
more classrooms, and receiving equalpay. This means increasingly coopera-tive work.
Vertical differentiated staffinga variedmix of people from paraprofessionalsto master teachers hierarchically ar-ranged to carry out instruction, fre-quently associated with flexible classscheduling, including modular timeunits, use of large classes for certainelements of instruction (such as audio-visual presentations), small classes forlectures and questions, and individualcounseling.
Use of paraprofessionals.Employment ofparaprofessionals has become an issue of cen-tral importance in implementing vertical dif-ferentiated staffing. Most cities, includingNew York City with its decentralized schoolsystem (32 community school districts), em-ploy paraprofessionals to some degree. Inrecent years, educators and community lead-ers have stressed the value of paraprofes-sionals both as a bridge across the gulf cre-ated by cultural differences between teachersand pupils, and as a means of providing serv-ices toward achieving education objectivesgenerally. Studies indicate that where theparaprofessional is part of the instructionalteam, differentiated roles are defined, thusproviding more time for the teacher to dealwith instructional activities. Better adult-pupil ratios for individualized services alsoresult.
To date, paraprofessionals have been usedas aides in classrooms, shops and laborato-

ries, study halls, lunchrooms, and buses, andas drug program aides. They are employedas well in materials centers, in registrationand attendance work, and as parent and fam-ily assistants. The paraprofessional's respon-sibilities are not those of a part-time teacher.Many school systems hire music, art, andother specialist teachers on a part-time basis.
Political concern to cycle back part of theeducation support-services dollar to benefitthe community's parent-resident populationhas played a role in the growth of the para-professional movement. Teachers have notopposed the opportunity to relinquish custo-dial tasks. However, teacher organizationsinsist that paraprofessionals must not en-croach upon professional pedagogic status,nor negate any need for greater numbers ofteachers. This stance may have thus far pre-vented teachers from employing paraprofes-sionals more fully and imaginatively in to-day's multiactivity classrooms. Not all teach-ers have fully perceived their new role asclassroom managers with creative options intheir deployment of personnel and resources.
Many State and federally funded programsto finance the hiring of paraprofessionals inthe schools have stipulated that career ladderaccess to the profession be provided to thesecommunity aides. Their school jobs have beencombined with college instruction that canlead to eventual qualification as a teacher, arequirement seen as one means of openingthe teaching profession to minority groupcandidates. Currently the percentage of mi-nority group members in the teaching pro-fession is not as large as their percentage inthe national population.
63
Technological Advances
Technological advances have had a sub-stantial impact on teacher roles. Among thenew technologies available to educators, com-puters have figured significantly. They servetwo major areas, each requiring differentlevels of involvement from the teacher andaffecting teacher roles to a different extent.First, computers are used in administrationfor such tasks as scheduling, creating ros-ters, storing test and achievement records,generating book orders, and maintaining per-sonnel, inventory, and budget records. Othereducation data storage, retrieval, and analy-sis functions can also be programed. Theeffects on teacher roles are positive and wel-comed: time is freed from administrativework and can be devoted to teacher-pupilinteraction.
Second, computers are the key componentin computer-managed instruction (CMI) andin computer-assisted instruction (CAI). Theformer can generally be described as an ad-junct process to teaching based upon printedmaterials. The computer is programed forthe materials used, and makes diagnoses ofspecific weaknesses and strengths that eachpupil exhibits through check-off, fill-in, orcomplete the sentence types of testing. Fur-ther, the computer generates a prescriptiona specific remedial task using designated ma-terialsfor each pupil showing lack of mas-tery in a course component or subject skill.Prescriptions are generated for pupils show-ing superior skills. CMI calls for special train-ing of teachers ; though the diagnostic-pre-
57

scriptive system is straightforward, basicfamiliarity and operational requirementsmust be taught. The actual teaching remainsa direct teacher-to-pupil process.
The latter, computer-assisted instruction(CAI), uses computer capabilities in twoways: first, the computerthrough a cathoderay terminal ("TV screen")presents someor all of the material being taught ; secondly,pupils may be required to demonstrate un-derstanding of the material taught by re-sponding to questions displayed on thescreen. Desktop keyboard consoles or elec-tronic light pencils used directly on the screenare employed. CAI changes the teacher's role.Part of the broad-based, highly repetitivefoundation work can be taught by the com-puter, leaving the teacher free to act as atrouble-shooter for pupils with specific indi-vidual difficulties or as a facilitator for high-ly talented pupils.
CMI, CAT, and related equipment such astalking typewriters (used in teaching read-ing and writing) present multifaceted chal-lenges to the school systems that consideradapting them. Suitability for differentcurriculum areas, installation and mainte-nance costs vs. costs of professional per-sonnel, numbers of pupils served, level ofsophistication of programing, potential forprograming additional functions (scores,score analysis, etc.) are among the issuesto be analyzed. In all cases, the transfer ofas many tasks as possible to the computerso as to free the experienced teacherfor one-to-one work with pupils remainsthe basic premise. Use of the computer
58 64
thus adds to the teacher's role as a man-ager of resources and further emphasizesthe teacher's responsibility for selecting in-structional approaches and alternate strate-gies.
Other technologies affect teacher roles andresponses. Increased use of audiovisual,videotape, and tape-recording equipment hasenabled teachers to (1) use or create a widerange of materials in support of the corecurriculum in any subject, and (2) analyzeteaching behaviors and teaching styles. Thiscan be done through microteaching and inter-action analysis, or through development ofprotocol materials. In addition, the pupil in-put into instructional materials can becomegreater and more enriching.
The use of electronic aidsfrom computersto hand-held calculatorsis increasing in theNation's high schools. It is argued that use ofcomputers in major scientific projects has atwofold benefit: more exacting work can becompleted, and the pupil learns programingand modern problem solving methodologies.Less enthusiam is evidenced for pocket cal-culators, because some educators fear thatthe American pupil will no longer masterthe basics of unaided computing.
Resistance to Innovation
Many children exhibit affective as well ascognitive deficiencies. Yet conceptual andtechnological innovation to correct these

problems is limited and often strongly re-sisted by school personnel in public schools.Taxpayers as well as teachers can be cata-lysts for educational change.'
Among the significant facts that haveemerged from observing innovations at workis that despite the designers' best efforts, fewinnovations are teacher-proof. In theory, ateacher is expected to adapt himself and hismethods to the basic requirements of the in-novation (in equipment, materials, or meth-ods) that he adopts. Only then can maximumbenefits be realized. However, in practice,the teacher tends to adapt or distort the inno-vation until it best fits his existing methods."Thus the innovation may deliver less thanpromised. When this result is included in keydata in evaluation reports, the valid conceptunderlying the innovation is damaged. Thus,as innovations are transferred in more sig-nificant number to the classroom, the teach-er's role as a manager with judgmental ca-pacities becomes more critical.
In all fairness, part of the resistance stemsfrom inadequate research on effective innova-tion. Teacher organizations point out that inthe past teachers have been required to par-ticipate in successive innovation programs,implemented without sufficient research,funding, or inservice training, and without
'' Ibid."Martin A. Siegel and Barak Rosenshine.
"Teaching Behavior and Student Achievement inthe Bereiter-Engelmann Follow-Through Pro-gram." Paper presented at the Annual Meetingof the American Educational Research Associa-tion, New Orleans, 1973.
65
their advice and consent. Some proposalsare perceived as threats to teacher economicsecurity. Consultation, negotiation, and in-volvement of the affected employees can in-crease chances for successfully adapting andimplementing innovations. It is generallyagreed that teacher education should includepreservice and inservice training that wouldenable teachers to interpret and selectivelyapply those research findings that alreadyexist as well as to understand and participatein designing and implementing researchstudies.
Implications of the Changing Role forPreservice and Inservice Training
Teacher training must be viewed as aneducation personnel development system. Insuch a system, preservice and inservice edu-cation would be totally integrated, fosteringthe concept of life-long learning and the needfor recurrent education. Thus older teacherswould not constitute an obstructive forcethwarting the creativity of more recently andbroadly trained teachers. Acceptance of thisconcept has major implications not only forrecipients of teacher education, but for teach-er educators themselves. Because all are in-volved in change, all need continuing edu-cation.
Recruitment for the Teaching Profession
The selection of potential teachers is anessential factor in determining quality and
59

effectiveness in any teacher education pro-gram, as well as the ultimate effectiveness ofthe teacher in the classroom.
There are no national or State plans forlimiting the number of teachers to betrained. Most State university systems aremaintained on the principle of open admis-sions, at least for State residents ; some unitsof the system may be more selective thanothers. Private universities and colleges de-termine their own goals. As budget con-straints increase, more institutions may limitthe size of their teacher education programs.In conflict with curtailment is the ideologicalcommitment of many educators to a "demo-cratic" and open recruitment procedure. Stu-dents who are high school graduates canfind places in one institution or another, as-suming they can bear the costs of collegetuition and living. In the first year of highereducation about one-third will drop out ofthe usual college program. In each succeed-ing year, attrition is reduced.
There is a general need throughout thecountry to recruit more minority and bi-lingual teachers, as well as to train teachersalready in the profession in the requiredskills. Screening devices using traditionalprior education standards tend to eliminatemany of the candidates among those mostsought at this time. Use of other standardsas screening devices would raise objectionsin many quarters. In New York City, 80percent of the Puerto Rican pupils do notcomplete high school, and thus are not eligi-ble for inclusion in conventional teachereducation programs. Mexican-Americans and
60
American Indians in the Southwest are ina similar situation. Pressure from minoritycommunities is leading to decisions requiringrecruitment of more minority teachers.
Philanthropic foundations and the FederalGovernment have over the years encouragedmore flexibility and experimentation throughspecial funding of institutions willing tomove in new directions. The major emphasison recruitment in most foundation-supportedand federally supported programs has beento expand minority populations in the pro-fession.
In a major U.S. Supreme Court decisionin 1974 (Lau v. Nichols), it was determinedthat Chinese or any non-English speakingpupils must be provided with the specialfacilities, materials, and teachers necessaryto give them an education. Based on thisdecision, Aspira of New York and Aspira ofAmerica, Inc., won a similar decision inAugust 1974 against the New York CityBoard of Education for Spanish-speakingpupils in New York City. The new trendtoward considering what special facilities,materials, and teachers are most productivefor differing groups of pupils may influencerecruitment as well as add to the ability toassign teachers to settings in which theycan achieve the best results with their pupils.
New Concepts in Teacher Training
Competency-based teacher education.The major change in evaluation of teachercandidates in teacher-education programs
66

has been the movement toward competency-based programs. These programs, based onresearch and demonstration programs fund-ed by the U.S. Office of Education (USOE)in the late 1960's, are now being initiated byState agencies and professional societies andwere developed to help ensure that standardsfor judging teacher performance went be-yond the quantity and quality of a candi-date's academic achievements in a 4-yearcollege program. Previously, a prospectiveteacher would be judged by his grades incourses and examinations, with little evalua-tion of his performance as a student teacherin a classroom setting.
A series of court decisions was also instru-mental in fostering this change in approach.In the 1970 Griggs v. Power case, the 'U.S.Court of Appeals declared that any test thatcould not be specifically demonstrated to testthe ability of the candidates to perform agiven job could not be sustained as the basisof selection for employment. Subsequently,the National Teachers Examination waschallenged in a case in which the courtstated, "It is not known whether there is arelationship between academic preparationas measured by the National Teachers Ex-amination and effective teaching." " Com-petency-based evaluation of teacher candi-dates is an effort to demonstrate that theskills judged are those necessary in the per-formance of the job. Observation and evalua-
" Baker et al. The Columbus Municipal SeparateSchool District et al., Vol. 62s F. 2nd. 11, 12(1972) at 7.4.
67,
tion of the candidate in a field-based settingare essential to the procedure. This processbecame a key part of the preservice program.
The movement toward competency-basedteacher education (CBTE) also had its rootsin the social upheavals of the 1960's. Out ofthis era came the feeling that the publicschools were not doing the job they wereexpected to do. It was also felt particularlythat the education needs of minority grouppupils were not being met. The assumptionthat the schools were not performing prop-erly led to questions about teacher educationprograms. The increasing use of the "sys-tems approach" to problem solving (meas-uring system inputs and outputs and the re-lationship of the two) laid the foundationfor CBTE emphasis.
Competency-based programs have at leastthree basic reference criteria : knowledge,performance, and consequences." In this defi-nition, performance refers to "behavior thestudent-teacher is expected to demonstrate"and consequences refers to "outcomes thatthe student-teacher is expected to bringabout in the emotional and intellectualgrowth of the pupils." "
A CBTE program generally has the fol-lowing characteristics:
Individualized instructionthe studentteachers are involved in making instruc-
1" Phyllis Hamilton. Competency-Based TeacherEducation, U.S. Office of Education, July 1973.P. 4.
" Ibid.
61

tion choices that they consider relevantto their own interests.Instruction modulesa module is a unitof learning consisting of a set of activi-ties intended to help a student-teacherachieve specified objectives.
Time as a variablecompletion of mod-ules and rate of progress through theprogram are determined by the studentteacher's competence, rather than by thetraditional requirement of course com-pletion in a fixed time-span.Field-centered instructionbecause ofthe emphasis on performance in realsettings with pupils, there is more andearlier practice teaching.Emphasis on exit rather than entrancewhile program admission requirementsare less rigid, demonstration of compe-tence is required for certification.
As is pointed out by almost all writers whocomment on CBTE, this approach does notcurrently have a strong research base. Thisis the major objection held by many to im-plementation of CBTE programs. As evenits defenders almost universally concede, re-search techniques that could validly measureon-the-job perforinance simply do not exist;in other words, "we are unable to identifyspecific teaching behaviors which are in factdirectly correlated to improved pupil abil-ity." 20 This observation raises serious ques-
:.`" Michael A. Rebell. Teacher Credentialing Re-form in New York State. Study Commission onUndergraduate Education and Education ofTeachers. March 1974. P. 30.
62 68
tions about CBTE when it is viewed as a sys-tems approach. In teacher education, therelationship between inputs and outputs isnot clear and, in addition, is difficult tomeasure.
When a State or individual college com-mits itself to CBTE, it is also committingitself to re-evaluation of the relationshipbetween the teacher education program andthe traditional liberal arts curriculum. CBTEproponents argue that the limited integra-tion between the traditional liberal arts cur-riculum and teacher education curriculumshas been one of the major failings of existingteacher education programs.
Another criticism of CBTE is raised bythe "humanists" (as contrasted with the "be-haviorists"), who feel that the developmentof required competencies will result in in-flexible standards that will serve to perpetu-ate the status quo. The humanists stress theneed for "encounter" teachers. No sets ofcriteria can be specified, they claim, for theirqualifications.
Currently, the strongest organized opposi-tion to the implementation of CBTE comesfrom the teacher unions. The American Fed-eration of Teachers (AFT) is waiting forcompletion of further research on CBTEbefore taking a final position. It suggeststhat the existing certification standardsshould remain in force until CBTE can bevalidated. The National Education Associa-tion (NEA) takes a similar position onCBTE: it demands that State education de-partments postpone implementation until

valid and reliable research is forthcomingand indicates that these programs are animprovement over existing ones. Further re-search may show that many of the skillsidentified and selected for competency-basedprograms are useful embellishments, but notessential elements in teaching and learning.Proponents of CBTE must be ready to facethis fact and to revise competency-based pro-grams as new evidenen is made available.
The potential for CBTE seems to hinge onthe outcome of ongoing research as well asadjustments in its approach to satisfy itscritics. Currently, approximately 32 Statesare moving toward a CBTE emphasis. Whileno State or individual college has developeda complete CBTE program, current ap-proaches fit in with the Federal focus asevidenced in some of the federally fundedteacher education programs with a CBTEcomponent.
Federal initiatives.The Federal Govern-ment has been an active catalyst for changein teacher education. Its major initiatives inteacher education during the past few yearshave been in the following seven programs:Teacher Corps, Career Opportunities, Trai,.-ing of Teacher Trainers, Urban, Rural SchoolDevelopment, Early Childhood Education,Exceptional Children in the Regular Class-room, and Educational Leadership.
1. Teacher Corps: The goal of the originalTeacher Corps law enacted in 1965 was"to strengthen the educational oppor-tunities available to children in areashaving concentrations of low-income
69
families, and to encourage colleges anduniversities to broaden their programsof teacher preparation."
These objectives are met by develop-ing innovative teacher education pro-grams encompassing the following basicstrategies : Mutual collaborative deci-sionmaking between higher educationinstitutions, the State education author-ity, the local education authority, andthe community ; community-based edu-cation ; field-based instruction ; school-staff focus ; diagnostic and prescriptiveteaching ; multicultural consideration ;training-needs analysis; teaching teams ;and management and evaluation plans.
Teacher Corps supports 2-year teach-er-education programs, employing 2,500interns and using up to 1,800 volunteersand experienced teachers. Each year ap-proximately 40 new projects are initi-ated.
At present, in crder to qualify forparticipation as an intern in a TeacherCorps program, one must have com-pleted at least 2 years toward a Bachelorof Arts degree. Competition for placesif keen, with 100 applications for every17 places. After having been admittedinto the program, one is assigned to ateam composed of interns and more ex-perienced teachers or team leaders. Theactual content of a Teacher Corps pro-gram includes work in an assignmentschool, enrollment in several academiccourses and seminars. and participationin community-based education activities.
63

While working in schools located in im-poverished areas, interns also fulfill re-quirements enabling them to completeeducation degrees and gain State certi-fication.
In the past, Teacher Corps has beensuccessful in training minority-groupmembers for professions in education.Over half of the present Corps membersare black or of Spanish-speaking origin,and 6 percent are American Indian. Inaddition to increased recruitment ofminority groups, it has been reportedthat 70 percent of Teacher Corps gradu-ates trained to work with pupils fromimpoverished areas continue to teach inlow-income school districts.2' This per-sistence of interest is a factor of specialimportance.
Legislation for a broader TeacherCorps program N; as approved in 1974.While in the past or.ly persons who hadnot completed teaching certificationwere admitted to the program as interns,the new legislation emphasizes supportfor demonstration of new strategies forretraining experienced teachers andaides. The demonstration project mustadopt one of the following 1-,roadly de-fined strategies : The training complex,competency -based teacher education,
2' Assessment of the Teacher Corps Pro7ram.U.S. Office of Education. B-164031 (1) 1972.
'20. Smith. Teachers For the Real World.American Association of Colleges of TeacherEducation, 1968.
64 70
training for implementing alternative-school designs, interdisciplinary-trainingapproaches, and training for the syste-matic adaptation of research findings.
2. Career Opportunities: Established un-der the Education Professions Develop-ment Act, the Career Opportunities Pro-gram (COP) is primarily concernedwith training school personnel. COP em-ploys members of low-income communi-ties and Vietnam veterans, "personneldifferent from those at present employedas teachers," as education auxiliaries inpoverty-area schools.23 These educationauxiliaries work as paraprofessionals inschools in low-income areas while train-ing for teacher certification. COP train-ees tend to graduate and be offered em-ployment at a rate exceeding that ofmost new student teachers.
The aims of the program are (1) toalter the organization, structure, andstaffing patterns of the local educationalsystems, (2) to affect the populationserved by higher education institutions,and (3) to improve the education ofchildren from poverty areas. Because ofthe current state of the economy and theteacher surplus, this Federal program isbeing phased out after completion of thefederally funded demonstration cycle.
3. Training of Teacher Trainers: Termi-nated in 1974, the Training of Teacher
Career Opportunities Diagnosis: Progress ofa MidRange Demonstration. COP Bulletin No. 3.Queens College, 1974. P. 1.

Trainers (TTT) program was based atmore than 40 university/city/communitylocations. It operated on the premisethat intervention at a high level in theteacher education process could helpproduce change in teacher education in-stitutions. This intervention was basedon identification, recruitment, selection,and training of future teacher trainers;a role for teachers themselves in plan-ning project activities; the need forthose involved to arrive at new under-standings of their role as trainers; andparticipation of public schools, commu-nities, and all sectors of the higher edu-cation institution concerned in the proc-ess. This participation was of pivotalimportance; without it, TTT would havebecome and remained a university-centered effort.
4. Urban/Rural School Development: Themost recent development of the USOEeducation personnel development pro-grams, the Urban/Rural School Devel-opment Program (URSDP) is based onthe belief that the most effective changein education will take place in the singleschool. It is a 5-year program at 26 sites,and focuses on the relationship betweenteachers, parents, and pupils. URSDPpredicates its activities on the assump-tion that change is more likely to occurwhen those directly affected determinewhat changes are needed and activelyparticipate in decisionmaking processesdesigned to bring about those changes.Thus it involves the community at all
71
stages in the school's decisionmakingprocess.
Experience and knowledge from othersources are utilized. In an interestingdeparture from normal practices, therelevant services of higher educationinstitutions are purchased by the localschools.
5. Early Childhood Education: In the mid-1960's, it became evident that a markedshortage of persons highly qualified toteach children at the preschool and earlyschool (kindergarten through thirdgrade) levels had developed. There weretoo few teachers, and many of thoseavailable needed to upgrade and reorienttheir skills, especially in areas wherepoverty and low incomes prevailed. Inresponse to this need, the USOE em-barked upon a many-sided approach in-volving schools, universities, communi-ties, parents, and distinguished child de-velopment experts. Typical programswere based at State departments of edu-cation, school systems, and colleges anduniversities. Operating on the premisethat the problem transcended the class-room, the program managers involvedteacher trainers, supervisors, curriculumand evaluation specialists, and otherteacher aides.
The following are three examples ofthe kinds of programs funded: (a) Aproject in the Southwest trained partici-pants in diagnostic and prescriptivetechniques and emphasized the socio-
65

66
political-economic system of Chicanochildren in the barrios ; (b) a Southernproject approached the problem on aregional basis, identified leadership per-sonnel, and drew on the combined re-sources of three State departments ofeducation; (c) a Western projecttrained first-grade teachers to recognizelearning disabilities and to individualizeprograms for functionally limited chil-dren.
6. Exceptional Children in the RegularClassroom: This teacher education pro-gram is designed to help meet the needsof handicapped children. It is based onthe premise (upheld in court decisionsand State laws in many parts of theUnited States) that such children shouldbe kept in regular classrooms as muchas possible. This premise, termed "main-streaming," poses a real challenge toschool systems and teacher educationinstitutions to sensitize regular class-room teachers to the needs of childrenso handicapped.
The idea of mainstreaming (also dis-cussed in chapter 1) has gained increas-ing acceptance educationally and legally,in no small part because of the contribu-tions of this program.
7. Educational Leadership: Since the late1960's, the USOE has supported somelimited small-scale ventures in trainingleaders for education. Two main pro-grams are involvedthe National Pro-gram for Educational Leadership
72
(NPEL) and the City/University(C/U) program. The NPEL is a low-cost effort to identify and recruit alreadysuccessful men and women from minor-ity and other traditionally under-repre-sented groupsall without experiencein school systemsand to train andplace them in responsible leadership andmanagement positions in education. TheC/U program is based on the belief thatschool systems and universities eachhave assets that can be shared and needsthe other can satisfy. At six universitiesand school systems, enduring coopera-tive relationships were initiated. The re-sult has been the development of train-ing capacities, relationships, and changestrategies not common a decade earlier.
Private sector initiatives and contribu-tions.Private sector institutionsphilan-thropic foundations and industries servicingeducationhave stimUlated or facilitatedmany of the initiatives designed to improveteaching and the schools in recent years.Foundations experience few restraints intheir choices of objectives.
Several of the major foundations haveadopted consistent emphases in their fund-ing practices. The Ford Foundation has spentmillions of dollars during the last decade oninnovation in education personnel develop-ment and service programing. The Founda-tion designated 20 major cities in the UnitedStates as "grey cities" (with depressed,inner-city areas) and funded remedial edu-cation programs. These laid the basis formany early initiatives funded subsequently

under title 1 of the Elementary and Secon-dary Education Act, 1965. Other key aimswere: (1) community involvement in edu-cation; (2) training of superintendents andprincipals in administration and manage-ment techniques; (3) leadership training forlocal, State, and national education leader"hip personnel ; and (4) development of anInstitute for Educational Leadership, bring-ing together Federal education leaders, con-gressional staff members, State departmentof education staffs, and other groups andprofessions having policy rather thanschool or student involvements with educa-tion, for a variety of single-session or short-term interservice education activities.
The Carnegie Foundation, while fundingmany small innovative programs, has em-phasized major research studies of criticaleducational issues, many of which have hadimplications for teacher education. TheRockefeller Foundation, while supportingother small innovative programs, has empha-sized development of superintendent intern-ships particularly for minority group per-sonnel. The Rockefeller Brothers Foundationhas stressed open-education projects andTeacher Centers, where planning and gov-ernance were undertaken by teachers andwhere participation was voluntary. Teachereducation remains significant in a widerange of foundation activities, even thoughrecently some foundations have cut backfunding significantly because of the declinein investment income.
The education service industries haveoperated in more areas than have the foun
73
dations. These encompassbut are not limi-ted tothe following activities: (1) Educa-tion goods and equipment for which in-creased demand is generated by legislation(e.g., because of recent court decisions, bi-lingual materials are becoming increasinglyimportant a.i did audiovisual equipment andscience kits in the post-Sputnik 1960's be-cause of the National Defense EducationAct) ; (2) hardware and software for com-puter-managed and computer-assisted irstruction ; (3) professional services undercontract, including personnel, plant, andbudgetary management ; (4) specializededucation services such as pupil testing, pro-gram evaluation, and curriculum design.
Since the 1960's, an increasing number ofmajor cirporations have acquired publish-ing or education service subsidiaries as ameans of entering the education market. Avery limited number of companies enteredthe performance contracting field of educa-tion in the late 1960's and early 1970's.(Performance contracting is delivery of in-struction to schools by personnel from out-side the school system, with payment basedupon the demonstrated achievement by thepupils of a specified level of learning.) Per-formance contracting has been strongly at-tacked on the grounds that the techniquesof the manufacturer and marketplace can-not easily be transferred to or applied ineducation. Results to date have fallen con-siderably short of expectations. Its defend-ers argue, however, that the contexts inwhich it has been attempted have been un-duly embattled ones often characterized by
67

acute managerial and administrative prob-lems.
Training for New Responsibilities
Teacher education must prepare people towork not only in the schools themselves butalso in the political and financial climates inwhich the schools operate. In light of newpolitical consciousness among minoritygroups, students' rights movements, andparent-school confrontations, teachers mustconcern themselves to a far greater degreethan previously with conflict mediation andpolitical and legal processes. The greaterrole of the Federal Government in educa-tion (Elementary and Secondary EducationAct, National Defense Education Act, Vo-cational Educational Act, etc.) requires theteacher to discharge new responsibilities.These include execution of mandated pro-gram requirements (applicable to most edu-cation programs receiving part of totalFederal funding) and preparation of evalu-ations and reports. Current innovations inteacher education reflect the need for thesemanagerial and administrative skills.
The technologies discussed earlier (CMI,CAI, ETV, and audiovisual) also require up-dated training on the part of old and newusers if their maximum potential in theclassroom is to be realized.
One experienced teacher-educator hasoffered a framework for effective inserviceteacher traininga three-vector approach,
68
calling for: (1) analysis of school needsthrough review of school objectives, teacherassessment of needs, analysis of teacherneeds by a qualified observer (based on class-room observations and teacher interviews),and random pupil judgments ; (2) review ofcurrent educational perspectives and re-search findings and assessment of theteacher's relative position ; and (3) con-stant research-action and action-researchfeedbacks.24 This three-vector approach canonly be activated through coordinated in-service education for professors, deans, sup-erintendents, and their leadership staffs.
Rather than as ends in themselves, ad-ministration and publications must beviewed as means to achieve better teachereducation and more effective counseling.They should support teamwork in school-university affairs, leading to curriculum re-vamping at both levels as the need forchange becomes apparent through carefulon-going education.
Management and planning are areas inwhich training is needed at all levels ofeducation. In addition to their educationfunctions, school systems, local schools,and teacher-education institutions are alsobusiness organizations with a full range ofplanning, budgetary, administrative, andmanpower recruitment and deployment re-quirements. The need for management in-formation such as budgetary data analysis,
74
"Sam P. Wiggins. "The Teacher EducationMarket Paradox," The Journal of Teacher Educa-tion. Fall 1974.

data on teacher supply and demand, job de-scriptions, and reporting systems has untilrecently been incompletely recognized.Timely receipt of this information enablesadministrators to support teacher perform-ance, whether in traditional or innovativeprograms, by effective decisionmaking. Ad-ministrators need training in managementand planning in order to be able to pre-dict long-term programmatic consequences.Teachers need to recognize the managementneeds of their working environment and tounderstand that effective ongoing manage-ment is an essential support to growth, de-velopment, and learning activities.
Continuing Education
There is also a need to upgrade many ofthe teachers hired in the "shortage" yearsof the 1950's and 1960's when jobs wereplentiful for teacher education graduates,regardless of the quality of their trainingor performance. These teachers, who stillhave 20 or 25 years of teaching ahead ofthem, deserve assistance in responding tothe changing needs of the classroom and inlearning to adapt their teaching techniquesto the findings of modern research.
Incentives and opportunities.There arevarious incentives for teachers to acquireadditional training graduate credits. Notonly do teachers with graduate credits nor-mally earn higher salaries, but severalStates and many local school districts haveadopted formal requirements for teachers(particularly at the secondary level) to have
75
earned a graduate degree or graduatecredits. Also, special courses are offered bylocal school districts with the hope thatteachers will be encouraged to pursue addi-tional learning experience. Salary incen-tives have been used successfully to encour-age teachers to pursue these programs.
Establishment of a variety of teacher-learning centers around the country hasstimulated some teachers voluntarily totake workshops and pursue new interestsand approaches that enhance their capabili-ties. Where incentives of increased salaryor released time are available, teacher re-sponse has been greater. The open-class-room movement has been an importantfactor in stimulating teachers to developskills in this area and school districts haveencouraged such training by recruitingteachers with that kind of experience.
Teacher organizations have been anothersource of inservice education, offeringcourses and workshops on subjects of inter-est. The development of new curricular ma-terials and the dissemination of informa-tion on new techniques are part of thateffort.
Several State education departments havedeveloped special training centers as ongo-ing facilities providing resources and tech-nical competence to local school districtsthat cannot afford their own programs. In-service teacher education programs inthese centers are voluntary but often pro-vide payment and:or released time forteachers willing to participate in them.
69

University graduate programs.Recently,several universities reorganized their gradu-ate programs to relate more specifically toinservice problems and needs. Field-based,these programs are more responsive to theparticular concerns of the classroom teach-er. Clearly, one of the problems in offeringsuch programs is that many universityfaculty members are not experienced class-room teachers familiar with current prob-lems in schools. Local school districts haveas a result taken the initiative in offeringinservice courses either independently or in
cooperation with the State and/or the uni-versity. Universities, recognizing the ad-vantage of using school personnel, are draw-ing on these people more frequently and aremoving increasingly to practicum-styletraining in the schools both for preserviceand inservice education. As noted earlier,various Federal programs, particularlyTeacher Corps, have made important contri-butions to expanding and improving effec-tive collaborative efforts between andamong school systems, State education de-partments, and colleges and universities.
70 76

Selected References
Association of Teacher Educators. Alterna-tive Approaches to Student Involvementin Teacher Education: Three ResearchStudies. Washington, D.C.: the Associa-tion, 1973. 36 pp.
Bailey, Stephen K., et al. Alternative Pathsto the High School Diploma. (Preparedby the Policy Institute, Syracuse Uni-versity Research Corp.) Reston, Va.:National Association of SecondarySchool Principals, 1973. 63 pp.
Basil, Douglas Constantine. The Manage-ment of Change. New York : McGraw-Hill, Inc., 1974.
Bell, Terrell Howard. A Performance Ac-countability System for School Admin-istrators. West Nyack, N.Y.: ParkerPublishing Co., 1974. 214 pp.
Benson, Charles. Planning for EducationalReform; Financial and Social Alterna-tives. New York: Dodd, Mead and Com-pany, 1974.
Berke, Joel S. Answers to Inequity; An Anal-ysis of the New School Finance. Berke-ley, Calif.: McCutchan Publishing Corp.,1974. 369 pp.
Bolino, August C. Career Education: Con-tributions to Economic Growth. NewYork : Praeger Publishers, Inc., 1973.
Bolton, Dale L. Selection and Evaluation ofTeachers. Berkeley, Calif.: McCutchanPublishing Corp., 1973.
77
Bornheimer, Deawe E. The Faculty in High-er Education. Danville, Ill.: InterstatePrinters and Publishers, Inc., 1973.
Brown, B. Frank, et al. The Reform of Sec-ondary Education; a Report of the Na-tional Commission on the Reform ofSecondary Education. New York : Mc-Graw-Hill Book Co., 1973. 188 pp.
Carnegie Commission on Higher Education,College Graduates and Jobs: Adjustingto a New Labor Market Situation. NewYork: McGraw-Hill, 1973.
Clasby, Miriam, Maureen Webster and Na-omi White. Laws. Tests and Schooling:Changing Contexts for Educational De-cision-Making. Syracuse, N.Y.: SyracuseUniversity Research Corp., EducationalPolicy Research- Center, 1973. 209 pp.
Commission on Non-traditional Study. Di-versity by Design. Samuel B. Gould,chairman. 1st ed. San Francisco: Jossey-Bass Publishers, 1973. 178 pp.
Committee on National Program Prioritiesin Teacher Education. The Power ofCompetency-based Teacher Education.Boston: Allyn & Bacon, Inc., 1973.
Corwin, Ronald G. Reform and Organiza-tional Survival. The Teachers Corps asan Instrument of Educational Change.New York : John Wiley & Sons, 1973.469 pp.
71

Denernark, George W. and Joost Yff. Obliga-tion for Reform: Final Report of theHigher Education Task Force on Im-provement and Reform in American Ed-ucation. Washington, D.C.: AmericanAssociation of Colleges for Teacher Ed-ucation, 1974. 68 pp.
Dunkin, M. J. The Study of Teaching. NewYork : Holt, Rinehart and Winston,1974.
Edelfelt, Roy A. et al. Teacher Designed Re-form in. Teacher Education. Final Re-port, Project No. 1-0683. Washington,D.C.: National Center for EducationalResearch and Development, Office of Ed..ucation, U.S. Department of Health, Ed-ucation, and Welfare, August 1972. 96pp.
Fantini, Mario D. Public Schools of Choice:A Plan for the Reform of AmericanEducation. New York: Simon andSchuster, 1974. 256 pp.
Florida, Department of Education. ProtocolCatalog Materials for Teacher Educa-tion. Tallahassee, Fla.: Department ofEducation, 1974. 41 pp.
Cage, N. L., et al., Computerized Catalogueof Teacher Training Products, Researchand Development Memorandum No. 116.Palo Alto, Calif. : Stanford Center forResearch and Development in Teaching,Stanford University, 1974.
72
. Teacher Training Products: The Stateof the Field, Research and DevelopmentMemorandum No. 116. Palo Alto, Calif.:Stanford Center for Research and De-velopment in Teaching, Stanford Uni-versity, 1974.
78
Gronlund, Norman E. Determining Account-ability for Classroom Instruction. NewYork: MacMillan, Inc., 1974.
Haberman, Martin and T. M. Stinnett.Teacher Education and the New Profes-sion of Teaching. Berkeley, Calif. : Mc-Cutchan Publishing Corp., 1973. 257 pp.
Hahn, Robert 0. Creative Teachers: WhoWants Them? New York : John Wiley &Sons, 1973. 272 pp.
Halstead, D. Kent. Statewide Planning inHigher Education. Washington, D.C.:U.S. Government Printing Office, 1974.812 pp.
Heath, G. Louis. The New Teacher, ChangingPatterns of Authority and Responsibil-ity. New York : Harper and Row, 1973.210 pp.
House, Ernest R. School Evaluation: ThePolitics and Process. Berkeley, Calif.:McCutchan Publishing Corp., 1973.
Houston, W. Robert. Exploring Competency-Based Education. Berkeley, Calif. : Mc-Cutchan Publishing Corp., 1974. 426 pp.

Howes, Virgil M. Informal Teaching in theOpen Classroom. New York: MacmillanPublishing Co., 1974. 220 pp.
Hughes, John F. and Anne 0. Hughes. EqualEducation: A New National Strategy.Bloomington, Ind.: Indiana UniversityPress, 1973.
Hunter, William A., ed., Multicultural Edu-cation through Competency-based Teach-er Education. Washington, D.C.: Ameri-can Association of Colleges of TeacherEducation, 1974. 276 pp.
Ianni, Francis A. J. and Edward Storey.Cultural Relevance and Educational Is-sues. Readings in Anthropology and Ed-ucation. Boston : Little, Brown and Co.1973.
Kimball, Solon T. Culture and the EducationProcess: An Anthropological Perspec-tive. New York : Teachers College Press,1974. 285 pp.
Klassen, Frank H. and John L. Collier, eds.Innovation Now! International Perspec-tives on Innovation in Teacher Educa-tion. Washington, D.C.: InternationalCouncil on Education for Teaching,1972. 133 pp.
Mark, Jorie Lester. Training and Utilizationof Paraprofessionals: A Study of theNation's Public School Systems Enroll-ing 5,000 and More Pupils. Amherst,Mass.: University of MassachusettsSchool of Education, 1975.
79
McCarty, Donald J. et al. New Perspectiveson Teacher Education. San Francisco,Calif.: Jossey-Bass Publishers, 1973.255 pp.
Mayhew, Lewis B. and Patrick F. Ford. Re-form in Graduate and Professional Edu-cation. San Francisco : Jossey-Bass,1974. 254 pp.
National Commission on the Financing ofPostsecondary Education. FinancingPostsecondary Education in the UnitedStates. Washington, D.C.: 'U.S. Govern-ment Printing Office, 1973. 442 pp.
National Education Association. Handbookof Research on Teaching, 2nd ed. (Proj-ect of the American Educational Re-search Association) Chicago, Ill.: RandMcNally & Co., 1973.
. Status of the American Public SchoolTeacher, 1970-71. (Research Report1970-R-3). Washington, D.C.: the As-sociation, 1972.
. Teacher Supply and Demand in PublicSchools, 1973. Washington, D.C.: the As-sociation, Research Division, 1973. 62pp.
Phi Delta Kappa. Financing the PublicSchools: a Search for Equality. Bloom-ington, Ind.: Phi Delta Kappa, 1973.
Regier, Harold G. Too Many Teachers:Fact or Fiction? Fastback Series, No. 5.Bloomington, Ind.: Delta Kappan Edu-cation Foundation, 1972. 38 pp.
73

Reischauer, Edwin 0. Toward the 21st Cen-tury: Education, for a Changing World.New York: Alfred A. Knopf, Inc., 1973.
Rubin, Louis J., ed., Improving InserviceEducation: Proposals and Proceduresfor Change. Boston, Mass.: Allyn andBacon, Inc., 1971. 284 pp.
Ryan, Kevin, ed. Yearbook on Teacher Edu-cation (the Seventy-third Yearbook ofthe National Society for the Study ofEducation). Chicago: University of Chi-cago Press, 1975.
Schmieder, Allen A. Competency-based Edu-cation: the State of the Scene. PETESeries No. 7, Washington, D.C.: Amer-ican Association of Colleges for TeacherEducation, 1973. 77 pp.
. Profile of the States in Compe-tency-Based Education. PETE vol. 3,no. 5, November 1974. Published by theMulti-State Consortium on Perform-ance-Based Teacher Education. Albany,N.Y.: New York State Education De-partment, 1974. 24 pp.
and Sam J. Yarger. Teaching Cen-ters: toward the state of the scene.Washington, D.C.: American Associa-tion of Colleges for Teacher Education,1974. 56 pp.
Smith, B. Othanel, et al. Handbook on theDevelopment and Use of Protocol Ma-terials for Teacher Education. Chipley,Fla.: Panhandle Area Educational Co-
74
operative (P.O. Drawer 190). 1973. 146
Smith, B. Othanel, et al. Teachers for theReal World. Report of the NDEA Na-tional Institute for Advanced Study inTeaching Disadvantaged Youth. Wash-ington, D.C.: American Association ofColleges for Teacher Education, 1969.185 pp.
State University of New York at Albany.Teacher Education Developmental Serv-ice. Glossary of Terms; Competence-Based Teacher Education. Supplementto PETE Newsletter, September 1974.Albany, N.Y.: School of Education,State University of New York, 1974.
Stiles, Lindley J., ed. Theories for Teaching.New York : Dodd, Mead & Co. 1974. 177pp.
Stinnett, T. M. A Manual on StandardsA ff ecting School Personnel in the UnitedStates. Washington, D.C.: NationalEducation Association, 1974. 184 pp.
Study Commission on Undergraduate Edu-cation and the Education of Teachers.Education for 1984 and After: A Sym-posium of Deans of Education andLeaders in Institutions EducatingTeachers. Paul A. Olson, Larry Free-man, James Bowman, eds. Lincoln,Nebr.: the Commission, 1971. 232 pp.
Travers, R. M., ed. Second Handbook of Re-search on Teaching. Chicago: RandMcNally, 1973.
SO

Ti. S. Office of Education. Better SchoolsThrough Better PartnershipsFinalReport and Recommendations of theCouncil of Chief State School OfficersNational Field Task Force on the Im-provement and Reform of AmericanEducation. Washington, D.C.: U. S.Government Printing Office, 1974.
. The Final Report and Recommenda-tions of the Summer Institute on theImprovement and Reform of AmericanEducation. Washington, D.C.: U. S.Government Printing Office, 1974. 304pp.
How Teachers Make a Difference.Washington, D.C.: U. S. GovernmentPrinting Office, 1971.
. Inside-Out: Final Report and Rec-ommendations of the Teachers NationalField Task Force on the Improvementand Reform of American Education.Washington, D.C.: Ti. S. GovernmentPrinting Office, 1975. 57 pp.
4
. Institutional Viability Final Reportand Recommendations of the Admin-istration and Supervision NationalField Task Force on the Improvementand Reform of American Education.Washington, D.C.: U. S. GovernmentPrinting Office, 1974. 112 pp.
Obligation for Reform: The FinalReport and Recommendations of theHigher Education National Field Task
Force on the Improvement and Reformof American Education. Washington,D.C.: U. S. Government Printing Office,1974. 54 pp.
A. Real AlternativeFinal Reportand Recommendations of the Commun-ity National Field Task Force on theImprovement and Reform of AmericanEducation. Washington, D.C.: Ti. S.Government Printing Office, 1975. 91 pp.
. The Second Newman Report: Na-tional Policy and Higher Education.Prepared by an independent task force,Frank Newman, chairman. Cambridge,Mass.: MIT Press, 1973. 227 pp.
Working TogetherFinal Report andRecommendations of the Basic StudiesNational Field Task Force on the Im-provement and Reform of AmericanEducation. Washington, D.C.: U. S.Government Printing Office, 1975. 42 pp.
el
. National Center for EducationalStatistics. National Longitudinal Studyof the High School Class of 1972: ACapsule Description of High SchoolSeniors. Base-Year Survey. Washing-ton, D.C.: Ti. S. Government PrintingOffice, 1974. The first in a series of pub-lications which will regularly presentthe highlights of a 10-year study of across section (10,000) of the high schoolgraduating class of 1972.
U S GOVERNMENT PRINTING OFFICE 1975 0- 590-125
75