Embed Size (px)
Citation preview
EECS 247 Lecture 12: Data Converters © 2004 H.K. Page 1
EE247Lecture 12
• Administrative issues§ Midterm exam Oct. 19th.
o You can only bring one 8x11 paper with noteso No books, class handouts, calculators,
computers, cell phones....§ Final exam date in process of changing-
feedback so far from students the only conflicting other final is EE142- if you have any other finals last chance to announce
EECS 247 Lecture 12: Data Converters © 2004 H.K. Page 2
EE247Lecture 12
• Data Converters0Summary last lecture0ADC & DAC testingú DNL & INL§ Code boundry servo test§ Histogram testing
ú Spectral testing
EECS 247 Lecture 12: Data Converters © 2004 H.K. Page 3
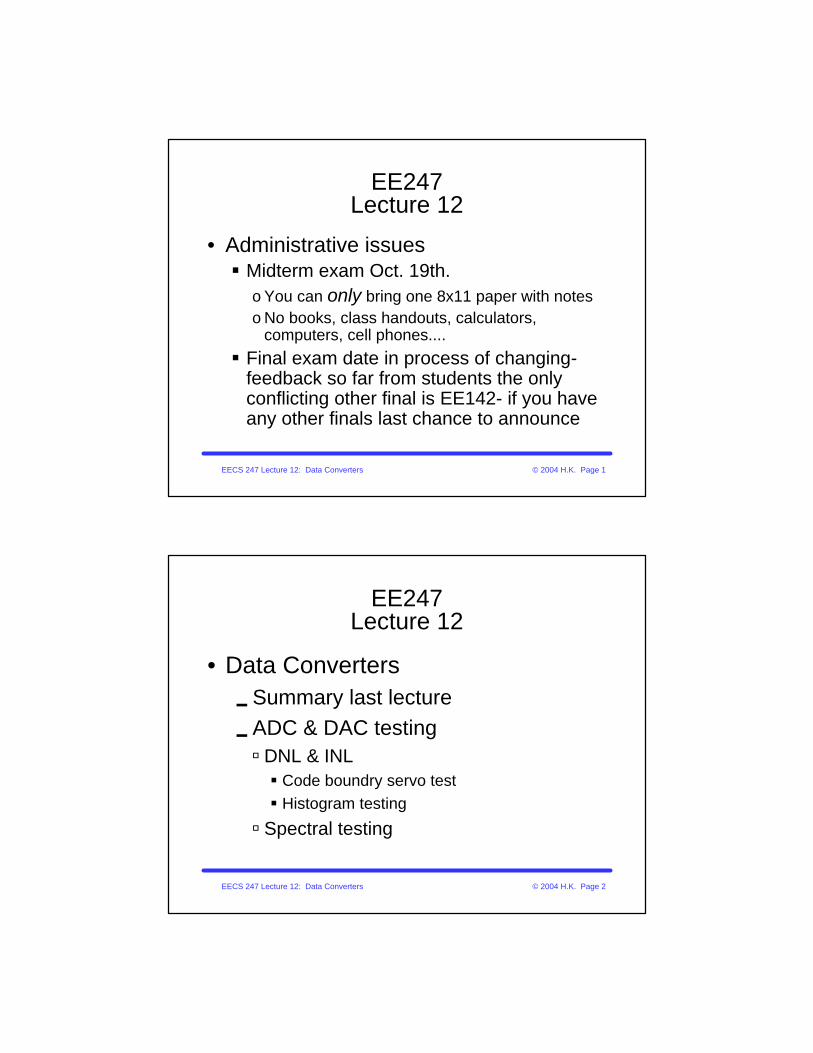
A/D & D/A ConversionA/D Conversion
D/A Conversion
EECS 247 Lecture 12: Data Converters © 2004 H.K. Page 4
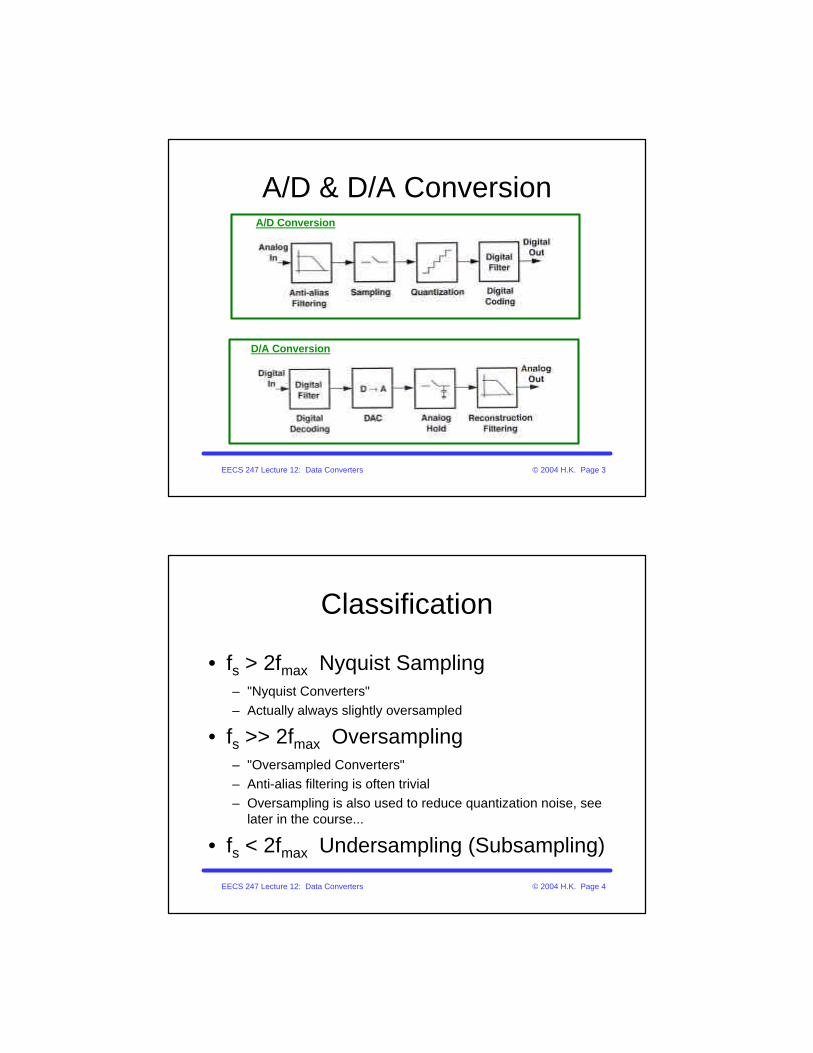
Classification
• fs > 2fmax Nyquist Sampling– "Nyquist Converters"– Actually always slightly oversampled
• fs >> 2fmax Oversampling– "Oversampled Converters"– Anti-alias filtering is often trivial– Oversampling is also used to reduce quantization noise, see
later in the course...
• fs < 2fmax Undersampling (Subsampling)
EECS 247 Lecture 12: Data Converters © 2004 H.K. Page 5
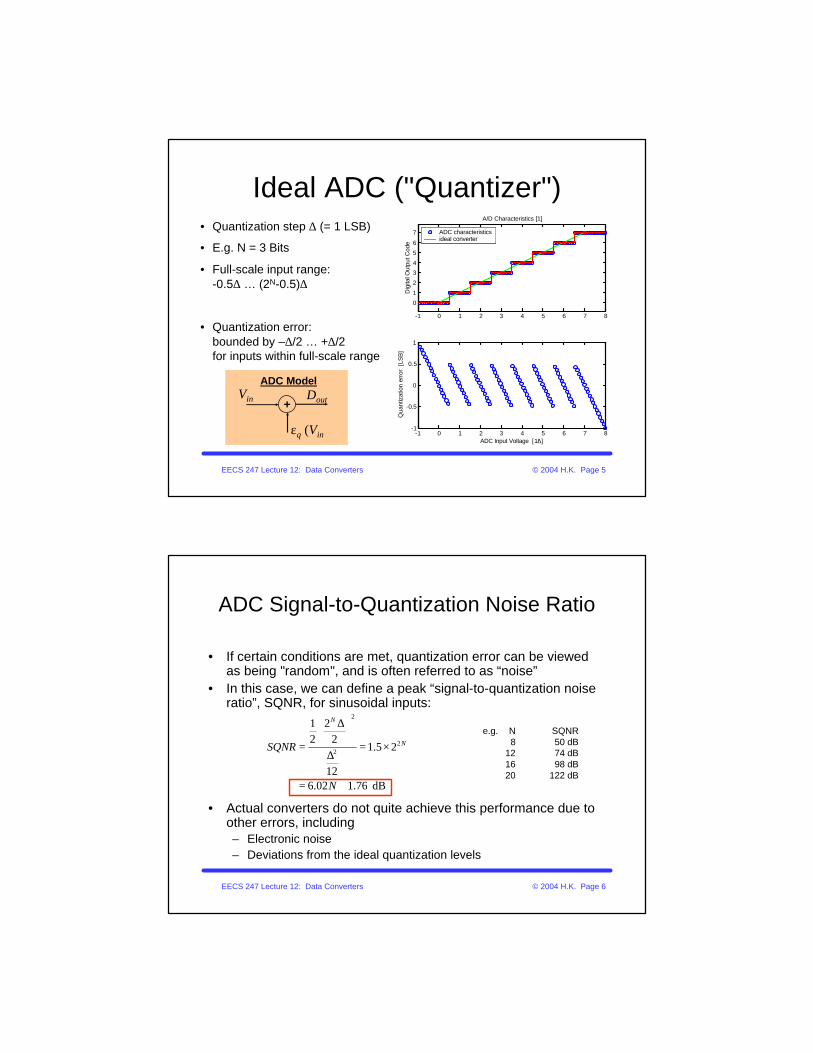
Ideal ADC ("Quantizer")• Quantization step ∆ (= 1 LSB)
• E.g. N = 3 Bits
• Full-scale input range:-0.5∆ … (2N-0.5)∆
• Quantization error:bounded by –∆/2 … +∆/2for inputs within full-scale range
-1 0 1 2 3 4 5 6 7 8
0
1
2
3
4
5
6
7
Dig
ital O
utpu
t Cod
e
A/D Characteristics [1]
ADC characteristicsideal converter
-1 0 1 2 3 4 5 6 7 8-1
-0.5
0
0.5
1
Qua
ntiz
atio
n er
ror
[LS
B]
ADC Input Voltage [1/∆]
+
εq (Vin )
Vin Dout
ADC Model
EECS 247 Lecture 12: Data Converters © 2004 H.K. Page 6
ADC Signal-to-Quantization Noise Ratio
• If certain conditions are met, quantization error can be viewed as being "random", and is often referred to as “noise”
• In this case, we can define a peak “signal-to-quantization noise ratio”, SQNR, for sinusoidal inputs:
• Actual converters do not quite achieve this performance due to other errors, including– Electronic noise– Deviations from the ideal quantization levels
dB 76.102.6
25.1
12
22
21
22
2
+=
×=∆
∆
=
N
SQNR N
N
e.g. N SQNR8 50 dB
12 74 dB16 98 dB20 122 dB

EECS 247 Lecture 12: Data Converters © 2004 H.K. Page 7
Static Converter Errors
Deviations of characteristic from ideal– Offset– Full-scale error – Differential nonlinearity, DNL– Integral nonlinearity, INL
EECS 247 Lecture 12: Data Converters © 2004 H.K. Page 8
Offset ErrorADC DAC
Ref: “Understanding Data Converters,” Texas Instruments Application Report SLAA013, Mixed-Signal Products, 1995.
EECS 247 Lecture 12: Data Converters © 2004 H.K. Page 9
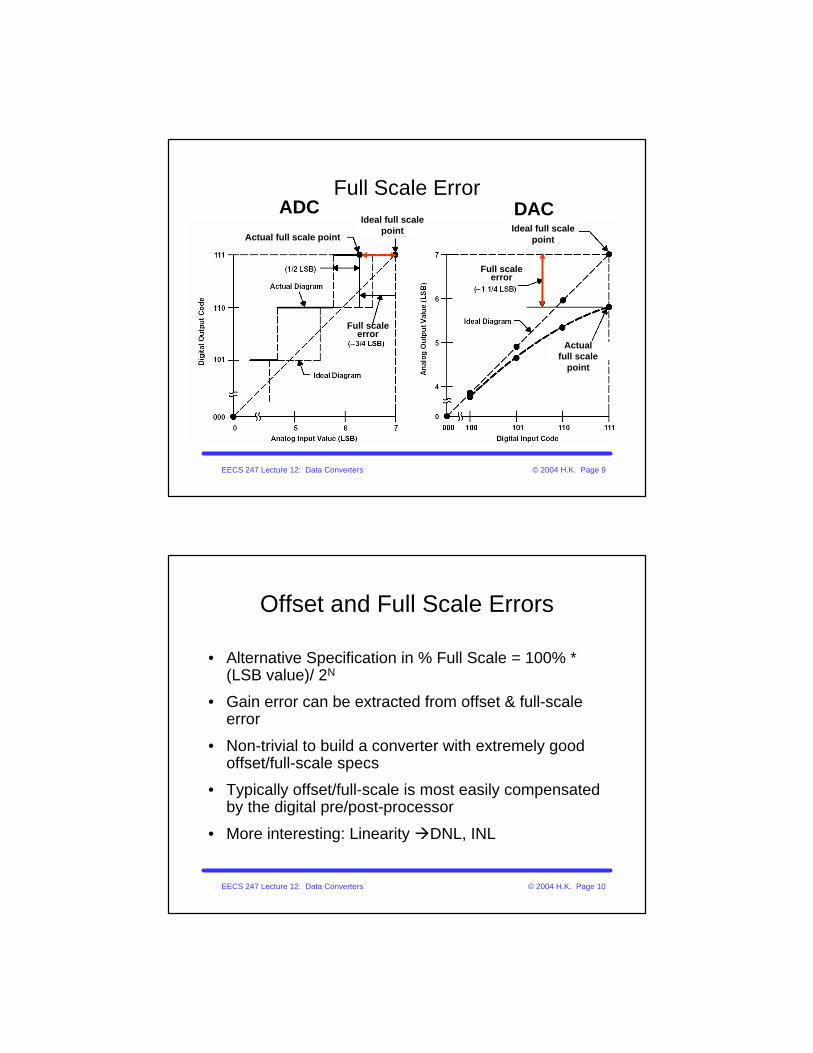
Full Scale ErrorADC DAC
Actual full scale point
Ideal full scale point Ideal full scale
point
Full scale error
Actual full scale
point
Full scale error
EECS 247 Lecture 12: Data Converters © 2004 H.K. Page 10
Offset and Full Scale Errors
• Alternative Specification in % Full Scale = 100% * (LSB value)/ 2N
• Gain error can be extracted from offset & full-scale error
• Non-trivial to build a converter with extremely good offset/full-scale specs
• Typically offset/full-scale is most easily compensated by the digital pre/post-processor
• More interesting: Linearity àDNL, INL

EECS 247 Lecture 12: Data Converters © 2004 H.K. Page 11
Offset and Full-Scale Error
-1 0 1 2 3 4 5 6 7 8
0
1
2
3
4
5
6
7
Dig
ital
Ou
tpu
t C
od
e
ADC Input Voltage [LSB]
ADC characteristicsideal converter
Offset error
Full-scale error
Note:à For further
measurements (DNL, INL) connecting the endpoints & deriving ideal codes based on the non-ideal endpoints elliminates offset and full-scale error
EECS 247 Lecture 12: Data Converters © 2004 H.K. Page 12
-1 0 1 2 3 4 5 6 7 8 9
0
1
2
3
4
5
6
7
8
ADC characteristicsideal converter
ADC Differential Nonlinearity
DNL = deviation of code width from
∆ (1LSB)
+0.4 LSB DNL error
-0.4 LSB DNL error
à Endpoints connected
à Ideal characteriscticsderived
à DNL measured
0 LSB DNL error
Dig
ital
Ou
tpu
t C
od
e
ADC Input Voltage [1/∆]
EECS 247 Lecture 12: Data Converters © 2004 H.K. Page 13
-1 0 1 2 3 4 5 6 7 8 9
0
1
2
3
4
5
6
7
8
ADC characteristicsideal converter
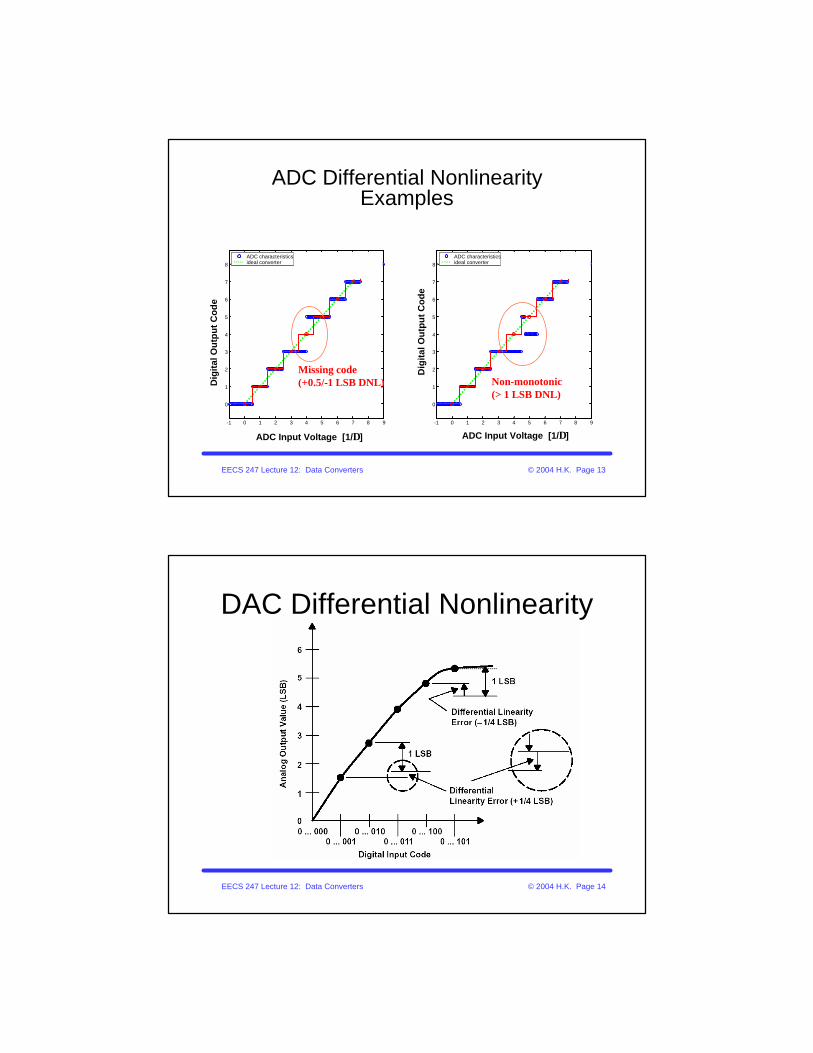
ADC Differential NonlinearityExamples
-1 0 1 2 3 4 5 6 7 8 9
0
1
2
3
4
5
6
7
8
ADC characteristicsideal converter
Non-monotonic(> 1 LSB DNL)
Missing code(+0.5/-1 LSB DNL)
Dig
ital
Ou
tpu
t C
od
e
ADC Input Voltage [1/∆]
Dig
ital
Ou
tpu
t C
od
e
ADC Input Voltage [1/∆]
EECS 247 Lecture 12: Data Converters © 2004 H.K. Page 14
DAC Differential Nonlinearity
EECS 247 Lecture 12: Data Converters © 2004 H.K. Page 15
Impact of DNL on Performance
• Same as a somewhat larger quantization error, consequently degrades SQNR
• How much – later in the course...• People sometimes speak of "DNL
noise", i.e. "additional quantization noise due to DNL"
EECS 247 Lecture 12: Data Converters © 2004 H.K. Page 16
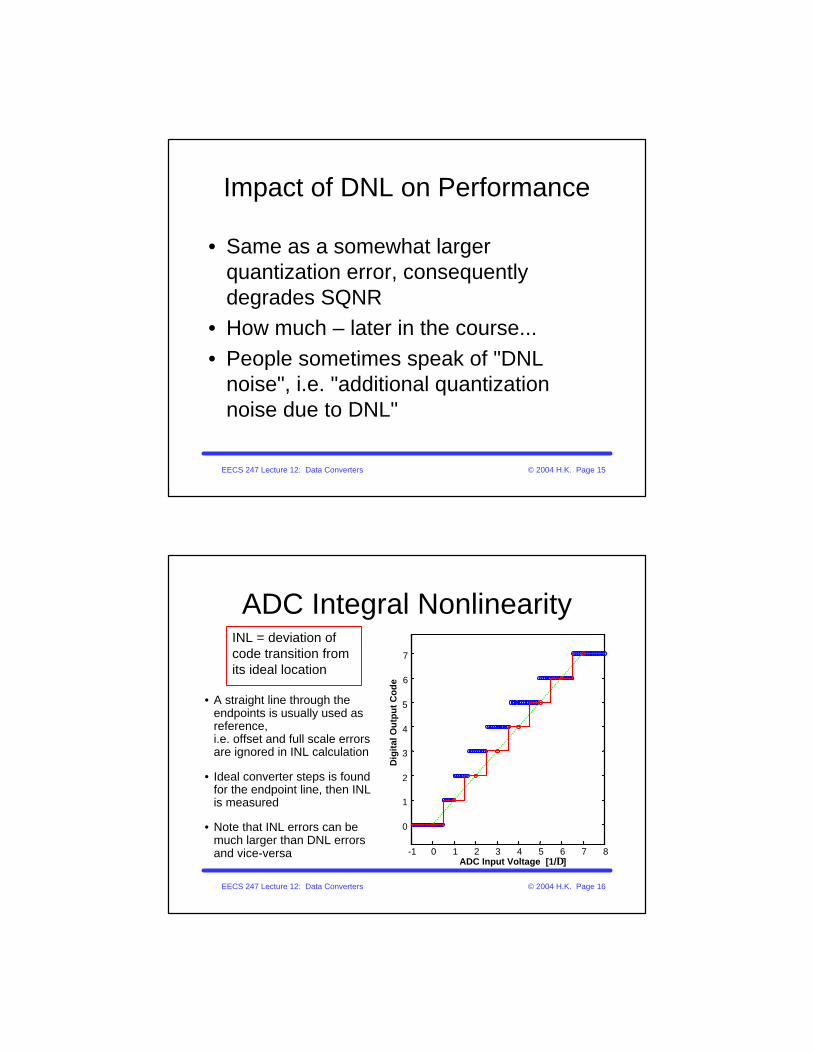
ADC Integral Nonlinearity
• A straight line through the endpoints is usually used as reference,i.e. offset and full scale errors are ignored in INL calculation
• Ideal converter steps is found for the endpoint line, then INL is measured
• Note that INL errors can be much larger than DNL errors and vice-versa
-1 LSB INL
-1 0 1 2 3 4 5 6 7 8
0
1
2
3
4
5
6
7
Dig
ital
Ou
tpu
t C
od
e
ADC Input Voltage [1/∆]
INL = deviation of code transition from its ideal location
EECS 247 Lecture 12: Data Converters © 2004 H.K. Page 17
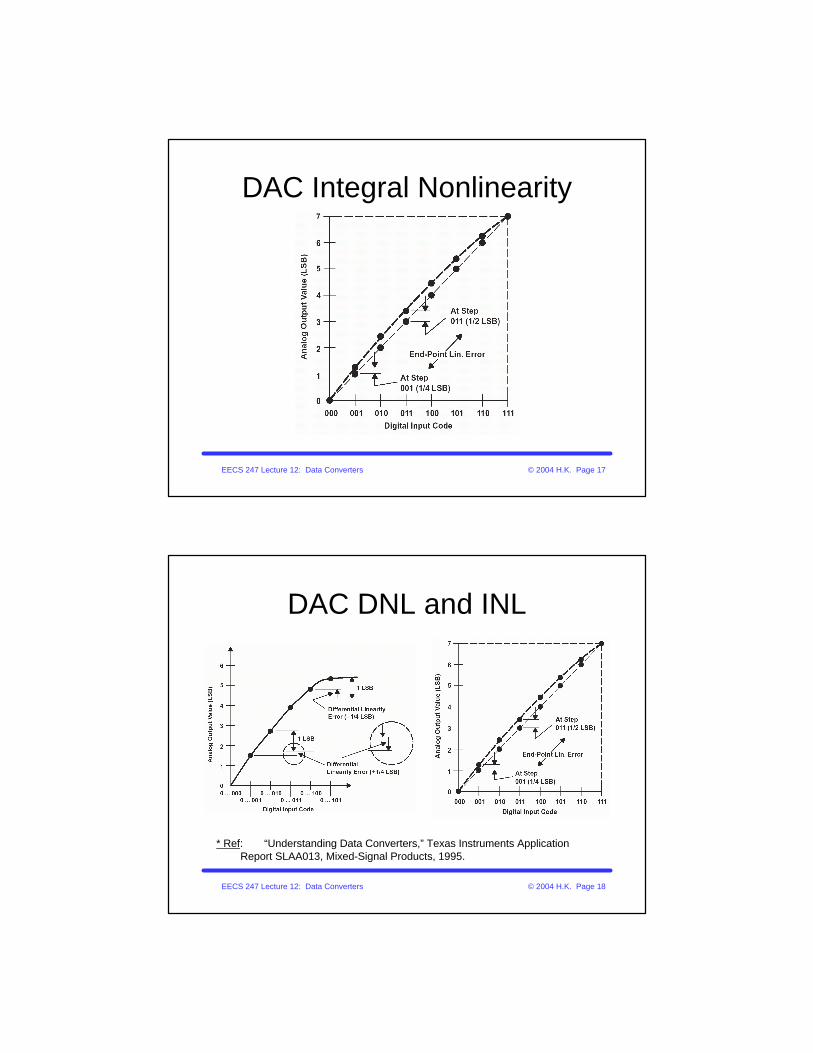
DAC Integral Nonlinearity
EECS 247 Lecture 12: Data Converters © 2004 H.K. Page 18
DAC DNL and INL
* Ref: “Understanding Data Converters,” Texas Instruments Application Report SLAA013, Mixed-Signal Products, 1995.
EECS 247 Lecture 12: Data Converters © 2004 H.K. Page 19
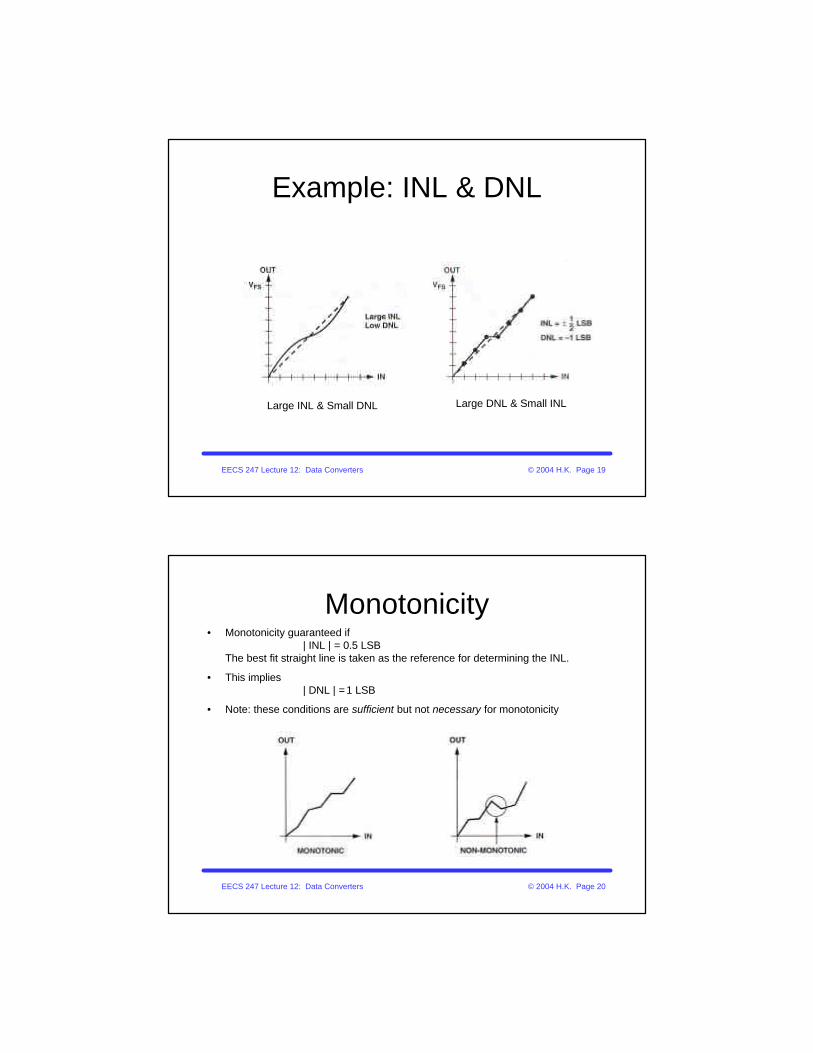
Example: INL & DNL
Large INL & Small DNL Large DNL & Small INL
EECS 247 Lecture 12: Data Converters © 2004 H.K. Page 20
Monotonicity• Monotonicity guaranteed if
| INL | = 0.5 LSBThe best fit straight line is taken as the reference for determining the INL.
• This implies| DNL | =1 LSB
• Note: these conditions are sufficient but not necessary for monotonicity
EECS 247 Lecture 12: Data Converters © 2004 H.K. Page 21
How to measure DNL/INL?• DAC:
– "trivial", apply codes and use a good voltmeter to measure output
• ADC– Need to find "decision levels", i.e. input voltages at all code
boundaries• One way: Adjust voltage source to find exact code trip points
"code boundary servo"• More versatile: Histogram testingàApply a signal with known distibution and analyze digital code distribution at ADC output
EECS 247 Lecture 12: Data Converters © 2004 H.K. Page 22
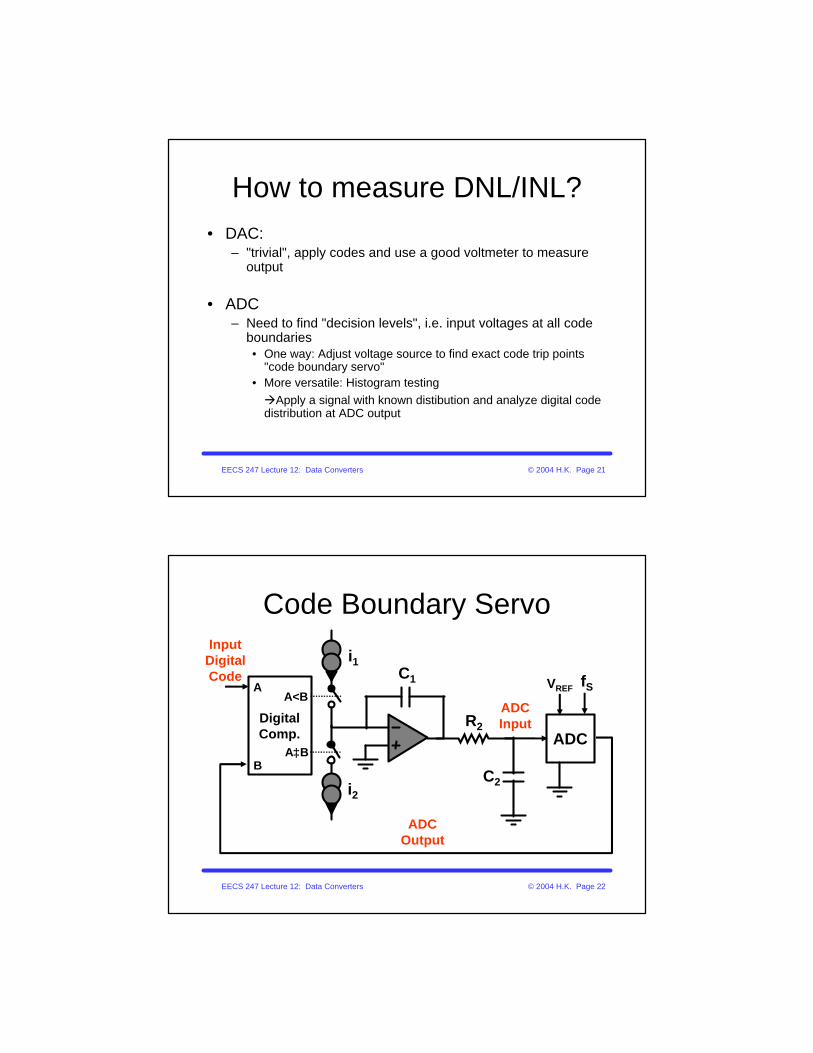
Code Boundary Servo
C1
ADCInputR2
C2
ADC
VREF
i1
i2
DigitalComp.
A<B
BA≥B
A
InputDigitalCode
ADCOutput
fS
EECS 247 Lecture 12: Data Converters © 2004 H.K. Page 23
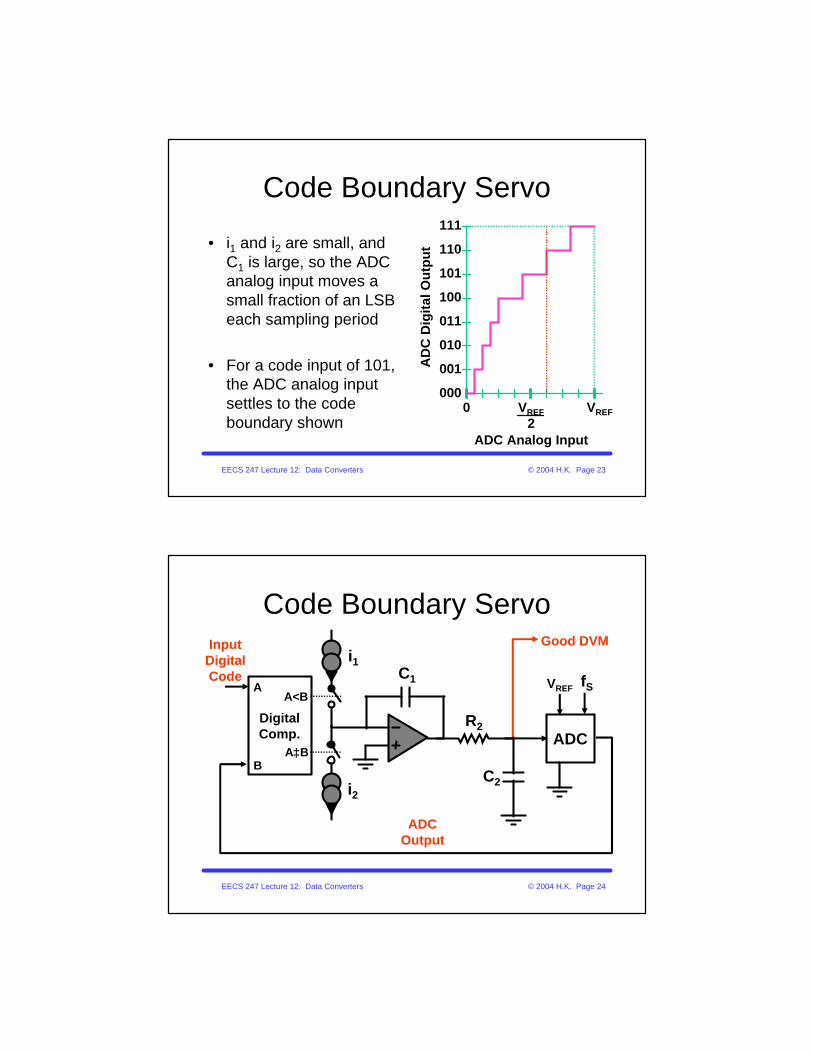
Code Boundary Servo
• i1 and i2 are small, and C1 is large, so the ADC analog input moves a small fraction of an LSB each sampling period
• For a code input of 101, the ADC analog input settles to the code boundary shown
VREF
000
001
010
011
100
101
110
111
AD
C D
igit
al O
utp
ut
0 VREF2
ADC Analog Input
EECS 247 Lecture 12: Data Converters © 2004 H.K. Page 24
Code Boundary ServoGood DVM
C1
R2
C2
ADC
VREF
i1
i2
DigitalComp.
A<B
BA≥B
A
InputDigitalCode
ADCOutput
fS
EECS 247 Lecture 12: Data Converters © 2004 H.K. Page 25
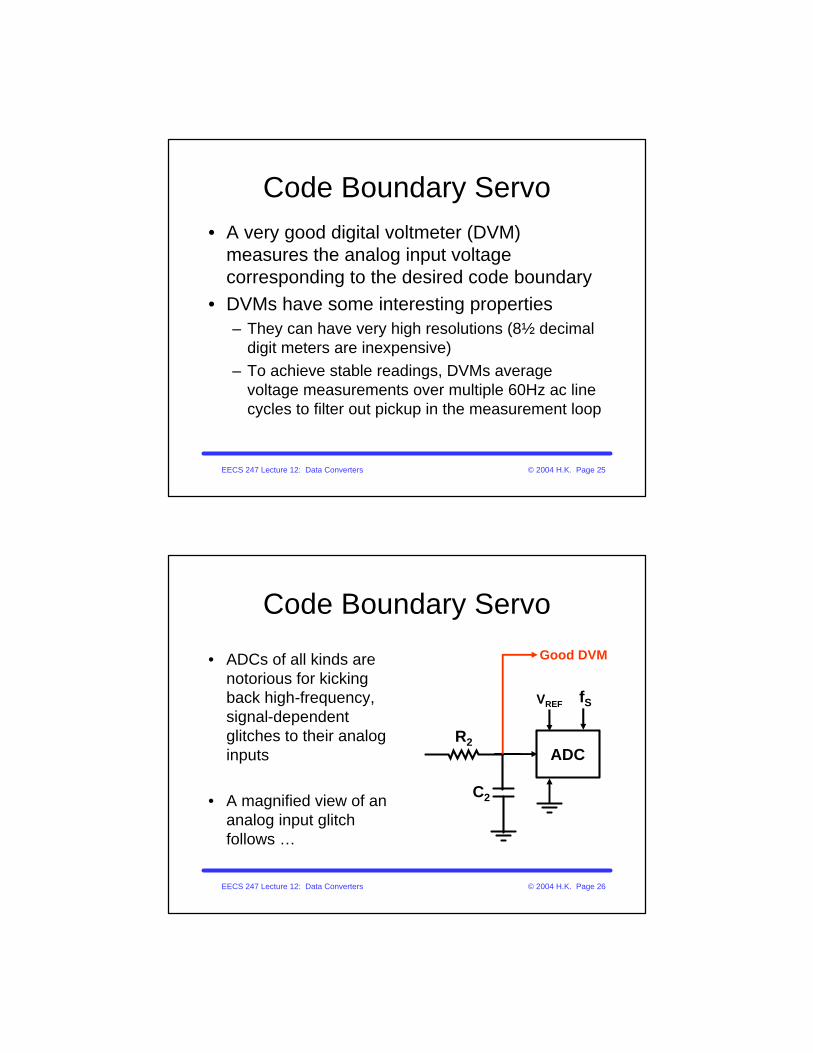
Code Boundary Servo• A very good digital voltmeter (DVM)
measures the analog input voltage corresponding to the desired code boundary
• DVMs have some interesting properties– They can have very high resolutions (8½ decimal
digit meters are inexpensive)– To achieve stable readings, DVMs average
voltage measurements over multiple 60Hz ac line cycles to filter out pickup in the measurement loop
EECS 247 Lecture 12: Data Converters © 2004 H.K. Page 26
Code Boundary Servo
• ADCs of all kinds are notorious for kicking back high-frequency, signal-dependent glitches to their analog inputs
• A magnified view of an analog input glitch follows …
Good DVM
R2
C2
ADC
VREF fS
EECS 247 Lecture 12: Data Converters © 2004 H.K. Page 27
Code Boundary Servo
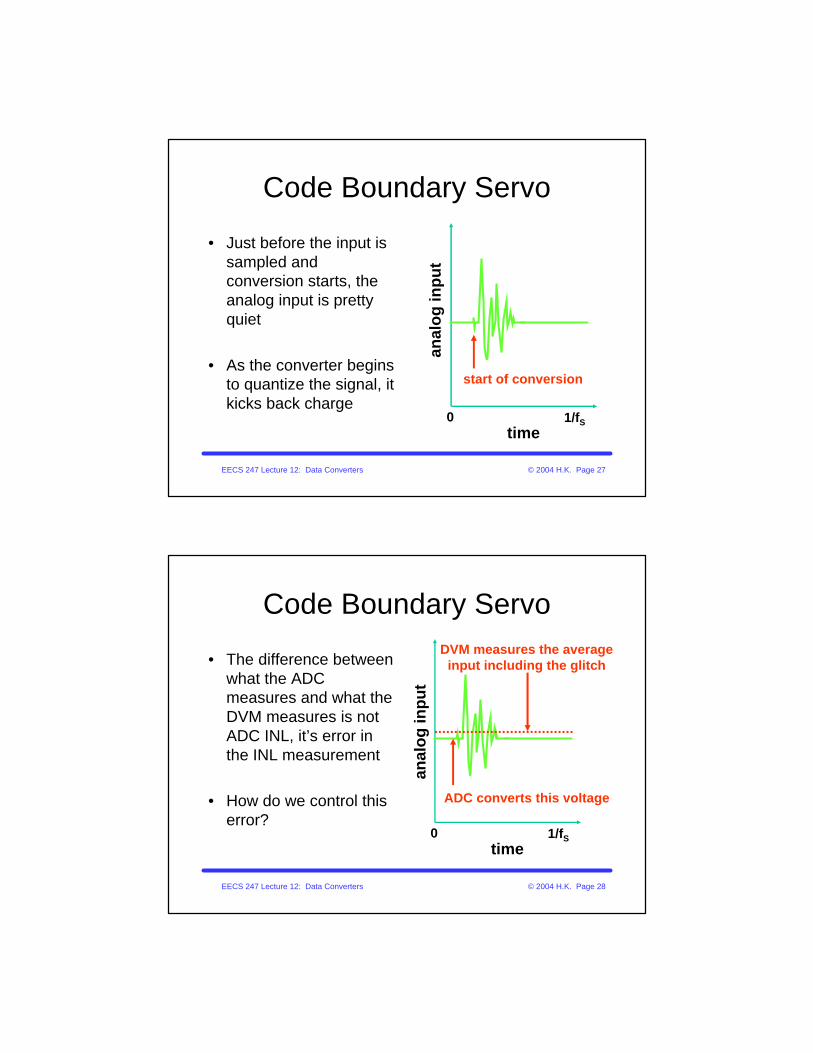
• Just before the input is sampled and conversion starts, the analog input is pretty quiet
• As the converter begins to quantize the signal, it kicks back charge
time0 1/fS
anal
og
inp
ut
start of conversion
EECS 247 Lecture 12: Data Converters © 2004 H.K. Page 28
Code Boundary Servo
• The difference between what the ADC measures and what the DVM measures is not ADC INL, it’s error in the INL measurement
• How do we control this error?
time0 1/fS
anal
og
inp
ut
ADC converts this voltage
DVM measures the averageinput including the glitch

EECS 247 Lecture 12: Data Converters © 2004 H.K. Page 29
Code Boundary Servo
• A large C2 fixes this
• At the expense of longer measurement time
Good DVM
R2
C2
ADC
VREF fS
EECS 247 Lecture 12: Data Converters © 2004 H.K. Page 30
Histogram Testing
• Code boundary measurements are slow– Long testing time– May miss dynamic errors
• Histogram testing– Quantize input with known pdf (e.g. ramp or
sinusoid)– Derive INL and DNL from deviation of measured
pdf from expected result
EECS 247 Lecture 12: Data Converters © 2004 H.K. Page 31
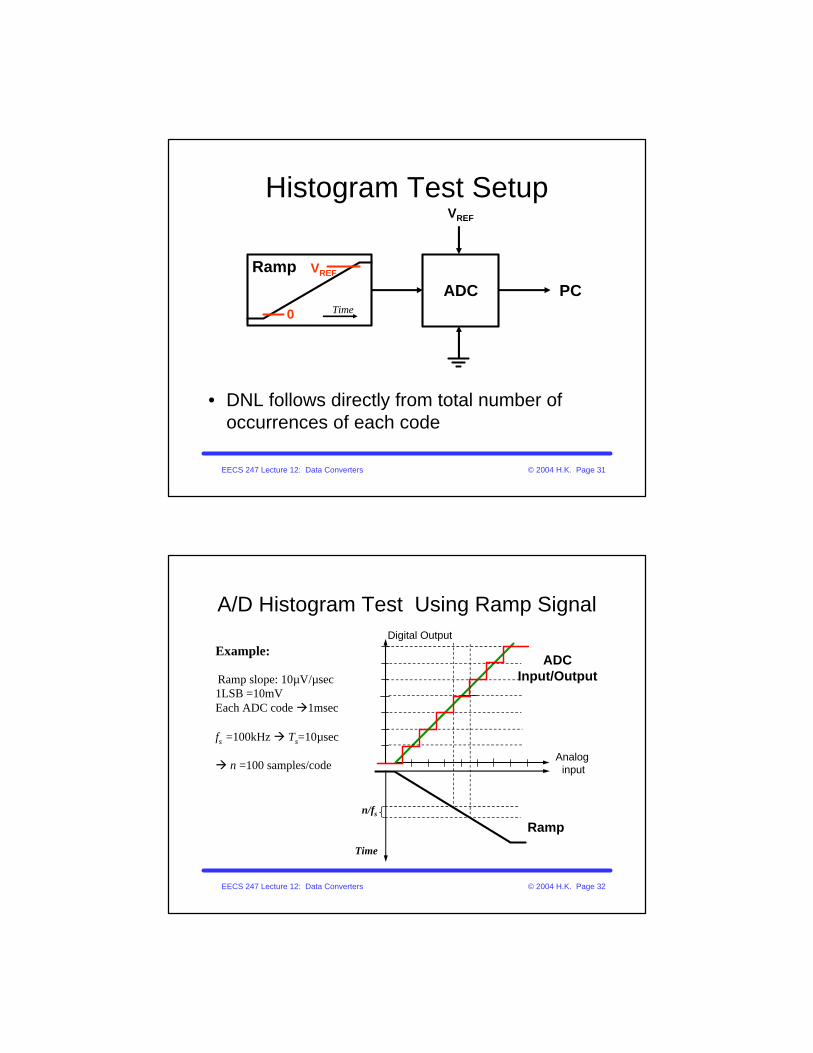
Histogram Test Setup
Ramp
0
VREF
ADC PC
VREF
• DNL follows directly from total number of occurrences of each code
Time
EECS 247 Lecture 12: Data Converters © 2004 H.K. Page 32
A/D Histogram Test Using Ramp SignalDigital Output
Analog input
Ramp
Time
n/fs
ADCInput/Output
Example:
Ramp slope: 10µV/µsec1LSB =10mVEach ADC code à1msec
fs =100kHz à Ts=10µsec
à n =100 samples/code
EECS 247 Lecture 12: Data Converters © 2004 H.K. Page 33
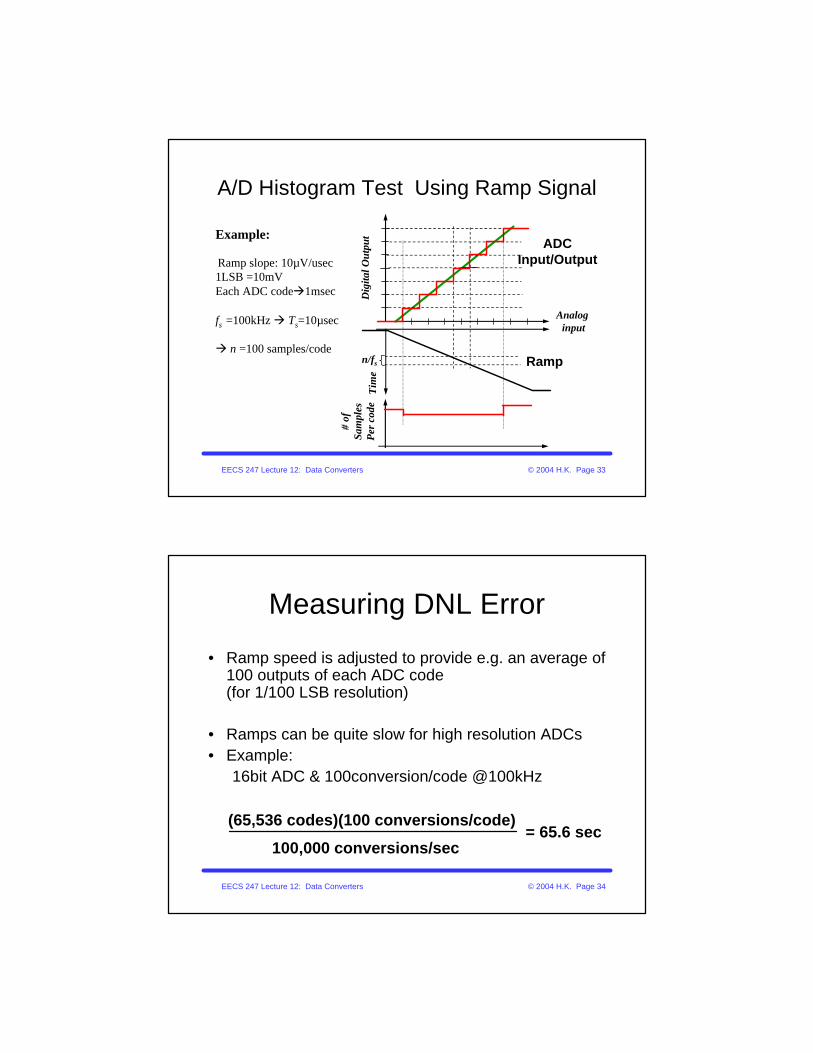
A/D Histogram Test Using Ramp Signal
Dig
ital O
utpu
t
Analog input
RampT
ime
n/fs
ADCInput/Output
Example:
Ramp slope: 10µV/usec1LSB =10mVEach ADC codeà1msec
fs =100kHz à Ts=10µsec
à n =100 samples/code#
ofSa
mpl
esP
er c
ode
EECS 247 Lecture 12: Data Converters © 2004 H.K. Page 34
Measuring DNL Error
• Ramp speed is adjusted to provide e.g. an average of 100 outputs of each ADC code(for 1/100 LSB resolution)
• Ramps can be quite slow for high resolution ADCs• Example:
16bit ADC & 100conversion/code @100kHz
(65,536 codes)(100 conversions/code)
100,000 conversions/sec= 65.6 sec

EECS 247 Lecture 12: Data Converters © 2004 H.K. Page 35
Ramp HistogramIdeal 3 Bit ADC
-1 0 1 2 3 4 5 6 7 8
0
1
2
3
4
5
6
7
ADC characteristicsideal converter
0 1 2 3 4 5 6 70
20
40
60
80
100
120
140
160
180
200
ADC output code
Co
de
Co
un
t
Dig
ital
Ou
tpu
t C
od
e
ADC Input Voltage [1/∆]
EECS 247 Lecture 12: Data Converters © 2004 H.K. Page 36
Ramp HistogramExample 3 Bit ADC
-1 0 1 2 3 4 5 6 7 8
0
1
2
3
4
5
6
7
ADC characteristicsideal converter
+0.4 LSB DNL
-0.4 LSB DNL
+0.4 LSB INL
0 1 2 3 4 5 6 70
20
40
60
80
100
120
140
160
180
200
ADC output code
Co
de
Co
un
t
Dig
ital
Ou
tpu
t C
od
e
ADC Input Voltage [1/∆]
EECS 247 Lecture 12: Data Converters © 2004 H.K. Page 37
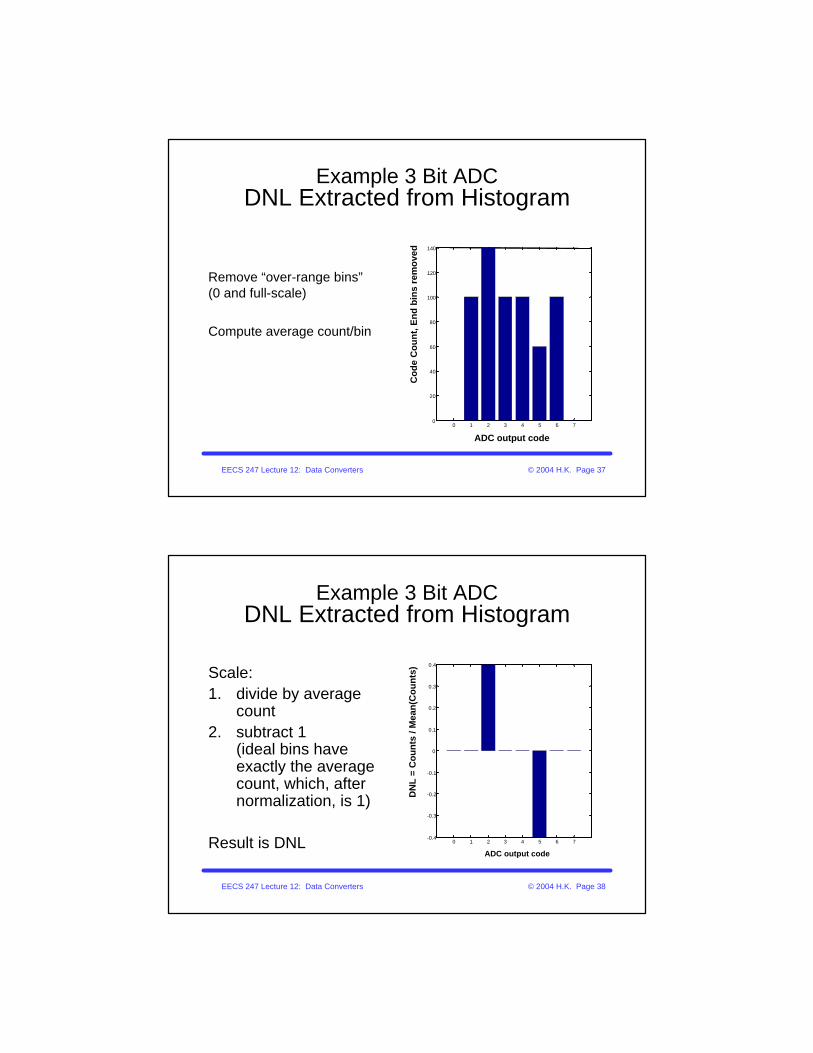
Example 3 Bit ADCDNL Extracted from Histogram
Remove “over-range bins” (0 and full-scale)
Compute average count/bin
0 1 2 3 4 5 6 70
20
40
60
80
100
120
140
ADC output code
Co
de
Co
un
t, E
nd
bin
s re
mo
ved
EECS 247 Lecture 12: Data Converters © 2004 H.K. Page 38
Example 3 Bit ADCDNL Extracted from Histogram
Scale:1. divide by average
count2. subtract 1
(ideal bins have exactly the average count, which, after normalization, is 1)
Result is DNL 0 1 2 3 4 5 6 7-0.4
-0.3
-0.2
-0.1
0
0.1
0.2
0.3
0.4
ADC output code
DN
L =
Co
un
ts /
Mea
n(C
ou
nts
)
EECS 247 Lecture 12: Data Converters © 2004 H.K. Page 39
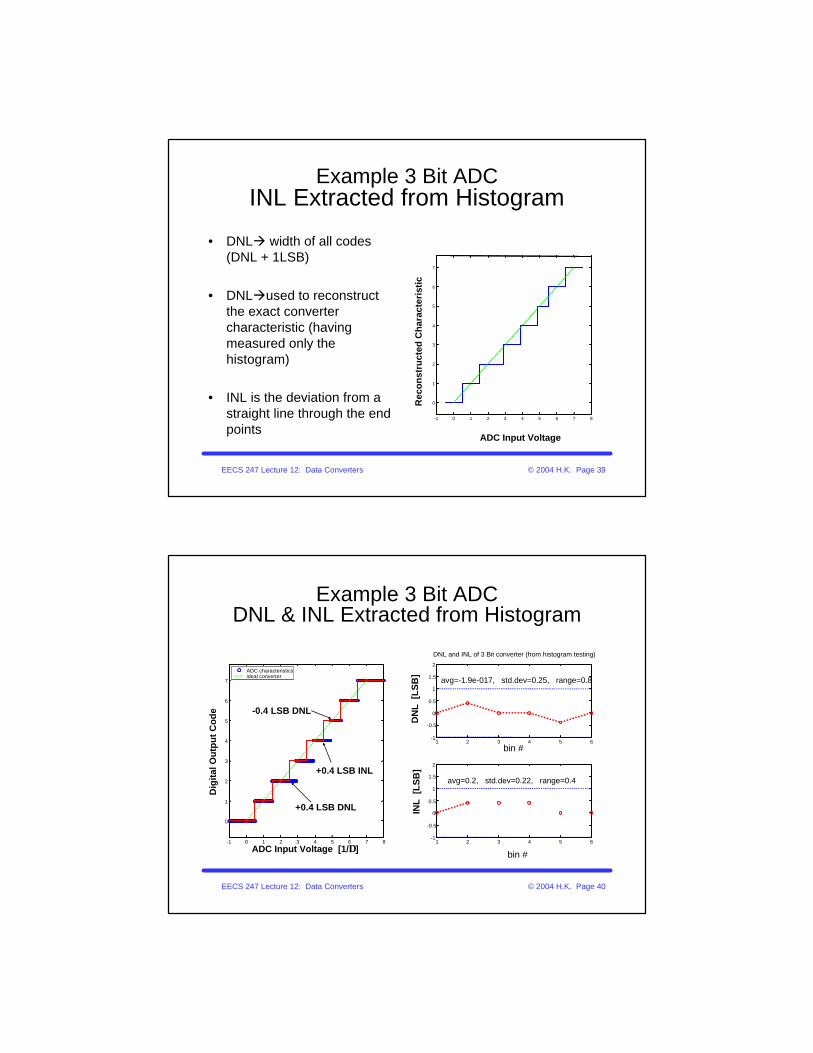
Example 3 Bit ADCINL Extracted from Histogram
• DNLà width of all codes(DNL + 1LSB)
• DNLàused to reconstruct the exact converter characteristic (having measured only the histogram)
• INL is the deviation from a straight line through the end points
-1 0 1 2 3 4 5 6 7 8
0
1
2
3
4
5
6
7
ADC Input Voltage
Rec
on
stru
cted
Ch
arac
teri
stic
EECS 247 Lecture 12: Data Converters © 2004 H.K. Page 40
Example 3 Bit ADCDNL & INL Extracted from Histogram
-1 0 1 2 3 4 5 6 7 8
0
1
2
3
4
5
6
7
ADC characteristicsideal converter
+0.4 LSB DNL
-0.4 LSB DNL
+0.4 LSB INL
1 2 3 4 5 6-1
-0.5
0
0.5
1
1.5
2
DN
L [
LS
B]
DNL and INL of 3 Bit converter (from histogram testing)
avg=-1.9e-017, std.dev=0.25, range=0.8
1 2 3 4 5 6-1
-0.5
0
0.5
1
1.5
2
bin #
INL
[L
SB
]
avg=0.2, std.dev=0.22, range=0.4
Dig
ital
Ou
tpu
t C
od
e
ADC Input Voltage [1/∆]
bin #
EECS 247 Lecture 12: Data Converters © 2004 H.K. Page 41
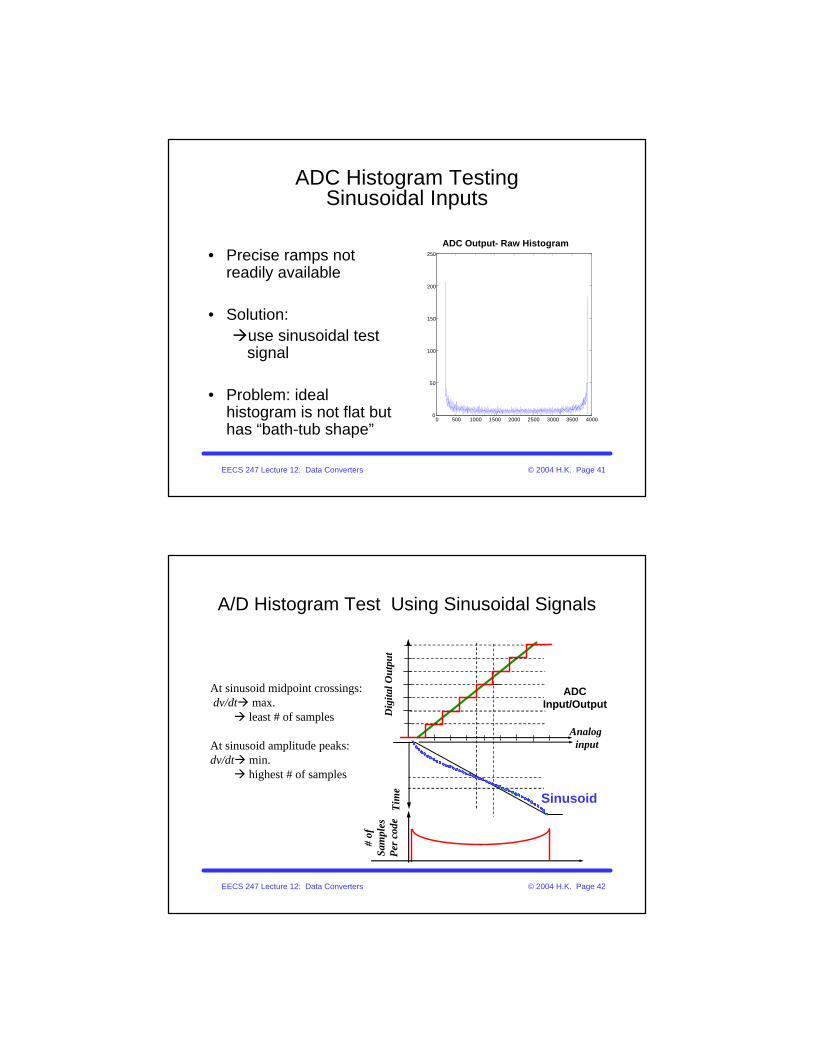
ADC Histogram Testing Sinusoidal Inputs
• Precise ramps not readily available
• Solution: àuse sinusoidal test
signal
• Problem: ideal histogram is not flat but has “bath-tub shape”
0 500 1000 1500 2000 2500 3000 3500 40000
50
100
150
200
250
ADC Output- Raw Histogram
EECS 247 Lecture 12: Data Converters © 2004 H.K. Page 42
A/D Histogram Test Using Sinusoidal Signals
Sinusoid
At sinusoid midpoint crossings:dv/dtà max.à least # of samples
At sinusoid amplitude peaks:dv/dtà min.à highest # of samples
ADCInput/Output
Dig
ital O
utpu
t
Analog input
Tim
e
# of
Sam
ples
Per
cod
e
EECS 247 Lecture 12: Data Converters © 2004 H.K. Page 43
After Correction for Sinusoidal pdf
0 500 1000 1500 2000 2500 3000 3500 40000
0.2
0.4
0.6
0.8
1
1.2
1.4x 10
-3 Linearized Histogram
EECS 247 Lecture 12: Data Converters © 2004 H.K. Page 44
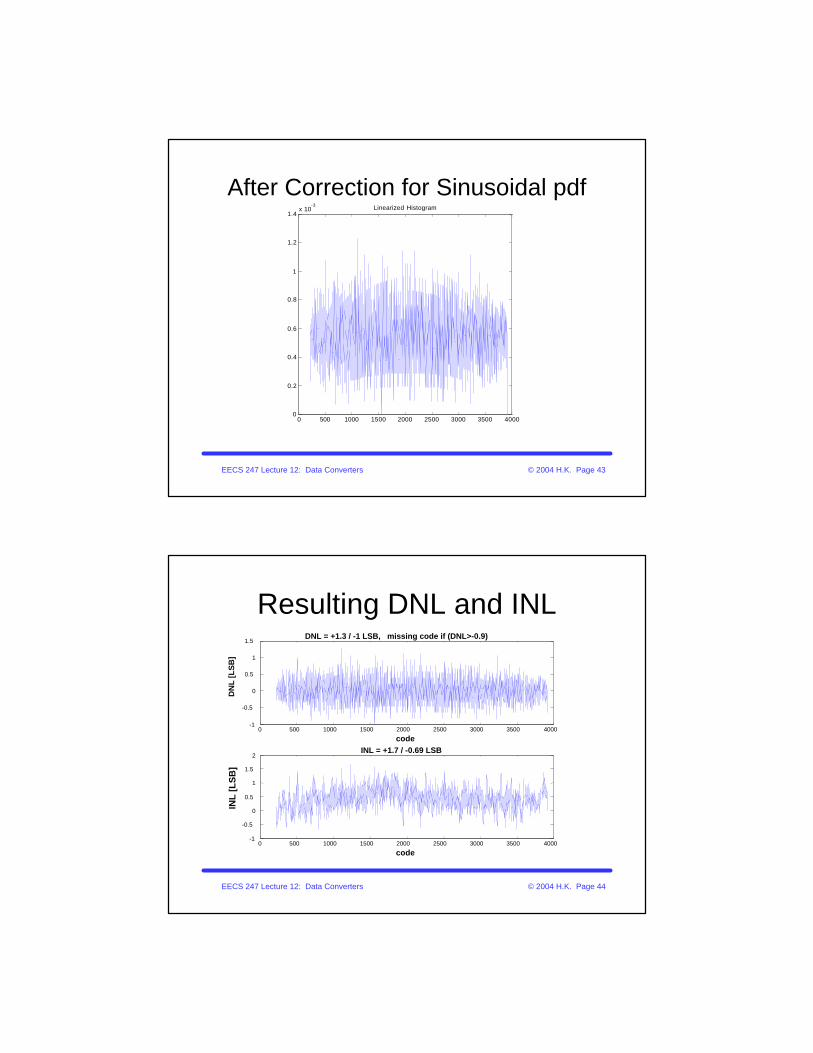
Resulting DNL and INL
0 500 1000 1500 2000 2500 3000 3500 4000-1
-0.5
0
0.5
1
1.5
code
DN
L [
LS
B]
DNL = +1.3 / -1 LSB, missing code if (DNL>-0.9)
0 500 1000 1500 2000 2500 3000 3500 4000-1
-0.5
0
0.5
1
1.5
2
code
INL
[L
SB
]
INL = +1.7 / -0.69 LSB

EECS 247 Lecture 12: Data Converters © 2004 H.K. Page 45
Correction for Sinusoidal pdf
• References:– [1] M. V. Bossche, J. Schoukens, and J. Renneboog,
“Dynamic Testing and Diagnostics of A/D Converters,” IEEE Transactions on Circuits and Systems, vol. CAS-33, no. 8, Aug. 1986.
– [2] IEEE Standard 1057
• Is it necessary to know the exact amplitude and offset of sine input? No!
EECS 247 Lecture 12: Data Converters © 2004 H.K. Page 46
DNL/INL Code
function [dnl,inl] = dnl_inl_sin(y);%DNL_INL_SIN% dnl and inl ADC output% input y contains the ADC output% vector obtained from quantizing a% sinusoid
% Boris Murmann, Aug 2002% Bernhard Boser, Sept 2002
% histogram boundariesminbin=min(y);maxbin=max(y);
% histogramh = hist(y, minbin:maxbin);
% cumulative histogramch = cumsum(h);
% transition levelsT = -cos(pi*ch/sum(h));
% linearized histogramhlin = T(2:end) - T(1:end-1);
% truncate at least first and last % bin, more if input did not clip ADCtrunc=2;hlin_trunc = hlin(1+trunc:end-trunc);
% calculate lsb size and dnllsb= sum(hlin_trunc) / (length(hlin_trunc));dnl= [0 hlin_trunc/lsb-1];misscodes = length(find(dnl<-0.9));
% calculate inlinl= cumsum(dnl);
EECS 247 Lecture 12: Data Converters © 2004 H.K. Page 47
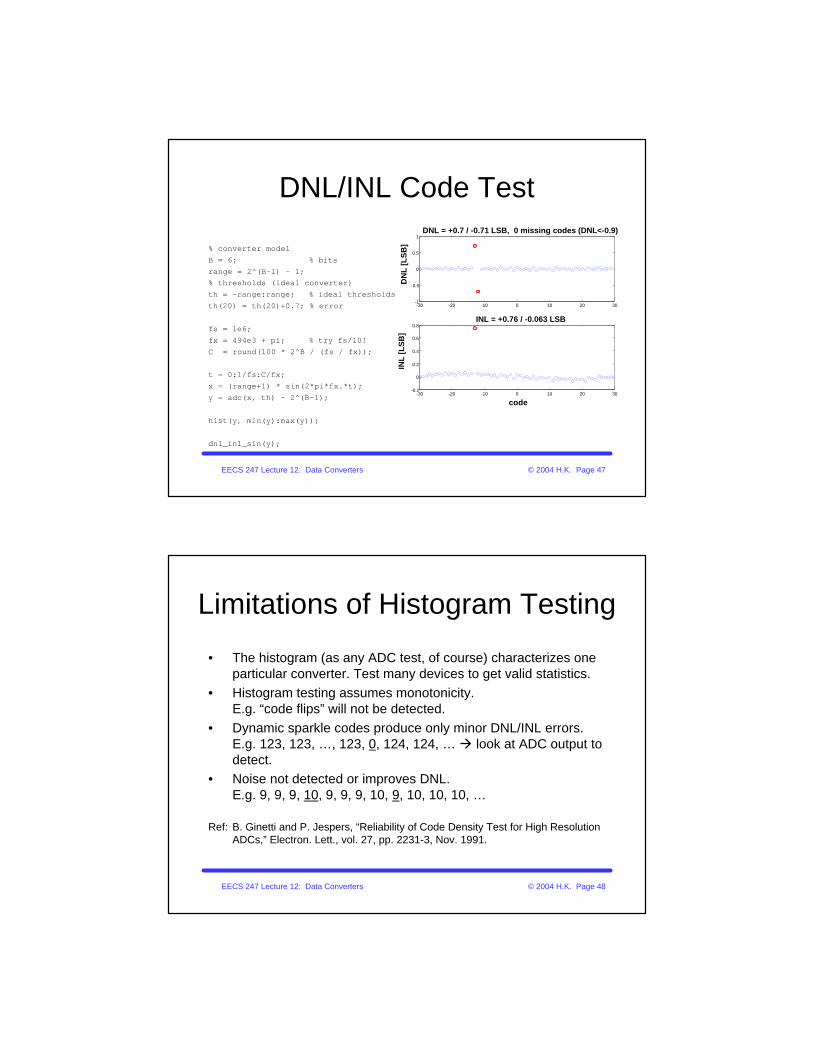
DNL/INL Code Test
% converter modelB = 6; % bitsrange = 2^(B-1) - 1;% thresholds (ideal converter)th = -range:range; % ideal thresholdsth(20) = th(20)+0.7; % error
fs = 1e6;fx = 494e3 + pi; % try fs/10!C = round(100 * 2^B / (fs / fx));
t = 0:1/fs:C/fx;x = (range+1) * sin(2*pi*fx.*t);y = adc(x, th) - 2^(B-1);
hist(y, min(y):max(y));
dnl_inl_sin(y);
-30 -20 -10 0 10 20 30-1
-0.5
0
0.5
1
codeD
NL
[L
SB
]
DNL = +0.7 / -0.71 LSB, 0 missing codes (DNL<-0.9)
-30 -20 -10 0 10 20 30-0.2
0
0.2
0.4
0.6
0.8
INL
[L
SB
]
INL = +0.76 / -0.063 LSB
EECS 247 Lecture 12: Data Converters © 2004 H.K. Page 48
Limitations of Histogram Testing
• The histogram (as any ADC test, of course) characterizes one particular converter. Test many devices to get valid statistics.
• Histogram testing assumes monotonicity.E.g. “code flips” will not be detected.
• Dynamic sparkle codes produce only minor DNL/INL errors.E.g. 123, 123, …, 123, 0, 124, 124, … à look at ADC output to detect.
• Noise not detected or improves DNL. E.g. 9, 9, 9, 10, 9, 9, 9, 10, 9, 10, 10, 10, …
Ref: B. Ginetti and P. Jespers, “Reliability of Code Density Test for High Resolution ADCs,” Electron. Lett., vol. 27, pp. 2231-3, Nov. 1991.

EECS 247 Lecture 12: Data Converters © 2004 H.K. Page 49
Hiding Problems in the Noise
• INL à 5 missing codes
• DNL "smeared out" by noise!
• Always look at both DNL/INL
• INL usually does not lie... [Source: David Robertson, Analog Devices]
EECS 247 Lecture 12: Data Converters © 2004 H.K. Page 50
Why Additional Tests/Metrics?
• Static testing does not tell the full story– E.g. no info about "noise"
• Frequency dependence (fs and fin) ?– In principle we can vary fs and fin when performing
histogram tests– Result of such sweeps is usually not very useful– Hard to separate error sources, ambiguity– Typically we use fs=fsNOM and fin << fs/2 for
histogram tests• For additional infoà Spectral testing

EECS 247 Lecture 12: Data Converters © 2004 H.K. Page 51
Direct ADC-DAC Test
• Need DAC with much better performance compared to ADC under test
• Actually a good way to "get started"...
ADCVin Vout
DACSpecrumAnalyzer
SignalGenerator
ClockGenerator
Device Under Test (DUT)
EECS 247 Lecture 12: Data Converters © 2004 H.K. Page 52
DFT Test
ADCVin PCSignal
Generator
ClockGenerator
Device Under Test (DUT)
DataAcquisition
System
EECS 247 Lecture 12: Data Converters © 2004 H.K. Page 53
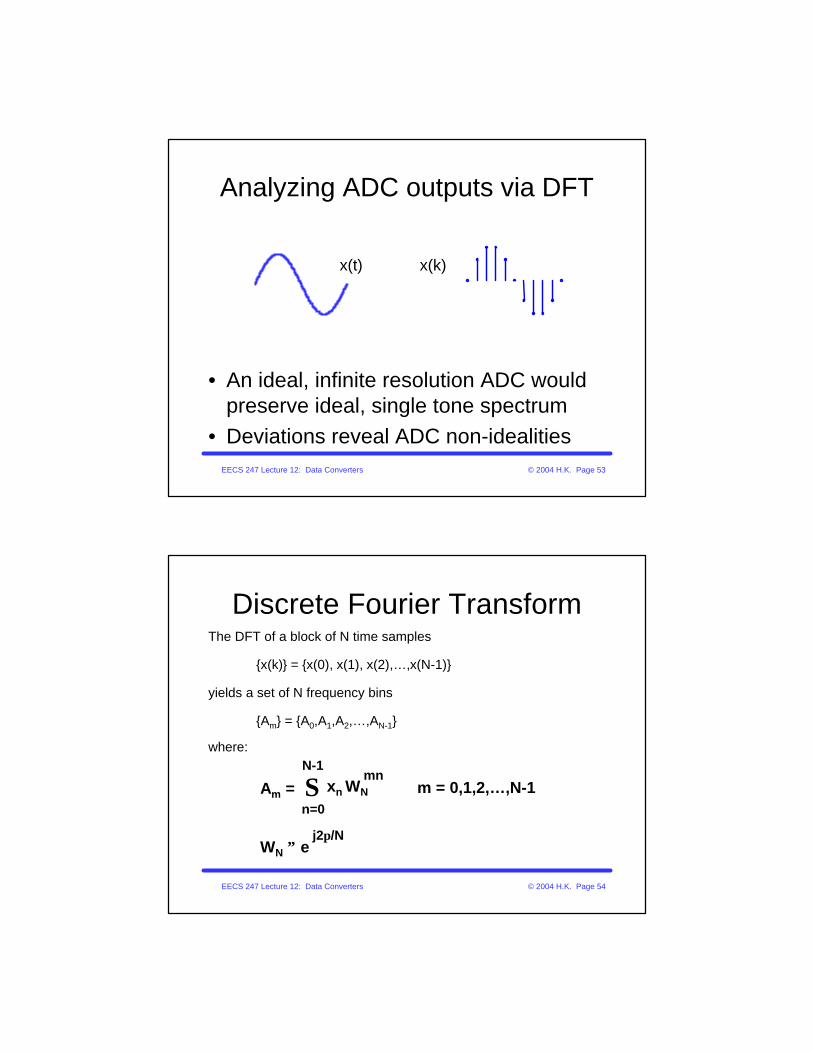
Analyzing ADC outputs via DFT
• An ideal, infinite resolution ADC would preserve ideal, single tone spectrum
• Deviations reveal ADC non-idealities
⇒x(t) x(k)
EECS 247 Lecture 12: Data Converters © 2004 H.K. Page 54
Discrete Fourier TransformThe DFT of a block of N time samples
{x(k)} = {x(0), x(1), x(2),…,x(N-1)}
yields a set of N frequency bins
{Am} = {A0,A1,A2,…,AN-1}
where:
Am = Σn=0
N-1
xn WNmn
m = 0,1,2,…,N-1
WN ≡ ej2π/N
EECS 247 Lecture 12: Data Converters © 2004 H.K. Page 55
DFT Properties
• DFT of N samples spaced T=1/fsseconds:– N frequency bins– Bin m represents frequencies at m * fs/N
[Hz]
• DFT frequency resolution:– Proportional to 1/(NT) in [Hz/bin]
EECS 247 Lecture 12: Data Converters © 2004 H.K. Page 56
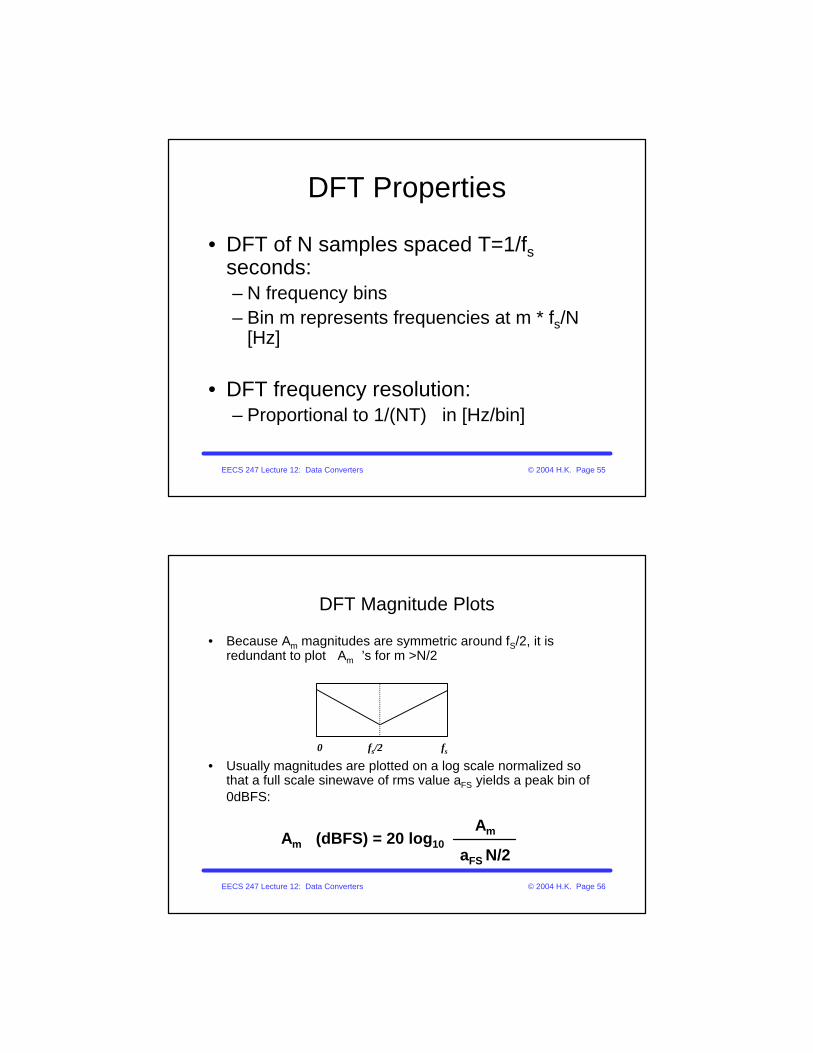
DFT Magnitude Plots
• Because Am magnitudes are symmetric around fS/2, it is redundant to plot Am’s for m >N/2
• Usually magnitudes are plotted on a log scale normalized so that a full scale sinewave of rms value aFS yields a peak bin of 0dBFS:
Am (dBFS) = 20 log10
Am
aFS N/2
0 fs/2 fs
EECS 247 Lecture 12: Data Converters © 2004 H.K. Page 57
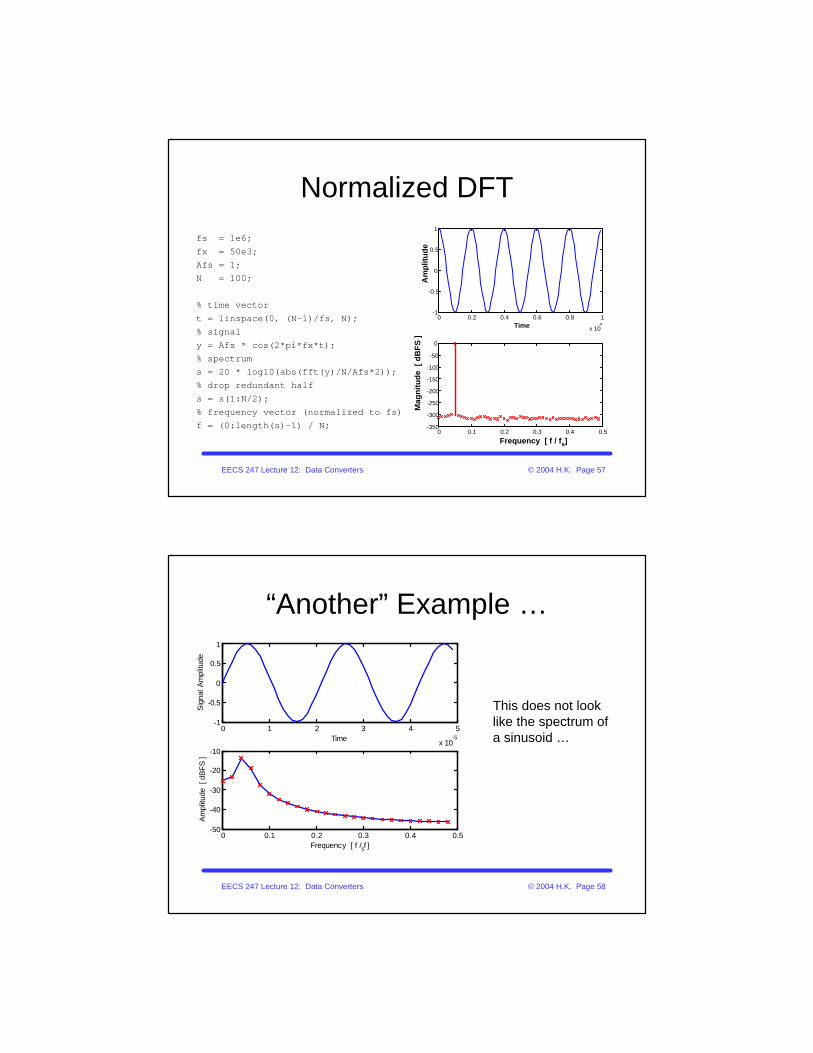
Normalized DFTfs = 1e6;fx = 50e3;Afs = 1;N = 100;
% time vectort = linspace(0, (N-1)/fs, N);% signaly = Afs * cos(2*pi*fx*t);% spectrums = 20 * log10(abs(fft(y)/N/Afs*2));% drop redundant halfs = s(1:N/2);% frequency vector (normalized to fs)f = (0:length(s)-1) / N;
0 0.2 0.4 0.6 0.8 1
x 10-4
-1
-0.5
0
0.5
1
Time
Am
plit
ud
e0 0.1 0.2 0.3 0.4 0.5
-350
-300
-250
-200
-150
-100
-50
0
Frequency [ f / fs]
Mag
nit
ud
e [
dB
FS
]
EECS 247 Lecture 12: Data Converters © 2004 H.K. Page 58
“Another” Example …
This does not look like the spectrum of a sinusoid …
0 1 2 3 4 5
x 10-5
-1
-0.5
0
0.5
1
Time
Sig
nal A
mpl
itude
0 0.1 0.2 0.3 0.4 0.5-50
-40
-30
-20
-10
Frequency [ f / fs ]
Am
plitu
de [
dB
FS ]

EECS 247 Lecture 12: Data Converters © 2004 H.K. Page 59
DFT Periodicity• The DFT implicitly assumes that
time sample blocks repeat every N samples
• With a non-integral number of periods periods within our observation window, the input yields a huge amplitude/phase discontinuity at the block boundary
• This energy spreads into all frequency bins as “spectral leakage”
• Spectral leakage can be eliminated by either– An integral number of sinusoids in
each block– Windowing
0 0.2 0.4 0.6 0.8 1 1.2 1.4
x 10-4
-1
-0.5
0
0.5
1
Time
Sig
nal A
mpl
itude
0 0.2 0.4 0.6 0.8 1 1.2 1.4
x 10-4
-1
-0.5
0
0.5
1
TimeS
igna
l Am
plitu
de
EECS 247 Lecture 12: Data Converters © 2004 H.K. Page 60
Integral Number of Periods
fs = 1e6;
% number of full cycles in testcycles = 67;
% power of 2 speeds up analysis% but make N/cycles non-integer! N = 2^10;
% signal frequencyfx = fs*cycles/N
0 0.1 0.2 0.3 0.4 0.5-350
-300
-250
-200
-150
-100
-50
0
50
Frequency [ f / fs ]
Am
plitu
de
[ dB
]