Embed Size (px)
Citation preview

Martin Oost
December 2016
Faculty of Behavioural, Management and Social Sciences
University of Twente
Effect of Electoral Systems on the Quality of Political Representation
Abstract:
Legislatures as elected institutions are expected to provide the voices of citizens in the
policymaking process. In order to determine the extent that electoral systems affect the quality
of political representation, we conducted a cross-sectional study. Legislative elections in free
democracies were sampled and measures of many-to-many congruence were constructed to
test the ideological preferences of citizens and representatives for similarity on the left-right
issue dimension. Results indicated that electoral systems indirectly affect the quality of
political representation, whilst controlled for the effect of the number of parliamentary
parties, the evidence is marginal. For the benefit of making inferences about the direct effect
of electoral systems, there might be a need for longitudinal data collection and further
research on a more comprehensive conceptualization for electoral systems.
Table of Contents
1. Introduction 1
2. Theory 3
2.1 Views on Political Representation
2.1.1 Quality of Political Representation: Focus on Substance 4
2.1.2 Substantive Representation as a Many-to-Many Relationship
2.2 Electoral Systems 6
2.2.1 Electoral Mechanisms Affecting Proportionality 7
2.3 Connections Between Proportionality, Number of Parties, and Congruence 8
3. Method 11
3.1 Sampling Legislative Elections in Free Democracies
3.2 Conceptualizing Electoral Systems: Proportionality 12
3.3 Conceptualizing Quality of Political Representation: Many-to-Many Congruence
3.3.1 Positioning Parliamentary Parties on the Left-Right Scale 13
3.3.2 Positioning Voters and Non-Voters on the Left-Right Scale 14
3.3.3 Measuring Many-to-Many Congruence
4. Results 16
4.1 Election Specific Characteristics and Calculations
4.2 Assumptions for Regression Analysis 17
4.3 Regression Results
5. Discussion 19
References
Appendix A: Assessing Assumptions for Regression Analysis
0
1. Introduction
In democratic countries with an open political elite, nourished within a context of education
and the availability of many informational sources in which democratic representation implies
competitive elections and related democratic processes that systematically induce substantive
linkages between voters and their representatives, citizens can develop preferences about
policy directions and should be able to assess the performance and either change their minds
about policy or penalize the policymakers (Powell, 2014, pp. 4-6).
According to Powell (2010), the election of representatives “is the essential institution
that systematically induces policymakers to take account of what the people want in national
policymaking” (p. 225). Legislatures as elected institutions are expected to provide the voices
of citizens in the policymaking process, so a common assumption among political scholars is
that these voices should correspond to the votes that parties receive in elections (p. 232).
One way to evaluate this correspondence is through the ‘mechanical aspect of
representation’ by measuring the ‘process of vote-seat translation’ (Golder & Stramski, 2010,
p. 98), thereby distinguishing proportional (i.e. close vote-seat ratio) and disproportional (i.e.
distant vote-seat ratio) electoral systems. Though, measures of proportionality insufficiently
estimate how well the citizenry as a whole is represented inasmuch as the scores do not
capture the preferences of citizens who did not cast a vote. Withal, measures of
proportionality do not hold the ‘strategic aspect of representation’ in that the ‘process of
preference-vote translation’ is not assessed (Golder & Stramski, 2010, pp. 91-92, 95, 98).
Proportional electoral systems do not inherently have higher quality of political
representation than disproportional systems. Dolny and Babos (2015) referred to Powell who
proposed to examine the linkage between citizens and representatives by way of ‘ideological
congruence’ via ‘substantive representation’, whereas “the study of left-right congruence
between electors and representatives is crucial to understanding the quality of political
representation” (pp. 3-5). Golder and Stramski (2010) introduced with emphasis on “the ideal
of having a legislature that accurately reflects the ideological preferences of the citizenry as a
whole” (p. 104), ‘many-to-many congruence’ as a conceptualization for substantive
representation (p. 95). Many-to-many congruence captures the variance in the ideological
preferences of many citizens (i.e. voters and non-voters) and policy positions of many
representatives (i.e. incumbents and non-incumbents) by means of evaluating similarity
1
between their preferences on the left-right issue dimension (i.e. scale ranging from ‘0’ to ‘10’)
(pp. 96, 104-105).
Citizens’ preferences influence policy through elections that are facilitated by electoral
systems (Blais & Massicotte, 2002, p. 40; Ezrow, 2010, p. 3). Scholars who conceptualized
electoral systems as certain electoral mechanisms, mostly used the classification by electoral
formula: ‘majoritarian’, ‘proportional representation’, and ‘mixed’ (Bormann & Golder, 2013,
p. 361). Nonetheless, more mechanisms are considered part of electoral systems (Gallagher &
Mitchell, 2005; Lijphart, 2012; Norris, 2004). While not judged appropriate for
conceptualizing political representation, measures of proportionality that are directly
influenced by four mechanical sources: ‘electoral formula’, ‘district magnitude’,
‘malapportionment’, and ‘electoral threshold’ (Gallagher, 1991, p. 43), became of particular
utility to conceptualize electoral systems.
Electoral mechanisms exert influence on proportionality and the number of parties
(Lijphart, 2012, p. 144; Norris, 2004, p. 211). In this regard, Ezrow (2010) found evidence
that electoral systems are influential with respect to the level of niche party competition that
“in turn has dramatic implications for the way in which representation works” (p. 119).
However, although the number of parliamentary parties is not integral part of electoral
systems, most studies neglected to account for its effect on the quality of representation. As a
consequence, these studies made inferences about the ‘indirect’ effect of electoral systems;
like Golder and Stramski (2010) who combined ‘Duverger’s law’ and ‘Downs’ theory of party
competition’ to explain the link between electoral system proportionality and many-to-many
congruence (pp. 99-100), and found highly significant coefficients (pp. 103-104). Yet mere
evidence exists that electoral systems ‘directly’ affect the quality of political representation.
In order to determine the extent that electoral systems affect the quality of political
representation, we will conduct a cross-sectional study. This study proceeds as follows: first,
the conceptualizations of ‘quality of representation’ as ‘many-to-many congruence’ and
‘electoral systems’ as ‘proportionality’ are discussed and justified; second, the measurement
of many-to-many congruence for recent legislative elections in democratic states is explained;
and third, the extent to which proportionality (in)directly predicts levels of many-to-many
congruence is scrutinized.
2
2. Theory
2.1 Views on Political Representation
The meaning of representation has “very different applications depending on what is being
made present or considered present, and in what circumstances” (Pitkin, 1967, p. 10). Often
referred to as ‘the paradox of representation’ (i.e. being present, while not being present, to be
represented), representation has developed into an etymological ambiguous concept.
To accommodate the paradoxical requirements, Pitkin termed the ‘non-objection
criteria’ that is met if the represented who is absent does not object to the representative’s do’s
or don’ts; the “presence [in parliament] comes from the ability of individuals to object to what
is done in their name” (Runciman, 2007, p. 95). Most political decisions are made by a
majority in which some individuals who did object are overruled, so political representation
requiring the non-objection criteria is difficult to claim. Runciman (2007) argued that in
acceptance that groups act “through the wishes of the majority of their members, then it
would follow that the outvoted minority are still being represented as members of the group”
(p. 101), and the representation of citizens is expected to cease if enough individuals object
(i.e. by vote) to what is done in their name (pp. 100-102).
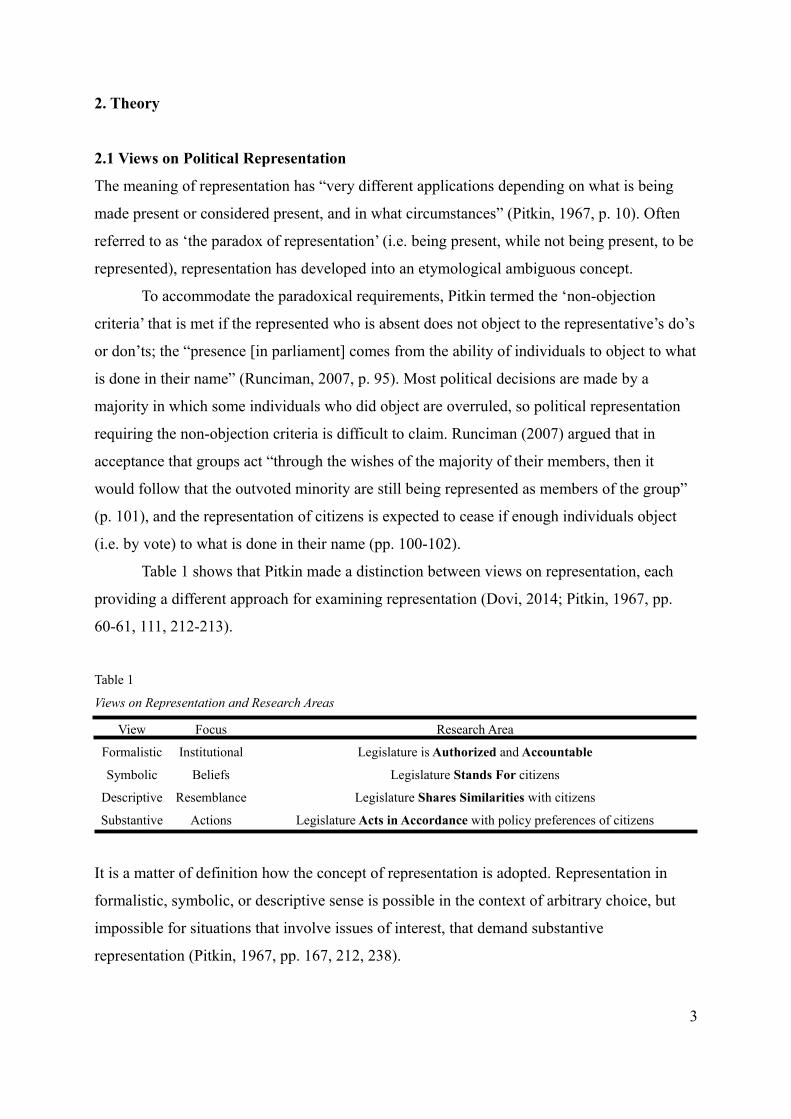
Table 1 shows that Pitkin made a distinction between views on representation, each
providing a different approach for examining representation (Dovi, 2014; Pitkin, 1967, pp.
60-61, 111, 212-213).
Table 1
Views on Representation and Research Areas
View Focus Research Area
Formalistic Institutional Legislature is Authorized and Accountable
Symbolic Beliefs Legislature Stands For citizens
Descriptive Resemblance Legislature Shares Similarities with citizens
Substantive Actions Legislature Acts in Accordance with policy preferences of citizens
It is a matter of definition how the concept of representation is adopted. Representation in
formalistic, symbolic, or descriptive sense is possible in the context of arbitrary choice, but
impossible for situations that involve issues of interest, that demand substantive
representation (Pitkin, 1967, pp. 167, 212, 238).
3
2.1.1 Quality of Political Representation: Focus on Substance
Pitkin described substantive representation as: “the activity of representatives; that is, the
actions taken on the behalf of, in the interest of, as an agent of, and as a substitute for the
represented” (Dovi, 2014), in which the ‘substance’ as guiding principle of the activity of
representing is to ‘promote the represented interests’ (Pitkin, 1967, pp. 118, 155).
Compared to the formalistic, symbolic, and descriptive views on representation, Pitkin
(1967) argued that substantive representation is “by far the most difficult” (p. 118) to
comprehend, because “this concept supplies us with standards for judging the representative's
action” (p. 142); like a representative who is assumed to act for the represented but as a
member of the legislature is also supposed to pursue the national interest (pp. 215-216).
According to Pitkin (1967), each view on representation is not a substitute to other
views, but an additive (p. 111). Accurate substantive representation not necessarily
means good representation because it does not hold conditions like representatives who have
“to act after authorization or to act before being held to account” (i.e. formalistic) (p. 59), nor
at “working on the minds of those who are to be represented or who are to be the audience
accepting [to be represented]” (i.e. symbolic) (p. 111), and neither at “parliamentary
representatives [who] are substitutes for the rest of the people” (i.e. descriptive) (p. 85).
While the descriptive view on representation could be adopted for studying
representation of certain segments within a population (e.g. women) as for determining single
issue correspondence (e.g. welfare spending), Pitkin argued that “an over-emphasis upon the
composition of political bodies [as regards the descriptive view on representation] prevents a
proper focus upon the activity of representation” … “political representation should be
conceived of in a substantive way, defining it as acting in the interest of the represented, in a
manner responsive to them” (Celis & Childs, 2008, p. 419). Representation focused on
interest “gives greater weight to the activities of citizens in seeking to understand, clarify, and
achieve their preferences than do alternative models of representations”, and should therefore
be “the starting point in a democratic view” (Plotke, 1997, p. 32).
2.1.2 Substantive Representation as a Many-to-Many Relationship
Powell (2014) stated that “good congruence between the preferences of citizens and the
positions of those who represent them in making policies is a measure of good substantive
4
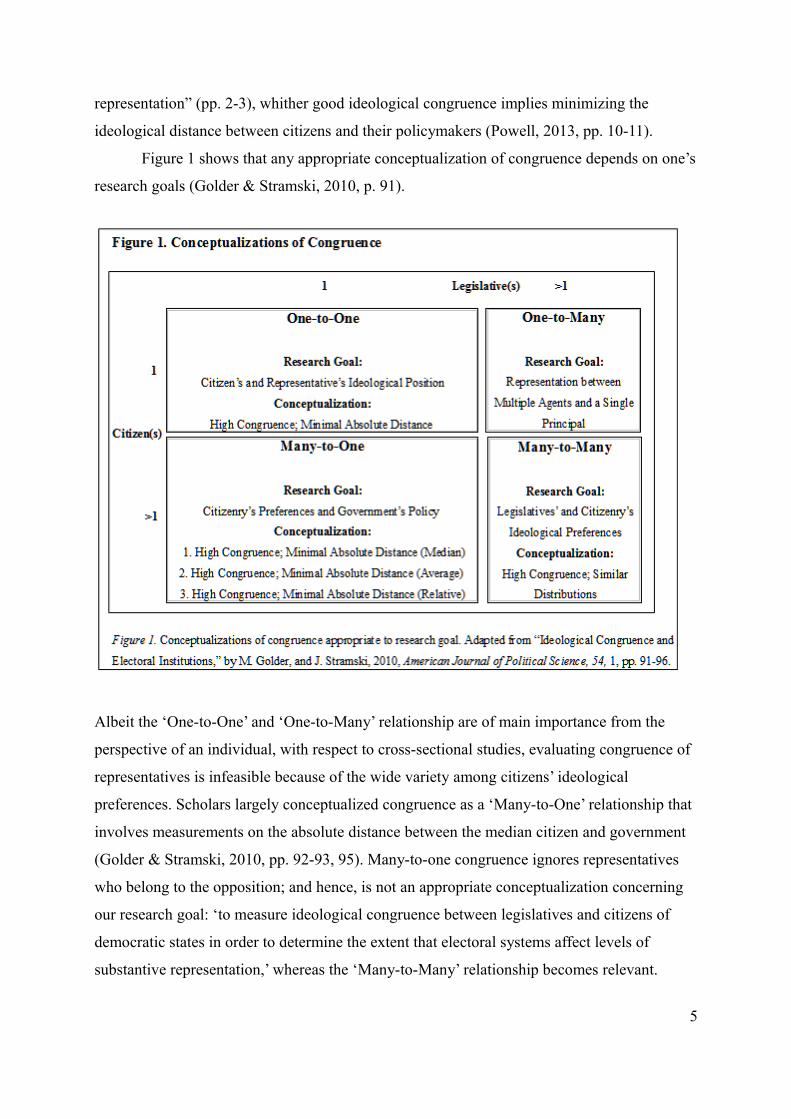
representation” (pp. 2-3), whither good ideological congruence implies minimizing the
ideological distance between citizens and their policymakers (Powell, 2013, pp. 10-11).
Figure 1 shows that any appropriate conceptualization of congruence depends on one’s
research goals (Golder & Stramski, 2010, p. 91).
Albeit the ‘One-to-One’ and ‘One-to-Many’ relationship are of main importance from the
perspective of an individual, with respect to cross-sectional studies, evaluating congruence of
representatives is infeasible because of the wide variety among citizens’ ideological
preferences. Scholars largely conceptualized congruence as a ‘Many-to-One’ relationship that
involves measurements on the absolute distance between the median citizen and government
(Golder & Stramski, 2010, pp. 92-93, 95). Many-to-one congruence ignores representatives
who belong to the opposition; and hence, is not an appropriate conceptualization concerning
our research goal: ‘to measure ideological congruence between legislatives and citizens of
democratic states in order to determine the extent that electoral systems affect levels of
substantive representation,’ whereas the ‘Many-to-Many’ relationship becomes relevant.
5

Measuring congruence between the ideological positions of representatives and substantive
preferences of citizens, “requires evaluating how similar the distributions of citizen and
representative preferences are on the left-right issue dimension” (Golder & Stramski, 2010, p.
96). Moreover, Cox (1990) noted that the left-right dimension is applicable due to its
unidimensional scale (i.e. from ‘0’ to ‘10’) for approximating many countries, and that in
multidimensional politics the degree of ideological preferences of legislatives is “not one of
the things that changes radically with the dimensionality of the policy space” (p. 908).
2.2 Electoral Systems
Ezrow (2010) argued that the most straightforward way how citizens’ preferences influence
policy is through voting in elections (p. 3). Elections are facilitated by an electoral system that
signifies “one important set of electoral rules that defines how votes are cast and seats
allocated” (Blais & Massicotte, 2002, p. 40). The most common options to conceptualize
electoral systems is by its mechanisms or by measures of proportionality (Carter & Farrell,
2010, pp. 25-26).
Table 2 shows the mechanisms that are considered part of electoral systems (Gallagher
& Mitchell, 2005; Lijphart, 2012; Norris, 2004).
Table 2
Overview of Electoral Mechanisms
Mechanism Description
Electoral Formula How votes are counted and allocated into parliamentary seats
District Magnitude Number of seats per district
Malapportionment District magnitudes that are not in constant ratio with the voting population
Electoral Threshold Minimum amount of votes needed by a party to secure a parliamentary seat
Size of Assembly Total number of parliamentary seats
Presidential Elections Influence on legislative elections due to tendency of voting for presidential party
Inter-Party Links Vote aggregation among separately listed parties
Conceptualizing electoral systems by any electoral mechanism falls short in capturing the
wide variety of mechanisms among and within electoral systems. Instead, we put our attention
on measures of proportionality, depicting the difference between parties’ shares of the votes
and their shares of the seats (Gallagher & Mitchell, 2005, p. 602).
6
2.2.1 Electoral Mechanisms Affecting Proportionality
Electoral mechanisms have direct effects flowing from electoral rules and the structural
conditions to which these rules consistently affect degrees of proportionality (Norris, 2004, p.
22; Lijphart, 2012, pp. 153-154). Four mechanical sources directly influence degrees of
proportionality: (1) Electoral Formula, (2) District Magnitude, (3) Malapportionment, and (4)
Electoral Threshold (Gallagher, 1991, p. 43).
First, electoral formula is the most widely used nominal conceptualization for electoral
systems. Bormann and Golder (2013) proposed a threefold classification of Majoritarian,
Proportional Representation (PR), and Mixed electoral systems (p. 361).In majoritarian
systems, candidates or parties need to win more votes than any other (i.e. plurality), or over
fifty percent of votes (i.e. majority) in order to win all respective parliamentary seats of a
particular constituency. ‘First-Past-The-Post’(FPTP) along single-member district plurality is
the most widely used electoral rule in majoritarian electoral systems (Diamond & Plattner,
2006, p. 17; Lijphart, 2012, p. 130), and is practised by voters who cast a vote in one round
for a single candidate. This design intents to concentrate legislative power in the hands of a
single-party government and simultaneously creates hurdles for smaller parties that have
diffused support (Norris, 2004, pp. 35, 42).
In PR systems, parties need to win a minimum number of required votes (i.e. List PR)
or a candidate needs to win a required quota of preferential votes (i.e. Single Transferable
Vote) (Bormann & Golder, 2013, pp. 362-363). List PR along multi-member districts is the
most widely used electoral rule in PR systems (Diamond & Plattner, 2006, p. 20; Lijphart,
2012, p. 134), and is practised by voters who cast a vote in one round for a party (i.e. closed
list), or an individual candidate (i.e. open list) from lists that are drawn up by political parties.
This design aims at sharing power between multiple political actors to maximize deliberation,
bargaining, and comprise (Norris, 2004, p. 67).
Massicotte and Blais (1999) considered electoral systems as mixed if “its mechanics
involves the combination of different electoral formulas for an election to a single body” (p.
345). Mixed systems could take advantage from both formulas by providing voters more
freedom to elect a local representative by FPTP and conjointly to elect a political party on
national level by List PR (Shugart & Wattenberg, 2001, pp. 1, 9).
Second, district magnitude implicitly determines the average number of legislative
seats corresponding to a certain constituency. It is expected that if in a plurality system district
7
magnitude increases, stronger parties are likely to win more seats and that proportionality will
decrease (Lijphart, 2012, pp. 132, 153). Due to the impossibility of distributing a single seat
to many parties, PR can only be employed in multi-member districts, and attends to produce
multi-party politics (Blais & Massicotte, 2002, p. 45; Gallagher & Mitchell, 2005, pp. 30-31,
497).
Third, malapportionment occurs whenever districts have unequal ratios of voting
populations and district magnitudes. It is hardly avoidable in majoritarian systems with single-
member districts. PR systems are associated with larger districts and varying district
magnitudes, so that parliamentary seats can be proportionally allocated. In PR systems that
have a single nationwide district, malapportionment is non-existent (Lijphart, 2012, p. 143).
And fourth, an electoral threshold determines explicitly the minimum amount of votes
that is needed by a party to secure a parliamentary seat. An effective threshold is
mathematically dependent on district magnitude, while a legal threshold could arbitrarily be
set from zero to hundred percent.
Blais and Bodet (2006) proposed the use of ‘Gallagher’s Least Squares Index’ as practical
solution for ascertaining overall degrees of disproportionality of electoral systems (p. 1250).
Gallagher (1991) advocated the index to measure disproportionality per election, and
favoured it from other indices due to the proficiency to “registers a few large discrepancies
more strongly than lot of small ones” (p. 40).
2.3 Connections Between Proportionality, Number of Parties, and Congruence
The primary consensus in political science is that an electoral system exerts influence on
proportionality and the number of parties (Carter & Farrell, 2010, p. 33; Ezrow, 2010, p. 48;
Gallagher & Mitchell, 2005, p. 21; Lijphart, 2012, p. 144; Norris, 2004, p. 211). Powell
(2013) mentioned the two most used theories among scholars: (1) Duverger’s Law and (2)
Downs’ Theory of Party Competition (p. 11).
Figure 2 displays the theoretical connections.
8
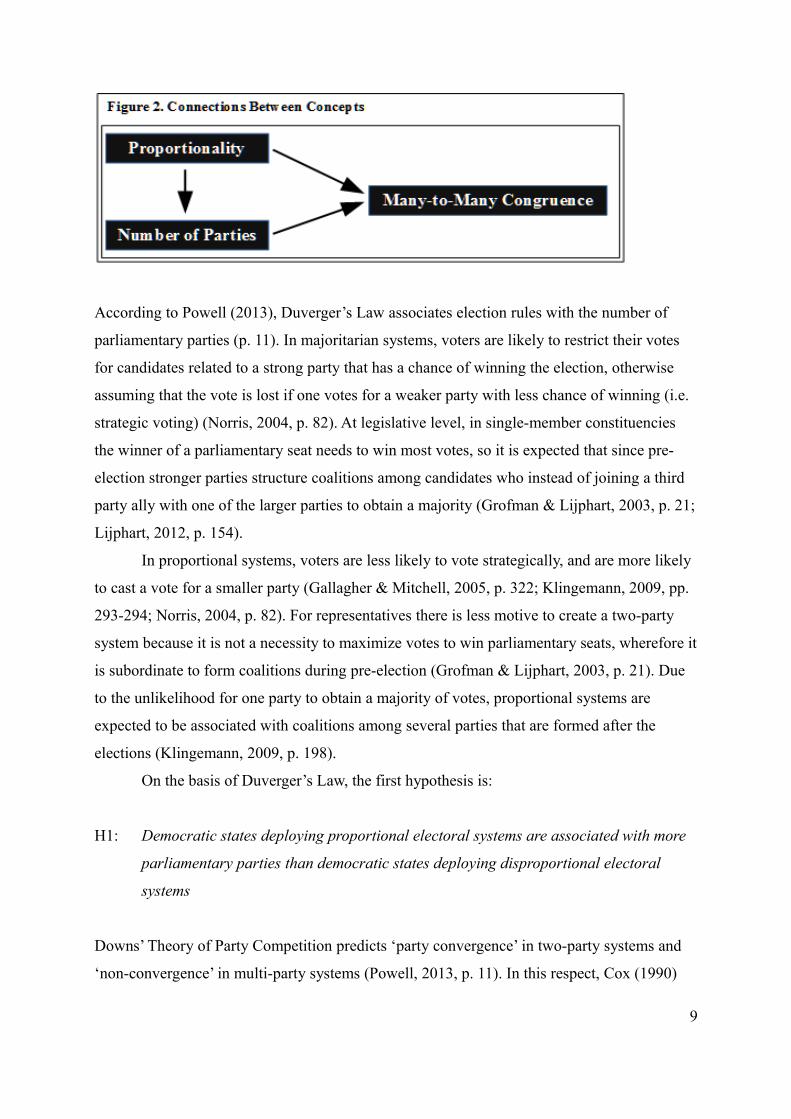
According to Powell (2013), Duverger’s Law associates election rules with the number of
parliamentary parties (p. 11). In majoritarian systems, voters are likely to restrict their votes
for candidates related to a strong party that has a chance of winning the election, otherwise
assuming that the vote is lost if one votes for a weaker party with less chance of winning (i.e.
strategic voting) (Norris, 2004, p. 82). At legislative level, in single-member constituencies
the winner of a parliamentary seat needs to win most votes, so it is expected that since pre-
election stronger parties structure coalitions among candidates who instead of joining a third
party ally with one of the larger parties to obtain a majority (Grofman & Lijphart, 2003, p. 21;
Lijphart, 2012, p. 154).
In proportional systems, voters are less likely to vote strategically, and are more likely
to cast a vote for a smaller party (Gallagher & Mitchell, 2005, p. 322; Klingemann, 2009, pp.
293-294; Norris, 2004, p. 82). For representatives there is less motive to create a two-party
system because it is not a necessity to maximize votes to win parliamentary seats, wherefore it
is subordinate to form coalitions during pre-election (Grofman & Lijphart, 2003, p. 21). Due
to the unlikelihood for one party to obtain a majority of votes, proportional systems are
expected to be associated with coalitions among several parties that are formed after the
elections (Klingemann, 2009, p. 198).
On the basis of Duverger’s Law, the first hypothesis is:
H1: Democratic states deploying proportional electoral systems are associated with more
parliamentary parties than democratic states deploying disproportional electoral
systems
Downs’ Theory of Party Competition predicts ‘party convergence’ in two-party systems and
‘non-convergence’ in multi-party systems (Powell, 2013, p. 11). In this respect, Cox (1990)
9
argued that “the number of political competitors affects the relative strength of the centripetal
and centrifugal forces in the system” (p. 904).
In systems dominated by centripetal incentives, the optimal vote-maximizing strategy
leads politicians to “converge on some centrally locate point, such as the median of the voter
distribution” (Cox, 1990, p. 927). For instance, with a view on not losing the votes of the bulk
electorate, representatives or parties are more likely to adopt policy positions that are not too
conservative or too progressive. As a result, the ideological placements of representatives are
expected to be somewhere in the middle of the left-right issue dimension.
In systems dominated by centrifugal incentives, “optimal strategies lead to a
dispersion across the ideological spectrum” (Cox, 1990, p. 927). These systems tend to
generate legislatures with a greater variety of political views, so the ideological placements of
representatives are expected to range more widely on the left-right issue dimension. By reason
of voters having more choice, congruence should increase with the number of parties (Blais &
Bodet, 2006, pp. 1243-1244, 1259).
On the basis of Downs’ Theory of Party Competition, the second hypothesis is:
H2: Democratic states deploying electoral systems associated with more parliamentary
parties have higher levels of many-to-many congruence than democratic states
deploying electoral systems associated with less parliamentary parties
Golder and Stramski (2010) combined Duverger’s and Downs’ theories to explain the indirect
link between proportionality and many-to-many congruence (pp. 99-100).
On the basis of Duverger’s Law and Downs’ Theory of Party Competition, the third
hypothesis is:
H3: Democratic states deploying proportional electoral systems have higher levels of
many-to-many ideological congruence than democratic states deploying
disproportional electoral systems
10

3. Method
3.1 Sampling Legislative Elections in Free Democracies
We conducted a cross-sectional study in which legislative elections in free democracies were
sampled and measures of many-to-many congruence were constructed to test the ideological
preferences of citizens and representatives for similarity on the left-right issue dimension. The
benefits of choosing this research design were its facilitation to compare populations of
citizens and their representatives across different democratic states, and that relationships
between several variables could be analysed at once.
We used Dataset Module 3 2006-2011 (dataset) of the Comparative Study of Electoral
Systems (CSES) that includes surveys from respondents in democratic states who placed
themselves and up to nine political parties on a 10-point left-right scale (CSES, 2013). The
left-right dimension is applicable in that ideological preferences placed on a unidimensional
scale do not change radically in case of multidimensional politics across many countries (Cox,
1990, p. 908).
In addition, assessments from Freedom House (FH); Freedom in the World (FH,
2015a) and Individual Country Ratings and Status (FH, 2015b) were used to assess if
countries were considered free democracies. In free democracies legislative elections are the
essential institutions in which representatives take account of the preferences of citizens who
in turn are able to develop preferences about policy directions of their policymakers (Powell,
2010, p. 225; Powell, 2014, pp. 4-6). Moreover, the fact that all countries can be labelled as
free democracies should increase the external validity of inferences (Goodin, 2006, p. 24).
We sampled 39 elections in next 31 democracies: Australia, Austria, Canada, Chile, Croatia,
Czech Republic, Denmark, Estonia, Finland, France, Germany, Greece, Iceland, Ireland,
Israel, Latvia, Mexico, The Netherlands, New Zealand, Norway, Peru, Poland, Portugal,
Slovakia, Slovenia, South Africa, Spain, Sweden, Switzerland, United States, and Uruguay.1
1 Due to data incompleteness, the elections of Brazil, Romania, Taiwan, Japan, and South Korea were
excluded for analysis.
11

3.2 Conceptualizing Electoral Systems: Proportionality
Table 3 shows that electoral formula as a nominal conceptualization for electoral systems
generated unequal and relatively small sample sizes.
Table 3
Mean Degrees of Proportionality by Electoral Formula
Dependent Variable Majoritarian Mixed Proportional Representation
Proportionality 90.51 (3.99) 94.76 (3.29) 95.84 (2.53)
n 4 5 30
Note. Standard deviations are reported in parentheses. Tukey post-hoc test revealed that proportionality was
significantly higher in PR systems (95.84 ± 2.53, p = .003) than in majoritarian systems (90.51 ± 3.99). There
were no significant differences between PR systems and mixed systems (p = .703), and between majoritarian and
mixed systems (p = .071). The results are available on request. Adapted from “Election Indices”, by M.
Gallagher 2015, pp. 6-39.
Because of the wide variety of electoral mechanisms among and within electoral systems
(Gallagher & Mitchell, 2005; Lijphart, 2012; Norris, 2004), we conceptualized the
independent variable, electoral systems, as proportionality to increase the internal validity of
inferences. To avoid ambiguousness in the directions of the relationships, we recalculated the
disproportionality measures from Election Indices by Gallagher (2015) into degrees of
proportionality. On a continuous scale, the conceptualization distinguishes electoral systems
with least proportional (i.e. ‘0’) and most proportional outcomes (i.e. ‘100’); in which perfect
proportionality implies that all parties obtain parliamentary seats exactly according to the
proportion of won votes by each party.
3.3 Conceptualizing Quality of Political Representation: Many-to-Many Congruence
We conceptualized the dependent variable, the quality of political representation, as many-to-
many congruence. Partisan representatives were assumed to be politically dependent and
subjected to vote on behalf of their affiliated parties, thereby acting according to their
ideological preferences. We adopted Golder and Stramski’s (2010) conceptualization for
substantive representation as many-to-many congruence; “congruence is high when the
distributions of citizens’ and representatives’ preferences are similar; it is perfect when the
two distributions are identical” (p. 96).
12
For each election we constructed levels of many-to-many congruence by means of evaluating
similarity between the distributions of citizen and representative preferences on the left-right
scale.2 In what follows, we explain how levels of many-to-many congruence were measured
by illustration of two distinctive electoral systems; the 2006 Dutch elections for a multi-party
assembly and the 2008 United States (US) elections for a two-party assembly.
3.3.1 Positioning Parliamentary Parties on the Left-Right Scale
Based on valid answers given by the respondents on question 11a-i:“in politics people
sometimes talk of left and right. Where would you place (PARTY A) on a scale from 0 to 10
where 0 means the left and 10 means the right?” (CSES, 2013), the mean party-placement
was calculated. In deviation with Golder and Stramski (2010), who included only the top 40%
of most educated respondents to reduce wrongful party-placements by the more uninformed
(p. 98), we included the top four educated groups of respondents for workable statistics.
The dataset is composed out of responses by participants who gave answers on fixed
questionnaires, so we filtered out all responses on irrelevant questions together with invalid
responses. Then, we divided the sum-total of ideological positions affiliated for each party by
the size of the sample in order to measure mean party-placement. The distance between the
(Cumulative) Distribution Functions ((C)DFs) of citizens’ and representatives’ preferences
had to be determined, necessitating the allocation of party seat shares to discrete points on the
scale (Golder & Stramski, 2010, p. 103). We reallocated the seats of the parties that had no
whole mean placement in proportion to relative closeness of the mean to its integers.
As for the Dutch elections, the CDA won 41 seats and had a mean placement of ‘6.75’,
so two integers; ‘6’ and ‘7’ are relevant. The mean is closer to ‘7’ than ‘6’; in proportion 75%
of the seats were reallocated to point ‘7’ and 25% to point ‘6’. Rounded to whole numbers, 10
seats were reallocated to point ‘6’ and 31 seats to point ‘7’ on scale. Likewise, we reallocated
11 seats to point ‘7’ and 11 seats to point ‘8’ for the VVD, and 1 seat to point ‘6’ and 1 seat to
point ‘7’ for the SGP. Amassed, 43 seats were allocated to point ‘7’ on the scale.
As for the US elections, the Democrats won 257 seats and had a mean placement of
‘4.31’, so two integers; ‘4’ and ‘5’ are relevant. The mean is closer to ‘4’ than ‘5’; in
proportion 69% of the seats were reallocated to point ‘4’ and 31% point ‘5’. Rounded to
whole numbers, 177 seats were reallocated to point ‘4’ and 80 seats to point ‘5’ on the scale.
2 This measure is related to the Kolmogorov-Smirnov test statistic applicable for determining if two one-
dimensional probability distributions are the same (Golder & Stramski, 2010, p. 97).
13
Likewise, we reallocated 119 seats to point ‘6’ and 59 seats to point ‘7’ for the Republican
party. Amassed, 59 seats were allocated to point ‘7’ on the scale.
Hereupon, we divided the number of allocated seats per discrete integer point by the
total number of seats to calculate the DFs. With regard to point ‘7’ on the scale, a DF of
29.05% (i.e. 43/148 multiplied by 100%) and 13.56% (i.e. 59/435 multiplied by 100%)
resulted for the Dutch and US elections, respectively.
3.3.2 Positioning Voters and Non-Voters on the Left-Right Scale
On the basis of question 13: “where would you place yourself on this scale?” (CSES, 2013),
the DFs for self-placement were calculated. On account of including the citizenry as a whole,
we included all respondents with valid answers on question 13. Because each respondent
could place one self chosen preferential placement on the scale, frequencies were allocated to
discrete integer points on the same left-right scale as for party-placement.
As for the Dutch and US elections, respectively 409 out of 2203 and 205 out of 1889
respondents placed themselves to point ‘7’ on the scale. As a result, a DF of 18.57% was
calculated for the Dutch elections, and a DF of 10.85% for the US elections.
3.3.3 Measuring Many-to-Many Congruence
We subtracted the CDFs of party-placement from the CDFs of self-placement. In line with
Andeweg (2010), the lowest percentages were enumerated for each point on the scale,
emanating the overlap between the distributions of party-placement and self-placement as a
measure of many-to-many congruence.
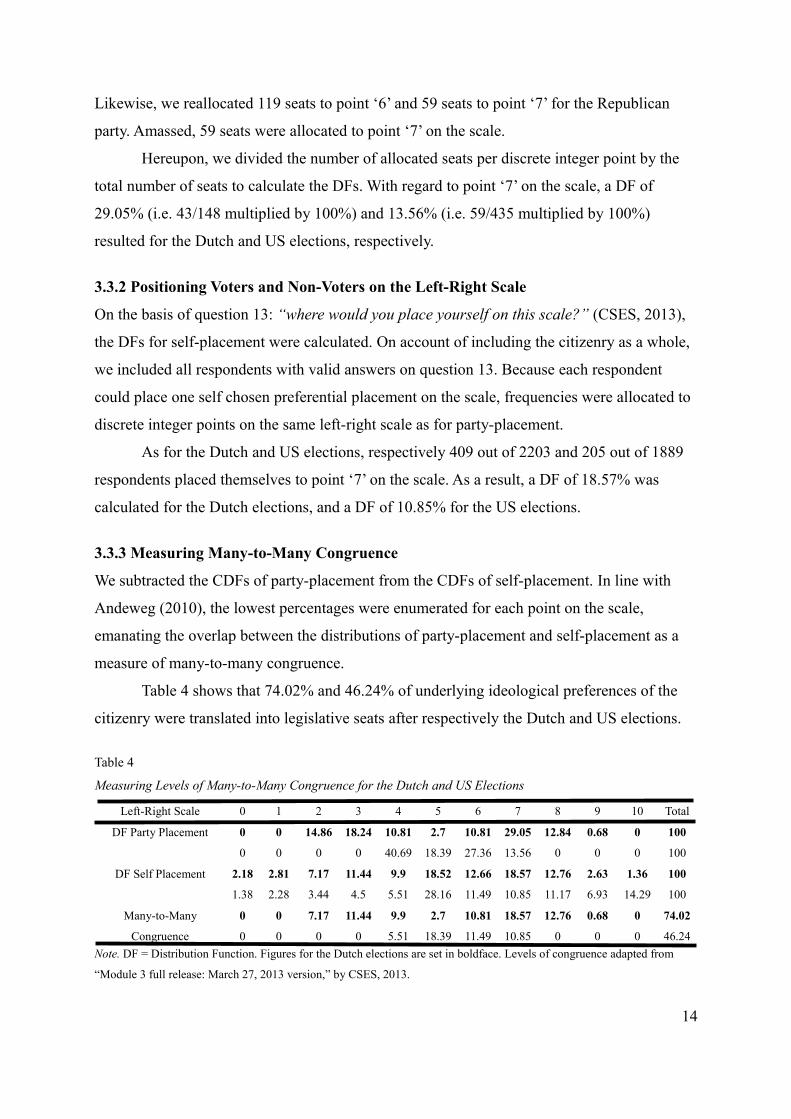
Table 4 shows that 74.02% and 46.24% of underlying ideological preferences of the
citizenry were translated into legislative seats after respectively the Dutch and US elections.
Table 4
Measuring Levels of Many-to-Many Congruence for the Dutch and US Elections
Left-Right Scale 0 1 2 3 4 5 6 7 8 9 10 Total
DF Party Placement 0
0
0
0
14.86
0
18.24
0
10.81
40.69
2.7
18.39
10.81
27.36
29.05
13.56
12.84
0
0.68
0
0
0
100
100
DF Self Placement 2.18
1.38
2.81
2.28
7.17
3.44
11.44
4.5
9.9
5.51
18.52
28.16
12.66
11.49
18.57
10.85
12.76
11.17
2.63
6.93
1.36
14.29
100
100
Many-to-Many
Congruence
0
0
0
0
7.17
0
11.44
0
9.9
5.51
2.7
18.39
10.81
11.49
18.57
10.85
12.76
0
0.68
0
0
0
74.02
46.24
Note. DF = Distribution Function. Figures for the Dutch elections are set in boldface. Levels of congruence adapted from
“Module 3 full release: March 27, 2013 version,” by CSES, 2013.
14
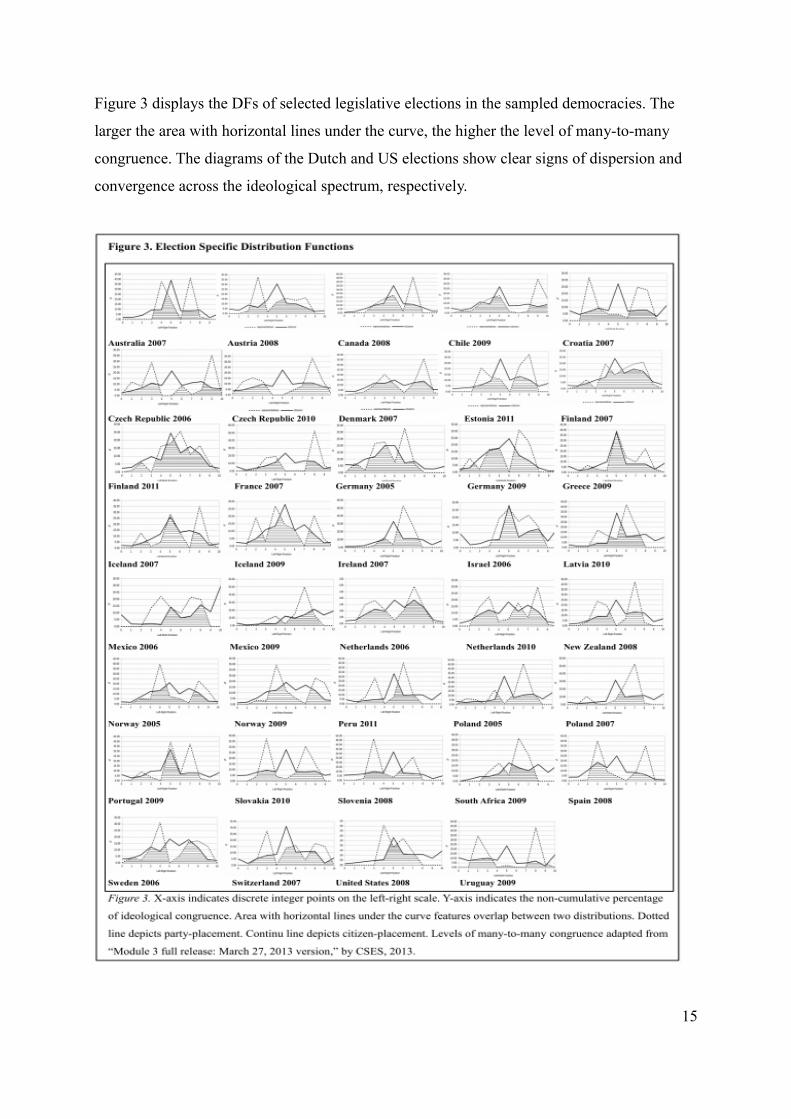
Figure 3 displays the DFs of selected legislative elections in the sampled democracies. The
larger the area with horizontal lines under the curve, the higher the level of many-to-many
congruence. The diagrams of the Dutch and US elections show clear signs of dispersion and
convergence across the ideological spectrum, respectively.
15
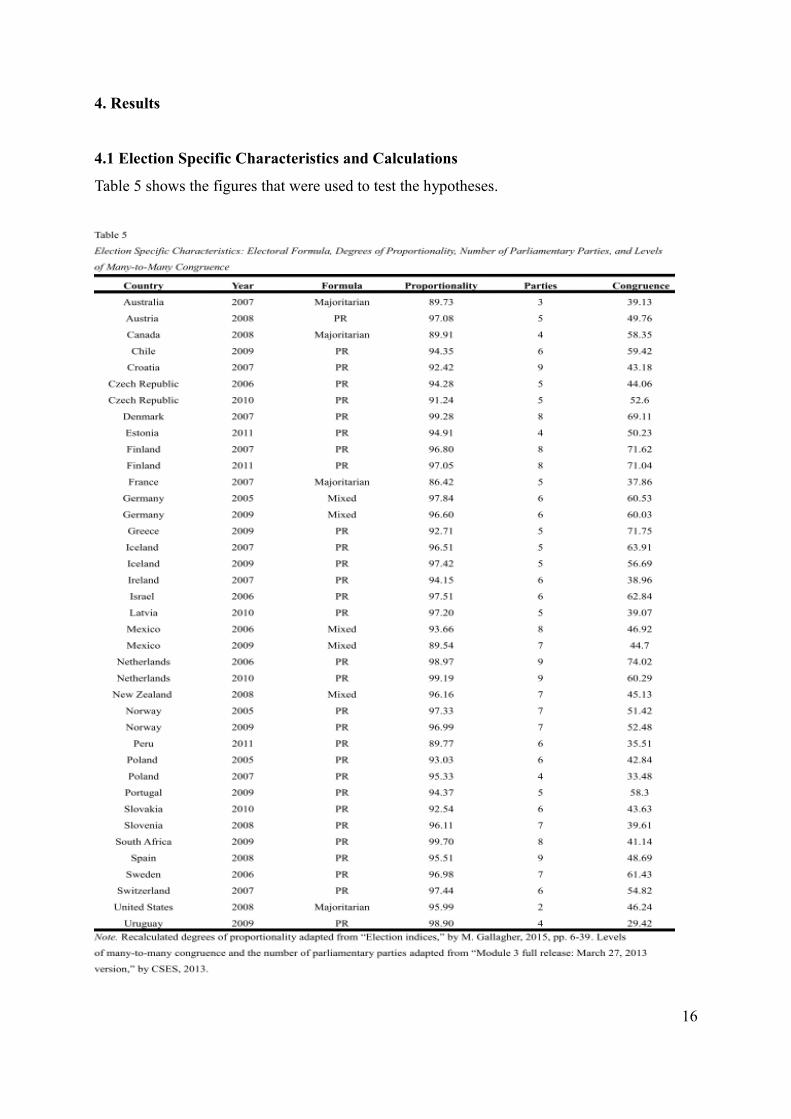
4. Results
4.1 Election Specific Characteristics and Calculations
Table 5 shows the figures that were used to test the hypotheses.
16

4.2 Assumptions for Regression Analysis
Table 6 shows the assumptions that have to be met in order to make valid inferences
concerning regression analysis. If required, the assessments are included in Appendix A.
Table 6
Linear Regression Analysis: Assessment and Indication of Assumptions
Assumption Description Assessment Indication
Linearity Independent variables and
dependent variable have a linear
relationship
Scatterplot Proportionality: moderate and positive
Number of Parties: moderate and positive
Normality Data of variables are normally
distributed
Q-Q Plot Proportionality: weak
Number of Parties: strong
Many-to-Many Congruence: weak
Homoscedasticity Normally distributed error around
regression line
P-P Plot No tendency in the error terms
Collinearity High correlation between at least
two independent variables
VIF VIF < 10 (VIF = 1.113)
Accounted for the small size of the sample (N = 39), the assumption of normality for degrees
of proportionality and many-to-many congruence cannot be ruled out, so we proceeded with
regression analyses.
4.3 Regression Results
Table 7 shows that bivariate regression analysis was performed to test if proportional electoral
systems positively affect the number of parliamentary parties.
Table 7
Regression Results for the Number of Parliamentary Parties
Constant -10.363 (8.071)
Proportionality .173** (.085)
R² .101
N 39
Note. Standard errors are reported in parentheses. The unstandardised coefficients are reported in the table.
* p < 0.10; ** p < 0.05; *** p < 0.01 (two-tailed). The results are available on request.
17
Results indicated that proportionality significantly predicted the number of parliamentary
parties, t(37) = 2.041, p = .048. Proportionality also explained a significant proportion of
variance in the number of parliamentary parties, F(1, 37) = 4.167, p = .048.
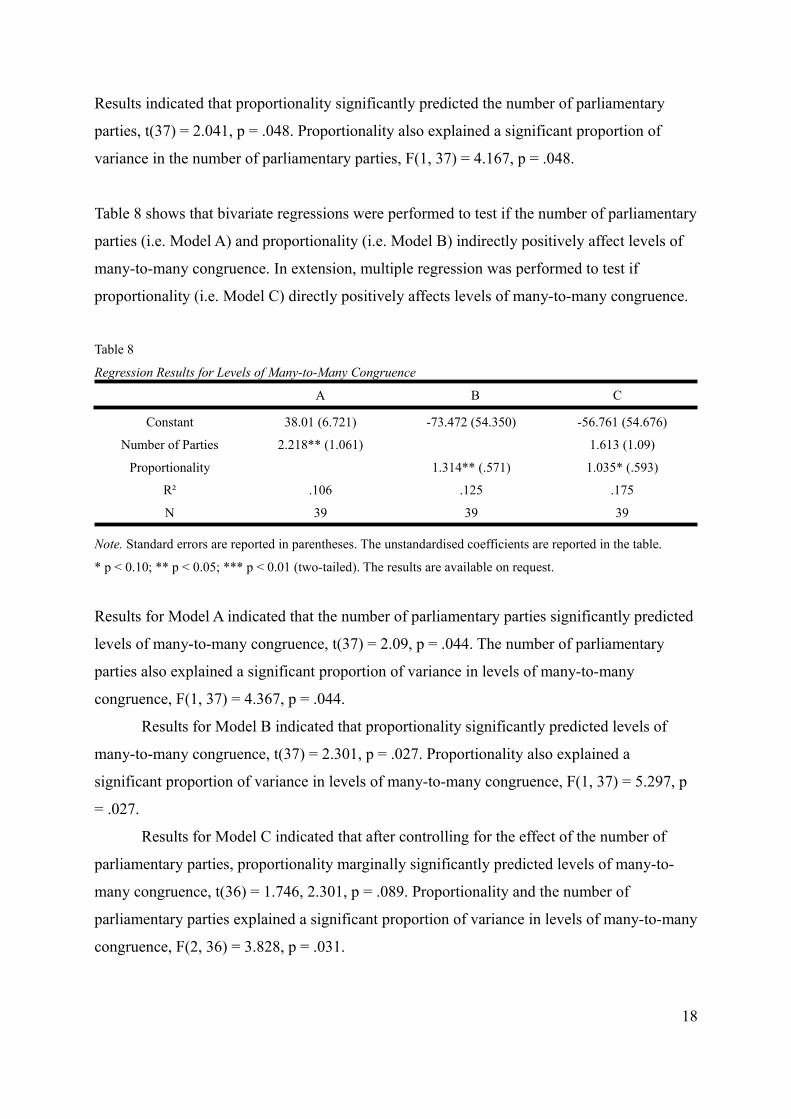
Table 8 shows that bivariate regressions were performed to test if the number of parliamentary
parties (i.e. Model A) and proportionality (i.e. Model B) indirectly positively affect levels of
many-to-many congruence. In extension, multiple regression was performed to test if
proportionality (i.e. Model C) directly positively affects levels of many-to-many congruence.
Table 8
Regression Results for Levels of Many-to-Many Congruence
A B C
Constant 38.01 (6.721) -73.472 (54.350) -56.761 (54.676)
Number of Parties 2.218** (1.061) 1.613 (1.09)
Proportionality 1.314** (.571) 1.035* (.593)
R² .106 .125 .175
N 39 39 39
Note. Standard errors are reported in parentheses. The unstandardised coefficients are reported in the table.
* p < 0.10; ** p < 0.05; *** p < 0.01 (two-tailed). The results are available on request.
Results for Model A indicated that the number of parliamentary parties significantly predicted
levels of many-to-many congruence, t(37) = 2.09, p = .044. The number of parliamentary
parties also explained a significant proportion of variance in levels of many-to-many
congruence, F(1, 37) = 4.367, p = .044.
Results for Model B indicated that proportionality significantly predicted levels of
many-to-many congruence, t(37) = 2.301, p = .027. Proportionality also explained a
significant proportion of variance in levels of many-to-many congruence, F(1, 37) = 5.297, p
= .027.
Results for Model C indicated that after controlling for the effect of the number of
parliamentary parties, proportionality marginally significantly predicted levels of many-to-
many congruence, t(36) = 1.746, 2.301, p = .089. Proportionality and the number of
parliamentary parties explained a significant proportion of variance in levels of many-to-many
congruence, F(2, 36) = 3.828, p = .031.
18
5. Discussion
The results of this cross-sectional study suggest that electoral systems indirectly affect the
quality of political representation. We find that democratic states deploying proportional
electoral systems are associated with more parliamentary parties and higher levels of many-
to-many congruence than democratic states deploying disproportional electoral systems. The
results confirmed previous findings by Golder and Stramski (2010) who combined Duverger’s
and Downs’ theories in order to explain the link between electoral system proportionality and
many-to-many congruence. What is more, however marginally, our findings suggest that
electoral systems directly affect the quality of representation.
Although the dataset is useful for positioning distributions of substantive preferences
of citizens and ideological positions of representatives on the left-right scale, it has some
limitations. In contrast to Gallagher’s (2015) indices, the dataset restrictively includes up to
nine parliamentary parties, so we were necessitated to normalize the number of parliamentary
seats in case of divergent assembly sizes. Moreover, while there are over eighty free
democracies (FH, 2015b), the dataset includes about half of them. As a consequence, the
sample was rather small. Furthermore, because the dataset is comprised out of data that were
gathered at a single point in time, we could not make definite inferences about cause-and-
effect relationships. We suggest to include longitudinal surveys from respondents in more free
democracies.
Measures of proportionality are considered to be influenced by four mechanical
sources: electoral formula, district magnitude, malapportionment, and electoral threshold
(Gallagher, 1991, p. 43). Next to degrees of proportionality, an improved conceptualization
for electoral systems has to hold the size of the assembly, the existence of presidential
elections, and the occurrence of inter-party links in order capture the electoral mechanisms
that are considered part of electoral systems (Gallagher & Mitchell, 2005; Lijphart, 2012;
Norris, 2004). Beneficial to confine the direct effects of electoral systems from the
intervening effects of the number of parliamentary parties on the quality of political
representation, we suggest further research on a more comprehensive conceptualization for
electoral systems.
19
References
Andeweg, R. B. (2010). Approaching Perfect Policy Congruence: Measurement,
Development, and Relevance for Political Representation. In: Denters, S. A. H.,
Rosema, M., & Aarts, K. (2010). How democracy works: Political representation
and policy congruence in modern societies : essays in honour of Jacques Thomassen.
Amsterdam: Pallas Publications, 39-52.
Blais, A., & Bodet, M. (2006). Does Proportional Representation Foster Closer Congruence
Between Citizens and Policy Makers?. Comparative Political Studies, 39, 10, 1243-
1262.
Blais, A., & Massicotte, L. (2002). Electoral Systems. In: LeDuc, L., Niemi, R. G., & Norris,
P. (2002). Comparing democracies 2: New challenges in the study of elections and
voting. London: Sage, 40-69.
Bormann, N.-C., & Golder, M. (2013). Democratic Electoral Systems around the world, 1946-
2011. Electoral Studies, 32, 2, 360-369.
Carter, E., Farrell, M. (2010) Electoral systems and Election Management. In: LeDuc, L.,
Niemi, R. G., & Norris, P. (2010). Comparing democracies 3: Elections and voting in
the 21st century. London: SAGE, 25-44.
Celis, K., & Childs, S. (2008). Introduction: The Descriptive and Substantive Representation
of Women: New Directions. Parliamentary Affairs, 61, 3, 419-425.
Cox, G. W. (1990). Centripetal and Centrifugal Incentives in Electoral Systems. American
Journal of Political Science, 34, 4, 903-935.
CSES. (2013). Module 3 full release: March 27, 2013 version [dataset].
doi:10.7804/cses.module3.2013-03-27

Diamond, L. J., & Plattner, M. F. (2006). Electoral systems and democracy. Baltimore: Johns
Hopkins University Press.
Dolny, B., & Babos, P. (2015). Voter-Representative Congruence in Europe: A Loss of
Institutional Influence?. West European Politics, 38, 6, 1274-1304.
Dovi, S. (2014). Political Representation. In E. N. Zalta (Ed.), The Stanford Encyclopedia of
Philosophy (Spring 2014 ed.). Retrieved from
http://plato.stanford.edu/archives/spr2014/entries/political-representation/
Ezrow, L. (2010). Linking Citizens and Parties: How Electoral Systems Matter for Political
Representation. Oxford Scholarship Online.
Freedom House. (2015a). Freedom in the World 2015 Methodology. New York.
Freedom House. (2015b). Individual country ratings and status, FIW 1973-2015 (EXCEL).
Retrieved from https://freedomhouse.org/report-types/freedom-world/
Gallagher, M. (1991). Proportionality, disproportionality and electoral systems. Electoral
Studies, 10, 1, 33-51.
Gallagher, M. (2015). Election Indices [dataset]. Retrieved from
http://www.tcd.ie/Political_Science/staff/michael_gallagher/ElSystems/index.php/
Gallagher, M., & Mitchell, P. (2005). The politics of electoral systems. Oxford: Oxford
University Press.
Golder, M., & Stramski, J. (2010). Ideological Congruence and Electoral Institutions.
American Journal of Political Science, 54, 1, 90-106.
Goodin, R. E. (2006). The Oxford handbook of contextual political analysis. Oxford: Oxford
University Press.

Grofman, B., & Lijphart, A. (2003). Electoral laws and their political consequences. New
York: Agathon Press.
Klingemann, H.-D. (2009). The comparative study of electoral systems. Oxford: Oxford
University Press.
Lijphart, A. (2012). Patterns of democracy: Government forms and performance in thirty-six
countries. New Haven: Yale University Press.
Massicotte, L., & Blais, A. (1999). Mixed electoral systems: a conceptual and empirical
survey. Electoral Studies, 18, 3, 341-366.
Norris, P. (2004). Electoral engineering: Voting rules and political behavior. Cambridge, UK:
Cambridge University Press.
Pitkin, H. F. (1967). The concept of representation. Berkeley: University of California Press.
Plotke, D. (1997). Representation is Democracy. Constellations, 4, 1, 19-34.
Powell, G. B. (2010). Consequences of Elections. In: LeDuc, L., Niemi, R. G., & Norris, P.
(2010). Comparing democracies 3: Elections and voting in the 21st century. London:
SAGE, 225-241.
Powell, G. B. (2013). Representation in Context: Election Laws and Ideological Congruence
Between Citizens and Governments. Perspectives on Politics, 11, 1, 9-21.
Powell, G. B. (2014). Congruence with Whom; Responsiveness to What?. 72th Annual
Conference. Conference conducted at the meeting of the Midwest Political Science
Association, Chicago.
Runciman, D. (2007). The Paradox of Political Representation. Journal of Political
Philosophy, 15, 1, 93-114.
Shugart, M. S., & Wattenberg, M. P. (2001). Mixed-member electoral systems: The best of
both worlds?. Oxford: Oxford University Press.

Appendix A: Assessing Assumptions for Regression Analysis
Linear regression analysis is founded on key assumptions that have to be met in order to make
valid inferences. We considered four assumptions relevant for this cross-sectional study in
which data were used from CSES (2013) that have been gathered at a single point in time: (1)
Linearity, (2) Normality, (3) Homoscedasticity, and (4) Collinearity.
A1.01 Linearity
As shown in Figure A1, we checked the existence of a linear relationship between the
predictor variables (i.e. proportionality and the number of parties) and the dependent variable
(i.e. many-to-many congruence) with scatterplots. These indicated a moderate (positive) linear
relationship for proportionality and the number of parties on many-to-many congruence.
A1.02 Normality
As shown in Figure A2, we assessed the presence of normality with Q-Q Plots. There were
strong signs of normality in the data regarding the number of parliamentary parties, and
weaker signs of normality for degrees of proportionality and many-to-many congruence.
However, accounted for the small size of the sample (N = 39), the assumption of normality
cannot be ruled out.
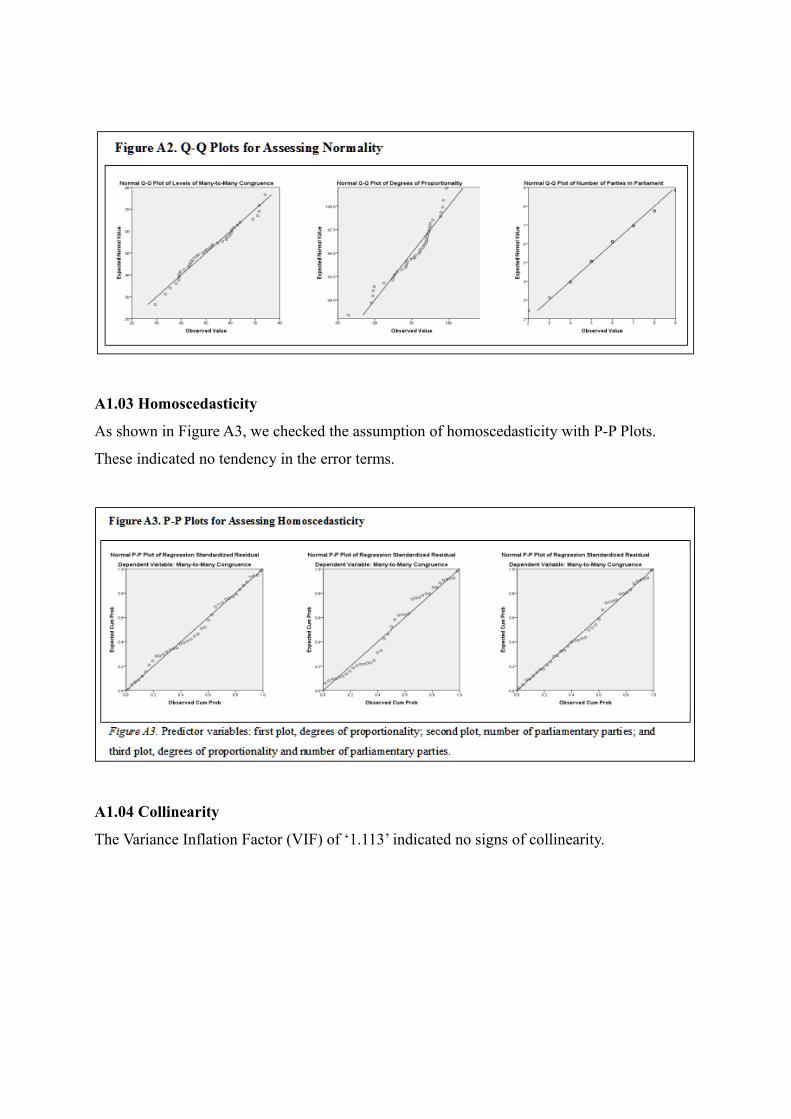
A1.03 Homoscedasticity
As shown in Figure A3, we checked the assumption of homoscedasticity with P-P Plots.
These indicated no tendency in the error terms.
A1.04 Collinearity
The Variance Inflation Factor (VIF) of ‘1.113’ indicated no signs of collinearity.