Embed Size (px)
Citation preview
TRANSPORTATION RESEARCH RECORD 1207 207
Effect of Load, Tire Pressure, and Tire Type on Flexible Pavement Response
RAMON F. BONAQUIST, CHARLES J. CHURILLA, AND DEBORAH M. FREUND
In recent years, decreased fatigue life, increased rutting, and accelerated serviceability loss in flexible pavements have been attributed to the effects of increased tire pressure. This study used the Federal Highway Administration Accelerated Loading Facility to measure the effects of load, tire pressure, and tire type on the response of a flexible pavement. Surface deflection, surface strain, and strain at the bottom of the asphalt layer were measured. Each of these responses was affected more by load than by tire pressure. Fatigue equivalency factors were developed using an exponential relationship between the number of cycles to failure and the magnitude of the tensile strain at the bottom of the asphalt layer. Since this strain was affected more by load than by tire pressure, the equivalency factors are influenced more by load. Doubling the wheel load (from 9,400 to 19,000 lb) increased predicted damage 1,000 percent whereas doubling the tire pressure (from 76 to 140 psi) increased predicted damage only 20 percent. On the basis of these fatigue equivalency factors, it was concluded that for the pavement section studied, the effect of increasing tire pressure from 76 to 140 psi is equivalent to an axle load increase of approximately 2,000 lb. This equivalency is valid for both radial and bias ply tires.
In recent years, the effect of increased truck tire pressures on flexible pavement performance has become a subject of great concern. Various researchers have used analytical methods to attribute decreased fatigue life, increased rutting, and accelerated serviceability loss to the effects of increased tire pressure (1-3). The purpose of this study was to investigate these concerns by measuring the effects of load, tire pressure, and tire type on the response of an asphalt concrete pavement. This experiment was conducted on Lane 2, Section 2 of the Federal Highway Administration (FHWA) Pavement Testing Facility (PTF).
BACKGROUND
The Pavement Testing Facility is an outdoor, full-scale pavement testing laboratory located at the Turner-Fairbank Highway Research Center in McLean, Virginia. The purpose of the PTF is to quantify the performance of full-scale test pavements trafficked with an accelerated rate of loading. The facility consists of two 200-ft-long instrumented bituminous concrete test pavements, the Accelerated Loading Facility (ALF) test machine, and a computer-controlled data acquisition system.
The test pavements represent typical in-service flexible
Federal Highway Administration, Office of Research, Development, and Technology, 6300 Georgetown Pike, McLean, Va. 22101.
FIGURE 1 Accelerated Loading Facility machine at the FHW A Pavement Testing Facility.
pavements. Lane 1 consists of a 2-in. asphalt concrete wearing course, a 3-in. asphalt concrete binder course, and a 5-in. crushed aggregate base course. Lane 2 consists of a 2-in. wearing course, a 5-in. binder course, and a 12-in. base course.
Both pavements were constructed on a uniform AASHTO classification A-4(0) subgrade soil. Details concerning the design and construction of the test pavements were presented in a previous report (4).
The ALF test machine is shown in Figure 1. It simulates one-half of a dual-tire single axle with loads ranging from 9,400 lb to 22,500 lb. The test wheel assembly travels at 12.5 mph over 40 ft of pavement. To simulate highway traffic, the loads are applied in one direction and are normally distributed about a 48-in. wheelpath. The ALF requires very little power to operate because gravity is used to accelerate and decelerate the test wheel assembly. Other fertures include all-weather, computer-controlled operation, and transportability for field testing.
The pavement instrumentation and data acquisition system form an integral part of the PTF. The pavement instrumentation includes thermocouples and moisture cells at various depths in the pavement, strain gauges at the bottom of the asphalt concrete binder, and a device for measuring surface deflection. In addition, rut depth and slope variance are obtained with an automatic profiling device. Signals from the various pavement instruments and the automatic profiling device are directed through
208
signal-conditioning equipment to analog-to-digital converters mounted in a personal computer. Software was developed to collect environmental data and pavement response and performance data as part of the routine operation of the PTF. The pavement instrumentation and data acquisition system were described in detail in a previous report ( 4).
RESEARCH APPROACH
Experimental Design
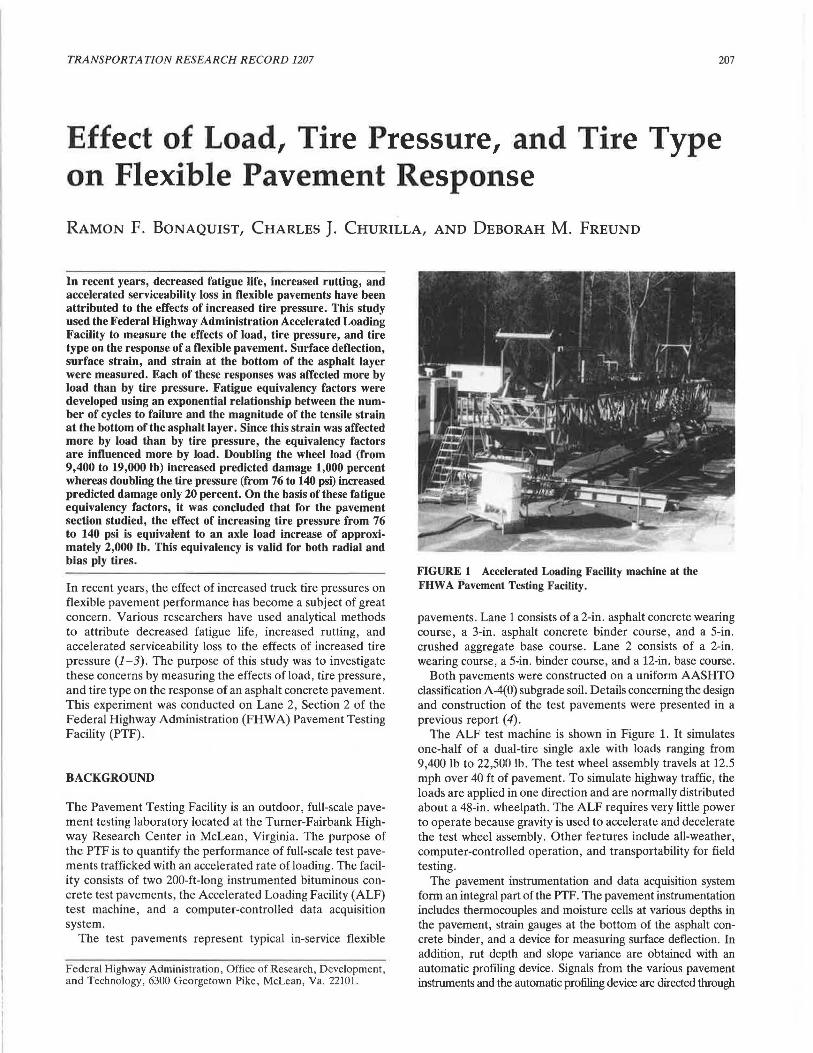
The objective of this study was to measure pavement response for various combinations of load and tire pressure for two types of tires. The experiment was designed as a complete factorial with load, tire pressure, and tire type as the controlled variables. Three load levels, three tire pressures, and two tire types were used in the experiment. Table 1 summarizes the experimental design. For each experimental cell, the following data were collected:
1. Tire contact area, 2. Surface deflection, 3. Surface strain, 4. Strain at the bottom of the asphalt layer, and 5. Pavement temperature.
Details concerning each of these measurements are presented in the Data Collection section of this paper.
Test Sequence
Ideally, the experimental combinations should be tested randomly with temperature and moisture conditions constant. The amount of work and down time required to ch<inge tires and loads, however, prohibited complete randomization. Since tire pressure is easy to vary, and loads can be changed quicker than tires, the test sequence outlined in Tab!~ 1 was used. On the basis of AASHTO equivalency factors, approximately 280,000 18-kip equivalent single-axle loads (ESALs) were applied to the pavement during this study as part of the normal research program at the PTF. The tests using radial tires and the 19,000-lb load were repeated at the end of the experiment to assess the effect of accumulated damage during the experiment.
TABLE 1 EXPERIMENTAL DESIGN AND TEST SEQUENCE
Load 76 (lb) (psi l
9,400
14, 100
19,000
19,000
l
4
9
21
Radial
108 (psi l
3
6
7
140 (psi l
2
5
8
19 20
76 (psi l
18
13
11
Bias Ply
108 (psi l
17
15
12
Numbers represent test sequence.
140 (psi)
16
14
10
TRANSPORTATION RESEARCH RECORD 1207
Temperature and Moisture
Pavement temperature and moisture conditions cannot be controlled at the PTF. To minimize the effects of temperature changes, all tests were conducted between 10:00 p.m. and 9:00 a.m. For the test sequence used in this study, temperature variations between tire pressures at a given load level were much smaller than temperature variations between load levels. Pavement temperatures were measured with each test to provide data for temperature adjustments. Moisture cell me;isurements taken during the study indicated that moisture conditions were constant.
Pavement Condition
The pavement was subjected to approximately 39,000 ESALs before this study was conducted. An additional 280,000 ESALs were applied during the study. Pavement condition monitoring before and after this study indicated little change in pavement condition during the study. Cracking of the test pavement was first observed at approximately 5 million ESALs.
DATA COLLECTION
Tire Contact Area
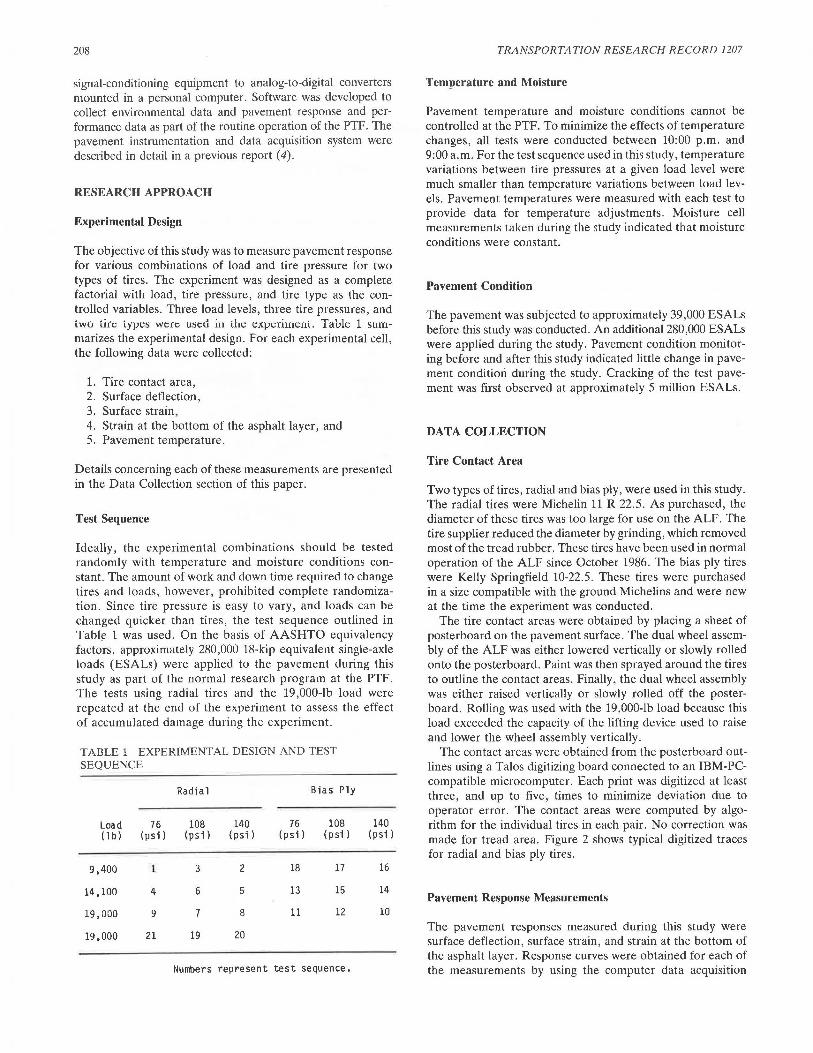
Two types of tires, radial and bias ply, were used in this study. The radial tires were Michelin 11 R 22.5. As purchased, the diameter of these tires was too large for use on the ALF. The tire supplier reduced the diameter by grinding, which removed most of the tread rubber. These tires have been used in normal operation of the ALF since October 1986. The bias ply tires were Kelly Springfield 10-22.5. These tires were purchased in a size compatible with the ground Michelins and were new at the time the experiment was conducted.
The tire contact areas were obtained by placing a sheet of posterboard on the pavement surface. The dual wheel assembly of the ALF was either lowered vertically or slowly rolled onto the posterboard. Paint was then sprayed around the tires to outline the contact areas. Finally, the dual wheel assembly was either raised vertically or slowly rolled off the posterboard. Rolling was used with the 19,000-lb load because this load exceeded the capacity of the lifting device used to raise and lower the wheel assembly vertically.
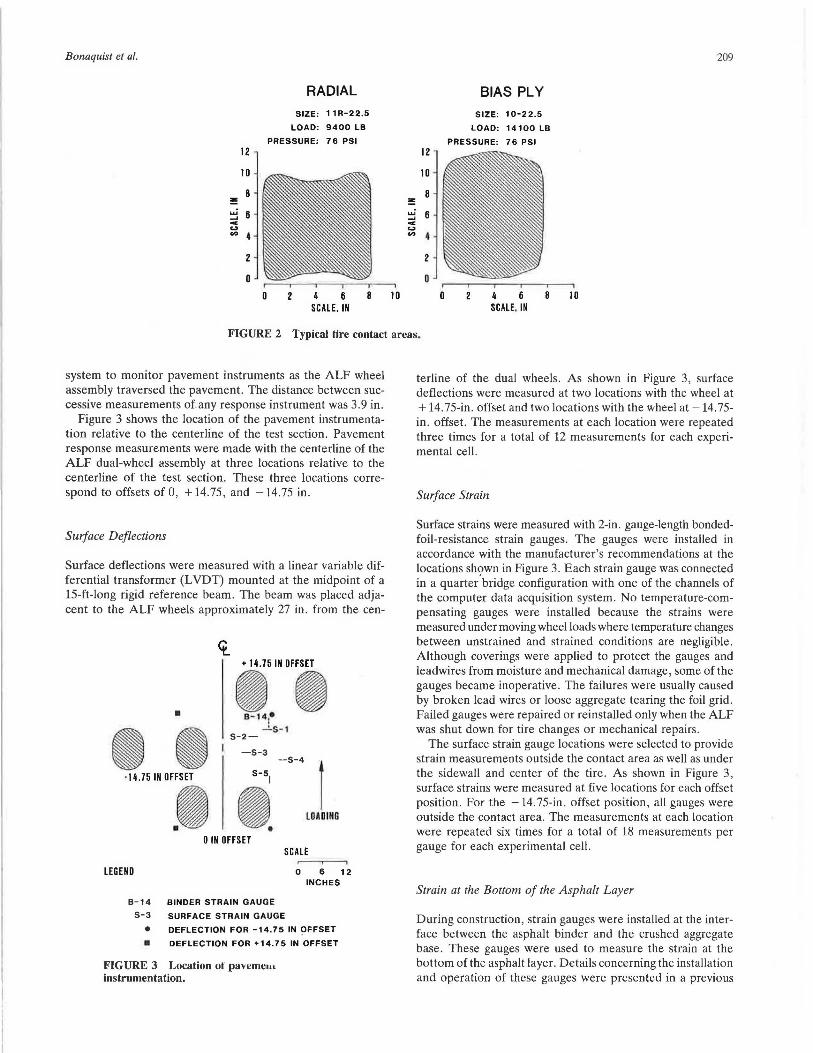
The contact areas \Vere obtained from the posterboard outlines using a Talos digitizing board connected to an IBM-PCcompatible microcomputer. Each print was digitized at least three, and up to five, times to minimize deviation due to operator error. The contact areas were computed by algorithm for the individual tires in each pair. No correction was made for tread area. Figure 2 shows typical digitized traces for radial and bias ply tires.
Pavement Response Measurements
The pavement responses measured during this study were surface deflection, surface strain, and strain at the bottom of the asphalt layer. Response curves were obtained for each of the measurements by using the computer data acquisition
Bonaquist et al.
RADIAL
SIZE: 11R-22.5
LOAD: 9400 LB
PRESSURE: 76 PSI 12
ID
8 !!: ...; 6 ..... ... ... "" 4
2
0
0 2 4 6 SCALE. IN
12
ID
8 :!: ...; 6 ..... "" ... "" 4
2
0
ID 0
BIAS PLY
SIZE: 10-2 2.5
LOAD: 14100 LB
PRESSURE: 76 PSI
4 6 ID SCALE. IN
209
FIGURE 2 Typical tire contact areas.
system to monitor pavement instruments as the ALF wheel assembly traversed the pavement. The distance between successive measurements of.any response instrument was 3.9 in .
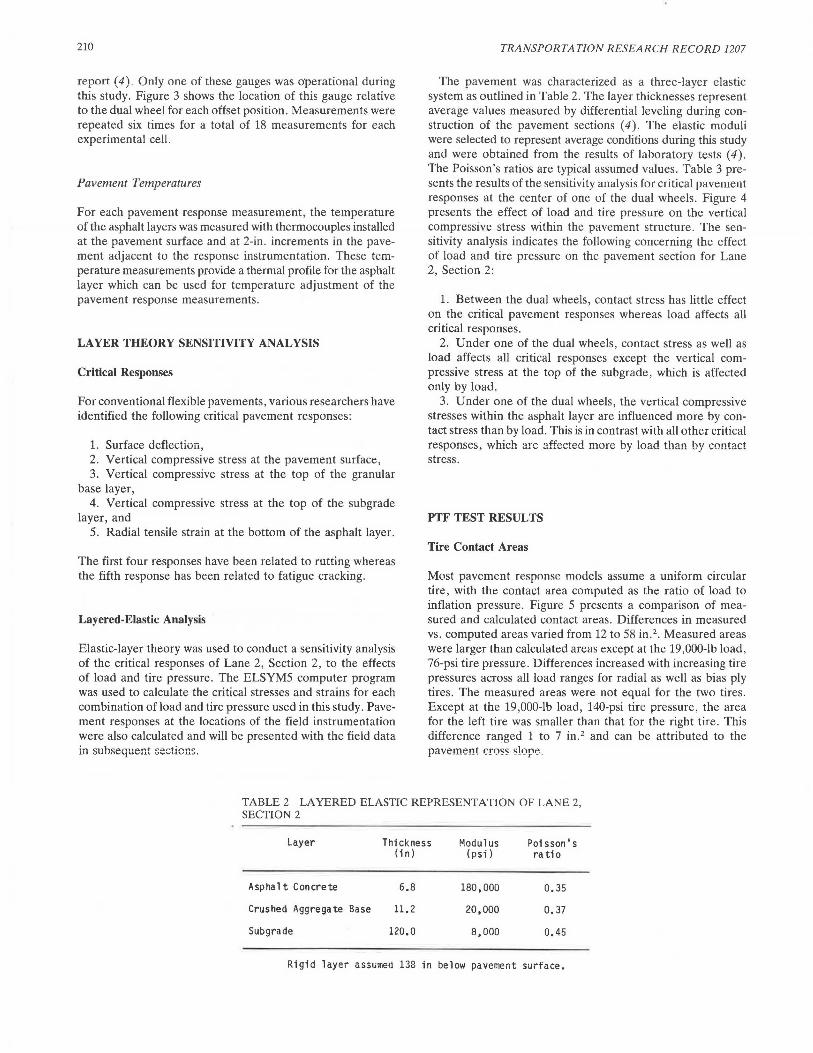
Figure 3 shows the location of the pavement instrumentation relative to the centerline of the test section. Pavement response measurements were made with the centerline of the ALF dual-wheel assembly at three locations relative to the centerline of the test section. These three locations correspond to offsets of 0, + 14.75, and -14.75 in.
Surf ace Deflections
Surface deflections were measured with a linear variable differential transformer (L VDT) mounted at the midpoint of a 15-ft-long rigid reference beam. The beam was placed adjacent to the ALF wheels approximately 27 in. from the cen-
+ 14. 75 IN OFFSET
• II B-141•
II -'-S-1
S-2-
-S-3 -S-4
I ·14.75 IN OFFSET
.I LOADING
0 IN OFFSET SCALE
LEGEND 0 6 12 INCHES
B-14 BINDER STRAIN GAUGE
S-3 SURFACE STRAIN GAUGE
e DEFLECTION FOR -14.75 IN ~FFSET
• DEFLECTION FOR +14 .75 IN OFFSET
FIGURE 3 Location ol pavcmc1u instrumentation.
terline of the dual wheels . As shown in Figure 3, surface deflections were measured at two locations with the wheel at + 14.75-in. offset and two locations with the wheel at -14.75-in. offset. The measurements at each location were repeated three times for a total of 12 measurements for each experimental cell.
Surface Strain
Surface strains were measured with 2-in. gauge-length bondedfoil-resistance strain gauges. The gauges were installed in accordance with the manufacturer's recommendations at the locations shown in Figure 3. Each strain gauge was connected in a quarter.bridge configuration with one of the channels of the computer data acquisition system. No temperature-compensating gauges were installed because the strains were measured under moving wheel loads where temperature changes between unstrained and strained conditions are negligible. Although coverings were applied to protect the gauges and leadwires from moisture and mechanical damage, some of the gauges became inoperative. The failures were usually caused by broken lead wires or loose aggregate tearing the foil grid . Failed gauges were repaired or reinstalled only when the ALF was shut down for tire changes or mechanical repairs .
The surface strain gauge locations were selected to provide strain measurements outside the contact area as well as under the sidewall and center of the tire. As shown in Figure 3, surface strains were measured at five locations for each offset position. For the -14.75-in. offset position, all gauges were outside the contact area. The measurements at each location were repeated six times for a total of 18 measurements per gauge for each experimental cell.
Strain at the Bottom of the Asphalt Layer
During construction, strain gauges were installed at the interface between the asphalt binder and the crushed aggregate base. These gauges were used to measure the strain at the bottom of the asphalt layer. Details concerning the installation and operation of these gauges were presented in a previous
210
report ( 4) . Only one of these gauges was operational during this study. Figure 3 shows the location of this gauge relative to the dual wheel for each offset position. Measurements were repeated six times for a total of 18 measurements for each experimental cell.
Pavement Temperatures
For each pavement response measurement, the temperature of the asphalt layers was measured with thermocouples installed at the pavement surface and at 2-in. increments in the pavement adjacent to the response instrumentation. These temperature measurements provide a thermal profile for the asphalt layer which can be used for temperature adjustment of the pavement response measurements.
LA YER THEORY SENSITIVITY ANALYSIS
Critical Responses
For conventional flexible pavements, various researchers have identified the following critical pavement responses:
1. Surface deflection, 2. Vertical compressive stress at the pavement surface, 3. Vertical compressive stress at the top of the granular
base layer, 4. Vertical compressive stress at the top of the subgrade
layer, and 5. Radial tensile strain at the bottom of the asphalt layer.
The first four responses have been related to rutting whereas the fifth response has been related to fatigue cracking.
Layered-Elastic Analysis
Elastic-layer theory was used to conduct a sensitivity analysis of the critical responses of Lane 2, Section 2, to the effects of load and tire pressure. The ELSYM5 computer program was used to calculate the critical stresses and strains for each combination of load and tire pressure used in this study. Pavement responses at the locations of the field instrumentation were also calculated and will be presented with the field data in subsequent sections.
TRANSPORTATION RESEARCH RECORD 1207
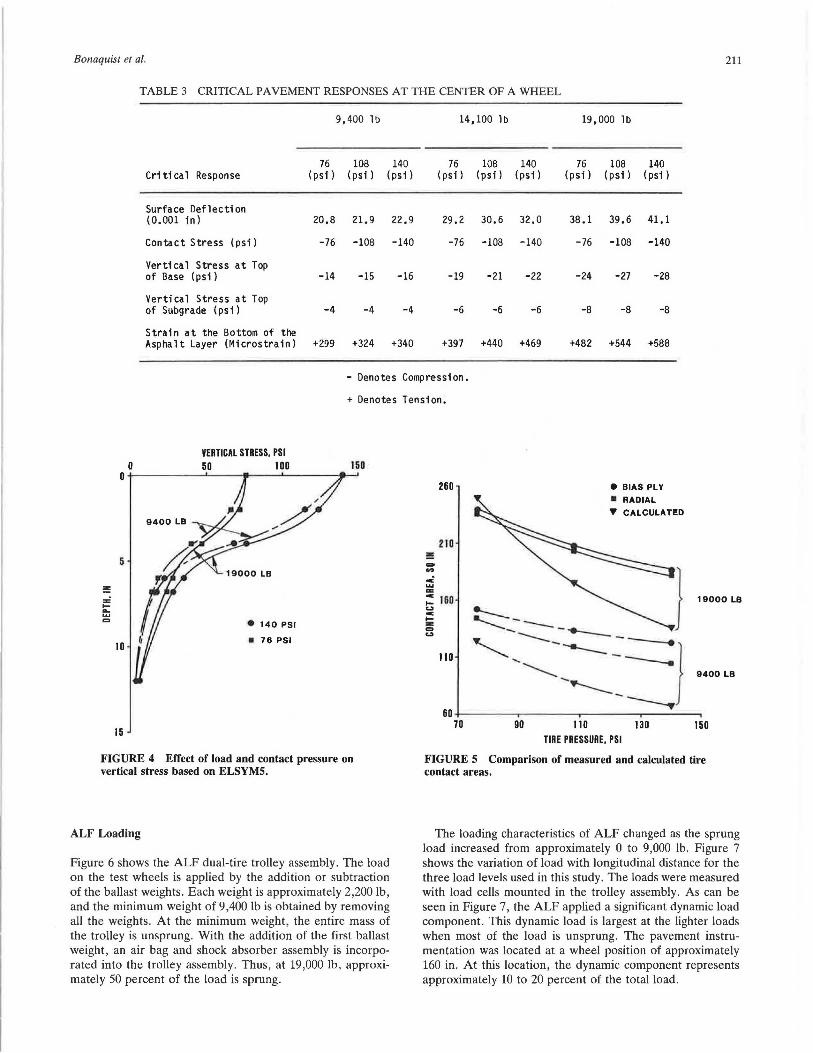
The pavement was characterized as a three-layer elastic system as outlined in Table 2. The layer thicknesses represent average values measured by differential leveling during construction of the pavement sections ( 4). The elastic moduli were selected to represent average conditions during this study and were obtained from the results of laboratory tests ( 4). The Poisson's ratios are typical assumed values. Table 3 presents the results of the sensitivity analysis for critical pavement responses at the center of one of the dual wheels. Figure 4 presents the effect of load and tire pressure on the vertical compressive stress within the pavement structure. The sensitivity analysis indicates the following concerning the effect of load and tire pressure on the pavement section for Lane 2, Section 2:
1. Between the dual wheels, contact stress has little effect on the critical pavement responses whereas load affects all critical responses.
2. Under one of the dual wheels, contact stress as well as load affects all critical responses except the vertical compressive stress at the top of the subgrade, which is affected only by load.
3. Under one of the dual wheels, the vertical compressive stresses within the asphalt layer are influenced more by contact stress than by load. This is in contrast with all other critical responses, which are affected more by load than by contact stress.
PTF TEST RESULTS
Tire Contact Areas
Most pavement response models assume a uniform circular tire, with the contact area computed as the ratio of load to inflation pressure. Figure 5 presents a comparison of measured and calculated contact areas. Differences in measured vs. computed areas varied from 12 to 58 in. 2 • Measured areas were larger than calculated areas except at the 19,000-lb load, 76-psi tire pressure. Differences increased with increasing tire pressures across all load ranges for radial as well as bias ply tires. The measured areas were not equal for the two tires. Except at the 19,000-lb load, 140-psi tire pressure, the area for the left tire was smaller than that for the right tire. This difference ranged 1 to 7 in. 2 and can be attributed to the pavement cross slope_
TABLE 2 LAYERED ELASTIC REPRESENTATION OF LANE 2, SECTION 2
Layer Thickness Modulus Poisson's (in) (psi) ratio
Asphalt Concrete 6.8 180,000 0,35
Crushed Aggregate Base 11.2 20,000 0.37
Sub grade 120.0 8,000 0.45
Rigid layer assumed 138 in below pavement surface.
Bonaquisl et al. 211
TABLE 3 CRITICAL PAVEMENT RESPONSES AT THE CENTER OF A WHEEL
9,400 lb 14,100 lb 19,000 lb
76 108 140 76 108 140 76 108 140 Critical Response (psi l (psi l (psi l (psi l (psi) (psi) (psi) (psi l (psi l
Surface Deflection (0.001 in l 20.8 21.9 22.9 29.2 30.6 32.0 38.1 39.6 41.1
Contact Stress (psi) -76 -108 -140 -76 -108 -140 -76 -108 -140
Vertical Stress at Top of Base (psi) -14 -15 -16 -19 -21 -22 -24 -27 -28
Vertical Stress at Top of Subgrade (psi) -4 -4 -4 -6 -6 -6 -8 -8 -8
Strain at the Bottom of the Asphalt Layer (Microstrainl +299 +324 +340 +397 +440 +469 +4B2 +544 +588
- Denotes Compression.
+ Denotes Tension.
VERTICAL STRESS, PSI 50 100 150
5
!! ,.: ,_ .... .... Cl
ID
15
FIGURE 4 Effect of load and contact pressure on vertical stress based on ELSYMS.
ALF Loading
Figure 6 shows the ALF dual-tire trolley assembly. The load on the test wheels is applied by the addition or subtraction of the ballast weights . Each weight is approximately 2,200 lb, and the minimum weight of 9,400 lb is obtained by removing all the weights. At the minimum weight, the entire mass of the trolley is unsprung. With the addition of the first ballast weight, an air bag and shock absorber assembly is incorporated into the trolley assembly. Thus, at 19,000 lb, approximately 50 percent of the load is sprung.
!! ... ... ~ .... a: c ,_ ... c ,_ -Cl ...
260
210
160
110
e BIAS PLY
• RADIAL
... CALCULATED
=:::::-_- ---..__
"'------=:----: =-=1 -....____
19000 LB
9400 LB
-~ 60+---------.-----------.---------y---------,
70 90 110 130 150 TIRE PRESSURE, PSI
FIGURE 5 Comparison of measured and calculated tire contact areas.
The loading characteristics of ALF changed as the sprung load increased from approximately 0 to 9,000 lb. Figure 7 shows the variation of load with longitudinal distance for the three load levels used in this study. The loads were measured with load cells mounted in the trolley assembly. As can be seen in Figure 7, the ALF applied a significant dynamic load component. This dynamic load is largest at the lighter loads when most of the load is unsprung. The pavement instrumentation was located at a wheel position of approximately 160 in. At this location, the dynamic component represents approximately 10 to 20 percent of the total load.
212
BALLAST WEIGHTS PICK-UP
,...MECHANISM
GEARED MOTOR
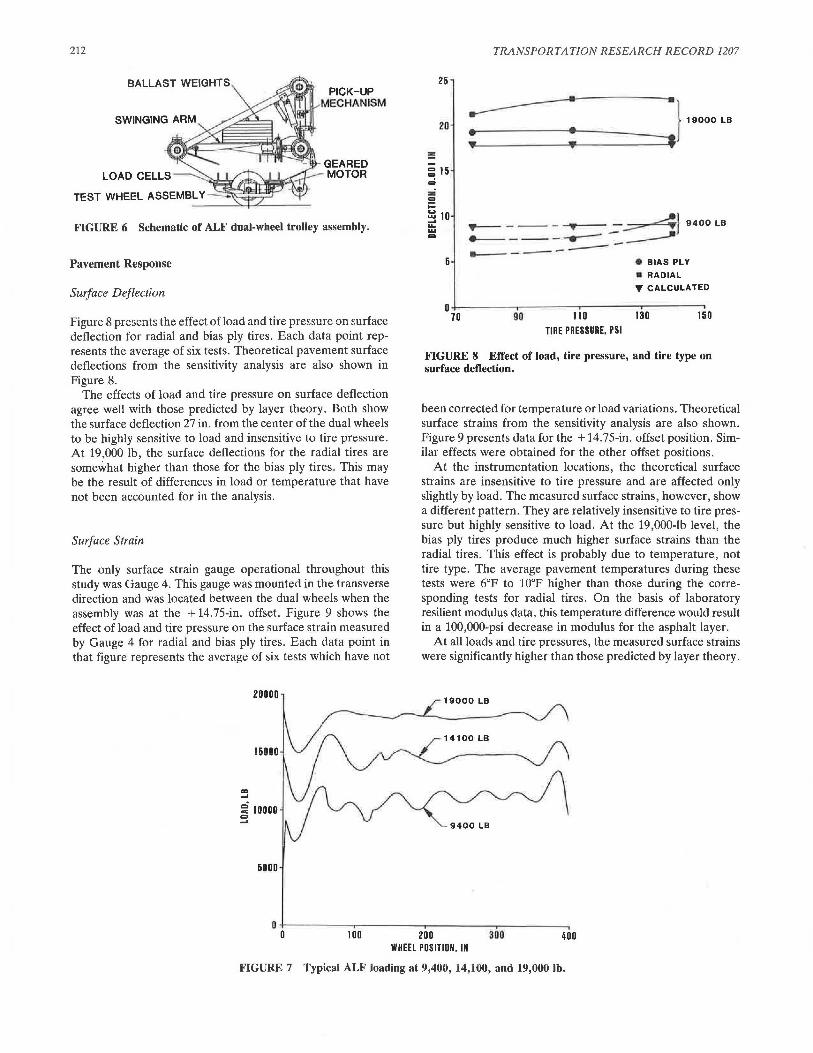
FIGURE 6 Schematic of ALF dual-wheel trolley assembly.
Pavement Response
Surface Deflection
Figure 8 presents the effect of load and tire pressure on surface deflection for radial and bias ply tires. Each data point represents the average of six tests. Theoretical pavement surface deflections from the sensitivity analysis are also shown in Figure 8.
The effects of load and tire pressure on surface deflection agree well with those predicted by layer theory. Both show the surface deflection 27 in. from the center of the dual wheels to be highly sensitive to load and insensitive to tire pressure. At 19,000 lb, the surface deflections for the radial tires are somewhat higher than those for the bias ply tires. This may be the result of differences in load or temperature that have not been accounted for in the analysis.
Surface Strain
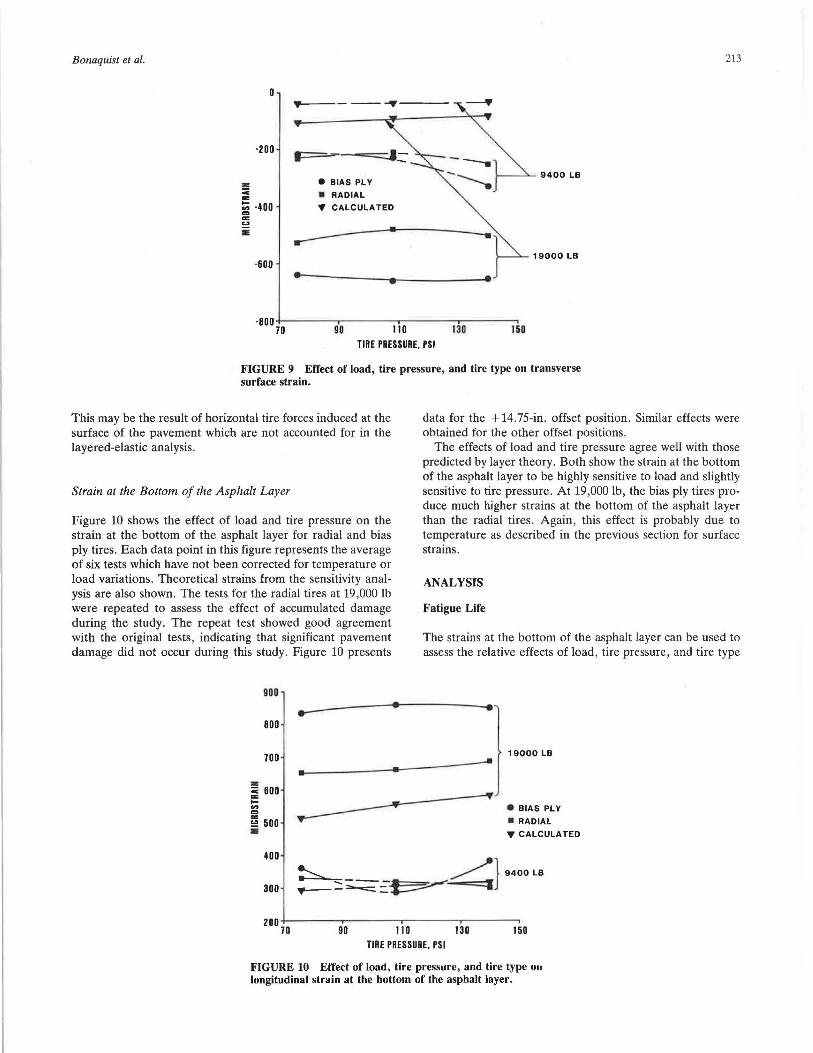
The only surface strain gauge operational throughout this study was Uauge 4. This gauge was mounted in the transverse direction and was located between the dual wheels when the assembly was at the + 14.75-in. offset. Figure 9 shows the effect of load and tire pressure on the surface strain measured by Gauge 4 for radial and bias ply tires. Each data point in that figure represents the average of six tests which have not
... ....
20000
!5000
g 10000 = ....
5000
25
ZD
= 15 .,;
"" = ;:: ~ ID ... ... "'
5
TRANSPORTATION RESEARCH RECORD 1207
; ___ _..._: ___ ---. l •ooooco
......----- _ -- - T - _;;;;;;>' -4} 9400 LB ------- ----- - ____. ---- - --- ----- -• BIAS PLY
• RADIAL
T CALCULATED
o +----~----~-----r------. 150 70 90 110 130
TIRE PRESSURE. PSI
FIGURE 8 Effect of load, tire pressure, and tire type on surface deflection.
been corrected for temperature or load variations. Theoretical surface strains from the sensitivity analysis are also shown. Figure 9 presents data for the + 14.75-in. offset position. Similar effects were obtained for the other offset positions.
At the instrumentation locations, the theoretical surface strains are insensitive to tire pressure and are affected only slightly by load. The measured surface strains, however, show a different pattern. They are relatively insensitive to tire pressure but highly sensitive to load. At the 19,000-lb level, the bias ply tires produce much higher surface strains than the radial tires. This effect is probably due to temperature, not tire type. The average pavement temperatures during these tests were 6°F to 10°F higher than those during the corresponding tests for radial tires. On the basis of laboratory resilient modulus data, this temperature difference would result in a 100,000-psi decrease in modulus for the asphalt layer.
At all loads and tire pressures, the measured surface strains were significantly higher than those predicted by layer theory.
0 +------.-------.-----~----~ 0 100 200 300 400
WHEEL POSITION, IN
FIGURE 7 Typical ALF loading at 9,400, 14,100, and 19,000 lb.
Bonaquist et al.
0
·200
-:c a: t; ·400 = a: !::! •
·600
e BIAS PLY
• RADIAL
T CALCULATED
•
213
19000 LB
•
"800 1..,_0 ____ 9~0----11~0---~,3-0-----.,50
TIRE PRESSURE. PSI
FIGURE 9 Effect of load, tire pressure, and tire type on transverse surface strain.
This may be the result of horizontal tire forces induced at the surface of the pavement which are not accounted for in the layered-elastic analysis .
Strain at the Bottom of the Asphalt Layer
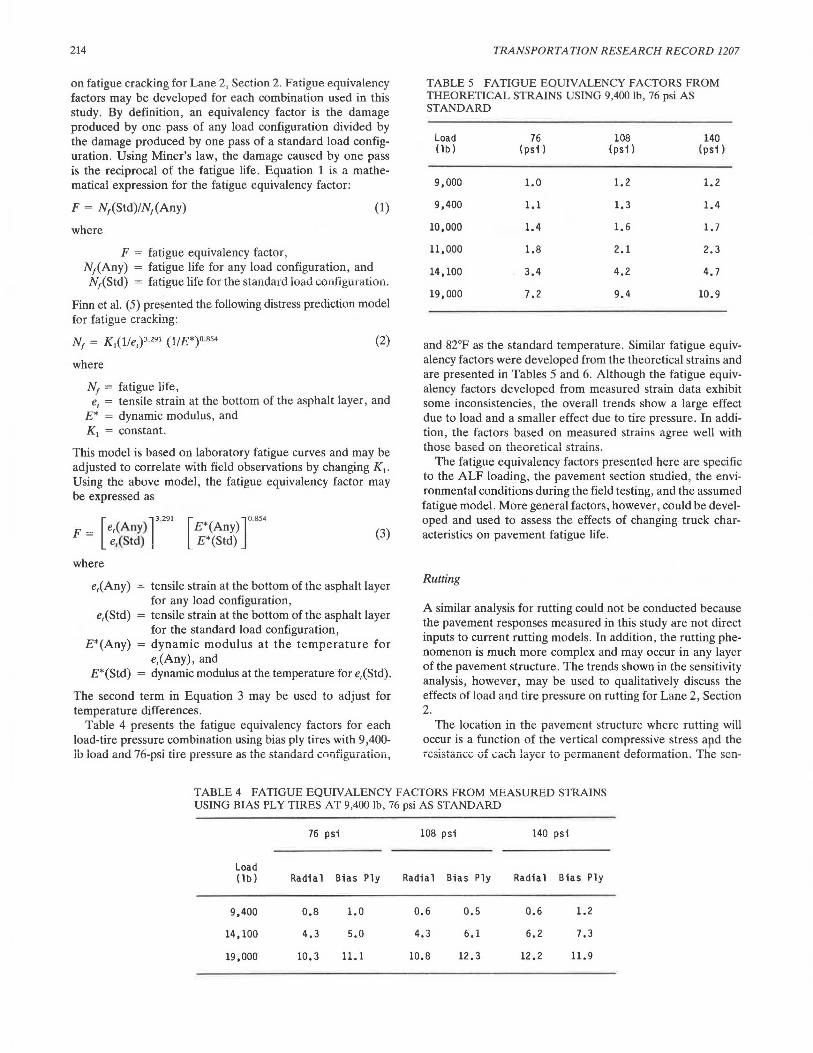
Figure 10 shows the effect of load and tire pressure on the strain at the bottom of the asphalt layer for radial and bias ply tires. Each data point in this figure represents the average of six tests which have not been corrected for temperature or load variations. Theoretical strains from the sensitivity analysis are also shown. The tests for the radial tires at 19,000 lb were repeated to assess the effect of accumulated damage during the study. The repeat test showed good agreement with the original tests, indicating that significant pavement damage did not occur during this study. Figure 10 presents
900
800
700
-:c 600 a: ,_ "' = a: !::! 500 •
•
data for the + 14.75-in. offset position. Similar effects were obtained for the other offset positions.
The effects of load and tire pressure agree well with those predicted by layer theory. Both show the strain at the bottom of the asphalt layer to be highly sensitive to load and slightly sensitive to tire pressure. At 19,000 lb, the bias ply tires produce much higher strains at the bottom of the asphalt layer than the radial tires . Again , this effect is probably due to temperature as described in the previous section for surface strains.
ANALYSIS
Fatigue Life
The strains at the bottom of the asphalt layer can be used to assess the relative effects of load, tire pressure, and tire type
...
19000 LB
e BIAS PLY
•RADIAL
T CALCULATED
400
300 !=> /} 9400 LB
...--:::~~~ =I
20070 90 110 130 150 TIRE PRESSURE, PSI
FIGURE 10 Effect of load, tire press11re, and tire type on longitudinal strain at the bottom of the asphalt layer.
214
on fatigue cracking for Lane 2, Section 2. Fatigue equivalency factors may be developed for each combination used in this study. By definition, an equivalency factor is the damage produced by one pass of any load configuration divided by the damage produced by one pass of a standard load configuration. Using Miner's law, the damage caused by one pass is the reciprocal of the fatigue life . Equation 1 is a mathematical expression for the fatigue equivalency factor:
F = N1(Std)/N1(Any) (1)
where
F = fatigue equivalency factor , N1(Any) = fatigue life for any load configuration, and N1(Std) = fatigue life for the standard load configuration.
Finn et al. (5) presented the following distress prediction model for fatigue cracking:
N, = K1(lle,)3-291 (1/E*)o 854
where
N1 = fatigue life,
(2)
e, = tensile strain at the bottom of the asphalt layer , and E* = dynamic modulus , and K1 = constant.
This model is based on laboratory fatigue curves and may be adjusted to correlate with field observations by changing K 1. Using the above model, the fatigue equivalency factor may be expressed as
F = [e,(Any)]3,291 e,(Std)
where
[E*(Any)] o.8s4 E*(Std)
(3)
e,(Any) = tensile strain at the bottom of the asphalt layer for any load configuration,
e,(Std) = tensile strain at the bottom of the asphalt layer for the standard load configuration,
E*(Any) = dynamic modulus at the temperature for e,(Any), and
E*(Std) = dynamic modulus at the temperature for e,(Std) .
The second term in Equation 3 may be used to adjust for temperature differences.
Table 4 presents the fatigue equivalency factors for each load-tire pressure combination using bias ply tires with 9,400-lb load a1t<l 76-psi tire pressure as the standard configuration,
TRANSPORTATION RESEARCH RECORD 1207
TABLE 5 FATIGUE EOUIVALENCY FACTORS FROM THEORETICAL STRAINS USING 9,400 lb , 76 psi AS STANDARD
Load 76 108 140 (lb) (psi) (psi) (ps1 l
9,000 1.0 1.2 1.2
9,400 1.1 1.3 1.4
10,000 1.4 1. 6 1. 7
11,000 1.8 2.1 2.3
14, 100 3.4 4.2 4.7
19,000 7.2 9.4 10.9
and 82°F as the standard temperature. Similar fatigue equivalency factors were developed from the theoretical strains and are presented in Tables 5 and 6. Although the fatigue equivalency factors developed from measured strain data exhibit some inconsistencies, the overall trends show a large effect due to load and a smaller effect due to tire pressure. In addition, the factors based on measured strains agree well with those based on theoretical strains.
The fatigue equivalency factors presented here are specific to the ALF loading, the pavement section studied, the environmental conditions during the field testing, and the assumed fatigue model. More general factors, however, could be developed and used to assess the effects of changing truck characteristics on pavement fatigue life.
Rutting
A similar analysis for rutting could not be conducted because the pavement responses measured in this study are not direct inputs to current rutting models . In addition, the rutting phenomenon is much more complex and may occur in any layer of the pavement structure. The trends shown in the sensitivity analysis, however, may be used to qualitatively discuss the effects of load and tire pressure on rutting for Lane 2, Section 2.
The location in the pavement structure where rutting will occur is a function of the vertical compressive stress apd the iesistance of each layer to permanent deformation. The sen-
TABLE 4 FATIGUE EQUIVALENCY FACTORS FROM MEASURED STRAINS USING BIAS PLY TIRES AT 9,400 lb , 76 psi AS STANDARD
76 psi 108 psi 140 psi
Load (lb l Radial Bias Ply Radial Bias Ply Radial Bias Ply
9,400 0.8 1.0 0.6 0.5 0.6 1.2
14,100 4.3 5.0 4.3 6.1 6.2 7.3
19,000 10,3 11.1 10.8 12.3 12.2 11.9
Bonaquist et al.
TABLE 6 FATIGUE EQUIVALENCY FACTORS FROM THEORETICAL STRAINS USING 9,000 lb, 76 psi AS STANDARD
Load 76 108 140 (lb) (psi) (psi) (psi)
9,400 1.0 1.2 1.3
10,000 1.2 1.4 1. 5
11,000 1. 5 1.8 2.0
14, 100 3.1 3,7 4.1
19,000 6.4 8.3 9.6
sitivity analysis of Lane 2, Section 2, indicated that load influences the vertical compressive stress in the base and subgrade layers more than tire pressure. Conversely, in the asphalt layer, tire pressure has the greatest effect on vertical compressive stress. Therefore, for Lane 2, Section 2, rutting that occurs in the asphalt layer would be accelerated by high tire pressures.
Lane 2, Section 3, at the PTF has the same cross-section as Lane 2, Section 2, and was trafficked to failure with a 19,000-lb load and 100-psi tire pressure. This section was tested from January to June 1987 when the pavement temperature was low. Rutting was the major form of distress observed, with rut depths averaging 0. 75 in. at failure. A post mortem evaluation was conducted to assess the amount of rutting attributable to each layer. This evaluation concluded that the majority of the rutting occurred in the crushed aggregate base layer (6).
Thus, the crushed aggregate base layer appears to have the critical combination of stress and rutting resistance for Lane 2 at the PTF. On the basis of the sensitivity analysis, tire pressure has little effect on rutting in this layer.
FINDINGS AND CONCLUSIONS
In recent years, the effect of increased truck tire pressures on flexible pavement performance has become a subject of great concern. Decreased fatigue life, increased rutting, and accelerated serviceability loss have been attributed to the effects of increased tire pressure.
This study investigated these concerns by using the Federal Highway Administration Accelerated Loading Facility to measure the effects of load, tire pressure, and tire type on the response of 'a flexible pavement. Although the findings and conclusions presented below are specific to the ALF loading, the pavement section studied and the environmental conditions during the testing, they provide valuable information concerning the combined effects of load and tire pressure.
Findings
The following is a summary of the findings of this study:
1. The measured tire contact areas were significantly larger than contact areas calculated as the ratio of load to tire pressure, except at high loads and low tire pressure.
215
2. The measured pavement responses-surface deflection, surface strain, and strain at the bottom of the asphalt layerwere affected by load as well as tire pressure. For the loads and tire pressures used in this study, load had a greater effect than tire pressure.
3. Although layer theory underestimated many of the measured pavement responses, the measured effects of load and tire pressure were in general agreement with those predicted by layer theory.
4. For tests conducted at approximately the same temperature, the measured pavement responses were similar for radial and bias ply tires.
Conclusions
Specific conclusions concerning the relative effects of load, tire pressure, and tire type on rutting and serviceability loss could not be drawn from the data presented in this paper. The measured pavement responses were not indicators of rutting potential, and an evaluation of serviceability loss requires performance data under each combination of load, tire pressure, and tire type.
The relative effects of load and tire pressure on pavement fatigue can be investigated using fatigue equivalency factors which account for load as well as tire pressure. Such factors were developed in this study using an exponential relationship between the number of cycles to failure and the magnitude of the tensile strain at the bottom of the asphalt layer. Since this strain was affected more by load than by tire pressure, the equivalency factors are influenced more by load. Doubling the load (from 9,400to19,000 lb) increased predicted damage 1,000 percent, whereas doubling the tire pressure from 76 to 140 psi increased predicted damage only 20 percent. From these fatigue factors, it is concluded that for the pavement section studied, the effect of increasing tire pressure from 76 to 140 psi is equivalent to an axle load increase of approximately 2,000 lbs. This equivalency is valid for radial and bias ply tires.
ACKNOWLEDGMENTS
The research presented in this paper is part of a staff study sponsored by the Federal Highway Administration. The authors thank Richard Panuska and Rod Cook, of Engineering Incorporated Services Company, for their efforts during the data collection; and David Anderson and David Luhr of the Pennsylvania State University for their assistance with the design of the experiment.
REFERENCES
1. K. M. Marshek, H. H. Chen, R. B. Connell, and C. L. Saraf. Effects of Truck Tire Inflation Pressure and Axle Load on Flexible and Rigid Pavement Performance. Transportation Research Record 1070. TRB, National Research Council, Washington, D.C., 1986, pp. 14-21.
2. H. F. Southgate and R. L. Dean. Effects of Load Distributions and Axle and Tire Configurations on Pavement Fatigue. Research Report UKTRP-85-13. Kentucky Transportation Research Program, University of Kentucky, Lexington, 1985.

216
3. F. L. Roberts , J. T . Tielking, D. Middleton, R. L. Lytton, and K. Tseng. Effects of Tire Pressure on Flexible Pavements. Research Report 372-lF, Texas Transportation Institute, Texas A&M University, College Station, 1986.
4. D. A. Anderson, W. P. Kilareski, and Z. Suddiqui. Pavement Testing Facility-Design and Construction. Report FHWA/RD-88/059. FHWA, U.S. Department of Transportation, Washington, D .C., 1987.
5. F . Finn, C. L. Saraf, R. Kulkarni, K. Nair, W. Smith, and A. Abdullah. NCHRP Report 291: Development of Pavement Structural Subsystems. TRB, National Research Council, Washington, D.C., 1986.
6. D. A. Anderson, P. Sebally, and N. Tabatae . Pavement Testing
TRANSPORTATION RESEARCH RECORD 1207
Facility-Performance of Initial Two Test Sections . .l<.eport !'HWA! RD-88/060. FHWA, U.S. Department of Transportation, Washington, D.C., 1987.
The contents of this paper reflect the views of the authors, and they are responsible for the accuracy of the data presented. The contents do not necessarily reflect the official views or policies of the Federal Highway Administration.
Publication of this paper sponsored by Committee on Flexible Pavement Design.